the oncogenic transcription factor runx1/eto corrupts cell ... · cancer cell article the oncogenic...
TRANSCRIPT

University of Birmingham
The oncogenic transcription factor RUNX1/ETOcorrupts cell cycle regulation to drive leukemictransformationMartinez-Soria, Natalia; McKenzie, Lynsey; Draper, Julia; Ptasinska, Anetta; Issa, Hasan;Potluri, Sandeep; Blair, Helen J; Pickin, Anna; Isa, Asmida; Chin, Paulynn Suyin;Tirtakusuma, Ricky; Coleman, Daniel; Nakjang, Sirintra; Assi, Salam; Forster, Victoria; Reza,Mojgan; Law, Ed; Berry, Philip; Mueller, Dorothee; Elder, AlexDOI:10.1016/j.ccell.2018.08.015
License:Creative Commons: Attribution (CC BY)
Document VersionPublisher's PDF, also known as Version of record
Citation for published version (Harvard):Martinez-Soria, N, McKenzie, L, Draper, J, Ptasinska, A, Issa, H, Potluri, S, Blair, HJ, Pickin, A, Isa, A, Chin, PS,Tirtakusuma, R, Coleman, D, Nakjang, S, Assi, S, Forster, V, Reza, M, Law, E, Berry, P, Mueller, D, Elder, A,Bomken, SN, Pal, D, Allan, JM, Veal, GJ, Cockerill, PN, Wichmann, C, Vormoor, J, Lacaud, G, Bonifer, C &Heidenreich, O 2018, 'The oncogenic transcription factor RUNX1/ETO corrupts cell cycle regulation to driveleukemic transformation', Cancer Cell, vol. 34, no. 4, pp. 626-642.e8. https://doi.org/10.1016/j.ccell.2018.08.015
Link to publication on Research at Birmingham portal
Publisher Rights Statement:Checked for eligibility 17/10/2018
Published in Cancel Cellhttps://doi.org/10.1016/j.ccell.2018.08.015
General rightsUnless a licence is specified above, all rights (including copyright and moral rights) in this document are retained by the authors and/or thecopyright holders. The express permission of the copyright holder must be obtained for any use of this material other than for purposespermitted by law.
•Users may freely distribute the URL that is used to identify this publication.•Users may download and/or print one copy of the publication from the University of Birmingham research portal for the purpose of privatestudy or non-commercial research.•User may use extracts from the document in line with the concept of ‘fair dealing’ under the Copyright, Designs and Patents Act 1988 (?)•Users may not further distribute the material nor use it for the purposes of commercial gain.
Where a licence is displayed above, please note the terms and conditions of the licence govern your use of this document.
When citing, please reference the published version.
Take down policyWhile the University of Birmingham exercises care and attention in making items available there are rare occasions when an item has beenuploaded in error or has been deemed to be commercially or otherwise sensitive.
If you believe that this is the case for this document, please contact [email protected] providing details and we will remove access tothe work immediately and investigate.
Download date: 30. Dec. 2019
Article
The Oncogenic Transcript
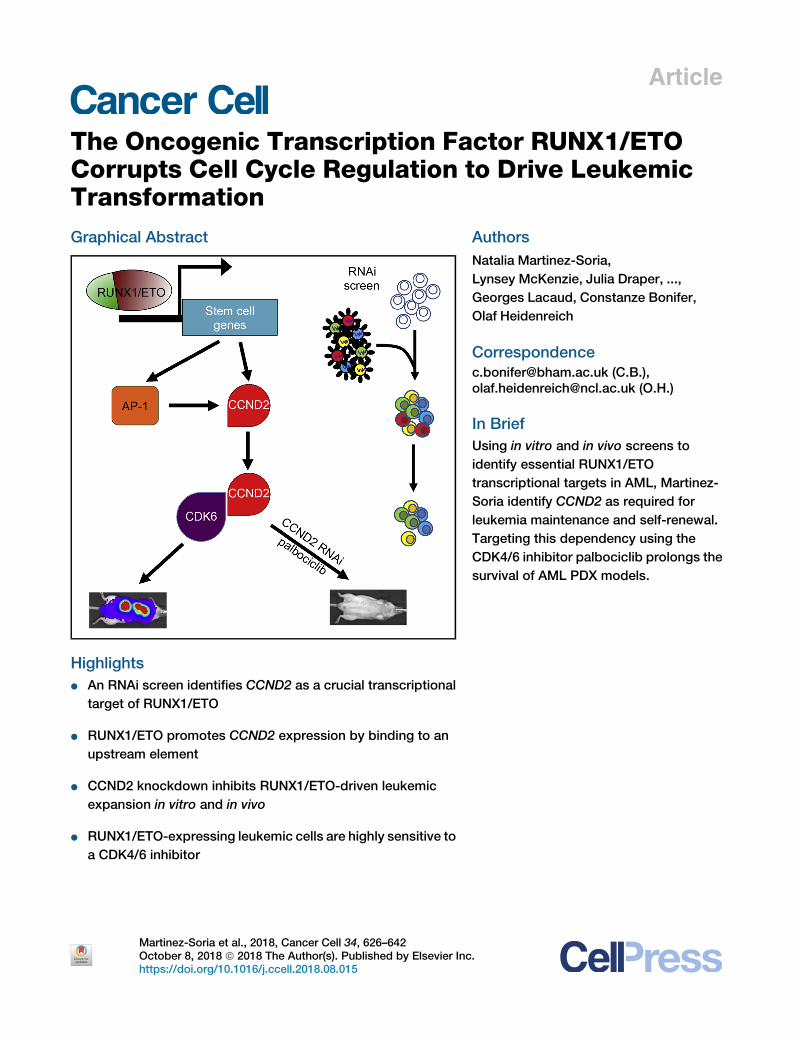
ion Factor RUNX1/ETOCorrupts Cell Cycle Regulation to Drive LeukemicTransformationGraphical Abstract
Highlights
d An RNAi screen identifies CCND2 as a crucial transcriptional
target of RUNX1/ETO
d RUNX1/ETO promotes CCND2 expression by binding to an
upstream element
d CCND2 knockdown inhibits RUNX1/ETO-driven leukemic
expansion in vitro and in vivo
d RUNX1/ETO-expressing leukemic cells are highly sensitive to
a CDK4/6 inhibitor
Martinez-Soria et al., 2018, Cancer Cell 34, 626–642October 8, 2018 ª 2018 The Author(s). Published by Elsevier Inchttps://doi.org/10.1016/j.ccell.2018.08.015
Authors
Natalia Martinez-Soria,
Lynsey McKenzie, Julia Draper, ...,
Georges Lacaud, Constanze Bonifer,
Olaf Heidenreich
[email protected] (C.B.),[email protected] (O.H.)
In Brief
Using in vitro and in vivo screens to
identify essential RUNX1/ETO
transcriptional targets in AML, Martinez-
Soria identify CCND2 as required for
leukemia maintenance and self-renewal.
Targeting this dependency using the
CDK4/6 inhibitor palbociclib prolongs the
survival of AML PDX models.
.

Cancer Cell
Article
The Oncogenic Transcription FactorRUNX1/ETO Corrupts Cell Cycle Regulationto Drive Leukemic TransformationNatalia Martinez-Soria,1,7 Lynsey McKenzie,1,7 Julia Draper,2 Anetta Ptasinska,3 Hasan Issa,1 Sandeep Potluri,3
Helen J. Blair,1 Anna Pickin,3 Asmida Isa,1 Paulynn Suyin Chin,3 Ricky Tirtakusuma,1 Daniel Coleman,3 Sirintra Nakjang,1
Salam Assi,3 Victoria Forster,1 Mojgan Reza,1 Ed Law,1 Philip Berry,4 Dorothee Mueller,3 Alex Elder,1 Simon N. Bomken,1
Deepali Pal,1 James M. Allan,4 Gareth J. Veal,4 Peter N. Cockerill,3 Christian Wichmann,5 Josef Vormoor,1,6
Georges Lacaud,2 Constanze Bonifer,3,* and Olaf Heidenreich1,6,8,*1Wolfson Childhood Cancer Research Centre, Northern Institute for Cancer Research, Newcastle University, Brewery Lane, Newcastle upon
Tyne NE1 7RU, UK2Cancer Research UK Manchester Institute, Manchester M20 4GJ, UK3Institute for Cancer and Genomic Sciences, College of Medical and Dental Sciences, University of Birmingham, Birmingham B15 2TT, UK4Newcastle Cancer Centre, Northern Institute for Cancer Research, Newcastle University, Newcastle upon Tyne NE2 4HH, UK5Department of Transfusion Medicine, Cell Therapeutics and Hemostaseology, Ludwig-Maximilian University Hospital, Munich 80539,
Germany6Princess Maxima Center for Pediatric Oncology, Utrecht 3584CS, the Netherlands7These authors contributed equally8Lead Contact
*Correspondence: [email protected] (C.B.), [email protected] (O.H.)https://doi.org/10.1016/j.ccell.2018.08.015
SUMMARY
Oncogenic transcription factors such as the leukemic fusion protein RUNX1/ETO, which drives t(8;21) acutemyeloid leukemia (AML), constitute cancer-specific but highly challenging therapeutic targets. We used epi-genomic profiling data for an RNAi screen to interrogate the transcriptional network maintaining t(8;21) AML.This strategy identified Cyclin D2 (CCND2) as a crucial transmitter of RUNX1/ETO-driven leukemic propaga-tion. RUNX1/ETO cooperates with AP-1 to drive CCND2 expression. Knockdown or pharmacological inhibi-tion of CCND2 by an approved drug significantly impairs leukemic expansion of patient-derived AML cellsand engraftment in immunodeficient murine hosts. Our data demonstrate that RUNX1/ETO maintains leuke-mia by promoting cell cycle progression and identifies G1 CCND-CDK complexes as promising therapeutictargets for treatment of RUNX1/ETO-driven AML.
INTRODUCTION
Therapeutic exploitation of oncogene addiction has become a
central aim of modern cancer therapy, but effective targeted
therapies have yet to be developed for the majority of
acute leukemia subtypes. Many of these are caused by chro-
mosomal rearrangements generating aberrant transcriptional
regulators such as RUNX1/ETO (Miyoshi et al., 1993). Treat-
Significance
Leukemic fusion proteins drive leukemia by maintaining abnorteins themselves, network components relaying fusion proteinWe tested this hypothesis by using an RNAi screen to functioRUNX1/ETO for their relevance for leukemia maintenance. Thessential RUNX1/ETO target gene, which confers high sensCCND-CDK4/6 complexes. This study demonstrates the feasibgene-driven vulnerabilities and their exploitation by repurpose
626 Cancer Cell 34, 626–642, October 8, 2018 ª 2018 The Author(s).This is an open access article under the CC BY license (http://creative
ments generally involve intensive and genotoxic chemotherapy,
which can severely impair the quality of life of patients during
treatment and of long-term survivors (de Rooij et al., 2015).
The toxicity of current treatments and the dissatisfactory
long-term survival of less than 70% even in acute myeloid leu-
kemia (AML) subgroups with ‘‘good prognosis’’ demand thera-
peutic concepts for more precise interference with the leukemic
program.
mal transcriptional networks. In contrast to most fusion pro-function may be amenable to pharmacologic interference.
nally interrogate transcriptional targets of the fusion proteinis approach identified the cell-cycle regulator CCND2 as anitivity toward palbociclib, a clinically approved inhibitor ofility of epigenomics-instructed screens for identifying onco-d drug approaches.
Published by Elsevier Inc.commons.org/licenses/by/4.0/).

A C E F
B
G H
I J
D
Figure 1. A Combined In Vitro/In Vivo RNAi Screen Identifies CCND2 as Crucial Mediator of RUNX1/ETO Function
(A) Scheme of the RNAi screen. t(8;21) cell lines were transduced with the lentiviral shRNA library and propagated with and without shRNA induction by
doxycycline either in vitro in three consecutive replatings (12–14 days per plating) and long-term suspension culture for up to 56 days (LTC) or in vivo by xen-
otransplantation of immunodeficient mice killed upon reaching clinical endpoints.
(B) Changes in relative (Rel.) sequencing read levels of proviral non-targeting control shRNA (shNTC) and RUNX1/ETO shRNA (shRE).
(C) PCA of shRNA pools in Kasumi-1 colony formation assay (CFA) cells during replating. PC, principal component.
(legend continued on next page)
Cancer Cell 34, 626–642, October 8, 2018 627

The chromosomal translocation t(8;21) generates the RUNX1/
ETO fusion protein, which interferes with normal hematopoiesis
by deregulating the expression of hundreds of genes, many of
them bound by the fusion protein and its binding partners,
thus defining a core transcriptional network of RUNX1/ETO-
responsive genes (Martens et al., 2012; Ptasinska et al., 2012,
2014). We reasoned that such a transcriptional network
contains crucial mediators of a fusion protein-driven AML
maintenance program that are amenable to pharmacological in-
hibition. Therefore, we tested the idea that RUNX/1ETO gener-
ates addictions for malignant cells accessible to therapeutic
intervention.
RESULTS
An RNAi Screen Identifies RUNX1/ETO Target GenesEssential for Leukemic PropagationTo identify pathways essential for RUNX1/ETO-driven leukemo-
genesis, we performed an RNAi screen targeting RUNX1/ETO-
bound genes responsive to RUNX1/ETO depletion (Figure 1A)
(Ptasinska et al., 2012, 2014). Gene set enrichment analysis
(GSEA) linked the set of genes downregulated by RUNX1/ETO
depletion to self-renewal programs (Figure S1A) (Ben-Porath
et al., 2008; Jaatinen et al., 2006; Muller et al., 2008). Integration
of bead array gene expression data from t(8;21) cell lines and
patient material with chromatin immunoprecipitation (ChIP)
sequencing (ChIP-seq) data from our perturbation studies
defined a set of 110 gene loci bound by RUNX1/ETO and with
reduced expression upon RUNX1/ETO knockdown (Ptasinska
et al., 2012). Inclusion of negative and positive control constructs
and small hairpin RNAs (shRNAs) against genes known to coop-
erate with RUNX1/ETO, such as KIT, RUVBL1 (also known as
Pontin), and CAPN1, yielded a lentiviral library of 374 shRNA
constructs targeting 133 genes (Table S1) (Breig et al., 2014;
Osman et al., 2009; Wichmann et al., 2015). To exclude cell
type bias, all screens were performed with two t(8;21) AML cell
lines, Kasumi-1 and SKNO-1. Furthermore, the RNAi screens
consisted of non-induced and doxycycline-induced arms with
4 3 106 transduced cells in each arm yielding a 10,000-fold
coverage of the shRNA library. Differentially expressed shRNA
constructs were identified by comparison between the two cor-
responding arms (Figure 1A). Doxycycline treatment resulted in
robust shRNA-associated red fluorescent protein (RFP) expres-
sion in vitro and in vivo (Figures S1B and S1C).
To identify genes required for leukemic self-renewal in vitro,
we determined changes in shRNA pool compositions after
extended suspension culture for up to 56 days or in colony for-
mation assays after three replatings. For the in vivo screen, we
intrafemorally transplanted NOD.Cg-Prkdcscid Il2rgtm1Wjl/SzJ
(NSG) mice with either Kasumi-1 or SKNO-1 cells transduced
(D) PCA of shRNA pools from Kasumi-1 transplanted NSG mice. dox, dox tre
treatment initiated 28 days after transplantation.
(E and F) Clustered heatmaps showing fold changes for genes in the in vitro (E) and
collapsed changes of shRNAs using the RRA approach of MAGeCK.
(G) Comparison of changes in shRNA construct levels in vivo and after the third
(H) Venn diagram identifying depleted shRNA constructs shared between the dif
(I and J) Fold change of all CCND2 shRNA constructs after third replatings (I) and
***p < 0.001; **p < 0.01; *p < 0.05 compared with no dox controls. See also Figu
628 Cancer Cell 34, 626–642, October 8, 2018
with the RNAi library. Next-generation sequencing yielded
4 3 104 to 2 3 106 reads per pool with 100–5,000 reads per
shRNA construct (Figure S1D, Tables S2 and S3). The shRNA
construct targeting RUNX1/ETO served as a positive control
and was strongly depleted after the first plating. The non-target-
ing control shNTC remained stable over the course of three re-
platings in both Kasumi-1 and SKNO-1 cells, thus demonstrating
overall functionality of the screen (Figures 1B and S1E).
Principal component analyses (PCAs) demonstrated that
doxycycline treatment increased separation of shRNA-express-
ing cell populations from baseline and untreated samples in all
in vitro and in vivo screens (Figures 1C, 1D, S1F, and S1G). Un-
like SKNO-1, engraftment of Kasumi-1 cells in NSG mice
induced amodest deviation of the engrafted pool from the base-
line pool composition (Figures 1D and S1G). Possible reasons
for this shift may include leaky expression of shRNAs in the
absence of doxycycline or potential niche competition. Never-
theless, the strategy of pre-selecting potential components
of the RUNX1/ETO-driven transcriptional network yielded an
extraordinarily high number of hits with more substantial
changes in the in vivo arm compared with the in vitro arm (Fig-
ures S1H and S1I). Intersection of depleted shRNA sequences
in both replating and in vivo screens showed that Kasumi-1 cells
shared more than 40% of depleted shRNAs with SKNO-1 cells,
indicating a substantial qualitative concordance between t(8;21)
cell lines (Figure S1J).
Notably, the in vitro and the in vivo screens identified distinct
groups of genes relevant for RUNX1/ETO-driven leukemia
propagation, suggesting that the in vivo environment required
additional gene functions for successful engraftment (Figures
1E and 1F). Two shRNAs were significantly depleted in all
in vitro and in vivo screens, both of which target CCND2 (Figures
1G and 1H). All three CCND2 shRNAs present in the pool
were depleted in both cell lines during replating and long-term
culture (Figure 1I). Furthermore, all three shRNAs were
depleted in Kasumi-1 cells in vivo, and two were depleted in
SKNO-1 cells in vivo (Figure 1J). These data highlight the impor-
tance of CCND2 expression for leukemic propagation in vitro
and in vivo.
RUNX1/ETO Regulates CCND2 Transcription via anIntergenic ElementCCND2 is highly expressed with similar transcript levels found in
t(8;21)-positive and -negative AML patients (Figures S2A and
S2B). To ascertain whether CCND2 is a transcriptional target
of RUNX1/ETO, we analyzed the CCND2 locus by integrating
ChIP-seq and DNaseI hypersensitivity site sequencing (DHS-
seq) data (Ptasinska et al., 2012, 2014).
In t(8;21) Kasumi-1 cells, DHS-seq, and ChIP-seq highlighted
an open chromatin region located 30 kb upstream of the CCND2
atment initiated immediately after transplantation; dox delayed, doxycycline
the in vivo (F) arms of the RNAi screen. Fold changes were calculated based on
replating.
ferent RNAi screen conditions.
in vivo engraftment (J).
re S1 and Tables S1, S2, and S3.

A B C
FED
G
I J
K
H
Figure 2. RUNX1/ETO Controls CCND2 Expression via an Upstream Regulatory Element
(A) University of California, Santa Cruz (UCSC) genome browser screenshot displaying changes in transcript levels (green) based on RNA sequencing (RNA-seq)
and RUNX1/ETO binding (pink) based on ChIP-seq at the CCND2 locus in Kasumi-1 cells. siRE, RUNX1/ETO small interfering RNA (siRNA); siMM, mismatch
control siRNA. Scale and nucleotide positions are indicated at the top.
(B) Screenshot of RUNX1/ETO binding and DNase1 hypersensitive sites (DNase1) at the �30 kb region of CCND2 in Kasumi-1 cells treated with siMM. The
location and sequence are shown on top with the RUNX1 consensus sites indicated in red.
(C) Change in CCND2 transcript levels between Kasumi-1 cells treated with siMM and siRE, as determined by RNA-seq. ***p < 0.001 compared with siMM.
(D) Immunoblots of CCND2 protein levels in Kasumi-1 and SKNO-1 cells following RUNX1/ETO knockdown. Mock, electroporated without siRNA.
(E) Chromatin accessibility atCCND2 for two t(8;21) AML patients (t(8;21) #1 and #2), normal CD34+ PBSCs from two donors (PBSC #1 and #2) and Kasumi-1 cells
as judged by DHS-seq. Top panel, RUNX1/ETO binding by ChIP-seq.
(F)CCND2 transcript levels in primary AML (patient sample L852) with (siRE) andwithout (siMM) RUNX1/ETO knockdown as analyzed by Illumina bead arrayswith
probe ILMN_2067656. ***p < 0.001 (Illumina custom false discovery rate [FDR]) compared with siMM.
(G) Effect of RUNX1/ETO knockdown on transcription factor binding at the CCND2 locus in Kasumi-1 cells.
(legend continued on next page)
Cancer Cell 34, 626–642, October 8, 2018 629

transcriptional start site (TSS) occupied by RUNX1/ETO (Figures
2A and S2C) that contained a tandem arrangement of RUNX1
consensus binding sites known to favor RUNX1/ETO occupation
(Figure 2B) (Okumura et al., 2008). Knockdown of RUNX1/ETO
eliminated its binding to this element and decreased CCND2
RNA and protein levels (Figures 2A, 2C, 2D, S2C, and S2D).
DHS-seq analysis of primary cells from two t(8;21) AML patients
and normal peripheral blood stem cells (PBSCs) from healthy do-
nors showed a highly similar pattern to that in Kasumi-1 cells
(Figure 2E). Furthermore, RUNX1/ETO knockdown diminished
CCND2 expression in primary AML blasts (Figure 2F). Therefore,
CCND2 regulation is conserved across t(8;21) cell lines and pri-
mary patient cells supporting Kasumi-1 cells as an appropriate
model system for investigating RUNX1/ETO-exerted control of
CCND2 expression.
Loss of RUNX1/ETO enhanced RUNX1 binding and dimin-
ished LMO2 binding at the �30 kb element, indicating competi-
tion between fusion and wild-type protein and a preferred
interaction of LMO2 with RUNX1/ETO at this site (Figures 2G,
2H, and S2E). These changes were associated with increased
DNaseI accessibility at the �30 kb element and increased
H3K9 acetylation at both the �30 kb element and the TSS (Fig-
ure 2I). Surprisingly, although amark for actively transcribed pro-
moters, this increase in H3K9 acetylation was linked to reduced
RNA polymerase II (RNA pol II) occupancy across the CCND2
gene body (Figure S2C). However, we observed increased
RNA pol II binding at the �30 kb element and a second location
at �27 kb, suggesting that increased histone acetylation and
RNA pol II occupation at the two upstream elements impairs
CCND2 expression (Figure 2I). Since RUNX1/ETO recruits
class I histone deacetylases (HDACs) to DNA (Gelmetti et al.,
1998; Lutterbach et al., 1998), we tested the impact of histone
acetylation onCCND2 expression by pharmacological HDAC in-
hibition. Treatment of Kasumi-1 or SKNO-1 cells with the HDAC
inhibitor vorinostat reduced CCND2 expression, confirming an
inhibitory function of histone acetylation of this gene (Figure 2J).
Interestingly, genome-wide chromosome conformation capture
data (CHiC) from Kasumi-1 cells indicated an interaction be-
tween the �30 kb region and the TSS, which was enhanced by
RUNX1/ETO loss (Figure 2K). In conclusion, RUNX1/ETO main-
tains CCND2 expression by binding to the �30 kb element,
which affects the three-dimensional interaction between this
element and the CCND2 TSS.
RUNX1/ETO Drives CCND2 Expression through AP-1FactorsNext, we asked whether RUNX1/ETO occupancy affected the
association of activating transcription factors to the CCND2
locus, focusing on AP-1, a heterodimer between JUN and
(H) Assessment of RUNX1/ETO in control (shNTC) or RUNX1/ETO knockdown (s
mean ± SD; *p < 0.05; **p < 0.01 compared with shNTC.
(I and J) (I) Assessment of epigenetic changes by ChIP-seq and DHS-seq in chrom
element upon RUNX1/ETO knockdown (siRE) in comparison with siMM in Kasumi
normalized to GAPDH (norm. CCND2) in t(8;21) AML cell lines. n = 3; mean ± SD
(K) Genome browser screenshot of promoter capture CHiC in Kasumi-1 cells vis
element with the CCND2 TSS. Control siRNA treatment, CHiC siMM; RUNX1/E
between RUNX1/ETO knockdown and control.
See also Figure S2.
630 Cancer Cell 34, 626–642, October 8, 2018
FOS family members known to transcriptionally activate
CCND2 (Mathas et al., 2002). JUN (c-JUN) is induced upon
RUNX1/ETO expression (Figure S3A) (Elsasser et al., 2003),
and it scored in the in vivo RNAi screen as being essential for
leukemia propagation (Figure 3A). Depletion of RUNX1/ETO
reduced binding of JUND to the CCND2 promoter and reduced
expression of JUN and several FOS family members (Figures
3B–3D and S3B). To functionally interfere with all AP-1 hetero-
dimers, we expressed a doxycycline-inducible dominant-nega-
tive FOS (dnFOS) (Olive et al., 1997). Induction of dnFOS
reduced JUND binding to the CCND2 promoter and diminished
CCND2 transcript and protein levels without interfering with
RUNX1/ETO occupation of the �30 kb element (Figures 3E–
3G, S3C, and S3D).
These combined data support a model where RUNX1/ETO
drives CCND2 expression by directly binding to the �30 kb
element and indirectly by supporting expression and binding of
AP-1 family members to the CCND2 promoter (Figure 3H).
Following RUNX1/ETO depletion, RUNX1 binding increases,
AP-1 binding is lost, and the balance is shifted to the inactive
state of CCND2.
CCND2 Is Required for Propagation of t(8;21)-Positive AMLKnockdown of RUNX1/ETO impairs engraftment, proliferation,
and clonal expansion and causes an accumulation of cells in
the G1 phase of the cell cycle (Martinez et al., 2004; Martinez
Soria et al., 2009). To examine the significance of CCND2
in these processes, we performed competitive proliferation
and transplantation assays using two validated CCND2
shRNAs (Figures 4A, S4A, and S4B). Both RUNX1/ETO (shRE)
and CCND2 (shCCND2-1 and -3) shRNA-expressing cells
were outcompeted by control cells (shNTC) within 15 days
of culture (Figures 4B and S4C). Competitive transplantation
of the Kasumi-1 cells into immunodeficient Rag2�/�Il2rg�/�
1293Balb/c (RG) mice resulted in a loss of cells expressing
RUNX1/ETO and CCND2 shRNAs, indicating a requirement of
both RUNX1/ETO and CCND2 for engraftment (Figures 4C
and S4D).
As with RUNX1/ETO, depletion of CCND2 inhibited cell prolif-
eration and clonogenic capacity and caused a G0/G1 arrest
without substantially increasing apoptosis (Figures 4D–4F,
S4E, and S4F). Induction of cellular senescence indicated a per-
manent cell-cycle arrest (Figure 4G). However, in contrast to
RUNX1/ETO knockdown, neither CCND2 knockdown nor phar-
macologic inhibition of CDK4/6-CCND complexes affected
CD34, CD33, or ITGAM (CD11b) transcript levels, suggesting it
did not relieve the RUNX1/ETO-mediated myeloid differentiation
block (Figure S4G). Both CCND2 and RUNX1/ETO depletion led
hRE) Kasumi-1 cells at the �30 kb element of CCND2 by manual ChIP. n = 3;
atin structure, histone K9 acetylation, and RNA Pol II occupation at the�30 kb
-1 cells. (J) Impact of the HDAC inhibitor vorinostat on CCND2 RNA expression
; ***p < 0.001 compared with shNTC.
ualizing the impact of RUNX1/ETO depletion on the interaction of the �30 kb
TO knockdown, CHiC siRE. CHiC fold change, fold difference in interaction

A B C
DH
E F
G
Figure 3. RUNX1/ETO Regulates CCND2 Expression by Promoting AP-1 Activity
(A) Log fold change of three JUN shRNA construct levels in in vivo screens in Kasumi-1 and SKNO-1 cells. ***p < 0.001; **p < 0.01 compared with no dox controls.
(B) UCSC screenshot showing JUND and RUNX1/ETO binding to the CCND2 locus with and without RUNX1/ETO knockdown in Kasumi-1 cells.
(C–E) (C) Manual ChIP validation of JUND binding at the CCND2 promoter with and without RUNX1/ETO knockdown in Kasumi-1 cells. shRE, RUNX1/ETO
shRNA; shNTC, non-targeting control shRNA. n = 3; mean ± SD; *p < 0.05 comparedwith shNTC. (D) Changes in transcript levels of JUN and FOSmembers upon
RUNX1/ETO knockdown in Kasumi-1 cells as assessed by RNA-seq. Mean ± SD; n = 3. ***p < 0.001; *p < 0.05 compared with shNTC. (E) Expression of dnFOS
transcript in Kasumi-1 cells lentivirally transduced with dnFOS or control (Ctrl) vector. Cells were incubated for 5 days with and without dox. n = 3; mean ± SD;
***p < 0.001.
(F) Impact of dnFOS induction by doxycycline in Kasumi-1 cells on relative CCND2 transcript levels measured by qPCR normalized toGAPDH. n = 3; mean ± SD;
*p < 0.05.
(G) Immunoblot showing CCND2 protein levels in Kasumi-1 cells upon dnFOS induction for 5 days. dnFOS#1 and dnFOS#2, FOS overexpressing clones 1 and 2,
respectively; Ctrl, normal Kasumi-1 cells.
(H) Scheme depicting a model for the regulation of CCND2 by RUNX1/ETO. Depletion of RUNX1/ETO enhances interaction between�30 kb and TSS, increases
H3K9 acetylation and occupation of the�30 kb element by RUNX1 and RNA Pol II, impairs AP1 binding at the promoter, and stalls RNA Pol II at the TSS, leading
to reduced CCND2 transcription.
See also Figure S3.
to reduced RB1 phosphorylation at serine 780 and threonine 821
(Figure 4H), sites phosphorylated by CDK4 and CDK6 (Harbour
et al., 1999). Finally, interfering with AP-1 function by expression
of dnFOS and the subsequent downregulation of CCND2 caused
a G1 cell-cycle arrest, increased cell-doubling time, and reduced
clonogenicity (Figures 4I–4K), but did not affect cell survival (Fig-
ure S4H). Induction of dnFOS did not increase the G0 fraction,
and termination of dnFOS expression restored the cell-cycle
Cancer Cell 34, 626–642, October 8, 2018 631

A B
DC E
HGF
IJ K
Figure 4. RUNX1/ETO-Expressing AML Cells Are Addicted to CCND2
(A) Scheme of the competitive co-culture and transplantation approaches. t(8;21) cells were lentivirally transduced with either a vector linking RPF657 to a non-
targeting control shRNA (shNTC) or dTomato to an shRNA targeting either RUNX1/ETO (shRE) or CCND2 (shCCND2-1, �3). Control and knockdown cells were
mixed 50:50 followed by co-culture (Kasumi-1 and SKNO-1) or intrahepatic transplantation into newborn RG mice (Kasumi-1). shRE, RUNX1/ETO shRNA;
shCCND2, CCND2 shRNA; shNTC, non-targeting control shRNA.
(B) Graph showing percentage of shRE-, shCCND2-1- or shCCND2-3 expressing Kasumi-1 and SKNO-1 cells compared with snNTC expressing cells
during LTC.
(C) Percentage of Kasumi-1 cells with indicated shRNA in transplanted RGmice. BL, starting pool prior to transplantation; RG, cells harvested from transplanted
RG mice humanely killed at clinical endpoints. Mean ± SD, n = 5.
(legend continued on next page)
632 Cancer Cell 34, 626–642, October 8, 2018

distribution, suggesting that CCND2 depletion does not cause
quiescence (Figure S4I). In summary, these data demonstrate
that RUNX1/ETO drives leukemic proliferation and cell-cycle
progression by maintaining CCND2 expression.
Key Regulators of G1 Progression Are Controlled byRUNX1/ETO but Do Not Compensate for CCND2 LossWe next examined whether knockdown of either RUNX1/ETO or
CCND2 affected the expression of other D cyclins and G1 CDKs.
While CDK4 was not differentially expressed, CDK6 and CCND1
levels were significantly higher and CCND3 levels were lower in
t(8;21) AML cells compared with other AMLs (Figures 5A and
S5A). RUNX1/ETO knockdown reduced CCND1 and CDK6
expression, with CCND1 transcript levels also being diminished
in primary AML cells (Figures 5B, 5C, and S5B–S5D). Both
CCND1 and CDK6 loci contain several binding sites and are
potential direct target genes for RUNX1/ETO (Figures 5D, 5E,
and S5E–S5G).
Since loss of a single D cyclin can be compensated by
increased expression of other D cyclins (Ciemerych et al.,
2002; Lam et al., 2000), we determined the transcript levels of
CDK4, CDK6, CCND3, and CCND1 after CCND2 knockdown.
Only CCND1 transcript levels rose more than 1.5-fold while the
expression of the other genes did not change (Figures 5F and
S5H). However, simultaneous knockdown of both CCND1 and
CCND2 did not enhance the effects of CCND2 knockdown alone
(Figures 5G–5J). In conclusion, loss of CCND2 is not functionally
compensated by changed expression of other components of
G1 CDK-CCND complexes.
Pharmacological Inhibition of CDK4/6-CCNDComplexes Inhibits RUNX1/ETO-Driven AMLSince CCND2 binds to CDK4 and CDK6 (Matsushime et al.,
1992; Meyerson and Harlow, 1994; Xiong et al., 1992), we
explored whether RUNX1/ETO-expressing cells were sensitive
to the CDK4/6 inhibitor palbociclib (PD-0332991) similar to
MLL-rearranged (MLLr) and FLT3-ITD-positive leukemia (Placke
et al., 2014; Uras et al., 2016; van der Linden et al., 2015). t(8;21)
AML cell proliferation and clonogenic potential were highly sen-
sitive to palbociclib with GI50 values (concentration of drug to
cause 50% reduction in proliferation of cancer cells) below
50 nM and did not resume proliferation during 18 days of drug
(D) Proliferation curves for Kasumi-1 and SKNO-1 cells electroporated sequentia
cells; siCCND2, CCND2 siRNA; siMM, mismatch control siRNA. Kasumi-1, n = 3
(E) Colony formation of Kasumi-1 cells transduced with the indicated siRNA const
n = 3; **p < 0.01; *p < 0.05 compared with Mock.
(F) Cell cycle distribution of Kasumi-1 and SKNO-1 cells with and without CCND
Kasumi-1, n = 3; ***p < 0.001; **p < 0.01; *p < 0.05 compared with siMM.
(G) Senescence in Kasumi-1 and SKNO-1 cells as indicated by staining for sen
porations with the indicated siRNAs. Top panels, stained cells; bottom panel, qu
Standard bar, 50 mm.
(H) Immunoblots showing the effect of RUNX1/ETO and CCND2 knockdown in K
changes.
(I) Cell cycle distribution of Kasumi-1 cells after 5 days with and without dnFOS
containing cells. Mean ± SD; n = 3. ***p < 0.001 compared with no dox.
(J) Impact of dnFOS inductions on cell doubling times (tD). Mean ± SD; n = 3. ***
(K) Impact of dnFOS induction on clonogenicity of Kasumi-1 cells. Colonies were
compared with no dox.
See also Figure S4.
exposure (Figures 6A–6C). This sensitivity toward palbociclib is
notable given that both lines carry p53 mutations (Banker
et al., 1998; Matozaki et al., 1995). GI50 values for t(8;21)-nega-
tive AML lines varied between 60 and 230 nM (Figure S6A),
and these cells also did not resume proliferation during pro-
longed drug exposure (Figure S6B).
To examine the effect of treatment in pre-leukemic cells, we
examined the impact of pharmacological inhibition of CDK4/6
in a human pre-leukemic cell culture model expressing a trun-
cated variant of RUNX1/ETO and a constitutive active KIT
N822K receptor (Wichmann et al., 2015). Palbociclib treatment
impaired proliferation (GI50 = 25 nM, Figure 6D), demonstrating
that primary RUNX1/ETO-positive cells are also dependent on
catalytically active CDK4 or CDK6.
In general, growth inhibition was primarily cytostatic for
nanomolar concentrations of palbociclib with minor increases
in apoptotic cells; impaired growth was associated with a
dose-dependent cell-cycle arrest in the G0/G1 phase (Figures
6E and S6C). Extended treatment did not reduce G1 phase ar-
rest (Figure S6D), emphasizing that prolonged exposure to pal-
bociclib might not cause resistance in RUNX1/ETO-expressing
cells. Moreover, it affected neither expression of myeloid differ-
entiation markers nor the size of the G0 population (Figures 6F
and S4G), but palbociclib caused a more than 10-fold increase
in senescence-associated b-galactosidase positivity in both
Kasumi-1 and SKNO-1 cells (Figure 6G). Finally, palbociclib
reduced phosphorylation of RB1 without affecting CCND2 or
CDK6 protein levels (Figure 6H). These data show that palboci-
clib promotes neither myeloid differentiation nor quiescence
but induces a G1 cell-cycle arrest and senescence.
The observed dependence of RUNX1/ETO on its downstream
target CCND2 was reflected by a substantial overlap between
the transcriptional responses to palbociclib and knockdown of
CCND2 andRUNX1/ETO. GSEA showed a significant correlation
between gene sets associated with RUNX1/ETO-depleted,
CCND2-depleted, and palbociclib-treated Kasumi-1 cells and
with published RUNX1/ETO knockdown signatures (Figures 6I
and S6E) (Dunne et al., 2006; Tonks et al., 2007). We found a
substantial overlap of shared gene sets, including cell-cycle
regulation, nucleotide metabolism, MYC- and MTOR-regulated
programs, glucose transport, glycolysis, stemness, and pluripo-
tency programs (Figures 6J and S6F). Notably, both CCND2
lly every two days with the indicated siRNAs. Mock; non-siRNA electroporated
, mean ± SD; SKNO-1, n = 1.
ructs at 12 days post plating. CFU, colony-forming unit. Mean ± SD; Kasumi-1,
2 knockdown. Mean ± SD; n = 3. Counts at 12 days post plating. Mean ± SD;
escence-associated b-galactosidase (SA-bGAL) after two sequential electro-
antitation of SA-bGAL+ cell numbers. n = 2 technical replicates; mean ± range.
asumi-1 and SKNO-1 cells on phosphorylation of RB1. Numbers indicate fold
induction by doxycycline. Ctrl, empty vector control; dnFOS, dnFOS vector-
p < 0.001 compared with no dox.
counted 12 days post plating relative to no dox. Mean ± SD; n = 3. *p < 0.05
Cancer Cell 34, 626–642, October 8, 2018 633

A B C
ED
F G
IH J
Figure 5. G1 Cell Cycle Components Are Regulated by RUNX1/ETO but Do Not Compensate for CCND2 Loss
(A) Comparison of CCND1 and CDK6 expression between patients with t(8;21)-positive and -negative AML. Line, median; horizontal box, interquartile range;
whiskers, 1.53 interquartile range. p value was determined by Mann-Whitney U test. Data were obtained from GEO GSE6891.
(B) CCND1 and CDK6 expression with and without RUNX1/ETO knockdown in Kasumi-1 cells as indicated by RNA-seq. siRE, RUNX1/ETO siRNA; siMM,
mismatch control siRNA. Mean ± SD; n = 3. ***p < 0.001.
(C)CCND1 transcript levels in primary t(8;21) AML blasts uponRUNX1/ETO knockdown as analyzed by Illumina bead arrayswith probe ILMN_1688480. **p < 0.01
compared with siMM.
(legend continued on next page)
634 Cancer Cell 34, 626–642, October 8, 2018

knockdown and palbociclib caused significant reduction of
EZH2 transcript levels (Figure S6G). Moreover, gene sets asso-
ciated with CCND2 knockdown and palbociclib were inversely
correlated with EZH2 and EDD gene expression signatures (Fig-
ure S6H). Since activation of EZH1/2 is associated with quies-
cence in leukemic stem cells (Fujita et al., 2018), these results
suggest that palbociclib is unlikely to promote quiescence.
Together, these findings demonstrate that the dependence of
t(8;21) AML cells on CCND2 confers acute sensitivity to
palbociclib.
Inhibition of G1 CDK Activity Impairs Ex Vivo Expansionof Primary AML CellsNext, we examined the sensitivity of primary AML cells to palbo-
ciclib. We cultured cells obtained from t(8;21)-positive and
-negative AML patients on human bone marrow-derived mesen-
chymal stem cells (MSCs) or, in the case of a relapsed sample,
on murine MS-5 feeder layers, which support proliferation of pri-
mary AML cells (Figure S7A) (Griessinger et al., 2014; Pal et al.,
2016). Importantly, palbociclib did not affect feeder cell numbers
(Figure S7B). Consistent with our cell line data, palbociclib dose-
dependently inhibited proliferation of primary AML blasts. A clin-
ically achievable concentration of 300 nM palbociclib (Tamura
et al., 2016) resulted in a 3-fold reduction of t(8;21)-positive
AML blasts (Figures 7A, 7B, and S7C).We also tested palbociclib
on a t(8;21) AML sample from a relapse patient and observed
high drug sensitivity with a 5-fold reduced cell number upon
treatment with 300 nM palbociclib (Figure 7C). Primary t(8;21)-
negative AML cells showed an overall trend of being less sensi-
tive to palbociclib compared with t(8;21)-positive AML (Figures
7A and S7D), although there was some heterogeneity in
response concomitant with reported sensitivity in other AML
subtypes (Placke et al., 2014; Uras et al., 2016; van der Linden
et al., 2015). Notably, palbociclib sensitivity did not strictly corre-
late with cell expansion, possibly due to proliferation masked by
cell-death-associated loss of cells.
Treated AML cells showed an accumulation in the G0/G1
phase and a slight increase in apoptotic cells (Figures 7D and
7E) as well as a 2-fold impediment of colony formation potential,
which was further reduced to more than 10-fold when palboci-
clib was included in the semisolid medium (Figures 7F, S7E,
and S7F). In conclusion, palbociclib impairs both the expansion
and clonogenicity of primary AML blasts.
Palbociclib Inhibits Leukemia In Vivo
To confirm that CCND2was required to propagate t(8;21) in vivo,
we examined the efficacy of palbociclib in RGmice transplanted
(D and E) RUNX1/ETO knockdown-induced changes in transcript levels and RU
indicated by RNA-seq (green) and ChIP-seq (pink), respectively. Top, scale and
(F) Impact of CCND2 knockdown by two different siRNAs on indicated mRNA l
indicated siRNAs. Transcript levels were determined on day 8 by qPCR.Mock, non
Mean ± SD; n = 3. ***p < 0.001; **p < 0.01 compared with siMM.
(G) Effects of single and combined siRNA treatment on CCND2, CCND1, and CD
48 hr after electroporation by qPCR and normalized to GAPDH. Mean ± SD, n =
(H) Proliferation curves for Kasumi-1 cells electroporated sequentially every 2 da
(I) Cell cycle distribution of Kasumi-1 cells 48 hr after electroporation with the ind
(J) Colony formation of Kasumi-1 cells electroporated with the indicated sRNA com
siMM. Mean ± SD; n = 4 technical replicates.
See also Figure S5.
with Kasumi-1 cells by initiating treatment and following the
development of disseminated luciferase signal (Figures 7G, 7H,
and S7G). Pharmacokinetic analysis indicated that a single oral
application of 100 mg/kg palbociclib achieved plasma levels in
the micromolar range over a period of 24 hr (Figure S7H), thus
exceeding the plasma levels reported for breast cancer patients
(Tamura et al., 2016). Palbociclib treatment halted disease pro-
gression and induced a transient decrease in luciferase signal
(Figure 7H), and overall survival in palbociclib-treated mice
was significantly longer (87 days) than control mice (67 days)
(Figure 7I).
To extend these studies to an in vivo setting that represents
the AML hierarchy and clonal variety of primary AML, we tested
the anti-leukemic effect of palbociclib in a mouse leukemia
model expressing a C-terminally truncated isoform of RUNX1/
ETO, termed RUNX1/ETO9a (Draper et al., 2016; Yan et al.,
2006). ChIP experiments with RUNX1/ETO9a in KIT-positive he-
matopoietic stem and progenitor cells showed binding of the
truncated protein to the corresponding murine Ccnd2 and
Cdk6 cis-elements as shown for the full-length RUNX1/ETO pro-
tein in human cells (Figures S7I and S7J). Consistently, palboci-
clib substantially reduced the leukemic burden, delayed AML
progression, and increased the median survival from 29 days
in the control group to 59 days (Figures 7J, 7K, and S7K). Taken
together, the RUNX1/ETO-supported expression of drivers of G1
cell-cycle progression is causatively linked with strong single-
agent activity of palbociclib against t(8;21) AML in vitro and in vivo
(Figure 7L).
Inhibition of G1 CDK Activity Sensitizes AML Cellstoward KIT InhibitionFinally, we asked whether interference with G1 CDK activity
would create therapeutic vulnerabilities. Activating KIT muta-
tions are among the most frequent secondary mutations found
in t(8;21) AML and indicate poor clinical outcome (Wang et al.,
2005; Wichmann et al., 2015). Since both Kasumi-1 and
SKNO-1 express KITN822K, it was interesting to note that KIT
shRNAs were depleted in both of the RNAi screens (Figure 8A),
emphasizing the significance of KIT mutants in t(8;21) AML prop-
agation (Becker et al., 2008; Faber et al., 2016; Larizza et al.,
2005). STRING network analysis of genes indicated in the screen
by at least two shRNAs showed no direct interaction between
KIT and CCND2. However, KIT may affect CCND2 indirectly
via MYC and JUN/AP-1 and may also regulate pathways such
as MTOR that are targeted by RUNX1/ETO (Figures 8B and
S8A) (Rossi et al., 2006; Serve et al., 1995). Previous studies
demonstrated responsiveness of KITN822K-expressing t(8;21)
NX1/ETO binding at the CCND1 (D) and CDK6 (E) loci in Kasumi-1 cells as
base pair position on chromosome.
evels. Kasumi-1 cells were sequentially electroporated every 2 days with the
-siRNA electroporated cells; siCCND1, siCCND2, CCND1, and CCND2 siRNA.
K6 RNA levels in Kasumi-1 cells. Transcript levels were analyzed in triplicates
3. ***p < 0.001; **p < 0.01 compared with siMM.
ys with the indicated siRNA combinations.
icated shRNA combinations. n = 1.
binations. Colonies were counted after 12 days post plating and normalized to
Cancer Cell 34, 626–642, October 8, 2018 635

A B D
C E
HG
J
F
I
(legend on next page)
636 Cancer Cell 34, 626–642, October 8, 2018

cells to imatinib, an inhibitor of ABL, BCR/ABL, PDGF receptor,
and KIT (Wang et al., 2005). Palbociclib was synergistic with im-
atinib in Kasumi-1 and SKNO-1 cells with combination indices
below 0.6 (Figures 8C and S8B). Therefore, interference of
RUNX1/ETO-driven G1 progression sensitizes leukemic cells
to inhibition of mutated KIT, a major secondary event in t(8;21)
AML. Since RUNX1/ETO and KITN822K represent initiating and
secondary events of leukemogenesis, these data suggest that
concurrent targeting of the two mutations may offer substantial
therapeutic benefit.
DISCUSSION
The molecular mechanisms by which RUNX1/ETO promotes
CCND2 expression highlights the complexity of how leukemo-
genic transcription factors reprogram the epigenome and estab-
lish an aberrant transcriptional network essential for leukemia
maintenance and self-renewal. RUNX1/ETO has been described
to activate gene expression by interacting with the histone ace-
tylase EP300 (Wang et al., 2011). However, here we show that
RUNX1/ETO can also activate gene expression by interfering
with an intergenic negative regulatory element. Members of the
RUNX family, including RUNX1, have been previously reported
to interact with silencing elements to restrict gene expression
to distinct cell lineages (Setoguchi et al., 2008). The activation
ofCCND2 transcription by RUNX1/ETO binding to the�30 kb re-
gion may represent another example for the interaction of RUNX
proteins with a negative regulatory element.
However, RUNX1/ETO does not only directly regulate CCND2
expression. AP-1 activity is required to drive CCND2 expression
and cell growth, and RUNX1/ETO loss reduces expression of
AP-1 family members, which affects the recruitment of AP-1 fac-
tors to theCCND2 promoter (Mathas et al., 2002). RUNX1/ETO is
thought to promote JUN expression by activating JNK signaling
(Elsasser et al., 2003; Frank et al., 1999). Our ChIP-seq data
show RUNX1/ETO occupancy at JUN and all three members
of the FOS gene family, suggesting also direct regulation (Ptasin-
ska et al., 2014). Therefore, RUNX1/ETO activates CCND2 tran-
scription both directly and indirectly.
Approximately 10%–15% of all t(8;21) AMLs have been found
to harbor CCND2 mutations (Eisfeld et al., 2017; Faber et al.,
2016). All mutations are located within the C-terminal PEST
domain of CCND2, increasing its stability and activity and further
Figure 6. The CDK4/6 Inhibitor Palbociclib Inhibits Growth of RUNX1/E
(A) Dose-response curve for proliferation of SKNO-1 and Kasumi-1 cells treated
(B) Dose-response curve for inhibition of colony formation by palbociclib. Colo
Mean ± SD; n = 3.
(C) Growth curves of t(8;21) cell lines during long-term treatment with palbociclib
(D) Dose-response curve for proliferation of CD34+ cord blood cells expressing
(E) Cell cycle distribution of Kasumi-1 and SKNO-1 cells after 72 hr treatment w
compared with no palbociclib (CV).
(F) Cell cycle distribution as indicated by Pyronin Y and Hoechst33342 staining
***p < 0.001; **p < 0.01 compared with no palbociclib (CV).
(G) Impact of CDK4/6 inhibition on senescence in Kasumi-1 and SKNO-1 cells as
50 nM palbociclib; bottom panel, quantitation of SA-bGAL-positive cell numbers
(H) Immunoblots showing dose-dependent impact of 72 hr palbociclib treatmen
(I) GSEA for correlation between palbociclib, RUNX1/ETO, and CCND2 knockdo
(J) Hallmarks of cancer pathways shared between palbociclib treatment, CCND2
See also Figure S6.
highlighting its relevance for maintaining t(8;21) AML. Impor-
tantly, leukemic cells expressing mutant CCND2 remain sensi-
tive to CDK4/6 inhibitors such as palbociclib (Khanna
et al., 2017).
Similar to previous preclinical studies, we used palbociclib
doses of 100–150 mg/kg in our in vivo experiments (Fry et al.,
2004), which yielded 10-fold higher plasma levels than those
found in breast cancer patients treated with palbociclib (Tamura
et al., 2016). Future experiments will refine the precise palboci-
clib dose that, as single agent or in combination, will inhibit
t(8;21) AML propagation.
In conclusion, we identified CCND2 as a core component of
the RUNX1/ETO-driven AML program. This dependence trans-
lates into a high susceptibility toward CDK4/6 inhibition, which
could be employed in combination with agents targeting sec-
ondarymutational events such as KITN822K, thus offering alterna-
tive therapeutic options. Ongoing research will identify drug
combinations based on synergistic activity with CDK4/6 inhibi-
tors for more precise intervention without occurrence of treat-
ment resistance and long-term side effects.
STAR+METHODS
Detailed methods are provided in the online version of this paper
and include the following:
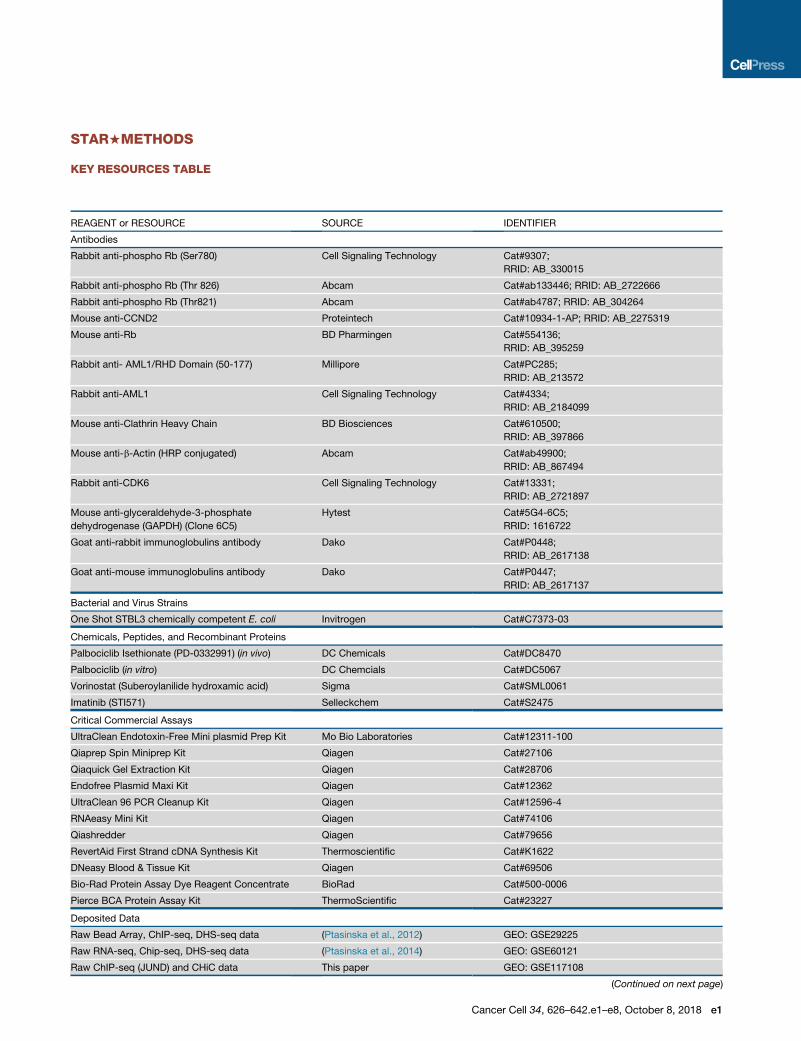
d KEY RESOURCES TABLE
d CONTACT FOR REAGENT AND RESOURCE SHARING
d EXPERIMENTAL MODEL AND SUBJECT DETAILS
TO
for
nies
. M
trun
ith t
of K
ind
. Me
t on
wn
, an
B Cell Lines
B Primary Cultures
B In Vivo Mouse Studies
d METHOD DETAILS
B Chemicals and Reagents
B Knockdown Using siRNA Electroporation
B Drug Treatments
B Lentivirus Production
B Cell Transduction
B RNAI Screen Library
B Mouse Transplantations
B RNAI Screen Sample Collection
B Colony Formation Assays
B Cell Cycle Analysis
-Expressing Leukemic Cells
72 hr with the indicated palbociclib concentrations. Mean ± SD; n = 6.
formed in presence of palbociclib were counted 14 days after seeding.
ean ± SD; n = 3.
cated RUNX1/ETO9a treated with palbociclib for 72 hr. Mean ± SD; n = 3.
he indicated palbociclib doses. Mean ± SD; n = 3. ***p < 0.001; *p < 0.05
asumi-1 and SKNO-1 cells with and without 50 nM palbociclib for 24 hr.
icated by staining for SA-bGAL. Top panels, stained cells after 7 days with
an ± SD; n = 5 technical replicates. Scale bar, 50 mm.
indicated protein levels in Kasumi-1 and SKNO-1 cells.
signatures derived from RNA-seq. NES, normalized enrichment score.
d RUNX1/ETO knockdown. Enriched pathways were identified by GSEA.
Cancer Cell 34, 626–642, October 8, 2018 637

A B C
D E F
G H I
J KL
Figure 7. CDK4/6 Inhibition Impairs Proliferation of Primary AML Cells and Increases Median Survival In Vivo
(A) Impact of palbociclib on proliferation of primary AML blasts. Blasts were co-cultured on MSC feeder layers with and without 300 nM palbociclib for 72 hr.
Mean ± SD; n = 3 for both t(8;21) and non-t(8;21) AML patient samples. *p < 0.05 compared with no palbociclib.
(B) Phase contrast photographs showing primary t(8;21) AML blasts from patient sample LK111 in co-culture with MSCs with and without (CV) palbociclib.
Standard bar, 200 mm.
(C) Proliferation of a t(8;21) AML sample from a relapsed patient on MS-5 feeders upon palbociclib treatment for 72 hr. Mean ± SD; n = 3 technical replicates.
(D and E) Cell cycle distribution (D) and changes in apoptotic subG1 cell fractions (E) of primary AML blasts obtained from two t(8;21) patients (patient samples
LK19 and LK111) on MSC after 96 hr incubation with and without (CV) palbociclib.
(legend continued on next page)
638 Cancer Cell 34, 626–642, October 8, 2018

(F) Clon
culture
palboc
(G) Bio
palboc
(H) Lum
*p < 0.0
(I) Surv
(J) Perc
(K) Surv
the pal
(L) Mod
which c
See als
A
B
C
Figure 8. CDK4/6 Interference Sensitizes AML Cells toward Inhibition of Mutated KIT
(A) Fold change of all KIT shRNA constructs in RNAi screens after third replatings (top) and in vivo engraftment (bottom) in t(8;21) cell lines.
(B) String-generated gene network showing interactions between genes indicated by the in vivo RNAi screen. Nodes represent genes indicated by at least two
shRNAs in combined SKNO-1 and Kasumi-1 screens.
(C) Dose-response curves for proliferation of Kasumi-1 and SKNO-1 cells with palbociclib, imatinib (blue curves), or a combination with a fixed molar ratio of
palboclib:imatinib of 1:10 (red curves). Top and bottom x axes show the corresponding palbociclib and imatinib concentrations. Cell numbers were counted after
72 hr of drug treatment. Mean ± SD; n = 4.
See also Figure S8.
B Apoptosis Assay (Annexin V Staining)
B Senescence Assay (B- Galactosidase Staining)
B Western Blotting and QPCR
B Next Generation Sequencing
B shRNA Competition Assay
B In Vivo Palbociclib Treatment
B CHIC Analysis of Long-Range Promoter Contacts
ogenic growth of three different t(8;21) patient samples after MSC co-culture f
medium (Palbociclib in co-culture) or to both co-culture and semisolid med
iclib. Mean ± SD; n = 3. ***p < 0.001; *p < 0.05 compared with no palbociclib
luminescent images of RG mice transplanted with luciferase-expressing (luc
iclib.
inal flux of bioluminescence for CV (n = 8) or palbociclib-treated animals (n =
5 compared with no palbociclib by one-way ANOVA using a D’Agostino and
ival curve for RG mice transplanted with luc+ Kasumi-1 cells. Significance wa
entage of Kit+ RUNX1/ETO9a (AE9a) GFP+ cells in mice after CV or palbocic
ival curve for Bl6 mice transplanted with KIT+ AE9a GFP+ cells. Significance w
bociclib group due to death unrelated to palbociclib treatment.
el depicting the RUNX1/ETO-promoted G1 cell cycle progression and leuke
an be blocked by either CCND2 knockdown or by pharmacologic inhibition o
o Figure S7.
d QUANTIFICATION AND STATISTICAL ANALYSIS
B Statistical Comparison of Experimental Groups
B Statistical Analysis of SHRNA Representation
B Gene Test and Ranking
B Differential Gene Expression Analysis
B Analysis of Published AML Microarray Datasets
d DATA AND SOFTWARE AVAILABILITY
or 96 hr. Indicated palbociclib concentrations were added either only to co-
ium (Palbociclib in co-culture & CFA). Colony numbers are relative to no
.+) Kasumi-1 cells after 21 days of treatment with control vehicle (CV) or
9). Treatment blocks are indicated at the bottom of the graph. **p < 0.01;
Pearson test; mean ± SEM.
s tested by log rank test.
lib treatment as determined by fluorescence-activated cell sorting (FACS).
as tested by log rank test. n = 5 for both groups with one censored animal in
mic propagation by direct transcriptional activation of CCND2 and CDK6,
f CDK4/6-CCND complexes.
Cancer Cell 34, 626–642, October 8, 2018 639

SUPPLEMENTAL INFORMATION
Supplemental Information includes eight figures and five tables and can be
found with this article online at https://doi.org/10.1016/j.ccell.2018.08.015.
ACKNOWLEDGMENTS
The authors wish to thank Charles Vinson for providing dnFOS cDNA. This
study was supported by Bloodwise grants 12055 and 15005 to O.H., a Chil-
dren with Cancer grant (17–245) to O.H., grants from the North of England Chil-
dren’s Cancer Research Fund to O.H. and J.V., an Aga Khan PhD studentship
to H.I., a University SainsMalaysia PhD studentship to A.I., an NC3R fellowship
and Children’s Cancer and Leukaemia Group grant to D.P., and a CRUK pro-
gram grant C27943/A12788 to J.V. and O.H. Research in C.B.’s and P.N.C.s
lab is funded by a program grant from Bloodwise (15001), an MRC/Leuka Clin-
ical Training Fellowship for S.P., and a CRUK studentship for A. Pickin. The
IVIS Spectrum was funded by grant 087961 from the Wellcome Trust.
AUTHOR CONTRIBUTIONS
Experiments were conceived and designed by O.H., C.B., G.L., and J.V. and
performed by N.M.-S., L.M., J.D., A. Pickin, H.J.B., A. Ptasinska, P.S.C.,
V.F., H.I., A.I., R.T., S.P., P.B., D.M., and M.R. Bioinformatics analyses were
performed by S.N., S.A., and E.L. D.P., A.E., G.J.V., J.M.A., S.N.B., and
C.W. provided essential advice and material. O.H., C.B., L.M., and N.M.-S.
wrote the manuscript with input from C.W., J.D., M.R., S.N., P.N.C., S.N.,
G.J.V., J.V., J.M.A., S.N.B., and G.L.
DECLARATION OF INTERESTS
The authors declare no competing interest.
Received: November 29, 2017
Revised: April 20, 2018
Accepted: August 29, 2018
Published: October 8, 2018
REFERENCES
Anders, S., Pyl, P.T., and Huber, W. (2015). HTSeq–a Python framework to
work with high-throughput sequencing data. Bioinformatics 31, 166–169.
Banker, D.E., Radich, J., Becker, A., Kerkof, K., Norwood, T., Willman, C., and
Appelbaum, F.R. (1998). The t(8;21) translocation is not consistently associ-
ated with high Bcl-2 expression in de novo acute myeloid leukemias of adults.
Clin. Cancer Res. 4, 3051–3062.
Becker, H., Pfeifer, D., Afonso, J.D., Nimer, S.D., Veelken, H., Schwabe, M.,
and Lubbert, M. (2008). Two cell lines of t(8;21) acute myeloid leukemia with
activating KIT exon 17 mutation: models for the ‘second hit’ hypothesis.
Leukemia 22, 1792–1794.
Ben-Porath, I., Thomson, M.W., Carey, V.J., Ge, R., Bell, G.W., Regev, A., and
Weinberg, R.A. (2008). An embryonic stem cell-like gene expression signature
in poorly differentiated aggressive human tumors. Nat. Genet. 40, 499–507.
Benjamini, Y., and Hochberg, Y. (1995). Controlling the false discovery rate:
a practical and powerful approach to multiple testing. J. R. Statist. Soc. B
57, 289–300.
Bomken, S., Buechler, L., Rehe, K., Ponthan, F., Elder, A., Blair, H., Bacon,
C.M., Vormoor, J., and Heidenreich, O. (2013). Lentiviral marking of patient-
derived acute lymphoblastic leukaemic cells allows in vivo tracking of disease
progression. Leukemia 27, 718–721.
Breig, O., Bras, S., Martinez Soria, N., Osman, D., Heidenreich, O., Haenlin, M.,
andWaltzer, L. (2014). Pontin is a critical regulator for AML1-ETO-induced leu-
kemia. Leukemia 28, 1271–1279.
Ciemerych, M.A., Kenney, A.M., Sicinska, E., Kalaszczynska, I., Bronson, R.T.,
Rowitch, D.H., Gardner, H., and Sicinski, P. (2002). Development of mice ex-
pressing a single D-type cyclin. Genes Dev. 16, 3277–3289.
Davis, S., and Meltzer, P.S. (2007). GEOquery: a bridge between the gene
expression omnibus (GEO) and BioConductor. Bioinformatics 23, 1846–1847.
640 Cancer Cell 34, 626–642, October 8, 2018
de Rooij, J.D., Zwaan, C.M., and van den Heuvel-Eibrink, M. (2015). Pediatric
AML: from biology to clinical management. J. Clin. Med. 4, 127–149.
Dobin, A., Davis, C.A., Schlesinger, F., Drenkow, J., Zaleski, C., Jha, S., Batut,
P., Chaisson,M., andGingeras, T.R. (2013). STAR: ultrafast universal RNA-seq
aligner. Bioinformatics 29, 15–21.
Donehower, L.A., Harvey, M., Slagle, B.L., McArthur, M.J., Montgomery, C.A.,
Jr., Butel, J.S., and Bradley, A. (1992). Mice deficient for p53 are developmen-
tally normal but susceptible to spontaneous tumours. Nature 356, 215–221.
Draper, J.E., Sroczynska, P., Tsoulaki, O., Leong, H.S., Fadlullah, M.Z., Miller,
C., Kouskoff, V., and Lacaud, G. (2016). RUNX1B expression is highly hetero-
geneous and distinguishes megakaryocytic and erythroid lineage fate in adult
mouse hematopoiesis. PLoS Genet. 12, e1005814.
Dunne, J., Cullmann, C., Ritter, M., Soria, M.N., Drescher, B., Debernardi, S.,
Skoulakis, S., Hartmann, O., Krause, M., Krauter, J., et al. (2006). siRNA-medi-
ated AML1/MTG8 depletion affects differentiation and proliferation-associ-
ated gene expression in t(8;21)-positive cell lines and primary AML blasts.
Oncogene 25, 6067–6078.
Eisfeld, A.K., Kohlschmidt, J., Schwind, S., Nicolet, D., Blachly, J.S., Orwick,
S., Shah, C., Bainazar, M., Kroll, K.W., Walker, C.J., et al. (2017). Mutations
in the CCND1 and CCND2 genes are frequent events in adult patients with
t(8;21)(q22;q22) acute myeloid leukemia. Leukemia 31, 1278–1285.
Elsasser, A., Franzen, M., Kohlmann, A., Weisser, M., Schnittger, S., Schoch,
C., Reddy, V.A., Burel, S., Zhang, D.E., Ueffing, M., et al. (2003). The fusion
protein AML1-ETO in acute myeloid leukemia with translocation t(8;21) in-
duces c-jun protein expression via the proximal AP-1 site of the c-jun promoter
in an indirect, JNK-dependent manner. Oncogene 22, 5646–5657.
Faber, Z.J., Chen, X., Gedman, A.L., Boggs, K., Cheng, J., Ma, J., Radtke, I.,
Chao, J.R., Walsh, M.P., Song, G., et al. (2016). The genomic landscape of
core-binding factor acute myeloid leukemias. Nat. Genet. 48, 1551–1556.
Frank, R.C., Sun, X., Berguido, F.J., Jakubowiak, A., and Nimer, S.D. (1999).
The t(8;21) fusion protein, AML1/ETO, transforms NIH3T3 cells and activates
AP-1. Oncogene 18, 1701–1710.
Fry, D.W., Harvey, P.J., Keller, P.R., Elliott, W.L., Meade, M., Trachet, E.,
Albassam, M., Zheng, X., Leopold, W.R., Pryer, N.K., and Toogood, P.L.
(2004). Specific inhibition of cyclin-dependent kinase 4/6 by PD 0332991
and associated antitumor activity in human tumor xenografts. Mol. Cancer
Ther. 3, 1427–1438.
Fujita, S., Honma, D., Adachi, N., Araki, K., Takamatsu, E., Katsumoto, T.,
Yamagata, K., Akashi, K., Aoyama, K., Iwama, A., and Kitabayashi, I. (2018).
Dual inhibition of EZH1/2 breaks the quiescence of leukemia stem cells in
acute myeloid leukemia. Leukemia 32, 855–864.
Gautier, L., Cope, L., Bolstad, B.M., and Irizarry, R.A. (2004). affy–analysis of
Affymetrix GeneChip data at the probe level. Bioinformatics 20, 307–315.
Gelmetti, V., Zhang, J., Fanelli, M., Minucci, S., Pelicci, P.G., and Lazar, M.A.
(1998). Aberrant recruitment of the nuclear receptor corepressor-histone de-
acetylase complex by the acute myeloid leukemia fusion partner ETO. Mol.
Cell. Biol. 18, 7185–7191.
Griessinger, E., Anjos-Afonso, F., Pizzitola, I., Rouault-Pierre, K., Vargaftig, J.,
Taussig, D., Gribben, J., Lassailly, F., and Bonnet, D. (2014). A niche-like
culture system allowing the maintenance of primary human acute myeloid leu-
kemia-initiating cells: a new tool to decipher their chemoresistance and self-
renewal mechanisms. Stem Cells Transl. Med. 3, 520–529.
Harbour, J.W., Luo, R.X., Dei Santi, A., Postigo, A.A., and Dean, D.C. (1999).
Cdk phosphorylation triggers sequential intramolecular interactions that pro-
gressively block Rb functions as cells move through G1. Cell 98, 859–869.
Heidenreich, O., Krauter, J., Riehle, H., Hadwiger, P., John, M., Heil, G.,
Vornlocher, H.-P., and Nordheim, A. (2003). AML1/MTG8 oncogene suppres-
sion by small interfering RNAs supports myeloid differentiation of t(8;21)-pos-
itive leukemic cells. Blood 101, 3157–3163.
Ianevski, A., He, L., Aittokallio, T., and Tang, J. (2017). SynergyFinder: a web
application for analyzing drug combination dose-response matrix data.
Bioinformatics 33, 2413–2415.

Irizarry, R.A., Hobbs, B., Collin, F., Beazer-Barclay, Y.D., Antonellis, K.J.,
Scherf, U., and Speed, T.P. (2003). Exploration, normalization, and summaries
of high density oligonucleotide array probe level data. Biostatistics 4, 249–264.
Jaatinen, T., Hemmoranta, H., Hautaniemi, S., Niemi, J., Nicorici, D., Laine, J.,
Yli-Harja, O., and Partanen, J. (2006). Global gene expression profile of human
cord blood-derived CD133+ cells. Stem Cells 24, 631–641.
Khanna, V., Eide, C.A., Tognon, C.E., Maxson, J.E., Wilmot, B., Bottomly, D.,
McWeeney, S., Edwards, V.D., Druker, B.J., and Tyner, J.W. (2017). Recurrent
cyclin D2 mutations in myeloid neoplasms. Leukemia 31, 2005–2008.
Lam, E.W., Glassford, J., Banerji, L., Thomas, N.S., Sicinski, P., and Klaus,
G.G. (2000). Cyclin D3 compensates for loss of cyclin D2 in mouse B-lympho-
cytes activated via the antigen receptor and CD40. J. Biol. Chem. 275,
3479–3484.
Langmead, B., and Salzberg, S.L. (2012). Fast gapped-read alignment with
Bowtie 2. Nat. Methods 9, 357–359.
Larizza, L., Magnani, I., and Beghini, A. (2005). The Kasumi-1 cell line: a t(8;21)-
kit mutant model for acute myeloid leukemia. Leuk. Lymphoma 46, 247–255.
Law, C.W., Chen, Y., Shi, W., and Smyth, G.K. (2014). voom: Precision weights
unlock linear model analysis tools for RNA-seq read counts. Genome Biol.
15, R29.
Li, W., Xu, H., Xiao, T., Cong, L., Love, M.I., Zhang, F., Irizarry, R.A., Liu, J.S.,
Brown, M., and Liu, X.S. (2014). MAGeCK enables robust identification of
essential genes from genome-scale CRISPR/Cas9 knockout screens.
Genome Biol. 15, 554.
Love, M.I., Huber, W., and Anders, S. (2014). Moderated estimation of
fold change and dispersion for RNA-seq data with DESeq2. Genome Biol.
15, 550.
Lutterbach, B., Westendorf, J.J., Linggi, B., Patten, A., Moniwa, M., Davie,
J.R., Huynh, K.D., Bardwell, V.J., Lavinsky, R.M., Rosenfeld, M.G., et al.
(1998). ETO, a target of t(8;21) in acute leukemia, interacts with the N-CoR
and mSin3 corepressors. Mol. Cell. Biol. 18, 7176–7184.
Martens, J.H., Mandoli, A., Simmer, F., Wierenga, B.J., Saeed, S., Singh, A.A.,
Altucci, L., Vellenga, E., and Stunnenberg, H.G. (2012). ERG and FLI1 binding
sites demarcate targets for aberrant epigenetic regulation by AML1-ETO in
acute myeloid leukemia. Blood 120, 4038–4048.
Martinez, N., Drescher, B., Riehle, H., Cullmann, C., Vornlocher, H.P., Ganser,
A., Heil, G., Nordheim, A., Krauter, J., and Heidenreich, O. (2004). The onco-
genic fusion protein RUNX1-CBFA2T1 supports proliferation and inhibits
senescence in t(8;21)-positive leukaemic cells. BMC Cancer 4, 44.
Martinez Soria, N., Tussiwand, R., Ziegler, P., Manz,M.G., and Heidenreich, O.
(2009). Transient depletion of RUNX1/RUNX1T1 by RNA interference delays
tumour formation in vivo. Leukemia 23, 188–190.
Mathas, S., Hinz, M., Anagnostopoulos, I., Krappmann, D., Lietz, A., Jundt, F.,
Bommert, K., Mechta-Grigoriou, F., Stein, H., Dorken, B., and Scheidereit, C.
(2002). Aberrantly expressed c-Jun and JunB are a hallmark of Hodgkin
lymphoma cells, stimulate proliferation and synergize with NF-kappa B.
EMBO J. 21, 4104–4113.
Matozaki, S., Nakagawa, T., Kawaguchi, R., Aozaki, R., Tsutsumi, M.,
Murayama, T., Koizumi, T., Nishimura, R., Isobe, T., and Chihara, K. (1995).
Establishment of a myeloid leukaemic cell line (SKNO-1) from a patient with
t(8;21) who acquired monosomy 17 during disease progression. Br. J.
Haematol. 89, 805–811.
Matsushime, H., Ewen, M.E., Strom, D.K., Kato, J.Y., Hanks, S.K., Roussel,
M.F., and Sherr, C.J. (1992). Identification and properties of an atypical cata-
lytic subunit (p34PSK-J3/cdk4) for mammalian D type G1 cyclins. Cell 71,
323–334.
Meyerson, M., and Harlow, E. (1994). Identification of G1 kinase activity for
cdk6, a novel cyclin D partner. Mol. Cell. Biol. 14, 2077–2086.
Mifsud, B., Tavares-Cadete, F., Young, A.N., Sugar, R., Schoenfelder, S.,
Ferreira, L., Wingett, S.W., Andrews, S., Grey, W., Ewels, P.A., et al. (2015).
Mapping long-range promoter contacts in human cells with high-resolution
capture Hi-C. Nat. Genet. 47, 598–606.
Miyoshi, H., Kozu, T., Shimizu, K., Enomoto, K., Maseki, N., Kaneko, Y.,
Kamada, N., and Ohki, M. (1993). The t(8;21) translocation in acute myeloid
leukemia results in production of an AML1-MTG8 fusion transcript. EMBO J.
12, 2715–2721.
Muller, F.J., Laurent, L.C., Kostka, D., Ulitsky, I., Williams, R., Lu, C., Park, I.H.,
Rao, M.S., Shamir, R., Schwartz, P.H., et al. (2008). Regulatory networks
define phenotypic classes of human stem cell lines. Nature 455, 401–405.
Okumura, A.J., Peterson, L.F., Okumura, F., Boyapati, A., and Zhang, D.E.
(2008). t (8; 21)(q22; q22) Fusion proteins preferentially bind to duplicated
AML1/RUNX1 DNA-binding sequences to differentially regulate gene expres-
sion. Blood 112, 1392–1401.
Olive, M., Krylov, D., Echlin, D.R., Gardner, K., Taparowsky, E., and Vinson, C.
(1997). A dominant negative to activation protein-1 (AP1) that abolishes DNA
binding and inhibits oncogenesis. J. Biol. Chem. 272, 18586–18594.
Osman, D., Gobert, V., Ponthan, F., Heidenreich, O., Haenlin, M., and Waltzer,
L. (2009). A Drosophila model identifies calpains as modulators of the human
leukemogenic fusion protein AML1-ETO. Proc. Natl. Acad. Sci. USA 106,
12043–12048.
Pal, D., Blair, H.J., Elder, A., Dormon, K., Rennie, K.J., Coleman, D.J.L.,
Weiland, J., Rankin, K.S., Filby, A., Heidenreich, O., and Vormoor, J. (2016).
Long-term in vitro maintenance of clonal abundance and leukaemia-initiating
potential in acute lymphoblastic leukaemia. Leukemia 30, 1691–1700.
Placke, T., Faber, K., Nonami, A., Putwain, S.L., Salih, H.R., Heidel, F.H.,
Kramer, A., Root, D.E., Barbie, D.A., Krivtsov, A.V., et al. (2014).
Requirement for CDK6 in MLL-rearranged acute myeloid leukemia. Blood
124, 13–23.
Ptasinska, A., Assi, S.A., Mannari, D., James, S.R., Williamson, D., Dunne, J.,
Hoogenkamp, M., Wu, M., Care, M., McNeill, H., et al. (2012). Depletion of
RUNX1/ETO in t(8;21) AML cells leads to genome-wide changes in chromatin
structure and transcription factor binding. Leukemia 26, 1829–1841.
Ptasinska, A., Assi, S.A., Martinez-Soria, N., Imperato, M.R., Piper, J., Cauchy,
P., Pickin, A., James, S.R., Hoogenkamp, M., Williamson, D., et al. (2014).
Identification of a dynamic core transcriptional network in t(8;21) AML that reg-
ulates differentiation block and self-renewal. Cell Rep. 8, 1974–1988.
Risso, D., Ngai, J., Speed, T.P., and Dudoit, S. (2014). Normalization of RNA-
seq data using factor analysis of control genes or samples. Nat. Biotechnol.
32, 896–902.
Ritchie, M.E., Phipson, B., Wu, D., Hu, Y., Law, C.W., Shi, W., and Smyth, G.K.
(2015). limma powers differential expression analyses for RNA-sequencing
and microarray studies. Nucleic Acids Res. 43, e47.
Robinson, M.D., McCarthy, D.J., and Smyth, G.K. (2010). edgeR: a
Bioconductor package for differential expression analysis of digital gene
expression data. Bioinformatics 26, 139–140.
Rossi, F., Ehlers, I., Agosti, V., Socci, N.D., Viale, A., Sommer, G., Yozgat, Y.,
Manova, K., Antonescu, C.R., and Besmer, P. (2006). Oncogenic Kit signaling
and therapeutic intervention in a mouse model of gastrointestinal stromal tu-
mor. Proc. Natl. Acad. Sci. USA 103, 12843–12848.
Schwarzer, A., Emmrich, S., Schmidt, F., Beck, D., Ng, M., Reimer, C., Adams,
F.F., Grasedieck, S., Witte, D., Kabler, S., et al. (2017). The non-coding RNA
landscape of human hematopoiesis and leukemia. Nat. Commun. 8, 218.
Serve, H., Yee, N.S., Stella, G., Sepp-Lorenzino, L., Tan, J.C., and Besmer, P.
(1995). Differential roles of PI3-kinase and Kit tyrosine 821 in Kit receptor-
mediated proliferation, survival and cell adhesion in mast cells. EMBO J. 14,
473–483.
Setoguchi, R., Tachibana, M., Naoe, Y., Muroi, S., Akiyama, K., Tezuka, C.,
Okuda, T., and Taniuchi, I. (2008). Repression of the transcription factor Th-
POK by Runx complexes in cytotoxic T cell development. Science 319,
822–825.
Subramanian, A., Tamayo, P., Mootha, V.K., Mukherjee, S., Ebert, B.L.,
Gillette, M.A., Paulovich, A., Pomeroy, S.L., Golub, T.R., Lander, E.S., and
Mesirov, J.P. (2005). Gene set enrichment analysis: a knowledge-based
approach for interpreting genome-wide expression profiles. Proc. Natl.
Acad. Sci. USA 102, 15545–15550.
Tamura, K., Mukai, H., Naito, Y., Yonemori, K., Kodaira, M., Tanabe, Y.,
Yamamoto, N., Osera, S., Sasaki, M., Mori, Y., et al. (2016). Phase I study of
Cancer Cell 34, 626–642, October 8, 2018 641

palbociclib, a cyclin-dependent kinase 4/6 inhibitor, in Japanese patients.
Cancer Sci. 107, 755–763.
Tonks, A., Pearn, L., Musson, M., Gilkes, A., Mills, K.I., Burnett, A.K., and
Darley, R.L. (2007). Transcriptional dysregulation mediated by RUNX1-
RUNX1T1 in normal human progenitor cells and in acute myeloid leukaemia.
Leukemia 21, 2495–2505.
Uras, I.Z., Walter, G.J., Scheicher, R., Bellutti, F., Prchal-Murphy, M., Tigan,
A.S., Valent, P., Heidel, F.H., Kubicek, S., Scholl, C., et al. (2016).
Palbociclib treatment of FLT3-ITD+ AML cells uncovers a kinase-dependent
transcriptional regulation of FLT3 and PIM1 by CDK6. Blood 127, 2890–2902.
van der Linden, M.H., Seslija, L., Schneider, P., Driessen, E.M., Castro, P.G.,
Stumpel, D.J., van Roon, E., de Boer, J., Williams, O., Pieters, R., and Stam,
R.W. (2015). Identification of genes transcriptionally responsive to the loss of
MLL fusions in MLL-rearranged acute lymphoblastic leukemia. PLoS One
10, e0120326.
Wang, L., Gural, A., Sun, X.J., Zhao, X., Perna, F., Huang, G., Hatlen, M.A., Vu,
L., Liu, F., Xu, H., et al. (2011). The leukemogenicity of AML1-ETO is dependent
on site-specific lysine acetylation. Science 333, 765–769.
Wang, Y.Y., Zhou, G.B., Yin, T., Chen, B., Shi, J.Y., Liang, W.X., Jin, X.L., You,
J.H., Yang, G., Shen, Z.X., et al. (2005). AML1-ETO and C-KIT mutation/over-
642 Cancer Cell 34, 626–642, October 8, 2018
expression in t(8;21) leukemia: implication in stepwise leukemogenesis and
response to Gleevec. Proc. Natl. Acad. Sci. USA 102, 1104–1109.
Wichmann, C., Quagliano-Lo Coco, I., Yildiz, O., Chen-Wichmann, L., Weber,
H., Syzonenko, T., Doring, C., Brendel, C., Ponnusamy, K., Kinner, A., et al.
(2015). Activating c-KIT mutations confer oncogenic cooperativity and rescue
RUNX1/ETO-induced DNA damage and apoptosis in human primary CD34+
hematopoietic progenitors. Leukemia 29, 279–289.
Xiong, Y., Zhang, H., and Beach, D. (1992). D type cyclins associate with mul-
tiple protein kinases and the DNA replication and repair factor PCNA. Cell 71,
505–514.
Yan, M., Kanbe, E., Peterson, L.F., Boyapati, A., Miao, Y., Wang, Y., Chen,
I.M., Chen, Z., Rowley, J.D., Willman, C.L., and Zhang, D.E. (2006). A previ-
ously unidentified alternatively spliced isoform of t(8;21) transcript promotes
leukemogenesis. Nat. Med. 12, 945–949.
Zuber, J., Radtke, I., Pardee, T.S., Zhao, Z., Rappaport, A.R., Luo, W.,
McCurrach, M.E., Yang, M.M., Dolan, M.E., Kogan, S.C., et al. (2009).
Mouse models of human AML accurately predict chemotherapy response.
Genes Dev. 23, 877–889.
STAR+METHODS
KEY RESOURCES TABLE
REAGENT or RESOURCE SOURCE IDENTIFIER
Antibodies
Rabbit anti-phospho Rb (Ser780) Cell Signaling Technology Cat#9307;
RRID: AB_330015
Rabbit anti-phospho Rb (Thr 826) Abcam Cat#ab133446; RRID: AB_2722666
Rabbit anti-phospho Rb (Thr821) Abcam Cat#ab4787; RRID: AB_304264
Mouse anti-CCND2 Proteintech Cat#10934-1-AP; RRID: AB_2275319
Mouse anti-Rb BD Pharmingen Cat#554136;
RRID: AB_395259
Rabbit anti- AML1/RHD Domain (50-177) Millipore Cat#PC285;
RRID: AB_213572
Rabbit anti-AML1 Cell Signaling Technology Cat#4334;
RRID: AB_2184099
Mouse anti-Clathrin Heavy Chain BD Biosciences Cat#610500;
RRID: AB_397866
Mouse anti-b-Actin (HRP conjugated) Abcam Cat#ab49900;
RRID: AB_867494
Rabbit anti-CDK6 Cell Signaling Technology Cat#13331;
RRID: AB_2721897
Mouse anti-glyceraldehyde-3-phosphate
dehydrogenase (GAPDH) (Clone 6C5)
Hytest Cat#5G4-6C5;
RRID: 1616722
Goat anti-rabbit immunoglobulins antibody Dako Cat#P0448;
RRID: AB_2617138
Goat anti-mouse immunoglobulins antibody Dako Cat#P0447;
RRID: AB_2617137
Bacterial and Virus Strains
One Shot STBL3 chemically competent E. coli Invitrogen Cat#C7373-03
Chemicals, Peptides, and Recombinant Proteins
Palbociclib Isethionate (PD-0332991) (in vivo) DC Chemicals Cat#DC8470
Palbociclib (in vitro) DC Chemcials Cat#DC5067
Vorinostat (Suberoylanilide hydroxamic acid) Sigma Cat#SML0061
Imatinib (STI571) Selleckchem Cat#S2475
Critical Commercial Assays
UltraClean Endotoxin-Free Mini plasmid Prep Kit Mo Bio Laboratories Cat#12311-100
Qiaprep Spin Miniprep Kit Qiagen Cat#27106
Qiaquick Gel Extraction Kit Qiagen Cat#28706
Endofree Plasmid Maxi Kit Qiagen Cat#12362
UltraClean 96 PCR Cleanup Kit Qiagen Cat#12596-4
RNAeasy Mini Kit Qiagen Cat#74106
Qiashredder Qiagen Cat#79656
RevertAid First Strand cDNA Synthesis Kit Thermoscientific Cat#K1622
DNeasy Blood & Tissue Kit Qiagen Cat#69506
Bio-Rad Protein Assay Dye Reagent Concentrate BioRad Cat#500-0006
Pierce BCA Protein Assay Kit ThermoScientific Cat#23227
Deposited Data
Raw Bead Array, ChIP-seq, DHS-seq data (Ptasinska et al., 2012) GEO: GSE29225
Raw RNA-seq, Chip-seq, DHS-seq data (Ptasinska et al., 2014) GEO: GSE60121
Raw ChIP-seq (JUND) and CHiC data This paper GEO: GSE117108
(Continued on next page)
Cancer Cell 34, 626–642.e1–e8, October 8, 2018 e1

Continued
REAGENT or RESOURCE SOURCE IDENTIFIER
Experimental Models: Cell Lines
Kasumi-1 DSMZ RRID: CVCL_0589
Cat#ACC 220
Kasumi-1 pSLIEW In house (Bomken et al., 2013) N/A
SKNO-1 DSMZ Cat#ACC 690; RRID: CVCL_2196
SKNO-1 pSLIEW In house (Bomken et al., 2013) N/A
HL-60 DSMZ Cat#ACC 3; RRID: CVCL_0002
AML-3 DSMZ Cat#ACC 582; RRID: CVCL_1844
Cat#ACC 582
THP-1 DSMZ Cat #ACC 16; RRID: CVCL_0006
MV4-11 DSMZ Cat#ACC 102; RRID: CVCL_0064
HEK293T DSMZ Cat#ACC 305; RRID: CVCL_0063
Human bone marrow-derived mesenchymal
stromal cells (MSC)
In house (Pal et al., 2016) N/A
MS-5 DSMZ Cat# ACC-441; RRID: CVCL_2128
Human peripheral blood CD34+ RUNX1/ETO+
KIT N822K HSPCs
Wichmann et al., 2015 N/A
AML patient samples, see Table S4 N/A N/A
Experimental Models: Organisms/Strains
NOD.Cg-Prkdcscid Il2rgtm1Wjl/SzJ (NSG) mice Jackson Laboratory N/A
Rag2�/�Il2rg�/�1293Balb/c (RG) mice Jackson Laboratory N/A
C57BL/6 AML1-ETO9a-IRES-GFP::rtTA mice In house (Draper et al., 2016) N/A
C57BL/6 Trp53+/- mice In house (Donehower et al., 1992) N/A
C57BL/6 AML1-ETO9a-IRES-GFP+::rtTA+::
Trp53+/- mice
In house (Draper et al., 2016) N/A
C57BL/6 mice Envigo N/A
Oligonucleotides
siRE (sense, 5’-CCU CGA AAU CGU ACU GAG
AAG-3’, antisense, 5’ UCU CAG UAC GAU UUC
GAG GUU-3’),
In house (Heidenreich et al., 2003) N/A
siMM (sense, 5’-CCU CGA AUU CGU UCU GAG
AAG-3’; antisense, 5’-UCU CAG AAC GAA UUC
GAG GUU-3’),
In house (Heidenreich et al., 2003) N/A
CCND2 siRNA Qiagen Hs_CCND2_2 FlexiTube SI00027839 and
Hs_CCND2_4 FlexiTube SI00027853
CCND1 siRNA Qiagen (Hs_CCND1_3 FlexiTube SI00147826)
Decode Indexing PCR and Sequencing Primer Kit Dharmacon #RHS5339
Sequences upon request from Company
qPCR primer sequences, see Table S5 N/A N/A
Recombinant DNA
pSLIEW vector In house (Bomken et al., 2013) N/A
pCMVD8.91 packaging vector Life Science Market Cat# PVT2323
pMD2.G envelope vector Addgene Cat#12259
pTRIPZ lentiviral vector Dharmacon (ThermoScientific) Cat#RHS4750
pLKO5d.SFFV.miRNA30n Addgene Cat#90333
pCW57.1-dnFOS In house N/A
Software and Algorithms
Bowtie2 Langmead and Salzberg, 2012 http://bowtie-bio.sourceforge.net/bowtie2/
index.shtml
EdgeR Robinson et al., 2010 http://bioconductor.org/packages/edgeR
(Continued on next page)
e2 Cancer Cell 34, 626–642.e1–e8, October 8, 2018

Continued
REAGENT or RESOURCE SOURCE IDENTIFIER
Limma/Voom Law et al., 2014 http://bioconductor.org/packages/limma
RUVSeq Risso et al., 2014 http://bioconductor.org/packages/RUVSeq
STAR Dobin et al., 2013 https://github.com/alexdobin/STAR
HTseq Anders et al., 2015 https://github.com/simon-anders/htseq
DESeq2 Love et al., 2014 http://bioconductor.org/packages/DESeq2
MAGeCK Li et al., 2014 https://sourceforge.net/projects/mageck/
GEOquery Davis and Meltzer, 2007 http://bioconductor.org/packages/GEOquery
affy Irizarry et al., 2003 http://bioconductor.org/packages/affy
ggplot2 CRAN https://CRAN.R-project.org/package=ggplot2
GSEA Subramanian et al., 2005 http://software.broadinstitute.org/gsea
SynergyFinder Ianevski et al., 2017 https://synergyfinder.fimm.fi
CONTACT FOR REAGENT AND RESOURCE SHARING
Further information and requests for reagents and resources should be directed to and will be fulfilled by the lead contact Olaf Hei-
denreich ([email protected]).
EXPERIMENTAL MODEL AND SUBJECT DETAILS
Cell LinesKasumi-1 (RRID: CVCL_0589; male), SKNO-1 (RRID: CVCL_2196; male). Kasumi-1 C28 and SKNO-1 C10 are subclones of Kasumi-1
and SKNO-1 respectively and contain the pSLIEW vector allowing cells to express firefly luciferase and eGFP (Bomken et al., 2013).
Cells were maintained in RPMI1640 medium supplemented with 10% or 20% FBS respectively, the latter also supplemented with
GM-CSF (7ng/ml)] at 37�C in a humidified 5% CO2 incubator. Neither Kasumi-1 nor SKNO-1 contain CCND2 mutations according
to CCLE (https://portals.broadinstitute.org/ccle) and COSMIC (http://cancer.sanger.ac.uk/cell_lines) databases.
Human peripheral blood CD34+ RUNX1/ETO+ KIT N822K HSPCs (Wichmann et al., 2015) were cultured in IMDM supplemented
with 20% FBS, 2% Glutamine, 1% Penicillin/Streptomycin and the following human cytokines at the indicated final concentrations:
IL3 (10 ng/ml), IL6 (20 ng/ml), FLT3L (20 ng/ml), GM-CSF (7 ng/ml), SCF (20 ng/ml) and TPO (20 ng/ml) 37�C in a humidified 5% CO2
incubator.
HL-60 (RRID: CVCL_0002; female), AML-3 (RRID: CVCL_1844; male), THP-1 (RRID: CVCL_0006; male), and MV4-11 (RRID:
CVCL_0064; male) were maintained in RPMI1640 medium supplemented with 20% FBS at 37�C in a humidified 5% CO2 incubator.
For shRNA knockdown cells, the culture medium was additionally supplemented with 2 mg/ml puromycin.
Human bonemarrow-derivedmesenchymal stromal cells (MSC) were isolated as described previously (Pal et al., 2016). MSCwere
maintained in DMEM supplemented with 20% FBS, 1% Penicillin/Streptomycin, 1% Glutamine, FGF-1 (8 ng/ml). MS-5 (RRID:
CVCL_2128, murine) were maintained in a-MEM supplemented with 10% FBS.
HEK293T cells (RRID: CVCL_0063; female) for lentivirus production were maintained in HEPES-modified DMEM medium supple-
mented with 10% FBS, 4mM L-glutamine and 1mM sodium pyruvate, incubated as above.
Identity of cell lines was confirmed by short tandem repeat profiling by NewGene Ltd (Newcastle University, UK). Cell lines were
confirmed free from mycoplasma infection at regular intervals using a MycoAlert kit (Lonza, Slough, UK).
Primary CulturesPatient-derived AML blasts were obtained from the Newcastle Haematology Biobank (REC reference number 07/H0906/109+5) and
were cultivated on MSC or MS-5 layers in SFEMII supplemented with StemSpan� Myeloid Expansion Supplement, IL3 (10 ng/ml),
FLT3L (20 ng/ml), 20% FBS and 1%glutamine or Myelocult H5100 supplemented with StemSpan�Myeloid Expansion Supplement,
Hydrocortisone, IL3, FLT3L and glutamine. Patient details are given in Table S4.
In Vivo Mouse StudiesMice for the RNAi screen and those for the intrahepatic in vivo palbociclib treatment model were housed in the Comparative Biology
Centre (Newcastle University) under specific pathogen free conditions. All experimental manipulations were performed under sterile
conditions in a laminar flow hood, except imaging. All work was approved and conductedn accordance with Home Office Project
Licences PPL60/4552 andPPL60/4222 by researchers who had completed approvedHomeOffice training and held current Personal
Licences under the Animals (Scientific Procedures) Act 1986. Mouse studies were approved and conducted at Newcastle University
Cancer Cell 34, 626–642.e1–e8, October 8, 2018 e3

andUniversity ofManchester following Institutional ethical review (AWERB) and in accordancewith theUKHomeOffice Animals (Sci-
entific Procedures) Act 1986. Group sizes were chosen according to pilot experiments andmale and female mice randomly assigned
into those groups
NOD.Cg-Prkdcscid Il2rgtm1Wjl/SzJ (NSG) mice (male and female) aged between 10 and 15 weeks at study commencement were
used for the intra-femoral RNAi screen in vivo model. Dependent on cell line injected (Kasumi-1 or SKNO-1), mice were randomly
assigned to 2 treatment groups: 13-14 mice fed a doxycycline-free diet and 6-7 mice fed a Doxycycline diet. After 4 weeks, the
Doxycycline-free group was further randomly divided into 2 groups of 6-7 mice: a Doxycycline free-group and ‘‘Doxycycline after
engraftment’’ (dox delayed) group.
Rag2�/�Il2rg�/�1293Balb/c (RG) mice (male and female) aged 1-4 days at study commencement were used for the intrahepatic
in vivo palbociclib treatment model. They were then randomly assigned to 2 treatment groups (5-6mice per group) prior to treatment.
Male and female mice aged between 10 and 15 weeks at study commencement were used for intravenous transplantation.
For both study models, mice were humanely killed when they displayed end points as specified by the licenses. For example when
tumours reached 1.5 cm in diameter, if they lost >10% weight compared to controls for 3 consecutive days or 20% at any time, or
they displayed signs of ill health.
The AML1-ETO9a-IRES-GFP::rtTAmouse line has been described previously (Draper et al., 2016). These mice were crossed with
the previously described C57BL/6 Trp53+/- (Donehower et al., 1992) generating AML1-ETO9a-IRES-GFP+::rtTA+::Tp53+/- mice.
We utilized a Tp53 heterozygous background as p53 loss accelerates AML1-ETO9a-mediated AML (Zuber et al., 2009). Male and
female mice were intravenously transplanted at an age of 12 weeks.
C57BL/6 mice (male and female) were used for secondary transplantations at an age of 12 weeks.
METHOD DETAILS
Chemicals and ReagentsThe following antibodies were used for western blot analysis: beta-Actin, ab49900 (Abcam); CDK6, D4S8S (Cell Signalling); Clathrin
(C28, BD Biosciences); Cyclin D2, 10934-1-AP (Proteintech); Phospho-Rb (Ser780), 9307 (Cell Signalling); Phospho-Rb (Thr821),
ab4787(Abcam); Rb, 554136 (BD Pharmingen); RUNX1/ETO, PC285 (Merck Millipore).
Growth factors and media were obtained from StemCell Technologies, Sigma- Aldrich, Gibco and R&D Systems. Palbociclib was
purchased from DC Chemicals (Shanghai, China).
dnFOS was amplifided from cDNA provided by Charles Vinson (Olive et al., 1997) with SalI and NotI restriction site overhangs. Us-
ing these restriction sites, the fragment was ligated into pENTR2B (Addgene) and then recombined into pCW57.1 (Addgene).
Knockdown Using siRNA ElectroporationKasumi-1 and SKNO-1 cells were transfected with the indicated siRNA concentrations using a Fischer EPI 3500 electroporator as
described previously (Martinez et al., 2004). siRNA was added to final concentration of 100-500 nM to 100-750 ml of cell suspension
(107 cells/ml) in standard medium into a 0.4 cm electroporation cuvette. Electroporation was performed at 330 V (Kasumi-1) or 350 V
(all other cell lines) for 10 ms. After 15 min at room temperature, cells were diluted and cultured under standard conditions. The
following siRNAs were used: RUNX1/ETO siRNA siRE, mismatch control siMM, CCND2 siRNAs siCCND2-2 and siCCND2-4 and
CCND1 siRNA siCCND1-3.
Drug TreatmentsIf not otherwise indicated, palbociclib (DC Chemicals, Shanghai) was used at various concentrations for 72 h before counting using
Trypan Blue solution (0.4%) to count cell number. Patient-derived AML blasts were treated with palbociclib for 96 hr. Vorinostat (Sub-
eroylanilide hydroxamic acid, Sigma Aldrich) was used at 1 mM for 24 h. Combination treatments included the use of palbociclib with
imatinib (Sigma) at various concentrations for 72 h before counting cell number using Trypan Blue solution (0.4%) or assessed via
luciferase assay normalised to known cell numbers. The GI50 is defined as the concentration required for 50% of maximal inhibition
of cell proliferation. Synergy scores were calculated using SynergyFinder (Ianevski et al., 2017).
Lentivirus ProductionLentivirus were produced in 293T cells by co-transfection with a second generation lentiviral vector, an envelope plasmid pMD2.G
and a packaging plasmid pCMVDR8.91. The day before co-transfection, cells were seed at a density of 2-3 3 105 cells/ml on a
100-mm tissue culture dish. The day of co-transfection 5 mg of pMD2.G, 15 mg of pCMVR8.91 and 20 mg the lentiviral vector were
mixed and brought to a final volume of 250 ml with special water (2.5 mM HEPES containing deionized water at pH7.3). After adding
250 ml of 0.5 M CaCl2 solution, this mix was added dropwise, slowly on 500 ml of 23 HeBS (0.28 M NaCl, 0.05 M HEPES and 1.5 mM
Na2HPO4 in deionized water at pH 7.0), while mixing by air bubbling. The mix is left to incubate for 30-40 min at RT before adding it
slowly, dropwise on the cell monolayer. After 24 h, cells were gently washed once with 10 ml prewarmed PBS, and 10 ml of fresh
complete media was added. Cells were incubated at 37�C in a humidified atmosphere with 5% CO2 for the next 3 days. Lentivirus
was collected by centrifuging the cell culture medium supernatant at 3000 rpm of 15 min at 4�C. The supernatant was subsequently
filtered through Acrodisc� Syringe 0.45 filters and stored in aliquots at -80�C.
e4 Cancer Cell 34, 626–642.e1–e8, October 8, 2018

Cell TransductionAfter adding polybrene to a starting dilution of cells at a 106 cells/ml to a final concentration of 8 mg/ml, cells were seeded onto a cell
culture plate. Virus containing supernatant was added to the cell suspension and the plate was centrifuged at 34�C for 50 min at
900xg. After centrifugation, cells were incubated overnight. On the next day the supernatant was removed and cells were diluted
1:2 in complete media. dnFOS transduced cells were puromycin selected for 5 days followed by single cell sorting on a FACS
Aria II to grow up individual clones.
RNAI Screen LibraryA customized shRNA library was purchased from Thermo Scientific. shRNAmir constructs that were unavailable as pTRIPZ con-
structs were cloned frompGIPZ to pTRIPZ as indicated by the provider (ThermoScientific OpenBiosystems Expression Arrest TRIPZ
Lentiviral shRNAmir technical manual) with the exceptions of using Qiaprep Spin Miniprep Kit, Qiaquick Gel, Endofree Plasmid Maxi
Kit and Qiaquick Gel Extraction Kit for the cloning stages and UltraClean Endotoxin-Free Mini plasmid Prep Kit to provide endotoxin
free DNA plasmids. One Shot STBL3 chemically competent E. coli were used for vector over-expression. The complete shRNA
construct library can be found in Table S1. The screen lentiviral library provided 1000-fold coverage for each construct in both
Kasumi-1 cells and SKNO-1 cells engineered to express GFP and Luciferase (Bomken et al., 2013). shNTC virus was added to
the screen library lentivirus therefore making up 14% of the screen lentiviral pool. shRE containing cells were added to shRNA library
containing cells to ensure equal coverage of shRE to other library shRNA in the screen (each construct covers 0.2% of the library.
shNTC covers 14% of the library). For a more than 1,000-fold coverage, 107 Kasumi-1 or SKNO-1 cells were transduced at an
MOI of 0.3 and subsequently selected with puromycin (2 mg/ml) in the absence of doxycycline, i.e. without inducing shRNA expres-
sion prior to colony formation and xenotransplantation experiments. Cells were treated in the absence and presence of doxycycline
for 3 days under continuous puromycin selection and subsequently put into culture, colony formation experiments (see Colony For-
mation Assays section) and xenotransplantation (see below).
Mouse TransplantationsFor the RNAi screen, SKNO-1 or Kasumi-1 were intrafemorally injected into NOD.Cg-Prkdcscid Il2rgtm1Wjl/SzJ (NSG) mice at a total
cell number of 5x10⁵ and 1x10⁵, respectively (for mouse group details see in vivomouse studies section above). We originally applied
three different doxycycline schedules for inducing shRNA expression with one untreated control group (Kasumi-1: n=5; SKNO-1:
n=2; no dox), one group being treated with doxycycline starting with the time point of transplantation (Kasumi-1: n=5; SKNO-1:
n=3; dox) and one group with doxycycline treatment initiated 28 days after transplantation to avoid interference with homing
((Kasumi-1: n=3; dox delayed). However, PCA of shRNA pool compositions showed a clear separation of the latter two groups
and the control group, but the two different doxycycline schemes did not cause a further segregation (Figure 1D). Therefore, we com-
bined all doxycycline-treated animals into one group for further analyses. Leukemic cell propagation and location was tracked by
bioluminescence using the IVIS Imaging System (Caliper). Expression of shRNA in all tumour samples was indicated by co-expres-
sion of RFP and observed on the FACS Calibur.
For primary mouse AML1-ETO9a (AE9a) transplantations, NOD.Cg-Prkdcscid Il2rgtm1Wjl/SzJ (NSG) mice (bred from a colony sup-
plied by the Jackson Laboratory) were fed Low-Phytoestrogen irradiated complete feed supplemented with 545 mg/kg (625 ppm)
doxycycline hyclate (ssniff Spezialdi€aten GmbH), commencing from seven days prior to transplantation. In addition, they were sup-
plied with drinking water supplemented with 0.16% neomycin sulfate (ThermoFisher Scientific) for a total of sixteen days,
commencing from three days prior to transplantation. On day 0, the mice were conditioned with sublethal full-body irradiation
(1.25 Gy) and injected with 2x10⁶ AE9a-IRES-GFP+::rtTA+::Tp53+/- bone marrow cells (post-Ammoniun-Chloride-Potassium
(ACK) buffer lysis). Spleen cells were harvested from primary recipient mice displaying a leukaemic phenotype (approximately
20 weeks post transplantation).
For secondary mouse AE9a transplantations, we chose C57 Bl/6 mice as the immunologically more relevant therapeutic model
compared to NSG mice. C57BL/6 mice (supplied by Envigo) were fed doxycycline hyclate-supplemented complete feed and
neomycin sulfate-supplemented drinking water as above. On day 0, the mice were conditioned with sublethal full-body irradiation
(two doses of 3.5 Gy each, three hr apart) and then injected with 2x10⁶ AE9a-IRES-GFP-expressing spleen cells.
RNAI Screen Sample CollectionSamples of cells were taken throughout both screens. For the in vivo screens, leg and abdominal tumours formed by t(8;21) cells,
were harvested from humanely killed mice. DNA was extracted using a DNeasy Blood & Tissue Kit (Qiagen). PCR was performed
on each sample using the Decode Indexing PCR and Sequencing Primer Kit (Dharmacon), with 36 further bespoke reverse primers.
The forward primer was adapted for sequencing the pTRIPZ vector (AAT GAT ACG GCG ACC ACC GAG ATC TAC ACG TGA TGC
AGA AGA AAA CAC G). Amplicons were electrophoresed on an agarose gel, bands cut out and cleaned up using the Qiagen PCR
clean-up kit. Samples were pooled into groups of 48 samples and sent for Illumina MiSeq 50bp single end (SE) sequencing and later
Illumina HiSeq 50bp SE sequencing.
Cancer Cell 34, 626–642.e1–e8, October 8, 2018 e5

Colony Formation AssaysCells were seeded in Methylcellulose media (0.56% (w/v) in complete media containing 20% FBS) at a density of 5,000 cells/ml on a
24 well plate (2500 cells per well), and incubated 10-14 days until colonies grew to over 25 cells/colony before counting. RNAi screen
cells (4x10⁶ cells/group) were similarly diluted onto 10 cm tissue culture plates.
Cell Cycle AnalysisApproximately 106 cells were resuspended in 200 ml of citrate buffer (0.25 M Sucrose, 40 mM Sodium citrate pH 7.6). After that, 2 ml
100 mg/ml RNase A was added followed by 800 ml of staining solution (20 mg/ml propidium iodide, 0.5%NP40, 0.5 mM EDTA in PBS
at pH 7.2). Cells were acquired on FACS Calibur in the FL2-H channel. Data were subsequently analysed using FlowJo software.
Apoptosis Assay (Annexin V Staining)Cells were washed twice with cold PBS and resuspended in 13 binding buffer (10X: 0.1 MHepes (pH 7.4), 1.4 MNaCl, 25 mMCaCl2)
at a concentration of 13 106 cells/ml. After transfer of 100 ml of the cell suspension (105 cells) to a 5ml culture tube and addition of 5 ml
of BV421 Annexin V (BD Biosciences, 563973), cells were vortexed and incubated for 15 min at RT in the dark. After addition of 400 ml
of 13 Binding Buffer, cells were analysed on FACS Canto II using FlowJo software.
Senescence Assay (B- Galactosidase Staining)Cytochemical staining for beta b-galactosidase activity was performed using Senescence b-Galactosidase Staining Kit (# 9860, Cell
Signalling). Cells were collected and washed with 10 ml PBS. Cells were then fixed with fixative solution at room temperature for
15 minutes, followed by two PBS wash steps. Staining reagent at pH 6 was prepared according to manufacturer’s instructions
and 500 ml of the solution was added to each cell pellet. Samples were then transferred into a 24 well plate, sealed with parafilm,
and placed in an incubator at 37�C without CO2 overnight. The following day, stained samples were viewed under an Axiovert
200 microscope (Zeiss) at 200x magnification, with bright field illumination. A total of 5 images were captured for each sample
and assessed using ImageJ image analysis software. The percentage of b-galactosidase positive undergoing senescence (stained
green) were determined by counting the number of the green cells and normalising them to the total number of the cells in the
same image.
Western Blotting and QPCRCells were lysed in either 50mM Tris pH 8/1% SDS supplemented with phosphatase and protease inhibitors or RIPA buffer (50 mM
Tris, 150 mM NaCl, 1% Triton X-100, 1% Sodium Deoxycholate, 0.1% SDS, 1 mM EDTA) supplemented with phosphatase and pro-
tease inhibitors. Alternatively, proteins present in the RNeasy flow through were mixed with 2 volumes of acetone, precipitated and
dissolved in urea buffer (8 M urea, 1% DTT, 4% CHAPS). Protein concentration was determined using either Bio-Rad Protein Assay
Reagent concentrate (Bio-Rad) or BCA Protein Assay kit (Pierce). Sample proteins were separated using SDS-PAGE electrophoresis
and transferred onto PVDF. Membranes were incubated overnight with primary antibody, washed and incubated with secondary
antibody for 1 hr. Protein/antibody complexes were detected by autoradiography.
Total RNA was extracted using RNeasy Mini Kit (Qiagen, 74106). 500 ng was used as a template for reverse transcriptase with
RevertAid First Strand cDNA Synthesis Kit (ThermoScientific, K1621). Quantitative PCR was then performed on a Viia7 RT-PCR
(Applied Biosystems). Primer sequences are shown in Table S5.
Next Generation Sequencing50 bp single end (SE) sequencing was performed using Illumina MiSeq and HiSeq2000. Resulting reads consisted of shRNA specific
barcodes in FASTQ format. Raw reads were trimmed both ends up to the locations of barcode sequence before aligning to the refer-
ence shRNA barcodes using Bowtie2 (Langmead and Salzberg, 2012). An in-house script was used to count the number of reads
specific to each shRNA barcode from the Bowtie2 output allowing for only a single mismatch. Barcode read counts were then
used for the analysis of changes in shRNA pool composition between doxycycline-induced and non-induced samples over time.
shRNA Competition AssayKasumi-1 pSLIEW and SKNO-1 pSLIEW cells were transduced with pLKO5d.SFFV.miRNA30n with different expression marker for
each target (dTOMATO representative of shCCND2 and shRE expression and RFP657 representing shNTC expression) (Schwarzer
et al., 2017). Four days post-transduction, cells were analysed by flow cytometry (BD FACSCalibur). Each shCCND2 construct was
mixed with shNTC in a mixture of 50% each. The percentage of shRNA-expressing cells was measured every 2-3 days by flow
cytometry. In vivo approachwas done using the same proportion of cellsmixture. A dose of 2.5 x 10⁵ of cellsmixturewere intrahepati-
cally injected into 1 to 4-day-old Rag2�/�Il2rg�/�1293Balb/c (RG) mouse. Tumour engraftment was assessed via bioluminescent
imaging (IVIS Spectrum, Caliper with Living Image Software). Tumour was harvested and analysed with flow cytometry at endpoint
of experiment.
In Vivo Palbociclib TreatmentKasumi-1 pSLIEW cells were intrahepatically injected into 17 newborn (1-4 days old) immunodeficient Rag2�/�Il2rg�/�1293Balb/c
(RG) mice at a cell dose of 2.5 x10⁵ cells/mouse as described previously (Martinez Soria et al., 2009). From 5 weeks old, cell
e6 Cancer Cell 34, 626–642.e1–e8, October 8, 2018

engraftment was assessed weekly via bioluminescent imaging (IVIS Spectrum, Caliper with Living Image Software). Mice were rand-
omised into two treatment groups, one given palbociclib 100 mg/kg once daily and the other water vehicle at 10 ml/g body weight,
orally by gavage in an unblended fashion. Treatment was given in 3 blocks of 7 days separated by 7 day blocks with no treatment.
This schedule was found to be well tolerated with little weight loss compared to controls.
Engraftment of secondary mouse AE9a transplants in C57BL/6 mice was monitored by flow cytometry. As soon as flow cytometry
indicated 5% total GFP+ or 2% GFP+ KIT+ (as a % of live cells) in peripheral blood, secondary recipients were treated with control
vehicle (CV) or palbociclib by oral gavage in the following treatment blocks: day 9 to day 18, 150 mg/kg/day; day 42 to day 46,
100mg/kg/day; day 49 to day 50, 100mg/kg/day. Secondary recipient mice were monitored closely for signs of leukemia (behavioral,
body condition, weight loss, piloerection, hind limb paralysis). Since 150 mg/kg/day approached the Maximal Tolerated Dose in this
model, we reduced the dose for the final two blocks to 100 mg/kg/day. In addition, automated cell counts (analyzed on a Sysmex XT
2000i analyzer) and flow cytometric analyses (using an LSRFortessa X20 analyzer) were performed on tail vein blood microsamples,
collected using heparinized end-to-end Micro Pipettes (Vitrex). The reagents used in the flow cytometric analyses were: 1mg/ml anti-
mouse CD117 (c-Kit) APC-eFluor 780 (ThermoFisher Scientific, eBioscience clone 2B8); 1 mg/ml anti-mouse CD45.2 PerCPCy5.5
(ThermoFisher Scientific, eBioscience clone 104); 0.68 mg/ml anti-mouse CD45.1 eFluor 450 (ThermoFisher Scientific, eBioscience
cloneA20); 1 mg/ml Hoechst 33258, Pentahydrate (bis-Benzimide) (ThermoFisher Scientific) for live/dead staining.
CHIC Analysis of Long-Range Promoter ContactsKasumi-1 cells (53 107) were fixed in 37ml of RPMI-1640 supplemented with 15%FBS and 2% formaldehyde for 10minutes at room
temperature. 6 ml of 1M glycine (0.125 M final concentration) was added to quench the reaction and cells were incubated at room
temperature for 5 min, followed by 15minutes on ice before pelleting the cells at 4�C and washing them in ice cold PBS. Each sample
was flash frozen in liquid nitrogen, and stored at �80�C. Cells were lysed in a tight dounce homogeniser (ten cycles) with 3ml of cold
lysis buffer (10 mM Tris-HCl pH 8, 10 mMNaCl, 0.2% Igepal CA- 630, one tablet protease inhibitor cocktail (Roche complete, EDTA-
free, 11873580001)). Cells were left on ice for five minutes then homogenised another ten times. The lysed cells, in 3 ml lysis buffer,
were added to 47ml of lysis buffer and incubated on ice for 30 minutes with occasional mixing. Chromatin was pelleted and resus-
pended in 1ml of 1.25x NEBuffer 2 and split into four. Each sample was then pelleted at 1000 rpm and resuspended in 358 ml of 1.25x
NEBuffer 2. 11 ml 10% SDS was added and each tube was incubated at 37�C for 60 minutes, rotating at 950 rpm. Samples were
mixed by pipetting up and down every 15 minutes. SDS was quenched with 75ml 10% Triton X-100 and incubated at 37�C for 60 mi-
nutes. HindIII digestion, biotinylation, ligation, crosslink reversal, promoter capture and library preparation was performed exactly as
described previously (Mifsud et al., 2015).
QUANTIFICATION AND STATISTICAL ANALYSIS
Statistical Comparison of Experimental GroupsIf not indicated otherwise, all statistical comparisons were performed using two-sided Student’s t-test.
Statistical Analysis of SHRNA RepresentationRead counts for each dataset were normalised with upper-quartile normalisation method implemented in edgeR (Robinson et al.,
2010). For in vitro SKNO-1 colony formation assays dataset, differential representation of shRNAs between doxycycline-induced
and non-induced samples was assessed using edgeR. In brief, data were fit to a generalized linear model (GLM) and aGLM likelihood
ratio test was performed to determine whether the coefficient representing the contrast between the conditions of interest was equal
to zero, which indicate no differential representation.
For the other three in vitro datasets, time course analyses were performed in order to find shRNAs that have different responses
between doxycycline-induced and non-induced arms over time with linear modeling using voom/limma pipeline (Law et al., 2014;
Ritchie et al., 2015). For each dataset, the analysis was performed by fitting a temporal trend to time points/replatings for each con-
dition using a natural regression spline function from the splines package. To test for any differences in the spline fits between
induced and non-induced conditions, we created a model matrix that includes an interaction term corresponding to differences in
the curves between conditions and a contrast matrix that is equivalent to the null hypothesis stating that the trends are equivalent
between conditions taking into account any difference in the magnitude of expression and the shapes of the splines. Log2 fold
changes between induced and non-induced samples were then calculated by subtracting the log2-transformed counts per million
(CPM) value of the induced sample from the CPM value of non-induced sample at each time point for each shRNA.
For the in vivo datasets, RUVr approach fromRUVSeq (Risso et al., 2014) was used to estimate unwanted variation, and in our case
was potentially attributed by data generated from two different sequencing platforms.We usedRUVr to calculate factors of unwanted
variation using residuals from a first pass GLM regression of the upper-quartile normalised counts on the covariate of interest i.e.
doxycycline induction effect. To adjust for this technical bias, the estimated factors of unwanted variation as well as the covariate
of interest were both included in the model for differential representation analysis which was performed using the negative binomial
GLM approach implemented in edgeR (Robinson et al., 2010). P values were adjusted to control for the false discovery rate (FDR)
using the Benjamini-Hochberg method (Benjamini and Hochberg, 1995).
Cancer Cell 34, 626–642.e1–e8, October 8, 2018 e7

Gene Test and RankingThe modified robust rank aggregation (a-RRA) module implemented in MAGeCK (Li et al., 2014) was employed to identify essential
genes, which are genes with many shRNAs ranked near the top of the shRNA list sorted by P-values from the shRNA differential rep-
resentation analysis procedure described above. In brief, a-RRA looks for genes whose shRNA rankings are consistently higher than
expected and computed the statistical significance of the skew in ranking by permutation.
Differential Gene Expression AnalysisFor expression profiling with RNA-seq data, paired-end reads were mapped to the reference human genome hg19 using STAR2-
pass allowing up to two mismatches (Dobin et al., 2013). Per gene raw read counts for each sample were obtained using HTseq
and Gencode version 19 (Anders et al., 2015). Gene-level differential expression analysis was performed using DEseq2 (Love
et al., 2014). P-values were adjusted to control for the false discovery rate (FDR) using the Benjamini-Hochberg method (Benjamini
and Hochberg, 1995). Gene set enrichment analyses were performed using MSigDB (Subramanian et al., 2005).
Analysis of Published AML Microarray DatasetsThe microarray dataset (GSE6891) was downloaded from the Gene Expression Omnibus (GEO) using the Bioconductor GEOquery
package (Davis and Meltzer, 2007). Expression data were processed and normalised with Robust multi-array average (RMA (Gautier
et al., 2004)) using the Bioconductor affy package (Irizarry et al., 2003). CCND2 gene expression was calculated from the mean
average expression of probes targeting the gene. P-value calculated using two-sided Wilcoxon test indicates significant difference
of CCND2 expression between the groups.
DATA AND SOFTWARE AVAILABILITY
The accession number for the CHiC and JUND ChIP data reported in this paper is GEO: GSE117108. ChIP-seq, DHS-seq, RNA-seq
and bead array data have been previously deposited under GSE29225 and GSE60121 (Ptasinska et al., 2012, 2014).
e8 Cancer Cell 34, 626–642.e1–e8, October 8, 2018