the optimal size of a uk hub airport
TRANSCRIPT

The optimal size of a UK hub airport
Peter Hind February 2014

INDEPENDENT TRANSPORT COMMISSION
1
Meeting the UK’s future aviation needs is amongst the most difficult infrastructure challenges we face. The ITC, as the UK’s independent transport think tank, has therefore made this a priority area for research.
In May 2013 the ITC published an initial report Flying into the Future. This concluded that while the UK’s short-haul needs can be met through regional airports, its connectivity to global, long-haul, destinations is seriously constrained by the limits on our major hub. Therefore more hub capacity is needed to sustain London’s position as the best-connected world city, especially since rival European hubs are providing growing competition for airlines and customers. It did not recommend a specific site for an expanded UK hub, but concluded that if a different one were chosen Heathrow would have to close.
The national debate continues and the Government-appointed Airports Commission has now published its interim conclusions, recognising the need for more capacity but without yet concluding whether this should be at a major hub or spread between Heathrow (or, perhaps, the Isle of Grain) and Gatwick.
The ITC has therefore commissioned a team at RDC Aviation Ltd, led by Peter Hind, to address two key issues. First, is the airline industry’s hub-and-spoke business model, based around large hub airports, likely to continue to be key to long-haul connectivity? Or will it be superseded by long-distance point-to-point services, flying to and from smaller airports? Second, if the UK’s prime need is indeed for additional hub capacity, how much will it actually need in the decades ahead?
This report explores these issues, highlighting the role of transfer passengers in making long-haul routes viable, and developing scenarios to test the scale of capacity needed to enable the UK to match continental rivals. It concludes:
a) for the foreseeable future the long-haul industry remains likely to rely very heavily (though not exclusively) on the hub and spoke business model. To protect and develop the UK’s global “direct” connectivity and to ensure new routes are launched from the UK before our European competitors, the prime need remains to develop our hub capacity;
b) a three-runway hub airport is likely to be sufficient to meet anticipated needs for the next 20-30 years; and these three runways need to be at the same physical site i.e. the current Heathrow or a new Isle of Grain airport;
c) but in planning for the longer term, the Airports Commission should address now what might happen if, in the middle of the century, it becomes clear further capacity is required.
The findings are broadly consistent with the Airports Commission’s interim findings, which suggest the need for one additional runway. However, while the Commission remains undecided where this should be located, our findings suggest that - even with the large London domestic market - it will be extremely difficult to sustain true global hub networks through two medium-sized airports.
This suggests that if the UK is to have just one additional runway, it is likely to get far more benefit, in terms of additional global connectivity, by investing in a stronger hub airport than in spreading its capacity thinly across two 2-runway airports.
Dr Stephen Hickey
Chairman of the Aviation working group
Independent Transport Commission
Foreword from the ITC Project Chairman
Published by the Independent Transport Commission
The Independent Transport Commission (ITC) is one of Britain’s leading research charities with a mission to explore all aspects of transport and land use policy. Through our independent research work and educational events we aim to improve and better inform public policy making. For more information on our current research and activities please see our website: www.theitc.org.uk
Independent Transport Commission 70 Cowcross Street London EC1M 6EJ
Tel No: 0207 253 5510 www.theitc.org.uk
Registered Charity No. 1080134 February 2014 © Copyright Independent Transport Commission
Acknowledgements:
This report was authored by Peter Hind and RDC Aviation. The ITC would like to acknowledge its gratitude to Peter and the RDCA team for their work, and also to thank those who have offered help and advice with the paper including Roger Maynard, Graham French and Dr Nigel Dennis.
The ITC would also like to record its gratitude to its Core Benefactors, a list of whom can be found on the main ITC website. The views expressed in this paper are those of the authors and do not necessarily represent the collegiate view of the ITC.
February 2014

INDEPENDENT TRANSPORT COMMISSIONThe optimal size of a uk hub
32
Table of Contents
Executive Summary 4
1. Background 10
2. Current Situation and Future Outlook 11
Demand Forecasts 14
Fleet Development 15
3. Airline Strategy and the role of the Hub 17
Airline Strategy 17
The Role of Transfer Traffic 19
The Importance of Business Travel 21
Why Do Airlines Use the Hub Model? 22
Limitations of the Point-to-Point Long-haul Model 27
Airport Development 30
4. Connectivity 32
Home Base versus Non-Domicile Airlines 37
5. Infrastructure 40
Terminal Capacity 40
Runways 42
Hours of Operation 45
6. Hub Airport Runway Requirements and Timing 50
Timing and Conclusions 52
The optimal size of a UK hub airport

INDEPENDENT TRANSPORT COMMISSION
5
The optimal size of a uk hub
4
This compares with Heathrow’s total of 176 destinations today. To be more realistic, we have modelled a number of scenarios based on the assumption that a UK hub should serve a similar profile to the other largest European hubs. Depending on the assumptions made, this suggests it would serve between roughly 200 and 300 destinations. We have opted for the mid-point, which appears consistent with the Airports Commission’s own assumptions.
We do not believe that additional capacity at a hub airport would immediately deliver new routes to an unlimited list of emerging markets, many of which are covered by restrictive air service agreements. Airlines are more likely to begin filling their network gaps to the developed countries in Europe, North America and the more advanced South East Asia economies. However a trickle-down effect would follow, as demand grows and connectivity options increase, leading to a more diverse network of new world destinations coming on-stream at the hub.
Some have argued that it is no longer necessary to develop hub capacity in order to develop long-haul connectivity, and that the need can be met by developing smaller secondary airports, enabled by growing local markets and the new generation of more efficient aircraft, to developing new global destinations. In this view the “hub and spoke” business model, which has underpinned long-haul networks over recent decades, has had its day and will be replaced by cheaper point-to-point routes, as has happened in the short-haul market. The implication is that any new capacity could go into secondary airports rather than into an expanded hub.
We therefore explore the alternative business models used in the industry and ask whether hub and spoke is likely to be superseded in the long-haul market. The model certainly has limitations and creates some apparently odd results. Airlines today charge passengers less to fly from (say) Copenhagen to (say) New York in two journeys via their main hub (eg London or Paris) than by one journey direct. We therefore review how airline economics are likely to develop and consider the possibility that, as routes from the UK regions, such as Manchester to New York, become “thicker”, more people will fly direct from secondary airports rather than via major hubs. But while it is likely that this kind of travel will grow in absolute terms, we think it very unlikely to fundamentally displace the powerful commercial drivers which underpin the hub-and-spoke business model for connectivity with global destinations, including emerging markets. From the airline perspective, the hub-and-spoke model has major attractions, including a much broader “offer” to potential customers and significant internal operational and cost efficiencies. Conversely, there are formidable commercial and operational difficulties for airlines seeking to operate long-haul routes simply on a point-to-point basis.
We conclude that we cannot safely assume that the hub and spoke model will be displaced by point to point in the long-haul market; so that if we wish to promote global connectivity the priority remains the UK’s hub capacity. Developing long-haul routes from secondary airports is to be welcomed, but not at the price of constraining the hub’s ability to sustain existing global routes and to develop new ‘spokes’.
This study is part of a series of papers that the ITC is commissioning in response to the Airports Commission. The first report, Flying into the Future, supports the view that the UK requires a high-quality international hub airport to maximize long-haul connectivity to the world’s key cities, at the same time recognising the importance of developing regional airports to improve point-to-point connectivity.
This study has been written by the independent consultancy RDC Aviation. It looks to address the question of “how much hub capacity does the SE need?” not just conceptually but also from the airline standpoint. We believe it has 3 elements:
• how much international connectivity do we “need” or could reasonably expect to obtain?
• how much transfer traffic do we need passing through a hub airport to support that?
• how does that translate into “hub capacity”? Taking account of the different measures of capacity (passenger numbers, aircraft movements, peak-hour needs, resilience, terminal capacity etc), how many runways do we need at the hub?
How much international connectivity?
Flying into the Future stressed the need to protect and enhance the UK’s direct connectivity (i.e. without having to travel via 3rd countries) with a broad and growing range of global destinations; and expressed concern that, without growth in hub capacity, this would be put at risk as more global networks centre around a small number of non-UK major hubs.
The Airports Commission has highlighted that Heathrow already serves fewer global destinations than Frankfurt, Paris or Amsterdam and many fewer than Dubai. The position for London as a whole is stronger, and London has some areas of particular strength (eg North American routes). It also scores well on flight frequencies. But the UK has relatively weak links with important destinations for the future; sees many UK passengers relying on Amsterdam and other airports to reach global destinations (and the converse for people coming to the UK); and, without better hub capacity, is at risk of seeing more of its global connectivity narrowing to a relatively limited set of high-volume destinations, and the rest becoming largely indirect. Our analysis of the world’s top 25 airports shows that since 2005, while other hubs have increased their range of destinations, often dramatically, Heathrow has lagged behind. Heathrow’s decline has been absolute, not just relative to all other hubs.
How many destinations “should” a UK hub serve? Clearly there is no simple answer. Loughborough University and the Globalization and World Cities Research Network have identified 296 “world cities”, which suggests a theoretical (and implausible) maximum connectivity of 295, plus secondary destinations.
Executive Summary

INDEPENDENT TRANSPORT COMMISSIONThe optimal size of a uk hub
76
Our findings therefore support the Airports Commission’s view that a “concentrated” hub airport would deliver a wider range of routes - and hence better connectivity - than their alternative “dispersed” option, i.e. with two runways at both Heathrow and Gatwick. We suspect that the scale of the difference is greater than suggested in the Commission’s interim report, since their modelling appears to assume that both airports operate as genuine hubs. But the airlines’ commercial incentives and strategies suggest this is implausible and that in reality only one would work as a true hub in the full sense. Thus if Gatwick were chosen as the site for expansion, that might be sufficient for longer, but only because the level of potential demand would not have been adequately mined. As Manchester illustrates, having two runways is not sufficient in itself to turn an airport into a global hub. We recommend the Commission revisit its modelling and test the underpinning assumptions about airlines’ behaviour.
How much more hub capacity?
Hub capacity is most easily considered in terms of runways. And the ultimate issue for the Airports Commission and the Government is whether to build additional runway capacity and, if so, how much and where. But measuring and planning airport “capacity” needs to reflect many factors. They include:
• the number of passengers, which depends in turn on the balance between the numbers willing to fly and the numbers who can be handled. The Airports Commission has confirmed that, whatever the uncertainties around future economic conditions, fuel prices, CO2 constraints etc, the “demand” for air travel over the next decades is strongly upwards;
• the number of flights (“air traffic movements” or ATMs): there are inevitable uncertainties around the future mix of aircraft sizes and their loadings, and hence how many ATMs are needed to fly a given number of passengers. An efficient hub needs a mix of aircraft types - typically, smaller ones for shorter, feeder journeys and larger ones for medium/long-haul; and Heathrow already operates with relatively high loadings. Our analysis suggests that, for the aviation industry as a whole, the ratio of smaller to larger planes may shift towards the former, but suggests limited change in load factors. This in turn implies that more ATMs may be needed to move a given number of passengers, reinforcing the need for more runway capacity;
• contingency: a major problem today is that Heathrow (and Gatwick) operate at full capacity with almost no contingency. This means even minor delays or problems can rapidly escalate, resulting in passengers waiting to depart and aircraft circling London (adding CO2 and noise). A clear contingency margin should be built into future capacity planning;
Transfer traffic - an opportunity?
Transfer traffic is an inherent part of the hub and spoke model and airports that enable their hub carriers to capture transfer traffic are able to develop new routes at a faster rate than those that simply rely on local demand. The Airports Commission notes that Dubai, with a population of around 2 million, would be unable to support its vast network of routes if it weren’t for transfer traffic. Our findings suggest that new routes can be brought forward by a decade or more if there is a high proportion of transfer traffic.
Heathrow relies less on transfer passengers than many other hubs: only 37 per cent of traffic transfers compared with over 40 and 50 per cent at Schiphol and Dubai. More passengers from the UK regions now transfer via these two competitors than through Heathrow. If Heathrow were to recapture all that traffic, its passengers would rise by around 12 per cent and air traffic movements, based on a simplistic estimate, by 8 per cent.
Recapturing all this business is implausible, even with more capacity. But enabling more people to transfer from other UK cities via the UK hub would create real opportunities. It would improve air connectivity between London and UK cities and regions which have lost this in recent years. And it would add critical mass to support long-haul flights to and from the UK, making the UK in turn a more attractive destination for foreign businesses and visitors. This is before taking account of indigenous growth and/or the hub’s ability to attract passengers currently transferring at other European hubs – this is a market in which success breeds success (as can be seen by growth at Dubai).
The Airports Commission has developed new growth forecasts for the London airport system and suggests that without additional capacity, the number of transfer passengers using Heathrow will drop from 22.6 million in 2011 to less than 4 million in 2050, resulting in a 20 per cent decline in the number of destinations served over the same period. Enabling the UK hub (whether at Heathrow or elsewhere) to achieve a greater share of this transfer traffic, would address this prospective connectivity loss, give a stronger competitive advantage to the UK and create additional investment and employment opportunities.
Transfer traffic can play an important role in maintaining and growing the network of routes from a UK hub airport and in doing so will help attract inbound investment from emerging markets. Connectivity through direct air links offers opportunities for UK-based companies to travel efficiently to undertake business in these new markets; and for businesses from emerging economies to locate their European operations in the UK. The availability of direct air services between the UK and corporate home-cities is of paramount importance in influencing their choice of overseas location and is essential to keep London as an ‘alpha ++’ world city.

INDEPENDENT TRANSPORT COMMISSIONThe optimal size of a uk hub
98
Conclusion
In Flying to the Future the ITC argued that the major aviation connectivity challenge for the UK was not in the short-haul area - which has been very well served by the growth of low-cost airlines and airports around the country - but in sustaining and enhancing direct connectivity with global destinations; and that increased hub capacity was crucial to address this.
We currently host the world’s busiest international airport, yet more traffic from the UK’s regional airports hubs abroad than via Heathrow. Before adding ‘new’ demand, recapturing that traffic could increase passenger numbers by 12 per cent, ATMs by 8 per cent and destinations by 7 per cent.
In this report we conclude that:
a) we cannot forecast significant changes in the structure of aviation. Long-haul remains likely to rely very heavily (though not exclusively) on the hub and spoke business model and aircraft entering service now will still feature strongly in airline fleets in the 2030s;
b) to protect and develop the UK’s global “direct” connectivity and to ensure new routes are launched from the UK before our European competitors, the prime need remains to develop our hub capacity;
c) over time, a three runway airport might mean up to 70 more destinations but paradoxically we believe the first instinct of airlines will be to increase routes to some of the more mature markets;
d) a three runway hub airport is likely to be sufficient to meet anticipated needs until at least the middle of the century and these three runways need to be at the same physical site i.e. the current Heathrow or a new Isle of Grain airport ;
e) but in planning for the longer term, the Airports Commission should address now what might happen if, in the middle of the century, it becomes clear further capacity is required;
f) we agree with the earlier views of the ITC that an extra runway at Gatwick would not offer the same opportunities for developing connectivity.
• peak hour: certain times of day are particularly important for arriving and departing passengers, depending on the time zone they are travelling to/from. We illustrate the implications for flights to and from different global destinations of different airport opening hours and conclude that the case for 24 hour operations is not strong. Early morning slots are particularly important for some, but also sensitive for local communities. Such slots must be provided and managed in a way which reflects both priorities, particularly by minimising noise;
• runways: we review issues around runway design and optimisation. We recognise that, just as operating Heathrow with only 2 runways is clearly sub-optimal, once airports go above 4 runways new design problems and potential inefficiencies can arise. Taking into account the need to accommodate resilience and peaks, we suggest it would be prudent to plan for annual utilisation of no more than 90 per cent of theoretical capacity;
• terminal capacity. Terminal 5 is one of the largest in the world, capable of handling over 30m passengers annually; and Terminal 2 is near the end of a major upgrade. The Airports Commission will need to consider the configuration of terminals and their interconnections, but we do not believe they are likely to constrain the overall capacity of the future hub airport;
• surface access. The ITC has commissioned a separate review of this critical issue, so we do not address surface access in this report.
Having taken these factors into account, our analysis of connectivity scenarios, and modelling of the consequential potential ATMS and passenger numbers, suggests the initial requirement for a UK hub airport is for three runways at the same site. This would allow for 70 additional destinations to be served at a flight frequency that enables competition, and leaves a reasonable margin for peaks and contingency. However, looking further ahead to the mid-century, it is possible, though not certain, that a fourth runway might be needed, eg to enable more resilience and accommodate domestic transfer traffic repatriated from competitors in Europe and the Middle East.

The optimal size of a uk hub
10
INDEPENDENT TRANSPORT COMMISSION
11
2.1. The five major London airports, Heathrow, Gatwick, Stansted, Luton and London City, make up the largest air travel market in the world by most measures. In 2013, the London system offered almost 176m seats to global markets. The total amount of capacity and resultant available seat kilometres (ASKs) from London are significantly greater than that of the nearest competitor cities and only the combined New York airports have a greater volume of flights than London.
Figure 1: Top 10 Global Cities - Combined Air Market Scheduled Airline Metrics
City 2013 Seat Capacity Departures Ave Capacity ASKs (bn)
London 175,992,872 490,864 179 252.7
Tokyo 147,588,886 319,986 230 169.8
New York 144,270,668 578,062 124 226.8
Beijing 119,101,952 302,883 196 128.0
Paris 118,349,398 345,712 171 166.6
Atlanta 112,196,734 443,968 126 85.6
Shanghai 111,794,614 297,652 187 108.7
Chicago 106,911,606 530,277 100 105.7
Dubai 87,766,392 168,354 260 168.5
Dallas 87,261,514 377,872 115 70.9
2.2. However, this unique five-airport system is under greater pressure than ever, with Heathrow and Gatwick operating very close to maximum capacity and the others with some peak-time constraints, there is little scope for accommodating future demand based on current infrastructure. The five main London airports handled 135m passengers in 2012, and DfT forecasts for the period to 2050 show total volume increasing to 197m per annum. Within this, Heathrow is projected to grow to 93mppa, from around 70m in 2012.
2.3. Each of the London airports undertakes a different role within the system and only Heathrow operates as a major base for long-haul services and as such the other airports should not be seen as a proxy for Heathrow, which is recognised internationally as the intercontinental airport of choice for serving the UK. While all London airports have increased passenger throughput in the last decade, growth has not been consistent. Analysis of the published timetable data shows that the network carrier segment has decreased capacity over the period from 2002, whereas the low-cost and charter carriers have shown very significant growth.
2.4. One implication is that over the last ten years, network carriers have been forced to show discipline in their expansion because of the constraints at their preferred airports, whereas low-cost carriers have been able to establish new bases at the sites with spare capacity, thereby facilitating growth. This is particularly notable at Gatwick, which lost a large number of long-haul services in 2008/09, seeing them replaced by short-haul low-cost routes. To this extent, London has developed in a different way to other major European cities.
2. Current Situation and Future Outlook
1.1. This paper has been commissioned by the Independent Transport Commission (ITC), Britain’s leading research charity focussed on transport, land-use and planning issues, and written by the independent consultancy firm RDC Aviation Ltd (RDC). RDC is a UK-based consultancy and software business with expertise in network planning and long-term demand forecasting for airport, airline and investor clients across the world.
1.2. The report forms part of a series of studies run by ITC into aviation strategy with a view to providing evidence to the UK Airports Commission. In its Flying into the Future report, ITC supports the view that the UK needs a high-quality international hub airport to maximise connection opportunities to the world’s key cities, while also recognising the importance of direct flights from regional airports1. As such, it is intended to focus on the optimal size for a major hub airport, considering the levels of infrastructure required to provide sufficient capacity to meet future demand. It also seeks to contextualise global airline strategy in relation to the UK airport capacity debate.
1.3. Although consideration has to be made as to the role of existing airports and their airline customers when suggesting the type of new capacity that the country needs, this study is location-neutral. It seeks to build upon the previous work of the ITC in suggesting that a key driver for the provision of new airport capacity has to be to enable greater long-haul air connectivity for the UK, but does not consider or recommend whether this should be at a current or new site. It also considers the important role of airline strategy in shaping air travel markets. What we are looking at is the amount of runway or terminal capacity that would be required to host a hub operation, and this could be added to an existing airport or form part of a wholly new site.
1.4. Simply building a hub airport for the UK on the basis that it will attract airlines to fly new destinations, meet the strategic needs of its customers and be accessible for the widest number of passengers over-simplifies the role of the airport and airlines. Creating such a facility without understanding the workings of the air transport industry could result in under-utilisation of an expensive asset.
1. Background
1 ITC Flying into the Future: Key issues for assessing Britain’s Aviation infrastructure needs. http://www.theitc.org.uk/docs/98.pdf
INDEPENDENT TRANSPORT COMMISSIONThe optimal size of a uk hub
1312
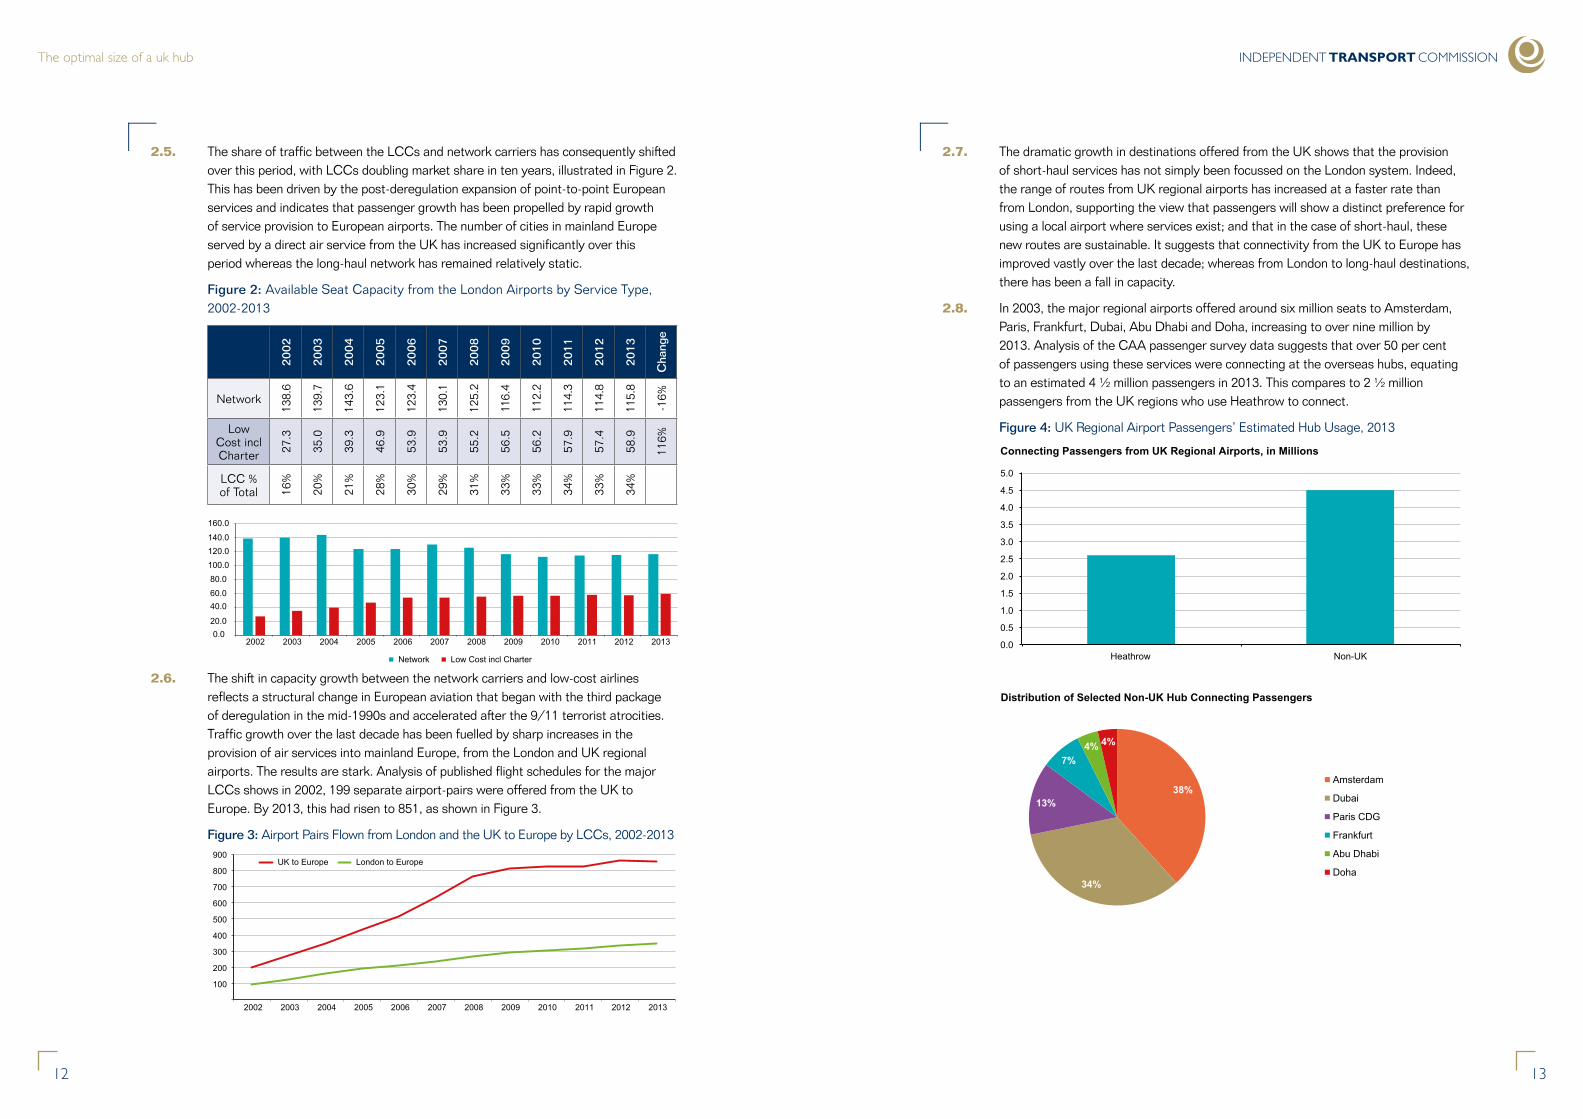
2.5. The share of traffic between the LCCs and network carriers has consequently shifted over this period, with LCCs doubling market share in ten years, illustrated in Figure 2. This has been driven by the post-deregulation expansion of point-to-point European services and indicates that passenger growth has been propelled by rapid growth of service provision to European airports. The number of cities in mainland Europe served by a direct air service from the UK has increased significantly over this period whereas the long-haul network has remained relatively static.
Figure 2: Available Seat Capacity from the London Airports by Service Type, 2002-2013
2002
2003
2004
2005
2006
2007
2008
2009
2010
2011
2012
2013
Cha
nge
Network
138.
6
139.
7
143.
6
123.
1
123.
4
130.
1
125.
2
116.
4
112.
2
114.
3
114.
8
115.
8
-16%
Low Cost incl Charter 27
.3
35.0
39.3
46.9
53.9
53.9
55.2
56.5
56.2
57.9
57.4
58.9
116%
LCC % of Total 16
%
20%
21%
28%
30%
29%
31%
33%
33%
34%
33%
34%
0.0 20.0
40.0 60.0
80.0 100.0 120.0 140.0
160.0
2002 2003 2004 2005 2006 2007 2008 2009 2010 2011 2012 2013
Network Low Cost incl Charter
2.6. The shift in capacity growth between the network carriers and low-cost airlines reflects a structural change in European aviation that began with the third package of deregulation in the mid-1990s and accelerated after the 9/11 terrorist atrocities. Traffic growth over the last decade has been fuelled by sharp increases in the provision of air services into mainland Europe, from the London and UK regional airports. The results are stark. Analysis of published flight schedules for the major LCCs shows in 2002, 199 separate airport-pairs were offered from the UK to Europe. By 2013, this had risen to 851, as shown in Figure 3.
Figure 3: Airport Pairs Flown from London and the UK to Europe by LCCs, 2002-2013
100
200
300
400
500
600
700
800
900
2002 2003 2004 2005 2006 2007 2008 2009 2010 2011 2012 2013
UK to Europe London to Europe
2.7. The dramatic growth in destinations offered from the UK shows that the provision of short-haul services has not simply been focussed on the London system. Indeed, the range of routes from UK regional airports has increased at a faster rate than from London, supporting the view that passengers will show a distinct preference for using a local airport where services exist; and that in the case of short-haul, these new routes are sustainable. It suggests that connectivity from the UK to Europe has improved vastly over the last decade; whereas from London to long-haul destinations, there has been a fall in capacity.
2.8. In 2003, the major regional airports offered around six million seats to Amsterdam, Paris, Frankfurt, Dubai, Abu Dhabi and Doha, increasing to over nine million by 2013. Analysis of the CAA passenger survey data suggests that over 50 per cent of passengers using these services were connecting at the overseas hubs, equating to an estimated 4 ½ million passengers in 2013. This compares to 2 ½ million passengers from the UK regions who use Heathrow to connect.
Figure 4: UK Regional Airport Passengers’ Estimated Hub Usage, 2013
0.0
0.5
1.0
1.5
2.0
2.5
3.0
3.5
4.0
4.5
5.0
Heathrow Non-UK
Connecting Passengers from UK Regional Airports, in Millions
38%
34%
13%
7% 4% 4%
Distribution of Selected Non-UK Hub Connecting Passengers
Amsterdam
Dubai
Paris CDG
Frankfurt
Abu Dhabi
Doha
0.0
0.5
1.0
1.5
2.0
2.5
3.0
3.5
4.0
4.5
5.0
Heathrow Non-UK
Connecting Passengers from UK Regional Airports, in Millions
38%
34%
13%
7% 4% 4%
Distribution of Selected Non-UK Hub Connecting Passengers
Amsterdam
Dubai
Paris CDG
Frankfurt
Abu Dhabi
Doha
INDEPENDENT TRANSPORT COMMISSIONThe optimal size of a uk hub
1514
2.9. The fact that so many UK passengers now travel to their end-destinations via non-UK hubs might seem unimportant. But it has three serious implications. First, it reduces the number of viable flights between the UK regions and London, constraining domestic connectivity (though not the numbers flying or CO2 since they still fly, but via non-UK airports). Second, it reduces the UK’s global connectivity by limiting the ability of airlines to start and end long-haul flights in the UK, since the essential feeder traffic is increasingly supporting flights centred on other, non-UK, cities instead. Finally, the UK becomes reliant on overseas governments having long-term growth policies for their hubs, so that UK regional airports can be guaranteed future connectivity to world markets. To illustrate the scale of the issue, we estimate that if all these UK transfer passengers were able to travel via a UK hub, they would support around 30,000 domestic flights and increase domestic flight connectivity by up to 40 per cent through a combination of additional destinations and flight frequency.
Demand forecasts
2.10. National demand forecasts for the UK have been developed and maintained by the Department for Transport (DfT) since the publication of the 2003 Future of Air Transport White Paper, using its National Air Passenger Demand Model (NAPDM) and National Air Passenger Allocation Model (NAPAM). The models produce high level passenger numbers using an income versus cost approach, where various factors determine potential to grow through increases in GDP and consumption, which are offset by increases in fares through higher cost of fuel, non-fuel costs and government taxation. The results of the modelled passenger demand are then allocated to airports within the UK system.
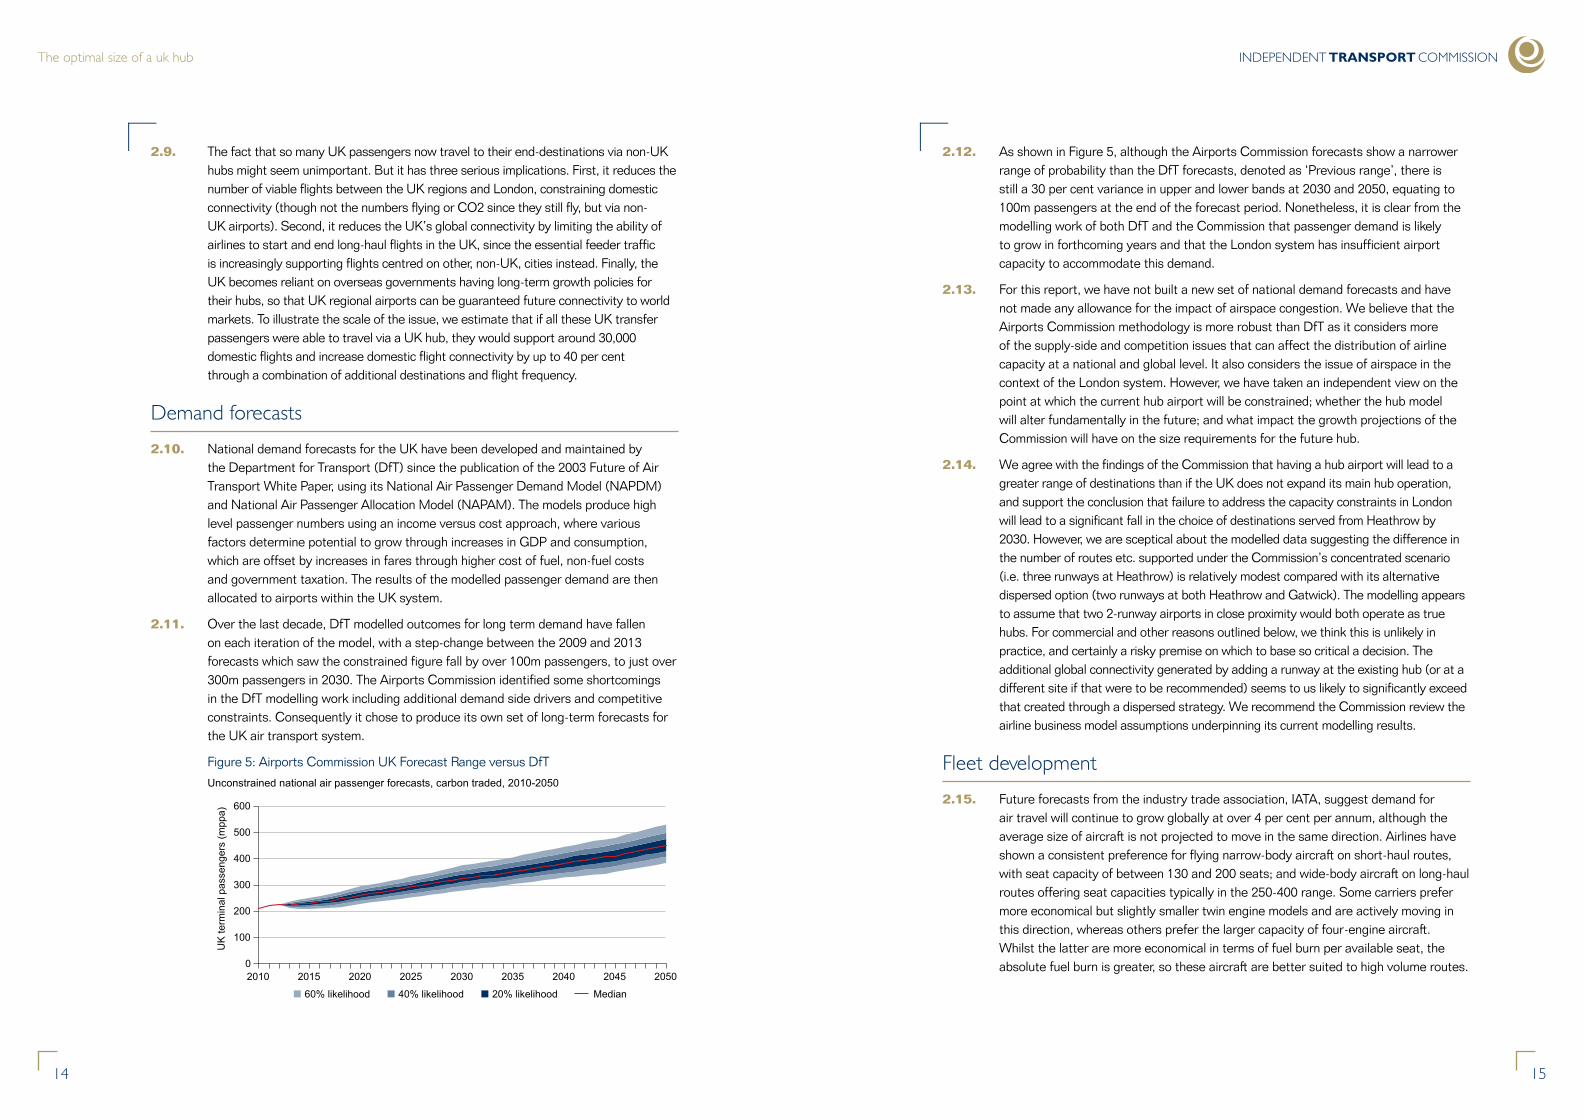
2.11. Over the last decade, DfT modelled outcomes for long term demand have fallen on each iteration of the model, with a step-change between the 2009 and 2013 forecasts which saw the constrained figure fall by over 100m passengers, to just over 300m passengers in 2030. The Airports Commission identified some shortcomings in the DfT modelling work including additional demand side drivers and competitive constraints. Consequently it chose to produce its own set of long-term forecasts for the UK air transport system.
Figure 5: Airports Commission UK Forecast Range versus DfT
Unconstrained national air passenger forecasts, carbon traded, 2010-2050
0
100
200
300
400
500
600
2010 2015 2020 2025 2030 2035 2040 2045 2050
UK
term
inal
pas
seng
ers
(mpp
a)
60% likelihood 40% likelihood 20% likelihood Median
2.12. As shown in Figure 5, although the Airports Commission forecasts show a narrower range of probability than the DfT forecasts, denoted as ‘Previous range’, there is still a 30 per cent variance in upper and lower bands at 2030 and 2050, equating to 100m passengers at the end of the forecast period. Nonetheless, it is clear from the modelling work of both DfT and the Commission that passenger demand is likely to grow in forthcoming years and that the London system has insufficient airport capacity to accommodate this demand.
2.13. For this report, we have not built a new set of national demand forecasts and have not made any allowance for the impact of airspace congestion. We believe that the Airports Commission methodology is more robust than DfT as it considers more of the supply-side and competition issues that can affect the distribution of airline capacity at a national and global level. It also considers the issue of airspace in the context of the London system. However, we have taken an independent view on the point at which the current hub airport will be constrained; whether the hub model will alter fundamentally in the future; and what impact the growth projections of the Commission will have on the size requirements for the future hub.
2.14. We agree with the findings of the Commission that having a hub airport will lead to a greater range of destinations than if the UK does not expand its main hub operation, and support the conclusion that failure to address the capacity constraints in London will lead to a significant fall in the choice of destinations served from Heathrow by 2030. However, we are sceptical about the modelled data suggesting the difference in the number of routes etc. supported under the Commission’s concentrated scenario (i.e. three runways at Heathrow) is relatively modest compared with its alternative dispersed option (two runways at both Heathrow and Gatwick). The modelling appears to assume that two 2-runway airports in close proximity would both operate as true hubs. For commercial and other reasons outlined below, we think this is unlikely in practice, and certainly a risky premise on which to base so critical a decision. The additional global connectivity generated by adding a runway at the existing hub (or at a different site if that were to be recommended) seems to us likely to significantly exceed that created through a dispersed strategy. We recommend the Commission review the airline business model assumptions underpinning its current modelling results.
Fleet development
2.15. Future forecasts from the industry trade association, IATA, suggest demand for air travel will continue to grow globally at over 4 per cent per annum, although the average size of aircraft is not projected to move in the same direction. Airlines have shown a consistent preference for flying narrow-body aircraft on short-haul routes, with seat capacity of between 130 and 200 seats; and wide-body aircraft on long-haul routes offering seat capacities typically in the 250-400 range. Some carriers prefer more economical but slightly smaller twin engine models and are actively moving in this direction, whereas others prefer the larger capacity of four-engine aircraft. Whilst the latter are more economical in terms of fuel burn per available seat, the absolute fuel burn is greater, so these aircraft are better suited to high volume routes.
The optimal size of a uk hub
16
INDEPENDENT TRANSPORT COMMISSION
17
3. Airline Strategy and the Role of the Hub Figure 6: Boeing Fleet Mix Forecast2
6%
70%
13%
9% 2%
2032
13%
64%
12%
7% 4%
2012
Regional Jet
Single-aisle
Small wide-body
Medium wide-body
Large wide-body
21,310 airframes
41,240 airframes
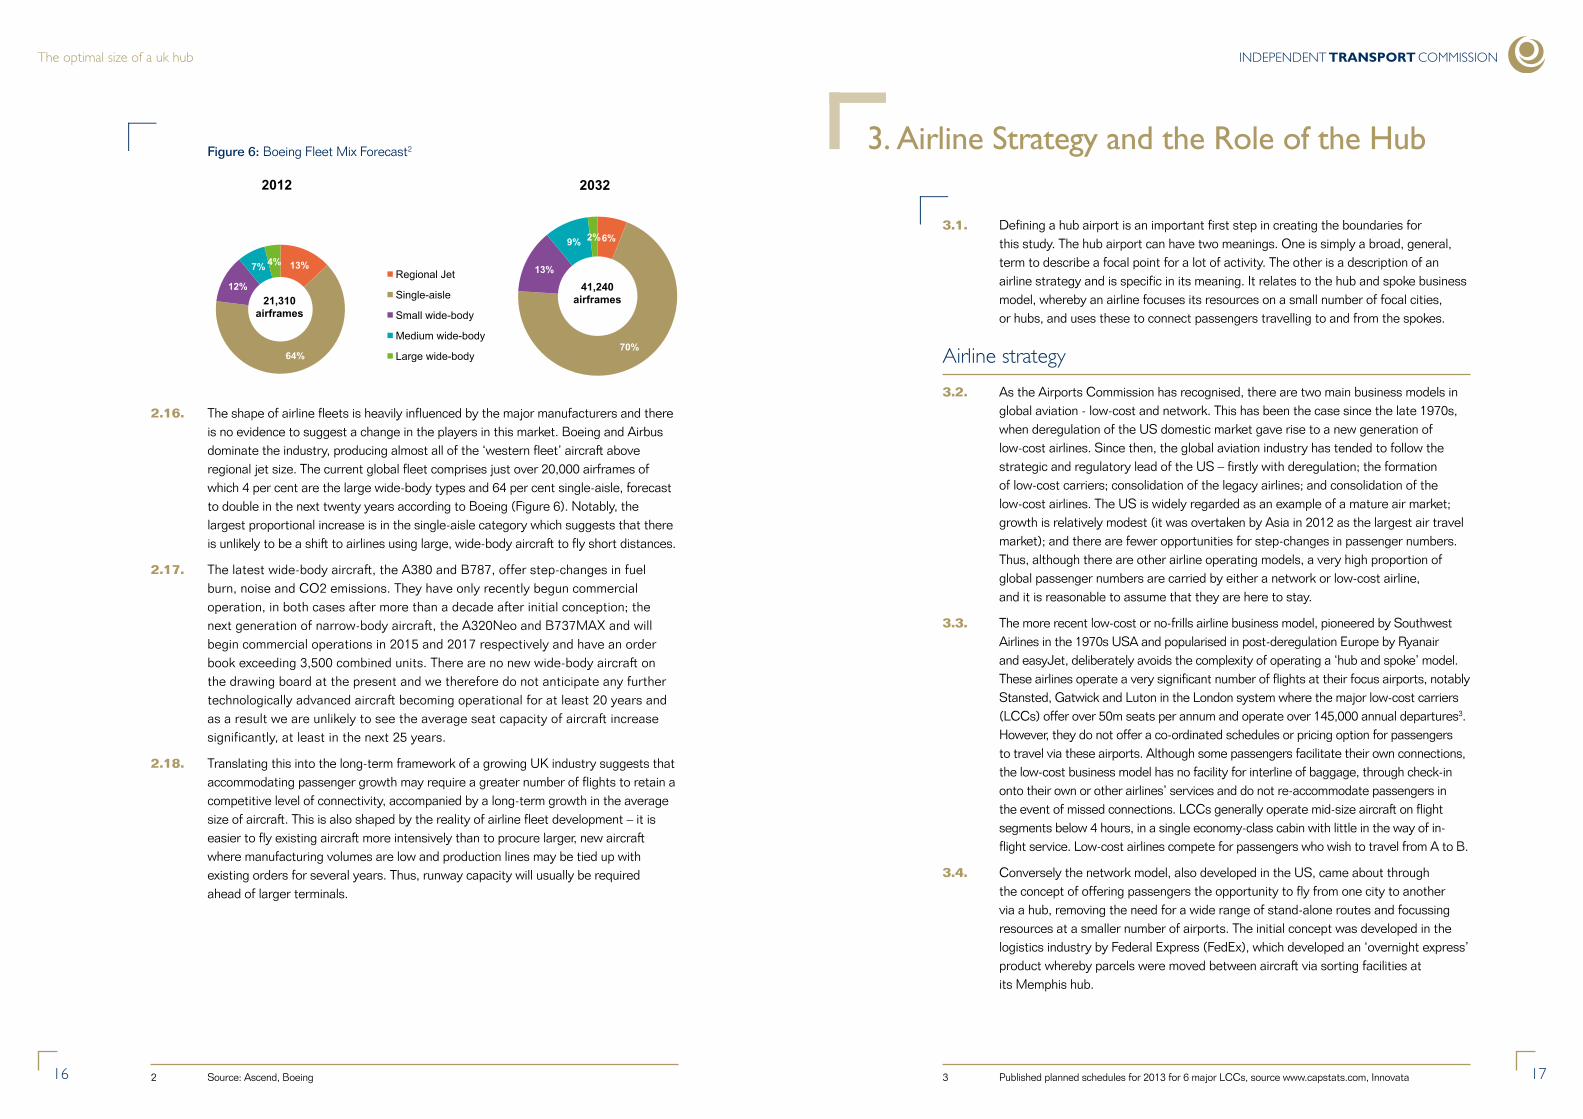
2.16. The shape of airline fleets is heavily influenced by the major manufacturers and there is no evidence to suggest a change in the players in this market. Boeing and Airbus dominate the industry, producing almost all of the ‘western fleet’ aircraft above regional jet size. The current global fleet comprises just over 20,000 airframes of which 4 per cent are the large wide-body types and 64 per cent single-aisle, forecast to double in the next twenty years according to Boeing (Figure 6). Notably, the largest proportional increase is in the single-aisle category which suggests that there is unlikely to be a shift to airlines using large, wide-body aircraft to fly short distances.
2.17. The latest wide-body aircraft, the A380 and B787, offer step-changes in fuel burn, noise and CO2 emissions. They have only recently begun commercial operation, in both cases after more than a decade after initial conception; the next generation of narrow-body aircraft, the A320Neo and B737MAX and will begin commercial operations in 2015 and 2017 respectively and have an order book exceeding 3,500 combined units. There are no new wide-body aircraft on the drawing board at the present and we therefore do not anticipate any further technologically advanced aircraft becoming operational for at least 20 years and as a result we are unlikely to see the average seat capacity of aircraft increase significantly, at least in the next 25 years.
2.18. Translating this into the long-term framework of a growing UK industry suggests that accommodating passenger growth may require a greater number of flights to retain a competitive level of connectivity, accompanied by a long-term growth in the average size of aircraft. This is also shaped by the reality of airline fleet development – it is easier to fly existing aircraft more intensively than to procure larger, new aircraft where manufacturing volumes are low and production lines may be tied up with existing orders for several years. Thus, runway capacity will usually be required ahead of larger terminals.
3.1. Defining a hub airport is an important first step in creating the boundaries for this study. The hub airport can have two meanings. One is simply a broad, general, term to describe a focal point for a lot of activity. The other is a description of an airline strategy and is specific in its meaning. It relates to the hub and spoke business model, whereby an airline focuses its resources on a small number of focal cities, or hubs, and uses these to connect passengers travelling to and from the spokes.
Airline strategy
3.2. As the Airports Commission has recognised, there are two main business models in global aviation - low-cost and network. This has been the case since the late 1970s, when deregulation of the US domestic market gave rise to a new generation of low-cost airlines. Since then, the global aviation industry has tended to follow the strategic and regulatory lead of the US – firstly with deregulation; the formation of low-cost carriers; consolidation of the legacy airlines; and consolidation of the low-cost airlines. The US is widely regarded as an example of a mature air market; growth is relatively modest (it was overtaken by Asia in 2012 as the largest air travel market); and there are fewer opportunities for step-changes in passenger numbers. Thus, although there are other airline operating models, a very high proportion of global passenger numbers are carried by either a network or low-cost airline, and it is reasonable to assume that they are here to stay.
3.3. The more recent low-cost or no-frills airline business model, pioneered by Southwest Airlines in the 1970s USA and popularised in post-deregulation Europe by Ryanair and easyJet, deliberately avoids the complexity of operating a ‘hub and spoke’ model. These airlines operate a very significant number of flights at their focus airports, notably Stansted, Gatwick and Luton in the London system where the major low-cost carriers (LCCs) offer over 50m seats per annum and operate over 145,000 annual departures3. However, they do not offer a co-ordinated schedules or pricing option for passengers to travel via these airports. Although some passengers facilitate their own connections, the low-cost business model has no facility for interline of baggage, through check-in onto their own or other airlines’ services and do not re-accommodate passengers in the event of missed connections. LCCs generally operate mid-size aircraft on flight segments below 4 hours, in a single economy-class cabin with little in the way of in-flight service. Low-cost airlines compete for passengers who wish to travel from A to B.
3.4. Conversely the network model, also developed in the US, came about through the concept of offering passengers the opportunity to fly from one city to another via a hub, removing the need for a wide range of stand-alone routes and focussing resources at a smaller number of airports. The initial concept was developed in the logistics industry by Federal Express (FedEx), which developed an ‘overnight express’ product whereby parcels were moved between aircraft via sorting facilities at its Memphis hub.
6%
70%
13%
9% 2%
2032
13%
64%
12%
7% 4%
2012
Regional Jet
Single-aisle
Small wide-body
Medium wide-body
Large wide-body
21,310 airframes
41,240 airframes
6%
70%
13%
9% 2%
2032
13%
64%
12%
7% 4%
2012
Regional Jet
Single-aisle
Small wide-body
Medium wide-body
Large wide-body
21,310 airframes
41,240 airframes
2 Source: Ascend, Boeing 3 Published planned schedules for 2013 for 6 major LCCs, source www.capstats.com, Innovata

INDEPENDENT TRANSPORT COMMISSIONThe optimal size of a uk hub
1918
Figure 8: Comparison of Capacity Trend at UK airports to UAE and Asia
0
500,000
1,000,000
1,500,000
2,000,000
2,500,000
3,000,000
3,500,000
4,000,000
4,500,000
0% 10% 20% 30% 40% 50% 60% 70% 80% 90%
100%
2003 2004 2005 2006 2007 2008 2009 2010 2011 2012 2013
Tota
l dep
artin
g se
ats
London Regions Total departing seats
0
500,000
1,000,000
1,500,000
2,000,000
2,500,000
3,000,000
3,500,000
4,000,000
0% 10% 20% 30% 40% 50% 60% 70% 80% 90%
100%
2003 2004 2005 2006 2007 2008 2009 2010 2011 2012 2013
Tota
l dep
artin
g se
ats
London Regions Total departing seats
0
500,000
1,000,000
1,500,000
2,000,000
2,500,000
3,000,000
3,500,000
4,000,000
4,500,000
0% 10% 20% 30% 40% 50% 60% 70% 80% 90%
100%
2003 2004 2005 2006 2007 2008 2009 2010 2011 2012 2013
Tota
l dep
artin
g se
ats
London Regions Total departing seats
0
500,000
1,000,000
1,500,000
2,000,000
2,500,000
3,000,000
3,500,000
4,000,000
0% 10% 20% 30% 40% 50% 60% 70% 80% 90%
100%
2003 2004 2005 2006 2007 2008 2009 2010 2011 2012 2013
Tota
l dep
artin
g se
ats
London Regions Total departing seats
3.8. The strong performance of air services to the Middle East is in contrast to the provision of capacity from the UK to selected key markets in Asia, shown in Figure 8 above. The home-based airlines have a very different strategy, focussing on intra-Asia regional development and strengthening frequency on a smaller number of intercontinental hubs. Despite rapid traffic growth within and to/from Asia, capacity to the UK has remained static over the last decade and the proportion of non-stop scheduled flights from the UK regional airports to China, Singapore, Thailand and Hong Kong had dropped from 5 per cent to zero by 2011.
The role of transfer traffic
3.9. Transfer traffic plays a vital role in the development of hub airports. It has underpinned the rapid development of Dubai International Airport which is now the fastest growing airport in the world, as noted by the Airports Commission which identified that the local population of around 2 million would be unable to support the diverse route network at Dubai without the addition of international transfer traffic. This large network of routes is also an enabler of inbound investment in Dubai by overseas companies who place a high importance on the availability of frequent, non-stop flights when looking to establish a Middle East regional office.
3.5. The major competitive traffic flows from Europe at present are to and from North America and Asia. Competition for passenger flows exists between the European flag carriers seeking to transport passengers via their hubs; the big three US international carriers; the Asian majors; and in recent times the Middle East Big 3 (MEB3) - Emirates, Etihad and Qatar Airways. These well-funded carriers have undertaken a huge expansion in the last decade and with large forward order-books, shown in Figure 7, have clear aspirations to capture traffic flows between Europe and Asia.
Figure 7: Confirmed Forward Orders - MEB3 and Turkish Airlines v UK Long-haul Carriers
0
50
100
150
200
250
300
350
400
450
Emirates Qatar Airways Etihad Turkish Airlines IAG (Incl British Airways)
Virgin Atlantic
Confirmed Orders
Current Fleet
MEB3: +578
3.6. The final player in the west-to-east market is Turkish Airlines, another network carrier that has a massive forward order book. The recent announcement of the construction of a new, third airport in Istanbul capable of handling up to 150mppa is a clear message of confidence in the strength of the Turkish market. It also reflects the facilities that have been, or are in development at Abu Dhabi, Doha and Dubai airports, home of the MEB3 and where these airlines will deploy their new equipment.
3.7. The data in Figure 8 shows how seat capacity has changed over the period 2003-2013 from the UK to the United Arab Emirates (left) and Singapore, China, Thailand and Hong Kong (right). Not only has the amount of capacity doubled from the UK to the UAE, the share from regional airports has increased from 16 per cent in 2003 to 35 per cent by 2013. This is driven by the strategy of Emirates and Etihad to add European regional airports as spokes on their hub networks, resulting in service increases to Birmingham, Manchester, Newcastle, Glasgow and Edinburgh airports.

INDEPENDENT TRANSPORT COMMISSIONThe optimal size of a uk hub
2120
The importance of business travel
3.13. Although traffic volume tends to come from the leisure sector, the stronger airline revenues are generated by the business traveller. The CAA study into the UK business air travel market5 confirmed that network density and flight frequency were crucial for airlines in bidding and winning corporate travel contracts. The study comments that “airlines operating a greater number of frequencies of flights should, in principle, be able to attract a greater proportion of (higher yielding) time-sensitive passengers” and that the decision making process as to which airline to use, for half of the short-haul business travellers surveyed at Heathrow, were:
• Timing of flight
• Direct (non-stop) route
• Availability
3.14. Large businesses often have a diverse range of destinations to which staff must travel, and therefore airlines flying more routes have a greater likelihood of winning the lucrative corporate travel contracts. This need to attract high value customers, particularly on long-haul flights which are more costly to operate, spawned global airline alliances as carriers sought to increase their overseas reach through commercial agreements with partners in other countries. Building a network of routes coupled with alliance participation enables an airline to minimise the risk of starting new routes, because adding a single new route into the hub creates multiple new combinations of flight itinerary.
3.15. Airlines need a mix of business, leisure, point-to-point and connecting traffic to maximise passenger numbers and revenue year round and this explains why there is a greater concentration of long-haul flights at hub airports. Flying at high frequency on a route creates a more attractive proposition for the point-to-point business traveller, but this segment make up less than 30 per cent of all passengers. Thus, while managing to capture a higher proportion of the higher value customers through adding flight frequency, the airline is adding a greater number of available seats into the market. Filling these seats, even if covering marginal cost only, is far preferable to flying empty; and so airlines fill these with connecting passengers. Good frequency in turn attracts point-to-point business passengers and can allow significantly improved connecting possibilities – a virtuous circle6.
3.16. The same study provides a useful analysis of the role of business and connecting passengers in the top five routes by volume from Heathrow. The routes into Dubai and Hong Kong, hubs for Emirates and Cathay Pacific respectively, have the highest proportion of connecting traffic amongst the business and total categories, with over 60 per cent of passengers making a connection at one end of the route as shown in Figure 10. This demonstrates that even high volume routes with high proportions of business travel also carry quite significant levels of connecting traffic across the year.
3.10. Analysis of the Emirates services from the UK to Dubai suggests 76 per cent of passengers from London, 77 per cent from Newcastle and 84 per cent from Manchester are connecting to destinations in Africa, Asia and Australasia rather than terminating at Dubai4. Arguably a very large number of passengers are being lost from the UK airport system to overseas hubs such as Dubai because of the lack of capacity at the UK hub, leading to our regional airports being added as spokes to the hubs of these carriers.
3.11. Markets where local demand is weak are not just confined to countries or cities with a comparatively low population. Underlying demand from the UK to secondary cities in the BRIC countries is currently modest and in most instances not yet large enough to justify frequent non-stop services, but adding transfer traffic from other points may be the difference between an airline launching a route and choosing to do something different. New routes typically take time to move from loss to profit and as airlines will always target their resources at the most profitable opportunities, adding a frequency to an existing profitable destination is more attractive than launching a completely new route in a heavily constrained environment.
3.12. Transfer traffic can have a very significant impact on the point at which a new service becomes viable. The example shown in Figure 9 shows routes with 50 per cent transfer passengers becoming viable 14 years sooner than those with none. This is based on:
• Annual market size of 125,000 passengers – equivalent to single daily long-haul service operating at an on-board load factor of 80 per cent
• 50 per cent transfer and 50 per cent local traffic equates to a local market of 62,500
• With zero transfer traffic, the route would require 14 years of growth at 5 per cent per annum for the 62,500 market to reach 125,000
Figure 9: Effect of Transfer Traffic on Route Viability
50% 40% 30% 20% 10%
0
0.1
0.2
0.3
0.4
0.5
0.6
0.7
0.8
0.9
-14 -13 -12 -11 -10 -9 -8 -7 -6 -5 -4 -3 -2 -1 0
On
Boa
rd L
oad
Fact
or
5 CAP796 “Flying on Business – a Study of the UK Business Travel Market” November 2011
6 CAP796, para 6.314 Source: CAA Surveys

INDEPENDENT TRANSPORT COMMISSIONThe optimal size of a uk hub
2322
Figure 11: Combined British Airways and American Airlines Networks, Chicago and Heathrow
3.19. The map in Figure 11 shows the combined network of domestic and intra-EU routes served by British Airways and American Airlines from their Heathrow and Chicago hubs, which are connected with four daily flights in the off-peak months and six in the summer peak. With a transatlantic joint-venture, similar to those of Lufthansa-United and Air France-Delta, these alliances enable airlines to offer a vast array of connecting options via their hub airports. A new entrant looking to compete on the London to Chicago market, without an alliance partner, will be reliant on the local market only and face a very challenging competitive landscape.
3.20. The hub model enables an airline to focus resources at a small number of airports – often one – thereby gaining significant economies of scale. In this respect, it is similar to the strategy adopted by any corporate multi-national firm in centralising production at a small number of sites and operating one global head-office. By co-ordinating flight schedules, the airline is able to maximise utilisation of its aircraft; ensure ground staff and flight crew usage is optimised; minimise redundant ground-time; and move passengers quickly between aircraft. It also results in a significant increase in the number of active city-pairs the airline, particularly when compared to the coverage of a point-to-point airline, widening the revenue coverage for the carrier.
Figure 10: Traffic Analysis, Largest Business Markets from London
Of Total Of Connecting Passengers
% On Business % on Business % of Total
New York 19% 37% 43%
Dubai 22% 61% 66%
Hong Kong 23% 60% 60%
Tokyo 28% 46% 49%
Boston 28% 46% 45%
Why do airlines use the hub model?
3.17. The airline hub developed as a radial network of routes from an airport partly as a result of the regulation of air services. Bilateral inter-government treaties granted airlines the right to fly international services between each other, but not those of third-countries, for example the UK and USA would negotiate for UK and US registered airlines to fly between the two countries; but would not enable an airline of a third party to do the same. This resulted in each national airline only being able to develop services from its home country; and usually from the principal or capital city. Although there have been progressive moves to deregulate air service agreements over time7, international air services are still subject to various regulations and restrictions.
3.18. Consequently, the hub airport tends to be a national capital city or primary business destination and almost all network carriers build their hub in their home country. Other than the MEB3, there are no examples of a new network carrier coming into being in the last 20 years or more; and there have been no new network carriers in Europe since the Second World War other than those created from merger or through acquisition. The barriers to entry are almost insurmountable without enormous financial backing and this is very unlikely to change. To replicate the network density and marketing power of a major global carrier; ensure alliance membership; secure sufficient slots; obtain traffic rights; and a fleet of aircraft to launch a rival network, seems a very steep challenge.
7 the intra-EU market is a liberalised but for EU airlines only
ATLANTIC OCEAN
INDEPENDENT TRANSPORT COMMISSIONThe optimal size of a uk hub
2524
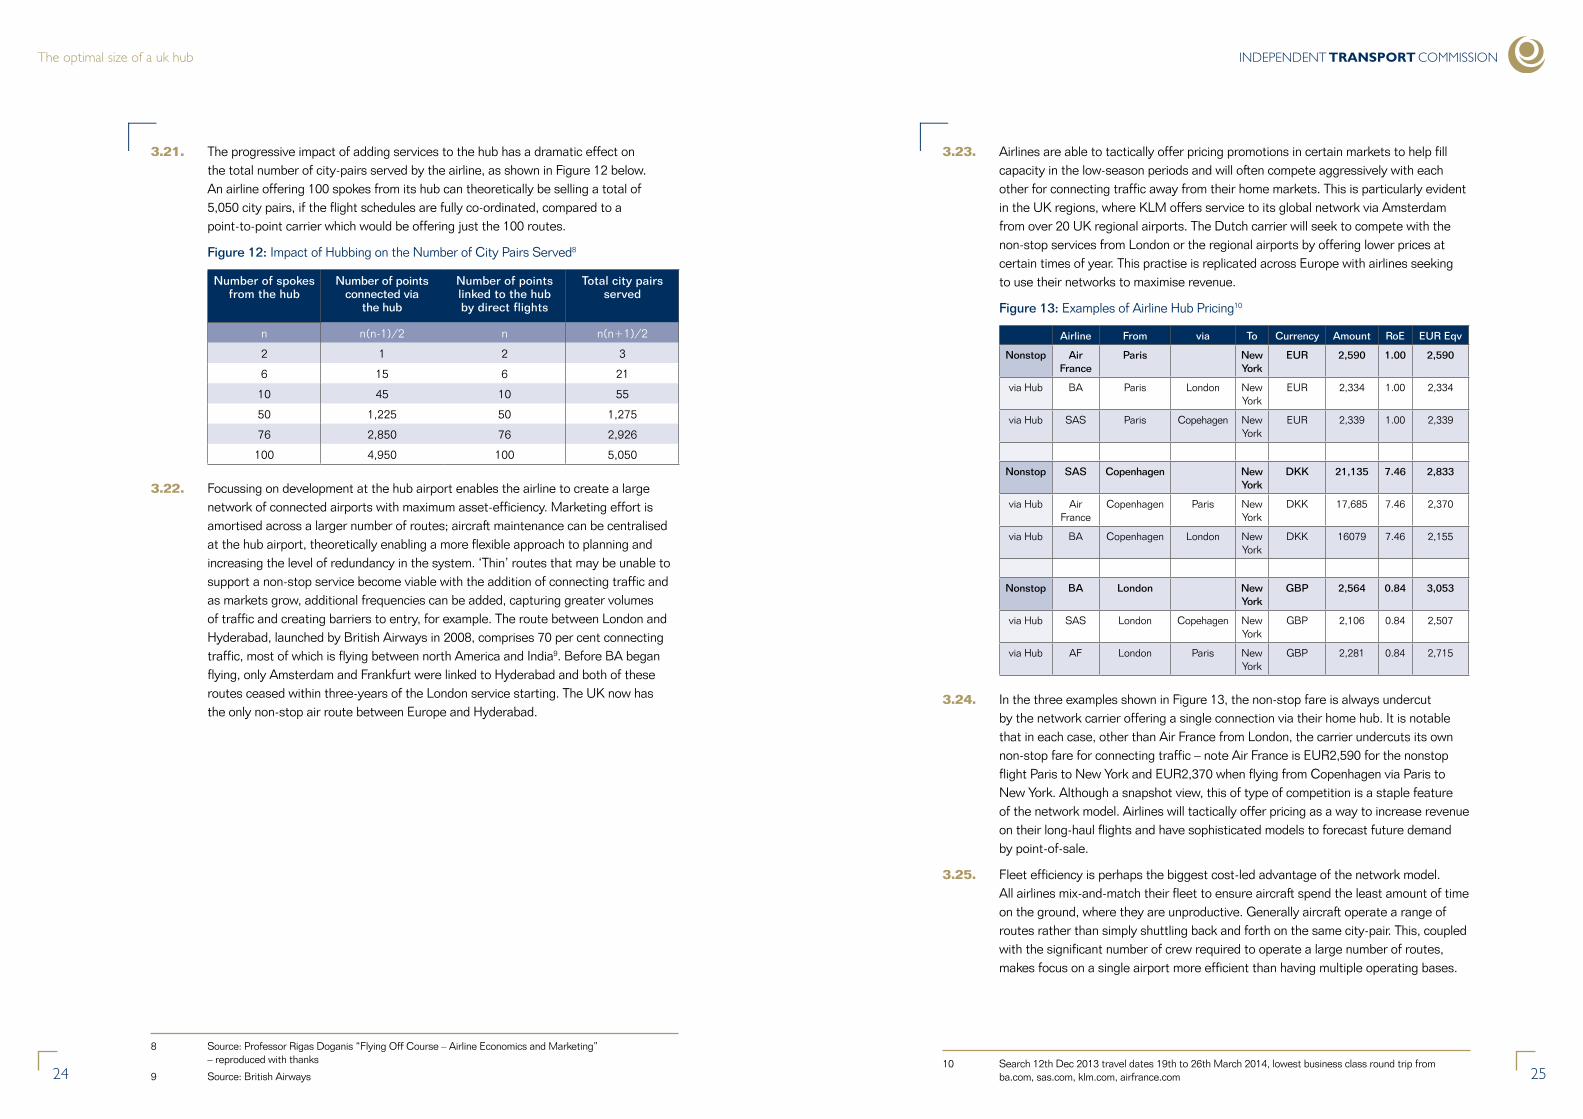
3.23. Airlines are able to tactically offer pricing promotions in certain markets to help fill capacity in the low-season periods and will often compete aggressively with each other for connecting traffic away from their home markets. This is particularly evident in the UK regions, where KLM offers service to its global network via Amsterdam from over 20 UK regional airports. The Dutch carrier will seek to compete with the non-stop services from London or the regional airports by offering lower prices at certain times of year. This practise is replicated across Europe with airlines seeking to use their networks to maximise revenue.
Figure 13: Examples of Airline Hub Pricing10
Airline From via To Currency Amount RoE EUR Eqv
Nonstop Air France
Paris New York
EUR 2,590 1.00 2,590
via Hub BA Paris London New York
EUR 2,334 1.00 2,334
via Hub SAS Paris Copehagen New York
EUR 2,339 1.00 2,339
Nonstop SAS Copenhagen New York
DKK 21,135 7.46 2,833
via Hub Air France
Copenhagen Paris New York
DKK 17,685 7.46 2,370
via Hub BA Copenhagen London New York
DKK 16079 7.46 2,155
Nonstop BA London New York
GBP 2,564 0.84 3,053
via Hub SAS London Copehagen New York
GBP 2,106 0.84 2,507
via Hub AF London Paris New York
GBP 2,281 0.84 2,715
3.24. In the three examples shown in Figure 13, the non-stop fare is always undercut by the network carrier offering a single connection via their home hub. It is notable that in each case, other than Air France from London, the carrier undercuts its own non-stop fare for connecting traffic – note Air France is EUR2,590 for the nonstop flight Paris to New York and EUR2,370 when flying from Copenhagen via Paris to New York. Although a snapshot view, this of type of competition is a staple feature of the network model. Airlines will tactically offer pricing as a way to increase revenue on their long-haul flights and have sophisticated models to forecast future demand by point-of-sale.
3.25. Fleet efficiency is perhaps the biggest cost-led advantage of the network model. All airlines mix-and-match their fleet to ensure aircraft spend the least amount of time on the ground, where they are unproductive. Generally aircraft operate a range of routes rather than simply shuttling back and forth on the same city-pair. This, coupled with the significant number of crew required to operate a large number of routes, makes focus on a single airport more efficient than having multiple operating bases.
3.21. The progressive impact of adding services to the hub has a dramatic effect on the total number of city-pairs served by the airline, as shown in Figure 12 below. An airline offering 100 spokes from its hub can theoretically be selling a total of 5,050 city pairs, if the flight schedules are fully co-ordinated, compared to a point-to-point carrier which would be offering just the 100 routes.
Figure 12: Impact of Hubbing on the Number of City Pairs Served8
Number of spokes from the hub
Number of points connected via
the hub
Number of points linked to the hub by direct flights
Total city pairs served
n n(n-1)/2 n n(n+1)/2
2 1 2 3
6 15 6 21
10 45 10 55
50 1,225 50 1,275
76 2,850 76 2,926
100 4,950 100 5,050
3.22. Focussing on development at the hub airport enables the airline to create a large network of connected airports with maximum asset-efficiency. Marketing effort is amortised across a larger number of routes; aircraft maintenance can be centralised at the hub airport, theoretically enabling a more flexible approach to planning and increasing the level of redundancy in the system. ‘Thin’ routes that may be unable to support a non-stop service become viable with the addition of connecting traffic and as markets grow, additional frequencies can be added, capturing greater volumes of traffic and creating barriers to entry, for example. The route between London and Hyderabad, launched by British Airways in 2008, comprises 70 per cent connecting traffic, most of which is flying between north America and India9. Before BA began flying, only Amsterdam and Frankfurt were linked to Hyderabad and both of these routes ceased within three-years of the London service starting. The UK now has the only non-stop air route between Europe and Hyderabad.
8 Source: Professor Rigas Doganis “Flying Off Course – Airline Economics and Marketing” – reproduced with thanks
9 Source: British Airways10 Search 12th Dec 2013 travel dates 19th to 26th March 2014, lowest business class round trip from
ba.com, sas.com, klm.com, airfrance.com

INDEPENDENT TRANSPORT COMMISSIONThe optimal size of a uk hub
2726
3.26. Based on a two-hour turnaround at each end of the route, long-haul services over about 9 ½ hours flight time require two different aircraft in order to maintain a daily flight frequency, and so having a large fleet based at the same airport offers greater opportunities for airline planners to schedule flights at the same time each day but with different aircraft. Figure 14 below shows two weeks in the life of two long-haul aircraft. One is a BA B747 based at London Heathrow; the other is a Cathay Pacific B777 based at Hong Kong. Both of these aircraft flew between Heathrow and Hong Kong on the same day, but mapping their movement in the two weeks prior to that shows not only the vast mileage covered but also the diversity of routes served. It is particularly notable with the Cathay aircraft which, in addition to visiting Europe and North America, undertook three comparatively short flights to Bangkok, Manila and Taipei to maximise utilisation.
Figure 14: Two Weeks in the Life of a Long-Haul Aircraft
3.27. The final strength of the hub model is in the efficient carriage of freight. Wide-body aircraft used for long-haul routes are able to carry large volumes of cargo in addition to their passenger load, whereas narrow-body aircraft as used by LCCs and point-to-point airlines often carry little or no freight. Within the UK, this has led to Heathrow handling over 60 per cent of cargo by weight, 1.46mt, despite having almost no dedicated freighter services.
3.28. Over the ten years to 2011, Heathrow grew market share of UK freight tonnage; East Midlands, which has dedicated hubs for the large integrators DHL and UPS, also increased market share; while other London and UK airports declined. Gatwick saw a 50 per cent drop in tonnage handled between 2006 and 2008, when a number of US carriers moved passenger operations to Heathrow.
Figure 15: Cargo Tonnage by Volume at UK Airports, 2001 to 201111
0% 10% 20% 30% 40% 50% 60% 70% 80% 90%
100%
2001 2002 2003 2004 2005 2006 2007 2008 2009 2010 2011
Heathrow East Midlands Other London Other UK
3.29. Belly-hold cargo requires specialist facilities to load, transfer and warehouse large volumes and for airlines the ability to centralise this at a hub facility is important, particularly as freight contributes anywhere from 7 per cent to 25 per cent to airline revenues12. According to latest financial statements, cargo revenues at Virgin Atlantic account for 11 per cent of total income and have consistently been greater than the airline’s operating profit.
Limitations of the point-to-point long-haul model
3.30. Developments in new airframes, particularly the fuel-efficient, mid-size long-haul types such as the B787 and A350, offer airlines lower operating cost and greater range than their predecessors, and therefore may open alternative opportunities for airlines. One option is for carriers to serve thinner long-haul routes, cutting out hub airports; the other is for airlines to launch ultra-long-haul routes that are beyond the range of current aircraft. As a result of these technology improvements, the new aircraft have been heralded as potential game-changers in the future development of long-haul services, offering airlines the scope to fly less-dense markets with direct services. As hubs become more congested, regional and secondary airports have an opportunity to absorb some of the latent demand through provision of services to some of the key markets. Conceptually, connecting traffic may gradually be replaced by non-stop flights that bypass hubs, leading to a dispersed rather than concentrated network of long-haul routes. This would reduce the amount of connecting traffic using the UKs hub airport and may reduce the ability of a network carrier to add extra destinations supported by connecting traffic.
11 Source: UK CAA
12 Freight revenue range - IAG, including British Airways – 7%. Cathay Pacific, 25%. Source Flightglobal.com
ATLANTIC OCEAN
PACIFIC OCEAN
INDIAN

INDEPENDENT TRANSPORT COMMISSIONThe optimal size of a uk hub
2928
3.31. However, the benefits of being part of a hub-and-spoke model are such that for smaller airlines it often makes better sense to join a global Alliance than to attempt to operate entirely independently without ready access to transfer passengers, synchronised timetables etc. As national regulatory restrictions have eased there has therefore been a process of consolidation around three major global alliances, all using the hub and spoke model, and operating most efficiently when they base their services around a single hub in each part of the world.
3.32. This means in turn that airports which don’t serve as a primary hub for a major airline or airline alliance tend to remain global “spokes” rather than true hubs, even if capacity is not a major constraint. Given the number of existing major hubs in western Europe, and the existence of only three global Alliances, it is implausible to assume that there could in practice be two London airports both operating as genuine global hubs. This raises a question about the Airports Commission modelling of its dispersed option, since it appears that this assumes both London airports would be hubs
3.33. Thus, our view is that neither the point-to-point nor additional hub models are likely to develop on a scale that would materially change the global hub airport model. Ultra-long-haul routes have proved very difficult to sustain on aircraft flying at sub-sonic speeds, in part because of passenger reaction to spending extreme amounts of time in the air.
3.34. The concept of very long-haul, thin routes between two non-hub cities is a long way off. An airline seeking to fly a daily service between Glasgow and Vancouver would require two dedicated aircraft if neither airport was a hub for the airline, which would translate to significantly higher operating costs than if the route were operated from a hub, as the full cost of aircraft ownership would accrue to one single, low-utilisation route. There may be limited opportunities at the margins for these routes to become sustainable but without a large-scale and highly risky new entry the hub model is very likely to remain the preferred strategy for the inter-continental air carriers.
3.35. The longest 30 air routes currently flown are all to or from hub airports, suggesting that the new generation of long-haul aircraft are far more likely to be used to fly low-volume routes from hub airports than bypassing hubs altogether – a recent example being the launch of the first inter-continental flight from Austin, Texas, by British Airways into Heathrow. However, Singapore Airlines dropped the world’s longest non-stop flight, a 19-hour marathon between Singapore and New York, after a decade of operation in 2013 citing lack of demand. To date there is no evidence that major airlines favour hub-bypass or ultra long-haul services and the various mergers amongst US major carriers has consolidated rather than diversified the use of the hub model for long-haul.
3.36. The launch of new routes may be from a UK hub to overseas secondary airports or emerging markets; or to UK regional or secondary airports from overseas hubs. In terms of connectivity, the former offers a greater level of additionality for the UK than the latter. The main cost advantage of the latest aircraft is through improvements in fuel economy - in all cases they offer lower fuel-burn than the aircraft they replace, in some instances by up to 25 per cent per-available seat. Against this, lease rates are higher than for old aircraft and, crucially, the savings in fuel-burn are more than offset by increases in fuel prices.
Figure 16: Operating Cost Comparison, 2000 to 2014: Boeing 767 v Boeing 787
0
50
100
150
200
250
0
5000
10000
15000
20000
25000
30000
35000
40000
2000 2001 2002 2003 2004 2005 2006 2007 2008 2009 2010 2011 2012 2013 2014
Ave
rage
Fue
l Cos
t per
Sea
t
Fuel
Cos
t per
Sec
tor i
n U
SD
Fuel Cost Comparison, 7 Hour Flight - B767 v B787
B787 per Seat B767 per Seat B787 Sector Cost B767 Sector Cost
2014 Fuel Cost per Seat, B787
3.37. The cost of Jet A1 has trebled in the last decade alone13 and so while lower fuel burn is critically important in helping airlines manage their costs, new aircraft types do not offer a step-change in operating cost compared to a decade ago.
3.38. Figure 16 shows the evolution of absolute and per-seat fuel cost of the B767 and B78714, on a 7 hour flight using average (nominal) fuel prices for the years 2000 to 2014. The B787, which entered commercial service in 2012, has an absolute cost advantage over the older aircraft of around 15 per cent and with 10 per cent more seats generates a 25 per cent cost saving per available seat. However, the sharp rise in fuel prices over the period means that projected fuel costs per seat for the B787 in 2014 is the same as the B767 was in 2007; and for each year before 2007, the B767 was considerably cheaper to operate. So, while the new aircraft types are undoubtedly more efficient, they are unable to off-set the impact of increasing fuel costs. In the foreseeable future, a sharp reduction in fuel prices will have a far greater impact on the strategic development of airlines than the next generation of aircraft. However, the fuel prices underpinning the Airports Commission forecasts, which are based on oil price projections of the International Energy Agency, show a continued rise in the cost of oil over the period to 2050, suggesting a low-fuel cost scenario extremely unlikely. Moves to a de-carbonised environment are unlikely to reduce operating economics. Jet fuel is subject to inclusion in the European ETS, and biofuels are currently far more expensive than the fossil fuel alternative.
3.39. As previously discussed, the hub model offers powerful economics of scale, evidenced by the increasing consolidation in mature markets. It benefits from the on-going regulatory protection offered in some markets to their national carriers; offers significant efficiencies in staff and equipment utilisation; and additional opportunities to boost revenue through the carriage of freight via a central distribution facility at the hub. Non-European airlines may use smaller, more efficient aircraft to feed the UK and other European regions from their hubs as a complement to hub-to-hub flights but a highly dispersed network model that eliminates hubs at both ends of the route, and is able to compete with the array of connecting options offered by the major network carriers, is not something that we see happening in the medium-term.
13 Source: US Energy Information Administration
14 Source: routepro.net

INDEPENDENT TRANSPORT COMMISSIONThe optimal size of a uk hub
3130
Airport development
3.40. Development of airport facilities is often undertaken in consultation with the major customers and generally reflects the type of airline customers that are present at the airport. Terminal 5 at London Heathrow is an example of an airport operator developing a piece of infrastructure for, and in conjunction with, its key customer, British Airways; and to this extent, an airport’s market segment is defined by the airlines that fly there. Conversely, new airports are often built to accommodate the anticipated airline users. They may, for example, have a low-cost terminal with simpler facilities for use by LCCs or a major integrated freight terminal to attract cargo carriers. Mostly, the intended airline customers move or set up operations at the new airport. The ‘new’ Hong Kong airport at Chep Lap Kok is an example of an entirely new airport facility being developed with the aim of servicing a major network carrier, Cathay Pacific, and also to become Asia’s leading cargo airport, both objectives being achieved. In this case, the old Kai Tak airport was closed once the new facility became operational, leaving airlines the simple choice to move or stop serving Hong Kong.
3.41. In some cases, however, the airport doesn’t attract the intended airline type, Stansted Airport being perhaps the most obvious example within the UK. The airport was re-developed in the late 1980s with a state of the art new terminal, the intention being to relieve congestion at Heathrow and Gatwick by providing a high-standard airport capable of handling long and short-haul services operated by network carriers. For a short while it succeeded in attracting long-haul operations but these were withdrawn for commercial and strategic reasons in the late 1990s and the airport has remodelled itself to become the largest base on Ryanair’s network and the airport serving the third largest number of low-cost airlines in Europe15.
3.42. There are various examples of airports being speculatively built on the basis of future demand, only for the airline customers to refuse to move. The most notable is probably Montreal Mirabel, constructed in the mid-1970s to replace Dorval Airport and at the time the world’s largest airport by land volume. In spite of regulation forcing all international flights to use the airport – unthinkable in the modern era – its location 24 miles from the city centre meant it was unpopular with travellers and airlines. In 1997, the legislation changed, enabling international flights to begin using the old Dorval Airport (now Pierre Elliott Trudeau International) and Mirabel rapidly lost all of its passenger services. It is now a cargo-only facility.
3.43. Even in Dubai, where Dubai International Airport has been developed in conjunction with the rapidly growing home-carrier Emirates, building the new airport will be undertaken in stages. The current Dubai airport is the second largest in the world when measured by ASKs, behind Heathrow, and has grown from 15mppa in 2002 to 58mppa in 2012 making it the fastest growing major airport globally. A new facility has already been constructed at Jebel-Ali, planned to be the world’s first aerotrpolis, capable of handling 160mppa on a 220 km2 site. However the airport has been initially constructed with a single runway, terminal capable of handling 5mppa and will be expanded as demand increases. Without Emirates moving its flights over to the new site, there is no hope of the airport ever achieving its grand aspiration.
3.44. Developing a larger or new airport is no guarantee that it will operate as a hub within the airline definition and may not, therefore, bring about passenger connections, facilitate additional flights and bring about the wider economic benefits that the UK requires. Although the hub model is favoured by a number of airlines, there are other factors that will influence whether an airport within Europe can successfully operate as a hub. It must have:
• reasonable and competitive fees and charges;
• no competing, operational hub close by;
• a strong local catchment;
• well managed airspace;
• a supportive regulatory regime; and
• a major global airline or Alliance willing to base most or all of its hub there and not simply use the airport as another spoke.
15 Measured by Available Seat Kilometres (ASKs), 2013. Source www.capstats.com and Innovata

The optimal size of a uk hub
4.1. Previous research published by ITC focuses on the importance of developing a wider range of non-stop, long-haul services to global cities, in particular emerging market destinations. High frequency short-haul and (minimum) daily long-haul, non-stop services are important in supporting the needs of UK-based business travellers and the future UK hub should accommodate flights to these destination types.
4.2. In recent years, the number of direct long-haul connections from the UK has remained stagnant and from Heathrow the numbers have fallen. Indeed, when looking at the number of routes flown from the world’s 25 busiest airports, Heathrow is bottom of the list when sorted by relative shift in destinations since 2005.
4.3. In spite of being the largest airport by ASKs, Heathrow has seen the largest relative decline in routes served in the last eight years and is one of only two airports that have seen a decrease in destinations served over this period16. Notably, Heathrow is also only mid-way in terms of absolute number of destinations served, 176, and falls well behind Frankfurt, which lost four destinations but at 294 is the best connected airport in the world. Worryingly for the UK, Heathrow lags behind the other European hubs airports for the number of destinations flown, though the broader picture suggests that the major growth over this period has not been seen in Europe. Other major European hubs have seen fewer new routes than their Middle East and Asian counterparts with Madrid (10th) seeing the greatest number of new routes.
32
4. Connectivity
16 Non-stop services only
INDEPENDENT TRANSPORT COMMISSION
33
Figure 17: Change in the Number of Destinations, 2013 v 2005 at World’s Top 25 Airports17
Domestic International Total
Rank Airport 2005 2013 % change 2005 2013 %
change 2005 2013 Difference % change
22 Istanbul - Ataturk
Airport17 37 118% 108 200 85% 125 237 112 90%
2 Dubai Airport 2 2 0% 118 218 85% 120 220 100 83%
6 Shanghai -
Pu Dong Airport40 85 113% 65 86 32% 105 171 66 63%
17 Sao Paulo - Guarulhos
International Airport27 44 63% 37 54 46% 64 98 34 53%
12 Beijing - Capital
Airport93 116 25% 55 106 93% 148 222 74 50%
8 Seoul - Incheon
International Airport3 4 33% 114 162 42% 117 166 49 42%
4 Hong Kong
International Airport106 146 38% 106 146 40 38%
21 Tokyo - Narita
Airport8 16 100% 78 96 23% 86 112 26 30%
3 Singapore - Changi
Airport106 132 25% 106 132 26 25%
24 New York -
John F. Kennedy International Airport
57 65 14% 92 118 28% 149 183 34 23%
9 San Francisco
International Airport64 79 23% 29 34 17% 93 113 20 22%
10 Los Angeles
International Airport82 107 30% 63 68 8% 145 175 30 21%
14 Kuala Lumpur
International Airport16 15 -6% 80 99 24% 96 114 18 19%
20 Madrid - Barajas
Airport33 29 -12% 120 151 26% 153 180 27 18%
13 Miami International
Airport48 52 8% 79 91 15% 127 143 16 13%
19 Chicago - O’Hare
International Airport134 156 16% 65 67 3% 199 223 24 12%
15 Dallas/Ft. Worth
International Airport145 150 3% 38 54 42% 183 204 21 11%
25 Bangkok -
Suvarnabhumi International Airport
24 14 -42% 111 136 23% 135 150 15 11%
11 Amsterdam -
Schiphol Airport2 2 0% 247 263 6% 249 265 16 6%
16 Sydney - Kingsford
Smith Airport46 51 11% 41 41 0% 87 92 5 6%
5 Hartsfield-Jackson
Atlanta International Airport
164 164 0% 60 72 20% 224 236 12 5%
18 Paris - Charles
De Gaulle Airport15 17 13% 233 242 4% 248 259 11 4%
23 New York -
Newark Liberty International Airport
91 86 -5% 83 89 7% 174 175 1 1%
7 Frankfurt
International Airport18 16 -11% 280 278 -1% 298 294 -4 -1%
1 London - Heathrow
Airport9 7 -22% 174 169 -3% 183 176 -7 -4%
17 Measured by Available Seat Kilometres (ASKs). Source, Innovata

The optimal size of a uk hub
34
4.4. Expansion of destinations at Heathrow for the home-hub carrier British Airways has only been possible through the acquisition of bmi british midland, the former competitor on short and medium-haul routes. As shown in Figure 18, the number of nonstop destinations flown by the airline declined from 2005 to 2010, after which it began acquiring slots from bmi before buying the company in early 2012. The rationalisation of the two networks and reduction in competition on certain routes enabled British Airways to launch new destinations; but potentially reduced competition on some European services where BA and bmi had competed with other European carriers for traffic.
Figure 18: British Airways Destinations from Heathrow 2005-2013
Airline
2005
2006
2007
2008
2009
2010
2011
2012
2013
British Airways 114 120 112 101 106 105 111 127 129
bmi 23 26 38 35 32 31 30 26
4.5. For the UK, there is a double-impact of losing connections. Not only is the Heathrow hub now connected to fewer destinations, it is also less competitive as a connecting gateway. This suggests that while London remains constrained, airlines are focussing on carrying passengers on the high-value point-to-point routes, increasing flight frequency and capturing more of the high value business traffic, while their European and Middle East counterparts are using the additional available capacity to launch new routes and develop more of a feed-based network.
Figure 19: Destinations Served by Region from European Hub Airports
Destinations AMS CDG FRA LHR
North America 24 27 30 31
Middle East 9 12 16 13
Europe 168 123 149 76
Asia 22 27 45 30
Africa 26 52 32 21
South America 7 8 7 3
Caribbean 9 8 13 2
Total 265 257 292 176
4.6. Figure 19 shows that the UK has fallen behind its key European counterparts in terms of air service connections, although the frequency of flights to the largest destinations is far higher from London than the comparative hubs elsewhere in Europe. The national hub airport has more destinations in North America than its European peers, but to every other global region, Heathrow is connected to fewer cities with non-stop flights than at least one of its peers. The most marked variance is to European points, where Heathrow offers 47 fewer connections than Paris and 92 less than Amsterdam. However the range of short-haul destinations available from the other London airports more than makes up for this shortfall, making London very well connected to Europe, just not via the hub airport.
INDEPENDENT TRANSPORT COMMISSION
35
Figure 20: Average Weekly Flight Frequency to Major Long-haul Cities, 2013:
From / To New York
Dubai Chicago Hong Kong
Los Angeles
Singapore Tokyo Total
London 198 97 62 53 51 44 32 538
Paris 72 27 19 24 17 14 35 208
Frankfurt 48 28 24 14 10 23 28 174
Amsterdam 36 19 12 14 8 14 10 113
Total 355 170 118 105 86 95 105 1,034
4.7. Frequency of flights to these major long-haul destinations shows that, with the exception of Paris to Tokyo, London has a greater number of weekly flights than anywhere else in Europe. The change in route structure from short-haul to high frequency long-haul shows that in a constrained market, airlines are able to rely less on connecting traffic flows to support new route development and instead focus on becoming more dominant in the stronger markets, shown in Figure 20 above. Unless the capacity issue is resolved, the network of destinations flown at the UK’s major international gateway will stagnate or even fall as airlines look to dominate a few key markets with very high frequency flights, creating high barriers to entry. On current evidence, the UK will dominate the transatlantic market and some long-standing current or former Commonwealth destinations, but risks become a marginal player to emerging markets. Already, the UK is behind Germany and France for nonstop flights to Brazil and China, for example.
Figure 21: Connectivity to BRIC and MINT Countries from European Hub Cities
Bra
zil
Rus
sia
Indi
a
Chi
na
BR
ICS
Mex
ico
Indo
nesi
a
Nig
eria
Turk
ey
MIN
T
Tota
l
Frankfurt 4 10 7 5 26 2 0 2 13 17 43
Amsterdam 2 2 2 6 12 2 0 1 9 12 24
Paris - CDG 2 3 3 5 13 2 0 2 3 7 20
London - Heathrow
Airport
2 4 5 4 15 1 0 2 1 4 19
4.8. This means that, whatever the position for London as a whole today, the constraints on its hub makes it relatively difficult to expand into new and emerging markets. Heathrow is behind other European hub airports in the number of destinations to the BRIC and MINT countries, with only just over half the BRIC destinations enjoyed by Frankfurt and particularly weak connectivity with Russia and Turkey.
4.9. Away from the emerging markets, London is well served. Air service connections to the 296 world cities, as defined by Loughborough University and the GAWC Research Network18, are stronger than from other European hub cities, shown in Figure 22.
18 http://www.lboro.ac.uk/gawc/

The optimal size of a uk hub
36
Figure 22: Connectivity to World Cities
London LHR Paris CDG
60% 47% 56% 54%
Amsterdam AMS Frankfurt FRA
50% 50% 54% 54%
4.10. The London airport system is connected by non-stop flights to 60 per cent of the world cities, shown above, compared to Paris (56 per cent), Frankfurt (54 per cent) and Amsterdam (50 per cent). However, when looking at the connectivity for the hub airport serving each of these cities, London (Heathrow) has the lowest level of coverage at 47 per cent of world cities.
4.11. Figure 23 shows the combined number of connected cities from the four major alliance hubs in Europe, calculated by multiplying the number of European destinations by the number of destinations in each continent. The analysis shows that, without exception, Heathrow is connected to fewer combinations of city-pair than any of the three other hub airports.
Figure 23: Route Combinations from European Hubs
Europe to World Region AMS CDG FRA LHR
North America 4,032 3,321 4,470 2,356
Middle East 1,512 1,476 2,384 988
Europe 28,224 15,129 22,201 5,776
Asia 3,696 3,321 6,705 2,280
Africa 4,368 6,396 4,768 1,596
South America 1,176 984 1,043 228
Caribbean 1,512 984 1,937 76
4.12. Connecting passengers are an essential ingredient to the development of a functioning hub airport helping bring forward routes where local demand is insufficient to support a direct service. In this respect, a UK hub airport should offer the opportunity to improve flight connections in support of additional long-haul services that will bring additional economic benefit to the UK.
INDEPENDENT TRANSPORT COMMISSION
37
Figure 24: Global Connectivity Scenarios
Destination Scenarios
DestinationsHeathrow
TodayScenario 1 Scenario 2 Scenario 3 Scenario 4 Max
North America
31 32 33 34 36 38
Middle East
13 14 14 14 15 16
Europe 76 90 110 120 135 150
Asia 30 35 40 45 50 55
Africa 21 22 28 32 36 42
South America
3 5 6 6 7 8
Caribbean 2 3 3 4 4 5
Total 176 201 234 255 283 314
Expected ATMs
474,530 545,447 640,580 693,955 772,373 853,031
Seat Capacity
96,037,708 109,232,416 126,153,554 136,223,770 150,955,979 166,236,838
Average Occupancy
78% 80% 80% 80% 80% 80%
Passenger Capability
74,909,413 87,385,933 100,922,843 108,979,016 120,764,783 132,989,470
4.13. The London hub should aim to enable the UK to host a range of destinations similar to that of its European competitors. Figure 24 shows a series of scenario-led progressions from today, at 176 destinations, to an airport serving a similar profile of destinations to the largest European hubs, with slightly fewer European destinations but a greater number of non-stop services to Asia, South America and Africa. This compares to an Airports Commission analysis that the two London airports would offer just below 250 destinations by 2050.
Home base versus non-domicile airlines
4.14. Airlines generally develop route networks from their home-country. Regulatory barriers often prevent expansion in third-countries, although the landscape has changed within Europe as deregulation allows any European-registered carrier to operate without restriction from any country within the EU. This has enabled the LCCs to establish operating bases in other countries – Ryanair at Stansted being the most successful example. Nonetheless, there are few examples of full deregulation in the international air market and consequently long-haul carriers almost always operate from their home-country and without global deregulation, it is highly likely to remain this way. In the long-term, scope may exist for creation of ‘open aviation areas’ where foreign ownership restrictions and traffic right limitations are removed, though this may hasten consolidation and focus on hubs rather than remove barriers to entry.
World City Connectivity
Total Cities
296

The optimal size of a uk hub
38
4.15. Global alliances have changed the shape of network airline development over the last 15 years, yet there is no evidence that alliances will establish hubs outside of the home-bases of any of their member airlines. When the alliances have expanded into new territory, it is usually in partnership with one of the home-based carriers which gives access to domestic and regional market connectivity via the hub airport. Looking at the spread of routes offered by home-registered (domicile) airlines versus non-domicile at a selection of major European airports, shown in Figure 25, in most cases the total number of routes are in a similar range, but the number of airlines offering those routes is heavily skewed. On average, each of these airports is served by four home-registered airlines and 78 foreign registered. The main carrier offers an average of 96 destinations, whereas the average number of destinations for foreign registered carriers is 1.7.
Figure 25: Destinations Served, Home and Non-Home Registered Airlines
Airport Number of Destinations offered by Home-Reg
Airlines
Number of Destinations offered by
Foreign Airlines
Number of Home-Reg
Airlines
Number of Foreign
airlines
London LHR 129 123 2 80
Frankfurt 256 132 8 89
Amsterdam 202 135 3 80
Paris CDG 169 182 5 102
Brussels 134 92 3 60
Vienna 131 87 2 64
Rome FCO 122 152 6 96
Madrid 118 129 5 70
Copenhagen 90 133 4 61
Milan MXP 55 122 6 74
Average 141 129 4 78
Airport Average destinations
by Home-Reg Airlines
Destinations by main Carrier
Average number of
destinations for Foreign Airlines
Runways
London LHR 65 129 1.5 2
Frankfurt 32 147 1.5 4
Amsterdam 67 115 1.7 5
Paris CDG 34 152 1.8 4
Brussels 45 65 1.5 3
Vienna 66 78 1.4 2
Rome FCO 20 90 1.6 4
Madrid 24 104 1.8 4
Copenhagen 23 82 2.2 3
Milan MXP 9 0 1.6 2
Average 32 96 1.7 3.3
INDEPENDENT TRANSPORT COMMISSION
39
4.16. It is also notable that the UK hub has fewer home-registered airlines than almost all of its European counterparts, a function of acquisition (of other carriers) being the only way for airlines to increase their slots at the airport. British Airways took over bmi in 2012 primarily to obtain its slot portfolio, the latter having itself acquired British Mediterranean in 2007 for the same reason. British Airways and Virgin Atlantic are the only UK airlines at Heathrow – and Virgin is 49 per cent owned by US giant Delta.
4.17. Without global deregulation of the air transport industry, including a removal of restrictions on foreign ownership of airlines, building a connecting hub operation will need a home-registered airline to underpin operations. The hub may be supported by alliance partner feed, but it is highly unlikely that a long-haul hub would be developed by a group of foreign airlines. Each of the airports above is a spoke on the network of foreign airlines.

The optimal size of a uk hub
40
5.1. In general, an airport generates its income from fees levied to airlines for use of its facilities and, increasingly, revenues derived from passengers using retail, car parking etc. As such, many airports see stronger revenues from outbound departing leisure passengers, who are more likely to drive to the airport and spend in shops, than from inbound business travellers who spend less time in the terminal and generally use airline lounge facilities. Airport operators invest heavily in improving the passenger experience once through security and it is commonplace for major hub airports to have well developed commercial real-estate comprising retail and food/beverage outlets.
Terminal capacity
5.2. The passenger capacity of an airport terminal tends to be less absolute than other infrastructure, although it is constrained by the number of departure gates, security processing ability and check-in/bag drop. Terminals are sized to accommodate the busy-hour flows of departing and arriving passengers although modelling passenger behaviour can be difficult. As such, new terminal buildings tend to be developed in a modular way, with sufficient capacity on opening to accommodate growth in passenger numbers, but also scope to add on further floor and gate space in the longer term.
5.3. Typically, departing passengers require the greater amount of space because they have longer dwell-times in the terminal compared to arriving passengers, who usually leave the airport as quickly as passport-control and baggage will allow. The industry bodies IATA and ICAO publish various airport planning guidance that includes suggested ratios of floor-space to annual passengers to maintain comfortable levels of occupancy.
5.4. It is clear that passenger experience is heavily influenced by the type of terminal building and perception of space and congestion. Figure 26 below shows the Airport Service Quality19 score for Heathrow before and after the opening of Terminal 5 in March 2008. In the two years leading up to the new terminal opening, the airport was consistently below the EU average and top quartile in the ASQ scorings. Within 6 months of the new terminal opening, the ASQ score rose to the EU average and from Q2-2010 has remained above average.
Figure 26: Airport Service Quality (ASQ) Score – Heathrow v EU Average 2006-201220
Q206
3.00
3.20
3.40
3.60
3.80
4.00
AQ
S S
core
4.20
Q306
Q406
Q107
Q207
Q307
Q407
Q108
Q208
Q308
Q408
Q109
Q209
Q309
Q409
Q110
Q210
Q310
Q410
Q111
Q211
Q311
Q411
Q112
Q212
Q312
Heathrow EU average Top EU quartile
5. Infrastructure
INDEPENDENT TRANSPORT COMMISSION
41
5.5. Looking to the future, the amount of space required for check-in desks is likely to diminish. Online check-in is now commonplace and carriers are seeing online check-in take-up regularly exceeding 80 per cent. Although some of the space will be replaced by fast-bag drops for passengers needing to drop bags, future terminal designs will place less emphasis on landside space requirement and a greater focus on the airside, post-security space. However the net result will be an improved passenger experience within a similar footprint to today’s terminal sizes.
5.6. Although tempting to consider off-airport terminals or ‘downtown’ check-in facilities, the reality is there are very few such examples of these being viable. Off-site bag drop, where customers are able to leave checked bags for secure transport to the airport is impossible under current security guidelines and is likely to be impractical in the event of restrictions being lifted. The original Heathrow Express offered a check-in and bag drop at Paddington Station for five years from launch with bags being carried in a secure environment to Heathrow and funnelled into the airport baggage system without need for passenger intervention, but take up was low and the service suspended in 2003.
5.7. A single terminal building should be sized to handle a maximum of 25-30m passengers per annum if walking distances are to be kept below 1km and transfer times between gates minimised. Heathrow T5, Frankfurt T1 and Amsterdam are all capable of handling around 30mppa although Heathrow has two ‘midfield’ piers at T5 that have to be reached by a rail shuttle. Terminal buildings in Asia are similarly sized – Shanghai, Seoul Incheon, Kansai, Bangkok Suvarnabhumi and Singapore Changi all have maximum terminal sizes in the 25-30mppa range. Dubai provides the exception to this rule with a 60mppa capacity terminal.
5.8. Same-terminal transfers offer a simpler and more convenient passenger proposition than having to transit between facilities and two of the world’s leading airports – Amsterdam and Singapore – offer this. The logistics of maintaining competitive connecting times that also enable movement of baggage and people are greatly enhanced by a single-building/terminal connection. This is an easier proposition at a new airport rather than attempting to incrementally expand existing facilities. However, it is far more challenging to design a multiple runway airport with only one terminal, whilst maintaining ease of terminal-to-airfield access.
5.9. The terminal of the future will enable rapid movement of passengers through the central search area and into airside lounge and retail facilities before dispersal to the gates. Hand-luggage only customers already barely touch landside infrastructure, often having checked-in online; whilst those with hold bags will proceed to an automated fast bag drop before entering the security. These systems are already in place at Gatwick and Heathrow. Baggage systems will allow drop-off several hours before flight departure, giving greater passenger flexibility to arrive at the airport at a time convenient to them, rather than waiting for check-in to open.
5.10. A new-build airport would, of course, offer the opportunity to create an optimised terminal layout to ease transit times for connecting passengers and ease of access for aircraft with proximity to runways, minimal taxiing times and sufficient gate arrangements to accommodate high volumes of traffic without compromising punctuality.
19 ASQ is an Airports’ Council International initiative run on behalf of the airport industry worldwide
20 Source: Heathrow Airport

The optimal size of a uk hub
42
Runways
5.11. Another key element in the design of large airports is the runway and taxiway layout. High-volume airfields occupy large land areas which may require long taxi-times between gate and runway. In peak periods, the amount of taxiing aircraft represents a continual challenge for local air navigation services to maintain punctuality. Most large airports have pairs of parallel runways facing the prevailing winds but this can also mean challenges in moving aircraft around the airfield.
5.12. The chart in Figure 27 shows total published ATMs against number of runways for the top 25 airports. Only airports with five runways or more achieve a throughput in excess of 650,000 ATMs at present, although that is a function of traffic mix and demand rather than runway constraints.
Figure 27: Number of ATMs per Runway, Top 25 Airports
LHR
DXB
LAX
JFK CDG
PEK
FRA
HKG SIN
NRT
BKK ICN
SFO
ORD
AMS
ATL
PVG SYD KUL
DFW
GRU
IST EWR
MAD MIA
0 100,000 200,000 300,000 400,000 500,000 600,000 700,000 800,000 900,000
1,000,000
0 1 2 3 4 5 6 7 8
Ann
ual A
TMs
Number of runways
Total ATMs versus number of runway for 25 largest airports (2013) Source: Capstats
5.13. Atlanta, which handles almost 900,000 ATMs from its five runways, is an example of high efficiency at a large airport. It also has a significantly smaller average aircraft size than the major intercontinental hubs, and so requires proportionally more ATMs. Applying the same average aircraft size of Heathrow today to the movements at Atlanta implies a potential through-put of 126m passengers from a five-runway airport.
5.14. Although not a new airport, it is an example of a simple and very effective airfield layout. Arguably, the ease of access for aircraft and passengers, as shown in Figure 28, has been a major factor in the airport becoming a major global gateway airport. It sits in the state of Georgia, which is only 11th on the list of US states measured by GDP; and therefore the airport punches well above its weight when compared to global and US peers.
5.15. The layout of the airport illustrates the challenge of runway configuration at a large airport. Any passenger aircraft using the fifth runway, at the bottom of the graphic, would have a very significant taxiing distance to reach the passenger terminals, involving crossing two operational runways before joining the main taxi-system. Adding extra runways often brings a decreasing level of efficiency for this reason and is perhaps why most major airports in the world have fewer than six operational runways.
21 Source: Federal Aviation Administration
INDEPENDENT TRANSPORT COMMISSION
43
Figure 28: Airfield and Concourse Layout - Atlanta Hartsfield Airport21
5.16. The level of constraint at Heathrow and Gatwick airports currently allows for very little flexibility in the event of operational disruption, be that weather-related or due to any unforeseen event. Gatwick is by far the most efficient single runway airport in the world, handling the most passengers and movements; but with only one runway has no resilience. Heathrow’s two runways are operating at 98 per cent capacity and, again, there is very little scope for recovery in the event of disruption, an area being investigated by CAA and DfT under the Tactically Enhanced Arrival Measures (TEAM) project, which seeks to allow a more flexible use of the airfield to recover operations.
5.17. No airport can sustain year-round runway utilisation in excess of 90 per cent and maintain operational integrity. Equally, demands for slots at airports suggest that there will almost always be a time of day, usually the early morning, where demand for slots is at its highest. This is known as the peak-hour. As airports grow in size, the peak hour becomes less marked versus other hours – as shown in Figure 29. Nonetheless, airlines prefer to have some flexibility to schedule their flights in a way that optimises flight connections – particularly at a hub airport.
Figure 29: Peak Hour Profile, European Hubs
0 10 20 30 40 50 60 70 80 90
100
00:0
0
01:0
0
02:0
0
03:0
0
04:0
0
05:0
0
06:0
0
07:0
0
08:0
0
09:0
0
10:0
0
11:0
0
12:0
0
13:0
0
14:0
0
15:0
0
16:0
0
17:0
0
18:0
0
19:0
0
20:0
0
21:0
0
22:0
0
23:0
0
Peak day two-way ATMs by hour - EU hubs Source: Innovata
LHR AMS FRA CDG
NB. These figures show aggregates of landing and take off movements.

The optimal size of a uk hub
44
5.18. Therefore over time, the ceiling for annual utilisation of total runway capacity – meaning the number of slots that are being used as a proportion of the theoretical maximum number available22 – should sit in the 85 per cent-90 per cent range. At congested airports, this figure will apply throughout the day but it can also be used in considering constraints in shorter time periods. As shown in Figure 29, there is a rapid ramp-up in runway utilisation at the start of the day. This is the time period in which aircraft parked over-night begin their day and when demand for short-haul business flights is at its peak. Additional capacity at this time of day is a priority for any hub airport as access to morning slots underpins network development.
Figure 30: Runways, Destinations and Departure Metrics, Busiest Global Airports
Airport Airport Destinations DeparturesTotal Seats (m)
Runways Dests/ Runway
Deps/ Ruway
Seats/ Runway
Avg Daily Freq
LHR London LHR 176 236,357 95.6 2 88 118,179 47,814,115 3.7
DXB Dubai 220 168,185 87.7 2 110 84,093 43,854,389 2.1
LAX Los Angeles 175 280,971 81.0 4 44 70,243 20,240,458 4.4
JFK New York JFK 183 193,133 63.5 4 46 48,283 15,873,285 2.9
CDG Paris CDG 259 216,133 77.1 4 65 54,033 19,269,201 2.3
PEK Beijing 222 282,324 112.4 3 74 94,108 37,471,285 3.5
FRA Frankfurt 294 221,594 77.2 4 74 55,399 19,295,719 2.1
HKG Hong Kong 146 156,829 77.6 2 73 78,415 38,803,596 2.9
SIN Singapore 132 162,983 72.5 2 66 81,492 36,235,298 3.4
NRT Tokyo NRT 112 99,263 48.5 2 56 49,632 24,252,465 2.4
BKK Bangkok 150 139,410 66.2 2 75 69,705 33,094,703 2.5
ICN Seoul ICN 166 115,054 53.5 3 55 38,351 17,848,420 1.9
SFO San Fransisco 113 196,243 53.2 4 28 49,061 13,289,913 4.8
ORD Chicago ORD 223 433,842 80.7 7 32 61,977 11,532,108 5.3
AMS Amsterdam 265 196,232 61.7 5 53 39,246 12,337,438 2.0
ATL Atlanta 236 443,757 112.2 5 47 88,751 22,438,503 5.2
PVG Shanghai 171 170,794 64.5 3 57 56,931 21,488,331 2.7
SYD Sydney 92 152,434 51.1 3 31 50,811 17,042,613 4.5
KUL Kuala Lumpur 114 160,761 63.6 2 57 80,381 31,783,539 3.9
DFW Dallas DFW 204 330,347 75.5 7 29 47,192 10,785,476 4.4
GRU Sau Paulo GRU 98 129,157 46.5 2 49 64,579 23,242,616 3.6
IST Istanbul 237 187,627 65.1 3 79 62,542 21,692,984 2.2
EWR New York EWR 175 196,637 43.2 3 58 65,546 14,384,827 3.1
MAD Madrid 180 158,375 52.1 4 45 39,594 13,024,996 2.4
MIA Miami 143 154,478 48.2 4 36 38,620 12,056,614 3.0
Average Average 179 207,317 69 3 57 63,486 23,166,116 3.2
22 Further information – CAA Runway Resilience Study 2008
INDEPENDENT TRANSPORT COMMISSION
45
5.19. Figure 30 shows the number of destinations, departures and runways at busiest 25 airports. Other than the US airports23, which have a higher proportion of high frequency domestic services, Amsterdam is the only airport with more than four runways and the average for these airports is three. There is little correlation between the number of destinations served, runways and average frequency of flights; though it is clear that in absolute movements per runway, Heathrow is far ahead of the other airports with an average of 118,000 departures per runway against an average of 63,000.
Hours of operation
5.20. Most airports in the UK have some form of night-time flight curfew that limits the number of flights at anti-social hours, and this is common across the world. The impact of extending operating hours on the utilisation of an airport is dependent on the level of constraint and the need to have flexible opening hours to enable manageable flight times to other time-zones.
Figure 31: Peak Day Movements, Middle East and Asia Hubs
0
10
20
30
40
50
60
00:0
0
01:0
0
02:0
0
03:0
0
04:0
0
05:0
0
06:0
0
07:0
0
08:0
0
09:0
0
10:0
0
11:0
0
12:0
0
13:0
0
14:0
0
15:0
0
16:0
0
17:0
0
18:0
0
19:0
0
20:0
0
21:0
0
22:0
0
23:0
0
Peak day two-way ATMs by hour - ME hubs Source: Innovata
DXB DOH AUH
0
10
20
30
40
50
60
70
Peak day two-way ATMs by hour - Asian hubs Source: Innovata
HKG SIN
00:0
0
01:0
0
02:0
0
03:0
0
04:0
0
05:0
0
06:0
0
07:0
0
08:0
0
09:0
0
10:0
0
11:0
0
12:0
0
13:0
0
14:0
0
15:0
0
16:0
0
17:0
0
18:0
0
19:0
0
20:0
0
21:0
0
22:0
0
23:0
0
0
10
20
30
40
50
60
00:0
0
01:0
0
02:0
0
03:0
0
04:0
0
05:0
0
06:0
0
07:0
0
08:0
0
09:0
0
10:0
0
11:0
0
12:0
0
13:0
0
14:0
0
15:0
0
16:0
0
17:0
0
18:0
0
19:0
0
20:0
0
21:0
0
22:0
0
23:0
0
Peak day two-way ATMs by hour - ME hubs Source: Innovata
DXB DOH AUH
0
10
20
30
40
50
60
70
Peak day two-way ATMs by hour - Asian hubs Source: Innovata
HKG SIN
00:0
0
01:0
0
02:0
0
03:0
0
04:0
0
05:0
0
06:0
0
07:0
0
08:0
0
09:0
0
10:0
0
11:0
0
12:0
0
13:0
0
14:0
0
15:0
0
16:0
0
17:0
0
18:0
0
19:0
0
20:0
0
21:0
0
22:0
0
23:0
0
5.21. Some of the large hubs in Middle East and Asia have 24-hour operations, but the traffic profile varies by region. At the Middle East hubs of Dubai, Doha and Abu Dhabi, operations are relatively consistent throughout the day, with small peaks in the morning and late evening. However, Doha and Abu Dhabi are equally busy at 0400 as they are in mid-afternoon, which is driven by the need for very late departing flights to make a morning arrival into Europe. These contrast with Hong Kong and Singapore, where there is a sharp drop in movements between 0100 and 0600, but a strong late-evening peak, again with flights timed to arrive early into Europe.
23 sorted by total ASKs
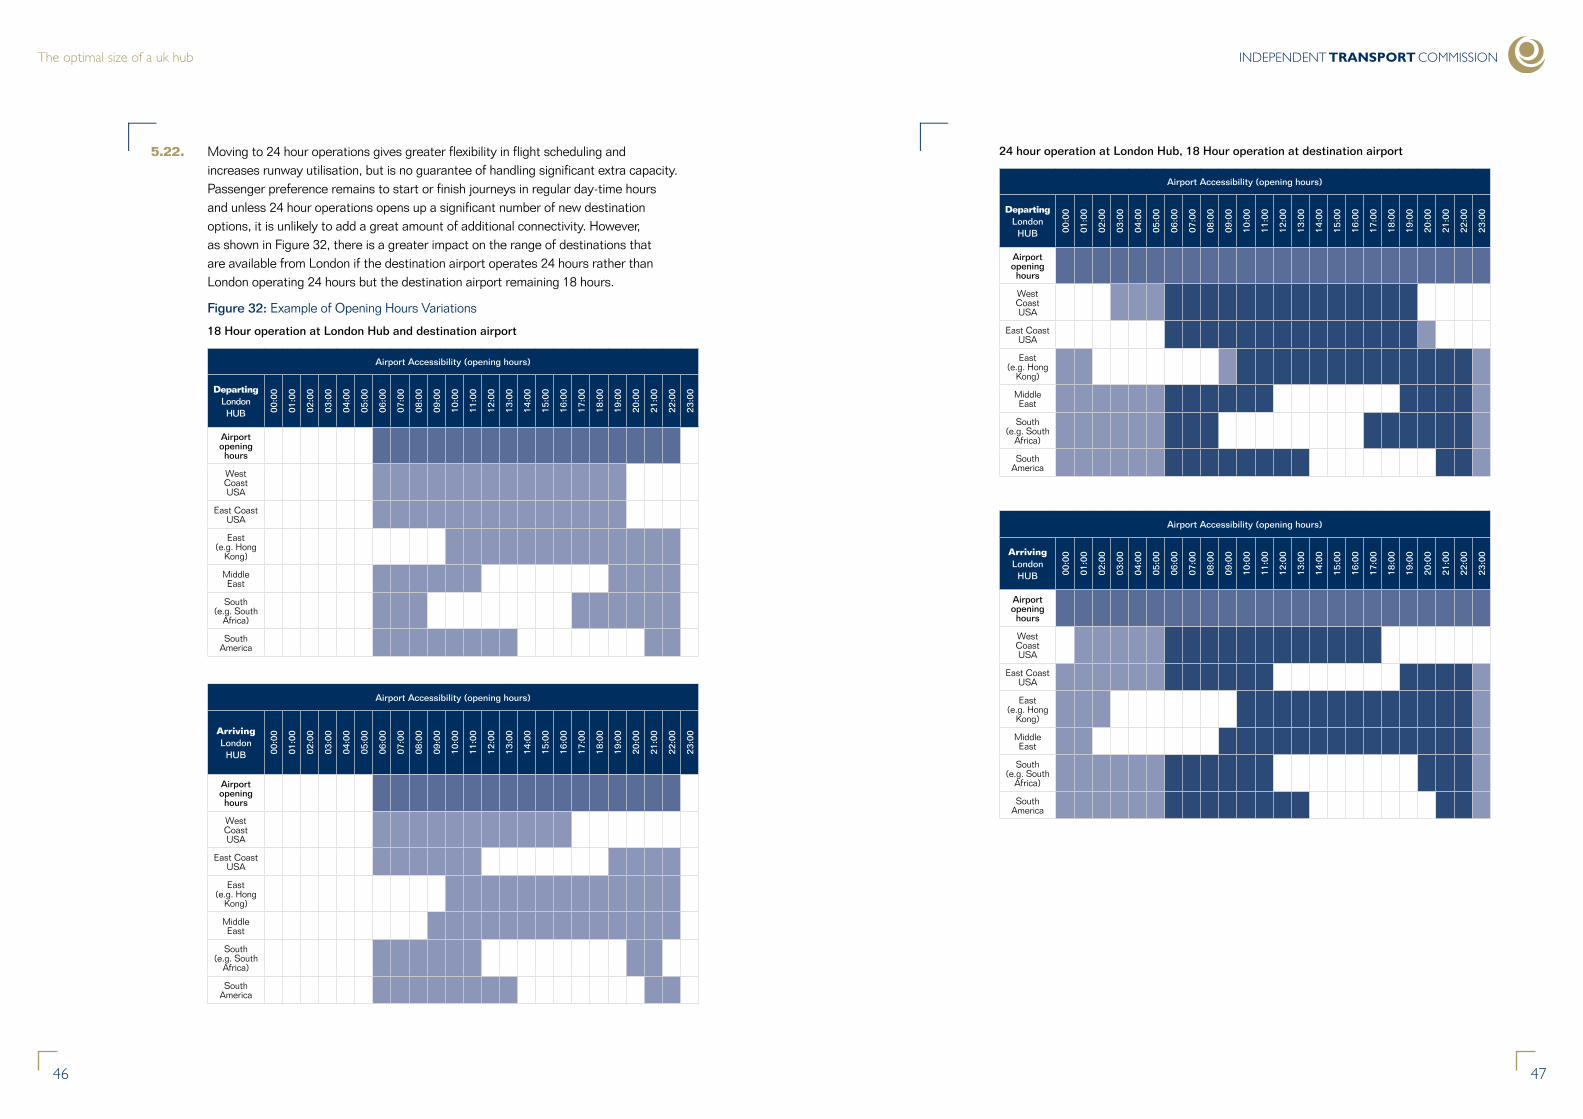
The optimal size of a uk hub
46
5.22. Moving to 24 hour operations gives greater flexibility in flight scheduling and increases runway utilisation, but is no guarantee of handling significant extra capacity. Passenger preference remains to start or finish journeys in regular day-time hours and unless 24 hour operations opens up a significant number of new destination options, it is unlikely to add a great amount of additional connectivity. However, as shown in Figure 32, there is a greater impact on the range of destinations that are available from London if the destination airport operates 24 hours rather than London operating 24 hours but the destination airport remaining 18 hours.
Figure 32: Example of Opening Hours Variations
18 Hour operation at London Hub and destination airport
Airport Accessibility (opening hours)
Departing London HUB 00
:00
01:0
0
02:0
0
03:0
0
04:0
0
05:0
0
06:0
0
07:0
0
08:0
0
09:0
0
10:0
0
11:0
0
12:0
0
13:0
0
14:0
0
15:0
0
16:0
0
17:0
0
18:0
0
19:0
0
20:0
0
21:0
0
22:0
0
23:0
0
Airport opening hours
West Coast USA
East Coast USA
East (e.g. Hong
Kong)
Middle East
South (e.g. South
Africa)
South America
Airport Accessibility (opening hours)
Arriving London
HUB 00:0
0
01:0
0
02:0
0
03:0
0
04:0
0
05:0
0
06:0
0
07:0
0
08:0
0
09:0
0
10:0
0
11:0
0
12:0
0
13:0
0
14:0
0
15:0
0
16:0
0
17:0
0
18:0
0
19:0
0
20:0
0
21:0
0
22:0
0
23:0
0
Airport opening hours
West Coast USA
East Coast USA
East (e.g. Hong
Kong)
Middle East
South (e.g. South
Africa)
South America
INDEPENDENT TRANSPORT COMMISSION
47
24 hour operation at London Hub, 18 Hour operation at destination airport
Airport Accessibility (opening hours)
Departing London
HUB 00:0
0
01:0
0
02:0
0
03:0
0
04:0
0
05:0
0
06:0
0
07:0
0
08:0
0
09:0
0
10:0
0
11:0
0
12:0
0
13:0
0
14:0
0
15:0
0
16:0
0
17:0
0
18:0
0
19:0
0
20:0
0
21:0
0
22:0
0
23:0
0
Airport opening hours
West Coast USA
East Coast USA
East (e.g. Hong
Kong)
Middle East
South (e.g. South
Africa)
South America
Airport Accessibility (opening hours)
Arriving London
HUB 00:0
0
01:0
0
02:0
0
03:0
0
04:0
0
05:0
0
06:0
0
07:0
0
08:0
0
09:0
0
10:0
0
11:0
0
12:0
0
13:0
0
14:0
0
15:0
0
16:0
0
17:0
0
18:0
0
19:0
0
20:0
0
21:0
0
22:0
0
23:0
0
Airport opening hours
West Coast USA
East Coast USA
East (e.g. Hong
Kong)
Middle East
South (e.g. South
Africa)
South America

The optimal size of a uk hub
48
18 hour operation at London Hub, 24 Hour operation at destination airport
Airport Accessibility (opening hours)
Departing London HUB 00
:00
01:0
0
02:0
0
03:0
0
04:0
0
05:0
0
06:0
0
07:0
0
08:0
0
09:0
0
10:0
0
11:0
0
12:0
0
13:0
0
14:0
0
15:0
0
16:0
0
17:0
0
18:0
0
19:0
0
20:0
0
21:0
0
22:0
0
23:0
0
Airport opening hours
West Coast USA
East Coast USA
East (e.g. Hong
Kong)
Middle East
South (e.g. South
Africa)
South America
Airport Accessibility (opening hours)
Arriving London
HUB 00:0
0
01:0
0
02:0
0
03:0
0
04:0
0
05:0
0
06:0
0
07:0
0
08:0
0
09:0
0
10:0
0
11:0
0
12:0
0
13:0
0
14:0
0
15:0
0
16:0
0
17:0
0
18:0
0
19:0
0
20:0
0
21:0
0
22:0
0
23:0
0
Airport opening hours
West Coast USA
East Coast USA
East (e.g. Hong
Kong)
Middle East
South (e.g. South
Africa)
South America
INDEPENDENT TRANSPORT COMMISSION
49
5.23. The first of the charts in Figure 32 above shows in blue the range of viable flight departure and arrival times to six global regions based on the departure and arrival airports opening 18 hours daily, taking into consideration the average flight time and time difference. The white blocks indicate the hours in which a flight is unable to depart London (left side) or arrive in London (right side) because of the destination airport being closed. The middle charts show the difference if a London hub operates 24 hours but the destination remains restricted to 18 hours. The major changes, shown in blue, are a greater potential for flights to depart to the Middle East, South Africa and South America. For flight arrivals, there is greater flexibility for arrivals from North and South America and South Africa.
5.24. The bottom chart shows the difference in scope for flights if the London hub is open 18 hours daily and the destination 24 hours, in which case flights to and from all regions are viable throughout the day – notwithstanding that the arrival times at, and departure times from the destination airport may be in the middle of the night. Clearly with 24 hour operations at both ends of the route, flights could be timetabled at any time of the day.
5.25. The location of the UK in relation to the major markets, taking into consideration time zones and flight times, is advantageous for the majority of airline operations to take place in the ‘normal’ operating day. There would be some advantages to extending opening hours to enable very early flight arrivals or late departures; and for operational reasons, having the ability to overspill into the current curfew would enable quicker service recovery. However even looking into the very long term, the demand from passenger airlines for runway slots between midnight and 0500 at a UK hub is likely to remain minimal.

The optimal size of a uk hub
6.1. In pulling together this report, it is clear that the issue of future airport capacity for the UK, particularly its location and size, is highly challenging and has a range of uncertainties that make planning difficult. However, there are some key findings that we feel are essential to inform the debate about the size of a hub airport:
• Competition exists at and between UK airports for short-haul passengers
• In the long-haul market, competition is largely between a small number of global hubs, with transfer passengers - from many places of origin - as the key to success. Connecting passengers are essential to support long-haul air services and bring forward additional routes
• New airport capacity should maintain the level of competition between airports
• There will, if anything, be fewer European hubs in the future, competing for new international routes
• Capacity should be added to convert extra capacity into extra connectivity. It is more effective to add a third runway at the hub than to have two 2-runway London airports
6.2. Looking at how this relates to the optimum level of capacity, if the UK was to achieve full coverage of the 296 World Cities, all 295, plus a much wider range of smaller destinations, would be served by UK airports. However this is an impractical aspiration given the location of some of the world cities and our runway requirement analysis is based on the hub airport serving 250 destinations in total, including smaller ones. Further, we find little evidence to suggest that the future hub airport will serve many more destinations than this; and is highly unlikely to rise above 300 cities even given population growth and migration. The figure of 250 is the mid-point in our global connectivity analysis, presented in Figure 24, and is consistent with the level of connectivity that the Airports Commission expect to see from the London system at 205024.
6.3. We have examined how this would translate to annual runway utilisation using a range of flight frequency and passenger scenarios based on the average flight frequency at Heathrow today, and high/low variances. These are shown in Figure 33.
50
6. Hub Airport Runway Requirements and Timing
24 Airports Commission Interim Report, Table 4.6 Page 133
INDEPENDENT TRANSPORT COMMISSION
51
Figure 33: Runway Requirement Scenarios for a Hub Serving 250 Destinations
UK Hub Airport under various flight frequency scenarios
Current situation (LHR)
Lower Today Higher
Number of destinations 176 250 250 250
Average frequency (weekly) 26 15 26 35
Annual ATMs 480,000 390,000 676,000 910,000
Pax (based on current LHR pax/ATM) 70,800,000 57,525,000 99,710,000 134,225,000
Pax estimate (based on 20% growth in pax/ATM) 84,960,000 69,030,000 119,652,000 161,070,000
Utilisation of x number of runways
2 98% 79% 136% 183%
3 64% 52% 91% 122%
4 48% 39% 68% 92%
5 39% 31% 54% 73%
6.4. The current situation shows Heathrow operating at 98 per cent runway utilisation with an average frequency of 26 weekly flights to 176 destinations. At 250 destinations and assuming no material change in aircraft size, the hub would need to accommodate 676,000 ATMs based on the profile of Heathrow today; and a range of 390,000 to 910,000 based on a low of 15 flights/week and high of 35 flights per week per destination. The resultant volume of passengers is dependent on the number of passengers per movement (PPATM). Two scenarios are shown, the lower being the current PPATM level at Heathrow and the higher assumes a 20 per cent increase in PPATM, resulting in up to 161m passengers per annum.
6.5. Our analysis suggests that on this basis, a three-runway hub offering 250 destinations would operate at 91 per cent capacity if the profile was similar to Heathrow today, compared to 52 per cent utilisation at the lower flight frequency, while three runways are unable to handle 250 destinations at the higher flight frequency.
6.6. Adding a fourth runway would see utilisation of 68 per cent at the current profile of Heathrow. At the higher average daily frequency, four runways would be able to cope at similar congestion levels to Heathrow today. A fifth runway would have quite considerable spare capacity in all scenarios and so we conclude that there is no requirement for a hub airport of this size.
6.7. The UK hub will maintain a relatively high average aircraft size, because of the attraction of London as a point-to-point market. It must ensure sufficient runway capacity is available to enable competition between airlines for this point-to-point traffic, and so average flight frequency for the airport should be approaching four daily flights, which is close to the current situation at Heathrow. We do not see sufficient demand in the long term for very high frequency flights – greater than 70 per week - to a large number of destinations.

The optimal size of a uk hub
52
Timing and Conclusions
6.8. On this basis, an additional runway is required as soon as possible to relieve congestion at the current London airports. Whether this is at the current Heathrow site or a new airport is out of the scope for this study, however we do not foresee the need for three additional runways and therefore a new site would necessitate the closure of Heathrow. Looking at how the hub may develop, we have modelled the uptake in capacity in five-year blocks after the addition of the third runway, which is presented in Figure 34.
6.9. DfT forecasts suggest Heathrow passenger throughput capped at two runways will reach a ceiling of 93mppa at 480,000 movements. Our analysis is more conservative. Based on current airline fleets, route mix and forward orders, we forecast passenger numbers to reach a peak of 85mppa. Beyond this, although there may be scope to slowly grow passengers, it will only come from a smaller number of routes flying at higher frequency on larger aircraft, meaning the number of destinations will fall.
Figure 34: Growth in Usage and Additional Runway Timing with Modelled Increase in PPATM
Years After Third Runway
Base 5 10 15 20 25 30 35 40 45 50
ATM 480,000 541,177 579,847 618,884 650,418 683,558 711,258 738,237 766,240 795,304 825,471
PPATM 175 171 173 176 180 183 187 191 195 199 203
Passengers (m)
84.24 92.45 100.55 109.04 116.91 125.34 133.05 140.88 149 157.95 167.25
6.10. Taking this as the starting point for new capacity to be added at a hub airport, our forecast is that, on opening, a new runway would lead to an initial decline in passengers per movement (PPATM). This is based on the assumption that additional short-haul services would be added (to capture back the traffic currently transferring at overseas hub airports) at a faster rate than new long-haul routes are added. However, after the first five years, growth in PPATM would return to the modest levels suggested in the Airports Commission report – c. 0.4 per cent per annum, and within ten to fifteen years of opening, would be back to base-year levels. Adding in annual growth in passengers at the same long-term rates as the Commission suggests shows that fifteen years after opening, a third runway would begin to show signs of congestion; and by thirty-years, based on the same set of assumptions, would be approaching maximum capacity of 720,000 movements.
6.11. Addition of a fourth runway would enable the hub to maintain growth in passengers beyond the 720,000 absolute maximum ATM limit of a three runway airport. Continuation in growth of passengers and the number of passengers per movement at the lower rates of 1.2 per cent and 0.4 per cent respectively shows that a four-runway airport would only reach 85 per cent of capacity, or 816,000 ATMs, around fifty years after the addition of the third runway and although not shown in Figure 34, would reach maximum usage of 960,000 ATMs around seventy years after the third runway opened.
INDEPENDENT TRANSPORT COMMISSION
6.12. We agree with the Airports Commission that in deciding on the location of new capacity, it should consider the long term. We conclude that for the UK to maintain an effective, competitive international hub operation does not require a ‘mega-hub’ airport with five or six runways; however it does require a hub airport with additional capacity in the form of a third runway at the soonest possible opportunity.
6.13. Looking very far into the future introduces a large number of economic, strategic, legislative, technological and other uncertainties that could radically alter the air transport industry. However, on the basis that a third runway could be built and operational sometime between 2025 and 2030, and under a set of growth assumptions based on what we know today, it is likely to start becoming congested by 2050 and be at absolute capacity around 2060. Thus, if the Commission wishes to take an ultra-long term view, and one that would offer resilience to the tail-end of the century, it should consider the scope for a fourth runway at the same airport site.
Peter Hind and RDC Aviation For the Independent Transport Commission February 2014

INDEPENDENT TRANSPORT COMMISSIONThe optimal size of a uk hub
5554
Notes

The optimal size of a uk hub
56
Independent Transport Commission
February 2014
For further information and electronic copies please visit:
www.theitc.org.uk
or write to:
The Independent Transport Commission
70 Cowcross Street
London
EC1M 6EJ
INDEPENDENT TRANSPORT COMMISSION
Disclaimer
Data for this report has been obtained from a number of sources including CAA, Innovata and other public domain resources. RDC Aviation makes a number of adjustments to the data in order to maintain integrity and consistency; however the Company is not responsible for the accuracy of any data provided or obtained from third parties.
This document may contain forward-looking statements regarding future events such as ‘forecast’, ‘expect’, ‘believe’, ‘estimate’, ‘anticipate’, ‘will’, ‘could’, ‘may’ or ‘might’ and the negative of such terms or similar expressions. By their nature, forward-looking statements involve risks and uncertainties, because they relate to events and depend on circumstances that may or may not occur in the future. RDC Aviation cautions you that forward-looking statements are not guarantees of future performance.
The information in this document is subject to verification, completion and change. Accordingly no representation or warrant, express or implied, is made or given by or on behalf of the Company as to the accuracy or fairness of the information or opinions contained within this report. None of the Company nor any of its shareholders, directors, officers or any person accepts any liability whatsoever for any loss howsoever arising from any use of the contents of this report or otherwise arising in connection herewith. By opening, accepting or reading these materials you agree to be bound by the foregoing terms regarding the information disclosed herein.
The company will be pleased to explain the basis of any supporting grounds pertaining to the statements herein, in the event that these are not clearly shown.

Published by the Independent Transport Commission
The Independent Transport Commission (ITC) is one of Britain’s leading research charities with a mission to explore all aspects of transport and land use policy. Through our independent research work and educational events we aim to improve and better inform public policy making. For more information on our current research and activities please see our website: www.theitc.org.uk
reac
hmar
ketin
g.co
.uk
219
99 1
0/13
Independent Transport Commission 70 Cowcross Street London EC1M 6EJ
Tel No: 0207 253 5510 www.theitc.org.uk
Registered Charity No. 1080134 February 2014 © Copyright Independent Transport Commission