the outlook for oil and gas presentation to oklahoma independent petroleum association june 11, 2007
TRANSCRIPT

GROPPE, LONG & LITTELL
OIL AND GAS ANALYSTS AND FORECASTERS
HENRY GROPPE E.W. LONG, JR. GEORGE S. LITTELL
1111 BAGBY, SUITE 2330 PHONE (713) 658-1193 WEBSITE www.groppelong.com HOUSTON, TEXAS 77002 FAX (713) 658-1196 EMAIL [email protected]
THE OUTLOOK FOR OIL AND GAS
Presentation To
OKLAHOMA INDEPENDENT PETROLEUM ASSOCIATION
June 11, 2007

0
1
2
3
4
5
6
7
8
9
10
11
1945 1955 1965 1975 1985 1995 2005 2015
9.6
9.0TOTAL
OTHER LOWER 48 CRUDE OIL
FIGURE 1
UNITED STATES PRODUCTIONMillion Barrels Per Day
ALASKA
CONDENSATE
GULF OF MEXICOSLOPE AREAS
NATURAL GASLIQUIDS
Actual Forecast
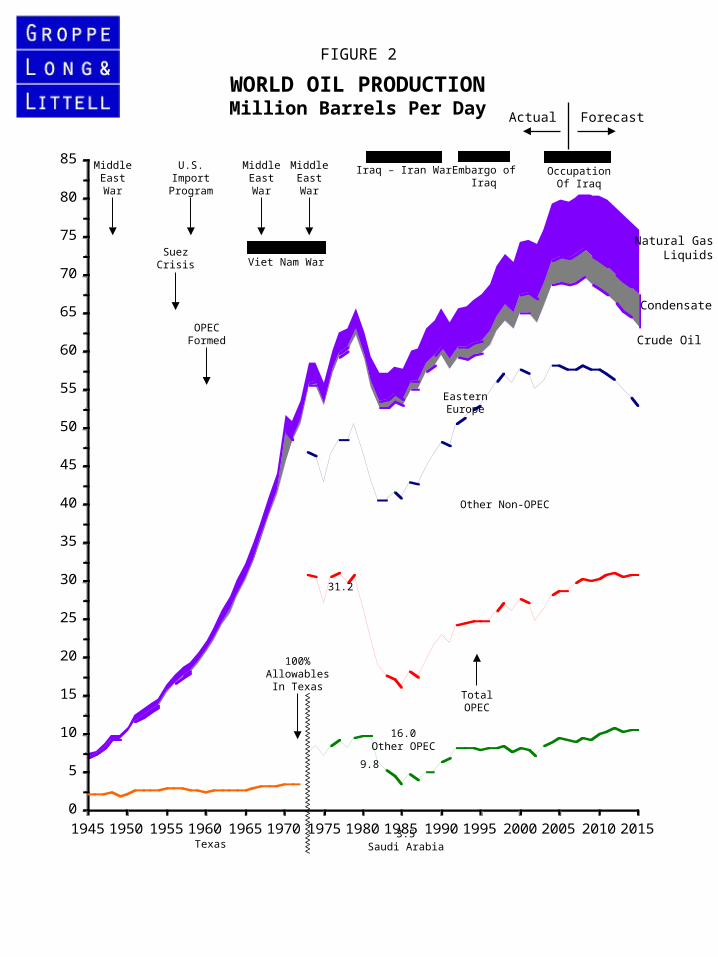
0
5
10
15
20
25
30
35
40
45
50
55
60
65
70
75
80
85
1945 1950 1955 1960 1965 1970 1975 1980 1985 1990 1995 2000 2005 2010 2015
WORLD OIL PRODUCTIONMillion Barrels Per Day
FIGURE 2
Texas Saudi Arabia3.5
9.8
Other OPEC16.0
Other Non-OPEC
EasternEurope
TotalOPEC
31.2
<<<<<<<<<<<<<<<<<<<<<<<<<<<<<<<<<<<<
100%AllowablesIn Texas
Natural Gas Liquids
Condensate
Crude Oil
Iraq – Iran War Embargo ofIraq
OccupationOf Iraq
MiddleEastWar
U.S.Import
Program
MiddleEastWar
MiddleEastWar
SuezCrisis
OPECFormed
Viet Nam War
Actual Forecast

0
1
2
3
4
5
6
7
8
9
10
11
12
13
1945 1955 1965 1975 1985 1995 2005 2015
NON-OPEC CRUDE OIL PRODUCTIONMillion Barrels Per Day
ForecastActual
Middle East
Asia
MexicoChina
Latin America
CanadaU.S. Lower 48
Africa
FIGURE 3
Western Europe
U.S. Lower 48
Eastern Europe

0.00
0.25
0.50
0.75
1.00
1.25
1.50
1.75
2.00
2.25
2.50
2.75
3.00
3.25
1945 1955 1965 1975 1985 1995 2005 2015
FIGURE 4
CRUDE OIL PRODUCTION IN MEXICOMillion Barrels Per Day
TotalCrude
2.75
3.21
TotalOffshore
Cantarell
ReformaArea
2.10
Chicontepec
Actual Forecast
2.50
0.89
0.50

0
5
10
15
20
25
30
35
1970 1975 1980 1985 1990 1995 2000 2005 2010 2015
Million Barrels Per Day
WORLD OIL PRODUCTION
30.8
10.4
Other Non-OPEC Crude Oil
Eastern Europe Crude Oil
OPEC Crude Oil
NGL **
Other *
* alcohols, coal liquefaction, and gas to liquids** condensate, natural gasoline, butanes, propane, and ethane
22.2
12.6
2.40.9
28.7
11.4
28.9
10.8
Angola joined OPEC
FIGURE 5
Actual Forecast

Actual Forecast
0
10
20
30
40
50
60
70
80
90
1975 1980 1985 1990 1995 2000 2005 2010 2015
FIGURE 6
WORLD PETROLEUM DELIVERIES Million Barrels Per Day
Rest ofWorld
United States
Japan, Canada,Australia & New Zealand
Western Europe
65.9
57.5
China
18.9
15.2
8.9
Includes crude oil, other liquids and processing gain
81.9
84.1
33.2
8.5
20.5
15.1
6.8

UNITED STATES GASOLINE MARKET
$0
$1
$2
$3
$4
PerGallon
$3.06 Retail
$2.31 Cost + 51¢ pergallon subsidy
$1.80 Total Cost
$1.60 Feedstock (2.5 gallons per bushel)
$3.06 Retail
$2.30 retail(from crude)
$1.55 Domestic refineryor imports
B
A
Case A Case B
DEMAND
Crude Oil: $60 per barrelCorn: $4 per bushel
SUPPLY
Mandated Ethanol Volume
Gallons
FIGURE 7

Actual Forecast
0
500
1,000
1,500
2,000
2,500
3,000
1997 1998 1999 2000 2001 2002 2003 2004 2005 2006 2007 2008 2009 2010 2011 2012 2013 2014 2015
OIL DELIVERIES IN CHINAThousand Barrels Per Day
Gasoline
Residual Fuels
Distillate
Direct Crude
FIGURE 8

0
1
2
3
4
5
6
7
8
9
10
11
12
13
14
15
16
17
18
1970 1980 1990 2000 2010
0
1
2
3
4
5
6
7
8
9
10
11
12
13
14
15
16
17
18
FIGURE 9
INDUSTRIAL NATURAL GAS AND ELECTRICITY
GDPTrillion2005$
PopulationMillions Actual Forecast (Normal Weather)
Gross Domestic Product (GDP)
Population
5.31
- 200
- 300
6.70
0.84
7.20
281.4
1.06
237.9
296310
$5.68
$12.49
1.5
1.4
1.3
1.2
1.1
1.0Electricity
Gas
Trillionkwh
TrillionTcf
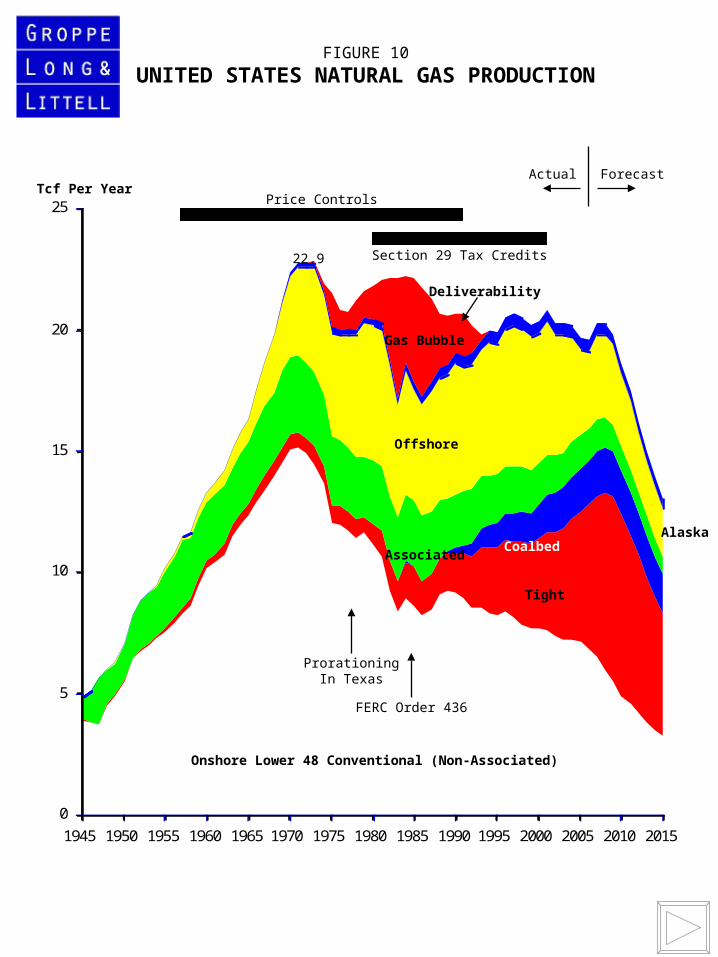
0
5
10
15
20
25
1945 1950 1955 1960 1965 1970 1975 1980 1985 1990 1995 2000 2005 2010 2015
Tcf Per Year
Tight
CoalbedAssociated
Offshore
Gas Bubble
Onshore Lower 48 Conventional (Non-Associated)
Price Controls
Section 29 Tax Credits
Alaska
Actual Forecast
ProrationingIn Texas
FERC Order 436
22.9
Deliverability
FIGURE 10
UNITED STATES NATURAL GAS PRODUCTION

FIGURE 11
WORLD LNG
0
2
4
6
8
10
12
14
16
18
20
22
24
26
28
30
32
34
36
38
40
42
44
46
48
50
Billion CubicFeet Per Day
Production Consumption
Production Consumption
2005 2015
Indonesia16%
Algeria 13%
Malaysia15%
Qatar 15%
Australia 8%
Nigeria 6%Brunei 5%
U.A.E. 4%Oman 5%
Trinidad 7%
Egypt 4%
Western Europe
25%
South Korea 15%
Taiwan 5%U.S. 9%
Japan 42%
India 3%U.S.
Western Europe
20%
South Korea12%
Taiwan 5%
U.S. 16%
Japan 21%
India 6%
Mexico 6%
China 7%
Indonesia 8%
Algeria 8%
Malaysia 6%
Qatar 19%
Australia 13%
Nigeria 14%
Brunei 2%
U.A.E. 2%
Oman 3%Trinidad 4%Egypt 5%
Russia 2%
Iran 8%
Yemen 2%
Peru 1%E. Guinea2%
19.34 18.
63
46.1244.41

0
10
20
30
40
50
60
70
1973 1978 1983 1988 1993 1998 2003 2008 2013
Bcf/d
Residential & Commercial
Boiler Fuel & Other
46.9
60.8
24.0
Fuel Use Act
UNITED STATES NATURAL GAS CONSUMPTIONBillion Cubic Feet Per Day
20.0
59.0
47.5
FIGURE 12
Actual Forecast

GROPPE, LONG & LITTELL
OIL AND GAS ANALYSTS AND FORECASTERS
HENRY GROPPE E.W. LONG, JR. GEORGE S. LITTELL
1111 BAGBY, SUITE 2330 PHONE (713) 658-1193 WEBSITE www.groppelong.com HOUSTON, TEXAS 77002 FAX (713) 658-1196 EMAIL [email protected]
THE OUTLOOK FOR OIL AND GAS
Presentation To
OKLAHOMA INDEPENDENT PETROLEUM ASSOCIATION
June 11, 2007