the outlook for the japanese economy · japan’s economy hit a bump following the consumption tax...
TRANSCRIPT

The Outlook for the Japanese Economy | 19 September 2014 1
The Outlook for the Japanese Economy
Consumption Tax Hike Weathered as Virtuous Cycle Picks Up Steam, Japan’s Economy Stays on Recovery Course
YASUHIRO ISHIMARU CHIEF MANAGER ECONOMIC RESEARCH OFFICE T 03-3240-3204
The Bank of Tokyo-Mitsubishi UFJ, Ltd.A member of MUFG, a global financial group
19 SEPTEMBER 2014
(ORIGINAL JAPANESE VERSION RELEASED ON 11 SEPTEMBER 2014
1. Overview of the Japanese Economy
Japan’s economy hit a bump following the consumption tax hike in April. Real GDP slumped an annualized 7.1% YoY in Apr-Jun according to the Cabinet Office’s second preliminary report, clearly reflecting a reactionary drop following the surge of demand ahead of the tax hike, particularly in private and residential investment demand (Figure 1). Although net exports boosted GDP because of a big drop in imports due to weakened domestic demand, exports remain soft.
The big GDP contraction stoked concerns about Japan’s economic outlook, but companies do not appear to be as deeply concerned about the slowdown as the GDP data suggests. According to the BoJ Tankan Weighted Average DI––the weighted averages of the Production Capacity DI and Employment Conditions DI by capital and labor distribution rates–– companies were clearly aware of a loosening macro-supply and demand balance in Apr-Jun. However, the weakening was not great and companies expect supply and demand to converge once again in Jul-Sept (Figure 2). Not only have companies already been feeling a tightening in the labor supply since H1 2013, more recently capacity also appears to be inadequate and the loosening supply-demand relationship is unlikely to quell companies’ expenditure for the future.
Corporate view of supply-demand balance still bright despite economic bump following consumption tax hike

The Outlook for the Japanese Economy | 19 September 2014 2
A continued tightening of supply and demand will be a key factor supporting both rising household incomes via expanded employment and higher wages as well as a recovery in personal consumption. Employment conditions are clearly improving, as compensation has been rising faster following the spring wage negotiations agreement for fairly large wage hikes. The employment rate by gender and age group shows that employment has been rising markedly among women and older workers compared to past economic peaks (Figure 3). This shows that a wide range of workers are more actively entering the labor market as wages rise because of companies’ willingness to hire. We think such increased participation will contribute to boosting Japan’s economic growth momentum over the medium- to long-term from both the supply and demand sides.
Companies are steadily making more capital expenditures. In the June BoJ Tankan, large enterprises revised up their capital expenditure plans for this year by 5.8% from the March survey (Figure 4). The June revision rate was the biggest since 1991, during the bubble economy, and shows that corporate investment sentiment remains firm even in the wake of the consumption tax hike. Capital expenditures are like to keep expanding strongly as the sense of stock overcapacity has been largely dispelled and demand (including private consumption) remains firm. Manufacturers are making capital expenditures largely for upgrades and rationalizations, while non-manufacturers are investing to bolster capacity. The Government’s steady implementation of its growth strategy, including cutting the corporate real tax rate, will encourage greater corporate investment activity.
Private consumption to recover as household incomes continue to improve on growing company willingness to hire
Government growth strategy propelling capital expenditures
-20
-15
-10
-5
0
5
10
15
2010 2011 2012 2013 2014
Figure 1: Real GDP and Final Demand
Private consumptionResidential investmentCapital expendituresInventory investmentPublic demandNet exportsReal GDP
Source: Compiled by BTMU Economic Research Office from Cabinet Office data.
(QoQ annualized, %) -20
-15
-10
-5
0
5
10
15
20
252005 2006 2007 2008 2009 2010 2011 2012 2013 2014
Capacity factors
Employmentfactors
Tankan weightedaverage DI
Notes: 1) Production capacity DI and Employment conditions DI weighted average using capital and labor distribution rate.
2) Capacity factors is change from Production capacity DI; Employment factors is change from Employment conditions DI.
Source: Compiled by BTMU Economic Research Office from BoJ data.
(%point, inverse axis)
Forecast
Excess demand
Figure 2: Tankan Weighted Average DI

The Outlook for the Japanese Economy | 19 September 2014 3
The Japanese economy’s virtuous cycle is gaining traction as companies make more forward-looking expenditures and investment activity picks up as supply and demand tighten. We expect the economy to weather the negative impact from the recent consumption tax hike and stay on a recovery course. Relatively strong growth in the wake of the big Apr-Jun slump is likely to persist and real GDP to grow by nearly 1% this fiscal year. We forecast Japan’s economy to sustain a mid-1% growth rate in FY2015 as well, despite downward pressures from another consumption tax hike to 10%.
2.Current Conditions and Outlook, by Sector and Area
(1)CORPORATE SECTOR Japanese exports continue to be weak, especially shipments to Asia
and the US. Real exports (in GDP figures) slipped an annualized -2.0% QoQ in Apr-Jun, the first decline in three quarters, due to weakening import demand around the world because of the struggling global economy. As the share of advanced country exports (the weight of advanced country exports among overall global exports, in real terms) has been shrinking overall, Japan has maintained its share of exports since 2013, when the excessively strong JPY began correcting (Figure 5). This is an indication that Japan’s recent export softness is not necessarily due to the country’s unique factors of declining competitiveness and production shifts overseas.
Exports are likely to pick up gradually going forward. First, we expect global import demand to grow more strongly as the world economy slowly recovers, especially in advanced countries. Further, Japanese export goods have shifted from final consumption goods to intermediate goods and investment goods. Thus, although retail prices are reflecting
Exports to pick up as advanced economies recover and JPY weakness takes root
Corporate forward-looking spending and investment activity accelerating virtuous cycle
30
40
50
60
70
80
90
100
15-24
25-34
35-44
45-54
55-64
15-24
25-34
35-44
45-54
55-64
Em
plo
ymen
t ra
te (
%)
Age group (years)
July 2014
April 2012
February 2008
November 2000
Source: Compiled by BTMU Economic Research Office from MIC data.
Figure 3: Employment Rate, by Gender and Age Group
-8
-6
-4
-2
0
2
4
6
8
1990 1993 1996 1999 2002 2005 2008 2011 2014
Manufacturers
Non-manufacturers
Revision rate
Figure 4: BoJ Tankan Capital Expenditures June Survey Revision Rate
(Large Enterprises, All Industries)(%)
Note: Revision rate is versus March survey.Source: Compiled by BTMU Economic Research Office from BoJ data.
(FY)

The Outlook for the Japanese Economy | 19 September 2014 4
exchange rate fluctuations after longer lags compared to the past, export price in contract currency-denominated terms has been steadily declining (Figure 6). Improved price competitiveness due to the weaker JPY appears to be supporting Japan’s export volume somewhat.
Real capital expenditures slumped an annualized -18.8% QoQ in Apr-Jun, the first drop in five quarters. Capital expenditures marked a record increase in Jan-Mar due not only to improved corporate profits and investment sentiment, but also because of the surge of demand brought ahead of the consumption tax hike and one-time demand that arose as software support ended. The reactionary slump appeared in Apr-Jun.
The upward trend in capital expenditures is persisting, and expenditure is likely to start to rise again in Jul-Sept. Companies listed on the first section of the Tokyo Stock Exchange reported higher current profits in Apr-Jun, and the strong results were reported by not only manufacturers but also non-manufacturers, which tend to be more strongly impacted by declining domestic demand. Profits have neared the peak levels of prior to the collapse of Lehman Brothers (Figure 7). A sustained earnings recovery will also likely contribute to maintaining corporate business sentiment and improving investment sentiment. An August Development Bank of Japan survey on corporate capital expenditures plans (among companies with capital of at least JPY1.0bn) showed that a wide range of industries, including manufacturing sector companies in the chemicals, iron and steel, and transportation machinery areas, plan to increase investment (Figure 8). Companies are expected to invest more for maintenance/repairs, rationalizations and labor savings, as well as to strengthen operating capacity in non-manufacturing sector like transport, real estate, wholesaling, and retailing.
Capital expenditures still on upward trend even after being hit by consumption tax hike
90
92
94
96
98
100
102
0 2 4 6 8 10 12 14 16 18 20 22 24 26 28 30 32(Number of months elapsed)
Oct 2011 -Jan 2005 -December 1999 -April 1995 -November 1988 -
(Beginning of period = 100)
Note: Weighted average prices of contract currency-denominated export prices of general purpose, production, and business oriented machinery, electric products, electronic parts and devices, information communications equipment, and transport equipment.
Source: Compiled by BTMU Economic Research Office from BoJ data.
Figure 6: Export Prices (Contract Currency-Denominated) of Major Exports during JPY Weakening
3
4
5
6
7
44
45
46
47
48
2010 2011 2012 2013 2014
(%)
Advanced countries (excl Japan, left axis)
Japan (right axis)
Note: Real 2005 prices. An average of the past three months. Source: Compiled by BTMU Economic Research Office from Netherlands
Bureau for Economic Policy Analysis data.
(%)
Figure 5: Export Share of Advanced Countries and Japan

The Outlook for the Japanese Economy | 19 September 2014 5
(2)HOUSEHOLD SECTOR Real private consumption plunged in Apr-Jun, by an annualized -19.0%
QoQ. The figure appears to reflect a reactionary drop in the surge of demand ahead of the consumption tax hike as well as weaker real purchasing power because of the tax hike. The private consumption recovery has been weaker recently because of adverse climate conditions over the summer, but is likely to persist because of improving employment and wage conditions. With employee numbers picking up, scheduled wages rose even more in July and bonuses and other special wage also jumped (Figure 9). As a result of the spring wage negotiations, wages (including annual wage hikes and higher basic wage) rose 2.07% this year, a 0.36%pt increase from 2013. As a result, one-time payments totaled approximately JPY1.54 million, a 6% increase from 2013. Macro-level real wages also appear to reflect this. Employment has been expanding and wages rising because of companies’ greater willingness to hire, and household incomes are thus expected to keep going up. This is expected to support a private consumption recovery (Figure 10).
Private consumption slumping due to consumption tax hike; to recover as employment and wages improve
-1.5
-1.0
-0.5
0.0
0.5
1.0
1.5
2.0
2.5
3.0
2013 2014
Special wagesUnscheduled wagesScheduled wagesPer capita wagesRegular workers
(YoY, %)
Figure 9: Per Capita Wages and Workers
Note: Companies with 5+ employees.Source: Compiled by BTMU Economic Research Office from MHLQ data.
-20
-15
-10
-5
0
5
10
2008 2009 2010 2011 2012 2013 2014 2015
Figure 10: Real Private Consumption
Driven and downturn by consumption tax hike
Impact of decline in real income resulting fromconsumption tax hikeOther
(QoQ annualized, %)
Source: Compiled by BTMU Economic Research Office from Cabinet Officedata.
Forecast
-30-20-100102030405060
-3-2-10123456
Che
mic
als
Iron
,Ste
el
Pet
role
um
Cer
amic
s,S
tone
,Cla
y
Non
ferr
ous
met
als
Te
xtile
s
Pul
p,P
ape
r
Tra
nspo
rtat
ion
ma
chin
ery
Ele
ctric
al m
achi
ner
y
Gen
eral
ma
chin
ery
Oth
er m
anuf
act
urin
g
Pre
cisi
on m
ach
iner
y
Foo
d,B
ever
age
s
Tra
nsp
ort
Rea
l est
ate
Wh
oles
alin
g, r
eta
iling
Ele
ctric
,Gas
util
itie
s
Con
stru
ctio
n
Ser
vice
s
Oth
er
non-
ma
nufa
ctur
ing
Info
rma
tion
com
mun
icat
ion
Leas
ing
YoY change(contribution,left axis)YoY change(right axis)
Figure 8: FY2014 Capital Expenditures Plans, Large Enterprises
Source: Compiled by BTMU Economic Research Office from Development Bank of Japan materials.
(%) (%)
Manufacturers (materials)
Manufacturers (processing) Non-manufacturers
-10
-8
-6
-4
-2
0
2
4
6
8
10
-100
-80
-60
-40
-20
0
20
40
60
80
100
2007 2008 2009 2010 2011 2012 2013 2014
(JPY trn)(%)
Non-manufacturers (excl financial) (right axis)Manufacturers (right axis)Non-manufacturers (excl financial) YoY change (left axis)Manufacturers, YoY change (left axis)
Note: Current profit figures of 1,120 companies that had released Apr-Jun earnings as of August 10, and for which continuous data from Apr-Jun2006 is available.
Source: Compiled by BTMU Economic Research Office from Bloomberg data.
Figure 7: Current Profits, Companies Listed on the First Section of the TSE (excl Financial)
Manufacturers (+8.6%)Non-manufacturers (+3.9%)

The Outlook for the Japanese Economy | 19 September 2014 6
Real residential investment plummeted an annualized -35.6% QoQ in Apr-Jun, the first drop in nine quarters. New housing starts, a leading indicator of residential investment, have been declining after peaking at end-2013, especially for owned housing and build for housing sale, and residential investment, calculated in terms of investments made, also started to fall (Figure 11). Residential investment is expected to continue to drop for some time in reaction to the surge of demand ahead of the consumption tax hike, while a slowing household formation rate is also forecasted to exert downward pressure over the medium to long term. However, we expect the surge of demand ahead of the next consumption tax hike (expected in October 2015) to lift residential investment temporarily (Figure 12).
(3)GOVERNMENT SECTOR Real public demand was roughly flat in Apr-Jun, at an annualized
-0.2% QoQ (Figure 13). The fall in public investment shrank to -2.0% QoQ annualized because of more outlays made related to the FY2013 supplementary budget passed in February besides an increase in government final consumption expenditures primarily for the expansion of medical expenses and care costs as a benefit.
Public investment is likely to remain high and to turn positive in Jul-Sept, bolstered by the FY2013 supplementary budget spending. However, the FY2013 supplementary budget is small in scale compared to the FY2012 supplementary budget, which supported expanded public investment. As a result, public investment is not likely to continue rising over an extended period.
Residential investment slump in reaction to the surge of demand ahead of consumption tax hike
Public investment decline to slow because of supplementary budget outlays
Public investment expected to turn positive, but not to last
-20
-15
-10
-5
0
5
10
15
20
25
30
2012 2013 2014
(YoY, %)
Build for housing saleIssued housingRented housingOwned housingNew housing starts
Source: Compiled by BTMU Economic Research Office from MLIT data.
Figure 11: New Housing Starts by Owner Occupant Relation
-50
-40
-30
-20
-10
0
10
20
30
2008 2009 2010 2011 2012 2013 2014 2015
Driven and downturn byconsumption tax hike
Impact of decline in realincome resulting fromconsumption tax hikeOther
Forecast
Source: Compiled by BTMU Economic Research Office from Cabinet Officedata.
(QoQ annualized, %)
Figure 12 :Real Residential Investment

The Outlook for the Japanese Economy | 19 September 2014 7
(4)INFLATION Although CPI has remained firm, the rate of increase has slowed
recently. The rate of increase in CPI (core CPI, excluding fresh foods as well as the direct impact from the consumption tax hike) stood at +1.3% YoY in Apr-Jun, roughly level with Jan-Mar. This appears to be due to the largely-exhausted upward effect on prices by the weakening JPY. Another factor appears to be slumping private consumption in the wake of the surge of demand brought forward, causing inflation of durable goods price to weaken.
Looking ahead, we think the rate of increase in CPI is likely to keep weakening through year’s end as the JPY depreciation effect diminishes. Thereafter, we think inflation will once again start to gradually rise as macro supply-demand conditions continue to tighten as the economy stays on a recovery path (Figure 14). We forecast core CPI (excluding the effect of the consumption tax hike) to stand at +1.1% YoY this fiscal year, then pick up slightly to +1.2% YoY in FY2015.
3. Current Conditions and Outlook, Monetary Policy and Financial Markets
(1)MONETARY POLICY AND LONG-TERM YIELD The BoJ continues to carry out the quantitative and qualitative
monetary easing introduced in April 2013. At its July Monetary Policy meeting, the BoJ reiterated its outlook that the 2% price stability target rate would be achieved in FY2015. That said, the BoJ outlook is considerably more bullish than private sector economists’. Private sector economists have raised their real GDP growth forecasts for this fiscal year, narrowing the forecast gap with the BoJ, and as a result the CPI outlooks have also been converging (Figure 15). However, since private sector and BoJ growth forecasts for FY2015 differ by a mere 0.2%pt, the two CPI forecasts are unlikely to align because of the supply-demand gap once again improving more than the private sector expects.
The rate of increase in CPI temporarily peaking as effect of weaker JPY is diminished
Inflation to remain positive as supply-demand gap tightens
Price stability target unlikely to be met in FY2015; BoJ to sustain monetary easing
-10
-8
-6
-4
-2
0
2
4
6
8
10
12
2007 2008 2009 2010 2011 2012 2013 2014
Figure13:Real Public Demand
Public inventory investmentPublic sector fixed capital formationGovernment final expenditure consumptionReal public demand
Source: Compiled by BTMU Economic Research Office from Cabinet Office data.
(QoQ annualized, %)
-6
-4
-2
0
2
4
6
-2
-1
0
1
2
3
4
2010 2011 2012 2013 2014 2015 2016
(YoY, %)CPI (goods sensitive to exchange rate changes)Same (durable goods)Same (other)CPI (overall, excl fresh foods, left axis)GDP gap (right axis)
Notes: 1) CPI excluding direct impact of consumption tax hike. 2) Goods sensitve to exchange rate changes is energy, airfares,
overseas travel packages. 3) GDP gap is difference between real GDP and potential real GDP
divided by potential real GDP.Source: Compiled by BTMU Economic Research Office from MIC, Cabinet
Office data.
Forecast
Figure 14: CPI and the GDP Gap(%)

The Outlook for the Japanese Economy | 19 September 2014 8
The BoJ will likely continue to maintain large-scale monetary easing while keeping a close eye on the effects.
The yield on the 10Yr JGB recently fell to around 0.5% level and has remained low. This is due to a tighter supply-demand of JGBs because of the BoJ’s huge purchases as well as lower yields in the US and Europe. As the Japanese economy’s growth momentum and inflation rate gain steam and US yields rise as expectations of a rate hike build, upward pressure on Japan’s long-term yield is also likely to increase (Table 1). However, continued BoJ quantitative and qualitative monetary easing are expected to absorb such upward pressures, and the long-term JGB yield will likely rise only at a slow pace.
(2)EXCHANGE RATES USD/JPY had been trading in a narrow range around JPY102, but JPY
selling has recently picked up. The Japan-US monetary base ratio (Japan’s monetary base size divided by the US), tightly correlated to USD/JPY since the collapse of Lehman Brothers, has been rising as the BoJ maintains large-scale monetary easing while the FRB scales down asset purchases (Figure 16). Further, the US-Japan 2Yr yield spread (US minus Japan) has been gradually widening as US yields rise. Although encouraging JPY weakening and USD strengthening behind the deadlock of exchange rate, such trend may have been gradually reflected in the exchange rate.
We expect the JPY to weaken and the USD to strengthen going forward gradually. As explained above, Japan’s long-term yield will remain low because of the BoJ’s continued large-scale monetary easing, while the US long-term yield will come under upward pressure as speculation of a US rate hike builds. The Japan-US real long-term yield spread is expected to widen even more as Japan’s inflation rate stays
Long-term yield to rise slowly as BoJ large-scale monetary easing absorbs upward pressure from improving fundamentals
JPY selling pressures coming to prevail in USD/JPY
Widening US-Japan yield spread causing JPY-weakening/ USD-strengthening pressures
0.0
0.2
0.4
0.6
0.8
1.0
1.2
1.4
2013Apr Jul Oct
2014Jan Apr Jul
2013Apr Jul Oct
2014Jan Apr Jul
The rate of increase in CPI
Real GDP growth rate
(BoJ outlook minus Private sector outlook, % point)
Notes: 1) BoJ outlook is median outlook of Policy meeting members; Private sector outlook is average outlook of private research institutions (approximately 40) responding to ESP Forecast Survey.
2) The rate of increase in CPI is overall excluding fresh foods anddirect impact of consumption tax hike.
Source: Compiled by BTMU Economic Research Office from BoJ, Japan Center for Economic Research materials.
FY2014 FY2015
Figure 15: Disparity between BoJ's Outlook andPrivate Sector Outlook
Inflation rate To rise
Real economicgrowth rate
To rise
Fiscal balance To improve
Average remainingduration for issued JGBs
To gradually lengthening
Monetary baseBallooning due to purchases of
long-term JGBs
Average remainingdurations of BoJ JGB
To lengthen
Policy rate・loan rate To be held low
Overseasinterest rates
US interest rates To gradually rise
Stock prices To rise
Bank lending To gradually increase
Exchange rates JPY to weaken further
Direction ofeconomic policy
stable government mainlysuported by Liberal Democratic
Party of JapanFinancial regulations
(Basel III)Specified holdings of highly-
liquid risk free assets
Source: Compiled by BTMU Economic Research Office from various materials.
Fiscalpremium
Monetarypolicy
Portfoliorebalancing
Policyoperations・
Monetarysystem
Table 1:Factors Affecting Long-Term Yields
Factor Indicator Outlook for indicator
Fundamentals
Direction of impact on(arrow) and importance
for long-term yields

The Outlook for the Japanese Economy | 19 September 2014 9
firm (Figure 17). Although the risk of JPY-buying as a last resort safe haven bears watching as global geopolitical risks intensify, we think that conditions will continue to support JPY selling.
For further details, please contact the Economic Research Office, Bank of Tokyo-Mitsubishi UFJ
Chief Manager, Yasuhiro Ishimaru Tel: 03-3240-3204
Written by Rei Tsuruta [email protected]
Takayuki Miyadou [email protected]
Tooru Kanahori [email protected]
Yuusuke Yokota [email protected]
This report is intended for information purposes only and shall not be construed as solicitation to take any action such as purchasing/selling/investing financial market products. In taking any action, each reader is requested to act on the basis of his or her own judgment. This report is based on information believed to be reliable, but we do not guarantee its accuracy. The contents of the report may be revised without advance notice. Also, this report is a literary work protected by the copyright act. No part of this report may be reproduced in any form without express statement of its source. This report is also available for viewing online.
0.0
0.1
0.2
0.3
0.4
0.5
0.6
0.7
0.8
0.9
70
75
80
85
90
95
100
105
110
115
2009 2010 2011 2012 2013 2014
USD/JPY (left axis)Japan/US Monetary base ratio (left axis)US-Japan yield spread (right axis)
Figure 16: USD/JPY and Japan/US Monetary Base Ratio and Yield Spread
(USD/JPY, Japan/US Monetary base ratio, 2009 = 100) (% points)
Notes: 1) Japan/US Monetary base ratio is Japan's monetary base divided by US monetary base. Indexed using base date January 2009 = 100.
2) US-Japan yield spread is US 2Yr Treasury yield minus Japan 2Yr JGB yield.
Source: Compiled by BTMU Economic Research Office from BoJ data.
-3
-2
-1
0
1
2
3
40
60
80
100
120
140
160
2000 2002 2004 2006 2008 2010 2012 2014 2016
(USD/JPY)
USD/JPY(left axis)
US-Japan real long-term yeild spread(US-Japan,right axis)
Source: Compiled by BTMU Economic Research Office from Bloomberg, BoJ data.
(% point)
Forecast
Figure 17: USD/JPY and US-Japan Real Long-Term Yeild Spread
Japanese CPI jumps due to JPY weakening, US CPI sluggish
Forecast
20161Q 2Q 3Q 4Q 1Q 2Q 3Q 4Q 1Q 2Q 3Q 4Q 1Q
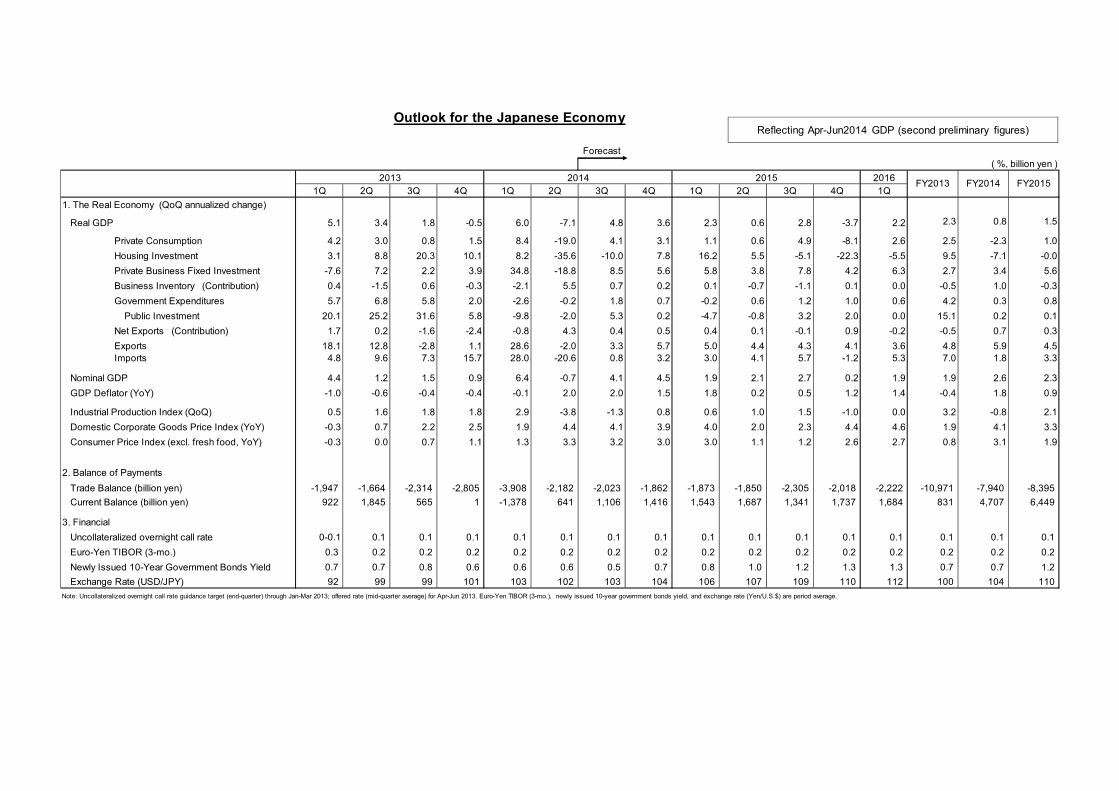
1. The Real Economy (QoQ annualized change)
Real GDP 5.1 3.4 1.8 -0.5 6.0 -7.1 4.8 3.6 2.3 0.6 2.8 -3.7 2.2 2.3 0.8 1.5
Private Consumption 4.2 3.0 0.8 1.5 8.4 -19.0 4.1 3.1 1.1 0.6 4.9 -8.1 2.6 2.5 -2.3 1.0
Housing Investment 3.1 8.8 20.3 10.1 8.2 -35.6 -10.0 7.8 16.2 5.5 -5.1 -22.3 -5.5 9.5 -7.1 -0.0
Private Business Fixed Investment -7.6 7.2 2.2 3.9 34.8 -18.8 8.5 5.6 5.8 3.8 7.8 4.2 6.3 2.7 3.4 5.6
Business Inventory (Contribution) 0.4 -1.5 0.6 -0.3 -2.1 5.5 0.7 0.2 0.1 -0.7 -1.1 0.1 0.0 -0.5 1.0 -0.3
Government Expenditures 5.7 6.8 5.8 2.0 -2.6 -0.2 1.8 0.7 -0.2 0.6 1.2 1.0 0.6 4.2 0.3 0.8
Public Investment 20.1 25.2 31.6 5.8 -9.8 -2.0 5.3 0.2 -4.7 -0.8 3.2 2.0 0.0 15.1 0.2 0.1
Net Exports (Contribution) 1.7 0.2 -1.6 -2.4 -0.8 4.3 0.4 0.5 0.4 0.1 -0.1 0.9 -0.2 -0.5 0.7 0.3
Exports 18.1 12.8 -2.8 1.1 28.6 -2.0 3.3 5.7 5.0 4.4 4.3 4.1 3.6 4.8 5.9 4.5 Imports 4.8 9.6 7.3 15.7 28.0 -20.6 0.8 3.2 3.0 4.1 5.7 -1.2 5.3 7.0 1.8 3.3
Nominal GDP 4.4 1.2 1.5 0.9 6.4 -0.7 4.1 4.5 1.9 2.1 2.7 0.2 1.9 1.9 2.6 2.3
GDP Deflator (YoY) -1.0 -0.6 -0.4 -0.4 -0.1 2.0 2.0 1.5 1.8 0.2 0.5 1.2 1.4 -0.4 1.8 0.9
Industrial Production Index (QoQ) 0.5 1.6 1.8 1.8 2.9 -3.8 -1.3 0.8 0.6 1.0 1.5 -1.0 0.0 3.2 -0.8 2.1
Domestic Corporate Goods Price Index (YoY) -0.3 0.7 2.2 2.5 1.9 4.4 4.1 3.9 4.0 2.0 2.3 4.4 4.6 1.9 4.1 3.3
Consumer Price Index (excl. fresh food, YoY) -0.3 0.0 0.7 1.1 1.3 3.3 3.2 3.0 3.0 1.1 1.2 2.6 2.7 0.8 3.1 1.9
2. Balance of Payments
Trade Balance (billion yen) -1,947 -1,664 -2,314 -2,805 -3,908 -2,182 -2,023 -1,862 -1,873 -1,850 -2,305 -2,018 -2,222 -10,971 -7,940 -8,395
Current Balance (billion yen) 922 1,845 565 1 -1,378 641 1,106 1,416 1,543 1,687 1,341 1,737 1,684 831 4,707 6,449
3. Financial
Uncollateralized overnight call rate 0-0.1 0.1 0.1 0.1 0.1 0.1 0.1 0.1 0.1 0.1 0.1 0.1 0.1 0.1 0.1 0.1
Euro-Yen TIBOR (3-mo.) 0.3 0.2 0.2 0.2 0.2 0.2 0.2 0.2 0.2 0.2 0.2 0.2 0.2 0.2 0.2 0.2
Newly Issued 10-Year Government Bonds Yield 0.7 0.7 0.8 0.6 0.6 0.6 0.5 0.7 0.8 1.0 1.2 1.3 1.3 0.7 0.7 1.2
Exchange Rate (USD/JPY) 92 99 99 101 103 102 103 104 106 107 109 110 112 100 104 110
FY2015
( %, billion yen )
FY2014
Outlook for the Japanese Economy
FY2013
Note: Uncollateralized overnight call rate guidance target (end-quarter) through Jan-Mar 2013; offered rate (mid-quarter average) for Apr-Jun 2013. Euro-Yen TIBOR (3-mo.), newly issued 10-year government bonds yield, and exchange rate (Yen/U.S.$) are period average.
2013 20152014
Reflecting Apr-Jun2014 GDP (second preliminary figures)

1.Main Economic IndicatorsAs of Sep. 19, 2014
Fiscal Fiscal 2013
2012 2013 4Q 1Q 2Q APR MAY JUN JUL AUG
Real GDP Growth Rate <% changes from 0.7 2.3 -0.5 6.0 -7.1 *** *** *** *** ***
previous period at SA annual rate> (2.5) (3.0) (-0.1)
Index of All Industries Activity 0.1 1.9 0.3 1.6 -3.3 -4.4 0.6 -0.4 #N/A #N/A
(1.9) (3.2) (-0.9) (-0.9) (-1.4) (-0.5) #N/A #N/A
Industrial Production Index -2.9 3.2 1.8 2.9 -3.8 -2.8 0.7 -3.4 0.4 #N/A
Production (5.8) (8.2) (2.7) (3.8) (1.0) (3.1) (-0.7) #N/A
Shipments -1.8 2.9 2.6 4.6 -6.8 -5.0 -1.0 -1.9 0.7 #N/A
(6.5) (7.4) (1.3) (2.4) (-0.8) (2.2) (-0.1) #N/A
Inventory -3.0 -1.4 -1.9 0.2 4.6 -0.5 3.0 2.0 0.9 #N/A
(-4.3) (-1.4) (2.8) (-1.9) (0.8) (2.8) (2.9) #N/A
Inventory/Shipments Ratio 114.4 106.2 104.6 102.6 107.7 103.7 107.8 111.5 109.1 #N/A
(2010=100) [117.7] [113.4] [108.3] [108.2] [106.3] [110.3] [109.2] [110.7]
Domestic Corporate Goods Price Index -1.1 1.9 0.2 0.2 3.1 2.9 0.3 0.1 0.4 -0.2
(2.5) (1.9) (4.3) (4.2) (4.4) (4.5) (4.3) (3.9)
Consumer Price Index(SA, total, excl.fresh foods) -0.2 0.8 0.3 -0.1 2.7 2.1 0.3 0.2 0.2 #N/A
(1.1) (1.3) (3.3) (3.2) (3.4) (3.3) (3.3) #N/A
Index of Capacity Utilization 95.4 100.0 100.2 106.0 101.4 103.0 102.3 98.9 98.1 #N/A
(2010=100) [93.1] [95.1] [96.3] [96.0] [97.0] [96.0] [97.8] [96.7]
Machinery Orders(Private Demand, -3.0 11.5 1.9 4.2 -10.4 -9.1 -19.5 8.8 3.5 #N/A
Excl.Electric Power and Ship building) (13.3) (16.4) (-0.4) (17.6) (-14.3) (-3.0) (1.1) #N/A
Manufacturing -10.1 10.2 2.0 3.9 -8.5 -9.4 -18.6 6.7 20.3 #N/A
(14.8) (22.1) (4.1) (19.3) (-3.8) (-1.3) (13.4) #N/A
Non-manufacturing 2.8 12.1 4.9 -1.0 -6.7 0.9 -17.8 4.0 -4.3 #N/A
Excl.Electric Power & Ship building (12.4) (11.8) (-3.1) (16.7) (-19.9) (-4.1) (-7.4) #N/A
Shipments of Capital Goods -6.0 5.6 4.8 10.8 -8.0 -6.9 -1.5 -0.1 5.2 #N/A
(Excl.Transport Equipment) (10.8) (16.8) (8.1) (9.1) (5.1) (10.0) (11.1) #N/A
Construction Orders 2.4 20.1
(18.1) (1.6) (35.9) (104.9) (13.7) (9.3) (24.4) #N/A
Private 2.6 14.2
(10.7) (-18.0) (9.5) (35.2) (-6.0) (3.6) (22.8) #N/A
Public 5.3 31.2
(37.1) (34.7) (143.0) (418.4) (55.3) (62.1) (52.3) #N/A
Public Works Contracts 10.3 17.7
(5.0) (16.8) (14.4) (10.0) (21.1) (14.3) (3.5) (-8.1)
Housing Starts 89.3 98.7 102.6 93.9 88.8 90.6 87.2 88.3 83.9 #N/A
10,000 units at Annual Rate, SA (6.2) (10.6) (12.9) (3.4) (-9.3) (-3.3) (-15.0) (-9.5) (-14.1) #N/A
Total floor (4.8) (9.9) (13.8) (0.5) (-13.4) (-6.9) (-19.4) (-13.6) (-18.2) #N/A
Sales at Retailers 0.3 2.9
(3.0) (6.6) (-1.8) (-4.3) (-0.4) (-0.6) (0.6) #N/A
Real Consumption Expenditures 1.6 0.9 -0.2 4.6 -9.0 -13.3 -3.1 1.5 -0.2 #N/A
of Households over 2 persons (SA) (0.6) (2.3) (-5.2) (-4.6) (-8.0) (-3.0) (-5.9) #N/A
Propensity to Consume 74.8 75.5 74.6 78.8 73.8 74.2 70.3 74.8 75.3 #N/A
(SA,%) [74.5] [76.2] [74.0] [73.6] [74.0] [73.0] [73.4] [74.3]
Overtime Hours Worked -0.3 4.4 1.6 2.1 0.6 -0.4 -0.5 -1.2 -0.6 #N/A
(All Industries, 5 employees or more) (6.0) (7.1) (5.1) (6.4) (4.9) (3.9) (2.9) #N/A
Total Cash Earnings (Regular Employees -0.7 0.1
Only; All Industries, 5 employees or more) (0.4) (0.1) (0.8) (0.7) (0.6) (1.0) (2.4) #N/A
Employment Index(Regular Employees Only;'All Industries, 107 45 49 54 65 62 65 69 77 #N/A
5 employees or more)(Change over the M/Q/Y) 133 24 33 29 32 37 40 42
Ratio of Job Offers to Applicants 0.82 0.97 1.01 1.05 1.09 1.08 1.09 1.10 1.10 #N/A
(SA,Times) [0.82] [0.85] [0.90] [0.88] [0.90] [0.92] [0.94] [0.95]
Unemployment Rate 4.3 3.9 3.9 3.6 3.6 3.6 3.5 3.7 3.8 #N/A
(SA,%) #N/A #N/A #N/A #N/A #N/A #N/A #N/A #N/A
Economy Watcher Survey 46.3 54.0 53.7 55.2 44.8 41.6 45.1 47.7 51.3 47.4
(Judgment of the present condition D.I,%) [41.6] [53.3] [55.1] [56.5] [55.7] [53.0] [52.3] [51.2]Bankruptcies (Number of cases) 11,719 10,536 2,571 2,460 2,613 914 834 865 882 727
(-7.7) (-10.0) (-11.0) (-11.4) (-8.0) (1.6) (-20.1) (-3.5) (-13.9) (-11.2)
(Notes)
Unless otherwise indicated, tabulated figures and those in parentheses show % changes from previous quarter/month as applicable.
The figures in ( ) indicate % changes from previous year.
[ ] show the comparable figure of the previous year.
MAIN ECONOMIC AND FINANCIAL INDICATORS (JAPAN)
20142014

As of Sep. 19, 2014
Fiscal Fiscal 2013
2012 2013 4Q 1Q 2Q APR MAY JUN JUL AUG
Customs Clearance (Exports in Yen Terms) -2.1 10.8 (17.4) (6.6) (0.1) (5.1) (-2.7) (-1.9) (3.9) (-1.3)
Value 4.0 10.2 (12.5) (6.0) (1.1) (3.0) (0.7) (-0.3) (2.9) (1.6)
Volumes -5.8 0.6 (4.3) (0.7) (-1.0) (2.0) (-3.4) (-1.6) (1.0) (-2.9)
Imports (In Yen terms) 3.4 17.4 (24.1) (17.6) (2.7) (3.4) (-3.5) (8.5) (2.3) (-1.5)
Value 2.5 14.6 (18.4) (10.3) (2.1) (4.8) (0.5) (1.2) (2.7) (3.2)
Volumes 1.0 2.3 (4.8) (6.5) (0.5) (-1.3) (-4.0) (7.2) (-0.3) (-4.6)
Current Account (100 mil. yen) 42,233 8,312 -14,311 -8,187 3,112 1,874 5,228 -3,991 4,167 #N/A
Goods (100 mil. yen) -52,474 -109,709 -31,002 -41,190 -19,934 -7,804 -6,759 -5,371 -8,281 #N/A
Services (100 mil. yen) -41,864 -34,522 -11,319 -6,194 -9,586 -6,597 -682 -2,306 -4,590 #N/A
Financial Account (100 mil. yen) 20,255 -23,521 -28,031 -13,285 3,543 -16,342 9,056 10,829 4,463 #N/A
Gold & Foreign Exchange Reserves ($1mil.) 1,254,356 1,279,346 1,266,815 1,279,346 1,283,921 1,282,822 1,283,920 1,283,921 1,276,027 1,278,011
Exchange Rate (\/$) 83.08 100.23 100.45 102.78 102.13 102.56 101.79 102.05 101.72 102.96
3.Financial Market Indicators
Fiscal Fiscal 2013
2012 2013 4Q 1Q 2Q APR MAY JUN JUL AUG
Uncollateralized Overnight Call Rates 0.083 0.073 0.072 0.074 0.067 0.065 0.068 0.067 0.066 0.069
[0.084] [0.083] [0.073] [0.072] [0.073] [0.074] [0.073] [0.073]
Euro Yen TIBOR 0.312 0.223 0.220 0.215 0.211 0.212 0.210 0.210 0.210 0.210
(3 Months) [0.318] [0.270] [0.228] [0.228] [0.228] [0.228] [0.228] [0.228]
Newly Issued Japanese Government Bonds Yields 0.560 0.640 0.735 0.640 0.565 0.620 0.570 0.565 0.530 0.490
(10 Years) [0.795] [0.560] [0.855] [0.600] [0.860] [0.855] [0.795] [0.720]
Average Contracted Interest Rates 1.184 1.077
on Loans and Discounts(City Banks) 1.102 1.077 1.067 1.078 1.077 1.067 1.066 #N/A
(% changes from previous period) (-0.023) (-0.025) (-0.010) (0.001) (-0.001) (-0.010) (-0.001) #N/A
The Nikkei Stock Average 12,398 14,828 16,291 14,828 15,162 14,304 14,632 15,162 15,621 15,425
(TSE 225 Issues) [10,395] [12,398] [13,677] [13,861] [13,775] [13,677] [13,668] [13,389]
M2(Average) (2.5) (3.9) (4.2) (4.0) (3.3) (3.5) (3.3) (3.0) (3.0) (3.0)
Broadly-defined Liquidity(Average) (1.0) (3.7) (4.3) (3.9) (3.1) (3.3) (3.0) (2.9) (2.9) (2.9)
Principal Figures of Financial Institutions
Banks & Shinkin (0.9) (2.0) (2.2) (2.2) (2.2) (2.0) (2.2) (2.3) (2.2) (2.2)
Loans and Banks (1.1) (2.3) (2.4) (2.4) (2.3) (2.2) (2.4) (2.5) (2.3) (2.3)
Discount City Banks etc. (-0.2) (1.7) (1.8) (1.6) (1.3) (1.1) (1.3) (1.4) (1.0) (1.0)
(Average) Regional Banks (2.9) (3.3) (3.2) (3.4) (3.6) (3.5) (3.6) (3.8) (3.7) (3.7)
Regional Banks Ⅱ (0.8) (1.4) (2.0) (2.4) (2.5) (2.5) (2.5) (2.6) (2.8) (2.9)
Shinkin (-0.7) (0.3) (0.5) (0.9) (1.2) (1.1) (1.2) (1.3) (1.4) (1.5)
Total(3 Business Condition) (2.2) (3.8) (3.9) (3.6) (2.8) (3.0) (2.9) (2.6) (2.6) (2.8)
Deposits City Banks (1.8) (3.7) (3.7) (3.2) (2.1) (2.3) (2.4) (1.7) (2.0) (2.4)
and CDs Regional Banks (2.8) (4.3) (4.5) (4.2) (3.6) (3.9) (3.6) (3.4) (3.2) (3.2)
(Average) Regional Banks Ⅱ (1.8) (2.5) (3.2) (3.1) (3.0) (3.0) (3.0) (3.1) (3.3) (3.2)
(Notes) Newly Issued Japanese Government Bonds Yields and Interest rates are averages. The Nikkei Stock Average is as of month-end.Unless otherwise indicated, tabulated figures and those in parentheses show % changes from previous quarter/month as applicable.The figures in ( ) indicate % changes from previous year.[ ] show the comparable figure of the previous year.
(Sources)Cabinet Office, National Accounts, Machinery Orders; METI, Indices of Tertiary Industry Activity, Industrial Production, Current Survey of Commerce; MOF, Trade Statistics, Balance of Payments;MPMHAPT, Consumer Price Index, Family Income and Expenditure Survey, Labour Force Survey; MHLW, Monthly Labour Survey; Ministry of Land, Infrastructure, and Transport, Economic ConstructionStatistics; BOJ, Corporate Price Index, Financial and Economic Statistics Monthly, etc.
2014
2014
2014
2014
2.Balance of Payments