the outlook for transportation fuel prices and .../media/others/events/2017/automotive... · the...
TRANSCRIPT
www.eia.govU.S. Energy Information Administration Independent Statistics & Analysis
The Outlook for Transportation Fuel Prices and Transportation Energy Use: Insights from AEO2017
Twenty-Fourth Annual Automotive Outlook SymposiumJune 1, 2017 | Detroit, MI
ByJohn Staub, Director Office for Petroleum, Natural Gas, and Biofuels Analysis

• Short-term outlook for crude oil and petroleum products
• Overview of the Annual Energy Outlook 2017
• Fuel prices
• Transportation energy consumption
• Projecting light-duty electric vehicle sales in the National Energy Modeling System (NEMS)
Automotive Outlook Symposium June 1, 2017
Outline
2

Forecast
-3
-2
-1
0
1
2
3
4
5
6
84
86
88
90
92
94
96
98
100
102
2012-Q1 2013-Q1 2014-Q1 2015-Q1 2016-Q1 2017-Q1 2018-Q1
Implied stock change and balance (right axis)World production (left axis)World consumption (left axis)
Source: EIA, Short-Term Energy Outlook May 2017
Automotive Outlook SymposiumJune 1, 2017
The global liquid fuels market is expected to be balanced or slightly over-supplied through the end of 2018World liquid fuels production and consumption balancemillion barrels per day (MMb/d) MMb/d
3
Forecast
40
45
50
55
60
65
70
75
80
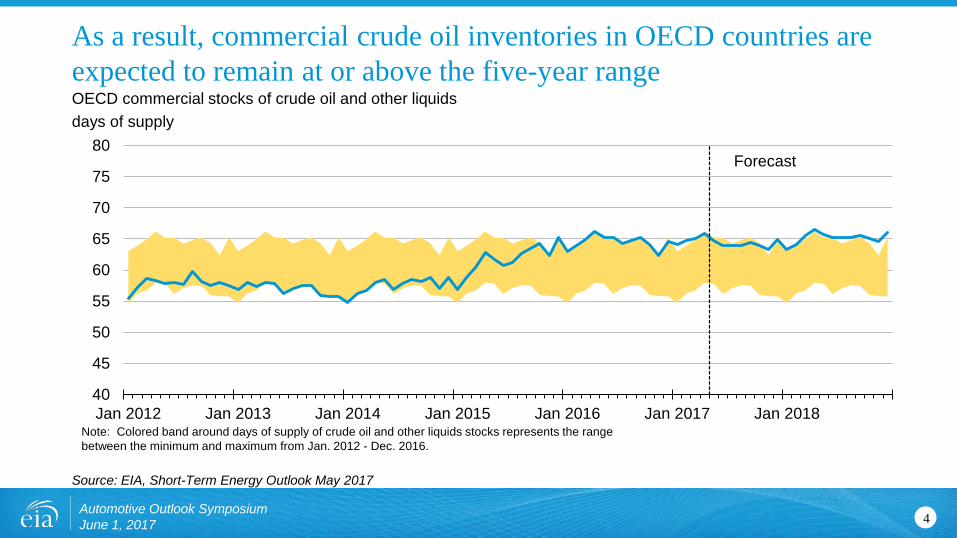
Jan 2012 Jan 2013 Jan 2014 Jan 2015 Jan 2016 Jan 2017 Jan 2018Note: Colored band around days of supply of crude oil and other liquids stocks represents the range between the minimum and maximum from Jan. 2012 - Dec. 2016.
Source: EIA, Short-Term Energy Outlook May 2017
Automotive Outlook SymposiumJune 1, 2017
As a result, commercial crude oil inventories in OECD countries are expected to remain at or above the five-year rangeOECD commercial stocks of crude oil and other liquidsdays of supply
4

-0.6-0.4-0.20.00.20.40.60.81.01.21.4
2016 2017 2018
OPEC countries North America Russia and Caspian Sea Latin America North Sea Other Non-OPEC
Forecast
Source: EIA, Short-Term Energy Outlook May 2017
Automotive Outlook SymposiumJune 1, 2017
North America is projected to be the largest source of liquid fuels production growth over the next two yearsWorld crude oil and liquid fuels production growthmillion barrels per day
5

-1.0
-0.5
0.0
0.5
1.0
1.5
2.0U
nite
d S
tate
s
Bra
zil
Can
ada
Rus
sia
Kaz
akhs
tan
Om
an
Nor
way
Mal
aysi
a
Aus
tralia
Syr
ia
Indi
a
Sou
th S
udan
Uni
ted
Kin
gdom
Egy
pt
Vie
tnam
Aze
rbai
jan
Col
ombi
a
Mex
ico
Chi
na
201820172016
Source: EIA, Short-Term Energy Outlook May 2017
Automotive Outlook SymposiumJune 1, 2017
U.S. producers will be the largest source of non-OPEC production growth in 2017 and 2018Non-OPEC crude oil and liquid fuels production growthmillion barrels per day
6

0.0
0.2
0.4
0.6
0.8
1.0
1.2
2016 2017 2018OECD* Non-OECD Asia Former Soviet Union Other
* Countries belonging to the Organization for Economic Cooperation and Development
Forecast
Source: EIA, Short-Term Energy Outlook May 2017
Automotive Outlook SymposiumJune 1, 2017
Growth in global consumption of liquid fuels will be led by non-OECD economies in 2017 and 2018World liquid fuels consumption growthmillion barrels per day
7

-0.30
-0.15
0.00
0.15
0.30
0.45
0.60
0.75
0.90
2015 2016 2017 201817.0
17.5
18.0
18.5
19.0
19.5
20.0
20.5
21.0
Motor gasoline (right axis) Jet fuel (right axis)Distillate fuel (right axis) Other fuels (right axis)Total product supplied (left axis) Product supplied forecast (left axis)
Source: EIA, Short-Term Energy Outlook May 2017
Automotive Outlook SymposiumJune 1, 2017
While U.S. consumption of liquid fuels will increase slightly in 2017 and 2018, led primarily by HGLsU.S. liquid fuels product suppliedmillion barrels per day (MMb/d) annual change (MMb/d)
8
0
20
40
60
80
100
120
140
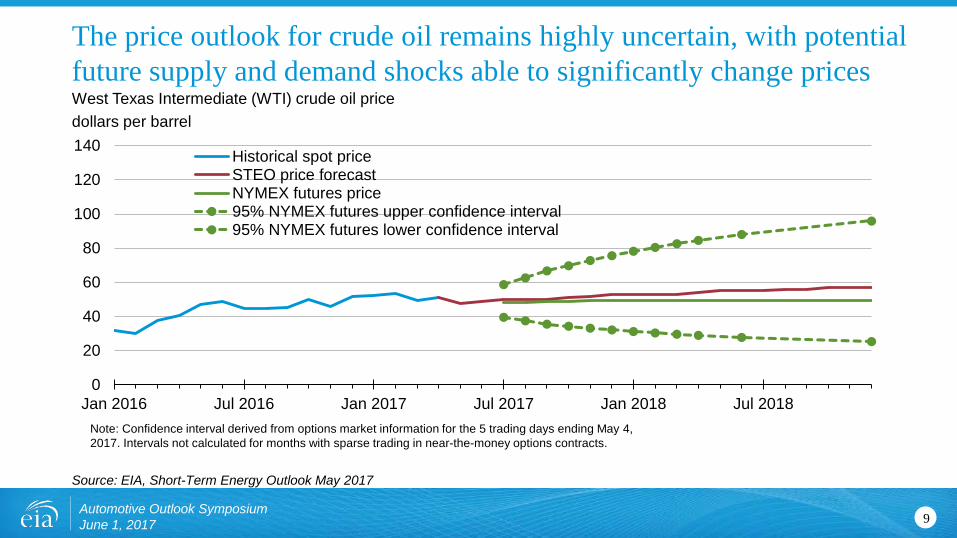
Jan 2016 Jul 2016 Jan 2017 Jul 2017 Jan 2018 Jul 2018
Historical spot priceSTEO price forecastNYMEX futures price95% NYMEX futures upper confidence interval95% NYMEX futures lower confidence interval
Note: Confidence interval derived from options market information for the 5 trading days ending May 4, 2017. Intervals not calculated for months with sparse trading in near-the-money options contracts.
Source: EIA, Short-Term Energy Outlook May 2017
Automotive Outlook SymposiumJune 1, 2017
The price outlook for crude oil remains highly uncertain, with potential future supply and demand shocks able to significantly change pricesWest Texas Intermediate (WTI) crude oil pricedollars per barrel
9

• Oil prices are primarily driven by global market balances that are mainly influenced by factors external to the NEMS model; in the Reference case, oil prices reach $109/b in 2016 dollars, compared to $43/b in the Low Oil Price case and $228/b in the High Oil Price case
• In the High Oil and Gas Resource and Technology case, lower costs and higher resource availability than in the Reference case allow for higher production at lower prices; in the Low Oil and Gas Resource and Technology case, more pessimistic assumptions about resources and costs are applied
• The effects of economic assumptions on energy consumption are addressed in the High and Low Economic Growth cases, which assume compound annual growth rates for U.S. gross domestic product of 2.6% and 1.6%, respectively, from 2016–40, compared with 2.2% annual growth in the Reference case
• A case assuming that the Clean Power Plan (CPP) is not implemented can be compared to the Reference case to show how that policy could affect energy markets and emissions
Automotive Outlook Symposium June 1, 2017
AEO2017 includes side cases with different assumptions of macroeconomic growth, world oil prices, technological progress, and energy policies
10
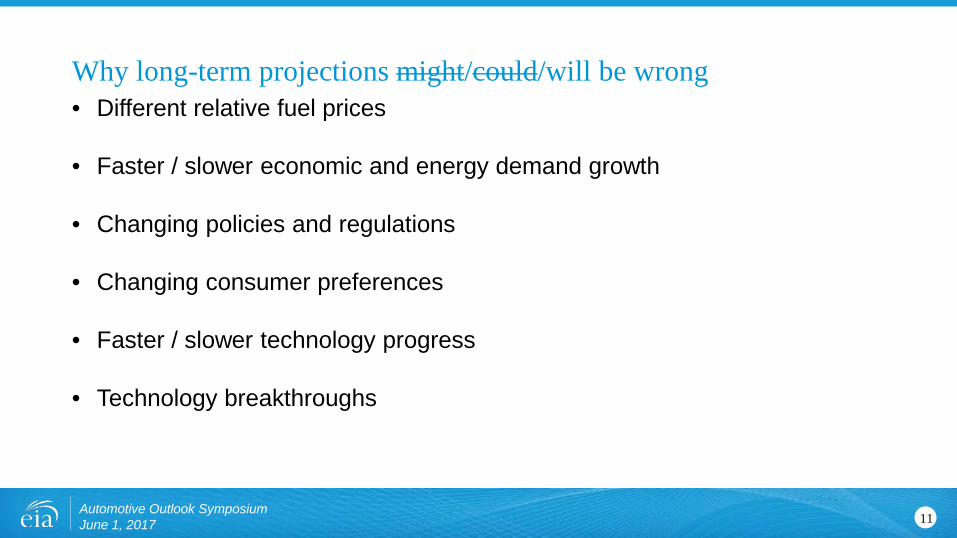
• Different relative fuel prices
• Faster / slower economic and energy demand growth
• Changing policies and regulations
• Changing consumer preferences
• Faster / slower technology progress
• Technology breakthroughs
Automotive Outlook Symposium June 1, 2017
Why long-term projections might/could/will be wrong
11

0
20
40
60
80
100
120
140
1980 1990 2000 2010 2020 2030 2040
2016history projections High Economic
GrowthLow Oil PriceHigh Oil PriceHigh Oil and Gas Resource and TechnologyReference Low Oil and Gas Resource and Technology Low Economic Growth
Source: EIA, Annual Energy Outlook 2017
Automotive Outlook Symposium June 1, 2017
Energy consumption varies minimally across all AEO cases, bounded by the High and Low Economic Growth cases Total energy consumptionquadrillion British thermal units
12

0
5
10
15
20
25
30
35
40
45
1980 1990 2000 2010 2020 2030 2040
petroleum and other liquidsnatural gas
other renewable energycoalnuclearhydroliquid biofuels
2016history projections
Source: EIA, Annual Energy Outlook 2017
Automotive Outlook Symposium June 1, 2017
Domestic energy consumption remains relatively flat in the Reference case, but the fuel mix changes significantlyEnergy consumption (Reference case)quadrillion British thermal units
13

0
20
40
60
80
100
120
140
1980 1990 2000 2010 2020 2030 2040
High Oil and Gas Resource and Technology High Oil PriceHigh Economic GrowthReference Low Economic GrowthLow Oil PriceLow Oil and Gas Resource and Technology
2016history projections
Source: EIA, Annual Energy Outlook 2017
Automotive Outlook Symposium June 1, 2017
Energy production ranges from nearly flat in the Low Oil and Gas Resource and Technology case, to continued growth in the High Resource and Technology caseTotal energy productionquadrillion British thermal units
14
0
10
20
30
40
1980 1990 2000 2010 2020 2030 2040
dry natural gas
crude oil and lease condensate
coalother renewablesnuclearnatural gas plant liquidshydro
2016history projections
Source: EIA, Annual Energy Outlook 2017
Automotive Outlook Symposium June 1, 2017
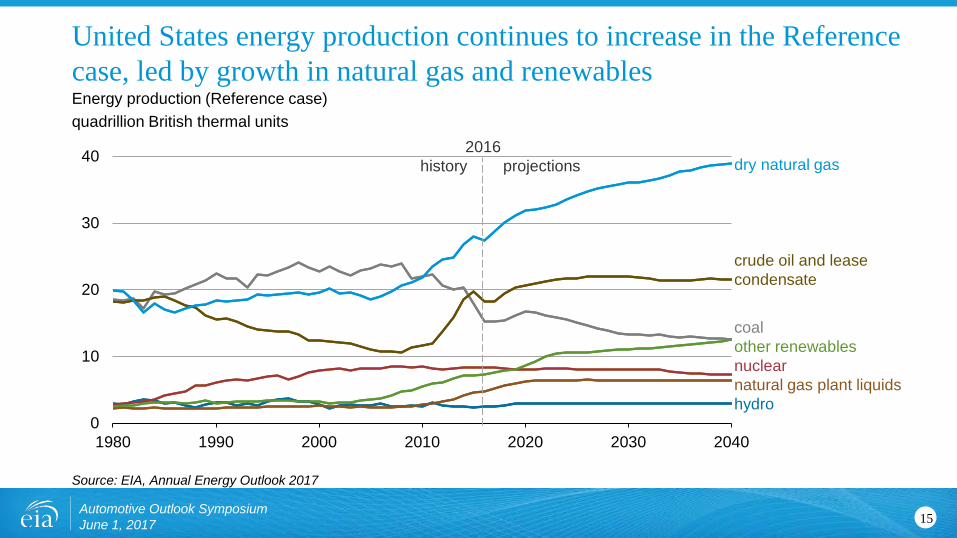
United States energy production continues to increase in the Reference case, led by growth in natural gas and renewablesEnergy production (Reference case)quadrillion British thermal units
15

Tight oil dominates U.S. production in the Reference case, but other types of oil production continue to yield significant volumes
Source: EIA, Annual Energy Outlook 2017
02468
1012141618
2000 2010 2020 2030 2040
Crude oil production million barrels per day
U.S. total
tight oil
non-tight oil
2016history projections
2020 2030 2040
2016projections
2020 2030 2040
2016projections
Low Oil and Gas Resource and Technology
Reference High Oil and Gas Resource and Technology
16Automotive Outlook Symposium June 1, 2017
-40
-20
0
20
40
60
80
2000 2005 2010 2015 2020 2025 2030 2035 2040
Low Oil PriceLow Oil and GasResource and TechnologyReference
High Oil Price
High Oil and GasResource and Technology
net imports
net exports
2016history projections
Source: EIA, Annual Energy Outlook 2017
Automotive Outlook SymposiumJune 1, 2017
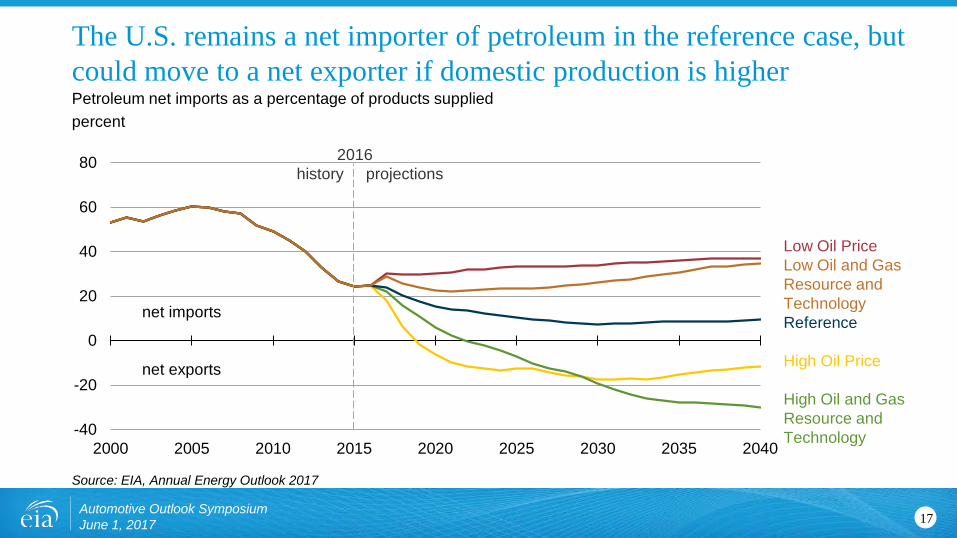
The U.S. remains a net importer of petroleum in the reference case, but could move to a net exporter if domestic production is higherPetroleum net imports as a percentage of products suppliedpercent
17

-30
-20
-10
0
10
20
30
40
2005 2010 2015 2020 2025 2030 2035 2040
2016history projections
solarwindoil and gasnuclearothercoal
additions
retirements
Source: EIA, Annual Energy Outlook 2017
Adam Sieminski, Johns Hopkins SAIS January 5, 2017
Lower capital costs and the availability of tax credits boost near-term wind additions and sustain solar additions; whereas coal-fired unit retirements in the Reference case are driven by low natural gas prices and the Clean Power PlanAnnual electricity generating capacity additions and retirements (Reference case) gigawatts
18

Prices
Automotive Outlook Symposium June 1, 2017 19

0
50
100
150
200
250
2000 2010 2020 2030 2040
North Sea Brent oil price2016 dollars per barrel
2016history projections
0
2
4
6
8
10
12
14
16
18
2000 2010 2020 2030 2040
2016history projections
Crude oil productionmillion barrels per day
Source: EIA, Annual Energy Outlook 2017
In the long-term, there is a wide set of potential outcomes for both crude oil prices and U.S. crude oil production
20Automotive Outlook SymposiumJune 1, 2017
High Oil and Gas Resource and Technology
High Oil PriceReference case
Low Oil PriceLow Oil and Gas Resource and Technology

0.00
1.00
2.00
3.00
4.00
5.00
6.00
0
20
40
60
80
100
120
2015 2020 2025 2030 2035 2040
Motor gasoline (right)
Diesel fuel (right)
North Sea Brent oil price (left)
Real petroleum prices2016 dollars per barrel 2016 $/gallon
Real fuel prices in transportation sector2016 $/MMBtu
Note: Motor gasoline is sales weighted-average price for all grades. Includes Federal, State, and local taxes.Source: EIA, Annual Energy Outlook 2017.
Real fuel prices in the transportation sector are lowest for natural gas, highest for electricity
Automotive Outlook Symposium June 1, 2017 21
0
5
10
15
20
25
30
35
40
45
2015 2020 2025 2030 2035 2040
Motor gasoline
Diesel fuel
Electricity
Natural gas
2016projections
2016projections

0
2
4
6
8
10
12
2000 2010 2020 2030 2040
2016history projections Low Oil and
Gas Resource and TechnologyHigh Oil PriceReference case Low Oil PriceHigh Oil and Gas Resource and Technology
Source: EIA, Annual Energy Outlook 2017
Automotive Outlook SymposiumJune 1, 2017
Natural gas prices also depend on developments in the oil market, with coproduction and substitution linking these marketsHenry Hub natural gas price2016 dollars per million Btu
22

0
5
10
15
20
25
0
2
4
6
8
10
2000 2010 2020 2030 2040
Liquefied natural gas exportstrillion cubic feet billion cubic feet per day
2016history projections
0
1
2
3
4
5
6
7
8
2000 2010 2020 2030 2040
Oil-to-natural gas price ratioenergy-equivalent terms
2016history projections
Source: EIA, Annual Energy Outlook 2017
U.S. LNG export levels vary across cases and reflect both the level of global demand, as well as by the difference between domestic and global natural gas prices
Reference High and Low Oil and Gas Resource and Technology
High and LowOil Price
23Automotive Outlook Symposium June 1, 2017

Transportation Energy Demand
Automotive Outlook Symposium June 1, 2017 24

0
5
10
15
20
25
30
35
2000 2010 2020 2030 2040
Transportation sector consumption quadrillion British thermal units
2016history projections
motorgasoline
distillatefuel oil
jet fuelelectricityother
0
5
10
15
20
25
30
35
2000 2010 2020 2030 2040
Transportation sector consumptionquadrillion British thermal units
2016history projections
light-duty vehiclesmedium-and heavy-duty vehiclesaircommerciallight trucksrailmarineother
Source: EIA, Annual Energy Outlook 2017
Transportation energy use declines between 2018 and 2034 in the Reference case, driven by improvements in fuel economy
25Automotive Outlook SymposiumJune 1, 2017

0
10
20
30
40
50
2000 2010 2020 2030 2040
Light-duty stock fleet fuel economymiles per gallon
car
fleetaverage
truck
2016history projections
20%
30%
40%
50%
60%
70%
2000 2010 2020 2030 2040
Light-duty vehicle sales sharespercent
truck
car
0%
2016history projections
Source: EIA, Annual Energy Outlook 2017
Average light-duty fuel economy improves in the Reference case, even as the share of light-duty trucks increases
26Automotive Outlook SymposiumJune 1, 2017

Source: EIA, Annual Energy Outlook 2017
Automotive Outlook Symposium June 1, 2017
Sales of battery electric, plug-in electric hybrid, and fuel cell vehicles increase in the Reference case because of lower projected battery costs and existing state policiesNew light-duty vehicle sales thousands of vehicles
27
0
5
10
15
20
2015 2020 2025 2030 2035 2040
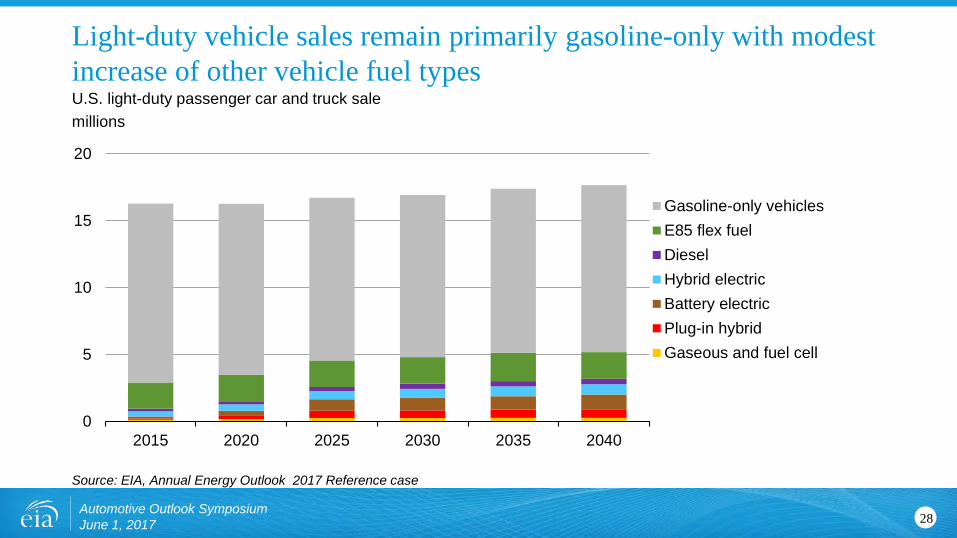
Gasoline-only vehiclesE85 flex fuelDieselHybrid electricBattery electricPlug-in hybridGaseous and fuel cell
Source: EIA, Annual Energy Outlook 2017 Reference case
Light-duty vehicle sales remain primarily gasoline-only with modest increase of other vehicle fuel typesU.S. light-duty passenger car and truck salemillions
28Automotive Outlook Symposium June 1, 2017

0%
5%
10%
15%
20%
25%
30%
2015 2020 2025 2030 2035 2040
Source: EIA, Annual Energy Outlook 2017 Reference case
Share of vehicles with micro hybrid subsystem increase across the projectionGasoline micro hybrid share of new gasoline vehiclesales
29Automotive Outlook Symposium June 1, 2017

With the second phase of fuel efficiency regulations, medium- and heavy-duty vehicle energy consumption declines over 2027-33 despite continued growth in miles traveled
Source: EIA, Annual Energy Outlook 2017
050
100150200250300350400450
2000 2020 2040
2016history projections
travel indicatorbillion vehicle-miles traveled
0
2
4
6
8
10
12
2000 2020 2040
2016history projections
stock fuel economymiles per gallon
0
1
2
3
4
5
6
7
2000 2020 2040
2016history projections
energy consumptionquadrillion British thermal units
Medium- and heavy-duty vehicle metrics
30Automotive Outlook SymposiumJune 1, 2017

• Ride sharing
• Autonomous vehicle technology in both passenger and freight applications
• Actual uptake of vehicles fueled by electricity and/or hydrogen
• Teleworking and telepresence
• Possible pursuit of deep decarbonization
• Future vehicle efficiency and taxation policies
Automotive Outlook Symposium June 1, 2017
Food for thought – transportation
31

Projecting Light-Duty Electric Vehicle Sales in the National Energy Modeling
System (NEMS)
Automotive Outlook Symposium June 1, 2017 32

• Manufacturers Technology Choice Component (MTCC) – adopt vehicle subsystem technologies (86) for different vehicle fuel types (conventional gasoline,
hybrid, diesel, etc.) based on value of fuel economy and/or performance improvement– alternative fuel vehicles (15)
• Consumer Vehicle Choice Component (CVCC)– determines consumer acceptance (market share) by vehicle fuel type (conventional gasoline,
hybrid, diesel, etc.) – nested multinomial logit model, coefficients vary by size class, for 9 attributes
• Meeting CAFE through the MTCC and CVCC– Application of alternative fuel vehicle credits– CAFE credits and banking– FFV credit limits
Modeling vehicle choice in the NEMS transportation module involves both manufacturers (building) and consumers (buying)
33Automotive Outlook Symposium June 1, 2017

• Historic and Projected vehicle attributes (fuel economy, horsepower, weight, tank size, interior volume, price, footprint) by size class (6), manufacturer (9), and vehicle fuel type (16)
Manufacturer Technology Choice Component (MTCC)—vehicle attributes and size classes
34
Passenger Car Size Class
(interior volume—cubic feet)
Light-Duty Truck Size Class
(test weight—lbs)Mini (<85) Small Pickup (<4500)
Subcompact (85-99) Standard Pickup (>4500)Compact (99-109) Small SUVMidsize (110-120) Standard SUV
Large (>120) Small Van2 seater Standard Van
Automotive Outlook Symposium June 1, 2017

Manufacturer Technology Choice Component (MTCC)—manufacturer groups
35
Passenger CarManufacturer
Light-Duty Truck Manufacturer
Domestic Domestic 1Asian Domestic 2
European Domestic 3Sports/Luxury Import 1
Import 2
Automotive Outlook Symposium June 1, 2017

• Micro and mild hybridization are considered vehicle subsystems
Manufacturer Technology Choice Component (MTCC)—vehicle fuel types
36
Vehicle fuel typeGasoline Gasoline Hybrid
Diesel Dedicated CNGFlex Fuel (ethanol) Dedicated LPG
Electric—100 mile range Bi-fuel CNGElectric—200 mile range Bi-fuel LPG
Plug-in Hybrid Electric—10 mile Methanol Fuel CellPlug-in Hybrid Electric—40 mile
range Gasoline Fuel Cell
Diesel Hybrid Hydrogen Fuel Cell
Automotive Outlook Symposium June 1, 2017

• 86 subsystem technologies available
– Vehicle: Mass Reduction I to V; Aerodynamics I and II; Tires I and II; Low Drag Brakes; Secondary Axle Disconnect
– Transmission: 6 speed Manual; 6, 7, and 8 speed Automatic; Dual Clutch Automated Manual; High Efficiency Gearbox; Aggressive Shift Logic I and II; Early Torque Converter Lockup; Continuously Variable Transmission
– Accessories/Electrification: Electric Power Steering; Improved Accessories I and II; 12V Micro Hybrid; Integrated Starter Generator Mild Hybrid
– Engine (most by cylinder and cam profile): Low Friction Lubricants; Engine Friction Reduction I and II; Cylinder Deactivation; Variable Valve Timing (ICP, CCP, DCP); Variable Valve Lift (DVVL, CVVL); Stoichiometric Gasoline Direct Injection; Turbocharging and Downsizing I, II, and III with cooled EGR
• Technology attributes include fuel economy, cost, horsepower and weight adjustment, and base year (2015) penetration (by manufacturer, by size class)
• Technology synergies, supersede notes, and learning rates
Manufacturer Technology Choice Component (MTCC)—adopting vehicle subsystem technology
37Automotive Outlook Symposium June 1, 2017
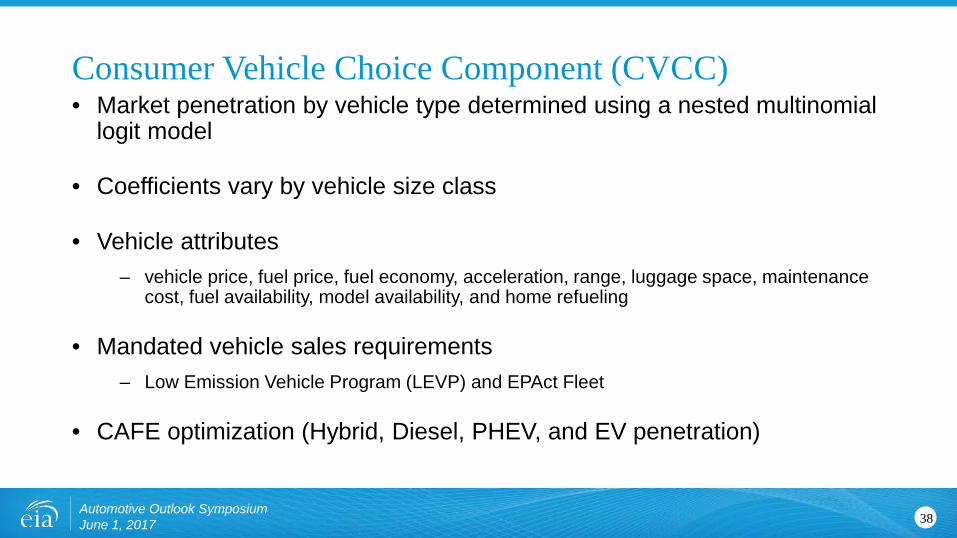
• Market penetration by vehicle type determined using a nested multinomial logit model
• Coefficients vary by vehicle size class
• Vehicle attributes– vehicle price, fuel price, fuel economy, acceleration, range, luggage space, maintenance
cost, fuel availability, model availability, and home refueling
• Mandated vehicle sales requirements– Low Emission Vehicle Program (LEVP) and EPAct Fleet
• CAFE optimization (Hybrid, Diesel, PHEV, and EV penetration)
Consumer Vehicle Choice Component (CVCC)
38Automotive Outlook Symposium June 1, 2017
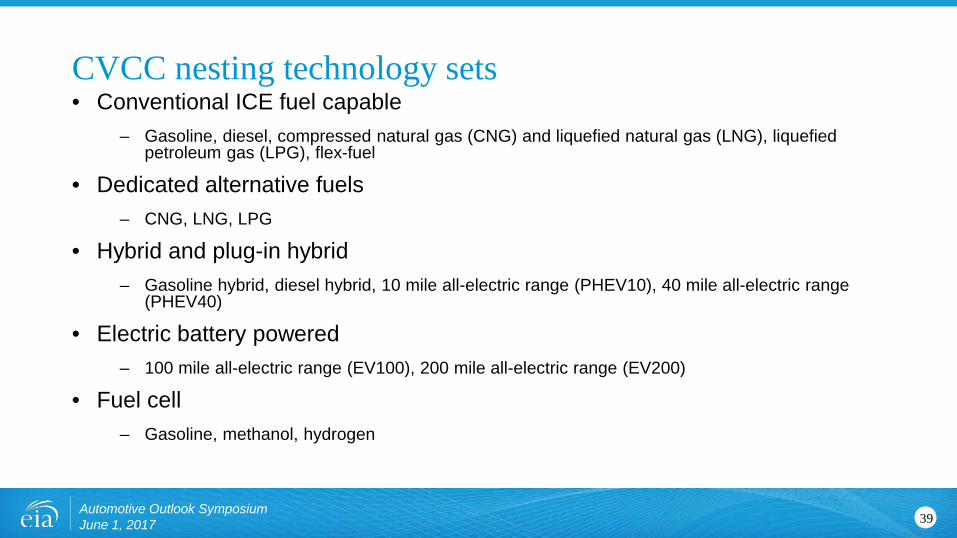
• Conventional ICE fuel capable– Gasoline, diesel, compressed natural gas (CNG) and liquefied natural gas (LNG), liquefied
petroleum gas (LPG), flex-fuel
• Dedicated alternative fuels– CNG, LNG, LPG
• Hybrid and plug-in hybrid– Gasoline hybrid, diesel hybrid, 10 mile all-electric range (PHEV10), 40 mile all-electric range
(PHEV40)
• Electric battery powered– 100 mile all-electric range (EV100), 200 mile all-electric range (EV200)
• Fuel cell– Gasoline, methanol, hydrogen
CVCC nesting technology sets
39Automotive Outlook Symposium June 1, 2017

Nesting structure
40
Vehicle Class
Conventional Fuel ICE
Gasoline, Diesel, FFV,
Bi-Fuel
FFVBi-Fuel
CNG, LPG
Alternative Fuel ICE
CNG, LPG
Hybrid
HEV (gasoline),
HEV (diesel), PHEV10
(gasoline), PHEV40 (gasoline
Electric
EV100, EV200
Fuel Cell
Hydrogen, Methanol, Gasoline
Automotive Outlook Symposium June 1, 2017

• Three passes through the MTCC and CVCC
• Each pass determines CAFE compliance– Pass 1: Add technologies economically– Pass 2: Implement fine for CAFE non-compliance– Pass 3: Reduce horsepower to comply with CAFE
• If not in compliance after third pass, force alternative vehicles for CAFE compliance
CAFE test looping process
41Automotive Outlook Symposium June 1, 2017

Battery Electric Vehicle Assumptions
42Automotive Outlook Symposium June 1, 2017

• Generalized electric-range groups– EV100 (90 actual miles)
– EV200 (200 actual miles)
– PHEV10 (10 all-electric miles)
– PHEV40 (40 all-electric miles)
• Lithium-ion battery costs are modeled for each vehicle type– Base year costs based on literature review
– Cost difference between vehicle types comes from ANL BatPac model
– Projected costs reduce over time as a function of production and a learning curve to generally match projected costs from literature review
Battery Electric Vehicles in NEMS
43Automotive Outlook Symposium June 1, 2017

• Vehicle miles travelled assumed same for all powertrains– VMT per vehicle input by vintage for passenger cars and light trucks
– Total VMT calculated from vehicle stock projections
• PHEV all-electric vs. conventional usage– PHEV10 – 21% of VMT all-electric
– PHEV40 – 58% of VMT all-electric
Battery Electric Vehicles in NEMS
44Automotive Outlook Symposium June 1, 2017

Battery Costs Projected from 2015Lithium-ion retail battery costs 2015$/kW-hr
45
0
200
400
600
800
1,000
1,200
1,400
1,600
2010 2015 2020 2025 2030 2035 2040 2045 2050
PHEV10
PHEV40
EV100
EV200
AEO2016 EV100
Automotive Outlook Symposium June 1, 2017

• California Zero-Emission Vehicle Mandate– Adopted by nine other states
• California AB-32 for GHG Reduction– Further increases electric vehicle share
– Decreases VMT
Battery Electric Vehicle Sales Drivers
46Automotive Outlook Symposium June 1, 2017

• High technology– 10 percent increase in technology fuel economy, 10 percent reduction in technology price
• Low technology– 10 percent decrease in technology fuel economy, 10 percent increase in technology price
• High tech battery case (AEO2012)
• Extended policies case
• Import dependency cases (AEO2013)
AEO transportation scenarios
47Automotive Outlook Symposium June 1, 2017

• Updates to battery electric vehicle models– Non-battery systems costs
– Increase electric-ranges to better represent changing market
Potential updates to AEO2018
48Automotive Outlook Symposium June 1, 2017

For more information
U.S. Energy Information Administration home page | www.eia.gov
Short-Term Energy Outlook | www.eia.gov/steo
Annual Energy Outlook | www.eia.gov/aeo
International Energy Outlook | www.eia.gov/ieo
Monthly Energy Review | www.eia.gov/mer
Today in Energy | www.eia.gov/todayinenergy
49Automotive Outlook SymposiumJune 1, 2017

Backup
50Automotive Outlook SymposiumJune 1, 2017

Although population and economic output per capita are assumed to continue rising, energy intensity and carbon intensity are projected to continue falling in the Reference case
0
50
100
150
200
250
300
350
400
1980 2010 2040
U.S. populationmillion people
2016
history
0
10
20
30
40
50
60
70
80
1980 2010 2040
Gross domestic product per capitathousand dollars/person
2016
history
0
2
4
6
8
10
12
14
1980 2010 2040
Energy intensitythousand British thermal units per dollar
2016
history
0
10
20
30
40
50
60
70
1980 2010 2040
Carbon intensitymetric tons CO2 per billion British thermal units
2016
history
Referencecase
Source: EIA, Annual Energy Outlook 2017
51Automotive Outlook SymposiumJune 1, 2017
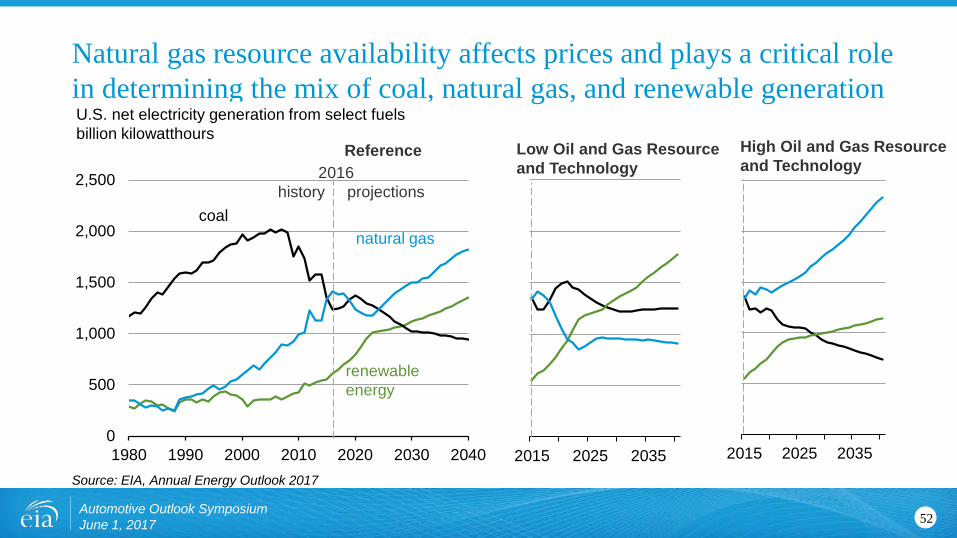
Natural gas resource availability affects prices and plays a critical role in determining the mix of coal, natural gas, and renewable generation
Source: EIA, Annual Energy Outlook 2017
52Automotive Outlook Symposium June 1, 2017
2015 2025 2035 2015 2025 2035
Low Oil and Gas Resourceand Technology
High Oil and Gas Resource and Technology
0
500
1,000
1,500
2,000
2,500
1980 1990 2000 2010 2020 2030 2040
U.S. net electricity generation from select fuels billion kilowatthours
natural gas
2016history projections
coal
renewableenergy
Reference

Natural gas
53Automotive Outlook Symposium June 1, 2017

-3-2-10123456789
2015 2016 2017 201864666870727476788082848688
Federal Gulf of Mexico production (right axis) U.S. non-Gulf of Mexico production (right axis)U.S. net imports (right axis) Total marketed production (left axis)Marketed production forecast (left axis)
Source: EIA, Short-Term Energy Outlook May 2017
Automotive Outlook SymposiumJune 1, 2017
After dropping in 2016, U.S. natural gas production will increase in 2017 and 2018U.S. natural gas production and importsbillion cubic feet per day (Bcf/d)
annual change Bcf/d
54

0
10
20
30
40
50
60
2000 2010 2020 2030 2040
U.S. natural gas production by type trillion cubic feet
shale gas and tight oil plays
tight gasother Lower 48 onshoreLower 48 offshoreother
2016history projections
Source: EIA, Annual Energy Outlook 2017
U.S. dry natural gas production is the result of continued development of shale gas and tight oil plays, alternative assumptions cause significant differences
55Automotive Outlook Symposium June 1, 2017
0
10
20
30
40
50
60
2000 2010 2020 2030 2040
Dry natural gas productiontrillion cubic feet
2016history projections High Oil Price
High Oil and Gas Resourceand Technology Reference case Low Oil PriceLow Oil and Gas Resource and Technology

-3-2-1012345678
2015 2016 2017 20180
102030405060708090
100110
Electric power (right axis) Residential and comm. (right axis)Industrial (right axis) Other (right axis)
Source: EIA, Short-Term Energy Outlook May 2017
Automotive Outlook SymposiumJune 1, 2017
Higher natural gas prices in 2017 will reduce its use for electricity generation compared to 2016U.S. natural gas consumptionbillion cubic feet per day (Bcf/d)
annual change (Bcf/d)
56
0
20
40
60
80
100
0
5
10
15
20
25
30
35
40
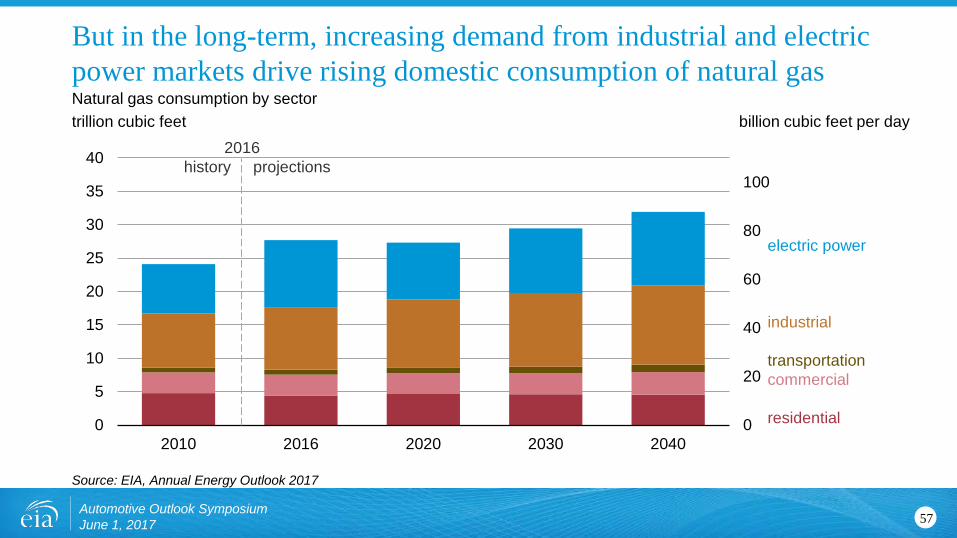
2010 2016 2020 2030 2040
electric power
industrial
transportationcommercial
residential
2016history projections
Source: EIA, Annual Energy Outlook 2017
Automotive Outlook SymposiumJune 1, 2017
But in the long-term, increasing demand from industrial and electric power markets drive rising domestic consumption of natural gasNatural gas consumption by sector trillion cubic feet billion cubic feet per day
57
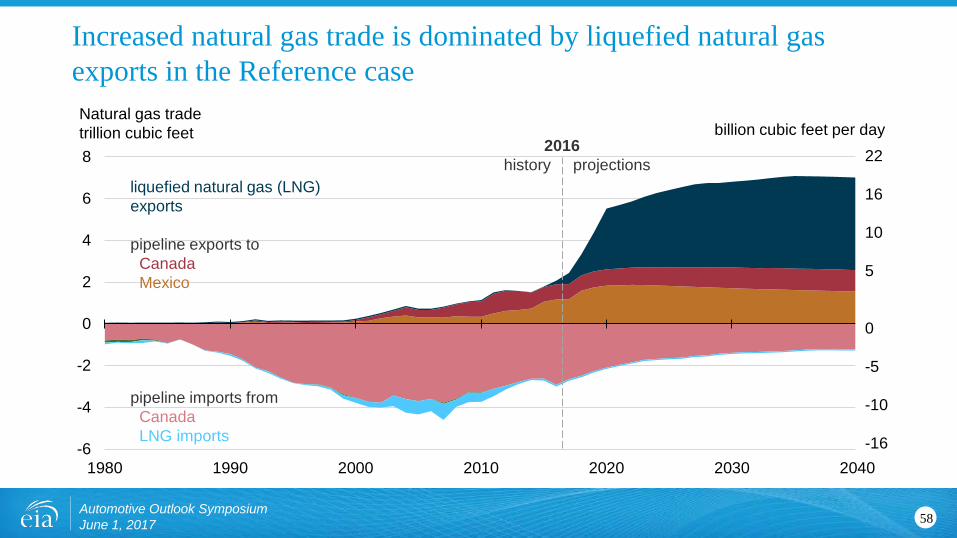
Increased natural gas trade is dominated by liquefied natural gas exports in the Reference case
58
-6
-2
2
6
-6
-4
-2
0
2
4
6
8
1980 1990 2000 2010 2020 2030 2040
Natural gas tradetrillion cubic feet
2016history projections
liquefied natural gas (LNG) exports
pipeline exports to CanadaMexico
pipeline imports fromCanadaLNG imports
billion cubic feet per day22
16
10
5
0
-5
-10
-16
Automotive Outlook Symposium June 1, 2017
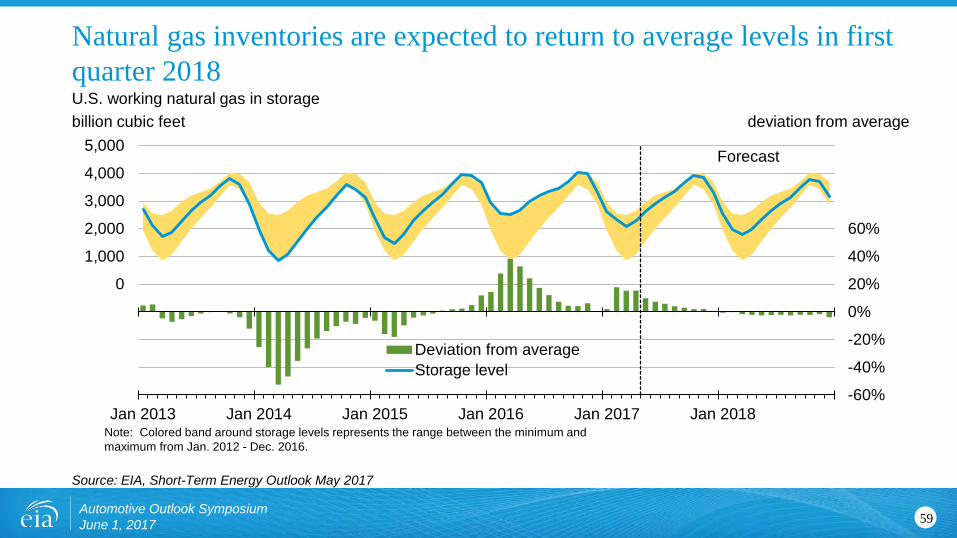
Forecast
-60%
-40%
-20%
0%
20%
40%
60%
80%
100%
120%
-4,000
-3,000
-2,000
-1,000
0
1,000
2,000
3,000
4,000
5,000
Jan 2013 Jan 2014 Jan 2015 Jan 2016 Jan 2017 Jan 2018
Deviation from averageStorage level
Note: Colored band around storage levels represents the range between the minimum and maximum from Jan. 2012 - Dec. 2016.
Source: EIA, Short-Term Energy Outlook May 2017
Automotive Outlook SymposiumJune 1, 2017
Natural gas inventories are expected to return to average levels in first quarter 2018U.S. working natural gas in storagebillion cubic feet deviation from average
59

0
1
2
3
4
5
6
7
8
9
Jan 2016 Jul 2016 Jan 2017 Jul 2017 Jan 2018 Jul 2018
Historical spot priceSTEO forecast priceNYMEX futures price95% NYMEX futures upper confidence interval95% NYMEX futures lower confidence interval
Note: Confidence interval derived from options market information for the 5 trading days ending May 4, 2017. Intervals not calculated for months with sparse trading in near-the-money options contracts.
Source: EIA, Short-Term Energy Outlook May 2017
Automotive Outlook SymposiumJune 1, 2017
Future natural gas prices are inherently uncertain, with market participants indicating a range of about $2 to $7 per MMBtuHenry Hub natural gas pricedollars per million Btu
60

• Technology developments – to what extent will they continue to offset depletion of hydrocarbon resources
• Possible pursuit of deep decarbonization, particularly in the electricity generation and buildings sectors
• Geopolitics in key oil and natural gas producing regions – both internationally and within the United States
• Competitiveness of gas-fired generation with other technologies in developing countries where projected electricity demand growth is concentrated
• Technologies and policies affecting vehicle choice, which given dominant role of transportation sector in oil demand can significantly affect markets for oil and natural gas
Automotive Outlook Symposium June 1, 2017
Food for thought – natural gas production and trade
61

• Technology developments – to what extent will they continue to offset depletion of hydrocarbon resources
• Geopolitics in key producing regions – both internationally and within the United States
• Possible pursuit of deep decarbonization, particularly in transportation applications
• Technologies and policies affecting vehicle choice, given dominant role of transportation sector in oil demand
Automotive Outlook Symposium June 1, 2017
Food for thought – hydrocarbon production and trade
62

John Maples | phone: 202-586-1757 | email: [email protected]
David Stone | phone: 202-586-8851 | email: [email protected]
Melissa Lynes | phone: 202-586-5192 | email: [email protected]
Automotive Outlook Symposium June 1, 2017
EIA Transportation analysts
63