the paradox of social media security: a study of it
TRANSCRIPT

Kennesaw State UniversityDigitalCommons@Kennesaw State UniversityMaster of Science in Information TechnologyTheses Department of Information Technology
Fall 12-14-2016
The Paradox of Social Media Security: A Study ofIT Students’ Perceptions versus Behavior on UsingFacebookZahra Y. Alqubaiti
Follow this and additional works at: http://digitalcommons.kennesaw.edu/msit_etd
Part of the Information Security Commons
This Thesis is brought to you for free and open access by the Department of Information Technology at DigitalCommons@Kennesaw State University.It has been accepted for inclusion in Master of Science in Information Technology Theses by an authorized administrator ofDigitalCommons@Kennesaw State University. For more information, please contact [email protected].
Recommended CitationAlqubaiti, Zahra Y., "The Paradox of Social Media Security: A Study of IT Students’ Perceptions versus Behavior on Using Facebook"(2016). Master of Science in Information Technology Theses. 3.http://digitalcommons.kennesaw.edu/msit_etd/3

Kennesaw State University
College of Computing and Software Engineering
Information Technology Department
The Paradox of Social Media Security: A Study of IT Students’ Perceptions
versus Behavior on Using Facebook
Thesis Paper
Submitted by: Zahra Alqubaiti
Master of Science in Information Technology
Thesis Advisor: Dr. Lei Li
Committee Members: Dr. Svetlana Peltsverger and Dr. Kyung Hun Jung
December 2016

The Paradox of Social Media Security: Users’ Perceptions versus Behavior Page 2 of 84
Abstract
Social media plays an essential role in the modern society, enabling people to be better connected
to each other and creating new opportunities for businesses. At the same time, social networking
sites have become major targets for cyber-security attacks due to their massive user base. Many
studies investigated the security vulnerabilities and privacy issues of social networking sites and
made recommendations on how to mitigate security risks. Users are an integral part of any security
mix. In this thesis, we explore the relationship between users’ security perceptions and their actual
behavior on social networking sites. Protection motivation theory (PMT), initially developed to
study fear appeals, has been widely used to examine people’s behavior in information security
domains. We propose that PMT theory can also be adapted to explain and predict social media
users’ behaviors that have security implications. We use a web-based survey to measure users’
security awareness on social networking sites and collect data on their actual behavior.
Keywords: Social media, protection motivation theory, security, vulnerability, user’s behavior,
awareness, threats, IT students, Facebook.

The Paradox of Social Media Security: Users’ Perceptions versus Behavior Page 3 of 84
Table of Contents
Chapter 1. Introduction ............................................................................................................... 4
Chapter 2. Social Media Security Vulnerabilities ...................................................................... 6
2.1 Proliferation of the Social Media ..................................................................................... 7
2.2 Social Media Security Threats and Mitigation Techniques ........................................... 10
2.2.1 Platform Related Threats ............................................................................................ 12
2.2.2 User Related Threats ................................................................................................... 13
2.2.3 Cyber-Attacks Threats ................................................................................................ 14
Chapter 3. Users’ Perception and Behavior .............................................................................. 16
3.1 Related Theories and Models ......................................................................................... 17
3.1.1 Technology Acceptance Model .................................................................................. 17
3.1.2 Communication Privacy Management Theory ........................................................... 18
3.1.3 Social Cognitive Theory ............................................................................................. 20
3.1.4 Protection Motivation Theory ..................................................................................... 22
3.2 User’s Perception on Security Vulnerability and Threats .............................................. 25
Chapter 4. Research Questions and Hypotheses ...................................................................... 27
Chapter 5. Research Design and Methodology ........................................................................ 31
Chapter 6. Research Results ..................................................................................................... 36
6.1 Pilot Study ...................................................................................................................... 36
6.2 Formal Study .................................................................................................................. 45
Chapter 7. Discussion and Conclusion ..................................................................................... 56
References …….. .......................................................................................................................... 59
Appendix A: Formal Study Instrument......................................................................................... 66
Appendix B: Formal Study - Analysis Tests ................................................................................ 70
Appendix C: Pilot Study Instrument ............................................................................................. 79
Appendix D: Pilot Study - Analysis Tests .................................................................................... 83

The Paradox of Social Media Security: Users’ Perceptions versus Behavior Page 4 of 84
Chapter 1. Introduction
Social media plays a major role in people’s daily activities and social life. As part of people’s
“online lives,” social networking sites offer many benefits, ranging from keeping everyone
connected to others anywhere and anytime, to being an outlet for the latest information on breaking
news and trends, to creating new business opportunities for individuals and organizations.
Along with the benefits, social media also introduces risks to our community. Social media sites,
as part of the World Wide Web, are inherently subject to security vulnerability imposed by the
Web. User privacy is another important part of social network security management (Oehri &
Teufel, 2012). People are constantly posting messages, updating their status, liking, or disliking
other postings, and sharing photos and videos. What individuals post or share could potentially
violate their privacy and security on the Web. Thus, it is critical for the users to be aware of the
vulnerabilities of social networking sites, and act with caution.
Many studies have been conducted on the security vulnerabilities of social networks. For example,
Fokes and Li (Fokes & Li, 2014) surveyed the common security threats to Facebook and made
some suggestions on how to stay safe on Facebook. Oehri and Teufel (Oehri & Teufel, 2012)
discussed how to form a security culture in the social networks. Nemati et al. (Nemati, Wall, &
Chow, 2014) investigated the differences in a number of privacy issues among American and
Chinese social media users, and explored these issues among users with different levels of Internet
addiction and different online identity perceptions. However, those studies were mainly on the
vulnerabilities of the system and recommendations to the users; little research investigated users’
behavior related to their security awareness on the social networking sites.

The Paradox of Social Media Security: Users’ Perceptions versus Behavior Page 5 of 84
In this thesis, we explore the relationship of users’ security perceptions and their actual behavior
on the social networking sites. Protection motivation theory (PMT) initially was developed to
study fear appeals, and has been widely used to examine people’s behavior in information security
domains. We propose that PMT theory can also be adapted to explain and predict social media
users’ behaviors that have security implications. We plan to use a web-based survey to measure
users’ security awareness on social networking sites and collect data on their actual behavior.
The rest of the thesis is organized as follows: chapter two introduces the emergence of social media
and presents current literature on social media security vulnerabilities and mitigation techniques,
chapter three examines the relationship between users’ perceptions and behavior, which includes
the technology acceptance model, protection motivation theory, communication privacy
management, and social cognitive theory. Whereas chapter four presents our research questions
and hypothesis, chapter five introduces our research design and methodology, chapter six presents
the research results that includes pilot and formal study sections, and finally, chapter seven
presents the discussion and conclusion which includes the limitations and future work.

The Paradox of Social Media Security: Users’ Perceptions versus Behavior Page 6 of 84
Chapter 2. Social Media Security Vulnerabilities
Since the 1980’s when the use of the Internet began spreading, people experiences a whole new
life. Personal life styles also transformed as new innovative devices and systems became essentials
in our daily lives. Laptops, tablets, smartphones; all affect our lives and open a wide door to many
new technologies and tools. Social media networking sites take a big share among these inventions.
Social media has been a vital research area many researchers and scientists have investigated and
studied, and hundreds of statistical reports have been published. Social media affects almost each
and every part of our society; like individuals, businesses, governments. Unfortunately, some of
these affects have negative impacts and bring new versions of violations and crimes.
This chapter investigates social media security vulnerabilities through two main sections;
proliferation of social media, and social media security threats and mitigation techniques. The
proliferation of social media section defines what social media means, its main characteristics,
categories, and examples. It also presents statistical findings related to the use of social media
websites, with Facebook as one of the most popular social media websites, and using social media
in business. Section two, social media security threats and mitigation techniques, explores the risks
and vulnerabilities of social media. This section highlights number of report findings related to
social media as a “criminal aspect” in a way or another. Moreover, this section handles the security
threats of social media in three main categories: (1) platform related, (2) user related, and (3) cyber-
attacks (Fokes & Li, 2014).

The Paradox of Social Media Security: Users’ Perceptions versus Behavior Page 7 of 84
2.1 Proliferation of the Social Media
Social media, social networking sites, and social media platforms all refer to the same concept,
which many researchers agreed on; that social media includes web-based services that allow
individuals to communicate with each other via the Internet. Boyd and Ellison (Boyd & Ellison,
2007) defined social network sites as “web-based services that allow individuals to (1) construct a
public or semi-public profile within a bounded system, (2) articulate a list of other users with
whom they share a connection, and (3) view and traverse their list of connections and those made
by others within the system”. Furthermore, Kaplan and Haenlein (Kaplan & Haenlein, 2010)
defined social media as “a group of Internet-based applications that build on the ideological and
technological foundations of Web 2.0, and allow the creation and exchange of user generated
content”.
Social media can be assorted into number of groups, including: collaborative projects (e.g.
Wikipedia), blogs and microblogs (e.g. Twitter), social networking sites (e.g. Facebook, LinkedIn,
MySpace), content communities (e.g. YouTube, Flickr), virtual social worlds (e.g. Second Life)
(Boyd & Ellison, 2007; Kaplan & Haenlein, 2010), and virtual game worlds (e.g. C.O.D, “World
of Warcraft”, Sony’s EverQuest) (Kaplan & Haenlein, 2010). In this thesis, we focus on the
security issues of social networking sites.
Based on the statistics released by Internet World Stats in 2015, the number of global Internet users
has reached 3,366,261,156 worldwide; this shows a total growth of 832.5% since 2000 (Internet
World Stats, 2015). Almost two-thirds of American adults (65%) use social networking web sites,
up from 7% (Figure 2.1) when the Pew Research Center began systematically tracking social
media usage in 2005 (Perrin, 2015). Pew Research published a number of reports that have
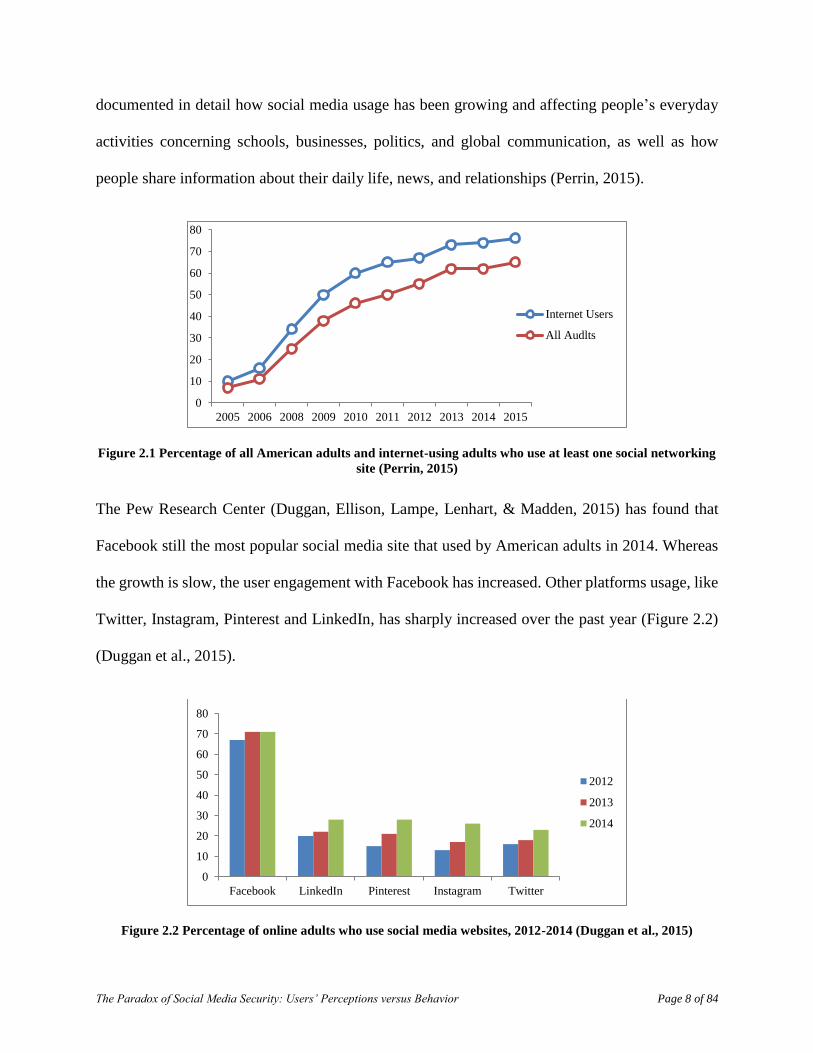
The Paradox of Social Media Security: Users’ Perceptions versus Behavior Page 8 of 84
documented in detail how social media usage has been growing and affecting people’s everyday
activities concerning schools, businesses, politics, and global communication, as well as how
people share information about their daily life, news, and relationships (Perrin, 2015).
Figure 2.1 Percentage of all American adults and internet-using adults who use at least one social networking
site (Perrin, 2015)
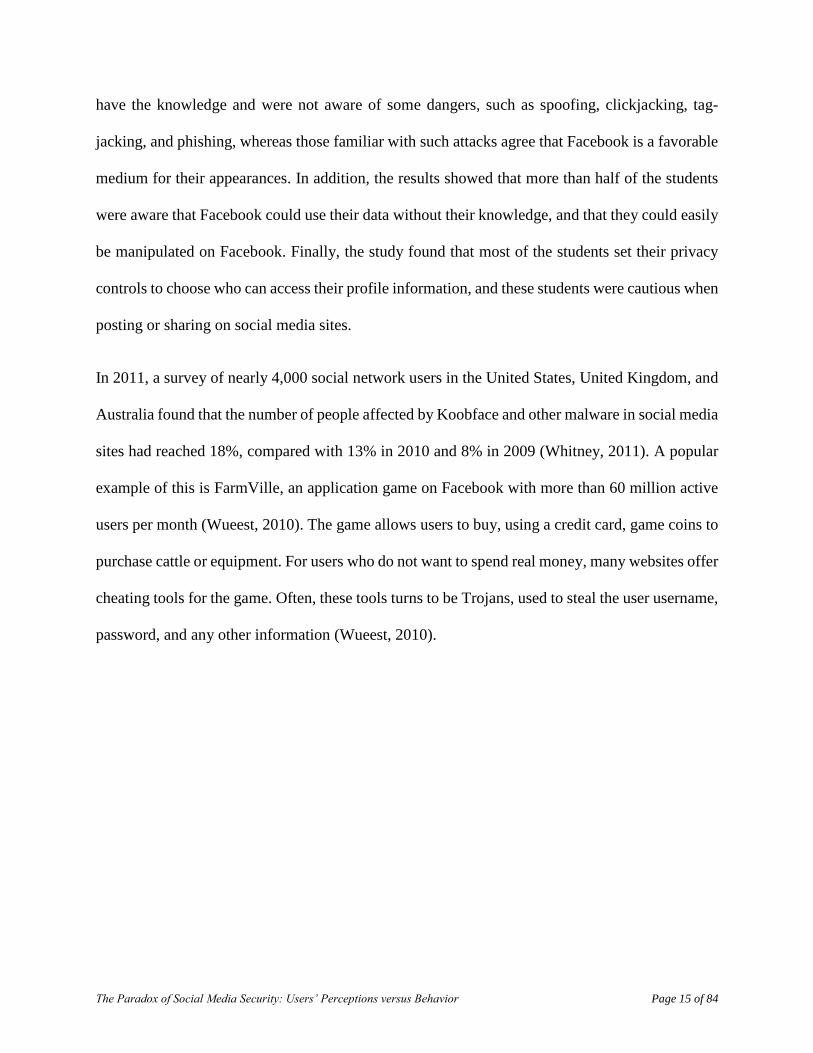
The Pew Research Center (Duggan, Ellison, Lampe, Lenhart, & Madden, 2015) has found that
Facebook still the most popular social media site that used by American adults in 2014. Whereas
the growth is slow, the user engagement with Facebook has increased. Other platforms usage, like
Twitter, Instagram, Pinterest and LinkedIn, has sharply increased over the past year (Figure 2.2)
(Duggan et al., 2015).
Figure 2.2 Percentage of online adults who use social media websites, 2012-2014 (Duggan et al., 2015)
0
10
20
30
40
50
60
70
80
2005 2006 2008 2009 2010 2011 2012 2013 2014 2015
Internet Users
All Audlts
0
10
20
30
40
50
60
70
80
Facebook LinkedIn Pinterest Instagram Twitter
2012
2013
2014

The Paradox of Social Media Security: Users’ Perceptions versus Behavior Page 9 of 84
Other research conducted by the Pew Research Center (Hampton, Goulet, Rainie, & Purcell, 2011)
on the number of social media users found that on an average day Facebook users are quite active.
15% of Facebook users update their own status.
22% comment on another’s post or status.
20% comment on another user’s photos.
26% “like” another user’s content.
10% send another user a private message
Number of studies have also been conducted to investigate the current usage of social media in
corporate sectors and how it affects the processes of daily work, as well the benefit of using such
tools for businesses. Social media has become an important tool for organizational communication
processes; it is capable to preserve behaviors that were difficult to obtain before having such tools
in the workplace (Treem & Leonardi, 2013).
In 2014, LinkedIn conducted an investigative study to understand how small businesses are using
social media sites, and whether it is worth the investment or not. The study found that 94% of
survey respondents used social media for marketing, while 60% stated social media solves the
business challenge of attracting new customers (Schneider, 2014).
Social Media Examiner, in their 7th annual study, surveyed over 3700 marketers to understand
how they are using social media to grow and promote their businesses. The study found that 92%
of marketers stated social media was important to their businesses, while 66% of marketers’ plan
to increase their use of these social networks. At least 91% of marketers wanted to know the most
effective social tactics and the best ways to engage their audience with social media and 88%

The Paradox of Social Media Security: Users’ Perceptions versus Behavior Page 10 of 84
wanted to know how to measure their return on investment for social media activities (Stelzner,
2015).
2.2 Social Media Security Threats and Mitigation Techniques
As with any other technology, social media has its own drawbacks and risks. Internet Crime
Complaint Center (IC3) complaint data showed 12% of the complaints submitted in 2014
contained a social media aspect. Complaints involving social media have quadrupled since 2009
(Internet Crime Complaint Center, 2014). In most cases, social engineering, or hacked accounts
invaded victims’ privacy. In 2010, an estimated 2,322 arrests for Internet sex crimes against minors
involved social media sites in some way, including an estimated 503 arrests in cases involving
identified victims and the use of social media by offenders (Mitchell, Finkelhor, Jones, & Wolak,
2010).
A report published by the Guardian (Press Association, 2012) reported that social networking
crime was comparatively minor in 2008 with 556 reports made to police, according to the statistics
released by 29 police forces in England, Scotland and Wales under the Freedom of Information
Act. However, in 2011, the number of reports has dramatically increased to 4,908 incidents in
which Facebook and Twitter were a factor. This demonstrates an increase by 780% in four years,
resulting in approximately 650 people being charged in 2011.
According to the Get Safe Online awareness initiative and the City of London police’s National
Fraud Intelligence Bureau, at least £5.2m (around $6 million) was lost to ticket fraud in 2015 in
the United Kingdom – up from £3.35m (around $3.8 million) in 2014, an increase of 55% in 2015
since 2014, as criminals increasingly made use of social media to defraud music and sports fans

The Paradox of Social Media Security: Users’ Perceptions versus Behavior Page 11 of 84
(Jones, 2016). More than a fifth of the crimes were instigated via Facebook, with Twitter
accounting for a further 6% (Jones, 2016).
The National White Collar Crime Center (NW3C) provides a list of crimes linked to social media;
it includes: burglary, phishing & social engineering, malware, identity theft, and cyberstalking
(National White Collar Crime Center, 2013). According to the National Cyber Security Alliance
(NCSA) in 2011, 15% of Americans had never checked their social networking privacy and
security account settings (National Cyber Security Alliance, 2011), while 49% of social media
users had changed their passwords once or more in 2012, with 6% changing passwords weekly,
and at the same time, 42% had never changed their social media passwords (National Cyber
Security Alliance, 2012).
Per the Cisco 2013 Annual Security Report, social media sites belong to the main types of sites
with very high concentrations of online security threats. The report illustrated that online
advertisements are 182 times more likely to deliver malicious content than pornography sites
(Ashford, 2013).
Based on the literature reviews, we divided the security threats of social media into three main
categories: (1) platform related, (2) user related, and (3) cyber-attacks (Fokes & Li, 2014). Platform
related threats include the network information social media sites provide, privacy and security
policies, vulnerabilities such as verification options, authentication processes, and data breaches.
User related threats present vulnerable practices by social media users, including information
sharing, privacy coping behavior, the preventable user, user's privacy settings, and lack of privacy
awareness. Finally, cyber-attack threats talked about number of dangers such as user’s awareness
of social media risks for example spoofing and clickjacking, and attacks of malwares and Trojans.

The Paradox of Social Media Security: Users’ Perceptions versus Behavior Page 12 of 84
2.2.1 Platform Related Threats
When using social media platform, the user decides how much private data he or she is willing to
share with others. These sites allow users to adjust privacy settings for public visibility (Wueest,
2010). Zhao and Zhao (Zhao & Zhao, 2015) evaluated the security and vulnerability of 50 social
media sites in terms of (a) privacy and security policies and their implementation, (b) network
information availability of social media sites, and (c) computer network system vulnerability to
cyber intrusions and attacks. The research found that most social media sites provided links to their
privacy policy, child-protection policy, no-liability statement, security policy, and proper-use
guidelines on their home page. Using SSL encryption for data transmission has been included in
most of the security policies, while only a few of the sites stated clearly the execution of the key
security measures: authentication, anti-password guessing, monitoring, investigation, and
auditing. Furthermore, the research found that social media sites’ network information was
publicly available through a Google search, and this could lead to cyber intrusions and attacks.
The research found that social media sites had most of their ports closed, filtered, or behind
firewalls; only very few ports were detected as open: Port 80/TCP and Port 443/TCP, and that
American-based social media sites had more policies and measures than other country’s
counterparts in six aspects: privacy policy, security policy, child-protection policy, SSL
encryption, proper use statement, and no-liability statement.
On a Facebook survey study, Fokes and Li (Fokes & Li, 2014) found number of platform related
vulnerabilities, which should be addressed by Facebook Inc., including: SMS verification
weaknesses, social authentication, vulnerabilities from applications, and puppetnets. In late
November 2012, CNN reported that hackers had stolen usernames and passwords for over two
million accounts at Facebook, Google, Twitter, Yahoo, and other similar websites. Researchers at

The Paradox of Social Media Security: Users’ Perceptions versus Behavior Page 13 of 84
Trustwave stated that “the massive data breach was a result of keylogging software maliciously
installed on an untold number of computers around the world”. The virus tracked log-in details of
key websites for over a month and sent this information to a server controlled by the hackers
(Pagliery, 2013). Several months later, Twitter reported “We discovered one live attack and were
able to shut it down in process moments later. However, our investigations have thus far indicated
that the attackers may have had access to limited user information – usernames, email addresses,
session tokens and encrypted/salted versions of passwords – for approximately 250,000 users”
(Lord, 2013).
2.2.2 User Related Threats
Nemati et al. (Nemati et al., 2014) investigated the differences among privacy issues for social
media users in the United States and China, and explored these issues affecting users with different
levels of Internet addiction and different online identity perceptions. The study survey measured
three variables related to information sharing and privacy coping behavior: (1) users’ comfort with
sharing information with different groups of people (e.g., family, friends, and strangers), (2) users’
breadth of online self-disclosure (e.g., sharing birthdates, addresses, phone numbers, personal
interests, etc.), and (3) users’ willingness to engage in privacy coping behaviors. According to the
study, American and Chinese users behaved differently when it comes to their privacy coping and
sharing information with others; Chinese respondents were less stringent when sharing information
with others than American respondents. Also, Chinese respondents were more likely to share with
diverse sets of people than American users, which may put them at a higher risk for privacy
violations.

The Paradox of Social Media Security: Users’ Perceptions versus Behavior Page 14 of 84
Preventable user related vulnerabilities include: fake profiles, Sybil attack, identity theft, and
account access (Fokes & Li, 2014). Usually, social media users have limited awareness of the
security vulnerabilities which can lead to a serious threat to themselves and to their friends on the
site. Gundecha et al. (Gundecha, Barbier, & Liu, 2011) stated that three measures can be taken to
minimize a user's vulnerability; (1) the user's privacy settings are effectively set to protect personal
information, (2) the user has adequate means to protect friends, (3) the user's friends must have
intentions to protect the user. The study proposed a methodology and measures for evaluating the
vulnerable user and how to adjust a user's network to best deal with threats presented by vulnerable
friends (Gundecha et al., 2011).
Liu and Maes (Liu & Maes, 2005) addressed lack of privacy awareness and how people disclose
themselves in social media. This fact strengthens the need for vulnerability research on a social
networking site to make users aware of privacy risks. Social media networks also affect business
environments. Social media provides both opportunities and risks for organizations; thus, from a
survey conducted to determine social media guidelines, Oehri and Teufel (Oehri & Teufel, 2012)
developed a management model for creating, monitoring and controlling social media security
culture.
2.2.3 Cyber-Attacks Threats
Researchers at Alexandru Ioan Cuza University, Romania, conducted a study on 628 students from
the Faculty of Economy and Business Administration and 200 students specializing in Accounting
and Information Systems. The purpose of the study was to analyze the students’ awareness of
social media risks that they expose themselves to, and to actually measure security when using
social media (Popescul & Georgescu, 2015). The main findings were: most of the students did not
The Paradox of Social Media Security: Users’ Perceptions versus Behavior Page 15 of 84
have the knowledge and were not aware of some dangers, such as spoofing, clickjacking, tag-
jacking, and phishing, whereas those familiar with such attacks agree that Facebook is a favorable
medium for their appearances. In addition, the results showed that more than half of the students
were aware that Facebook could use their data without their knowledge, and that they could easily
be manipulated on Facebook. Finally, the study found that most of the students set their privacy
controls to choose who can access their profile information, and these students were cautious when
posting or sharing on social media sites.
In 2011, a survey of nearly 4,000 social network users in the United States, United Kingdom, and
Australia found that the number of people affected by Koobface and other malware in social media
sites had reached 18%, compared with 13% in 2010 and 8% in 2009 (Whitney, 2011). A popular
example of this is FarmVille, an application game on Facebook with more than 60 million active
users per month (Wueest, 2010). The game allows users to buy, using a credit card, game coins to
purchase cattle or equipment. For users who do not want to spend real money, many websites offer
cheating tools for the game. Often, these tools turns to be Trojans, used to steal the user username,
password, and any other information (Wueest, 2010).

The Paradox of Social Media Security: Users’ Perceptions versus Behavior Page 16 of 84
Chapter 3. Users’ Perception and Behavior
The relationship between users’ perceptions and behavior lay down many questions without
answers, and highlight conflicted viewpoints from researchers. Scholars from different
perspectives have devoted huge efforts to examine consequential human behaviors and established
many theories to study, analyze, and predict these behaviors.
Technology and information security has explored and developed number of theories to help
researchers from IT backgrounds, and other fields investigate if and how the technologies affect
users and how users behave while using such technology. This paper explores four theories that
have been established for such purposes; the technology acceptance model, protection motivation
theory, communication privacy management theory, and social cognitive theory.
This chapter explores several theories related to human acceptance and behavior toward
information technology (IT) and security. The related theories section discusses: the technology
acceptance model which presents a predictive framework for user acceptance of technologies, the
communication privacy management theory explaining how people believe they own their private
information yet miss the fact they are vulnerable when disclosing such information, the social
cognitive theory showing how people learn by observing others, and the protection motivation
theory which originally was created to help clarify fear appeals and understand and predict the
adoption of protective technologies. In addition, this chapter highlights user’s perception of
security vulnerability and threats; it explores factors and models that effect user’s behavior.

The Paradox of Social Media Security: Users’ Perceptions versus Behavior Page 17 of 84
3.1 Related Theories and Models
3.1.1 Technology Acceptance Model
Studies have verified the ability of the technology acceptance model (TAM) framework to predict
user acceptance of novel technologies. The TAM, which was first introduced by Davis (Fred D.
Davis, 1986) in the 1980s, has been shown to be highly predictive of IT adoption and use (Choi &
Chung, 2013; Venkatesh & Bala, 2008) and has been very useful in investigating the adoption of
social media technologies (Kwon, Park, & Kim, 2014; Rauniar, Rawski, Yang, & Johnson, 2014).
Perceived usefulness (PU) and perceived ease of use (PEOU) are the primary factors in adoption
(Fred D. Davis, 1986; Sago, 2015). Attitude (ATT), and intention to use (IU) are also two factors
of TAM that determine adoption of a technology (Fred D. Davis, 1986; Kwon et al., 2014). Both
PU and PEOU are important factors making the TAM a very effective research model to
understand and explain IT usage (Chau, 2001; Sago, 2015). Davis (F. D. Davis, 1989) defined PU
as “the degree to which a person believes that using a particular system would enhance his or her
job performance” and PEOU as “the degree to which a person believes that using a particular
system would be free of effort”.
Sago (Sago, 2015) examined user perceptions and frequency of use related to social media
networks (Facebook, Twitter, and Pinterest) and found that there are positive relationships between
frequency of use and multiple uses for social media in both females and males, and between
frequency of use of social media and the uses of social media as well. The research also found
positive relationships between PU and social media uses. PU had a relationship in 39.02% of the
entire samples; however, PEOU had limited impact on the uses of social media among both
genders. However, as few as 2.44% of social media uses had a relationship with PEOU.

The Paradox of Social Media Security: Users’ Perceptions versus Behavior Page 18 of 84
Choi and Chung (Choi & Chung, 2013) explored a number of graduate students’ acceptance of
social media networks. The researchers extended a new version of TAM – which they used as the
main theoretical framework – with two variables; subjective norm and perceived social capital,
aiming to have better understanding of social media acceptance and usage. The study focused on
Facebook, Myspace, and Twitter, and showed that PU and PEOU had huge effects on the intention
to use social media. In addition, the research explained how subjective norm and perceived social
capital had also impacts as predictors of both PU and PEOU and the importance of including these
two variables as potential variables to extend the TAM.
Rauniar et al. (Rauniar et al., 2014) studied user’s adoption behavior of Facebook based on the
TAM. The study validated the attitude-intent-behavior relationship in Facebook, examined, and
introduced additional elements to the original TAM; user’s critical mass (CM), social networking
site capability (CP), and perceived playfulness (PP).
3.1.2 Communication Privacy Management Theory
Communication privacy management (CPM) theory, also known as information boundary theory,
developed by Sandra Petronio in 1991 (Petronio, 1991) and suggested that “individuals believe
they own their private information and have a right to control whether the information is disclosed
as well as to whom it is disclosed” (Kennedy-Lightsey, Martin, Thompson, Himes, & Clingerman,
2012; Petronio, 1991, 2004).
CPM theory explains how people believe in the ownership of their private information and how
they usually miss the part that disclosing any information to others could vulnerable them in a way
or another. Petronio (Petronio, 2004) explains the importance of controlling our private
information and that once we share such information with others we don’t really own the

The Paradox of Social Media Security: Users’ Perceptions versus Behavior Page 19 of 84
information anymore and can’t decide what happens to the information then, “when people
disclose to each other, they essentially link others into a privacy boundary” (Petronio, 2004).
However, the theory also shows how people tempted to develop their own privacy rules based on
five criteria, which are: “(1) culture, (2) gendered, (3) motivations that people have concerning
privacy, (4) contextual constraints, and (5) risk–benefit ratio” (Petronio, 2004).
CPM theory has been used as a framework on number of research studies related to IT and social
media sites. Chen et al. (Chen, Ping, Xu, & Tan, 2009) pointed out the importance of privacy
concerns on social media sites and used the CPM theory to study the privacy concerns about peer’s
disclosure among social media users. The study used Facebook as research platform, found that
Facebook user can reduce his/her privacy concerns about peer’s disclosure through decisional
control, and suggested pragmatic strategies for social media sites in order to mitigate members’
privacy concerns.
Another survey study done by Frampton and Child (Frampton & Child, 2013) investigated how
working professionals respond to co-worker friend requests on Facebook using the CPM theory
framework. Researchers found that most working professionals accepted coworker Facebook
friend requests, and that working professionals did not find it necessary to change their privacy
settings and did not feel vulnerable when receiving such request.
Based on a complementary application of both the uses and gratifications and CPM theory; Child
et al. (Child, Haridakis, & Petronio, 2012) studied how people think of blogging and how they set
up their privacy settings. The research found that users influenced by two main factors when
managing their privacy setting for blogs; which are blogging privacy rule orientations and gender
functioned.

The Paradox of Social Media Security: Users’ Perceptions versus Behavior Page 20 of 84
Number of researchers has used CPM theory to investigate user’s privacy concerns when
disclosing private information, and how users develop their own privacy rules in IT research area.
CPM theory has been also used to study the privacy concerns about peer’s disclosure among
Facebook users (Chen et al., 2009).
Social media users interact with each other’s and share several types of information (public and
private). Examining how social media users encouraged in building their own privacy boundaries
and rules and to whom they disclose their privacy information will help us in understanding the
users’ behaviors while using social media.
3.1.3 Social Cognitive Theory
Social cognitive theory (SCT) developed by the psychologist Albert Bandura in 1986 based on
general on how people learn by observing others. The theory used in number of sectors like
psychology, education, business, health communication, and information security. SCT “founded
in an agentic perspective” to provide full understanding on how human psychosocial works
according to three reciprocal factors; which are: (1) cognitive (personal), (2) behavioral, and (3)
environmental factors (Bandura, 1991, 2001). Based on SCT, observation – which individuals
learn through - consists of four processes: (1) attentional, (2) retention, (3) production, and (4)
motivational (Bandura, 2001), and that the individual’s ability of observation proportionally
correlates with the individual’s level of self-efficacy (Bandura, 2001; Chai, Bagchi-Sen, Rao,
Upadhyaya, & Morrell, 2009). Bandura (Bandura, 1997) defined self-efficacy as “the belief in
one’s capabilities to organize and execute the courses of action required to manage prospective
situations”.

The Paradox of Social Media Security: Users’ Perceptions versus Behavior Page 21 of 84
SCT has been used by Chai et al. (Chai et al., 2009) as a theoretical background to study and
understand users’ private information sharing behavior over the internet; researchers conducted a
research framework – using both PMT and SCT - explaining an internet user’s information privacy
protection behavior, and found that internet users’ information privacy behaviors can be affected
by two factors: (1) users’ perceived importance of information privacy and (2) information privacy
self-efficacy. Researchers also found that the value of online information privacy assented by
users. Their findings showed that the educational and knowledge level, and surrounding groups of
family and friends, can essentially affect the internet users’ behavior when dealing with online and
security privacy.
Yao et al. (Yao, Rice, & Wallis, 2007) investigated influences of online privacy concerns and
developed a model that include gender, generalized self-efficacy, psychological need for privacy,
Internet use experience, Internet use fluency, and beliefs in privacy rights. Research main results
showed that main influences on online privacy concerns are psychological need for privacy and
beliefs in privacy rights, and that self-efficacy has positive correlation to Internet use diversity and
fluency; “individuals with high self-efficacy reported lower levels of need for privacy” (Yao et al.,
2007).
LaRose et al. (LaRose, Mastro, & Eastin, 2001) studied Internet usage using variables from SCT;
self-efficacy and self-disparagement were used to explain the domain of Internet behavior. The
study also included Internet addiction as a deficient self-regulation within the framework of SCT.
The study found that Internet self-efficacy and perceived Internet addiction were directly related
to Internet usage, and that self-disparagement and self-slighting were negatively related to Internet
usage.

The Paradox of Social Media Security: Users’ Perceptions versus Behavior Page 22 of 84
Lee and Ma (Lee & Ma, 2012) investigated news sharing intentions in social media platforms
and the factors that influence it using Uses and Gratifications (U&G) theory and SCT.
Based on SCT; Compeau et al. (Compeau, Higgins, & Huff, 1999) developed a model to examine
the impact of computer self-efficacy, outcome expectations, affect, and anxiety on computer usage.
Researchers found that computer self-efficacy and outcome expectations have remarkable
relationships, as well as, between self-efficacy and affect and anxiety and use. The results showed
that individual’s affective and behavioral reactions to IT could be affected by self-efficacy and
outcome expectations.
Many researches depended on SCT to study and explain how people learn by observing others.
SCT used in many IT related research areas including: users’ private information sharing behavior
over the internet (Chai et al., 2009), influences of online privacy concerns (Yao et al., 2007),
Internet usage (LaRose et al., 2001), and news sharing intentions in social media (Lee & Ma,
2012).
SCT has not been used to study the social media user’s behaviors, we believe that it provides a
theoretical framework that can be used to examine how social media users can learn and improve
their behavior when experience any vulnerable event while using social media sites.
3.1.4 Protection Motivation Theory
Protection motivation theory (PMT) (Rogers, 1975) was originally created to help clarify fear
appeals; it provides a conceptual framework to study individuals' fear appeal and behavioral
change (Chai et al., 2009; Li, 2012). According to Rogers (Rogers, 1975), “an individual’s
intention to protect him or herself depends on four factors: (1) the perceived severity of a
threatening event; (2) the perceived probability of the occurrence; (3) the efficacy of the

The Paradox of Social Media Security: Users’ Perceptions versus Behavior Page 23 of 84
recommended preventive behavior that an individual expects to carry out; and (4) the individual’s
perceived self-efficacy” (Chai et al., 2009; Rogers, 1975).
The PMT underlines two processes to predict and mediate protection motivation: threat appraisals
and coping appraisals (Tsai et al., 2016). (Kaspar, 2015) Threat appraisal evaluates the severity
level of an activity/situation and examines how serious it is (Kaspar, 2015; Rogers, 1983). Coping
appraisal evaluates the self-confidence level and response- efficacy of adapting a protection
behavior (Kaspar, 2015), where efficacy is “the individual's expectancy that carrying out
recommendations can remove the threat, and self-efficacy is the belief in one's ability to execute
the recommended courses of action successfully” (Rogers, 1983).
Using different applications and tools via the Internet allow users to experience a variety of online
security threats that require them to enact safety precautions. PMT has been used as a powerful
model to understand and predict the adoption of protective technologies, and one of the main
theoretical foundations in the information security research field, which helps users avoid harm
from a growing number of negative technologies by practicing healthier behaviors when dealing
with security issues (Boss, Galletta, Lowry, Moody, & Polak, 2015; Chenoweth, Minch, &
Gattiker, 2009). This study uses PMT to understand online safety behaviors in the context of social
media use.
PMT Applications in Security Fields
In an investigative study of the influence of fear appeals on the compliance of end users, Johnston
and Warkentin (Johnston & Warkentin, 2010) pointed out the effect of fear appeals in the end user
behavior when responding to a recommended act of security. It has been evaluated along with
perceptions of self-efficacy, response efficacy, threat severity, and social influence. During

The Paradox of Social Media Security: Users’ Perceptions versus Behavior Page 24 of 84
innovative research, Jenkins et al. (Jenkins, Grimes, Proudfoot, & Lowry, 2014) provided two
solutions to limit password reuse through detection and mitigation, based on PMT. The researchers
hypothesized that introducing just-in-time fear appeals when a violation is detected will likely
decrease password reuse. The study found significant results, including 88.41% of users who
received a fear appeal subsequently created unique passwords, whereas only 4.45% of users who
did not receive a fear appeal created unique passwords (Jenkins et al., 2014).
Chenoweth et al. (Chenoweth et al., 2009) tested a model designed to explain behavioral intention
to adopt a relevant form of protective technology, anti-spyware software. The research showed
that perceived vulnerability, perceived severity, response efficacy, and response cost positively
affect user behavior implementing anti-spyware software as a protective technology.
Tsai et al. (Tsai et al., 2016) developed a survey of Amazon Mechanical Turk users in order to
explore the impact of new PMT factors in predicting security behaviors. Researchers found that
threat severity had big impact, and coping appraisal also had measurable relationships to the online
safety intentions, namely: habit strength, response efficacy, and personal responsibility factors.
Based on an evaluation of the effect of organizational commitment on employee security
compliance intentions, Herath and Rao (Herath & Rao, 2009) suggested that “(a) threat perceptions
about the severity of breaches and response perceptions of response efficacy, self-efficacy, and
response costs are likely to affect policy attitudes; (b) organizational commitment and social
influence have a significant impact on compliance intentions; and (c) resource availability is a
significant factor in enhancing self-efficacy, which in turn, is a significant predictor of policy
compliance intentions”.

The Paradox of Social Media Security: Users’ Perceptions versus Behavior Page 25 of 84
As previously discussed, another survey study by Chai et al. (Chai et al., 2009) conducted a
research framework – using both PMT and SCT - explaining an internet user’s information privacy
protection behavior, and found that internet users’ information privacy behaviors can be affected
by two factors: (1) users’ perceived importance of information privacy and (2) information privacy
self-efficacy. Researchers also found that the value of online information privacy assented by
users. Their findings showed that the educational and knowledge level, and surrounding groups of
family and friends, can essentially affect the internet users’ behavior when dealing with online and
security privacy.
To date, the correlation between social media users’ awareness of security and their actual online
behavior has yet to be investigated. Several studies have captured social media networks users’
behavior by modeling it as computational units of processing information. Darmon et al. (Darmon,
Sylvester, Girvan, & Rand, 2013) applied two contrasting modeling paradigms: computational
mechanics and echo state networks, to evaluate activity patterns of groups of Twitter users to be
able to predict their behavior by modeling representations of their previous states as computational
processes. The researchers found that most users showed limited potential of behavioral
processing.
3.2 User’s Perception on Security Vulnerability and Threats
A research study done by Kwon et al. (Kwon et al., 2014) used the TAM and identified perceived
security along with five other factors - perceived mobility, perceived system quality, perceived
connectedness, perceived usefulness, and flow experience - as motivational factors of social media
use. The researchers developed a theoretical model to explain the users’ adoption of Facebook and
Twitter. The main findings were that perceived connectedness, usefulness, security, and system

The Paradox of Social Media Security: Users’ Perceptions versus Behavior Page 26 of 84
and service quality evenly contributed to shaping attitudes when using Twitter, and the effects of
perceived security in Facebook adoption were stronger than for Twitter, which may answer why
users consider Facebook more private than Twitter as a social media site.
Xu et al. (Xu, Zhang, Wu, & Yang, 2012) implemented a mixture model to study user posting
behavior on Twitter. The study proposed three factors that could influence a user post on Twitter:
(1) breaking news happening at that moment, (2) posts recently published by a user’s friends, (3)
user intrinsic interest.
Li (Li, 2012) reviewed fifteen established theories in online information privacy research and
developed an integrated framework highlighting the privacy calculus (“i.e., the trade-off between
expected benefits and privacy risks”) and the risk calculus (“i.e., the trade-off between privacy
risks and efficacy of coping mechanisms”).
Based on a literature review; Pierson (Pierson, 2012) investigated the relationship between online
consumer privacy in the new technologies and the changes of people vulnerability. The research
discussed the concepts of mass self-communication, empowerment and privacy, and highlighted
the consumers’ privacy while using social media, as well as how their vulnerability changes from
an external and internal perspective.

The Paradox of Social Media Security: Users’ Perceptions versus Behavior Page 27 of 84
Chapter 4. Research Questions and Hypotheses
This thesis aims to examine the relationship between users’ security awareness and their actual
activities on social networking sites. We are interested in measuring the social media users’
awareness of security and dimensions of such perceptions. The application of PMT in security
field shows that people’s behavior can be impacted by their perceptions.
We are interested in studying the people’s perception and behavior in social media. We collected
data on users’ behaviors on social networking sites and studied how users’ behavior is impacted
by their perception of security. The leads to following research questions:
RQ1: What is the users’ level of awareness on security vulnerabilities in the social
networking sites and how do we measure such awareness?
RQ2: How do the users behave in the social networking sites when their activities have
security implications?
RQ3: What is the correlation between users’ perceptions and their actual behavior on
social networking sites?
Many studies investigated users’ perceptions and behaviors. The technology acceptance model
(TAM) (F. D. Davis, 1989) and its extension models were extensively used to predict users’
acceptance of technology based on their perceptions. Social cognitive theory (SCT) was used to
investigate and understand users’ private information sharing behavior. In the security domain,
communication privacy management (CPM) (Petronio, 1991) theory was used widely to study
users’ privacy concerns on IT related platforms. Protection motivation theory (PMT) (Rogers,
1975) has been first applied - directly or indirectly - to many related topics, for example, personal

The Paradox of Social Media Security: Users’ Perceptions versus Behavior Page 28 of 84
physical health, such as cancer prevention, AIDS prevention, smoking, exercise/diet/healthy
lifestyle, alcohol consumption, and adherence to medical-treatment regimens (Floyd, Prentice-
Dunn, & Rogers, 2000). PMT was also widely adopted by researchers to explain users’ behaviors
related to information security: examination of the users’ intentions to adopt anti-spyware software
(Chenoweth et al., 2009), enforcement of security compliance in organizations (Herath & Rao,
2009; Siponen, Pahnila, & Mahmood, 2006), reduction of password reuse among users (Jenkins
et al., 2014), information security behaviors (Johnston & Warkentin, 2010), and improvement of
web users’ online privacy and safety (Tsai et al., 2016; Youn, 2005).
PMT provides an understanding for some of the observed behaviors, why unhealthy behaviors are
practiced, and offer some suggestions on how to overcome such behaviors. As we mentioned
earlier, PMT proposes that cyber security is based on four factors: (1) the perceived severity of a
threatening event (threat severity); (2) the perceived probability of the occurrence (threat
vulnerability); (3) the efficacy of the recommended preventive behavior that an individual expects
to carry out (response efficacy); and (4) the individuals perceived self-efficacy (self-efficacy).
As we explored the PMT in section 3.1.4, PMT has been applied by number of researchers in the
security field; like the effect of fear appeals in the end user behavior when responding to a
recommended act of security (Johnston & Warkentin, 2010), solutions to limit password reuse
through detection and mitigation (Jenkins et al., 2014), explain behavioral intention to adopt anti-
spyware software (Chenoweth et al., 2009), the effect of organizational commitment on employee
security compliance intentions (Herath & Rao, 2009), as well as the internet user’s information
privacy protection behavior (Chai et al., 2009).

The Paradox of Social Media Security: Users’ Perceptions versus Behavior Page 29 of 84
While PMT hasn’t been used to study users’ security related behaviors on social networking sites,
we believe it provides a sound theoretical framework to do so given its success in information
security research. Social networking sites are part of the World Wide Web. Social media users
share many common characteristics as the users of other websites or information systems. We
argue that the four dimensions of PMT, including threat severity, threat vulnerability, response
efficacy, and self-efficacy hold similar predicting power to explain users’ behavior in social
networking sites. Based on our literature review and discussion, this leads to following hypotheses.
The effect of a high level of education or/and awareness of the security threats and vulnerabilities
of social media sites is one of the most highly influential factors on the individual’s self-efficacy
and behavior, which affect user’s daily social media activity.
H1. The users’ level of perception of security severity will positively correlate to the users’
safe behavior on social networking sites.
H2. The users’ level of perception of self-efficacy in information security will positively
correlate to the users’ safe behavior on social networking sites.
Experiencing a similar occurrence of an incident more than once or hearing about an incident
several times from others, raises the user’s awareness of such threats and affect user’s behavior on
social media.
H3. The users’ level of perception of the probability of an occurrence of security threats
will positively correlate to the users’ safe behavior on social networking sites.

The Paradox of Social Media Security: Users’ Perceptions versus Behavior Page 30 of 84
Practicing healthy behaviors while using social media, or associating with people who do so,
improves a user’s perception of the efficacy of healthy and preventive behavior, which will affect
the user daily activity on social media.
H4. The users’ perception of the level of difficulty on the response efficacy of security
threats will positively correlate to the users’ safe behavior on social networking sites.
Based on our hypotheses, we set number of measurements to help in measure and understand social
media users’ perceptions and behaviors, that are explained in the following chapter.

The Paradox of Social Media Security: Users’ Perceptions versus Behavior Page 31 of 84
Chapter 5. Research Design and Methodology
In this thesis, web-based survey has been used as the main research method. We used Facebook as
the social media platform as it is one of most popular social networking sites (Duggan et al., 2015).
Undergraduate and graduate students from Kennesaw State University were recruited as research
subjects. College students are a valid and reliable representation of social media users. Targeting
college students as our research subjects reduced the cost and efforts of targeting other
classifications of subjects; and required focused, incentive-based advertisements for successful
survey completion.
To investigate our hypotheses, and find answers to our research questions, we developed a survey
questionnaire to gather and analyze the needed data. We explored the relationship between social
media users’ security awareness and their actual behavior while using these social media tools.
Developing an online survey is relatively simple nowadays; reliable tools are available over the
Internet, offering many options for different purposes, such as: Askia, LimeSurvey,
SurveyMonkey, and Zoho Survey (Keiser, 2016).
The web-based survey was conducted through a pilot study. We chose a pilot study to “develop,
adapt, or check the feasibility of techniques” and be able to test the survey questions and
measurements, and estimate the needed number of participants for the final sample with the desired
accuracy (Foster, 2013; Hopkins, 2000). Using pilot studies allow researchers to test and evaluate
their proposed methods or techniques on small scale groups without the need to undertake large
intensive groups that could waste efforts and resources (Foster, 2013).
The survey questionnaire was developed to collect data in three categories: users’ demographic or
background information, users’ perception of social media security vulnerabilities and security

The Paradox of Social Media Security: Users’ Perceptions versus Behavior Page 32 of 84
awareness in general, and users’ behavior while using social networking sites. The survey
instrument has been tested on a small group of students in the pilot study. The survey then was
modified based on the findings of the pilot study. The revised questionnaire was administrated to
a large group of students. The survey results were analyzed to test the research hypothesis stated
in the previous section. The measurements of users’ perceptions and behavior are based on
protection motivation theory.
Based on our hypotheses, we set number of measurements to help in measure and understand social
media users’ perceptions and behaviors, Figure 5.1 clarify the research theoretical model, where
the user’s behavior variables divided into two groups to measure user’s perception on an activity
or action with security implications, and the likelihood of performing that action. The variables
presented in this theoretical model were derived from the PMT factors that we explored earlier.
DV1. Likelihood
of performing the
activity
IV1. Perceived security
severity of the activity
IV2. Perceived self-
efficiency on security
IV3. Perceived
possibilities of security
breach
IV4. Perceived self-
efficacy of the preventive
behavior
An activity with security
implications
IV = Independent Variable (X), DV = Dependent Variable (Y)
Figure 5.1 Research theoretical model

The Paradox of Social Media Security: Users’ Perceptions versus Behavior Page 33 of 84
Mapping of Research Model and Survey Instruments
To investigate our research hypotheses, we designed a scenario based questions to test Facebook
users’ perceptions of certain action and the likelihood that they will perform that action. Here is
clarification of mapping both independent and dependent variables to each of our research
hypothesis. Questions from the formal study have been used in the mapping.
H1. The users’ level of perception of security severity will positively correlate to the users’ safe
behavior on social networking sites.
Independent variable: IV1. Perceived security severity of the activity. Measured by Q3.3
(In your opinion, how severe the consequence is if those posted photos were hacked? / X2).
Dependent variable: DV1. Likelihood of performing the activity. Measured by Q3.5
(Knowing the geotags attached to those pictures you took, what’s likelihood that you will
post them on your Facebook account? / Y2).
H2. The users’ level of perception of self-efficacy in information security will positively correlate
to the users’ safe behavior on social networking sites.
Independent variable: IV2. Perceived self-efficiency on security. Measured by statements
1 – 4 from Q2.4 (Facebook can be used for spoofing, Clickjacking or Tag-jacking can occur
on Facebook, Facebook is source of spams or/and viruses, Identity theft can happen in
Facebook / X).
Dependent variable: DV1. Likelihood of performing the activity. Measured by Q3.4 (If
your friend told you there is a software/app that can remove the geotags from the pictures,

The Paradox of Social Media Security: Users’ Perceptions versus Behavior Page 34 of 84
what’s the likelihood of you would install this software/app and use it to remove the
geotags from these pictures? / Y3).
H3. The users’ level of perception of the probability of an occurrence of security threats will
positively correlate to the users’ safe behavior on social networking sites.
Independent variable: IV3. Perceived possibilities of security breach. Measured by Q3.2
(After taking the pictures, one of your friend told you that she noticed that your pictures
are geotagged, which means that those pictures could reveal your home location on
Facebook if you post them. Given this information, in your opinion how likely is it these
photos will be used maliciously by hackers if you post them on your Facebook account? /
X1).
Dependent variable: DV1. Likelihood of performing the activity. Measured by Q3.4 (If
your friend told you there is a software/app that can remove the geotags from the pictures,
what’s the likelihood of you would install this software/app and use it to remove the
geotags from these pictures? / Y3).
H4. The users’ perception of the level of difficulty on the response efficacy of security threats will
positively correlate to the users’ safe behavior on social networking sites.
Independent variable: IV4. Perceived self-efficacy of the preventive behavior. Measured
by Q3.2 (After taking the pictures, one of your friend told you that she noticed that your
pictures are geotagged, which means that those pictures could reveal your home location
on Facebook if you post them. Given this information, in your opinion how likely is it these
photos will be used maliciously by hackers if you post them on your Facebook account? /
X1).

The Paradox of Social Media Security: Users’ Perceptions versus Behavior Page 35 of 84
Dependent variable: DV1. Likelihood of performing the activity. Measured by Q3.6 (If
geotag is removed from those pictures, what’s likelihood that you would post those pictures
on your Facebook account? / Y4).
Table 5.1 provides a matrix to clarify the mapping between the PMT factors and the research
hypotheses, as well as the theoretical model variables and the corresponding question from the
survey instrument. The questions presented in this matrix located from the formal study.
Table 5.1 Mapping hypotheses and instrument questions matrix
PMT Factor Hypothesis Model IV Instrument Q (X) Model DV Instrument Q (Y)
Threat severity H1 IV1 Q3.3 (X2) DV1 Q3.5 (Y2)
Response efficacy H2 IV2 Q2.4 (X)
Statements 1- 4 DV1 Q3.4 (Y3)
Threat vulnerability H3 IV3 Q3.1 (X1) DV1 Q3.4 (Y3)
self-efficacy H4 IV4 Q3.1 (X1) DV1 Q3.6 (Y4)

The Paradox of Social Media Security: Users’ Perceptions versus Behavior Page 36 of 84
Chapter 6. Research Results
As discussed in the research design chapter, the research used students from the Information
Technology department as subjects to conduct a pilot study. The survey instrument was tested on
a small group of students as part of the pilot study. The survey instrument has been modified in
the formal study based on initial results and input from the research committee members.
This chapter presents in its first section the pilot study results and the analysis tests that have been
run on data to understand the results. The second section presents the formal study results as well
as the analysis tests too.
6.1 Pilot Study
The initial survey was distributed among 60 undergraduate, graduate, and postgraduate students
from the Information Technology Department of the College of Computing and Software
Engineering as a first test for the pilot study (PS). We received 59 responses; only 30 responses
were valid. Valid responses exclude any response with missing answers to one or more questions.
No forced response option was used in this pilot study.
The first two parts of the survey collected data about the participants’ demographic information,
and their perception of social media security vulnerabilities and security awareness in general.
More than 50% of respondents were between 26 and 35-years-old, around 56% were married, and
40% never married. Most of the participants were graduate students, and 66% were male and 33%
were female. The survey asked the participants to describe their knowledge in cyber security;
around 46% considered their cyber security knowledge as intermediate, 20% as professional, and
around 26% as amateur. Table 6.1 describes the demographic questions.

The Paradox of Social Media Security: Users’ Perceptions versus Behavior Page 37 of 84
Table 6.1 PS Responses to demographic questions
Item Percent Count Item Percent Count
Age Gender
Under 18 0.0% 0 Male 66.7% 20
18 - 25 16.7% 5 Female 33.3% 10
26 - 35 53.3% 16 Prefer not to answer 0.0% 0
36 - 45 16.7% 5
46 - 55 6.7% 2 Education level
56+ 6.7% 2 Undergraduate 13.3% 4
Graduate 83.3% 25
Marital status Postgraduate 3.3% 1
Single (never married) 40.0% 12
Married 56.7% 17 Knowledge in cyber security
Separated 0.0% 0 Beginner 6.7% 2
Widowed 0.0% 0 Amateur 26.7% 8
Divorced 3.3% 1 Intermediate 46.7% 14
Prefer not to answer 0.0% 0 Professional 20.0% 6
Expert 0.0% 0
The participants were asked to check all social networking sites that they login to at least once a
month. More than 70% of the participants use YouTube, 70% use Facebook, and more than 55%
use LinkedIn. 3% added Steemit as another networking site. Figure 6.1 displays all results.
Figure 6.1 PS Login at least once a month to any of these social networking sites
0
5
10
15
20
25

The Paradox of Social Media Security: Users’ Perceptions versus Behavior Page 38 of 84
Among the 30 valid respondents, only 21 were using Facebook as one of the social networking
sites (login at least once a month). More than 50% of these respondents choose Facebook as the
most frequently used among the social networking sites, where only 19% choose YouTube and
less than 10% choose LinkedIn. See Figure 6.2.
Figure 6.2 PS The social networking site that most frequently use
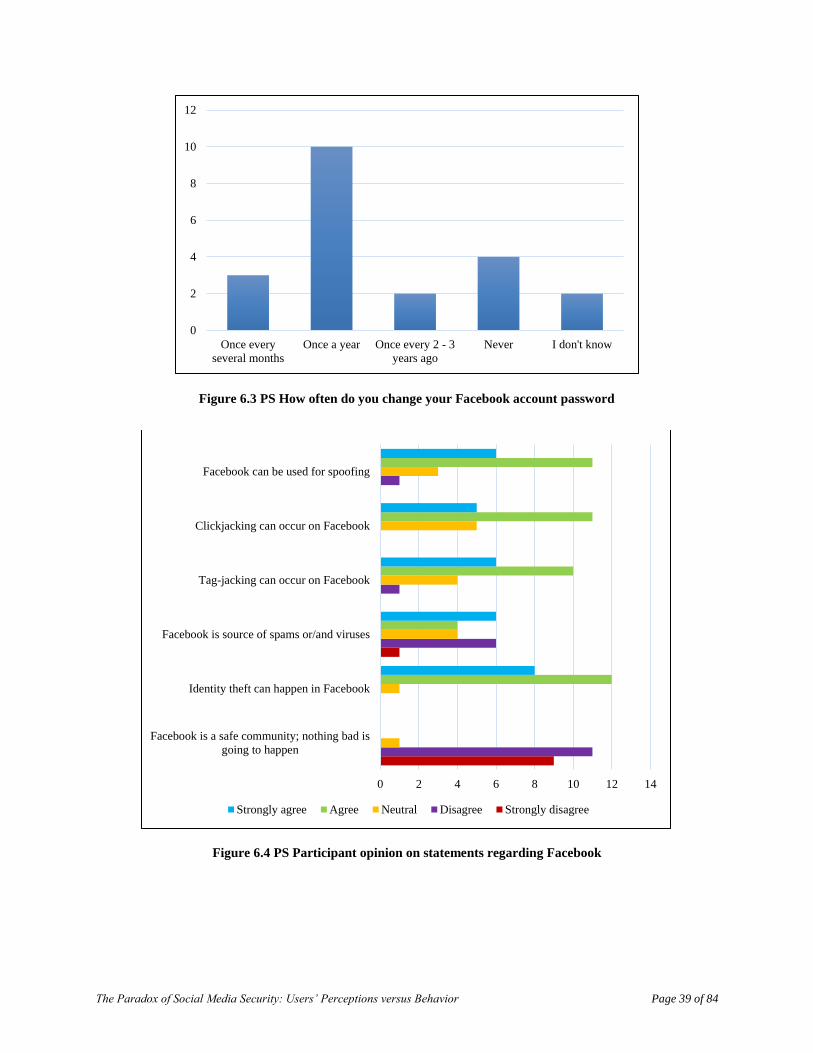
Among the Facebook participant users, only 1 student (4%) read the terms and conditions
agreement of Facebook, whereas less than 50% either read fewer than 10 lines or none. More than
65% set their Facebook account profile as private and 28% as public. The results show that at least
47% of the participants change their Facebook account password once a year, whereas 14% change
their password once every several months, 9% change their password once every two to three
years, and around 19% never changed their passwords. See Figure 6.3. Furthermore, the
participants were asked to indicate their opinion on statements regarding the security of Facebook;
the statements and results are illustrated in Figure 6.4. The results show that around 50% agree
that spoofing, click-jacking and tag-jacking can occur on Facebook, 57% agree that identity theft
can happen in Facebook, and interestingly, 52% disagree that Facebook is a safe community.
0
2
4
6
8
10
12
The Paradox of Social Media Security: Users’ Perceptions versus Behavior Page 39 of 84
Figure 6.3 PS How often do you change your Facebook account password
Figure 6.4 PS Participant opinion on statements regarding Facebook
0
2
4
6
8
10
12
Once every
several months
Once a year Once every 2 - 3
years ago
Never I don't know
0 2 4 6 8 10 12 14
Facebook is a safe community; nothing bad is
going to happen
Identity theft can happen in Facebook
Facebook is source of spams or/and viruses
Tag-jacking can occur on Facebook
Clickjacking can occur on Facebook
Facebook can be used for spoofing
Strongly agree Agree Neutral Disagree Strongly disagree

The Paradox of Social Media Security: Users’ Perceptions versus Behavior Page 40 of 84
The third part of the survey aimed to collect data to measure the participants’ behavior while using
Facebook. The answers scaled from extremely likely to extremely unlikely including neutral (on
scale of five). Per the research theoretical model Figure 5.1, the questions designed to measure two
aspects, as we call dependent and independent variables. Table 6.2 list the questions and the
analysis assumptions:
Table 6.2 PS part 3 questions, users’ behavior while using social networking sites
Question Analysis Assumption
Q3.1 Imagine that you have a group of friends who like to share pictures of
their homemade food on Facebook.
You just made an elegant dish and took a few pictures of the dish.
What’s the likelihood you’ll post those pictures on your Facebook
account?
Y1 (Dependent)
Q3.2 After taking the pictures, you find out the pictures are geotagged,
which means that those pictures could publish your home location on
Facebook if you post them. Given this information, please indicate
your opinion on the questions below. In your opinion, how likely is it
these photos will exploited by malicious people if they are posted to
your Facebook account?
X1 (Independent)
Q3.3 What do you think of the severity of consequence if those pictures
were posted to your Facebook account and exploited by the malicious
people?
X2 (Independent)
Q3.4 Knowing the geotag issue, what’s likelihood that you will post those
pictures on your Facebook account?
Y2 (Dependent)
Q3.5 If you were told there is a software/app that can remove the geotags,
what’s the likelihood of you would download and install this
software/app on your computer or smartphone?
Y3 (Dependent)
Q3.6 If the geotag removal software/app is already installed on your
computer/smart phone, what’s likelihood you would use the
software/app to remove the geotag on the pictures?
Y4 (Dependent)
Q3.7 If geotag is removed from the pictures, what’s likelihood that you
would post those pictures on your Facebook account?
Y5 (Dependent)

The Paradox of Social Media Security: Users’ Perceptions versus Behavior Page 41 of 84
Results show that there is no significant correlation between the users’ perceptions of an activity
with security implications and the likelihood of performing that activity. Regression analysis has
been run to investigate the research hypothesis and find answers to its questions.
The first hypothesis stated: The users’ level of perception of security severity will positively
correlate to the users’ safe behavior on social networking sites. Though, according to the scenario
that has been tested in the survey, results show that this hypothesis is not supported due to the very
low relationship (R Square = 0.024) between the users’ perceptions of the severity of consequence
if the pictures were posted to their Facebook account and exploited by the malicious people, and
the likelihood that they will post the geotagged pictures to their Facebook account.
Figure 6.5 PS Testing hypothesis 1
For the second hypothesis: The users’ level of perception of self-efficacy in information security
will positively correlate to the users’ safe behavior on social networking sites, results show there
is no significant correlation (R Square = 0.109) between the users’ opinion on how likely it is that
malicious people will exploit the photos if they are posted to their Facebook account as well as
y = -0.1833x + 4.2333
R² = 0.0242
0
1
2
3
4
5
6
0 0.5 1 1.5 2 2.5 3 3.5 4 4.5
Po
st p
ic. kn
ow
ing i
ts g
eota
gged
(Q
3.4
/Y2
)
Security severity of the activity (Q3.3/X2)

The Paradox of Social Media Security: Users’ Perceptions versus Behavior Page 42 of 84
their perceptions of the severity of consequence if the pictures were posted to their Facebook
account and exploited by the malicious people, and the likelihood that they will download and
install the geotags removal software/app on their computer or smartphone.
Figure 6.6 PS Testing hypothesis 2
The third hypothesis stated: The users’ level of perception of the probability of an occurrence of
security threats will positively correlate to the users’ safe behavior on social networking sites. And
per the survey results, there is a very low relationship (R Square = 0.103) between the users’
opinion on how likely it is that malicious people will exploit the photos if they are posted to their
Facebook account and the likelihood that they will download and install the geotags removal
software/app on their computer or smartphone. This concludes that this hypothesis is not
supported.
y = 0.0779x + 1.4762
R² = 0.1431
0
1
2
3
4
5
6
0 5 10 15 20 25
Inst
all
geo
tag r
emo
val
ap
p (
Q3
.5/Y
3)
Self-efficiency on security (Q3.2*Q3.3/X1*X2)

The Paradox of Social Media Security: Users’ Perceptions versus Behavior Page 43 of 84
Figure 6.7 PS Testing hypothesis 3
Fourth hypothesis: The users’ perception of the level of difficulty on the response efficacy of
security threats will negatively correlate to the users’ safe behavior on social networking sites.
Results show a low relationship (R Square =0.038) between the users’ opinion on how likely it is
that malicious people will exploit the photos if they are posted to their Facebook account and the
likelihood that they would post the pictures on their Facebook account if a geotag is removed from
the pictures, which also led to the same conclusion; this hypothesis is not supported.
y = -0.3616x + 3.3838
R² = 0.1033
0
1
2
3
4
5
6
0 1 2 3 4 5 6
Inst
all
geo
tag r
emo
val
ap
p(Q
3.5
/Y3
)
Possibilities of security breach (Q3.2/X1)

The Paradox of Social Media Security: Users’ Perceptions versus Behavior Page 44 of 84
Figure 6.8 PS Testing hypothesis 4
For better understanding the users’ correspondence of their perceptions, T-Test has been run to
explore the users’ perceptions on posting pictures they took on Facebook (Q3.2, Y1), their
perception on posting those pictures after knowing the geotag issue (Q3.4, Y2), and their
perception on posting those pictures if the geotag is removed (Q3.7, Y5). Our results show that
respondents’ perceived likelihood of posting pictures after knowing the geotag issue is
significantly different than before knowing the geotag issue (with P value = 0.02). This clarifies
that Facebook users are less likely to post the pictures once they know the geotag issue. See Table
6.3, 6.4, and 6.5 for details.
Table 6.3 PS t-Test, Q3.1, Q3.4 (Y1, Y2)
Variable 1 Variable 2
Mean 3.142857143 3.761904762
Variance 2.128571429 1.19047619
Observations 21 21
Pearson Correlation 0.493582983 Hypothesized Mean Difference 0 Df 20 t Stat -2.145904153 P(T<=t) one-tail 0.022167268
y = 0.2103x + 2.1033
R² = 0.0377
0
1
2
3
4
5
6
0 1 2 3 4 5 6
Po
st p
ic. if
geo
tag r
emo
ved
(Q3
.7/Y
5)
Self-efficacy of the preventive behavior (Q3.2/X1)
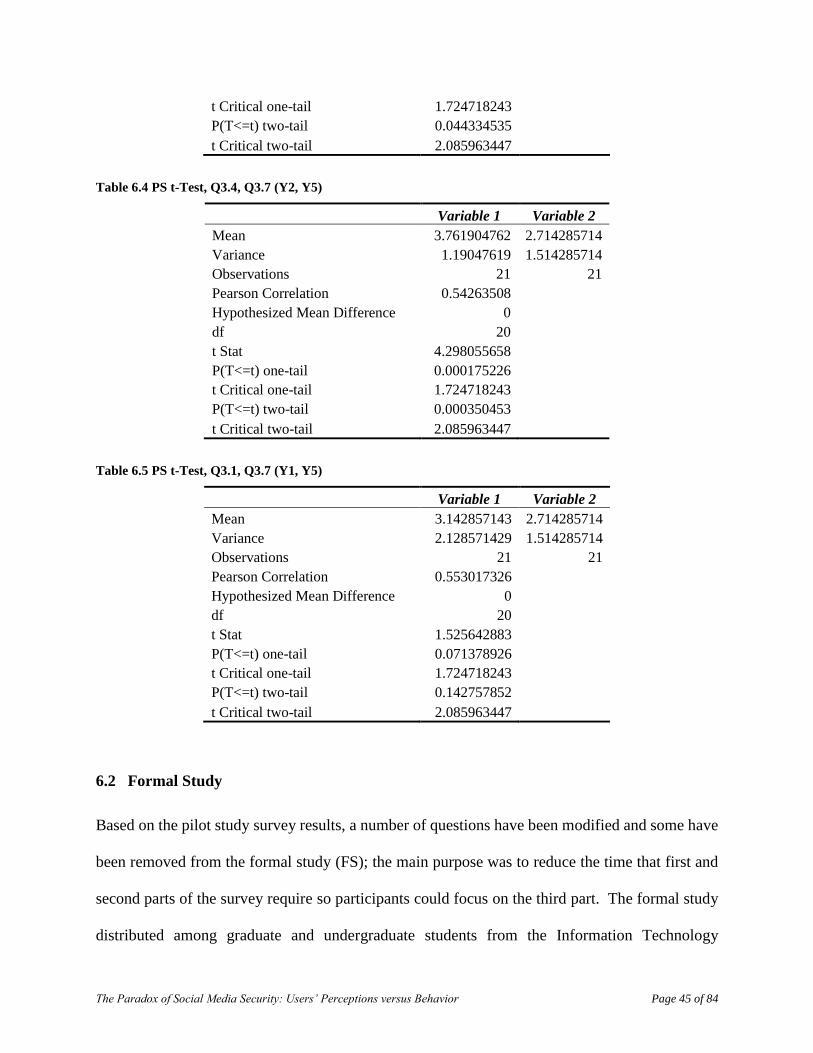
The Paradox of Social Media Security: Users’ Perceptions versus Behavior Page 45 of 84
t Critical one-tail 1.724718243 P(T<=t) two-tail 0.044334535 t Critical two-tail 2.085963447
Table 6.4 PS t-Test, Q3.4, Q3.7 (Y2, Y5)
Variable 1 Variable 2
Mean 3.761904762 2.714285714
Variance 1.19047619 1.514285714
Observations 21 21
Pearson Correlation 0.54263508 Hypothesized Mean Difference 0 df 20 t Stat 4.298055658 P(T<=t) one-tail 0.000175226 t Critical one-tail 1.724718243 P(T<=t) two-tail 0.000350453 t Critical two-tail 2.085963447
Table 6.5 PS t-Test, Q3.1, Q3.7 (Y1, Y5)
Variable 1 Variable 2
Mean 3.142857143 2.714285714
Variance 2.128571429 1.514285714
Observations 21 21
Pearson Correlation 0.553017326 Hypothesized Mean Difference 0 df 20 t Stat 1.525642883 P(T<=t) one-tail 0.071378926 t Critical one-tail 1.724718243 P(T<=t) two-tail 0.142757852 t Critical two-tail 2.085963447
6.2 Formal Study
Based on the pilot study survey results, a number of questions have been modified and some have
been removed from the formal study (FS); the main purpose was to reduce the time that first and
second parts of the survey require so participants could focus on the third part. The formal study
distributed among graduate and undergraduate students from the Information Technology

The Paradox of Social Media Security: Users’ Perceptions versus Behavior Page 46 of 84
Department of the College of Computing and Software Engineering, who share almost similar
background; from the pilot survey, Q1.4 (asked about the education level) and Q1.5 (asked to
describe knowledge in cyber security) have been removed. Two statements from Q2.4 were
combined into one statement (Clickjacking or Tag-jacking can occur on Facebook). More
modifications have been done to the last section of the survey, based on results from the pilot study
as well as the input from the committee members. Trying to include Facebook users with different
interests and background, Q3.1 has been updated to include more situations in addition to the
homemade food scenario. We simplify the language used in both Q3.2 and Q3.3, and two questions
(Q3.5, Q3.6) have been updated into one question (Q3.4 in FS) to clarify the idea and reduce time.
In addition, we also made changes to the wording of the answer choices to the third part questions,
scaling the answer choice “extremely” and replacing it with “very”. It is important to note that the
order of the analysis assumptions for some of the variables has been changed compared to the
assumptions order used in the pilot study; the order of two questions changed to improve the
participants’ engagement with the flow of the scenario questions.
Respondents for the final survey were recruited from the Information Technology department at
Kennesaw State University; all were graduate students. A total of 142 responses were received,
with 138 valid responses. A consent form was added as a first step of the survey, and a forced
response option has been applied to all questions to ensure that participants do not miss any
questions. Valid responses exclude any responses with missing answers to one or more questions.
Only one responder did not agree to the consent form contents, and three responses were not
completed. Adding the forced response validation option has remarkable effects on the percentage
of valid responses compared to the pilot study.

The Paradox of Social Media Security: Users’ Perceptions versus Behavior Page 47 of 84
Most of the participants were young, between 18 and 35-years-old, and 22% were mature, 36-
years-old or more. 72% of participants were male and 27% were female. 37% of the participants
were married and 56% were single (never married). Table 6.6 shows detailed demographic data
for the respondents.
Table 6.6 FS Responses to demographic questions
Item Percent Count Item Percent Count
Age Marital status
Under 18 0.0% 0 Single (never married) 56.5% 78
18 - 25 42.8% 59 Married 37.0% 51
26 - 35 35.5% 49 Separated 0.0% 0
36 - 45 11.6% 16 Widowed 0.7% 1
46 - 55 8.0% 11 Divorced 5.1% 7
56+ 2.2% 3 Prefer not to answer 0.7% 1
Gender
Male 72.5% 100
Female 26.8% 37
Prefer not to answer 0.7% 1
The participants were asked to check all social networking sites that they login to at least once a
month. The survey showed that around 75% of the participants use Facebook, 75% use YouTube,
and more than 44% use LinkedIn, almost 40% use Instagram and more than 35% use Snapchat.
9% added other social networking sites, include Reddit, WhatsApp, IMO, Viber, Tumbler, Tinder,
and Discord. Only those who chose Facebook as one of social networking sites continue to the
remaining of the survey. See Figure 6.9. Among those who login at least once a month to Facebook
(104 participants, 75.4%); more than 62% choose Facebook as the most frequent social networking
site that they use, and 12.5% choose YouTube. See Figure 6.10.
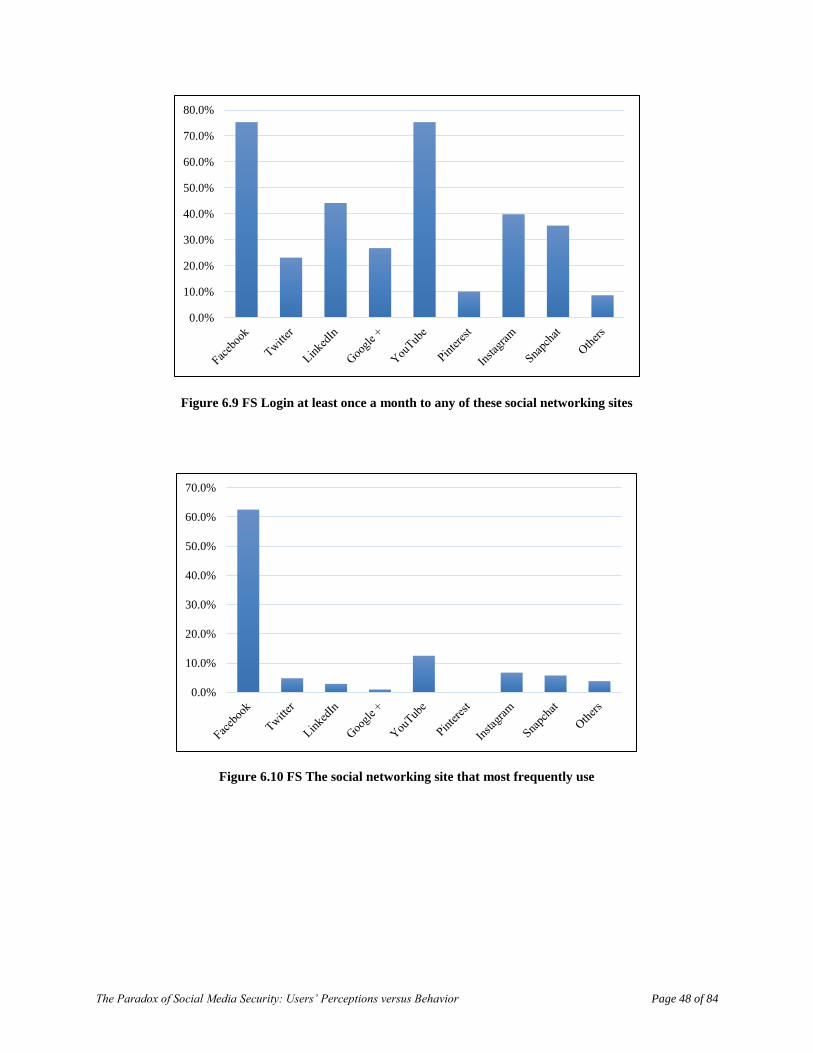
The Paradox of Social Media Security: Users’ Perceptions versus Behavior Page 48 of 84
Figure 6.9 FS Login at least once a month to any of these social networking sites
Figure 6.10 FS The social networking site that most frequently use
0.0%
10.0%
20.0%
30.0%
40.0%
50.0%
60.0%
70.0%
80.0%
0.0%
10.0%
20.0%
30.0%
40.0%
50.0%
60.0%
70.0%

The Paradox of Social Media Security: Users’ Perceptions versus Behavior Page 49 of 84
The second part of the survey aimed to study the participants’ security awareness while using
Facebook. Among the Facebook users’ participants, 17% read the terms and conditions agreement
of Facebook; almost 27% read less than 10 lines, and 56% did not read any. However, 73% set
their Facebook profile as private, and only 20% as public. (Figure 6.11, Figure 6.12).
At least 27% of the participants change their Facebook account password once a year, 24% change
their password once every several months, 18% change their password once every two to three
years, and around 27% never changed their passwords.
Figure 6.13 Frequent of changing Facebook account password
0.0%
5.0%
10.0%
15.0%
20.0%
25.0%
30.0%
Once every
several months
Once a year Once every 2 -
3 years ago
Never I don't know
0.0%
10.0%
20.0%
30.0%
40.0%
50.0%
60.0%
Yes Less than 10 lines No
0.0%
10.0%
20.0%
30.0%
40.0%
50.0%
60.0%
70.0%
80.0%
Private Public I don't know
Figure 6.11 FS Read terms & conditions Figure 6.12 FS Profile type

The Paradox of Social Media Security: Users’ Perceptions versus Behavior Page 50 of 84
In a question asking the participants to indicate their opinion on the number of statements related
to Facebook security awareness, between 48% to almost 29% showed good awareness toward the
security vulnerabilities and risks that the statements clarify. Moreover, only 6% and 2% agreed
and strongly agreed, respectively, that Facebook is a safe community and nothing dangerous is
going to happen. See Figure 6.14.
Figure 6.14 FS Participant opinion on statements regarding Facebook
As the initial survey; the third part of the survey collected data to measure the participants’
behavior while using Facebook. The answers scaled from very likely to very unlikely including
neutral (on scale of five). Per the research theoretical model (Figure 4.1), questions were designed
to measure two aspects, dependent and independent variables. The questions have been modified
as mentioned earlier, Table 6.7 lists the questions and the analysis assumptions:
0.0% 10.0% 20.0% 30.0% 40.0% 50.0% 60.0%
Facebook is a safe community; nothing bad is
going to happen
Facebook is source of spams or/and viruses
Clickjacking or Tag-jacking can occur on
Identity theft can happen in Facebook
Facebook can be used for spoofing
Strongly agree Agree Neutral Disagree Strongly disagree

The Paradox of Social Media Security: Users’ Perceptions versus Behavior Page 51 of 84
Table 6.7 FS part 3 questions, users’ behavior while using social networking sites
Question Analysis Assumption
Q3.1 Imagine that you have a group of friends who like to share pictures on
Facebook, and you just took few pictures of your backyard, food you just
made, or furniture you just assembled.
What’s the likelihood you will post those pictures on your Facebook
account?
Y1 (Dependent)
Q3.2 After taking the pictures, one of your friend told you that she noticed that
your pictures are geotagged, which means that those pictures could reveal
your home location on Facebook if you post them. Given this information,
in your opinion how likely is it these photos will be used maliciously by
hackers if you post them on your Facebook account?
X1 (Independent)
Q3.3 In your opinion, how severe the consequence is if those posted photos
were hacked?
X2 (Independent)
Q3.4 If your friend told you there is a software/app that can remove the geotags
from the pictures, what’s the likelihood of you would install this
software/app and use it to remove the geotags from these pictures?
Y3 (Dependent)
Q3.5 Knowing the geotags attached to those pictures you took, what’s
likelihood that you will post them on your Facebook account?
Y2 (Dependent)
Q3.6 If geotag is removed from those pictures, what’s likelihood that you would
post those pictures on your Facebook account?
Y4 (Dependent)
Results from the formal study were almost the same as the results from the pilot study. The analysis
shows that there is no significant correlation between the users’ perceptions of an activity with
security implications and the likelihood of performing that activity.
Testing the first hypothesis: The users’ level of perception of security severity will positively
correlate to the users’ safe behavior on social networking sites, shows that there is no significant
correlation between the users’ perceptions of the severity of consequence if the posted pictures
were hacked, and the likelihood that they will post the geotagged pictures on their Facebook
account (R Square = 0.004), and this confirm that first hypothesis is not supported.

The Paradox of Social Media Security: Users’ Perceptions versus Behavior Page 52 of 84
Figure 6.15 FS Testing hypothesis 1
The second hypothesis stated: The users’ level of perception of self-efficacy in information security
will positively correlate to the users’ safe behavior on social networking sites. The study surveyed
the users’ level of knowledge and awareness of several statements with security implications
related to Facebook, refer to Q2.4, Figure 6.14. The average on how each participant responded to
the first four statements has been calculated. Results show that there is a very low relationship (R
Square = 0.016) between the users’ perceptions of statements with security implications related to
Facebook and the likelihood that they will install and use a geotag removal software/app on their
computer or smartphone. This concludes that the second hypothesis is not supported.
y = -0.0576x + 3.7886
R² = 0.0041
0
1
2
3
4
5
6
0 1 2 3 4 5 6
Po
st p
ic. kn
ow
ing i
ts g
eota
gged
(Q
3.5
/Y2
)
Security severity of the activity (Q3.3/X2)

The Paradox of Social Media Security: Users’ Perceptions versus Behavior Page 53 of 84
Figure 6.16 FS Testing hypothesis 2
For hypothesis three: The users’ level of perception of the probability of an occurrence of security
threats will positively correlate to the users’ safe behavior on social networking sites, the
relationship was also low (R Square = 0.089) between the users’ opinion on how likely it is that
malicious people will exploit the posted photos, and the likelihood that they would install and use
geotag removal software/app to remove the geotag from these pictures. The conclusion is this
hypothesis is not supported.
y = 0.2195x + 2.2055
R² = 0.0164
0
1
2
3
4
5
6
0 1 1 2 2 3 3 4
Inst
all
& u
se g
eota
g r
emo
val
ap
p (
Q3
.5/Y
3)
Self-efficiency on security (Avarage, Q2.4 statments1-4)

The Paradox of Social Media Security: Users’ Perceptions versus Behavior Page 54 of 84
Figure 6.17 FS Testing hypothesis 3
Lastly, testing the fourth hypothesis: The users’ perception of the level of difficulty on the response
efficacy of security threats will negatively correlate to the users’ safe behavior on social
networking sites, shows that there is almost no correlation (R Square = 0.003) between the users’
opinion on how likely it is that malicious people will exploit the posted photos, and the likelihood
that they would post the pictures on their Facebook account if the geotag is removed from the
pictures. Consequently, the fourth hypothesis is not supported.
y = 0.3016x + 1.8006
R² = 0.0892
0
1
2
3
4
5
6
0 1 2 3 4 5 6
Inst
all
geo
tag r
emo
val
ap
p (
Q3
.4/Y
3)
Possibilities of security breach (Q3.2/X1)

The Paradox of Social Media Security: Users’ Perceptions versus Behavior Page 55 of 84
Figure 6.18 FS Testing hypothesis 4
Responses data were analyzed as well to investigate participants’ perceptions on posting pictures
they took on Facebook (Q3.2, Y1), their perception on posting those pictures after knowing the
geotag issue (Q3.5, Y2), and their perception on posting those pictures if the geotag is removed
(Q3.6, Y4). The results show that respondents’ perceived likelihood of posting pictures after
knowing the geotag issue is significantly different than before knowing the geotag issue (P value
= 0.006). This clarifies that Facebook users are less likely to post the pictures once they know the
geotag issue, although, we find interesting differences between male and female perceptions of
posting pictures for the same scenarios. Results indicate that women (with P = 0.001) are more
conservative than men (P = 0.145) when posting pictures after knowing that the pictures are
geotagged. Likewise, results for mature participants, 36-years-old or more, also show that they are
more conservative (P = 0.094) than young participants, 18 - 35-years-old, (P = 0.018) for same
scenarios. However, there was no significant differences among married and unmarried (single,
divorced, widowed) participants. Detailed results in Appendix B.
y = 0.0542x + 2.7529
R² = 0.003
0
1
2
3
4
5
6
0 1 2 3 4 5 6
Po
st p
ic. if
geo
tag r
emo
ved
(Q
3.6
/Y4
)
Self-efficacy of the preventive behavior (Q3.2/X1)

The Paradox of Social Media Security: Users’ Perceptions versus Behavior Page 56 of 84
Chapter 7. Discussion and Conclusion
Our research explores social media user’s awareness and behaviors while using Facebook among
students from the Information Technology Department of the College of Computing and Software
Engineering. The research conducted a literature review that explored the emergence of social
media and the social media security vulnerabilities and mitigation techniques, along with studying
four theories and models to examine the relationship between users’ perceptions and behavior. We
investigated Facebook users’ awareness regarding number of security threats related to Facebook.
We studied the users’ perceptions and behaviors using specific scenarios that we believe it can
measure users’ behaviors based on the theoretical model explained earlier in chapter 5. The
hypotheses presented in this research were found to be not supported. Human behavior is hard to
predict and explain.
Limitations and Future Work
As any research study, our study has a number of limitations. First, this research attempted to
investigate human behavior and perceptions while humans are hard to predict. Second, data were
collected from the Information Technology Department of the College of Computing and Software
Engineering, and all participants were graduate and undergraduate students; therefore, claims of
various academic backgrounds and skills were limited. On the other hand, choosing the geotag
scenario may not have been the best choice to test the users’ perceptions and behavior. The study
was simulated using online surveys, and no real environment was used. Furthermore, the language
of some questions, like Q3.2 (... Given this information, in your opinion how likely is it these
photos will be used maliciously by hackers if you post them on your Facebook account?) need to
be modified to use more specific terms. In addition, the relatedly of the survey to the factors that
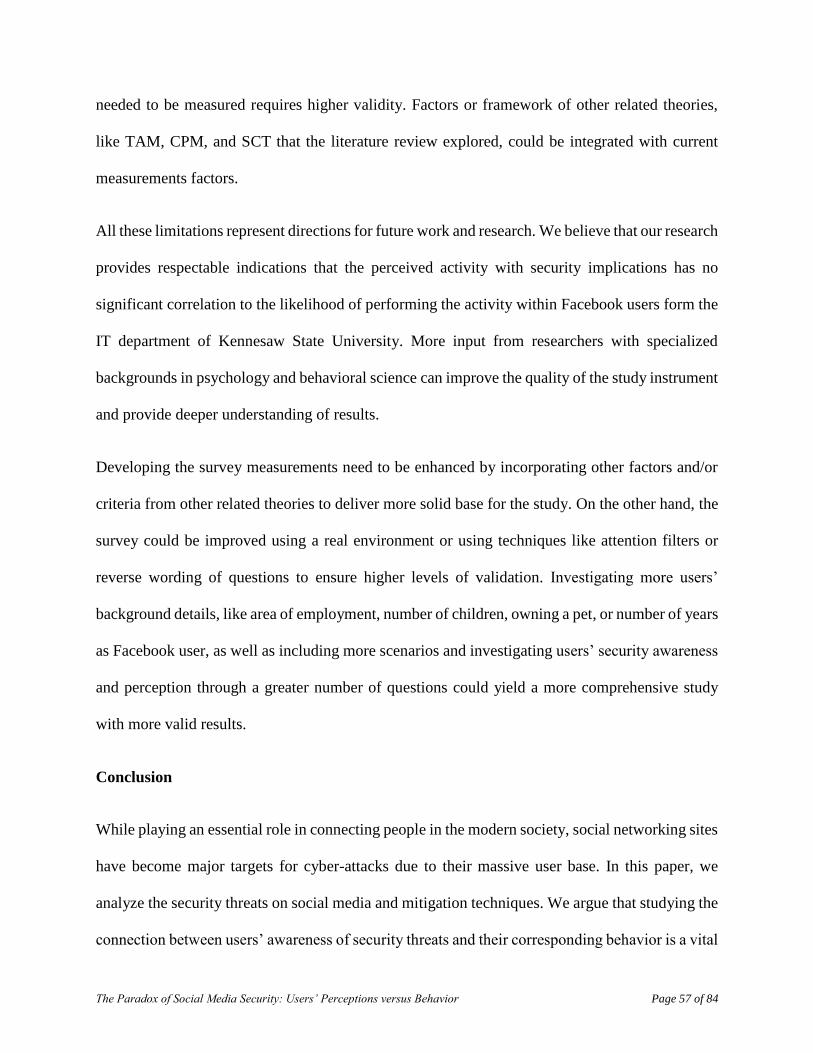
The Paradox of Social Media Security: Users’ Perceptions versus Behavior Page 57 of 84
needed to be measured requires higher validity. Factors or framework of other related theories,
like TAM, CPM, and SCT that the literature review explored, could be integrated with current
measurements factors.
All these limitations represent directions for future work and research. We believe that our research
provides respectable indications that the perceived activity with security implications has no
significant correlation to the likelihood of performing the activity within Facebook users form the
IT department of Kennesaw State University. More input from researchers with specialized
backgrounds in psychology and behavioral science can improve the quality of the study instrument
and provide deeper understanding of results.
Developing the survey measurements need to be enhanced by incorporating other factors and/or
criteria from other related theories to deliver more solid base for the study. On the other hand, the
survey could be improved using a real environment or using techniques like attention filters or
reverse wording of questions to ensure higher levels of validation. Investigating more users’
background details, like area of employment, number of children, owning a pet, or number of years
as Facebook user, as well as including more scenarios and investigating users’ security awareness
and perception through a greater number of questions could yield a more comprehensive study
with more valid results.
Conclusion
While playing an essential role in connecting people in the modern society, social networking sites
have become major targets for cyber-attacks due to their massive user base. In this paper, we
analyze the security threats on social media and mitigation techniques. We argue that studying the
connection between users’ awareness of security threats and their corresponding behavior is a vital

The Paradox of Social Media Security: Users’ Perceptions versus Behavior Page 58 of 84
component in social media security. Protection motivation theory (PMT) has been widely used to
examine people’s behavior in information security domain. We proposed that PMT theory can also
be adapted to explain and predict social media users’ behaviors that have security implications.
This paper extended the application of PMT to the social media domain, presents a resource in
user behavior research in the social media security field, and build a strong base to promote safe
user behavior on social networking sites.
This research investigates the relationship of users’ security perceptions and their actual behavior
on the social networking sites using Facebook as our survey platform. The study found that users’
perceptions on activity with security implications has no significant correlation with the likelihood
of performing that activity. Exploring behaviors that have security implication on social media
networks should be considered by more researchers. Protecting people from threats is very needed,
especially concerning massive use of social media networks.

The Paradox of Social Media Security: Users’ Perceptions versus Behavior Page 59 of 84
References
Ashford, W. (2013). Social media: A security challenge and opportunity. Retrieved April 20, 2016,
from http://www.computerweekly.com/feature/Social-media-a-security-challenge-and-
opportunity
Bandura, A. (1991). Social cognitive theory of self-regulation. Organizational Behavior & Human
Decision Processes, (2), 248.
Bandura, A. (1997). Self-Efficacy in Changing Societies. Cambridge University Press.
Bandura, A. (2001). Social Cognitive Theory of Mass Communication. Media Psychology, 3(3),
265.
Boss, S. R., Galletta, D. F., Lowry, P. B., Moody, G. D., & Polak, P. (2015). What Do Systems
Users Have to Fear? Using Fear Appeals to Engender Threats and Fear that Motivate Protective
Security Behaviors (SSRN Scholarly Paper No. ID 2607190). Rochester, NY: Social Science
Research Network. Retrieved from http://papers.ssrn.com/abstract=2607190
Boyd, D. M., & Ellison, N. B. (2007). Social Network Sites: Definition, History, and Scholarship.
Journal of Computer-Mediated Communication, 13(1), 210–230. http://doi.org/10.1111/j.1083-
6101.2007.00393.x
Chai, S. ( 1 ), Bagchi-Sen, S. ( 1 ), Rao, H. r. ( 1 ), Upadhyaya, S. j. ( 1 ), & Morrell, C. ( 2 ).
(2009). Internet and online information privacy: An exploratory study of preteens and early teens.
IEEE Transactions on Professional Communication, 52(2), 167–182.
http://doi.org/10.1109/TPC.2009.2017985
Chau, P. Y. K. (2001). Influence of computer attitude and self-efficacy on IT usage behavior.
Journal of End User Computing, 13(1), 26–33.
Chen, J., Ping, W., Xu, Y., & Tan, B. (2009). Am I Afraid of My Peers? Understanding the
Antecedents of Information Privacy Concerns in the Online Social Context. ICIS 2009
Proceedings. Retrieved from http://aisel.aisnet.org/icis2009/174
Chenoweth, T., Minch, R., & Gattiker, T. (2009). Application of protection motivation theory to
adoption of protective technologies. In Proceedings of the 42nd Annual Hawaii International
Conference on System Sciences, HICSS. http://doi.org/10.1109/HICSS.2009.74
Child, J. T., Haridakis, P. M., & Petronio, S. (2012). Blogging privacy rule orientations, privacy
management, and content deletion practices: The variability of online privacy management activity
at different stages of social media use. Computers in Human Behavior, 28, 1859–1872.
http://doi.org/10.1016/j.chb.2012.05.004
The Paradox of Social Media Security: Users’ Perceptions versus Behavior Page 60 of 84
Choi, G., & Chung, H. (2013). Applying the Technology Acceptance Model to Social Networking
Sites (SNS): Impact of Subjective Norm and Social Capital on the Acceptance of SNS.
International Journal of Human-Computer Interaction, 29(10), 619–628.
http://doi.org/10.1080/10447318.2012.756333
Compeau, D., Higgins, C. A., & Huff, S. (1999). Social Cognitive Theory and Individual Reactions
to Computing Technology: A Longitudinal Study. MIS Quarterly, 23(2), 145–158.
http://doi.org/10.2307/249749
Darmon, D., Sylvester, J., Girvan, M., & Rand, W. (2013). Predictability of User Behavior in
Social Media: Bottom-Up v. Top-Down Modeling. 2013 International Conference on Social
Computing, 102.
Davis, F. D. (1986). A technology acceptance model for empirically testing new end-user
information systems - Theory and results.pdf. Massachusetts Institute of Technology. Retrieved
from
https://www.researchgate.net/profile/Fred_Davis2/publication/35465050_A_technology_accepta
nce_model_for_empirically_testing_new_end-
user_information_systems__theory_and_results_/links/0c960519fbaddf3ba7000000.pdf
Davis, F. D. (1989). Perceived usefulness, perceived ease of use, and user acceptance of
information technology. MIS Quarterly, 13(1), 319–340.
Duggan, M., Ellison, M., Lampe, N. B., Lenhart, C., & Madden, M. (2015). Social Media Update
2014. Pew Research Center. Retrieved from http://www.pewinternet.org/2015/01/09/social-
media-update-2014/
Floyd, D. L., Prentice-Dunn, S., & Rogers, R. W. (2000). A meta-analysis of research on protection
motivation theory. Journal of Applied Social Psychology, 30(2), 407–429.
http://doi.org/10.1111/j.1559-1816.2000.tb02323.x
Fokes, E., & Li, L. (2014). A survey of security vulnerabilities in social networking media.
Proceedings of the 3rd Annual Conference Research in Information Technology, 57.
Foster, R. L. (2013). What a pilot study is and what it is not. Journal for Specialists in Pediatric
Nursing, 18(1), 1–2 2p. http://doi.org/10.1111/jspn.12015
Frampton, B. D., & Child, J. T. (2013). Friend or not to friend: Coworker Facebook friend requests
as an application of communication privacy management theory. Computers in Human Behavior,
29, 2257–2264. http://doi.org/10.1016/j.chb.2013.05.006
Gundecha, P., Barbier, G., & Liu, H. (2011). Exploiting vulnerability to secure user privacy on a
social networking site. Proceedings of the 17th ACM SIGKDD International Conference:
Knowledge Discovery & Data Mining, 511.

The Paradox of Social Media Security: Users’ Perceptions versus Behavior Page 61 of 84
Hampton, K. N. ., Goulet, L. S., Rainie, L., & Purcell, K. (2011). Social networking sites and our
lives. Pew Research Center’s Internet & American Life Project. Retrieved from
http://www.pewinternet.org/files/old-media//Files/Reports/2011/PIP%20-
%20Social%20networking%20sites%20and%20our%20lives.pdf
Herath, T., & Rao, H. R. (2009). Protection motivation and deterrence: a framework for security
policy compliance in organisations. European Journal of Information Systems, 18(2), 106–125.
Hopkins, W. G. (2000). Quantitative Research Design. Sportscience, 4(1). Retrieved from
http://www.sportsci.org/jour/0001/wghdesign.html
Internet Crime Complaint Center. (2014). Internet Crime Report 2014. Internet Crime Complaint
Center (IC3). Retrieved from https://www.ic3.gov/media/annualreport/2014_IC3Report.pdf
Internet World Stats. (2015). World Internet Usage and Population Statistics. Internet World Stats.
Retrieved from http://www.internetworldstats.com/stats.htm
Jenkins, J. L., Grimes, M., Proudfoot, J. G., & Lowry, P. B. (2014). Improving Password Cyber-
Security Through Inexpensive and Minimally Invasive Means: Detecting and Deterring Password
Reuse Through Keystroke-Dynamics Monitoring and Just-in-Time Fear Appeals (SSRN Scholarly
Paper No. ID 2292761). Rochester, NY: Social Science Research Network. Retrieved from
http://papers.ssrn.com/abstract=2292761
Johnston, A. C., & Warkentin, M. (2010). Fear Appeals and Information Security Behaviors: An
Empirical Study. MIS Quarterly, 34(3), 549-A4.
Jones, R. (2016, March 21). Social media users warned over rise in online ticket fraud. The
Guardian. Retrieved from http://www.theguardian.com/money/2016/mar/21/online-ticket-fraud-
social-media-users-warned-twitter-facebook-get-safe-online
Kaplan, A. M., & Haenlein, M. (2010). Users of the world, unite! The challenges and opportunities
of Social Media: KSU SuperSearch. Business Horizons, 53(1), 59–68.
Kaspar, K. (2015). An embodiment perspective on protection motivation theory: the impact of
incidental weight sensations on threat-appraisal, coping-appraisal, and protection
motivation/Teoria motivacie k ochrane z telesneho hl’adiska: vplyv vnimania hmotnosti na
hodnotenie hrozby, hodnotenie zvladania a motivaciu k ochrane. Studia Psychologica: Journal for
Basic Research in Psychological Sciences, (4), 301.
Keiser, B. E. (2016). Survey Research Polling and Beyond. Online Searcher, 40(2), 22–27.
Kennedy-Lightsey, C. D., Martin, M. M., Thompson, M., Himes, K. L., & Clingerman, B. Z.
(2012). Communication Privacy Management Theory: Exploring Coordination and Ownership
Between Friends. Communication Quarterly, 60(5), 665–680.
http://doi.org/10.1080/01463373.2012.725004

The Paradox of Social Media Security: Users’ Perceptions versus Behavior Page 62 of 84
Kwon, S. J., Park, E., & Kim, K. J. (2014). What drives successful social networking services? A
comparative analysis of user acceptance of Facebook and Twitter. The Social Science Journal, 51,
534–544. http://doi.org/10.1016/j.soscij.2014.04.005
LaRose, R., Mastro, D., & Eastin, M. S. (2001). Understanding Internet usage: A social-cognitive
approach to uses and gratifications. Social Science Computer Review, 19(4), 395–413.
http://doi.org/10.1177/089443930101900401
Lee, C. S., & Ma, L. (2012). News sharing in social media: The effect of gratifications and prior
experience. Computers in Human Behavior, 28(2), 331–339.
http://doi.org/10.1016/j.chb.2011.10.002
Li, Y. (2012). Theories in online information privacy research: A critical review and an integrated
framework. Decision Support Systems, 54, 471–481. http://doi.org/10.1016/j.dss.2012.06.010
Liu, H., & Maes, P. (2005). InterestMap: Harvesting Social Network Profiles for
Recommendations. Beyond Personalization-IUI, 56–66.
Lord, B. (2013, February 1). Keeping our users secure. Retrieved from
https://blog.twitter.com/2013/keeping-our-users-secure
Mitchell, K. J., Finkelhor, D., Jones, L. M., & Wolak, J. (2010). Use of Social Networking Sites
in Online Sex Crimes Against Minors: An Examination of National Incidence and Means of
Utilization. Journal of Adolescent Health, 47(2), 183–190.
http://doi.org/10.1016/j.jadohealth.2010.01.007
National Cyber Security Alliance. (2011). 2011 NCSA / McAfee Internet Home Users Survey.
National Cyber Security Alliance. Retrieved from
https://staysafeonline.org/download/datasets/2068/NCSA_McAfee_Online%20User%20Study_F
inal_11_15_11.pdf
National Cyber Security Alliance. (2012). 2012 NCSA / McAfee Online Safety Survey. National
Cyber Security Alliance. Retrieved from
https://staysafeonline.org/download/datasets/3890/2012_ncsa_mcafee_online_safety_study.pdf
National White Collar Crime Center. (2013). Criminal Use of Social Media (2013). The National
White Collar Crime Center (NW3C). Retrieved from
http://www.nw3c.org/docs/research/criminal-use-of-social-media.pdf?sfvrsn=6
Nemati, H., Wall, J. D., & Chow, A. (2014). Privacy Coping and Information-Sharing Behaviors
in Social Media: A Comparison of Chinese and U.S. Users. Journal of Global Information
Technology Management, 17(4), 228.
Oehri, C., & Teufel, S. (2012). Social media security culture - The Human Dimension in Social
Media Management. In Information Security for South Africa, 4(1), 1–5.

The Paradox of Social Media Security: Users’ Perceptions versus Behavior Page 63 of 84
Pagliery, J. (2013, December). Two million Facebook, Gmail and Twitter passwords stolen in
massive hack. Retrieved May 18, 2016, from
http://money.cnn.com/2013/12/04/technology/security/passwords-stolen/
Perrin, A. (2015). Social Media Usage: 2005-2015. Pew Research Center. Retrieved from
http://www.pewinternet.org/2015/10/08/social-networking-usage-2005-2015/
Petronio, S. (1991). Communication Boundary Management: A Theoretical Model of Managing
Disclosure of Private Information Between Marital Couples. Communication Theory (10503293),
1(4), 311.
Petronio, S. (2004). Road to Developing Communication Privacy Management Theory: Narrative
in Progress, Please Stand By. Journal of Family Communication, 4(3/4), 193–207.
http://doi.org/10.1207/s15327698jfc0403&4_6
Pierson, J. (2012). Online Privacy in Social Media: A Conceptual Exploration of Empowerment
and Vulnerability. Communications and Strategies, (88), 99–120.
http://doi.org/http://www.idate.org/en/Digiworld/Communications-
Strategies/Archives/Archives_50_.html
Popescul, D., & Georgescu, M. (2015). Social Networks Security in Universities: Challenges and
Solutions. Scientific Annals of the “Alexandru Ioan Cuza” University of Iasi: Economic Sciences
Series, 62, 53–63. http://doi.org/10.1515/aicue-2015-0036
Press Association. (2012, December). Social media-related crime reports up 780% in four years.
The Guardian. Retrieved from http://www.theguardian.com/media/2012/dec/27/social-media-
crime-facebook-twitter
Rauniar, R., Rawski, G., Yang, J., & Johnson, B. (2014). Technology acceptance model (TAM)
and social media usage: an empirical study on Facebook. Journal of Enterprise Information
Management, 27(1), 6–30. http://doi.org/10.1108/JEIM-04-2012-0011
Rogers, R. W. (1975). A Protection Motivation Theory of Fear Appeals and Attitude Change.
Journal of Psychology, 91(1), 93.
Rogers, R. W. (1983). Cognitive and physiological processes in fear appeals and attitude change:
A Revised theory of protection motivation. In J. Cacioppo & R. Petty (Eds.), Social
Psychophysiology. New York: Guilford Press. Retrieved from
https://www.researchgate.net/profile/John_Cacioppo/publication/229068371_Cognitive_and_ph
ysiological_processes_in_fear_appeals_and_attitude_change_A_revised_theory_of_protection_
motivation/links/54413d630cf2a76a3cc7d17e.pdf

The Paradox of Social Media Security: Users’ Perceptions versus Behavior Page 64 of 84
Sago, B. (2015). A comparison of user perceptions and frequency of use of social media to use of
social media. International Journal of Management and Marketing Research : IJMMR, 8(1), 15–
29.
Schneider, D. (2014, February 25). The Year of the Social Small Business [INFOGRAPHIC].
Retrieved from https://blog.linkedin.com/2014/02/25/the-year-of-the-social-small-business-
infographic
Siponen, M., Pahnila, S., & Mahmood, A. (2006). Factors Influencing Protection Motivation and
IS Security Policy Compliance. In 2006 Innovations in Information Technology (pp. 1–5).
http://doi.org/10.1109/INNOVATIONS.2006.301907
Stelzner, M. A. (2015). 2015 Social Media Marketing Industry Report. Social Media Examiner.
Retrieved from
http://www.socialmediaexaminer.com/SocialMediaMarketingIndustryReport2015.pdf
Treem, J. W., & Leonardi, P. M. (2013). Social Media Use in Organizations: Exploring the
Affordances of Visibility, Editability, Persistence, and Association. Annals of the International
Communication Association, 36(1), 143–189. http://doi.org/10.1080/23808985.2013.11679130
Tsai, H. S., Jiang, M., Alhabash, S., LaRose, R., Rifon, N. J., & Cotten, S. R. (2016).
Understanding online safety behaviors: A protection motivation theory perspective. Computers &
Security, 59, 138–150. http://doi.org/10.1016/j.cose.2016.02.009
Venkatesh, V., & Bala, H. (2008). Technology Acceptance Model 3 and a Research Agenda on
Interventions. Decision Sciences, 39(2), 273–315. http://doi.org/10.1111/j.1540-
5915.2008.00192.x
Whitney, L. (2011, August). More cyberattacks hitting social networks. Retrieved May 31, 2016,
from http://www.cnet.com/news/more-cyberattacks-hitting-social-networks/
Wueest, C. (2010). The risks of social networking. Symantec Corporation. Retrieved from
https://www.symantec.com/content/en/us/enterprise/media/security_response/whitepapers/the_ri
sks_of_social_networking.pdf
Xu, Z., Zhang, Y., Wu, Y., & Yang, Q. (2012). Modeling User Posting Behavior on Social Media.
In Proceedings of the 35th International ACM SIGIR Conference on Research and Development
in Information Retrieval (pp. 545–554). New York, NY, USA: ACM.
http://doi.org/10.1145/2348283.2348358
Yao, M. Z., Rice, R. E., & Wallis, K. (2007). Predicting user concerns about online privacy.
Journal of the American Society for Information Science & Technology, 58(5), 710–722.
http://doi.org/10.1002/asi.20530

The Paradox of Social Media Security: Users’ Perceptions versus Behavior Page 65 of 84
Youn, S. (2005). Teenagers’ Perceptions of Online Privacy and Coping Behaviors: A Risk–Benefit
Appraisal Approach. Journal of Broadcasting & Electronic Media, 49(1), 86–110.
http://doi.org/10.1207/s15506878jobem4901_6
Zhao, J., & Zhao, S. Y. (2015). Security and Vulnerability Assessment of Social Media Sites: An
Exploratory Study. Journal of Education for Business, 90(8), 458–466.
The Paradox of Social Media Security: Users’ Perceptions versus Behavior Page 66 of 84
Appendix A: Formal Study Instrument
Q1.1 You are being invited to take part in a research study, The Paradox of Social Media Security: Users’
Perceptions versus Behavior, conducted by Zahra Alqubaiti of Kennesaw State University. Zahra can be
reached at [email protected]. Before you decide to participate in this study, you should
read this form and ask questions about anything that you do not understand. The purpose of the study is
to investigate the relationship between the social media users’ security awareness and their actual
behavior while using social media. You are asked to complete an online survey and your participation
will require approximately 10 to 15 minutes. There are no known risks or discomforts associated with
this survey. Your input will help the researchers to better understand the students’ behavior while using
social media (Facebook). Taking part in this study is completely voluntary. Participants who complete
the survey will receive 5 extra points as class credit. Use the link at the end of survey to submit your name
and class number to receive your extra points. If you don’t want to take part of the survey, please contact
your instructor of the class for alternative extra point assignment. Your responses will be kept strictly
confidential, and digital data will be stored in secure computer files. Any report of this research that is
made available to the public will only include aggregated data. You must be 18 years of age or older to
participate in this study. The IP address will be automatically recorded by the online survey software. But
it won’t be used either for identification purpose or data analysis process. Research at Kennesaw State
University that involves human participants is carried out under the oversight of an Institutional Review
Board. Questions or problems regarding these activities should be addressed to the Institutional Review
Board, Kennesaw State University, 585 Cobb Avenue, KH3403, Kennesaw, GA 30144-5591, (470) 578-
2268. PLEASE PRINT A COPY OF THIS CONSENT DOCUMENT FOR YOUR RECORDS, OR IF
YOU DO NOT HAVE PRINT CAPABILITIES, YOU MAY CONTACT THE RESEARCHER TO
OBTAIN A COPY
I agree and give my consent to participate in this research project. I understand that participation is
voluntary and that I may withdraw my consent at any time without penalty. (4)
I do not agree to participate and will be excluded from the remainder of the questions. (5)
If I do not agree to participate... Is Selected, Then Skip To End of Survey
Q1.2 How old are you?
Under 18
18 - 25
26 - 35
36 - 45
46 - 55
56+

The Paradox of Social Media Security: Users’ Perceptions versus Behavior Page 67 of 84
Q1.3 What is your marital status?
Single (never married)
Married
Separated
Widowed
Divorced
Prefer not to answer
Q1.4 What is your gender?
Male
Female
Prefer not to answer
Q1.5 Do you login at least once a month to any of the following social networking sites? (check all
applicable)
Google +
YouTube
Snapchat
Others; please specify: ____________________
If Facebook Is Not Selected, Then Skip To End of Survey
Q1.6 What is the social networking site that you use most frequently?
Google +
YouTube
Snapchat
Others; please specify: ____________________
Q2.1 Have you ever read the terms and condition agreement of Facebook?
Yes
Less than 10 lines
No

The Paradox of Social Media Security: Users’ Perceptions versus Behavior Page 68 of 84
Q2.2 Is your Facebook profile private or public?
Private
Public
I don't know
Q2.3 On average, how often do you change your Facebook account password?
Once every several months
Once a year
Once every 2 - 3 years ago
Never
I don't know
Q2.4 Please indicate your opinions on the following statements:
Strongly
agree Agree Neutral Disagree
Strongly
disagree
I don't
know
Facebook can be used for spoofing
Clickjacking or Tag-jacking can occur on
Facebook is source of spams or/and viruses
Identity theft can happen in Facebook
Facebook is a safe community; nothing bad is
going to happen
Q3.1 Imagine that you have a group of friends who like to share pictures on Facebook, and you just took
few pictures of your backyard, food you just made, or furniture you just assembled. What’s the likelihood
you’ll post those pictures on your Facebook account?
Very likely
Likely
Neutral
Unlikely
Very unlikely
Q3.2 After taking the pictures, one of your friend told you that she noticed that your pictures are
geotagged, which means that those pictures could reveal your home location on Facebook if you post
them. Given this information, in your opinion how likely is it these photos will be used maliciously by
hackers if you post them on your Facebook account?
Very likely
Likely
Neutral
Unlikely
Very unlikely

The Paradox of Social Media Security: Users’ Perceptions versus Behavior Page 69 of 84
Q3.3 In your opinion, how severe the consequence is if those posted photos were hacked?
Very severe
Severe
Neutral
Not Severe
Not very severe
Q3.4 If your friend told you there is a software/app that can remove the geotags from the pictures, what’s
the likelihood of you would install this software/app and use it to remove the geotags from these
pictures?
Very likely
Likely
Neutral
Unlikely
Very unlikely
Q3.5 Knowing the geotags attached to those pictures you took, what’s likelihood that you will post them
on your Facebook account?
Very likely
Likely
Neutral
Unlikely
Very unlikely
Q3.6 If geotag is removed from those pictures, what’s likelihood that you would post those pictures on
your Facebook account?
Very likely
Likely
Neutral
Unlikely
Very unlikely
Q3.7 Thank you for your input! Please use the link below to claim your extra credits. The link will be
opened in a new window. Please submit this survey, then go to the new window to claim your extra
credits. Click here to claim your extra credits

The Paradox of Social Media Security: Users’ Perceptions versus Behavior Page 70 of 84
Appendix B: Formal Study - Analysis Tests
Table B.1 FS Regression analysis - Testing Hypothesis 1, Q3.3 (X2), Q3.5 (Y2)
Regression Statistics
Multiple R 0.064080511
R Square 0.004106312
Adjusted R Square -0.005657352
Standard Error 1.008239848
Observations 104
ANOVA
df SS MS F Significance F
Regression 1 0.427530244 0.427530244 0.420570809 0.518109721
Residual 102 103.6878544 1.016547592
Total 103 104.1153846
Coefficients Standard Error t Stat P-value
Intercept 3.788570576 0.257160873 14.73229787 5.25717E-27
X Variable 1 -0.057594748 0.088810296 -0.648514309 0.518109721
Lower 95% Upper 95% Lower 95.0% Upper 95.0%
Intercept 3.278493204 4.298647948 3.278493204 4.298647948
X Variable 1 -0.233749549 0.118560053 -0.233749549 0.118560053
Table B.2 FS Regression analysis - Testing Hypothesis 2, Q3.2 * Q3.3 (X1, X2), Q3.4 (Y3)
Regression Statistics
Multiple R 0.300528606
R Square 0.090317443
Adjusted R Square 0.072303927
Standard Error 1.061996529
Observations 104
ANOVA
df SS MS F Significance F
Regression 1 0.427530244 0.427530244 0.420570809 0.518109721
Residual 102 103.6878544 1.016547592
Total 103 104.1153846
Coefficients Standard Error t Stat P-value
Intercept 1.749234555 0.308424795 5.671510798 1.35266E-07
X Variable 1 0.283334809 0.109335098 2.591435098 0.010972472
X Variable 2 0.037035514 0.106738929 0.346972884 0.729333601
Lower 95% Upper 95% Lower 95.0% Upper 95.0%
Intercept 1.137402727 2.361066383 1.137402727 2.361066383
X Variable 1 0.066443387 0.500226232 0.066443387 0.500226232
X Variable 2 -0.17470581 0.248776837 -0.17470581 0.248776837

The Paradox of Social Media Security: Users’ Perceptions versus Behavior Page 71 of 84
Table B.3 FS Regression analysis - Testing Hypothesis 3, Q3.2 (X1), Q3.4 (Y3)
Regression Statistics
Multiple R 0.298719129
R Square 0.089233118
Adjusted R Square 0.080304031
Standard Error 1.057407484
Observations 104
ANOVA
df SS MS F Significance F
Regression 1 11.173874 11.17387 9.993532 0.002068751
Residual 102 114.0472798 1.118111
Total 103 125.2211538
Coefficients Standard Error t Stat P-value
Intercept 1.800626223 0.269363776 6.684738 1.25E-09
X Variable 1 0.301604697 0.095406639 3.161255 0.002069
Lower 95% Upper 95% Lower 95.0% Upper 95.0%
Intercept 1.266344452 2.334907995 1.266344452 2.334907995
X Variable 1 0.112366081 0.490843312 0.112366081 0.490843312
Table B.4 FS Regression analysis - Testing Hypothesis 4, Q3.2 (X1), Q3.6 (Y4)
Regression Statistics
Multiple R 0.054921385
R Square 0.003016359
Adjusted R Square -0.006757991
Standard Error 1.082277322
Observations 104
ANOVA
df SS MS F Significance F
Regression 1 0.361469968 0.361469968 0.308599419 0.579757302
Residual 102 119.4750685 1.171324201
Total 103 119.8365385
Coefficients Standard Error t Stat P-value
Intercept 2.752876712 0.275699113 9.985076415 8.7866E-17
X Variable 1 0.054246575 0.097650568 0.555517254 0.579757302
Lower 95% Upper 95% Lower 95.0% Upper 95.0%
Intercept 2.206028829 3.299724596 2.206028829 3.299724596
X Variable 1 -0.139442863 0.247936014 -0.139442863 0.247936014

The Paradox of Social Media Security: Users’ Perceptions versus Behavior Page 72 of 84
Table B.5 FS t-Test, Q3.1, Q3.5 (Y1, Y2)
Variable 1 Variable 2
Mean 3.365384615 3.634615
Variance 1.535100822 1.010829
Observations 104 104
Pearson Correlation 0.552468434 Hypothesized Mean Difference 0 df 103 t Stat -2.53884257 P(T<=t) one-tail 0.006308799 t Critical one-tail 1.659782273 P(T<=t) two-tail 0.012617597 t Critical two-tail 1.983264145
Table B.6 FS t-Test, Q3.5, Q3.6 (Y2, Y4)
Variable 1 Variable 2
Mean 3.63461538 2.894231
Variance 1.01082898 1.163462
Observations 104 104
Pearson Correlation 0.51012455 Hypothesized Mean Difference 0 df 103 t Stat 7.30659958 P(T<=t) one-tail 3.0133E-11 t Critical one-tail 1.65978227 P(T<=t) two-tail 6.0266E-11 t Critical two-tail 1.98326414
Table B.7 FS t-Test, Q3.1, Q3.6 (Y2, Y4)
Variable 1 Variable 2
Mean 3.365385 2.894231
Variance 1.535101 1.163462
Observations 104 104
Pearson Correlation 0.581317 Hypothesized Mean Difference 0 df 103 t Stat 4.490724 P(T<=t) one-tail 9.29E-06 t Critical one-tail 1.659782 P(T<=t) two-tail 1.86E-05 t Critical two-tail 1.983264

The Paradox of Social Media Security: Users’ Perceptions versus Behavior Page 73 of 84
Table B.8 FS t-Test, Q3.1, Q3.5 (Y1, Y2) - Male
Variable 1 Variable 2
Mean 3.527027 3.662162
Variance 1.403369 1.10348
Observations 74 74
Pearson Correlation 0.530318 Hypothesized Mean Difference 0 df 73 t Stat -1.067 P(T<=t) one-tail 0.144744 t Critical one-tail 1.665996 P(T<=t) two-tail 0.289488 t Critical two-tail 1.992997
Table B.9 FS t-Test, Q3.5, Q3.6 (Y2, Y4) - Male
Variable 1 Variable 2
Mean 3.662162 2.918919
Variance 1.10348 1.144021
Observations 74 74
Pearson Correlation 0.52393 Hypothesized Mean Difference 0 df 73 t Stat 6.180486 P(T<=t) one-tail 1.65E-08 t Critical one-tail 1.665996 P(T<=t) two-tail 3.3E-08 t Critical two-tail 1.992997
Table B.10 FS t-Test, Q3.1, Q3.6 (Y1, Y4) - Male
Variable 1 Variable 2
Mean 3.527027 2.918919
Variance 1.403369 1.144021
Observations 74 74
Pearson Correlation 0.531502 Hypothesized Mean Difference 0 df 73 t Stat 4.774402 P(T<=t) one-tail 4.52E-06 t Critical one-tail 1.665996 P(T<=t) two-tail 9.03E-06 t Critical two-tail 1.992997

The Paradox of Social Media Security: Users’ Perceptions versus Behavior Page 74 of 84
Table B.11 FS t-Test, Q3.1, Q3.5 (Y1, Y2) - Female
Variable 1 Variable 2
Mean 2.931034 3.551724
Variance 1.70936 0.827586
Observations 29 29
Pearson Correlation 0.633683 Hypothesized Mean Difference 0 df 28 t Stat -3.29419 P(T<=t) one-tail 0.00134 t Critical one-tail 1.701131 P(T<=t) two-tail 0.00268 t Critical two-tail 2.048407
Table B.12 FS t-Test, Q3.5, Q3.6 (Y2, Y4) - Female
Variable 1 Variable 2
Mean 3.551724 2.862069
Variance 0.827586 1.26601
Observations 29 29
Pearson Correlation 0.495697 Hypothesized Mean Difference 0 df 28 t Stat 3.575666 P(T<=t) one-tail 0.000647 t Critical one-tail 1.701131 P(T<=t) two-tail 0.001294 t Critical two-tail 2.048407
Table B.13 FS t-Test, Q3.1, Q3.6 (Y1, Y4) - Female
Variable 1 Variable 2
Mean 2.931034 2.862069
Variance 1.70936 1.26601
Observations 29 29
Pearson Correlation 0.74591 Hypothesized Mean Difference 0 df 28 t Stat 0.420305 P(T<=t) one-tail 0.338735 t Critical one-tail 1.701131 P(T<=t) two-tail 0.677471 t Critical two-tail 2.048407
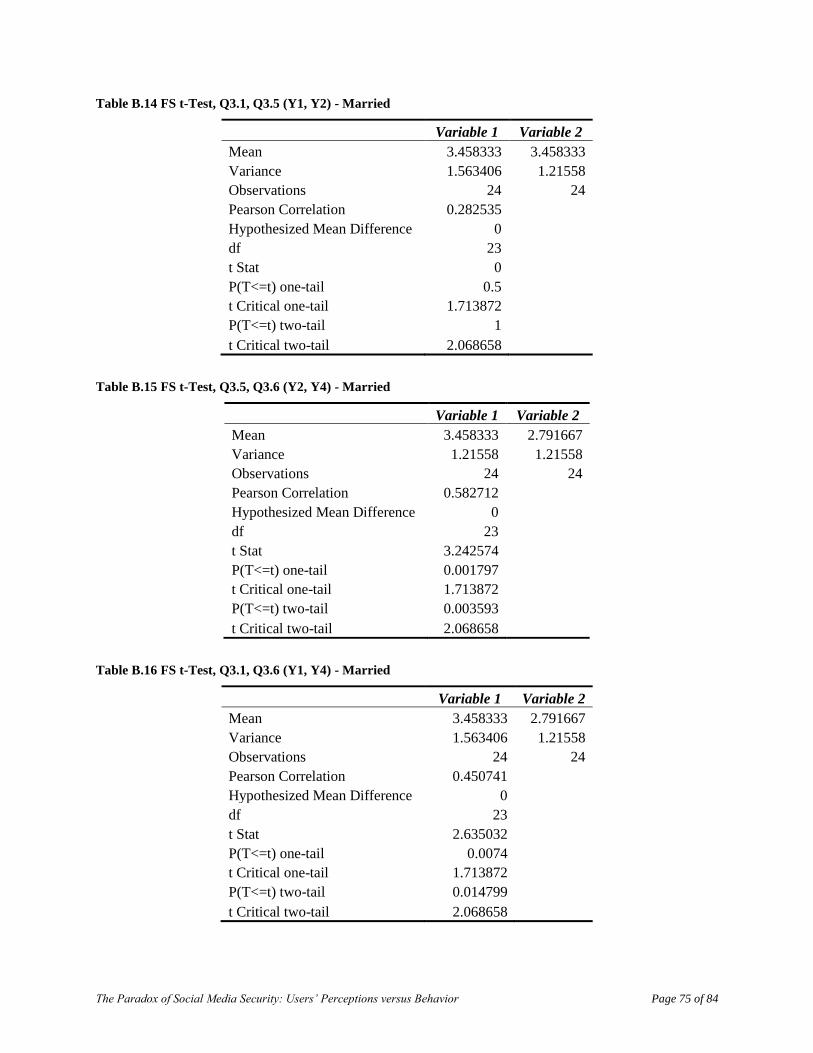
The Paradox of Social Media Security: Users’ Perceptions versus Behavior Page 75 of 84
Table B.14 FS t-Test, Q3.1, Q3.5 (Y1, Y2) - Married
Variable 1 Variable 2
Mean 3.458333 3.458333
Variance 1.563406 1.21558
Observations 24 24
Pearson Correlation 0.282535 Hypothesized Mean Difference 0 df 23 t Stat 0 P(T<=t) one-tail 0.5 t Critical one-tail 1.713872 P(T<=t) two-tail 1 t Critical two-tail 2.068658
Table B.15 FS t-Test, Q3.5, Q3.6 (Y2, Y4) - Married
Variable 1 Variable 2
Mean 3.458333 2.791667
Variance 1.21558 1.21558
Observations 24 24
Pearson Correlation 0.582712 Hypothesized Mean Difference 0 df 23 t Stat 3.242574 P(T<=t) one-tail 0.001797 t Critical one-tail 1.713872 P(T<=t) two-tail 0.003593 t Critical two-tail 2.068658
Table B.16 FS t-Test, Q3.1, Q3.6 (Y1, Y4) - Married
Variable 1 Variable 2
Mean 3.458333 2.791667
Variance 1.563406 1.21558
Observations 24 24
Pearson Correlation 0.450741 Hypothesized Mean Difference 0 df 23 t Stat 2.635032 P(T<=t) one-tail 0.0074 t Critical one-tail 1.713872 P(T<=t) two-tail 0.014799 t Critical two-tail 2.068658

The Paradox of Social Media Security: Users’ Perceptions versus Behavior Page 76 of 84
Table B.17 FS t-Test, Q3.1, Q3.5 (Y1, Y2) - Unmarried
Variable 1 Variable 2
Mean 3.395349 3.767442
Variance 1.197121 0.849391
Observations 43 43
Pearson Correlation 0.565583 Hypothesized Mean Difference 0 df 42 t Stat -2.56362 P(T<=t) one-tail 0.007014 t Critical one-tail 1.681952 P(T<=t) two-tail 0.014028 t Critical two-tail 2.018082
Table B.18 FS t-Test, Q3.5, Q3.6 (Y2, Y4) - Unmarried
Variable 1 Variable 2
Mean 3.767442 2.930233
Variance 0.849391 1.066445
Observations 43 43
Pearson Correlation 0.332778 Hypothesized Mean Difference 0 df 42 t Stat 4.847947 P(T<=t) one-tail 8.71E-06 t Critical one-tail 1.681952 P(T<=t) two-tail 1.74E-05 t Critical two-tail 2.018082
Table B.19 FS t-Test, Q3.1, Q3.6 (Y1, Y4) - Unmarried
Variable 1 Variable 2
Mean 3.395349 2.930233
Variance 1.197121 1.066445
Observations 43 43
Pearson Correlation 0.467512 Hypothesized Mean Difference 0 df 42 t Stat 2.776044 P(T<=t) one-tail 0.004092 t Critical one-tail 1.681952 P(T<=t) two-tail 0.008183 t Critical two-tail 2.018082

The Paradox of Social Media Security: Users’ Perceptions versus Behavior Page 77 of 84
Table B.20 FS t-Test, Q3.1, Q3.5 (Y1, Y2) - Young
Variable 1 Variable 2
Mean 3.345679 3.592593
Variance 1.579012 1.044444
Observations 81 81
Pearson Correlation 0.597717 Hypothesized Mean Difference 0 df 80 t Stat -2.13019 P(T<=t) one-tail 0.018114 t Critical one-tail 1.664125 P(T<=t) two-tail 0.036228 t Critical two-tail 1.990063
Table B.21 FS t-Test, Q3.5, Q3.6 (Y2, Y4) - Young
Variable 1 Variable 2
Mean 3.592593 2.864198
Variance 1.044444 1.168827
Observations 81 81
Pearson Correlation 0.492341 Hypothesized Mean Difference 0 df 80 t Stat 6.179789 P(T<=t) one-tail 1.27E-08 t Critical one-tail 1.664125 P(T<=t) two-tail 2.54E-08 t Critical two-tail 1.990063
Table B.22 FS t-Test, Q3.1, Q3.6 (Y1, Y4) - Young
Variable 1 Variable 2
Mean 3.345679 2.864198
Variance 1.579012 1.168827
Observations 81 81
Pearson Correlation 0.623861 Hypothesized Mean Difference 0 df 80 t Stat 4.223318 P(T<=t) one-tail 3.16E-05 t Critical one-tail 1.664125 P(T<=t) two-tail 6.32E-05 t Critical two-tail 1.990063

The Paradox of Social Media Security: Users’ Perceptions versus Behavior Page 78 of 84
Table B.23 FS t-Test, Q3.1, Q3.5 (Y1, Y2) - Mature
Variable 1 Variable 2
Mean 3.434783 3.782609
Variance 1.438735 0.905138
Observations 23 23
Pearson Correlation 0.365413 Hypothesized Mean Difference 0 df 22 t Stat -1.35755 P(T<=t) one-tail 0.094186 t Critical one-tail 1.717144 P(T<=t) two-tail 0.188371 t Critical two-tail 2.073873
Table B.24 FS t-Test, Q3.5, Q3.6 (Y2, Y4) - Mature
Variable 1 Variable 2
Mean 3.782609 3
Variance 0.905138 1.181818
Observations 23 23
Pearson Correlation 0.571331 Hypothesized Mean Difference 0 df 22 t Stat 3.945037 P(T<=t) one-tail 0.000345 t Critical one-tail 1.717144 P(T<=t) two-tail 0.00069 t Critical two-tail 2.073873
Table B.25 FS t-Test, Q3.1, Q3.6 (Y1, Y4) - Mature
Variable 1 Variable 2
Mean 3.434783 3
Variance 1.438735 1.181818
Observations 23 23
Pearson Correlation 0.418305 Hypothesized Mean Difference 0 df 22 t Stat 1.685935 P(T<=t) one-tail 0.05297 t Critical one-tail 1.717144 P(T<=t) two-tail 0.105941 t Critical two-tail 2.073873

The Paradox of Social Media Security: Users’ Perceptions versus Behavior Page 79 of 84
Appendix C: Pilot Study Instrument
Q1.1 How old are you?
Under 18
18 - 25
26 - 35
36 - 45
46 - 55
56+
Q1.2 What is your marital status?
Single (never married)
Married
Separated
Widowed
Divorced
Prefer not to answer
Q1.3 What is your gender?
Male
Female
Prefer not to answer
Q1.4 What is your current education level?
Undergraduate
Graduate
Postgraduate
Q1.5 How would you describe your knowledge in cyber security?
Beginner
Amateur
Intermediate
Professional
Expert
I don't know
Q1.6 Do you login at least once a month to any of the following social networking sites? (check all
applicable)
Google +
YouTube

The Paradox of Social Media Security: Users’ Perceptions versus Behavior Page 80 of 84
Snapchat
Others; please specify: ____________________
If Facebook Is Not Selected, Then Skip To End of Survey
Q1.7 What is the social networking site that you use most frequently?
Google +
YouTube
Snapchat
Others; please specify: ____________________
Q2.1 Have you ever read the terms and condition agreement of Facebook?
Yes
Less than 10 lines
No
Q2.2 Is your Facebook profile private or public?
Private
Public
I don't know
Q2.3 On average, how often do you change your Facebook account password?
Once every several months
Once a year
Once every 2 - 3 years ago
Never
I don't know
Q2.4 Please indicate your opinions on the following statements:
Strongly
agree Agree Neutral Disagree
Strongly
disagree
I don't
know
Facebook can be used for spoofing
Clickjacking can occur on Facebook
Tag-jacking can occur on Facebook
Facebook is source of spams or/and viruses
Identity theft can happen in Facebook
Facebook is a safe community; nothing bad is
going to happen

The Paradox of Social Media Security: Users’ Perceptions versus Behavior Page 81 of 84
Q3.1 Imagine that you have a group of friends who like to share pictures of their homemade food on
Facebook. You just made an elegant dish and took a few pictures of the dish. What’s the likelihood
you’ll post those pictures on your Facebook account?
Extremely likely
Likely
Neutral
Unlikely
Extremely unlikely
Q3.2 After taking the pictures, you find out the pictures are geotagged, which means that those pictures
could publish your home location on Facebook if you post them. Given this information, please indicate
your opinion on the questions below. In your opinion, how likely is it these photos will exploited by
malicious people if they are posted to your Facebook account?
Extremely likely
Likely
Neutral
Unlikely
Extremely unlikely
Q3.3 What do you think of the severity of consequence if those pictures were posted to your Facebook
account and exploited by the malicious people?
Extremely severe
Severe
Neutral
Not Severe
Extremely not severe
Q3.4 Knowing the geotag issue, what’s likelihood that you will post those pictures on your Facebook
account?
Extremely likely
Likely
Neutral
Unlikely
Extremely unlikely
Q3.5 If you were told there is a software/app that can remove the geotags, what’s the likelihood of you
would download and install this software/app on your computer or smartphone?
Extremely likely
Likely
Neutral
Unlikely
Extremely unlikely

The Paradox of Social Media Security: Users’ Perceptions versus Behavior Page 82 of 84
Q3.6 If the geotag removal software/app is already installed on your computer/smart phone, what’s
likelihood you would use the software/app to remove the geotag on the pictures?
Extremely likely
Likely
Neutral
Unlikely
Extremely unlikely
Q3.7 If geotag is removed from the pictures, what’s likelihood that you would post those pictures on your
Facebook account?
Extremely likely
Likely
Neutral
Unlikely
Extremely unlikely
Q3.8 Your input is greatly appreciated! Please use the link below to claim your extra credit.
https://kennesaw.co1.qualtrics.com/SE/?SID=SV_b2DeWkWKX37rVHL

The Paradox of Social Media Security: Users’ Perceptions versus Behavior Page 83 of 84
Appendix D: Pilot Study - Analysis Tests
Table D.1 PS Regression analysis - Testing Hypothesis 1, Q3.3 (X2), Q3.4 (Y2)
Regression Statistics
Multiple R 0.155563
R Square 0.0242
Adjusted R Square -0.02716
Standard Error 1.105806
Observations 21
ANOVA
df SS MS F Significance F
Regression 1 0.57619 0.57619 0.471203 0.500726451
Residual 19 23.23333 1.222807
Total 20 23.80952
Coefficients Standard Error t Stat P-value
Intercept 4.233333 0.727931 5.815572 1.33E-05
X Variable 1 -0.18333 0.267078 -0.68644 0.500726
Lower 95% Upper 95% Lower 95.0% Upper 95.0%
Intercept 2.709757 5.75691 2.709757 5.75691
X Variable 1 -0.74233 0.375666 -0.74233 0.375666
Table D.2 PS Regression analysis - Testing Hypothesis 2, Q3.2 * Q3.3 (X1, X2), Q3.4 (Y3)
Regression Statistics
Multiple R 0.330364221
R Square 0.109140518
Adjusted R Square 0.010156132
Standard Error 1.271512873
Observations 21
ANOVA
df SS MS F Significance F
Regression 2 3.565256935 1.782628 1.102603 0.353413276
Residual 18 29.10140973 1.616745
Total 20 32.66666667
Coefficients Standard Error t Stat P-value
Intercept 3.721236926 1.254632347 2.965998 0.008275
Q3.2 -0.381991814 0.25723461 -1.48499 0.154848
Q3.3 -0.108231014 0.31562965 -0.34291 0.735642
Lower 95% Upper 95% Lower 95.0% Upper 95.0%
Intercept 1.085352 6.357122 1.085352 6.357122
Q3.2 -0.92242 0.158438 -0.92242 0.158438
Q3.3 -0.77134 0.554882 -0.77134 0.554882

The Paradox of Social Media Security: Users’ Perceptions versus Behavior Page 84 of 84
Table D.3 PS Regression analysis - Testing Hypothesis 3, Q3.2 (X1), Q3.5 (Y3)
Regression Statistics
Multiple R 0.321435893
R Square 0.103321033
Adjusted R Square 0.056127403
Standard Error 1.241635443
Observations 21
ANOVA
df SS MS F Significance F
Regression 1 3.375153752 3.375153752 2.1893 0.15536271
Residual 19 29.29151292 1.541658574
Total 20 32.66666667
Coefficients Standard Error t Stat P-value
Intercept 3.383763838 0.759875561 4.453049961 0.000273
X Variable 1 -0.361623616 0.244401634 -1.47962847 0.155363
Lower 95% Upper 95% Lower 95.0% Upper 95.0%
Intercept 1.79332601 4.974201665 1.79332601 4.974201665
X Variable 1 -0.873162116 0.149914883 -0.873162116 0.149914883
Table D.4 PS Regression analysis - Testing Hypothesis 4, Q3.2 (X1), Q3.7 (Y5)
Regression Statistics
Multiple R 0.19416755
R Square 0.037701037
Adjusted R Square -0.012946276
Standard Error 1.238503159
Observations 21
ANOVA
df SS MS F Significance F
Regression 1 1.141802847 1.141802847 0.74438375 0.399019997
Residual 19 29.14391144 1.533890076
Total 20 30.28571429
Coefficients Standard Error t Stat P-value
Intercept 2.103321033 0.757958617 2.774981361 0.012062774
X Variable 1 0.210332103 0.24378508 0.862776767 0.399019997
Lower 95% Upper 95% Lower 95.0% Upper 95.0%
Intercept 0.516895416 3.68974665 0.516895416 3.68974665
X Variable 1 -0.299915934 0.72058014 -0.299915934 0.72058014