the perceived effects of the croatian customs …
TRANSCRIPT

25
* Opinions derived in this text represent authors’ opinions and may not reflect Customs Directorate’s attitudes. Authors give thanks to anonymous reviewers for very helpful comments and suggestions.
** Received: March 11, 2008 Accepted: November 24, 2008
THE PERCEIVED EFFECTS OF THE CROATIAN CUSTOMS SERVICES REFORM: THE OPINION OF FORWARDERS FROM ISTARSKA COUNTY
Marija KAŠTELAN-MRAK, PhD* Preliminary communication**Faculty of Economics, Rijeka UDC 339.543(497.5) JEL H11, L89
Alen BENAZIĆ, MSc*Customs Directorate, Pula Customs House
Abstract
The reforms of the public sector rank among the most complex problems Croatia has to face in the process of transition and accession to the EU. One of the recent reforms, the Customs Service Reform, offers insights into some of the achieved improvements and may serve as a guideline for reformers in other areas of public management. This rese-arch provides evidence of “customer satisfaction” with the functioning of the Croatian Customs System. Conclusions have been drawn based on the responses of 31 forwarders from Istarska County using a 19-item Likert scale. According to their opinion, services have improved in several aspects during the past few years, and accordingly the results can be interpreted as an indication of success of reform efforts.
Key words: public services, quality perception, reform results, customs services
1 Introduction
The general setting of any reform usually includes debates on institutional fit, effici-ency of the public sector and the quality of public services. Still, insufficient effort is de-
26
M. Kaštelan-Mrak and A. Benazić: Perceived effects of Croatian Customs Services Reform: the Opinionof Forwarders from Istarska CountyFinancial Theory and Practice 33 (1) 25-47 (2009)
dicated to discussing reform results and objectively establishing “cost-efficiencies”, im-proved “service quality” and other outcomes anticipated by strategic documents.
From the economic efficiency perspective, reforms demand resources in order to im-prove performance. In a market setting, the costs of a reform are expected to be offset by income generated upon its implementation. Reforms in the public sector should follow the same logic. However, observing inputs and outputs in public sector reforms is a far more complex issue, and so are the problems of defining ownership, motivation and control. Seen from the input side, public sector reforms bring about substantial investments from government and/or donor funds. Some costs will also be borne by the private sector since institutional changes imply discontinuity costs to the business process, and the presumed end benefactors of institutional reforms are forced to dedicate time and funds in adapting to the new business conditions. On the output side, even though reforms should produce benefits, there might be a problem of following reform results due to a high rate of new reforms running alongside. The motivation to measure outcomes may easily drop as new projects come around and as political leaders and political circumstances change.
Considering the wide population affected by reforms and the narrow time frame avai-lable for measurements, we decided to analyze the results of a recently run reform in Cro-atia. We chose the Customs Service Reform, because we are personally familiar with it since this study complements broader research within a doctoral thesis development.1
In this paper, we concentrated on researching solely into the perceptions of quality improvements brought on by the Reform from the perspective of forwarders, taken to con-stitute a specific group of customs service users. For the purpose of the research, a two-part questionnaire was developed as a research instrument for identifying the awareness of service users of the extent of the reform and their opinions on quality improvements achieved in customs services.
The questionnaire was administered in June 2007. All firms of the originally planned sample (31 respondents) returned the completed questionnaires. Only one respondent did not use the standard answering form, so his questionnaire results had to be discarded.
2 The reform of the Croatian Customs System
We start by providing an overview of the major activities that constitute inputs into the reform of the Croatian Customs System, followed by a reference to activities and me-asures defined to measure reform outcomes.
The Customs Directorate of Croatia has been implementing reforms aimed at impro-ving customs clearing for several years. Generally, it can be said that substantive reforms began in 2000 with the enforcement of the new Customs Law, by which the Croatian Cu-stoms System accepted regulations provided by the European Union’s Customs Code. In addition to drafting of the Law, further adjustments were made and as a result, today, the Croatian customs legislation is almost fully adjusted to the European. On Croatian acce-ssion to the European Union, Croatian Customs Law will go out of force, and the Cro-
1 The thesis focuses primarily on the efficiency gains of the reform. For this purpose some additional questions were added to the questionnaire used in this research.
27
M. Kaštelan-Mrak and A. Benazić: Perceived effects of Croatian Customs Services Reform: the Opinionof Forwarders from Istarska County
Financial Theory and Practice 33 (1) 25-47 (2009)
atian customs territory will become a part of the united European customs territory and wholly regulated by the European Customs Code.
The European Union recognized the need to adjust the Croatian Customs System and therefore included the Customs Directorate of the Republic of Croatia in different pro-grams of assistance. The fundamental, yet not the only, instrument promoting cooperation is the CARDS program, whose primary objective is to support Southeast European coun-tries to actively participate in the stabilization and accession process. Support is structu-red around financing institution building programs and investment programs.2 Fund users include public agencies, institutions providing help to legal entities, foundations and non-government organizations. Invested funds are nonrecurring.
Within the CARDS program framework, the Croatian Customs Directorate acts as a coordinator and a beneficiary of several projects. Some of them are:
• Integrated Border Management (CARDS 2001 – IBM) of 10.5 million euros, and its main objectives include building the institutional and administrative capacities of Customs Service and Border Police and the strengthening of cooperation among agencies that operate on Croatian border crossings;
• Integrated Tariff Management System (CARDS 2004 – ITMS) with the main objecti-ves of disseminating knowledge about the common European tariff system and other related legislation, educating and preparing documentation for IT development;3
• Support to the Customs Administration in the field of excise duties (CARDS 2003 – excise) with the main objectives of developing the administrative capacities of Cro-atian Customs Service in the field of excises and EMCS development;
• Strengthening of the Croatian Customs Laboratories System (CARDS 2003) aimed at building the capacities of the Croatian Customs laboratory system.
The IBM and ITMS projects are the projects we consider to be the most relevant to our research. Their implementation reflected directly on the effectiveness and efficiency of customs services by influencing customs clearing procedures, and thus the work con-tent of customs officers and the processing time for the movements of goods in interna-tional trade.4
The main objective of the Integrated Border Management Project was defined pre-cisely as the facilitation and acceleration of movement of goods and people, stressing the importance of strengthening inter-agency cooperation at border crossings concomitantly
2 The Croatian partner country for implementing of the CARDS program is the Republic of Austria - an EU country, historically, traditionally and culturally very close to Croatia. Under the sponsorship of the European Com-mission, the Croatian Customs Directorate concluded a twinning contract with the Austrian Customs Service on Feb-ruary 28, 2003, while the implementation of the CARDS project started on March 1, 2003.
3 Customs cooperation focuses on harmonizing the Croatian Customs System with the European. The European Union is a customs union, meaning that member states have harmonized customs systems, that there are no customs duties among member states, and that the system of customs tariffs to third countries is unique. The harmonization of the Croatian customs system will enable free trade between Croatia and EU member states. Parallel with harmoniza-tion, cooperation will be focused on the simplification and modernization of customs procedures, including the edu-cation of customs officers and the establishment of a modern customs information system.
4 In this paper, we try to establish primarily how successfully customs officers perform their everyday duties. Customs clearance is a rather routine procedure, therefore adequate for observing improvements in technical factors such as clearance time, simplified procedures, accessibility of customs officers, etc.

28
M. Kaštelan-Mrak and A. Benazić: Perceived effects of Croatian Customs Services Reform: the Opinionof Forwarders from Istarska CountyFinancial Theory and Practice 33 (1) 25-47 (2009)
with the protection of the Croatian border. The project was designed to contribute to re-gional stability due to the strengthening of border controls, and consequent decrease of illegal immigration. The value of the customs subcomponent of this project was 2 milli-on euros, out of which 1.2 million euros were allocated for technical support and 800 000 euros for investments. The project included:
• legislation development – analysis of customs legislation needs and shortcomin-gs and the provision of legal advice helping to bring about harmonization of legi-slation;
• building administrative capacities and increasing administrative efficiency, inclu-ding auditing, anti-fraud management, ethical principles;
• education of customs officers – creating a strategy for customs education, trainer education, establishing at Customs Academy;
• investment component – information and multimedia equipment, office equipment, vehicles and scanning equipment.
The Customs Directorate had organized and run various seminars and workshops for customs officers since the CARDS project began. Topics covered included: origin of goods, customs tariffs, organization of customs services, organization of the Europe-an Commission, organization of border crossings, customs valuation, data collecting and risk analysis, pre-arrival controls and audits, risk management and audit techniques, spe-cial customs procedures, passenger’s goods, diplomatic goods, customs procedures and establishment of the Customs Academy.
The second important CARDS project, the Integrated Tariff Management System, last-ed from November 7, 2005 to October 27, 2007. It included seminars, workshops, busi-ness trips and meetings of the auditing committee. Processed subjects included TARIC (Tarif Integré Communautaire), TQS (Tariff Quotas and Surveillance), EBTI (European Binding Tariff Information), ISPP (Information System for Processing Procedures), SMS (Specimen Management System), ECICS (European Customs Inventory of Chemical Sub-stances), BOI (Binding Origin Information). As a result, every customs house in Croatia has skilled trainers qualified to train other officials in all the areas mentioned above.
From the list of programs and activities mentioned above, it is evident that a large share of resources, not only financial, but also investments of time and effort have been dedicated to designing and implementing the Customs Service Reform. On the other hand, we feel that more should be done in terms of assessing the outcomes. This particularly ap-plies to establishing forms of external evaluation such as analyses of customer perception of the values/benefits gained by the reform.
The quality of provided services is a reform result most valuable to service users. In fact, the goal of “increasing the quality of public services” is explicitly mentioned among the eight goals of the State Administration Reform Strategy 2008-2011, right after “im-proving efficiency and cost-effectiveness” in the public sector. In describing quality as a goal (pp. 4-5), the Strategy also calls for running annual surveys of citizens’ opinions to be used along with other (internal) methods of appraisal. However, being a general doc-

29
M. Kaštelan-Mrak and A. Benazić: Perceived effects of Croatian Customs Services Reform: the Opinionof Forwarders from Istarska County
Financial Theory and Practice 33 (1) 25-47 (2009)
ument that does not concentrate on any specific government service, it does not go into details of how external surveys should be run.
An earlier document, the Action for IBM from 2006, concentrating specifically on Customs, also mentions quality as a reform measure, but it proposes a “quality manage-ment system” based solely on internal audit and control. External evaluations are not men-tioned (Table 1).5
Table 1 Measures of reforms in the Croatian Customs Service
Measure Explanation 1 Legislation
2 Management and organisation
3 Planning process
4 Quality management system
5 Establishing mobile units
6 Customs procedures
7 Human resources and education
8 Communication and information exchange
9 Information for customers
10 Public relations
11 Compatibility of IT system
12 Infrastructure and equipment
Croatian customs legislation needs to be completely harmonised with EU customs legislation;Improving flexibility through decentralisation and decision process delegation and organisational structure changes;Improving planning process and quality allocation of human resources and equipment;Establish quality management system based on internal audit and control;Establishing authorised and equipped mobile units with operational competence over the whole Croatian customs territory;Simplification and standardisation of customs procedures;Establishing permanent customs clearing in customs offices at frequent border crossings;Creating plans for extraordinary situations;Development of human resources and motivation, creating a strategy for human resources development;Establishing of management information system which provides simple and fast information access;Facilitated information access for customers of Customs service;Quality public relation provides increased public identity of customs service, establishing clear procedures of communication with public;Creating EU compatible IT system of customs service which supports processes in customs service;Croatian customs service has to be equipped according requirements of the EU
Source: Vlada RH (2006)
Furthermore, it should be pointed out that the European Commission also periodi-cally evaluates progress and assesses the administrative capacities of the Croatian Cu-stoms Directorate. However, apart from some insights into the general comments on the
5 In order to bridge this gap, we developed a questionnaire that would assess the opinion of service users and cover some of the goals established as measures of reforms. Our rationale was to assess the improvement achieved in areas most easily observable to service users and leave out the items less visible to outsiders (respondents). There-fore, from the list of reform measures listed in Table 1, we chose to concentrate on the last seven, starting from cus-toms procedures (6-12).

30
M. Kaštelan-Mrak and A. Benazić: Perceived effects of Croatian Customs Services Reform: the Opinionof Forwarders from Istarska CountyFinancial Theory and Practice 33 (1) 25-47 (2009)
advancement of the reform, no information about the specific techniques of measuring reform progress is provided. In short, the Commission’s report establishes that there is evidence of progress in the field of education of customs officers in the newly established Customs Academy and that considerable progress has been achieved in raising the acce-ssibility of customs services to the trade community. For example, all customs offices extended working hours for receiving customs declarations, some offices made possible the submission of customs declarations after working hours and some are now open 24/7 in order to provide continuous clearing of perishable products. Among the aspects of cu-stoms services that still require further attention, the European Commission emphasizes the issue of penalizing violations of procedures and corruption of customs officers. On this matter, the Customs Directorate has started a limited number of processes, but the general opinion is that the initiatives provided to fight corruption by the Customs Direc-torate are still quite unclear.
3 Approaches to quality
Quality should be observed as a multifaceted phenomenon. In developing our rese-arch, we referred primarily to work published by authors empirically researching quality through the lens of customer perception. However, we are aware, that at least two, wide-ly different, approaches in terms of defining and measuring quality exist. One is predo-minantly technical in nature and is oriented towards developing organizational capacities, while the other sees quality as a value perceived by customers and service users.
The reasons for the evolution of the “technical” concept of quality can be found in the development of manufacturing firms during the 20th century. In the technical setting of the traditional mass production factory and routine procedures, the problem of quality management may be reduced to ensuring conformity to standards. As far as markets are capable of absorbing production, conformance to standards guarantees efficiency of pla-nning and disposing of production factors. Adherence to standards, in the long run, even-tually develops time and cost efficient sampling techniques, as well as other forms of sy-stem improvement.6 An additional argument for defining widely recognizable standards of quality derives from globalization, where reliable quality facilitates the exchange of goods and services among firms and geographically dislocated areas.
From the 80s onwards, with the popularization of the quality movement, it has be-come common to look for sources of quality imbedded in organizations. The reason for studying quality became the development of business systems capable of sustaining sta-ble (business) processes and thus reliable levels of product/service quality. This approa-ch, labeled Total Quality Management (TQM), dominates contemporary Operations Ma-nagement textbooks (Hill, 2000; Schroeder, 1999; Gaither, 1992). In short, TQM can be defined as a “formalized system for evaluating the capacity of any organization to consi-stently design, provide and deliver products and services to specification” (Hill, 2000:343, highlighted by the authors).
6 When applying the same logic to customs services, technical (measurable) aspects of quality are related to time spent and costs dedicated to customs procedures. The method for reducing costs and time would revolve around for-malizing procedures and observing conformity to standards; an issue also relevant for evaluating the improvement in the efficiency of customs services, as in our research.

31
M. Kaštelan-Mrak and A. Benazić: Perceived effects of Croatian Customs Services Reform: the Opinionof Forwarders from Istarska County
Financial Theory and Practice 33 (1) 25-47 (2009)
Contrary to this predominantly technical approach, the marketing oriented approach does not pre-set standards for quality but tries to understand customer behavior. Instead, researchers in the field of marketing concentrate on quality as a predominantly perceptu-al phenomenon and the methods used to establish quality are usually customer surveys. In saturated mass markets, consumers do not have detailed technical information that will enable them to precisely recognize the costs and benefits of a purchase. The decision to purchase a product is made on a more or less intuitive/impulsive basis and therefore it de-pends on the perceived quality.
In academic research, the most common measurement tool is SERVQUAL. SER-VQUAL attempts to establish gaps between customer perception and expectations (Para-sumaran, Zeihaml and Berry, 1985; Cuthbert, 1996; Albaum, 1997; Kueng and Wettste-in, 2000). More recently, there is the SERVPERF method that measures service quality based “only on consumers’ perceptions of the performance of a service provider” (Brady and Cronim, 2002). The main difference between them is that SERVQUAL uses paired item scales questionnaires to identify gaps between expectations and perceptions of per-formance, implying that service quality is perceived whenever the customers’ perception of performance is equal to or greater than the expected level of service. SERVPERF tries to establish only measures of performance.
Comparing marketing- and operations-oriented approaches, we can observe that qu-ality in a technological sense usually corresponds to the adherence to standards as oppo-sed to quality seen as subjective perception of value gained by the customer. In our re-search we tried to integrate the technically oriented aspect of quality (the process design and factor contribution approach) and the marketing oriented idea of quality as positi-ve perception of individual consumers. Also, assuming that customers expectation in the case of public services, in our case customs services, would be fuzzy, or at best, based on some comparisons with earlier level of service (before the reform), we deliberately chose not to use SERVQUAL
It should be noted that the term “technical” is also sometimes used in marketing re-search but with a different meaning. A paper by Brady and Cronin (2001), describing the origins of service quality theory, uses the term “functional quality” to represent the customer’s perception of the technical quality reflecting the outcome of the service recei-ved. In some further exploration of the results of the reform of the Croatian Customs Ser-vice this “technical” outcome might be eventually measured as cost gains achieved beca-use of redesigned customs procedures.
Another useful clue received from Brady and Cronin (2001) concerns the use of a hierarchical approach in grouping variables. We decided to group variables around fac-tors contributing to improvements of customs services, much like the process-oriented TQM approach, rather than to group variables around sub-dimensions of quality percei-ved by customers.7
7 Brady and Cronin used open ended questionnaires encouraging respondents to list factors influencing their perception of quality, while we started with a questionnaire targeting measures proposed by the Customs Service Reform.

32
M. Kaštelan-Mrak and A. Benazić: Perceived effects of Croatian Customs Services Reform: the Opinionof Forwarders from Istarska CountyFinancial Theory and Practice 33 (1) 25-47 (2009)
In the final shaping of our questionnaire, additional useful clues were obtained from Bryer (2006). Bryer sets the concept of “responsiveness” of public administration into a historical setting. He develops a set of six variants of what he calls “bureaucratic respon-siveness” that vary in accordance to particular circumstances, determined by the changes in the perception of the role of public administration and the control methods “employed” to direct responses of administrators.
Another issue we wanted to take into consideration, was the effect of the general atti-tude of our respondents towards the reform of customs services on research results. We feared that a negative personal experience with the reform, specifically since the busine-ss of forwarders is bound to decline as custom procedures became simpler, might tran-slate into unfavorable opinions. Here, we were inspired by an article (Yang and Holzer, 2006) indicating possible difficulties in measuring performance of government services due to the lack of trust or misalignment of individual and common interests. Their article also stressed the impact of proper communication strategies on the quality of performan-ce perceived by government service users.
4 Research Methodology
We used a 19-item Likert scale questionnaire to measure respondents’ awareness and opinions. Each item was to be graded from 1-5 showing agreement or disagreement with proposed statements (1= strongly agree, 2=agree, 3= neutral, 4= disagree and 5= stron-gly disagree).
We distributed the questionnaire and asked the respondents to return it either by mail or fax. Each respondent received a letter explaining the purpose of the research, the 19-item questionnaire table and a second table requesting general information about the res-ponding firm. The returned questionnaires were analyzed by nonparametric tests using “Statistica”.
During the process of developing our research questionnaire we observed several pointers:
• Our first goal was to estimate the results of a reform project to complement a bro-ader and methodologically more detailed research being developed in a doctoral thesis. Since not much time elapsed from the beginning of the reform, we chose to concentrate on forwarders, as a relatively well-informed fraction of the population daily in touch with customs procedures.
• From the many approaches to quality, we wanted to develop a conceptual framework (section 3) that would be translated into a simple questionnaire form. The collected data should give us an insight into the factors relevant for achieving/managing qu-ality in the customs system.
• We tried to develop a measurement instrument that would spot reform improvements. The Customs Service has multiple roles. However, we concentrated on customs cle-arings procedures since the results in this domain would be easier to observe.
• We tried to keep the questionnaire short in order to the attention of our respondents and get the maximum number of questionnaires returned.

33
M. Kaštelan-Mrak and A. Benazić: Perceived effects of Croatian Customs Services Reform: the Opinionof Forwarders from Istarska County
Financial Theory and Practice 33 (1) 25-47 (2009)
Population – sample description
International forwarders constitute the population of firms most immediately influ-enced by the Customs Service Reform. They have daily contacts with customs officials and are thus the first group of “customers” to gain enough experience in the short period elapsed since the introducing the Reform. Also, we assumed forwarders would be will-ing to participate in our questionnaire, being professional service providers whose opera-tions depend most directly on the efficiency of customs services. They were also expect-ed to be critical of issues and problems that might have appeared along the reform pro-cess. We did, however, fear that generally worsening business conditions for forward-ers would lead respondents to an overly negative attitude towards the Customs Services Reform since forwarding activity might decline and small freight forwarders will be run out business. For this reason, several open-ended questions were introduced in a separate part of our questionnaire. This part inquired about general firm data, frequency of contact with customs officials, methods of acquiring information, software used as well as gen-eral business position of the forwarder in question.8
Geographically, we chose to concentrate our research on Istarska County.9 Our inten-tion was to have a more homogeneous population in terms of business performance, since not all Croatian counties are equally developed, and some are more, some are less involved in international trade. By restricting our research to a limited area, we reduced the possi-bility of responses being influenced by more general social and economic conditions.
Istarska County is one of the more entrepreneurial and economically better developed regions in Croatia. With 206 thousands of inhabitants, amounting to 4.65% of the populati-on of Croatia, Istarska County, with almost 7,200 registered business entities, accounts for 9.16% of the total number of Croatian entrepreneurs (Economic Profile of Istarska Coun-ty in 2006, 2007). It also accounts for a substantial part of Croatian foreign trade: making 1,038.6 million USD in exports, i.e. 10.01% of value of total Croatian exports, 1,127.9 million USD in import, or 5.25% of the value of total Croatian imports.10
There are 13 branch customs offices of Pula Customs House in Istarska County, ha-ving jurisdiction at 4 road border crossings, 4 sea border crossings, an airport and 8 in-land customs offices.
Of the total number of more than 550 business entities registered as forwarders in Croatia (February 1, 2007.), about 10 % are located in Istarska County. The total num-ber of active forwarding agents in Istarska County is 48 at the moment. Since some of the forwarders doing business in Istarska County have their headquarters in other regions and/or are not active (or were in the process of getting out of the business), we concentra-
8 This part of the questionnaire provided us with firm-specific information on increasing-decreasing level of activity in the past five years, concerning number of employees, number of clients, earnings and costs. It also con-tained a blank area for respondents to express their concerns and comments.
9 The fact that forwarders only from one region were included in the research might generate some questions on whether research conducted on the whole population of forwarders in Croatia might render somewhat different results. However, since the customs system is a centralized system and reforms were directed from the top, we would not expect major discrepancies among answers of respondents coming from different geographical areas.
10 Even though the trade balance in Istria is negative, as is the trade balance of Croatia as a whole, the disparity between exports and imports in Istria is much smaller.

34
M. Kaštelan-Mrak and A. Benazić: Perceived effects of Croatian Customs Services Reform: the Opinionof Forwarders from Istarska CountyFinancial Theory and Practice 33 (1) 25-47 (2009)
ted on forwarders actually doing business in Istarska County, i.e. on forwarders submi-tting customs declarations to the Customs House Pula, no matter on the location of their headquarters. Our final sample included 36 forwarders.
Out of these, 17 are registered as forwarders even though forwarding is their secon-dary business activity. Respondents were first contacted by phone to inform them about the research and eventually, a second time, after a couple of weeks, if their responses were not sent back. The final response rate was 86.1 %, providing us with a sample of 31 firms. One of the returned questionnaires was discarded since the respondent failed to follow the standard form of completing the questionnaire. The final sample of 30 firms can be consi-dered sufficiently large, especially granting the high proportion of respondents.
The final sample was then categorized by business activity into two subgroups:
Group 1 – Forwarding as only or main line of business (15 firms)
Group 2 – Forwarding as a secondary business activity (15 firms)11
The variables
Nine variables were defined to represent favorable opinions of services offered (V1, V2, V3, V5, V7, V8, V9, V10, V12 in table 2); four variables to convey unfavorable opi-nions (V4, V11, V13, V16). The latter, apart from inquiring into specific items, also ser-ved to test scores obtained for positively worded opinions. As the respondents completed the questionnaire on their own, we could not control in advance how seriously respon-dents would approach the questionnaire. Therefore, we tried mixing positive and negati-ve statements to enable us to spot, later on, eventual respondents that would just circle all answers along the same line, without carefully reading the statements.12
The remaining variables were used to test the respondents’ awareness of the com-plexity of the reform process, the steps already taken (e.g. establishment of an internal control unit and the Customs’ Academy) and to check their opinions on specific matters (V6, V14, V15, V17, V18, V19). These variables were included to suggest directions for future lines of research.
Variables were grouped to cover three dimensions of quality: the first one being what may be considered an overall measure of quality, indicating the general reform results; and the other two were conceived as indicators of the contribution of human and techni-cal factors to the success of the reform. We added an additional group of variables (mis-cellaneous), which do not fit any of the previously mentioned groups. Consequently we ended up with four groups of variables:
1 G-1 - general perception that services have improved Four variables were used to reflect the progress made in the past 3-4 years (V1, V2,
V3, V9). The general opinion of the respondents, expressed by the first item of the que-stionnaire (V1 - We have noticed an improvement in services during the past 3-4 years)
11 It was not our intention to have the same number of respondents in each sub group.12 In general, the respondents filled the questionnaire with care, which can also be observed from the fact that
many wrote down short comments in the designated blank area of the questionnaire.

35
M. Kaštelan-Mrak and A. Benazić: Perceived effects of Croatian Customs Services Reform: the Opinionof Forwarders from Istarska County
Financial Theory and Practice 33 (1) 25-47 (2009)
Table 2 Main questionnaire form
Question 1 2 3 4 5 V1 We have noticed a general improvement of custom services in the past
3-4 years V2 Custom procedures take less time now than 3-4 years ago V3 Custom procedures are now simpler than they were 3-4 years ago V4 Changes in the process happen too often (changes in needed documents,
rules, …) V5 Methods of disseminating information about these changes are clear,
detailed and prompt V6 A customs academy or other institution should administer an organized
system for educating and certifying forwarders V7 Customs offi cials know their job and perform it correctly V8 Customs offi cials always have enough time and there is no unnecessary
waiting V9 Customs offi cials are more responsive than 3-4 years agoV10 In their work, custom offi cials abide by public interest and ethics V11 Personal contact with a customs offi cial is important, otherwise there
might be delays V12 Equipment level at the customs offi ces conforms with the nature of their
tasks V13 Investment in equipment by customs lags behind investments carried
out by forwarders V14 A possibility of e-services (no paper copies) will make our work easier V15 A forwarder who is well organized, is capable of rendering faster
services and therefore able to decrease costs per job/client V16 Customs services in neighboring countries (EU) are better organized
than those in Croatia V17 The Customs Directorate has established an effi cient internal control
division within the customs system V18 The harmonization of the Croatian Customs System with the European
will favor primarily Croatian exporters V19 The harmonization of the Croatian Customs System with the European
will favor primarily Croatian importers
Note: The questionnaire was in Croatian and did not specify favorable from unfavorable sta-tements. For practical purposes variable highlights will be abbreviated later on in the paper.It should also be noted that a few respondents did not check a specific field when answering the que-stionnaire, but rather wrote YES or NO in the box they found most appropriate. The only questionnaire discarded was the one that has checked all his answers as yes and no in the first column, so we could not access his level of conformance with a particular statement.
Source: autor’s
was highly positive. We further tested respondents’ opinion by differentiating three pre-sumable dimensions of improvements in service quality: V2-shorter procedures, V3-sim-pler procedures and V9-improved responsiveness of customs official to users. As a final

36
M. Kaštelan-Mrak and A. Benazić: Perceived effects of Croatian Customs Services Reform: the Opinionof Forwarders from Istarska CountyFinancial Theory and Practice 33 (1) 25-47 (2009)
confirmation, the general perception of improvement was also tested through the state-ment that neighboring countries have better customs services (V16).
Group forms the set of dependant variables and constitutes the starting hypothesis that quality of public services has improved due to the Reform.
2 G-2 – quality of personnel (HUMAN FACTOR)Four variables (V7, V8, V9, V10) were used to establish the quality of personnel.
Through these variables we attempted to establish the respondents’ perception of the qu-ality of work and attitudes of custom officers by inquiring into their knowledge, availa-bility, responsiveness and their attitude concerning public interest.
3 G-3 – quality of equipment (TECHNICAL FACTOR)Two variables (V12, V13) were used to inquire directly into the respondents’ per-
ception of the technical adequacy of equipment, one phrased to carry a positive connota-tion and one a negative. Two additional variables, also presented on the list, can be con-sidered as pertaining to the technical factor; variable V5, used to test the perceived qu-ality of the methods of disseminating information on changes and variable V14, asking whether the possibility of using e-services would contribute considerably towards sim-plifying customs’ procedures. Both variables were used to suggest possible procedural/technological deficiencies.
4 G-4 - miscellaneous The last group of variables (V6, V15, V17, V18 and V19) constitutes a group of an-
swers that offers some insight into the respondents’ understanding of the Reform and their general attitude towards the customs harmonization process.
5 Observations and discussion
Three hypotheses were tested:
H1 – The reform has been successful in terms of providing higher customer satis-faction
H2 – The better-informed service users show more positive opinions than the less informed
H3 – The more involved/motivated (the ones whose main line of business is forwar-ding) have opinions that differ from those of the less involved. 13
5.1 General opinion
The general opinion on the results of the Customs Reform was positive.
The results obtained are presented in Table 3. It indicates the number of respondents that chose a certain value for each variable and the TOTAL, signifying the overall num-ber of respondents checking each value. The right side of the table shows the sum obtai-
13 Hypotheses H2 and H3 were introduced in order to test whether firm-specific data did impact on respondents’ opinion on the performance of customs services.

37
M. Kaštelan-Mrak and A. Benazić: Perceived effects of Croatian Customs Services Reform: the Opinionof Forwarders from Istarska County
Financial Theory and Practice 33 (1) 25-47 (2009)
ned for each variable14 (calculated as the sum of checked values multiplied by the number of respondents checking these values), the mean value15 (sum of all scores divided by the number of actual respondents) and the standard deviation (as a measure of dispersion).
As seen from the frequency distribution of positive opinion indicators (Table 3), most answers fall into the categories 1 and 2 (very much agree and agree). According to the respondents, excellent results have been obtained by the Reform in terms of the general perception of improvement in the functioning of customs services (mean 2.07). Among specific dimensions of perceived improvements, V2 has the lowest sum (V2-time to per-form procedures compared to 3-4 years ago) and therefore seems to be the greatest be-nefit of the Reform, well recognized by the respondents.
In the ranking of the 9 items presented in Table 3, the best ranked would be V2, se-cond best in rank are variables V10 and V1 (customs officials observing the public interest
14 When interpreting “sum” as an aggregate score, positively worded opinion statements with a lower sum value represent a more favorable opinion. For example, if most respondents agree with the statement “Custom procedures now take less time than 3-4 years ago”, the total sum of their scores would be low, the lowest possible score being 30, which would mean that all respondents answered the question checking “1” as their opinion. If the reform had no effect in this aspect of performance, and all respondents, therefore, extremely disagreed with the given statement, the maximum possible sum obtained would be 150.
15 The median and mode for each item are easily observable from the frequency tables.
Table 3 Frequency distribution of positive opinion statements
Variable 1 2 3 4 5 Missing cases
Sum Mean σ
V1 General improvement 11 11 5 1 2 0 62 2.07 1.14
V2 Procedures last shorter 15 9 4 0 2 0 55 1.83 1.12
V3 Procedures are simpler 9 12 7 0 2 0 64 2.13 1.07
V9 Officials are more responsive 4 12 10 1 2 1 72 2.48 1.02
V7 Officials know their job 5 16 4 2 3 0 72 2.40 1.62
V8 Officials have enough time 5 14 4 4 3 0 76 2.53 1.22
V10 Officials observe the public interest 10 13 2 5 0 0 62 2.07 1.05
V12 Equipment is adequate 7 8 6 4 3 2 72 2.57 1.32
V5 Info dissemination is adequate 0 10 3 7 9 1 102 3.52 1.27
Total 66 105 45 24 26 4
Source: authors’ calculation
38
M. Kaštelan-Mrak and A. Benazić: Perceived effects of Croatian Customs Services Reform: the Opinionof Forwarders from Istarska CountyFinancial Theory and Practice 33 (1) 25-47 (2009)
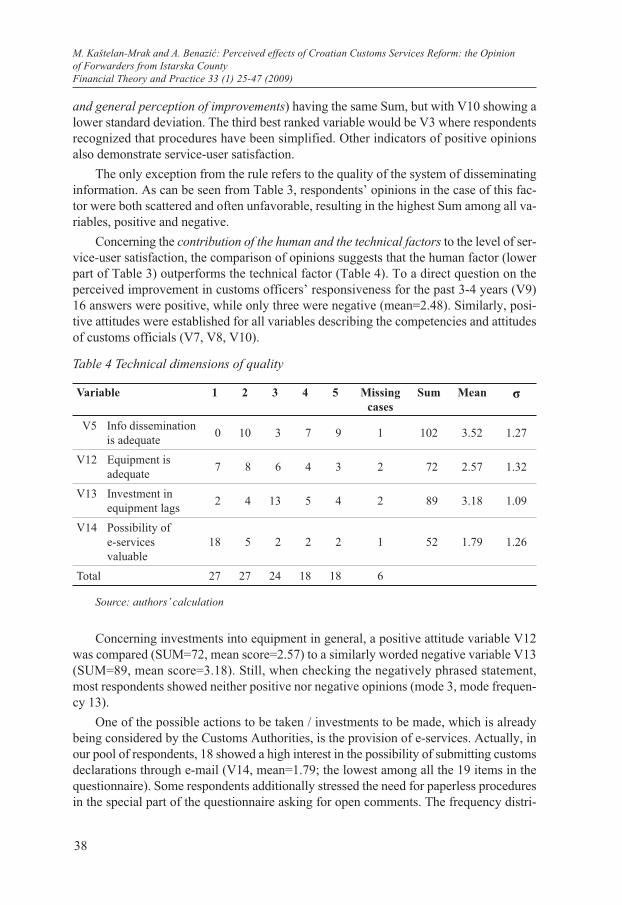
Table 4 Technical dimensions of quality
Variable 1 2 3 4 5 Missing cases
Sum Mean σ
V5 - Info dissemination is adequate 0 10 3 7 9 1 102 3.52 1.27
V12 - Equipment is adequate 7 8 6 4 3 2 72 2.57 1.32
V13 - Investment in equipment lags 2 4 13 5 4 2 89 3.18 1.09
V14 - Possibility of e-services valuable
18 5 2 2 2 1 52 1.79 1.26
Total 27 27 24 18 18 6
Source: authors’ calculation
and general perception of improvements) having the same Sum, but with V10 showing a lower standard deviation. The third best ranked variable would be V3 where respondents recognized that procedures have been simplified. Other indicators of positive opinions also demonstrate service-user satisfaction.
The only exception from the rule refers to the quality of the system of disseminating information. As can be seen from Table 3, respondents’ opinions in the case of this fac-tor were both scattered and often unfavorable, resulting in the highest Sum among all va-riables, positive and negative.
Concerning the contribution of the human and the technical factors to the level of ser-vice-user satisfaction, the comparison of opinions suggests that the human factor (lower part of Table 3) outperforms the technical factor (Table 4). To a direct question on the perceived improvement in customs officers’ responsiveness for the past 3-4 years (V9) 16 answers were positive, while only three were negative (mean=2.48). Similarly, posi-tive attitudes were established for all variables describing the competencies and attitudes of customs officials (V7, V8, V10).
Concerning investments into equipment in general, a positive attitude variable V12 was compared (SUM=72, mean score=2.57) to a similarly worded negative variable V13 (SUM=89, mean score=3.18). Still, when checking the negatively phrased statement, most respondents showed neither positive nor negative opinions (mode 3, mode frequen-cy 13).
One of the possible actions to be taken / investments to be made, which is already being considered by the Customs Authorities, is the provision of e-services. Actually, in our pool of respondents, 18 showed a high interest in the possibility of submitting customs declarations through e-mail (V14, mean=1.79; the lowest among all the 19 items in the questionnaire). Some respondents additionally stressed the need for paperless procedures in the special part of the questionnaire asking for open comments. The frequency distri-

39
M. Kaštelan-Mrak and A. Benazić: Perceived effects of Croatian Customs Services Reform: the Opinionof Forwarders from Istarska County
Financial Theory and Practice 33 (1) 25-47 (2009)
bution for some of the negatively worded variables (Table 5) confirms the impression that the technical aspects of the Reform should receive additional attention.
Table 5 Frequency distribution of negative opinion statements
Variable 1 2 3 4 5 Missing cases
Sum Mean σ
V4 Changes happen too often 10 13 5 1 0 1 55 1.90 0.81
V11 Personal contact necessary 13 6 6 3 2 0 65 2.17 1.29
V13 Investment in equipment lags 2 4 13 5 4 2 89 3.18 1.09
V16 EU customs better than Croatian 5 7 10 4 1 3 70 2.59 1.08
Total 30 30 24 13 7 6
Source: authors’ calculation
On the average the score for all negative variables is slightly higher than for positive variables. The average mean, calculated form table 5 is 2.46 for negative opinions aga-inst 2.40 for positive opinions (Table 4).
A very homogeneous perception of respondents relates to the frequent changes in the customs system (V4). In fact, the fast rate of changes is the variable that shows the highest agreement among respondents (lowest standard deviation among all variables). According to the opinion of the majority of them, changes happen too often (mean=1.90). Up to a point, this finding can be expected since the main purpose of reforms is to provide chan-ge. On the other hand, since changes disrupt existing patterns of behavior and increase the pressure by demanding time, learning, investments in equipment, it is natural to expect the respondents to show some discomfort, if not direct dissatisfaction, with the pace of changes. However, in striving for perfection, observations on this variable could be inter-preted as a signal that some action might be directed towards simplifying the process of forwarders’ adaptation to imminent changes. A possible way of action, suggested also by the results obtained for variable V5 (for which respondents showed discontent - see Table 4), would be to improve the process of communicating with service users.
It is interesting to note that respondents have shown the most pronounced agreement with statement V14 where 18 respondents checked that they highly agree that the imple-mentation of electronic processing of customs declarations would improve efficiency. This finding confirms that forwarders, as a group, are sensitive to technical factors influ-encing quality (process design). Consequently, reform managers could win extra support by investing in this area and by stressing technical improvements in their communicati-on with service users. However, the level of investment in equipment by the customs au-thorities appears to be satisfactory. When comparing investments by forwarders and by

40
M. Kaštelan-Mrak and A. Benazić: Perceived effects of Croatian Customs Services Reform: the Opinionof Forwarders from Istarska CountyFinancial Theory and Practice 33 (1) 25-47 (2009)
the customs, the majority of respondents perceived no lags of investments by the customs (median=3, mean=3.18).
Finally, as another check-point on the general level of forwarder satisfaction, respon-ses on variable V16, where Croatian customs services are compared to those in the EU, demonstrate only a slightly lower opinion of the quality of Croatian services than that of the customs’ authorities of other European countries.
A high proportion of respondents chose to agree with the statement V15 that better organized forwarders have shorter processing and lower costs (Table 6).
Table 6 Frequency distribution of opinions on miscellaneous items
Variable 1 2 3 4 5 Missing cases
Sum Mean σ
V6 Academy should be established 13 10 3 2 1 1 55 1.90 1.08
V15 Better org forwarders perform better 18 4 2 2 3 1 55 1.90 1.40
V17 Efficient internal controls exist 4 9 10 2 2 3 70 2.50 1.17
V18 EU harm favors Croatian exporters 11 8 7 4 0 0 64 2.33 1.07
V19 EU harm favors Croatian importers 6 10 10 0 2 2 66 2.36 1.06
Total 42 41 32 10 8 7
Source: authors’ calculation
Service users, as outsiders, are not in the position to perceive/judge the quality of the organizational skills and the efforts applied by Reform managers. For example, the distri-bution of answers for variable V17, with three missing answers and 10 respondents neit-her agreeing nor disagreeing with the statement that efficient internal controls exist, sug-gests rather that respondents do not have an opinion on the issue, rather that they are eit-her satisfied or dissatisfied with the level of services received.
The next step in our research was to establish statistical correlations among our vari-ables. Spearman Rank Order Correlations were calculated using Statistica (with p<0.05) with negatively phased variables recoded (The table is presented in the annex). Statisti-cally significant correlations are evident among all variables relating to the improvement achieved over the past 3-4 years, as well as for the variables describing the capabilities and attitudes of customs officers. The generally high perception of improvement correla-ted significantly with all nine variables referring to positive attitudes: shorter processing times, simpler procedures, adequate information diffusion, the four variables concerning customs officers’, adequate equipment and internal controls. We also noted that the opi-
41
M. Kaštelan-Mrak and A. Benazić: Perceived effects of Croatian Customs Services Reform: the Opinionof Forwarders from Istarska County
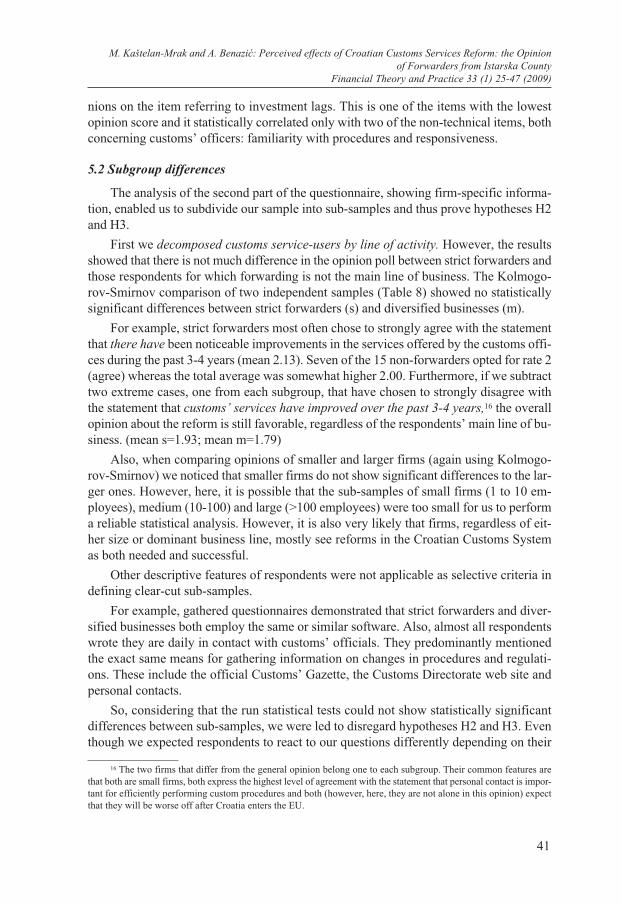
Financial Theory and Practice 33 (1) 25-47 (2009)
nions on the item referring to investment lags. This is one of the items with the lowest opinion score and it statistically correlated only with two of the non-technical items, both concerning customs’ officers: familiarity with procedures and responsiveness.
5.2 Subgroup differences
The analysis of the second part of the questionnaire, showing firm-specific informa-tion, enabled us to subdivide our sample into sub-samples and thus prove hypotheses H2 and H3.
First we decomposed customs service-users by line of activity. However, the results showed that there is not much difference in the opinion poll between strict forwarders and those respondents for which forwarding is not the main line of business. The Kolmogo-rov-Smirnov comparison of two independent samples (Table 8) showed no statistically significant differences between strict forwarders (s) and diversified businesses (m).
For example, strict forwarders most often chose to strongly agree with the statement that there have been noticeable improvements in the services offered by the customs offi-ces during the past 3-4 years (mean 2.13). Seven of the 15 non-forwarders opted for rate 2 (agree) whereas the total average was somewhat higher 2.00. Furthermore, if we subtract two extreme cases, one from each subgroup, that have chosen to strongly disagree with the statement that customs’ services have improved over the past 3-4 years,16 the overall opinion about the reform is still favorable, regardless of the respondents’ main line of bu-siness. (mean s=1.93; mean m=1.79)
Also, when comparing opinions of smaller and larger firms (again using Kolmogo-rov-Smirnov) we noticed that smaller firms do not show significant differences to the lar-ger ones. However, here, it is possible that the sub-samples of small firms (1 to 10 em-ployees), medium (10-100) and large (>100 employees) were too small for us to perform a reliable statistical analysis. However, it is also very likely that firms, regardless of eit-her size or dominant business line, mostly see reforms in the Croatian Customs System as both needed and successful.
Other descriptive features of respondents were not applicable as selective criteria in defining clear-cut sub-samples.
For example, gathered questionnaires demonstrated that strict forwarders and diver-sified businesses both employ the same or similar software. Also, almost all respondents wrote they are daily in contact with customs’ officials. They predominantly mentioned the exact same means for gathering information on changes in procedures and regulati-ons. These include the official Customs’ Gazette, the Customs Directorate web site and personal contacts.
So, considering that the run statistical tests could not show statistically significant differences between sub-samples, we were led to disregard hypotheses H2 and H3. Even though we expected respondents to react to our questions differently depending on their
16 The two firms that differ from the general opinion belong one to each subgroup. Their common features are that both are small firms, both express the highest level of agreement with the statement that personal contact is impor-tant for efficiently performing custom procedures and both (however, here, they are not alone in this opinion) expect that they will be worse off after Croatia enters the EU.

42
M. Kaštelan-Mrak and A. Benazić: Perceived effects of Croatian Customs Services Reform: the Opinionof Forwarders from Istarska CountyFinancial Theory and Practice 33 (1) 25-47 (2009)
size, business line, date of establishment, methods of gathering information and doing bu-siness in general, the whole sample demonstrated the same general attitudes.
Particularly, we expected that differences in opinion about the quality of service of customs officers would be caused by inevitable negative outcomes for forwarders once Croatia joins the EU. Forwarders represent a specific line of business where the size of the market and forwarders’ incomes directly relate to complicated customs procedures. Con-trary to our expectations, there were no significant differences in the opinion of respon-dents when it comes to evaluating the quality of service and reform outcomes. Not even the negative business perspectives facing forwarders and the expected decline in busine-ss activity affected the generally positive opinions.
6 Conclusion
Even though quality has long been recognized as an important phenomenon, ques-tions referring to the models of observing/measuring quality and the ways of providing/
Table 7 Comparisons of strict forwarders and business with forwarding as a secondary activity
Variable Kolmogorov-Smirnov Testa
Max. Neg. Difference
Max. Pos. Difference
p-level Mean m
Mean s
Standard deviation m
Standard deviation
s
Valid number
m
Valid number
s
Gen. improvement -0.133333 0.066667 p>0.10 2.000000 2.133333 1.069045 1.245946 15 15
Processing time -0.133333 0.000000 p>0.10 1.733333 1.933333 1.099784 1.162919 15 15
Simpler procedures -0.066667 0.066667 p>0.10 2.133333 2.133333 1.060099 1.125463 15 15
Changes too often -0.066667 0.152381 p>0.10 2.000000 1.800000 0.784465 0.861892 14 15
Adequate info -0.161905 0.090476 p>0.10 3.428571 3.600000 1.398586 1.183216 14 15
Officers know -0.066667 0.066667 p>0.10 2.333333 2.466667 1.175139 1.187234 15 15
Officers time -0.200000 0.000000 p>0.10 2.200000 2.866667 1.146423 1.245946 15 15
Responsive -0.061905 0.238095 p>0.10 2.571429 2.400000 1.016350 1.055597 14 15
Public interest 0.000000 0.200000 p>0.10 2.266667 1.866667 1.162919 0.915475 15 15
Adequate equipment -0.071429 0.214286 p>0.10 2.785714 2.357143 1.188313 1.446861 14 14
Investment lags 0.000000 0.142857 p>0.10 3.285714 3.071429 1.069045 1.141139 14 14
E-service -0.266667 0.095238 p>0.10 1.571429 2.000000 0.755929 1.603567 14 15
EU customs better -0.087912 0.115385 p>0.10 2.692308 2.500000 1.250641 0.940540 13 14
s – strict forwarders; m – multiple lines of businessBy variable: type of business Marked tests are significant at p < 0.05000
Source: Computed using Statistika

43
M. Kaštelan-Mrak and A. Benazić: Perceived effects of Croatian Customs Services Reform: the Opinionof Forwarders from Istarska County
Financial Theory and Practice 33 (1) 25-47 (2009)
developing quality continue to intrigue practitioners and researchers. In the case of pub-lic sector reforms, improved quality is a common goal sought by fund providers, proj-ect managers, reform proponents, service users and researchers. The primary purpose of this paper is to provide some preliminary understanding of the phenomenon of running reforms and organizational changes in the public sector and the adequate metrics for es-tablishing reform results.
In the case of the recent reform of the Croatian Customs System, available documenta-tion demonstrates that much effort and many resources have been dedicated to improving customs services. However, we found no report, or research, that would establish how the business sector was affected by these investments. Wondering about the results achieved by such investments, we tried to run an external evaluation of the reform.
Having no insight into the extent of internal measures of reform results applied by the Customs Directorate, our attention was concentrated on a relatively simple reform outcome – “customer” satisfaction. We targeted the research towards freight forwarders, a category of service users that, to our opinion, would have already been able to gather enough personal experience and form reliable opinions.
A 19-item Likert questionnaire was administered. Conclusions were drawn by basic statistic analysis combined with descriptive data on each respondent. Some questions re-lated to the respondents’ perception of changes in the quality of customs services during the past 3-4 years, which in fact corresponds to the period in which the Reform was car-ried out. Data was also collected on items that might indicate perception of relative quali-ty of two important factors in each reform: the human factor and the technical factor, two factors that, in our opinion, contributed towards the result of any reform.
On the basis of the research, it can be concluded that the general opinion of forwar-ders on the overall results of the reform of the Croatian Customs System is favorable. However, specific dimensions of achieved improvement did show different ratings. Im-provements in processing time (procedures last shorter) received the highest ranking and can, therefore, be considered the most pronounced benefit of the reform. Being an easi-ly observable value to service users, it surely contributed significantly to the overall per-ception of the success of the reform. An additional important implication of this particu-lar finding, important for the evaluation of the quality achieved in managing the reform process, is that the organizational skills and the process design applied in running the re-form were successful. Perception of improvements in other aspects of the customs ser-vices mainly served to confirm the general opinion. The worst rank among all items was obtained for the statement concerning the quality of the process of disseminating infor-mation. This item, combined with the item related to the fast rate of change, were the po-ints of highest discontent.
Even though this research may shed some light on public sector reforms in Croa-tia in the past decade, generalizations referring to public sector reforms in general would not be reliable. First of all, the study only dealt with customs services, not other forms of public services and secondly, the questionnaire was run on a rather small and regionally oriented sample.

44
M. Kaštelan-Mrak and A. Benazić: Perceived effects of Croatian Customs Services Reform: the Opinionof Forwarders from Istarska CountyFinancial Theory and Practice 33 (1) 25-47 (2009)
There are two points that came to our attention during the research that deserve fur-ther investigation.
• Our analysis seems to suggest that reforms in the public sector can work out and be perceived as successful even in situations when changes result in the worsening of general business conditions of those influenced
At the outset of the research, we had some fears that generally worsening business conditions could distort the perception of forwarders. This concern led us to include se-veral additional items in the main questionnaire and a set of descriptive variables. We expected that respondents’ specific factors such as size, scope of activities, increasing or decreasing business activity, technology and processes employed would result in stati-stically different opinions on the quality of customs’ services. The fact that we achieved a response rate above our expectations confirms that freight forwarders, as a directly af-fected group of stakeholders, showed not only interest in our research, but also and more important, satisfaction with reform results. Even though the business of forwarders, as a group, will be negatively affected once Croatia joins the European Union, they express favorable opinions concerning the results obtained through the Reform. We noticed no considerable differences between strict forwarders and diversified businesses, which con-firms us in this finding. Presuming that the more diversified businesses would have an easier time adjusting to new circumstances, we expected rather different opinions com-pared to those of strict forwarders. Even though more than half of the number of strict forwarders explicitly said that once Croatia joins the EU, they will undergo a drop in rev-enues and employment, and some will even go out of business, their opinion of the Re-form results seems very favorable.
• Our study indicated that the technical factor contributing to service quality recei-ved slightly less favorable opinions than the human factor.
Reforms are usually run with high levels of attention being dedicated to the human factor. Education, motivation and other investments dedicated to improving the ‘human side’ surely produce a positive impact on reform results. In the case of the customs servi-ces, the opinions of respondents that refer the improvement of the human factor (compe-tence, responsiveness...) leave no reason for dissatisfaction. However, it is possible that less attention has been dedicated to the technical side of the Reform. When it comes to opinions concerning information technology upgrades and satisfaction with the process of disseminating information, the collected answers become more dispersed and show a tendency towards lower levels of satisfaction. This indicated that, as a group, forwarders are sensitive to technical and process-design issues. A higher awareness of the importan-ce of Reform managers on the importance of prompt communication of changes (impro-vements) on technical issues might work as an efficient, and yet not a too costly, way to improve service users’ perception of Reform benefits.

45
M. Kaštelan-Mrak and A. Benazić: Perceived effects of Croatian Customs Services Reform: the Opinionof Forwarders from Istarska County
Financial Theory and Practice 33 (1) 25-47 (2009)A
nnex
1.
Spea
rman
Ran
k Ord
er Co
rrelat
ionsa
gen
shor
ter
sim
pler
chan
gein
foac
adem
ykn
owtim
ere
spon
sepu
blic
pers
onal
equi
pIn
v la
gIC
Tfo
rwar
der
EU
bett
erin
t ctr
expo
rtim
port
gen
0.45
7201
0.70
7166
0.09
9286
0.44
6887
0.05
2376
0.73
1894
0.71
1590
0.54
1936
0.58
8707
0.04
6477
0.63
6559
-0.15
8888
0.33
0924
0.10
0686
0.03
3363
0.75
4922
-0.18
8760
0.33
7943
shor
ter 0.
4572
01 0.
6931
21 0.
2573
45 0.
2630
30 0.
0230
88 0.
4177
24 0.
4821
97 0.
2988
43 0.
2293
58 0.
1988
30 0.
2405
83-0.
1407
58-0.
1678
56-0.
0113
20 0.
2630
90 0.
3760
82-0.
3738
72 0.
1890
65
simple
r 0.
7071
66 0.
6931
21 0.
1164
04 0.
5063
83 0.
0670
59 0.
6356
35 0.
6396
43 0.
6228
04 0.
4288
83 0.
0004
95 0.
5374
63-0.
0749
02 0.
0341
46 0.
0347
06 0.
0558
03 0.
6391
27-0.
1734
82 0.
3342
96
chan
ge
0.09
9286
0.25
7345
0.11
6404
0.43
6325
-0.16
6298
0.03
4731
0.21
0225
-0.04
1609
0.04
2840
0.16
1825
-0.06
0438
-0.07
2973
-0.34
0140
0.33
6414
0.00
1525
0.16
3383
-0.02
3188
-0.06
1813
info
0.44
6887
0.26
3030
0.50
6383
0.43
6325
-0.02
9978
0.29
5149
0.36
5155
0.31
4822
0.21
2706
0.13
2371
0.48
6041
-0.04
3019
0.01
6131
0.10
3014
-0.02
9769
0.44
8815
-0.07
4531
0.11
5186
acad
0.05
2376
0.02
3088
0.06
7059
-0.16
6298
-0.02
9978
0.14
1448
0.10
6103
0.38
1126
-0.16
1984
0.08
7695
0.12
5921
0.05
4729
0.26
6610
0.11
8066
-0.46
4524
0.01
8691
0.05
5038
-0.03
9320
know
0.73
1894
0.41
7724
0.63
5635
0.03
4731
0.29
5149
0.14
1448
0.88
1127
0.69
1059
0.71
6409
0.12
8589
0.40
0031
-0.42
3407
0.21
7717
0.16
4853
0.01
1028
0.66
8583
-0.21
3739
0.09
6245
time
0.71
1590
0.48
2197
0.63
9643
0.21
0225
0.36
5155
0.10
6103
0.88
1127
0.60
3436
0.54
1757
0.04
7567
0.33
3296
-0.27
0254
0.15
2721
0.14
0778
0.02
4715
0.71
6400
-0.06
0961
0.09
4148
respo
n 0.
5419
36 0.
2988
43 0.
6228
04-0.
0416
09 0.
3148
22 0.
3811
26 0.
6910
59 0.
6034
36 0.
3851
60 0.
0565
39 0.
2814
07-0.
3854
31 0.
1834
76 0.
2303
50-0.
3186
47 0.
4705
06-0.
1663
14-0.
0345
39
publi
c 0.
5887
07 0.
2293
58 0.
4288
83 0.
0428
40 0.
2127
06-0.
1619
84 0.
7164
09 0.
5417
57 0.
3851
60 0.
0593
73 0.
2616
72-0.
1945
66 0.
0205
90-0.
1320
21 0.
0560
22 0.
4317
37-0.
0128
90 0.
1174
26
pers
0.04
6477
0.19
8830
0.00
0495
0.16
1825
0.13
2371
0.08
7695
0.12
8589
0.04
7567
0.05
6539
0.05
9373
-0.21
6975
-0.24
0561
-0.15
1985
-0.02
9799
0.08
1148
-0.01
1553
-0.19
2282
-0.39
7819
equip
0.63
6559
0.24
0583
0.53
7463
-0.06
0438
0.48
6041
0.12
5921
0.40
0031
0.33
3296
0.28
1407
0.26
1672
-0.21
6975
0.16
8392
0.42
1995
-0.12
1422
-0.11
6053
0.54
8977
-0.10
8911
0.38
2976
inv la
g-0.
1588
88-0.
1407
58-0.
0749
02-0.
0729
73-0.
0430
19 0.
0547
29-0.
4234
07-0.
2702
54-0.
3854
31-0.
1945
66-0.
2405
61 0.
1683
92 0.
1127
09-0.
2989
59-0.
0235
59-0.
0947
31 0.
2210
15 0.
0222
93
ICT
0.33
0924
-0.16
7856
0.03
4146
-0.34
0140
0.01
6131
0.26
6610
0.21
7717
0.15
2721
0.18
3476
0.02
0590
-0.15
1985
0.42
1995
0.11
2709
0.27
1366
-0.13
4588
0.01
1727
-0.00
5033
0.32
4752
forw
0.10
0686
-0.01
1320
0.03
4706
0.33
6414
0.10
3014
0.11
8066
0.16
4853
0.14
0778
0.23
0350
-0.13
2021
-0.02
9799
-0.12
1422
-0.29
8959
0.27
1366
0.11
5440
0.03
2071
-0.29
1017
-0.03
6768
EUbe
tt 0.
0333
63 0.
2630
90 0.
0558
030.0
0152
5-0.
0297
69-0.
4645
24 0.
0110
28 0.
0247
15-0.
3186
47 0.
0560
22 0.
0811
48-0.
1160
53-0.
0235
59-0.
1345
88 0.
1154
40-0.
1394
09-0.
1600
67 0.
0600
38
int ct
r 0.
7549
22 0.
3760
82 0.
6391
27 0.
1633
83 0.
4488
15 0.
0186
91 0.
6685
83 0.
7164
00 0.
4705
06 0.
4317
37-0.
0115
53 0.
5489
77-0.
0947
31 0.
0117
27 0.
0320
71-0.
1394
09-0.
1703
97 0.
1589
25
expo
rt-0.
1887
60-0.
3738
72-0.
1734
82-0.
0231
88-0.
0745
31 0.
0550
38-0.
2137
39-0.
0609
61-0.
1663
14-0.
0128
90-0.
1922
82-0.
1089
11 0.
2210
15-0.
0050
33-0.
2910
17-0.
1600
67-0.
1703
97-0.
0312
57
impo
rt 0.
3379
43 0.
1890
65 0.
3342
96-0.
0618
13 0.
1151
86-0.
0393
20 0.
0962
45 0.
0941
48-0.
0345
39 0.
1174
26-0.
3978
19 0.
3829
76 0.
0222
93 0.
3247
52-0.
0367
68 0.
0600
38 0.
1589
25-0.
0312
57
a Mar
ked
corr
elat
ions
are
sign
ifica
nt a
t p <
.050
00So
urce
: aut
hors
’ cal
cula
tion
46
M. Kaštelan-Mrak and A. Benazić: Perceived effects of Croatian Customs Services Reform: the Opinionof Forwarders from Istarska CountyFinancial Theory and Practice 33 (1) 25-47 (2009)
LITERATURE
---, 2005. UN World Public Sector Report 2005. Unlocking the Human Potential for Public Service Performance. Public Sector Performance, Prestige and Promotion (back-ground paper) [online]. Available from: [http://unpan1.un.org/intradoc/groups/public/do-cuments/UN/UNPAN021631.pdf].
---, 2007a. Measuring Quality as Part of Public Service Output UK Centre for the Measurement of Government Activity [online]. Available from: [http://www.statistics.gov.uk/articles/nojournal/UKCeMGA_Strategy_Paper.pdf].
---, 2007b. Guidelines for Integrated Border Management in the Western Balkans. CARDS 2001–IBM [online]. Final version. Available from: [http://ec.europa.eu/enlarge-ment/pdf/financial_assistance/cards/publications/ibm_guidelines_en.pdf].
---, 2008. Strategija reforme državne uprave za razdoblje 2008-2011 [online]. Do-stupno na: [http://www.uprava.hr/strat-hr.pdf].
Albaum, G., 1997. “The Likert scale revisited: an alternate version (product preferen-ce testing)” [online]. Journal of the Market Research Society, 39 (2), 331. Available from: [http://business.nmsu.edu/~mhyman/M610_Articles/Albaum_JMRS_1997.pdf].
Begović, D., 2007. CARDS 2004 ITMS PROJEKT. Prezentacija u Carinskom centru za obuku (23.10.2007.).
Brady, M. K. [et al.], 2002. “Performance-only measurement of service quality: a replication and extension” [available]. Journal of Business Research, 55 (1), 17-31. Avai-lable from: [http://www.sciencedirect.com/science/article/B6V7S-44GR1XW-2/2/03234e56389c1fca0d32b75f4317d405].
Brady, M. K. and Cronin, J. Jr, 2001. “Some New Thoughts on Conceptualizing Perceived Service Quality: A Hierarchical Approach”. Journal of Marketing, 65 (July), 34-49.
Bryer, T. A., 2006. “Toward a Relevant Agenda for a Responsive Public Administra-tion” [online]. Journal of Public Administration Research and Theory, 17 (3), 479-500. Available from: [http://jpart.oxfordjournals.org/cgi/content/abstract/17/3/479?etoc].
Cuthbert, P. F., 1996. “Managing Service Quality in HE: is SERQUAL the answer? Part 2” [online]. Managing Service Quality, 6 (3), 31-35. Available from: [http://emeral-dinsight.com/Insight/ac_FullTextOptions.do;jsessionid=05DDD4954BB57B1EEF7932789F2D214E?contentId=1204123&contentType=Review].
Gaither, N., 1992. Production and Operations Management. New York: The Dry-den Press.
HGK, 2007. Gospodarski profil Istarske županije u 2006. godini. Pula: Hrvatska gos-podarska komora, Županijska komora Pula.
Hill, T., 2000. Operations Management; Strategic Context and Managerial Analysis. Houndmills, Basingstoke and New York: Palgrave.
Kueng, P. and Wettstein. T., 1999. “Measuring Customer Satisfaction using IT: A Case Study” [online]. Available from: [http://www.peterk.ch/Kueng_Wettstein_1999.pdf].

47
M. Kaštelan-Mrak and A. Benazić: Perceived effects of Croatian Customs Services Reform: the Opinionof Forwarders from Istarska County
Financial Theory and Practice 33 (1) 25-47 (2009)
Odluka o objavi Sporazuma o financiranju CARDS 2003 za Hrvatsku, NN Međuna-rodni ugovori 5/2004. Zagreb: Narodne novine.
Parasuraman, A., Zeihaml, A. and Berry, L., 1985. “A Conceptual Model of Ser-vice Quality and its Implications for Future Research” [online]. Journal of Marketing, 49 (3), 41-50. Available from: [http://www.farrellassociates.com.au/Papers/Conceptual%20Model%20of%20Service%20Quality.pdf].
Schroeder, R. G., 1999. Upravljanje proizvodnjom: odlučivanje u funkciji proizvod-nje. Zagreb: MATE.
Shahin, A., 2004. “SERVQUAL and Model of Service Gaps: A Framework for De-termining and Prioritizing Critical Factors in Delivering Quality Services” [online]. Avai-lable from: [http://www.qmconf.com/Docs/0077.pdf].
Vlada RH, 2006. Akcijski plan za integrirano upravljanje granicom Republike Hr-vatske. Zagreb: Vlada Republike Hrvatske.
Yang, K. and Holzer, M., 2006. “The Performance-Trust Link: Implications for Per-formance Measurement” [online]. Public Administration Review, 66 (1), 114-126. Available from: [http://www.blackwell-synergy.com/doi/pdf/10.1111/j.1540-6210.2006.00560.x].