the performance of socially responsible ...summit.sfu.ca/system/files/iritems1/17822/burrell, b...
TRANSCRIPT

THE PERFORMANCE OF SOCIALLY RESPONSIBLE MUTUAL FUNDS
by
Brandon Burrell
Bachelor of Business Administration
Simon Fraser University, 2016
and
Earendil Gutierrez
Bachelor of Commerce and International Business
La Salle University, 2013
PROJECT SUBMITTED IN PARTIAL FULFILLMENT OF
THE REQUIREMENTS FOR THE DEGREE OF
MASTER OF SCIENCE IN FINANCE
In the Master of Science in Finance Program
of the Faculty of
Business Administration
© Brandon Burrell and Earendil Gutierrez
SIMON FRASER UNIVERSITY
Fall 2017
All rights reserved. However, in accordance with the Copyright Act of Canada, this work
may be reproduced, without authorization, under the conditions for Fair Dealing.
Therefore, limited reproduction of this work for the purposes of private study, research,
criticism, review and news reporting is likely to be in accordance with the law,
particularly if cited appropriately.

ii
Approval
Name: Brandon Burrell and Earendil Gutierrez
Degree: Master of Science in Finance
Title of Project: The Performance of Socially Responsible Mutual Funds.
Supervisory Committee:
___________________________________________
Peter Klein
Senior Supervisor
Academic Director, PhD Program
Professor, Finance
___________________________________________
Victor Song
Second Reader
Lecturer, Finance
Date Approved: ___________________________________________

iii
Abstract
Socially responsible investing (SRI) is a growing practice in the investment
management industry which seeks to incorporate environmental, social and corporate
governance factors into the investment decision-making process. Arguments have been
made for and against it, and previous research has sought to answer the question of
whether funds of this type outperform their conventional counterparts.
This study explores the performances of both types of funds on a before-fee basis
and analyzes the impact fees have. We show that in the US from 1997-2017, SRI mutual
funds after fees significantly underperform conventional funds after adjusting for market
risk. Accounting for four risk factors, however, we find no significant difference in
performance. Further, we find no significant difference in fees for the period. Analyzing
the two 10-year subperiods of our test period, we find that SRI funds likely improve over
the sample period and the performance of conventional funds likely deteriorates on a
relative basis.
Keywords: socially responsible investment; mutual fund performance; management
expense ratio; mutual fund load; risk adjusted alpha

iv
Acknowledgements
We would like to thank Dr. Peter Klein, first and foremost, for his valuable
guidance and reassurance as we worked to complete this project. We also appreciate the
time and effort of Victor Song, who reviewed our project and gave insightful feedback.
We would also like to show sincere gratitude to our professors in the Master of Science in
Finance program at SFU. Much of the instruction they gave us went into this project and
much more, we know, will be used for years to come in our professional careers.
Finally, we want to thank our friends and our family, for being the foundation
from which we build our lives.

v
Table of Contents
Approval .......................................................................................................................................... ii
Abstract .......................................................................................................................................... iii
Acknowledgements ......................................................................................................................... iv
Table of Contents ............................................................................................................................. v
List of Figures ................................................................................................................................. vi
List of Tables ................................................................................................................................. vii
1: Introduction ................................................................................................................................ 1
2: Literature Review ...................................................................................................................... 4
3: Data ............................................................................................................................................. 7
3.1 Mutual Funds and Fees ........................................................................................................... 7
3.2 Sample Selection ..................................................................................................................... 8
3.3 Example of SRI Fund from Sample ...................................................................................... 11
4: Estimation of Risk-Adjusted Returns .................................................................................... 13
5: Performance Differences Between SRI and Conventional Funds ....................................... 15
5.1 Before-fee Performance ........................................................................................................ 15
5.2 Comparison of Fees ............................................................................................................... 16
5.3 After-fee Performance ........................................................................................................... 18
5.4 Significance of Differences in Performance.......................................................................... 19
5.5 Robustness Checks ................................................................................................................ 22
6: Conclusion ................................................................................................................................. 24
Appendix: Means of Regression Results .................................................................................... 26
Bibliography.................................................................................................................................. 27
Works Cited .................................................................................................................................... 27
Websites Reviewed ........................................................................................................................ 28

vi
List of Figures
FIGURE 1: SRI Monthly Net Returns ........................................................................................... 20
FIGURE 2: Conv Monthly Net Returns ......................................................................................... 20
FIGURE 3: SRI 1-Factor Alphas ................................................................................................... 21
FIGURE 4: Conventional 1-Factor Alphas .................................................................................... 21
FIGURE 5: SRI 4-Factor Alphas ................................................................................................... 21
FIGURE 6: Conv 4-Factor Alphas ................................................................................................. 21

vii
List of Tables
TABLE I: Number and Total Net Assets of SRI and Conventional Funds ...................................... 9
TABLE II: Descriptive Statistics .................................................................................................... 10
TABLE III: SRI Fund Sample ........................................................................................................ 12
TABLE IV: Before-Fee Performance ............................................................................................ 15
TABLE V: Comparison of Fees ..................................................................................................... 17
TABLE VI: Fees and After-fee Performance ................................................................................. 18
TABLE VII: Differences in Performance and Their Significance ................................................. 22
TABLE VIII: Annualized Net Alpha for Subperiods ..................................................................... 23

1
1: Introduction
According to the Sustainable Investment Forum (SIF), sustainable, responsible
and impact investing (SRI) or also called socially responsible investing, is the practice of
investing taking into consideration environmental, social and governance (ESG) criteria,
that aims at generating financial utility as well as a positive impact for society (2017).
Objectives of such investment strategies have been long discussed since their inception as
a popularized strategy in the 1980’s. This type of investment has evolved during the last
30 years, starting as an approach that focused on negative (exclusionary) screening,
which filtered out stocks according to activities or industries, or based on poor
performances in aspects such as labour conditions or environmental impact.
The SRI concept has evolved since then, making it a more inclusive tool, and as
such, it emphasizes the selection of stocks that rank above average in factors including
environmental friendliness, management team compensation and workforce treatment.
Modern SRI provides investors with a holistic approach that considers ESG factors aimed
at providing long-term returns and increased positive impact on our societies. The market
for SRI has also growth significantly, and accounts for $8.2 trillion (or one out of five)
dollars of professionally managed money in the United States (SIF, 2017).
The topic of performance of SRI funds has been previously discussed by many
authors, often around the question of whether investors should expect less returns for
their investments when they derive utility from non-financial factors such as peace of
mind, consciousness or integrity by investing in SRI funds. Proponents of sustainable
responsible and impact investing maintain that investing in stocks or funds with these
characteristics adds financial value to the portfolio in two ways. First, by limiting the

2
downside potential arising from litigation costs, fines or compensations, making them
more resilient to market shocks (Nofsinger and Varma, 2014). This robustness comes as
result of the chosen operations, corporate structure and integration of enterprise risk
management that earned companies their SRI label. Second, by generating long term
value through the generation of sustainable practices and goodwill within the
communities they operate in.
Conversely, detractors of SRI investments could argue that the nature of the funds
is a limiting factor, particularly in the context of modern portfolio theory. The reduced
investment universe that SRI funds select from, it would claim, inherently results in an
inability of these funds to perform above their conventional counterparts (Markowitz,
1952).
In this paper we make a comparison in the performance of SRI and conventional
mutual funds in the US from 1997-2017. As the market capitalization of SRI funds grows
faster than conventional funds, we seek to determine if investors today should follow the
trend and invest in SRI products on strictly financial terms. We make our comparison on
the basis of Jensen’s alpha as well as the alpha utilizing Carhart’s (1997) four-factor
model, which extends the Fama and French (1993) three-factor model by adding in a
momentum factor. We also compare fees directly across the two fund types and utilize
the total ownership cost (TOC) measure developed by Sirri and Tufano (1998) to extend
the comparison. With this, we compare both the before- and after-fee risk-adjusted
performance of SRI and conventional mutual funds. This study aims to expand the time
period covered by Gil-Bazo, Ruiz-Verdú, and Santos (2010) by utilizing a similar

3
process, to determine if the performance of SRI funds in the United States is above or
below that of traditional funds in a period extending into 2017.
This paper is limited in several key ways. First, our analysis was done with
limited access to SRI mutual funds meeting our criteria. Within the subset of 85 SRI
funds, only 26 of these had reported information for front end loads, for example, and our
comparison of total ownership cost had to be done with this small sample. Second, our
estimation of betas for the one- and four-factor alpha calculations was done once for each
fund. An extension of this work could calculate betas for each fund for each month so
that the conclusions are based on more recent, relevant data. Lastly, our performance
comparison is done between the two broad classes, SRI and conventional. The
comparison could be done at a more precise level by matching SRI funds to conventional
funds that are more similar across a number of variables. These variables could include
size, age, and other potential factors.
In section 2: Literature Review, previous literature on the topic of performance of
SRI funds and related topics are discussed, with a focus on studies done in the United
States. Section 3: Data, elaborates on the process of data selection, treatment and
validation. In section 4: Estimation of Risk-Adjusted Returns, we discuss the chosen
methodology to conduct the study of the funds’ performances and present our results in
section 5: Performance Differences Between SRI and Conventional Funds, along with a
comparative discussion and robustness check for our work. We conclude in section 6:
Conclusion, by summarizing our findings and outlining key considerations appropriate
for further research.

4
2: Literature Review
Early studies regarding the performance of SRI funds, both in isolation and
compared with the traditional mutual funds are inconclusive at best, and generally shows
that there are no statistical differences. Hamilton, Jo, and Statman (1993) find a less
negative performance of 17 SRI funds against their non-SRI counterparts, but these
differences are insignificant. Statman (2000) finds that the performance of the Domini
Social Index, which is constructed based on exclusionary and qualitative screening, was
better than that of the S&P 500 index during the 1990 to 1998 period, both in raw and
risk-adjusted returns. Although this difference was not statistically significant. On the
other hand, Geczy, Stambaugh, and Levin (2006) find that investors in the SRI space pay
higher diversification costs than traditional investors due to imposition of SRI constraints,
and find that this cost is contingent on investors beliefs of asset pricing models and
efficient markets. They find an investor that seeks alpha based on the CAPM market-risk
model earns 5 basis points over the market, and this increases to 30 basis points if
investors were to shift their decision-making to models like Fama-French’s (1993) three
factor model and Carhart’s (1997) four factor model.
Following the growth of the SRI investing, a solution for the performance-to-
ethics investing puzzle remains non-definite, but Renneboog, Ter Horst, and Zhang
(2008) provide some key considerations for the ongoing discussion of the matter. Mainly,
they discuss that the debate of SRI finds its roots in the theoretical trade-off between
maximization of shareholder value and alignment with general stakeholder value
criterion. Also, they discuss how SRI investors behave differently from conventional
investors and are less concerned with recent, past performance. They then differentiate

5
between performance of funds employing positive screening with funds employing
negative screening, and conclude performance is superior for positive screening funds
(Renneboog et al., 2008).
Several studies have been conducted using Jensen’s alpha or Carhart’s (1997)
four-factor alpha as a measure of risk adjusted performance. Statman (2000) uses
Jensen’s alpha and finds that from 1990-1998 SRI funds have higher, but barely
significant, risk-adjusted returns. Bauer et al. (2005), Renneboog et al. (2008) and Gil-
Bazo et al. (2010) all use a four-factor model. Bauer, Koedijk, and Otten (2005) find no
significant difference in performance for funds matched on both age and size from 1990-
2001. Renneboog et al. (2008) find no significant difference in their adjusted
performance from 1991-2003, but SRI funds significantly underperform conventional
funds in the 1991-1995 subperiod.
In their 2010 paper, Gil-Bazo et al. argue that SRI funds managed by firms
specialized in socially responsible investing outperform conventional funds of similar
characteristics on a before-and-after-fee basis in the period 1997-2005. Additionally, they
find that the outperformance is driven by SRI specialized firms, while SRI funds offered
by non-specialized firms underperform their conventional fund equivalents. Further, they
find that while there is no significant difference between fees for SRI funds and
conventional funds, there is a significant difference between fees of SRI and conventional
funds offered by the same firm.
The difference in fees between SRI and conventional mutual funds has received
much less attention in the literature. When it is mentioned in papers, the average expense
ratios do not differ significantly (Bauer et al., 2005; Benson et al., 2006; Gil-Bazo et al.,

6
2010; Renneboog et al., 2008), with the exception of Benson and Humphrey (2008) who
found, with significance, that the median expense ratio is higher for conventional mutual
funds.
As the market for SRI has seen rapid growth, it is likely that many factors of this
type of investment have changed. These include size and turnover of funds, the fees
charged, and both the before- and after-fee performance realized by SRI funds. This
makes it more important to have recent data, as relevance of data may be more quickly
lost with time. Our paper extends the testing period of SRI funds right up until June 2017.
Further, in testing robustness, we roughly compare the decade prior to the 2008 financial
crises to the decade since. While the event did not directly pertain to socially responsible
investing, it did cause many investors to look more closely into their investments and
rethink their objectives and constraints.

7
3: Data
3.1 Mutual Funds and Fees
Mutual funds come in many varieties. Funds can be composed of equities, fixed
income, or a combination of the two. They may also contain alternative investment
securities. Mutual funds can be constructed to track a particular market or replicate an
index, representing passive investments, or can be actively managed in accordance with
an established set of goals and guidelines. Further, mutual funds can restrict investments
to a particular sector or be more generally diverse and invest based on style or market
capitalization guidelines in order to meet varying investor needs.
The fees for mutual funds are in the form of expenses and loads. Expenses are
charged as a percentage of net asset value (NAV), known as the expense ratio, and this is
charged on an ongoing basis. Loads are charges as a percentage of NAV at either time of
purchase or sale. Front end loads are charged at time of purchase, whereas back end loads
are charged at time of sale, and often at a decreasing rate the longer the fund is held.
While all funds charge an expense ratio to cover management and operating expenses,
funds can opt to set maximum loads to be charged or have no load at all. Often, different
classes of the same fund will vary only by the loads that are charged. For example, Class
A shares could have no loads, while Class B shares would offer mutual fund brokers the
opportunity to charge a front-end load and a back-end load as well.
To approximate the expenses of the funds, we use the total ownership cost (TOC)
measure developed by Sirri and Tufano (1998). The measure assumes a holding period of
7 years, and so the lifetime load cost divided by 7 is added to the annual expense ratio.
This is shown in the formula:

8
TOC = lifetime load/7 + expense ratio
Because TOC assumes a 7-year holding period, back-end loads (BEL) become
irrelevant to the measure in our study. In our test period, no SRI funds have a BEL that
applies for longer than 6 years, and only 7 funds from the entire sample of conventional
funds, or less than 0.1%, have a BEL that applies for more than 7 years. To be precise,
there are 7 funds with a BEL that applies for 8 full years, each charging a maximum of
1% in the eighth year.
3.2 Sample Selection
Funds and fund data were collected from the CRSP Survivor Bias Free US
Mutual Fund Database. Our study looks at retail, equity, US domestic, diversified mutual
funds in the 20-year period from June 1997 – June 2017. Monthly returns and total net
asset data as well as all other required data in yearly intervals was downloaded from the
database.
Funds for the period were considered to be equity, domestic, and diversified if
they contained the CRSP Style Codes for equity (E), for domestic (D), and then for either
cap-based (C) or style (Y). Equity, domestic funds that were sector-based (S) were not
included as these funds are not diversified. CRSP Style Codes are used by the database to
classify funds, and the system is a mapping and combination of Wiesenberger, Strategic
Insight, and Lipper Objective codes which only exist for partial date ranges of the whole
database.
Next, the CRSP ETF and ETN identifier was used to identify passive and semi-
active funds. Funds that were index-based (B), pure index funds (D) or index enhanced

9
(E) were removed from the fund dataset. Funds that were also identified as index-based
by their name were eliminated.
Funds were considered to be retail if more than 50% of NAV was classified as
retail. For funds with multiple classes, a weighted average based on NAV of each class
was calculated for the fund as a whole. Institutional funds were not included in this study.
To identify SRI mutual funds from the sample, general attribute information was
retrieved from the Bloomberg Terminal. In addition, the sample was filtered based on
fund name. Funds indicating an SRI mandate from their name were manually verified
using the Bloomberg Terminal or SEC archives available online.
TABLE I: Number and Total Net Assets of SRI and Conventional Funds
SRI Funds Conventional Funds
Year Number
of Funds TNA
Mean
TNA/Fund
Number of
Funds TNA
Mean
TNA/Fund
1997 18 1725 94 1632 639,016 392
1998 20 2050 100 1900 839,514 442
1999 24 3233 136 2068 1,056,454 511
2000 27 5327 198 2221 1,291,276 581
2001 29 4011 138 2341 1,122,339 480
2002 28 3566 129 2403 985,851 410
2003 28 3899 142 2390 994,015 416
2004 27 4772 177 2351 1,252,491 533
2005 25 5201 208 2304 1,397,186 607
2006 25 5698 224 2280 1,572,701 690
2007 27 5985 220 2199 1,767,285 804
2008 32 6047 189 2155 1,419,894 659
2009 41 5222 127 2013 1,038,347 516
2010 50 6576 132 1918 1,170,341 610

10
2011 49 6948 142 1879 1,221,739 650
2012 47 6808 145 1878 1,171,884 624
2013 46 7556 166 1839 1,313,967 715
2014 44 9420 212 1858 1,479,454 796
2015 45 9078 201 1852 1,463,592 790
2016 47 7913 167 1740 1,376,557 791
2017 44 8184 185 1677 1,407,497 839
The table shows number and total net assets (TNA) of SRI and conventional funds in the
sample each year. TNA reported in millions of US dollars.
Table I above shows the number and total net assets of both types of funds by
year. Table II shows key differences between SRI and conventional funds. First, the
expense ratio is higher for SRI funds. Second, while SRI investments see lower front-end
loads, this is because fewer SRI funds have a front-end load. When comparing SRI and
conventional funds that charge a load, SRI funds have a marginally higher fee. Next, on
average conventional funds are more than 50% bigger than their SRI counterparts and are
roughly 3 years older. Turnover is substantially higher for conventional funds. Lastly,
gross returns are higher for SRI funds and even though SRI funds have higher fees, SRI
funds also see higher net returns over the sample period.
TABLE II: Descriptive Statistics
SRI Funds Conventional Funds
Mean SD Median Mean SD Median
Expense Ratio 1.85% 1.88% 1.60% 1.52% 0.82% 1.44%
FEL (all funds) 1.95% 1.37% 2.67% 2.11% 1.33% 2.88%
FEL (load funds) 2.67% 0.75% 3.00% 2.65% 0.87% 3.00%
TNA, funds 87.1 283.0 10.3 136.9 457.1 28.7
Age 14.5 11.9 13.7 17.4 9.7 17.8

11
Turnover 0.66 0.49 0.49 1.1 5.1 0.7
Gross Returns 9.00% 7.32% 9.86% 7.84% 10.56% 8.54%
Net Returns 7.15% 7.32% 8.01% 6.32% 10.56% 7.02%
The table highlights several annualized statistics for the two types of funds in the sample over
the 20-year period from June 1997 to June 2017. SD denotes standard deviation. Front end loads
are maximum front end load reported by CRSP. Loads in report do not include back end loads
(BEL) because a 7-year holding period was assumed. Within sample, no SRI fund had a BEL
applying beyond 7 years, and less than 0.1% of conventional funds had a BEL. TNA, funds is
reported in millions of US dollars. Age is reported in years. Turnover is the funds turnover ratio
which is calculated as the lesser of aggregate purchases or aggregate sales divided by average
annual TNA of fund. Gross returns are calculated as average of all monthly returns for the funds
reported by CRSP, annualized, plus the average annual expense ratio of the fund type. Net
returns are calculated simply as average of all monthly returns for the fund reported by CRSP.
The sample contains 85 SRI funds and 4044 conventional funds.
3.3 Example of SRI Fund from Sample
The table below outlines the characteristics of a fund that met the SRI screening
criteria of this paper. The randomly chosen sample fund, John Hancock ESG Large Cap
Core Fund; Class A Shares, employs their screening during the bottom-up analysis of
potential investments. Both inclusionary and exclusionary screening, as described in the
introduction, are deployed for this particular fund. On the one hand, sector-leading
qualities regarding ESG factors are sought out, while on the other, certain sectors and
practices are avoided.

12
TABLE III: SRI Fund Sample
Fund Name John Hancock ESG Large Cap Core Fund; Class A Shares
CRSP Fund No 87845
NASDAD Ticker JHJAX
Management
Company Name
John Hancock Group
SRI Screening
deployed,
according to
prospectus
• Review of ESG issues during bottom-up financial analysis
• Seeking strong or sector-leading ESG policies, performance, and
reporting
• Seeking strong awareness of industry-relevant ESG opportunities and
risks*
• Avoiding material exposure to particular sectors or practices†
• Avoiding companies with major recent or ongoing ESG controversies
* Opportunities include environmental (clean tech opportunities, climate change policies,
sustainable agriculture, water use), social (healthier products, product safety, supply chain and
human rights, worker safety), and governance (board diversity, employee relations, executive
compensation)
† Sectors and practices include companies with coal mining exposure; companies that derive
any revenue from manufacturing landmines or their components; energy companies with 10%
or more of proven reserves in the Tar Sands; energy companies that generate 10% or more of
revenues (or have the capacity to do so) from coal; companies that derive 5% or more of
revenues from: nuclear power, agricultural biotechnology or the sale of conventional, chemical
or biological weapons; companies that derive 5% or more from revenues, excluding retail,
from firearms, gaming, pornography or tobacco; companies that derive 1% or more of
revenues from nuclear weapon sales

13
4: Estimation of Risk-Adjusted Returns
Like Bauer et al. (2005), Renneboog et al. (2008) and Gil-Bazo et al (2010), we
use Carhart’s (1997) four-factor model to estimate risk adjusted alphas for SRI funds.
The four-factor equation is as follows:
rit - rft = αi + ꞵMKT-rf,i(MKTt - rft) + ꞵSMB(SMBt) + ꞵHML(HMLt) + ꞵpr1y(pr1yt) + ε
where rit is fund i’s pre-expense return for t month; rf is the risk-free rate of 1-month US
Treasury bills; αi is the 4-factor which represents the after-risk performance in the model;
MKTt is the monthly return of the market; SMBt, HMLt and pr1yt are the returns for the
portfolios which mimic the risk factors associated with size of fund, book-to-market ratio,
and returns over the previous year, respectively. The risk-free rate and four risk factors
were retrieved from Kenneth French’s (2017) online data library for the whole sample
period.
In order to calculate fund coefficients for the risk factors (betas), we base our
method off of Carhart’s (1997) two-step process. For every fund, the first 30 monthly
observations are regressed against the four risk factors to obtain betas as in the above
equation. If 30 or less monthly observations are available for a fund, it is not included in
the regression and alpha analysis. Next, for the 31st month until the end of the fund, the
vector of betas for each fund is multiplied by the vector of risk factors every month.
These values are subtracted from the excess return for the fund for each month to obtain
monthly alphas. Fund level, average alphas are not required. Instead, all monthly alphas
for SRI and conventional funds are summed up separately and then divided by the total
number of alphas. This risk-adjusted performance is then annualized.

14
We also calculate and compare Jensen’s alpha, estimated using the excess market
return detailed above as the single risk factor. An overall Jensen’s alpha for SRI and
conventional funds is calculated and annualized in the same way that four-factor alpha is
calculated.

15
5: Performance Differences Between SRI and Conventional
Funds
Mean risk-adjusted performance is compared between SRI and conventional
funds in this report. It would be more ideal to compare SRI funds against a control group
of the same funds where investment is not restricted based on SRI criteria. Such a control
group is, however, not readily available. Other studies have sought to match SRI funds to
conventional funds on several variables in place of such a control group (Bauer et al.,
2005; Kreander et al., 2005; Statman, 2000). To extend this report, a similar approach
could be taken and differences in performance would then be calculated first as
differences between matched pairs or groups.
5.1 Before-fee Performance
As per the method outlined in the previous section, before-fee performance was
calculated using the one- and four-factor models. Results are displayed in the table
below.
TABLE IV: Before-Fee Performance
Mean SRI Mean conventional Difference
Gross return 7.62% 7.89% -0.27%
Gross alpha, 1 factor -0.65% -0.05% -0.60%
Gross alpha, 4 factor -0.61% -0.69% 0.09%
Gross returns are calculated as average of all monthly returns for the funds reported by
CRSP, annualized, plus the average annual expense ratio of the fund type. Gross alpha, 1
factor and Gross alpha, 4-factor are calculated as average of all alphas calculated, plus the

16
average annual expense ratio of the fund type. The regressions and alpha calculations were
based on 70 SRI funds and 3762 conventional funds that had more than 30 months of data.
During the period of 1997 to 2017, gross returns were higher for conventional
funds. However, after factoring in risk, SRI underperformed in both models. While SRI
funds underperformed in gross returns by 27 basis points and in one-factor gross returns
by 60 basis points, SRI funds outperformed their conventional counterparts by 9 basis
points in four-factor alpha. However, none of these results are statistically significant.
5.2 Comparison of Fees
Mean differences on fees were calculated for the funds. For the conventional type,
only the funds which met the screening described previously and for which expense
ratios (ER) and maximum front-end load (FEL) were available were considered This
reduced the observations to 4044 from 7963 funds that met initial screening. Due to the
limited number of SRI funds and of data for SRI fees, this constraint was relaxed. Where
ER and FEL data were available for the SRI funds sample, it was used, regardless of
whether both fees were available for the same fund. This resulted in our tests using 58
SRI funds with ER data and 26 SRI funds had FEL data.
To test if the mean fees were significantly different between the two types of
funds, we used a two-tailed test for our two independent samples. We assumed unequal
variances and normal distribution, and we used a 95% confidence level. Our hypotheses
are of the form:
H0: μSRI = μConv
H1: μSRI ≠ μConv

17
The table below shows the comparative fee data obtained for both types of funds.
For expense ratios, SRI funds were 33 basis points more, although this is not statistically
significant. As discussed previously, comparisons solely based on expense ratios fail to
depict a complete picture of the costs for investors. The difference for front-end loads is -
15 basis points, meaning that conventional funds carry a higher load burden, although
this difference again is not significant at the 95% confidence level. These two
components combine in the calculation of total ownership cost (TOC), which is higher
for SRI than conventional funds by 31 basis points, but is also not statistically significant.
The finding that fees do not differ significantly between the two is in line with the
literature (Bauer et al., 2005; Benson et al., 2006; Gil-Bazo et al., 2010; Renneboog et al.,
2008).
TABLE V: Comparison of Fees
SRI
Funds
Conventional
Funds
Difference of
means SE p-value
Expense ratio
Mean 1.85% 1.52% 0.33% 0.2467% 0.1829
Observations 58 4044
SD 1.88% 0.82%
Front-end Load
Mean 1.95% 2.11% -0.15% 0.2691% 0.5745
Observations 26 4044
SD 1.37% 1.33%
TOC
Mean 2.13% 1.82% 0.31% 0.2484% 0.2160
Observations 58† 4044
SD 1.89% 0.79%

18
P-value is calculated from the two-tailed t-test of difference in means, where normality and
unequal variances are assumed. TOC is total ownership cost and was calculated using 58 data
points of expense ratios and 58† data points of front loads, of which 26 were available data
points and the remaining 32 data points were proxied using the average of the available data.
5.3 After-fee Performance
After-fee performance was calculated using the 1- and 4-factor models also used
for before-fee performance. Results are displayed in the table below. Net returns were
substantially higher for SRI funds. However, after factoring in risk, SRI underperformed
in both models. While SRI funds outperform in net returns by 83 basis points, this is not
significant. Conventional funds outperform their SRI counterparts by 1.64% during the
test period, which is significant at the 5% level. Conventional funds also outperform by
90 basis points in four-factor alpha, but this was not found to be significant. As stated in
the previous section, the differences in fees is not statistically significant. This results in
what appears to be inconsistent results between before-fee (gross) and after-fee (net)
performance. In actuality, we can only significantly state that, after accounting for market
risk alone, conventional funds outperform SRI funds by 1.64%.
TABLE VI: Fees and After-fee Performance
Mean SRI
Mean conventional Difference**
Fees
Expense ratio 1.85% 1.52% 0.33%**
Total loads 1.95% 2.11% -0.15%**
Total ownership cost 2.13% 1.82% 0.31%**

19
After-fee performance
Net return 7.15% 6.32% 0.83%**
Net alpha, 1 factor -3.22% -1.58% -1.64%**
Net alpha, 4 factors -3.12% -2.22% -0.90%**
Net returns are calculated as average of all monthly returns for the funds reported by
CRSP, annualized, with average annual expense ratio of the fund type already
incorporated. Gross alpha, 1 factor and Gross alpha, 4 factor are calculated as average of
all alphas calculated. The regressions and alpha calculations were based on 70 SRI funds
and 3762 conventional funds that had more than 30 months of data. ** denotes
significance at the 5% level.
5.4 Significance of Differences in Performance
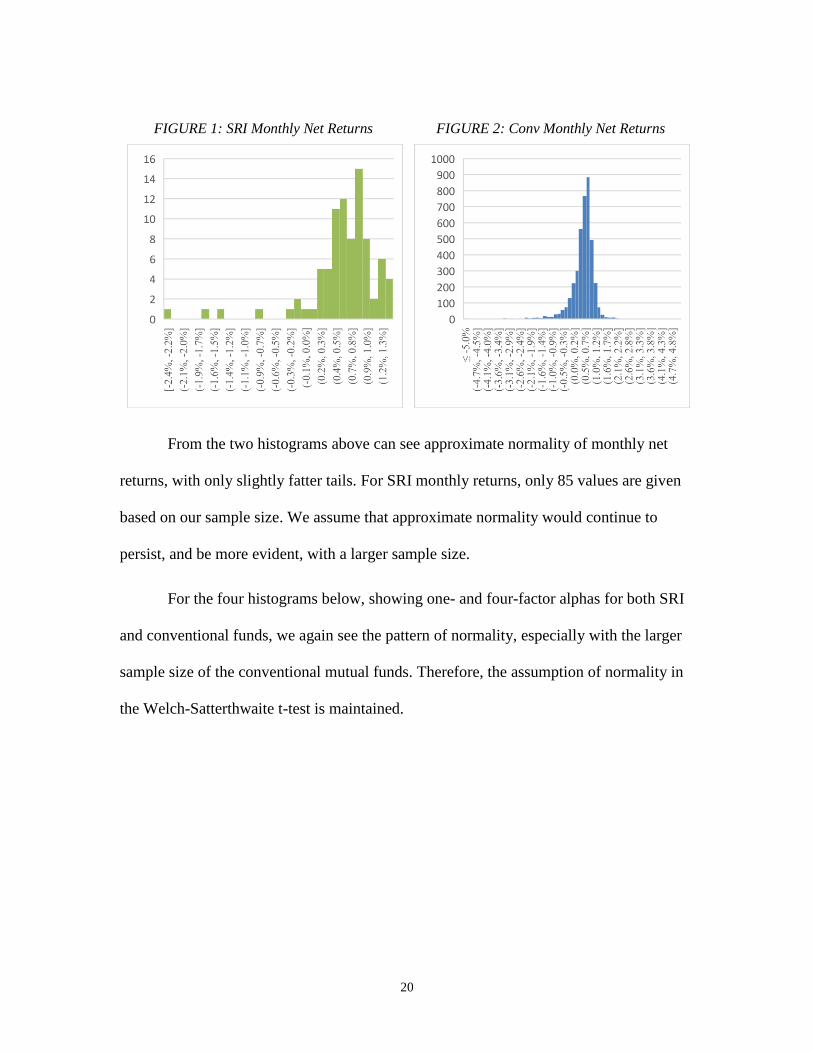
In order to measure the significance of our findings, the Welch-Satterthwaite t-test
for equal means was used. This test assumes unequal variances and normal distribution of
the two random variables. The following histograms of after-fee performance stand to
verify the assumption of normality. In all cases, underflow bins of -0.05 and overflow
bins of 0.05 were used for the sake of clarity.
20
FIGURE 1: SRI Monthly Net Returns
FIGURE 2: Conv Monthly Net Returns
From the two histograms above can see approximate normality of monthly net
returns, with only slightly fatter tails. For SRI monthly returns, only 85 values are given
based on our sample size. We assume that approximate normality would continue to
persist, and be more evident, with a larger sample size.
For the four histograms below, showing one- and four-factor alphas for both SRI
and conventional funds, we again see the pattern of normality, especially with the larger
sample size of the conventional mutual funds. Therefore, the assumption of normality in
the Welch-Satterthwaite t-test is maintained.

21
FIGURE 3: SRI One-Factor Alphas
FIGURE 4: Conventional One-Factor Alphas
FIGURE 5: SRI Four-Factor Alphas
FIGURE 6: Conv Four-Factor Alphas
From the table below, we see that based on the Welch-Satterthwaite t-test, only
the difference in one-factor net alphas is statistically significant. With a p-value of 0.0333
it is significant at the 5% level. The remaining differences are not even significant at the
10% level. Thus, we can conclusively say that, net of fees, conventional funds
outperform SRI funds from 1997 to 2017 on a market risk-adjusted basis.

22
TABLE VII: Differences in Performance and Their Significance
Difference
SE p-value
(Welch–Satterthwaite)
Before-fee performance
Gross return -0.26928% 0.80952% 0.7405
Gross alpha, 1 factor -0.60444% 0.44928% 0.1835
Gross alpha, 4 factor 0.08640% 0.41460% 0.8356
After-fee performance
Net return 0.84900% 0.80724% 0.2958
Net alpha, 1 factor -1.63884%** 0.75504% 0.0333
Net alpha, 4 factor -0.89772% 0.71364% 0.2124
** denotes significance at the 5% level.
5.5 Robustness Checks
Past research has been done over multiple periods and when subperiods are
analyzed results show inconsistencies in performance conclusions (Bauer et al., 2005;
Renneboog et al., 2008). When Gil-Bazo et al. (2010) apply the same methodology used
for the whole 1997-2005 period to the two subperiods 1997-2001 and 2002-2005, they
found varying levels of significance. From their study they found that, while conclusions
are the same, they lost statistical significance in their subperiods and could not claim that
SRI funds outperform conventional funds. This was due to a decrease in the total sample
size, per period, according to the paper (2010).
As seen in the table below, when the 20-year period is split into two equal halves,
our conclusions remain the same. However, statistical significance is lost as the sample
size of each subperiod is decreased. We also see that the outperformance of conventional
funds is mostly driven by the first subperiod, from 1997 to 2007. While conventional
funds outperform in the second half of the test period, this is to a much lesser extent. This

23
may be due to the fact that demand for SRI has seen a large increase and outgrown
conventional investments in the US over the past 15 years. More resources and skill, one
could argue, have therefore been applied to SRI.
TABLE VIII: Annualized Net Alpha for Subperiods
1997-2007 2007-2017 1997-2017
SRI 1 Factor -4.99% -2.28% -3.24%
Conv 1 Factor 0.22% -1.43% -0.61%
Difference -5.21% -0.85% -2.63%
SRI 4 Factor -5.01% -2.30% -3.27%
Conv 4 Factor -1.14% -1.57% -1.35%
Difference -3.87% -0.73% -1.92%
One- and four-factor alphas are calculated as the average of all alphas
calculated for the two fund types in their respective date range. 1997-
2007 covers the period of June 1997 to May 2007. 2007-2017 covers the
period of June 2007 to June 2017.

24
6: Conclusion
Research into the performance of socially responsible investing is of increasing
importance as today one in five dollars of professionally managed in the US is now in
SRI. Overall, research points to the conclusion that the difference in performance
between SRI funds and conventional funds is largely insignificant. Similar conclusions
have been made for the difference in fees between the two types of funds.
This study seeks to add value to the research efforts by determining whether SRI
funds perform better than conventional funds in the United States. Using the same CRSP
Survivor-Bias Free US Mutual Fund Database as Gil-Bazo et. al. (2010), we sought to
replicate and expand the period of study from 2005 to 2017.
We find no statistically significant evidence that before-fee performance for SRI
and conventional mutual funds is different over the period of 1997 to 2017. We find that
before-fee returns and adjusted for market risk alone was lower for SRI funds, but higher
for SRI funds when Carhart’s (1997) four-factor model was used. However, none of these
differences was found to be significant. Second, we arrive at the conclusion that, in line
with the literature, the fees charged by the two categories of funds is not significantly
different. Third, we conclude that there is no evidence of a statistically significant
different in after-fee performances between the two types of funds, except when market
risk is taken into account. Here, with 5% significance, SRI funds underperform their
conventional counterparts by 1.64%.
Our research ultimately finds, in line with the literature, that there is not a
statistically significant difference in the performance of both types of funds. However, as
more historical data becomes available and more widely spread about SRI funds,

25
comparison tests may become more significant. Further, more robust models for
calculating risk-adjusted returns specific to SRI funds may be developed and used to test
hypotheses of performance differences.
Aside from lack of observations and questions about the fit of models, we can
state that, at a minimum, socially responsible investing performs similarly to
conventional funds. While achieving similar results, SRI also provides further utility for
investors and a greater set of stakeholders. A natural follow up for this conclusion would
be then to attempt to approximate the differences in utility and the utility function itself
between SRI and non-SRI investors, and how this could affect demand of these types of
funds.
In addition, dividing the test period into two subperiods revealed a decrease in the
underperformance of SRI funds. While insignificant, our results showed that from 2007
to 2017, SRI funds lagged conventional funds to a smaller degree than they had in the
previous 10 years. This possibly comes as a result of more manpower and resources
applied, as well as institutional investor pressure on SRI investments. Future research
could concentrate on finding whether this reduction of underperformance is significant,
and look more closely into the factors behind it.

26
Appendix: Means of Regression Results
SRI 1-factor Conv 1-factor SRI 4-factor Conv 4-factor
Alpha -0.00175 -0.0012 -0.00223 -0.00066
Mkt-RF 0.009535 0.009512 0.009139 0.009268
SMB
0.001165 0.002056
HML
-0.00089 0.000144
Mom
0.000302 0.000139
Alpha (S.E) 0.003535 0.004356 0.00331 0.00363
Alpha (t-stat) -0.51554 -0.30408 -0.75748 -0.30621
Mkt-RF (S.E) 0.000783 0.001018 0.000858 0.000983
Mkt-RF (t-stat) 18.29187 12.22889 16.06229 12.16315
SMB (S.E)
0.001169 0.001162
SMB (t-stat)
0.325279 1.38163
HML (S.E)
0.001319 0.001544
HML (t-stat)
-0.60809 0.361959
Mom (S.E.)
0.000846 0.001021
Mom (t-stat)
-0.09163 0.051619
27
Bibliography
Works Cited
Bauer, R., Koedijk, K., and Otten, R., “Internationl evidence on ethical mutual fund performance
investment style”, Journal of Banking and Finance, Vol. 29, 2005, pp. 1751-1767Carhart,
M., “On persistence in mutual fund performance”, Journal of Finance, Vol. 52, pp.57-82
Benson, K., Brailsford , T. and Humphrey, J., “Do Socially Responsible Fund Managers Really
Invest Differently?”, Journal of Business Ethics, 65(4), 2006, pp. 337–357.
Fama, E., and French, K., “Common risk factors in the returns on stocks and bonds”, Journal of
Financial Economics, Vol. 33, 1993, pp. 3-53
Geczy, C., Stambaugh, R., and Levin, D., “Investing in socially responsible mutual funds”,
Working Paper (The Wharton School, University of Pennsylvania, 2006)
Gil-Bazo, J., Ruiz-Verdú, P., and Santos, A. “The Performance of Socially Responsible Mutual
Funds: The role of Fees and Management Companies”, Journal of Business Ethics, Vol.
94, 2010, pp. 243-263
Hamilton, S., Jo, H., and Statman, M., “Doing well while doing good? The investment
performance of socially responsible mutual funds”, Financial Analysts Journal, Vol. 56,
2000, pp. 30-39
Kreander, N., Gray, R., and Power, D., “Evaluating the Performance of Ethical and Non-Ethical
Funds: A Matched Pair Analysis, Journal of Business Finance and Accounting, Vol. 32,
2005, pp. 1465-1493
Nofsinger, J. and Varma, A. “Socially Responsible Funds and Market Crises”, Journal of Banking
and Finance, Vol. 48, 2014, pp.180-193
Renneboog, L., Ter Horst, J., and Zhang, C., “Socially responsible investments: Institutional
aspects, performance, and investor behavior”, Journal of Banking and Finance, Vol. 32,
2008, pp. 1723-1742
Statman, M., “Socially Responsible Mutual Funds”, Financial Analysts Journal, Vol. 56, 2000,
pp. 30-39

28
Renneboog, L., Ter Horst, J., and Zhang, C., “Is ethical money financially smart? Nonfinancial
attributes and money flows of socially responsible investment funds, Journal of Financial
Intermediation, Vol. 20, 2011, pp. 562-588
Websites Reviewed
John Hancock Investments. 2017. Mutual Funds. Accessed December 2017.
http://jhinvestments.com/Fund/FundResources.aspx?ProductType=MutualFund&ClassC
ode=A&CategoryID=ShowAll&TabOrder=1.
The Forum for Sustainable and Responsible Investment (SIF). 2017. Fast Facts. Accessed
November 2017. https://www.ussif.org/.
US Securities and Exchange Commission. 2017. Filings and Forms. 9 January. Accessed
November 2017. https://www.sec.gov/edgar.shtml.

29
________________________________________________