the peripheral south: demographic and political dynamism...
TRANSCRIPT
Chrestomathy: Annual Review of Undergraduate Research, School of Humanities and
Social Sciences, School of Languages, Cultures, and World Affairs, College of Charleston
Volume 6, 2007: pp. 48-71
© 2007 by the College of Charleston, Charleston SC 29424, USA.
All rights to be retained by the author.
48
The Peripheral South:Demographic and Political Dynamism and
Increasing Electoral Consequence
Sam Kakavitsas
After Democratic presidential candidates Al Gore and John Kerrywere defeated in 2000 and 2004 in every Southern state, some electoralscholars assert that prospects for future Democratic candidates in theSouth are virtually nil (Schaller 4). They also extend such bleak prospectsfor Democrats to Senate seats and House seats in non-majority African-American districts in the South (Schaller 14-5). But should the electoralbehavior of all Southern states be considered collectively? Do some South-ern states offer reasonable prospects for Democrats and the opportunityto have a highly competitive two-party system?
Overall, with its rapidly diversifying and growing population, the Southshould be viewed as a broader region encompassing two sub-regions.Distinguishing between the Deep South and the Peripheral South, andexamining these sub-regions’ electoral behavior, suggests different elec-toral trends, and yields a more accurate electoral picture.
What is the Peripheral South?
The task of classifying a Southern region is elusive and prone to sub-jectivity. Some consider only the eleven states of the Confederacy to beSouthern, while others include such states as Delaware, Maryland, Ken-tucky, West Virginia, Oklahoma, and Missouri. Earl and Merle Blackdefined the Deep South as South Carolina, Georgia, Alabama, Missis-sippi, and Louisiana; they defined the Peripheral South as Virginia, NorthCarolina, Tennessee, Arkansas, Florida, and Texas (Black and Black 17).This classification includes only states that were part of the Confederacy.
Kakavitsas: The Peripheral South 49
I add the non-Confederate states of West Virginia, Kentucky, and Mis-souri to their classification of the Peripheral South. These three statesmay be considered Southern because each has a significant contingent ofpeople with traits that many consider to be a part of Southern identity,including vernacular and religious behavior (Lew; Kilpinen). Missouriand Kentucky were slave states, and although West Virginia broke awayfrom Virginia, in part, over the issue of slavery, it did so relatively late(1863), considering its relatively eastward location in the United States.
On the other hand, I exclude Maryland, Delaware, and Oklahomafrom my analysis of the Peripheral South. While some consider Marylandand Delaware to be part of the South, the Northeastern megalopolis thatstretches from northern Virginia to Boston includes Maryland, anchoredby the urban Montgomery and Prince George’s counties outside of Wash-ington and Baltimore, and Delaware, anchored by Newcastle County en-compassing Wilmington and the Philadelphia exurbs. The populationdensities of Maryland and Delaware (542 and 401 people per square mile,respectively) far exceed the most population-dense state that we haveincluded in our classification (Florida, with 301 people per square mile(U.S. Census Bureau 2005a)). A main reason Oklahoma is discounted inthis analysis is that it has split from other Great Plains states in presiden-tial elections only once, and often voted differently than Peripheral Southstates, as in 1976 (Leip).
Population Growth in the Peripheral South
In recent years, the Peripheral South has realized a large populationincrease, though that increase has largely been confined to North Caro-lina, Florida, Texas, and Virginia. Of the total population increase in theUnited States from 2000 to 2005, the Peripheral South accounted foralmost 38% of the increase, though the region contained only 26% of thecountry’s total population in 2005. Much of this increase stems frominterstate migration from the Midwest and Northeast, and immigrationfrom Mexico, Central America, and Puerto Rico. The other states in thissub-region have also seen population increases, though to a lesser extent(U.S. Census Bureau 2005b).
Overall, the Deep South is growing at a modest pace compared withthe explosive growth of the Peripheral South. Georgia and South Caro-lina are growing above the national average, but the other states in this
50 Chrestomathy: Volume 6, 2007
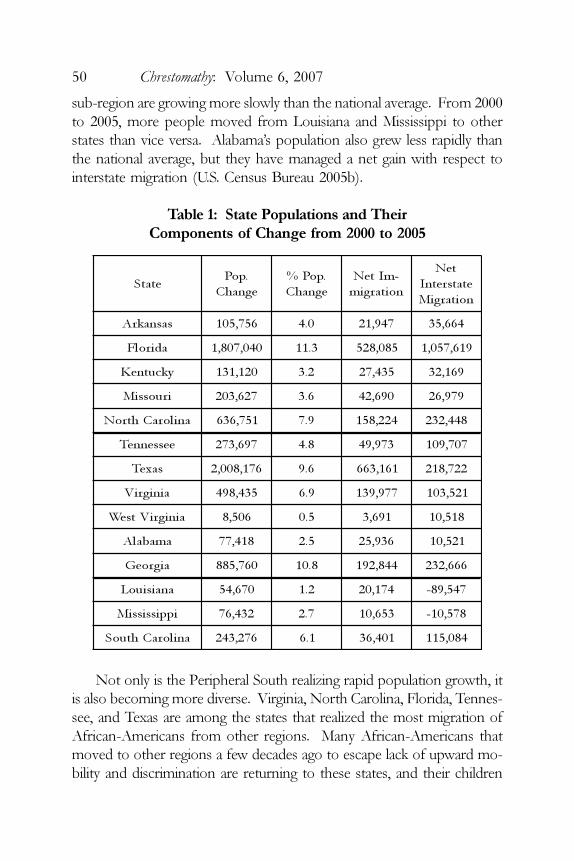
sub-region are growing more slowly than the national average. From 2000to 2005, more people moved from Louisiana and Mississippi to otherstates than vice versa. Alabama’s population also grew less rapidly thanthe national average, but they have managed a net gain with respect tointerstate migration (U.S. Census Bureau 2005b).
Table 1: State Populations and Their
Components of Change from 2000 to 2005
Not only is the Peripheral South realizing rapid population growth, itis also becoming more diverse. Virginia, North Carolina, Florida, Tennes-see, and Texas are among the states that realized the most migration ofAfrican-Americans from other regions. Many African-Americans thatmoved to other regions a few decades ago to escape lack of upward mo-bility and discrimination are returning to these states, and their children
etatS.poP
egnahC
.poP%
egnahC
-mIteN
noitargim
teN
etatsretnI
noitargiM
sasnakrA 657,501 0.4 749,12 466,53
adirolF 040,708,1 3.11 580,825 916,750,1
ykcutneK 021,131 2.3 534,72 961,23
iruossiM 726,302 6.3 096,24 979,62
aniloraChtroN 157,636 9.7 422,851 844,232
eessenneT 796,372 8.4 379,94 707,901
saxeT 671,800,2 6.9 161,366 227,812
ainigriV 534,894 9.6 779,931 125,301
ainigriVtseW 605,8 5.0 196,3 815,01
amabalA 814,77 5.2 639,52 125,01
aigroeG 067,588 8.01 448,291 666,232
anaisiuoL 076,45 2.1 471,02 745,98-
ippississiM 234,67 7.2 356,01 875,01-
aniloraChtuoS 672,342 1.6 104,63 480,511
Kakavitsas: The Peripheral South 51
are also moving to there. In fact, every other U.S. Census region — North-east, Midwest, and West — realized a net loss in black migration, withmore blacks moving out than moving in (Frazier 1, 4).
Coupled with Hispanic immigration and internal migration of His-panics from other regions, Texas has become a majority-minority state(where there is a plurality of non-Hispanic whites, not a majority). Florida,North Carolina, and Virginia boast large contingents of racial minoritieswith just 57.3%, 65.1%, and 65.7% of the population being non-His-panic whites, respectively, as of 2005 (U.S. Census Bureau 2005a). ThoughTennessee, Kentucky, Arkansas, and Missouri are not diversifying as rap-idly as Florida, North Carolina, and Virginia, some are becoming morediverse. As of 2005, only West Virginia was overwhelmingly composedof non-Hispanic whites (94.4%), while this figure was lower in otherstates—Kentucky (88.2%), Missouri (81.9%), Arkansas (76.8%), andTennessee (76.6%) (U.S. Census Bureau 2005a).
By contrast, in the Deep South, only Georgia is becoming more di-verse. Georgia realized a large increase of the share of blacks from 2000to 2005, from 28.5% to 29.5%. The Hispanic population grew 43.6%from 2000 to 2005, and the share of non-Hispanic whites decreased (U.S.Census Bureau, 2005a). From 1995 to 2000, Georgia realized the largestinterstate migration of blacks of all states, and this number was morethan double North Carolina’s which came in second place (Frazier 1).But other Deep South states saw no significant increase in the share ofblacks and no significant reduction in the share of non-Hispanic whites(U.S. Census Bureau 2005a).
Some of the fastest-growing counties in the nation are within thePeripheral South. Many of these counties are already heavily populated,so such a rapidly growing population is even more remarkable.
Such an example is Loudon County in northern Virginia, in the Wash-ington, D.C. metropolitan area. From 2000 to 2005, this county’s popula-tion ballooned from 169,755 to 255,518, an increase of 50.7%. PrinceWilliam County, also part of the northern Virginia suburb of D.C. grew24.1%, from 280,813 to 348,588. In fact, the growth of the northernVirginia D.C. suburbs, particularly Fairfax, Loudon, Prince William, andArlington counties (all of which rank in the top ten counties with thehighest votes cast in 2004), account for over 28.4% of the growth inVirginia from 2000 to 2005 (U.S. Census Bureau 2006c). Furthermore,

52 Chrestomathy: Volume 6, 2007
these counties are becoming more diverse, and the share of non-Hispanicwhites is decreasing. In Loudon County, the Hispanic population grew134% from 2000 to 2005, and this demographic now accounts for 9.3%of that county’s population (compared to 5.9% in 2000). The non-His-panic white share of the population has decreased from 82.8% to 73.8%.In Prince William County, the share of the Hispanic population increased187% (from 9.7% to 18.1%). The share of the non-Hispanic white votedecreased from 68.9% in 2000 to 62.5% in 2005 (U.S. Census Bureau2005a).
North Carolina, like Virginia, has seen rapidly increasing and diversi-fying populations in its larger counties, including Mecklenburg and Wakecounties. Mecklenburg County, home to Charlotte, grew 12.2%, and theshare of non-Hispanic whites decreased from 64.0% to 62.4% from 2000to 2005. Wake County, which features Raleigh and Cary, grew 16.2%,with the share of non-Hispanic whites dropping from 72.4% to 70.3%.Both counties saw an increased share of Hispanics, and Mecklenburgsaw an increase in the black share of the population. Even rapidly grow-ing suburban counties, usually among the least diverse of places, havediversified considerably. Cabarrus County, which lies outside of Char-lotte, grew 12.9% (131,063 to 147,039) from 2000 to 2005, but duringthis time, the share of non-Hispanic whites declined from 83.3% to 80.6%(U.S. Census Bureau 2005a). In North Carolina, over 51% of the growthfrom 2000 to 2005 has been in the ten most populous counties. Thegrowth in Mecklenburg, Wake, and Guilford counties accounts for over38% of the state’s population increase from 2000 to 2005 (U.S. CensusBureau 2006d).
In Texas, like North Carolina and Virginia, the growth has been con-centrated in several counties with almost 65% of the growth confined tothe ten most populous counties (U.S. Census Bureau 2006e). Harris County(which contains Houston) and many of the surrounding counties, such asGalveston and Fort Bend, are not only growing rapidly; they are also di-versifying rapidly.
Florida’s growth has shifted from the southern Atlantic region, en-compassing Miami and Palm Beach, to the I-4 corridor that runs fromDaytona Beach to Tampa, and to the southern Gulf Coast encompassingSarasota and Fort Myers. However, because many of these counties arerelatively small compared to enormously populous counties like Miami-
Kakavitsas: The Peripheral South 53
Dade, Palm Beach, and Broward, the ten most populous counties ac-count for almost 57% of the population growth in Florida from 2000 to2005 (U.S. Census Bureau 2006f).
At the same time, there have been only a few pockets of rapid growthin the Deep South, particularly in the already large suburban counties ofAtlanta. About half of the counties in other states within this sub-regionare losing population (U.S. Census Bureau 2006e).
The Old Solid South: A Brief History of Southern Politics Before
the Civil Rights Era
A region that many electoral scholars dismiss as solidly Republicanwas once a Democratic bastion where not only did Democrats win virtu-ally every election, but a Republican opponent was rarely fielded, espe-cially in the former Confederate states. There were, however, pockets ofRepublicanism in the South, and all of them were in the Peripheral South.These areas of Republican support were mainly in Appalachia: westernNorth Carolina, western Virginia, and eastern Tennessee (Black and Black40). The Democrats hailing from the South were largely pro-segregationand espoused racist beliefs. Before the Great Depression, Republicanswon elections without the help of the South. The general consensusamong Republicans was that the South was a lost cause, and so theyelicited their support from non-Southern states (Black and Black 13-4).
When the Great Depression wreaked havoc on the agrarian Southerneconomy, Southerners’ loyalty to the Democratic Party was only rein-forced. Of course, Democrats gained a large following with FranklinDelano Roosevelt’s New Deal, and Democrats were able to maintainmajorities of non-Southerners during some of this time. The Democratsfrom other regions were less inclined towards the segregation and racismof the Southern Democrats. Then, it must be asked, how were the South-ern Democrats able to prevent legislation that criminalized lynchings oroutlawed racial segregation?
The modus operandi of Southern Democratic congressmen was to beelected at an early age and continue to be re-elected term after term.Eventually, they would gain seniority and chair committees in Congressthat determined what legislation was addressed. Seniority was the deter-mining factor in committee chair assignments until the 1960’s.
Following the Roosevelt era, his successor Harry S. Truman, a former
54 Chrestomathy: Volume 6, 2007
U.S. Senator from Missouri, sought to pass civil rights legislation in Con-gress (Black and Black 46). His initiatives inspired the campaign of theDemocratic governor and future U.S. senator of South Carolina, J. StromThurmond, who ran as a “Dixiecrat” (Black and Black 33). A electoralcleavage between the Deep South and Peripheral South begins with thiselection: Truman carried every state in the Peripheral South while losingevery Deep South state except for Georgia (Leip).
In 1952, Democrats lost their twenty-year grip on the White Housewith the election of Dwight D. Eisenhower. Eisenhower was able tocarry five of the nine states in the Peripheral South, but no Deep South-ern states. In fact, the Democrat achieved at least 60% of the vote inthree of the five states in that sub-region. Eisenhower’s re-election dem-onstrated a continued divergence between the two sub-regions: he car-ried six of nine Peripheral South states, while only winning one in theDeep South. When John F. Kennedy was elected President, he carriedonly five of the nine Peripheral South states, a continuation of two-partypresidential politics in this sub-region, and he won the vote in four of thefive Deep South states, a continuation of near-solidarity (Leip).
The 1964 landslide victory of Lyndon Johnson over Barry Goldwater— one of the few non-South Republicans to vote against the VotingRights Act of 1965 — is arguably the most useful example in distinguish-ing between the politics of the two sub-regions (Black and Black 4). ThePeripheral South states unanimously voted for Johnson, as did all of thenon-Southern states except Arizona, Goldwater’s home state. The DeepSouth unanimously voted for Goldwater and against the remainder of thecountry, including the Peripheral South (Leip).
The peripheral Southern states that were not part of the Confederacycertainly had a Democratic leaning in presidential and congressional elec-tions, but these states — Kentucky, West Virginia, and Missouri — hadRepublican congressmen prior to 1960 (Black and Black 16). And whilesome Southern States had Republican representatives, almost all of thesewere confined to Appalachia with its strong Republican, pro-Union heri-tage. No Southern state had elected a Republican to the U.S. Senate sinceReconstruction (Black and Black 40). That remained true until 1961,with the election of John Tower of Texas to fill Lyndon B. Johnson’sSenate seat, when Johnson became Kennedy’s vice president (Black andBlack 90).
Kakavitsas: The Peripheral South 55
During the 1950’s and early 1960’s, many states in the PeripheralSouth experienced rapid urbanization, as people from rural areas of thesestates and migrants from non-Southern states began to concentrate inlarge urban centers, including Dallas, Houston, Charlotte, Memphis,Tampa, and Miami. These largely white, middle-class, urban Southernersbegan voting for Republicans, mainly because they viewed Republicansas being more compatible with their economic interests (Black and Black24). Thus, Peripheral South states had two sources of Republicanism:rapidly growing urban areas and historicallos“y loyal Appalachia. Thesevoting blocs would allow the emergence of a viable Republican Party instatewide elections — a hard road to travel, but one that would prove tobe much less difficult than Republican penetration of the Deep South(Black and Black 173).
The New South or the New Souths?
Though what Earle and Merle Black have referred to as “Republicanenclaves” emerged in the urban centers of the Peripheral South, the Demo-cratic juggernaut of the South had not been overturned. More Republi-cans were challenging Democratic incumbents in congressional races, andmany were running in open races where Democratic incumbents wereretiring (Black and Black 64-5). Success was slow and marked by set-backs (Black and Black 70-1). The Voting Rights Act of 1965, however,changed the electoral landscape for the South. By the end of the RonaldReagan’s presidency, more Southerners referred to themselves as Repub-licans than Democrats, though they still do not enjoy a majority in partyidentification and were not at all comparable to large majorities in partyaffiliation that Democrats had once enjoyed. The progression from aDemocratic one-party to a two-party system was steady in the PeripheralSouth, while it was subsequent but dramatic in the Deep South.
Although Democratic congressmen would continue to enjoy domi-nance in the Deep South until the 1980’s and early 1990’s, Republicansenjoyed great success on the presidential level from Goldwater onward.Voters in the Deep South continued to elect Democrats to Congress, butvery often voted for Republicans and third-party candidates. The Periph-eral South continued to send Democratic-majority delegations to Con-gress but exhibited a strong two-party presidential system with only Ar-kansas (and by a narrow margin) ever voting for a third-party candidate.
56 Chrestomathy: Volume 6, 2007
Merle and Earle Black portray this progression from presidential Republi-canism to Republican Party identification among the electorate as a top-bottom progression (Black and Black 32-6).
These changes in voting behavior can be attributed to the civil rightsmovement and to non-Southern Democrats becoming more aggressive inpursuing civil rights legislation (Black and Black 171). The political land-scape of the Deep South from the mid-1960’s to the early 1990’s is sum-marized as follows by Earl and Merle Black:
None of the Deep South states…had impressive traditions ofgrassroots Republicanism. Nor did these states contain whitemiddle classes large enough to make Republicans competitive instatewide elections. Most Deep South states were still more pre-occupied with racial conflicts than with economic development.As they had done for generations, racially conservative whiteDemocrats continued to set the tone of Deep Southpolitics….Although Republicans from the Peripheral South gradu-ally became a sizable minority presence in the Senate, they hadmuch greater difficulty doing so in the Deep South. (Black andBlack 114)
The Deep South continued to elect conservative Democrats who wereoften racially hostile and had low party unity scores (Black and Black114). Most of these conservative Democrats either retired, were de-feated, or switched to the Republican Party — some as late as the mid-1990’s. Examples who took the lattermost path include Sen. J. StromThurmond (SC), who became a Republican in the 1960’s, and Sen. Rich-ard Shelby (AL), who switched in the 1990’s (Black and Black 269-70).Many moderate Democrats formed bi-racial coalitions in which almostunanimous black support combined with 35-40% of white voters to givethe Democratic candidate a majority. Examples of these moderate Demo-crats who enjoyed bi-racial support included Sen. John Breaux (LA), AlGore (TN), and Sen. Sam Nunn (GA) (Black and Black 134).
Today, there is only one Democratic Senator from the Deep South:Mary Landrieu of Louisiana. Many believe that she faces a tough re-election in 2008 because she will have to contend with a demographiclandscape changed by the displacement of blacks, one of her key-sup-porting blocs, from New Orleans due to the devastating damage of Hur-
Kakavitsas: The Peripheral South 57
ricane Katrina in August 2005 (Miller). In her two previous elections tothe Senate, she has failed to achieve more than 52% of the vote (Leip).By 2008, Democrats may very well be shut out of any Senate seats in theDeep South.
In 1994 Republicans gained control of Congress, and for the firsttime, the South sent a majority Republican delegation to the House. Overthe next decade, Republicans lost their majority delegations outside theSouth, but continued to maintain their majority for the next twelve yearsin the House and for eleven of those twelve years in the Senate; thus theSouth was the critical component of their majority in Congress (Blackand Black 401-4). Republicans in the House were led by Southernersfrom overwhelmingly white, affluent, suburban districts: Speaker of theHouse Newt Gingrich, of suburban Atlanta, his successor Bob Livingston,of suburban New Orleans, and the House majority leader Tom Delay, ofsuburban Houston. These congressmen represented highly gerrymandereddistricts that essentially guaranteed them victory, freeing them to pursue acomprehensively conservative agenda that could be described as: “Lowtax, low union, strong work ethic, strong commitment to family and com-munity” (Black and Black 5-7).
One of the critical factors in the Republican surge in the South wasthe creation of majority-black districts that aimed to recruit more blacksin Congress. These efforts were supported by the Congressional BlackCaucus and by the Republicans in Congress. These districts did, in fact,allow more blacks to become elected in these newly created districts. Thedrawback for Democrats, however, is that these districts consolidatedDemocrats into noncompetitive districts and away from other districtswhich Republicans were able to pick up (Black and Black 389). Althoughthe number of votes for Democratic and Republican House candidates inFlorida in 2006 were roughly equal, Republicans won fifteen house seatswhile Democrats won only nine (CNN.com 2006). This disparity is largelydue to the concentration of Democrats within highly-gerrymandered dis-tricts where a Republican challenge is not often mounted. In fact, of thenine seats Democrats won, six were uncontested. Taking into accountthe House seats won by Democrats in the South in 2006, the averageshare of blacks in Democratically-held seats in the Deep South is slightlyover 50%, whereas the share in the Peripheral South is slightly below20% (New York Times Online 2006).
58 Chrestomathy: Volume 6, 2007
Democrats in the Peripheral South became less dominant, with moststates eventually sending majority Republican delegations to Congress,but these majorities stabilized in most states, and some have once againregained Democratic majorities. Many senate races in the Peripheral Southtend to be competitive. For example, North Carolina has not supportedany candidate by greater than a 10% margin since 1972 and no more thana 9% margin since 1984. Six of the nine elections for the U.S. Senate inNorth Carolina have been determined by less than 5%. Four of the fiveprevious senate races in Virginia (1994,1996, 2000, 2002, and 2006) havebeen determined a margin no greater than 5%. In Tennessee, the last twoSenate elections (2002 and 2006) were determined by less than 10%.Besides the landslide re-election of Sen. Connie Mack in 1994 and thelandslide victories by Democratic Senators Bob Graham in 1998 and BillNelson in 2006, two previous Florida Senate races were determined bynarrow margins (4.85% in 2000 and 1.11% in 2004). In Missouri, four ofthe five previous U.S. Senate elections have been determined by less than10% margins, and three of these by less than 3% (Leip).
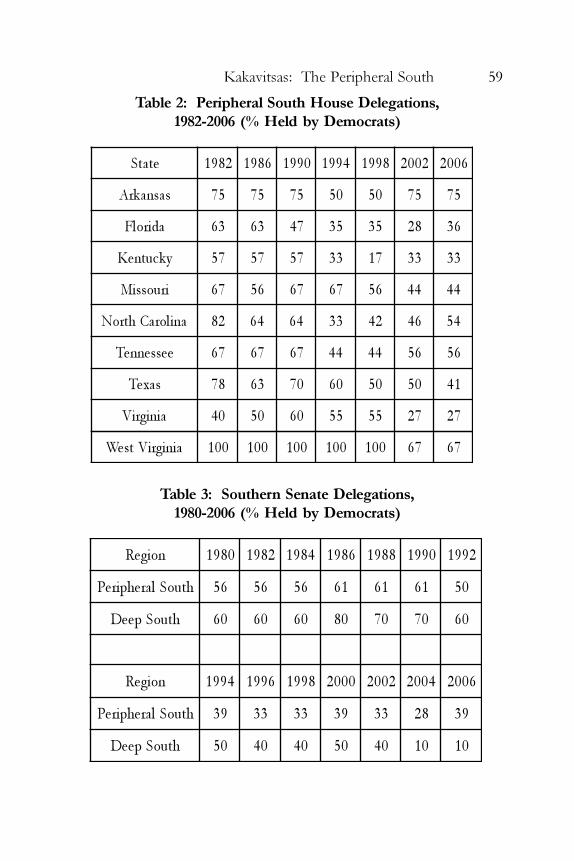
Tables 2 and 3 examine the progression of congressional delegationsin the South since the Reagan administration.
The Future of the South and the Peripheral South: One-Party Poli-
tics?
In Whistling Past Dixie: How Democrats Can Win Without the South, Tho-mas Schaller argues that the Democratic Party should essentially cut itslosses in the South (excepting Florida) and focus on winning states in theWest and Midwest. In fact, Schaller argues that Democratic candidatesshould run their campaigns to demonize or marginalize the South in a waythat he believes Republicans have by attempting to stereotype Democratsand using states such as Massachusetts and California as pejoratives(Schaller 18). He allows that there will always be certain House districts,but concludes that Democratic presidential and senatorial campaigns wouldbe ill-advised to try to court white Southerners (Schaller 3).
Schaller contends that, discounting Florida and Texas, the South —which he defines as the Confederacy — is not gaining much electoralsignificance. By 2030, the Confederate states, less Florida and Texas, willhave only gained a net two electoral votes. If we break this analysis downby sub-region, however, we see that the Peripheral South will realize
Kakavitsas: The Peripheral South 59
Table 2: Peripheral South House Delegations,
1982-2006 (% Held by Democrats)
Table 3: Southern Senate Delegations,
1980-2006 (% Held by Democrats)
etatS 2891 6891 0991 4991 8991 2002 6002
sasnakrA 57 57 57 05 05 57 57
adirolF 36 36 74 53 53 82 63
ykcutneK 75 75 75 33 71 33 33
iruossiM 76 65 76 76 65 44 44
aniloraChtroN 28 46 46 33 24 64 45
eessenneT 76 76 76 44 44 65 65
saxeT 87 36 07 06 05 05 14
ainigriV 04 05 06 55 55 72 72
ainigriVtseW 001 001 001 001 001 76 76
noigeR 0891 2891 4891 6891 8891 0991 2991
htuoSlarehpireP 65 65 65 16 16 16 05
htuoSpeeD 06 06 06 08 07 07 06
noigeR 4991 6991 8991 0002 2002 4002 6002
htuoSlarehpireP 93 33 33 93 33 82 93
htuoSpeeD 05 04 04 05 04 01 01
60 Chrestomathy: Volume 6, 2007
a net gain of one electoral vote (North Carolina will gain two electoralvotes and Virginia will gain one, while West Virginia and Missouri willlose one apiece), whereas the Deep South will realize a net loss of oneelectoral vote (Alabama and Louisiana will lose one apiece while Georgiawill gain one) (U.S. Census Bureau 2006g).
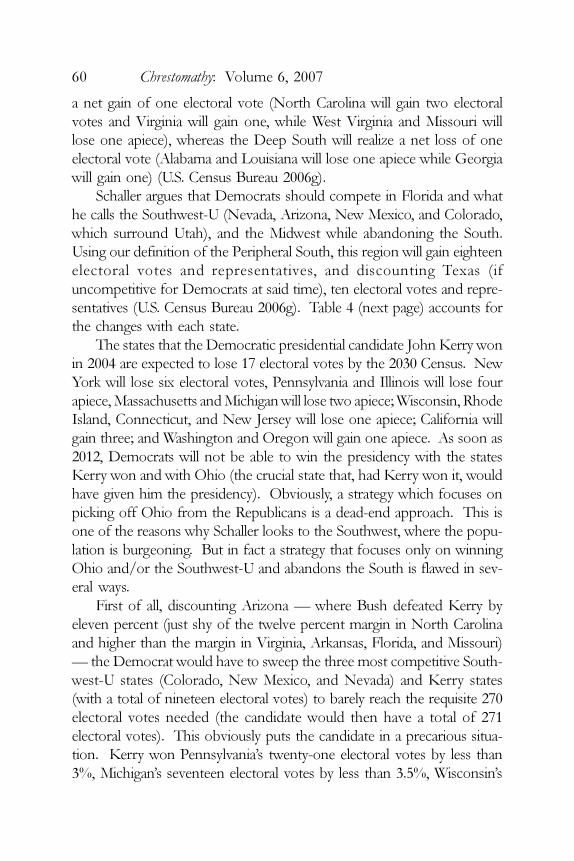
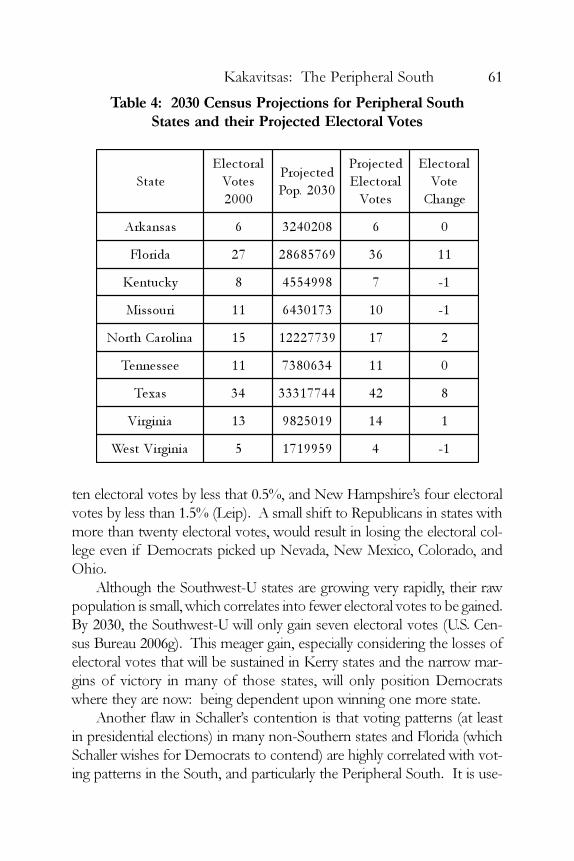
Schaller argues that Democrats should compete in Florida and whathe calls the Southwest-U (Nevada, Arizona, New Mexico, and Colorado,which surround Utah), and the Midwest while abandoning the South.Using our definition of the Peripheral South, this region will gain eighteenelectoral votes and representatives, and discounting Texas (ifuncompetitive for Democrats at said time), ten electoral votes and repre-sentatives (U.S. Census Bureau 2006g). Table 4 (next page) accounts forthe changes with each state.
The states that the Democratic presidential candidate John Kerry wonin 2004 are expected to lose 17 electoral votes by the 2030 Census. NewYork will lose six electoral votes, Pennsylvania and Illinois will lose fourapiece, Massachusetts and Michigan will lose two apiece; Wisconsin, RhodeIsland, Connecticut, and New Jersey will lose one apiece; California willgain three; and Washington and Oregon will gain one apiece. As soon as2012, Democrats will not be able to win the presidency with the statesKerry won and with Ohio (the crucial state that, had Kerry won it, wouldhave given him the presidency). Obviously, a strategy which focuses onpicking off Ohio from the Republicans is a dead-end approach. This isone of the reasons why Schaller looks to the Southwest, where the popu-lation is burgeoning. But in fact a strategy that focuses only on winningOhio and/or the Southwest-U and abandons the South is flawed in sev-eral ways.
First of all, discounting Arizona — where Bush defeated Kerry byeleven percent (just shy of the twelve percent margin in North Carolinaand higher than the margin in Virginia, Arkansas, Florida, and Missouri)— the Democrat would have to sweep the three most competitive South-west-U states (Colorado, New Mexico, and Nevada) and Kerry states(with a total of nineteen electoral votes) to barely reach the requisite 270electoral votes needed (the candidate would then have a total of 271electoral votes). This obviously puts the candidate in a precarious situa-tion. Kerry won Pennsylvania’s twenty-one electoral votes by less than3%, Michigan’s seventeen electoral votes by less than 3.5%, Wisconsin’s
Kakavitsas: The Peripheral South 61
Table 4: 2030 Census Projections for Peripheral South
States and their Projected Electoral Votes
ten electoral votes by less that 0.5%, and New Hampshire’s four electoralvotes by less than 1.5% (Leip). A small shift to Republicans in states withmore than twenty electoral votes, would result in losing the electoral col-lege even if Democrats picked up Nevada, New Mexico, Colorado, andOhio.
Although the Southwest-U states are growing very rapidly, their rawpopulation is small, which correlates into fewer electoral votes to be gained.By 2030, the Southwest-U will only gain seven electoral votes (U.S. Cen-sus Bureau 2006g). This meager gain, especially considering the losses ofelectoral votes that will be sustained in Kerry states and the narrow mar-gins of victory in many of those states, will only position Democratswhere they are now: being dependent upon winning one more state.
Another flaw in Schaller’s contention is that voting patterns (at leastin presidential elections) in many non-Southern states and Florida (whichSchaller wishes for Democrats to contend) are highly correlated with vot-ing patterns in the South, and particularly the Peripheral South. It is use-
etatS
larotcelE
setoV
0002
detcejorP
0302.poP
detcejorP
larotcelE
setoV
larotcelE
etoV
egnahC
sasnakrA 6 8020423 6 0
adirolF 72 96758682 63 11
ykcutneK 8 8994554 7 1-
iruossiM 11 3710346 01 1-
aniloraChtroN 51 93772221 71 2
eessenneT 11 4360837 11 0
saxeT 43 44771333 24 8
ainigriV 31 9105289 41 1
ainigriVtseW 5 9599171 4 1-
62 Chrestomathy: Volume 6, 2007
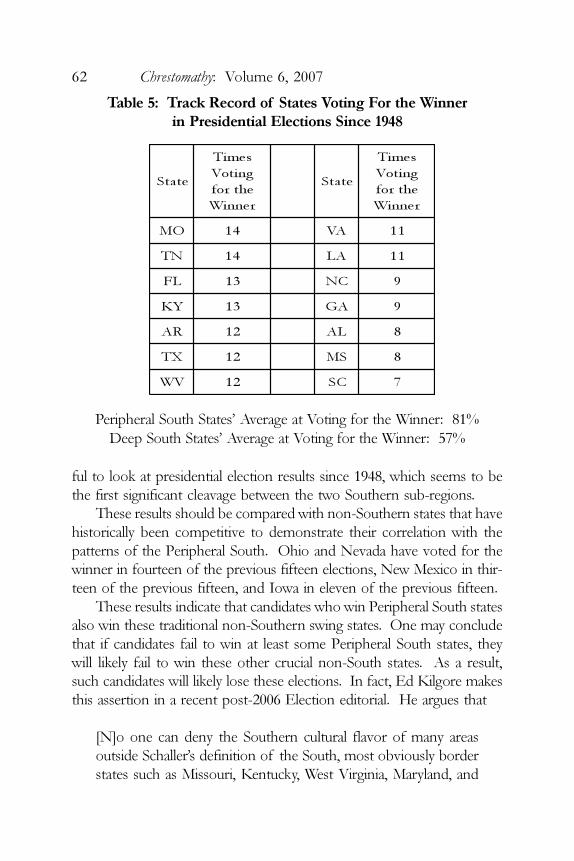
Table 5: Track Record of States Voting For the Winner
in Presidential Elections Since 1948
Peripheral South States’ Average at Voting for the Winner: 81%Deep South States’ Average at Voting for the Winner: 57%
ful to look at presidential election results since 1948, which seems to bethe first significant cleavage between the two Southern sub-regions.
These results should be compared with non-Southern states that havehistorically been competitive to demonstrate their correlation with thepatterns of the Peripheral South. Ohio and Nevada have voted for thewinner in fourteen of the previous fifteen elections, New Mexico in thir-teen of the previous fifteen, and Iowa in eleven of the previous fifteen.
These results indicate that candidates who win Peripheral South statesalso win these traditional non-Southern swing states. One may concludethat if candidates fail to win at least some Peripheral South states, theywill likely fail to win these other crucial non-South states. As a result,such candidates will likely lose these elections. In fact, Ed Kilgore makesthis assertion in a recent post-2006 Election editorial. He argues that
[N]o one can deny the Southern cultural flavor of many areasoutside Schaller’s definition of the South, most obviously borderstates such as Missouri, Kentucky, West Virginia, Maryland, and
etatS
semiT
gnitoV
ehtrof
renniW
etatS
semiT
gnitoV
ehtrof
renniW
OM 41 AV 11
NT 41 AL 11
LF 31 CN 9
YK 31 AG 9
RA 21 LA 8
XT 21 SM 8
VW 21 CS 7
Kakavitsas: The Peripheral South 63
Delaware, but also portions of Ohio, Indiana, and Illinois. Andanyone who thinks most of the nation despises Southern culturehasn’t paid much attention to the rapid spread and enthusiasm ofNASCAR and country music, not to mention evangelical Protes-tantism and mega-churches. Let’s also remember the pervasivelySouthern character of African-American culture throughout thecountry. It’s no accident that Southern Democratic politicianswho ran nationally seem to do especially well in presidential pri-maries among African-American voters. (Kilgore)
Kilgore also contends that “there’s a whole lot of ground between thisalleged Southern strategy [to ‘obsess about the South at the expense ofother opportunities’] and Schaller’s run-against-the-South prescription, andthat’s where I take my stand” (Kilgore).
Schaller fails to mention that early 20th-century Republicans couldmore easily afford to write off the South than present-day Democrats canin the current electoral landscape. In the 1924 and 1928 elections, Re-publicans had to win 266 of 405 or 66% of non-Southern electoral votesto win an election. Many of the Peripheral South states and non-Southstates in the Mountain West and Great Plains regularly voted for the Re-publican presidential candidate, so achieving victory was not all that en-tirely difficult. After the 2000 Census reapportionment of electoral votes,Democrats must win an identical 66% of states that were not part of theConfederacy, but this does not account for states that regularly vote forthe Republican presidential candidate. With these states, Florida, and theother Peripheral South states accounted for, Democrats must win 85% ofthe remaining electoral votes to attain victory (Leip). According to the2030 Census projections, the situation becomes even more precarious:without the broadly-defined South (excepting Florida), and the Great Plainsand interior West states that voted for Bush in 2004 by more than 15%,the Democrat would have to win 80% of the remaining electoral votes.With Florida conceded to Republicans, this figure would jump to over89% (U.S. Census Bureau 2006g).
Racial Perspectives in the New Souths
Schaller presents an interesting comparison of the racial perspectivesamong whites: from the Deep South, the Peripheral South, and the non-
64 Chrestomathy: Volume 6, 2007
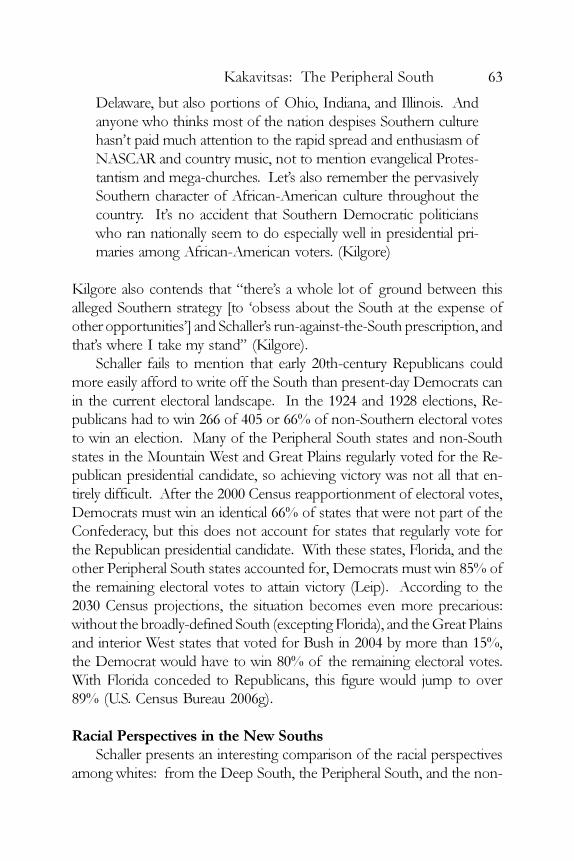
South. He cites a study done by Nicholas Valentino and David Searsconcerning four variations of “neo-racism” and their prevalence in thethree aforementioned regions: The four varieties are symbolic racism(“agreement/ disagreement as to whether progress among African-Ameri-cans was impeded by slavery and political discrimination”), negative blackstereotyping (“belief that African-Americans are lazy, less intelligent, lesshard-working”), white-black feeling thermometers (“scaled responses thatmeasure racial affect towards blacks and whites”), and Jim Crow racism(“support for keeping African-Americans out of white neighborhoods, oropposition to racial intermarriage and miscegenation”) (Schaller 82). Thefollowing table illustrates their findings.
Table 6: Negative Racial Attitudes Held By Whites By Region
noigeRcilobmyS
msicaR
kcalB
-ytoeretS
gnip
gnileeF
-omrehT
retem
worCmiJ
msicaR
htuoSpeeD %55 %94 %74 %34
htuoSlarehpireP %93 %93 %83 %43
htuoS-noN %23 %73 %43 %32
Table 6 illustrates that racial attitudes in the Peripheral South are muchcloser to those in the non-South than the Deep South for three of the fourcategories, and the other category shows the Peripheral South to be al-most exactly between the Deep South and the non-South. Clearly, race isless of an issue in the Peripheral South than it is in the Deep South.
So long as Democrats continue to embrace civil rights, the policiesthat allowed the Republican Party to be competitive in the Deep South(from Barry Goldwater’s opposition to the Voting Rights Act to RonaldReagan’s “states’ rights” speech in Philadelphia, Mississippi), they are go-ing to encounter difficulties winning in a region where almost half of thewhite population believes that blacks as a whole have inferior intelligenceand work ethic. Because this attitude is less common among both Periph-eral Southern and non-Southern whites than among their Deep Southcounterparts, Democratic and African-American candidates will have achallenging, but possible, task ahead of them. The Peripheral South has
Kakavitsas: The Peripheral South 65
several examples of successful African-American candidates being electedby largely white populations: former Governor of Virginia Douglas Wilder,former Mayor of Charlotte Harvey Gantt, and Mayor Terry M. Bellamyof Asheville.
Jim Crow racism (essentially, the support of racial segregation) is moreof an issue in the Peripheral South than in the rest of the nation, thoughless of an issue than it is in the Deep South. This kind of racism mightmake it difficult for African-American candidates, as the whites who es-pouse this type of racism may view political office as an institution re-served for their race alone. Schaller seems to believe that this “neo-racist” attitude precludes African-Americans from winning statewide of-fice, though he seems to conveniently blame the South as a whole. Heconveniently dismisses Douglas Wilder’s 1989 gubernatorial victory,though he was the only elected African-American governor in the nationuntil Deval Patrick won the 2006 Massachusetts gubernatorial election.He passively concedes that “the track record for electing black candi-dates to statewide office is not much better in the non-Southern states,”and instead he turns to the fact that the relatively large black populationin the South should automatically translate into success among African-American candidates (Schaller 81). Harold Ford, a candidate for the U.S.Senate from Tennessee and an African-American, won enough white vot-ers in Tennessee to beat his Republican opponent, but African-Americanvoter turn-out was less than the share of the African-American popula-tion (CNN.com 2006; U.S. Census Bureau 2005a). Perhaps his failure towin had more to do with lack of appeal among the black electorate thanhostility among the white electorate. Ford, by many accounts, is a moder-ate-to-conservative Democrat: He supported repeal of the estate tax andcalled for more troops to be sent to the Iraq conflict. Perhaps these con-servative stances did not appeal to African-Americans and failed to moti-vate this voting bloc to vote in numbers proportional to their presence inthe population (Tumulty and Bacon).
Race will continue to be highly intertwined in Southern politics, butwe must also examine the interrelatedness of race and politics in the non-South and the absence of African-American politicians in those states.Perhaps, if and when, appreciable numbers of black candidates are electedto political office in the non-South, there will be a similar, but mitigated,effect in the Peripheral South.
66 Chrestomathy: Volume 6, 2007
The 2006 Midterm Elections: A Gap Between the Deep and Pe-
ripheral South?
Democrats regained control of both houses of Congress for the firsttime in twelve years in the 2006 midterm elections. Democrats increasedtheir seats in the House from 202 to 232 and increased their Senate seatsfrom 45 to 51 (including two independents who caucus with the Demo-crats). The Peripheral South contributed two of the six Senate gains, withthe elections of Jim Webb in Virginia and Claire McCaskill in Missouri(CNN.com 2006). Indeed, Democrats regained control of the Senatebecause of these two victories against Republican incumbents. The Pe-ripheral South provided six of the thirty gains for Democrats in the House:Heath Shuler (NC-11), John Yarmouth (KY-03), Ron Klein (FL-22), TimMahoney (FL-16), Ciro Rodriguez (TX-23), and Nick Lampson (TX-22)won Republican-held seats. Democrats gained a Republican-held guber-natorial seat in Arkansas, to regain a majority of governors’ mansions inthis sub-region (CNN.com 2006).
There were several seats in the Peripheral South where Democratsalmost won. Republican Robin Hayes (NC-08) was 329 votes from beingunseated by a former textile worker and middle-school teacher Larry Kissell,even though Hayes vastly out-spent his opponent in the campaign. PhilKellam almost unseated Republican Thelma Drake (VA-02). In Florida,Christine Jennings is within 373 votes (of almost 238,000 ballots) ofunseating Republican Vern Buchanan (FL-13). The outcome of this raceis still in question (CNN.com 2006). In the Tennessee Senate race men-tioned earlier, Democrat Harold Ford lost with 47.98% to 50.72% forBob Corker, a thin margin of 2.74% (Leip 2006). Exit polls revealed thatFord won enough white voters (he won 41% of them) to have won theelection if Tennessee blacks had voted at a rate proportional to theirshare (16.4%) of the population in the state (CNN.com 2006).
Overall, Democrats realized appreciable success in this sub-region.However, the outcomes in the Deep South were unimpressive for Demo-crats and would help to bolster Schaller’s arguments for this particularsub-region. In the House races, Democrats incumbents almost lost twoU.S. House seats in Georgia. Democrat Jim Marshall (GA-08) held offRepublican Mac Collins by fewer than 1,800 votes out of over 159,000cast. Democrat John Barrow held off Republican Max Burns by fewerthan 900 votes of over 142,000 cast. Republicans continued to hold four
Kakavitsas: The Peripheral South 67
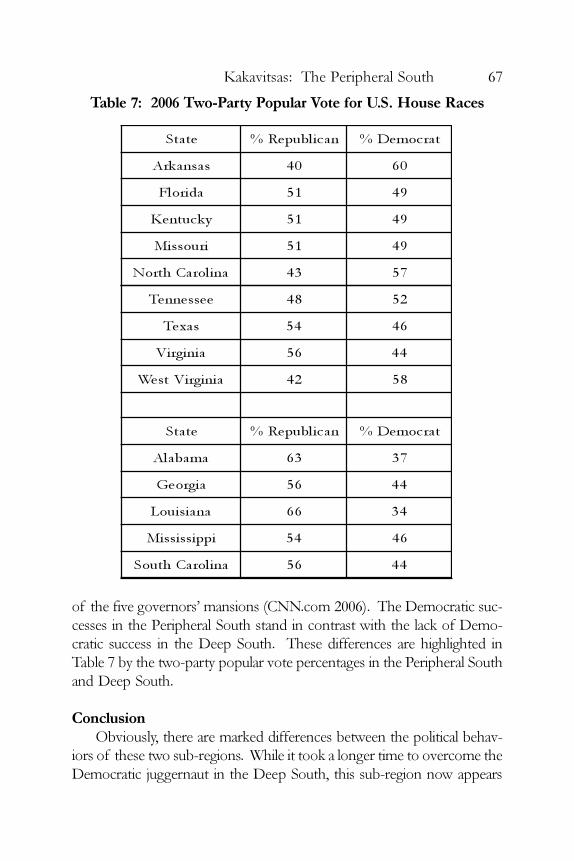
of the five governors’ mansions (CNN.com 2006). The Democratic suc-cesses in the Peripheral South stand in contrast with the lack of Demo-cratic success in the Deep South. These differences are highlighted inTable 7 by the two-party popular vote percentages in the Peripheral Southand Deep South.
Conclusion
Obviously, there are marked differences between the political behav-iors of these two sub-regions. While it took a longer time to overcome theDemocratic juggernaut in the Deep South, this sub-region now appears
Table 7: 2006 Two-Party Popular Vote for U.S. House Races
etatS nacilbupeR% tarcomeD%
sasnakrA 04 06
adirolF 15 94
ykcutneK 15 94
iruossiM 15 94
aniloraChtroN 34 75
eessenneT 84 25
saxeT 45 64
ainigriV 65 44
ainigriVtseW 24 85
etatS nacilbupeR% tarcomeD%
amabalA 36 73
aigroeG 65 44
anaisiuoL 66 43
ippississiM 45 64
aniloraChtuoS 65 44
68 Chrestomathy: Volume 6, 2007
far less promising for Democrats. By contrast, the Peripheral South seemsto be emerging and/or stabilizing for the two parties, with neither partyenjoying a large advantage in party identification (as indicated by exitpolls), excepting Texas and West Virginia (CNN.com 2006). Rather thanmaking broad characterizations of the South, electoral scholars shouldexamine demography and electoral behavior with a more specific approach,looking at each state and each sub-region.
Although the 1990’s proved to be a highly successful decade for Re-publicans in congressional elections, the elections of Democrats JohnEdwards (NC) and Blanche Lincoln (AR) are noteworthy, though for dif-ferent reasons. John Edwards was the only Democrat to beat an incum-bent Republican in one of the former Confederate states in the 1990’s(Black and Black 111). He was also the vice presidential nominee in2004. While the Democratic ticket failed to win his home state of NorthCarolina, exit polls from the state showed that Edwards still enjoyed fa-vorable opinion among a small majority of voters. Blanche Lincoln, run-ning for an open U.S. Senate seat, in the next election after Arkansaselected its first Republican Senator since Reconstruction, handily defeatedher Republican opponent. She won re-election in 2004 by a similar mar-gin, outperforming the Republican presidential candidate and winning amajority of white women (CNN.com 2004).
With the Peripheral South’s increasing diversification and growth, thesuccess Republicans have enjoyed in the last few decades could becomeless consistent or, perhaps, become a consistent opportunity for the Demo-cratic Party. As an article in The Charlotte Observer reports, “The influx[ofminorities into Charlotte, and other places in the South] could have politi-cal ramifications as well….Although Sen. John Kerry lost the 2004 presi-dential election, he won Mecklenburg County with 52% of the vote—thehighest percentage for a Democratic candidate since Franklin Rooseveltin 1994” (Frazier 4). What seems to have been the foundation for mod-ern Republican competitiveness in the Peripheral South — Appalachiaand rapidly-growing urban centers — now seems to be an opportunity fora Democratic re-emergence, though there is little prospect of the Demo-cratic dominance that was enjoyed in these states before the 1950’s. Tables2-5 indicate that these large and diversifying urban centers have recentlytrended towards the Democratic presidential candidate.
In The Rise of Southern Republicans, Black and Black conclude that the
Kakavitsas: The Peripheral South 69
emergence of the Republican Party in the South can be characterized as acompetitive Republican plurality, not a Republican majority. They arguethat such competitiveness does not preclude Democratic victories; rather,both major political parties have reasonable prospects for electoral suc-cess in both the South and the nation as a whole (Black and Black 3-4).From our examination, we may clarify the conclusion by Black and Black:while the Deep South seems to offer fewer and fewer prospects for Demo-cratic victory, there are increasing opportunities and a competitive two-party framework in the Peripheral South that leads to a competitive two-party framework nationally. How Democrats can maximize their elec-toral prospects without reverting to the racism espoused by Democrats ofthe region decades ago is a question that can be examined in light of theobservations set forth in this study.
Works Cited
“2006 Election Guide.” New York Times Online. 2006. 15 Nov. 2006 at<http://www.nytimes.com/ref washington/2006ELECTIONGUIDE.html>.
“America Votes 2004.” CNN.com. 2004. 1 Dec. 2006 <http://www.cnn.com/ELECTION/2004/>.
“America Votes 2006.” CNN.com. 2006. 1 Dec. 2006 <http://www.cnn.com/ELECTION/2006/>.
Black, Earl and Merle Black. The Rise of Southern Republicans. Cambridge,MA: Belknap Press, 2005.
Frazier, Eric. “Southern Appeal: Influx of Blacks to ‘New South’ Accel-erates, Particularly in N.C. and Mecklenburg County.” The Charlotte
Observer 6 Aug. 2006.Kilgore, Ed. “Yes, Democrats do need the South!” Salon.com. 28 Nov.
2006. 1 Dec. 2006 <http://www.salon.com/opinion/feature/2006/11/28/kilgore_south/print.html>.
Kilpinen, Jon T. “Map Gallery of Religion in the United States.” 2003.10 July 2007 <http://www.valpo.edu/geomet/geo/courses/geo200/religion.html>.
Leip, David. Dave Leip’s Atlas of U.S. Presidential Elections. 2006. 15 Nov.2006 <http://uselectionatlas.org/RESULTS/index.html>.

70 Chrestomathy: Volume 6, 2007
Lew, Alan A. “Geography: USA.” 2004. 10 July 2007 <http://www.geog.nau.edu/courses/alew/ggr346/text/chapters/ch1.html>.
Miller, John J. “It’s Never Too Early: An Early Glance at Senate Races,Two Years Out.” National Review Online. 4 Dec. 2006. 09 December2006 at <http://article.nationalreview. com/?q=ZGZlYTIyYjVkOGQzODU4ZjhhZjFkMjcxOGJmZjc1NmI=>.
Schaller, Thomas F. Whistling Past Dixie: How Democrats Can Win Without
the South. New York: Simon & Schuster, 2006.Tumulty, Karen and Perry Bacon, Jr. “Why Harold Ford Has a Shot.”
Time 6 Aug. 2006. 11 Dec. 2006 <http://www.time.com/time/maga-zine/article/0,9171,1223381-1,00.html>.
U.S. Census Bureau. 2005a. “American FactFinder.” Accessed30 Sep-tember 2006 at <http://factfinder.census.gov/home/saff/main.html?_lang=en>.
U.S. Census Bureau. 22 December 2005b. “Table 4: Cumulative Esti-mates of the Components of Population Change for the United Statesand States: April 1, 2000 to July 1, 2005.” Accessed 1 October 2006at <http://www.census.gov/popest/states/NST-comp-chg2005.html>.
U.S. Census Bureau. 16 March 2006c. “Table 2: Cumulative Estimatesof Population Change for Counties of Virginia and County Rankings:April 1, 2000 to July 1, 2005.” Accessed 1 October.2006 at <http://www.census.gov/popest/counties/CO-EST2005-02.html>.
U.S. Census Bureau. 16 March 2006d. “Table 2: Cumulative Estimatesof Population Change for Counties of North Carolina and CountyRankings: April 1, 2000 to July 1, 2005.” Accessed 1 October2006 at <http://www.census.gov/popest/counties/CO-EST2005-02.html>.
U.S. Census Bureau. 16 March 2006e. “Table 2: Cumulative Estimatesof Population Change for Counties of Texas and County Rankings:April 1, 2000 to July 1, 2005.” Accessed 1 October 2006 at <http://www.census.gov/popest/counties/CO-EST2005-02.html>.
U.S. Census Bureau. 16 March 2006f. “Table 2: Cumulative Estimatesof Population Change for Counties of Florida and County Rankings:April 1, 2000 to July 1, 2005.” Accessed 1 October 2006 at <http://www.census.gov/popest/counties/CO-EST2005-02.html>.

Kakavitsas: The Peripheral South 71
U.S. Census Bureau. 21 April 2006g. “Table 1: Interim Projections: Rank-ing of Census 2000 and Projected 2030 State Population and Change:2000 to 2030.” Accessed 3 October 2006 at <http://www.census.gov/population/www/projections/projectionsagesex.html>.
U.S. Congress. “Biographical Directory of the United States Congress.”Accessed 4 December 2006 at <http://bioguide.congress.gov/biosearch/biosearch.asp>.