the persistence of a banking crisis -...
TRANSCRIPT
The Persistence of a Banking Crisis
Kilian Huber∗
November 2015
Abstract
This paper analyses the e�ects of bank lending on GDP and employment. Following losses
on international �nancial markets in 2008/09, a large German bank cut its lending to the Ger-
man economy. I exploit variation in dependence on this bank across counties. To address the
correlation between county GDP growth and dependence on this bank, I use the distance to the
closest of three temporary, historic bank head o�ces as instrumental variable. The results show
that the e�ects of the lending cut were persistent, and resembled the growth patterns of de-
veloped economies during and after the Great Recession. For two years, the lending cut reduced
GDP growth. Thereafter, a�ected counties remained on a lower, parallel trend. The �rm results
exhibit similar dynamics, and show that the lending cut primarily a�ected capital expenditures.
Overall, the lending cut reduced aggregate German GDP in 2012 by 3.9 percent, and employment
by 2.3 percent. This shows that a single bank can persistently shape macroeconomic growth.
∗London School of Economics, Centre for Economic Performance (CEP), and Centre for Macroeconomics (CFM)[email protected]. I thank Alan Manning, Steve Pischke, Alwyn Young, Francesco Caselli, David Card, Wouterden Haan, David Romer, Silvana Tenreyro, and John Van Reenen for valuable advice. For helpful conversations,I am grateful to Florian Blum, Tito Boeri, Pierre Cahuc, Gabriel Chodorow-Reich, Jeremiah Dittmar, ThomasDrechsel, Jonathan Eaton, Fernando Ferreira, Pierre-Olivier Gourinchas, Christoph Gögler, Tarek Hassan, Brun-Hagen Hennerkes, Ethan Ilzetzki, Henrik Kleven, Camille Landais, Alexandre Mas, Stephan Maurer, Ana McDowall,Atif Mian, Guy Michaels, Hoai-Luu Nguyen, Isabelle Roland, Benjamin Schoefer, Hans-Werner Sinn, David Sraer,Claudia Steinwender, Amir Su�, Jim Wilcox, and Eric Zwick. I acknowledge �nancial support from CEP, CFM,Cusanuswerk, and Stiftung Familienunternehmen in acquiring the �rm data. Sta� at the Bundesbank Historic Archive,Economic Archive Hohenheim, and University Library Tuebingen generously helped me in collecting the historic data.
1
1 Introduction
Many economies experienced a severe crisis of their banking sector in 2008/09. The subsequent
Great Recession in the United States, the United Kingdom, and other developed economies was
characterised by two years of negative growth. The eventual recovery was slow, and output and
employment failed to return to their pre-crisis trends. This paper �nds that the causal e�ects of a
bank lending cut resemble this growth pattern. A temporary banking crisis can persistently keep
output and employment low, even after bank loan supply has normalised.
I analyse a lending cut by Commerzbank, Germany's second-largest bank. During the �nancial
crisis 2008/09, Commerzbank su�ered signi�cant losses and write-downs on its international trading
portfolio. These translated into huge equity capital losses, raised the bank's cost of external funds,
and forced it to reduce its risk exposure. As a result, Commerzbank cut its loan supply to the German
economy. Crucially, the trading losses were unrelated to Commerzbank's loan portfolio. Interest
income, which includes what Commerzbank earns from lending to German �rms and households,
remained on an upward trend up to 2009. Firms dependent on Commerzbank reported restrictive
bank loan supply in 2009, but by 2011 their bank �nancing was not a�ected anymore.1
I use variation across counties in dependence on Commerzbank to study the e�ect of this lending
cut. By focusing on an imported banking crisis, I address the key identi�cation challenge that
plagues the literature on �nancial frictions: the correlation between the health of the �nancial sector
and the business cycle. The unfolding of the Great Recession in the United States exempli�es the
empirical challenge. The housing market crisis forced banks to reduce their loan supply (Ivashina
and Scharfstein (2010)). At the same time, it led to a fall in aggregate demand (Mian and Su�
(2014b)), higher uncertainty (Baker et al. (2013)), and a sovereign debt rating downgrade. Since
there was no housing, sovereign debt, or other domestic crisis in Germany leading up to the Great
Recession, the lending cut provides a natural experiment to disentangle the causal impact of bank
lending.2
In a previous recession, counties dependent on Commerzbank grew faster, probably because
Commerzbank selectively expanded to economically resilient counties (Klein (1993)). This suggests
that during recessions there may be a positive correlation between county Commerzbank depend-
1Commerzbank refers to all branches that were part of the Commerzbank AG in 2009, including Dresdner Bank.2See �gure 4 for GDP and �gure 5 for house prices.
2
ence and growth, which would attenuate the OLS estimates. I employ an instrumental variable
to overcome this problem. The instrument is based on the enforced break-up of Commerzbank by
the Allied occupation forces after World War II. This led Commerzbank to set up three separate,
temporary head o�ces, in Duesseldorf, Frankfurt, and Hamburg. These cities were chosen through
a combination of historic accident and power struggles among the Allies, rather than the bank's
business considerations.
Banks tend to form relationships with geographically close customers (Guiso et al. (2004); De-
gryse and Ongena (2005); Mian (2006)). Using historic records, I show that Commerzbank expanded
its branch network around its temporary head o�ces in the post-war period. The association between
proximity to a post-war head o�ce and Commerzbank dependence survived until 2006. I can thus
use a county's distance to the closest of Commerzbank's post-war head o�ces as instrument for
Commerzbank dependence before the banking crisis. To address concerns that proximity to certain
cities biases the results, I control for the linear distances to Duesseldorf, Frankfurt, Hamburg, Berlin,
and Dresden, as well as a range of economic, demographic, and geographic factors in the regressions.
Controlling for the linear distances does not raise an econometric collinearity problem, because the
instrument is a nonlinear function (the minimum) of the linear distances to the three post-war
head o�ces. To my knowledge, this is the �rst paper to use a nonlinear distance instrument, while
simultaneously controlling for linear distances to avoid spurious correlations.
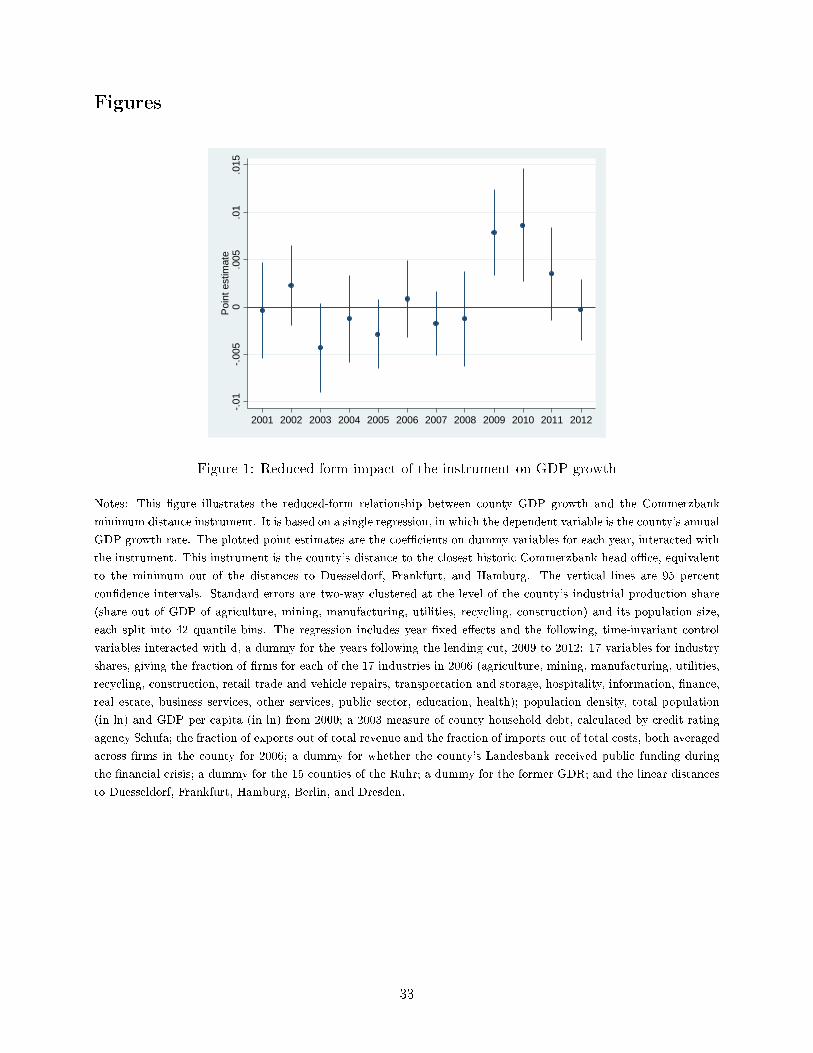
Figure 1 shows how the lending cut a�ected GDP growth over time. For two years, a�ected
counties grew more slowly. Thereafter, the growth rates were similar, which means a�ected counties
remained on a lower, parallel trend after bank loan supply had been restored. These dynamics
resemble the development of the United States economy during and after the Great Recession, and
suggest a role for the banking crisis 2008/09 in explaining the sluggish recovery.
Standard growth theory implies the e�ects of a temporary lending cut should be transitory
(Hall (2010); Fernald and Jones (2014)). But if total factor productivity is a�ected, the losses can
be permanent, as in models by Aghion et al. (2010) and Benigno and Fornaro (2015). Back-of-
the-envelope growth accounting suggests that the lending cut indeed slowed productivity growth.
Overall, the lending cut lowered German GDP in 2012 by 3.9 percent, and employment by 2.3
percent. The instrumental variable estimate is larger than the OLS estimate, but not statistically
di�erent.
3
The instrumental variable exclusion restriction assumes that the minimum distance instrument
a�ects growth from 2009 to 2012 only through the lending cut, conditional on the linear distances to
the cities. I present a range of evidence supporting this assumption. First, Commerzbank's income
statements show that the lending cut was entirely due to losses in its trading portfolio. Interest
income, which includes what Commerzbank earns from lending to �rms and households, continued
to increase up to 2009. Second, in a survey, �rms dependent on Commerzbank report restrictive bank
loan supply in 2009, but not in 2003, 2006, and 2011. There is no di�erence in their reported product
demand in any year. Third, �gure 1 shows that there is no association between the instrument and
GDP growth before the lending cut. Fourth, the e�ect is not an artefact of large banks' customers
performing badly during the Great Recession. I carry out a county placebo experiment, for which
I construct an analogous minimum distance instrument for Deutsche Bank dependence. I �nd no
e�ect of Deutsche Bank dependence on growth.
Next, I turn to the e�ects of the lending cut on �rms. Figure 2 shows that the �rm dynamics
resemble the county e�ects. The lending cut lowered the employment growth rate at a�ected �rms
for two years. In 2011, �rms dependent on Commerzbank reported they are not credit constrained
anymore. Nevertheless, they remained on a lower, parallel trend for another two years, with no
convergence.
A large literature �nds that credit frictions reduced �rm short-run employment (Chodorow-Reich
(2014)) and �rm investment (Almeida et al. (2012)) during the 2008/09 �nancial crisis.3 I �nd that
the lending cut primarily a�ected �rms through their capital expenditures, and lowered the capital-
labour ratio. In line with a model of competitive factor markets, average wages and average labour
productivity remained constant, while the average product of capital rose. I do not instrument for
�rm Commerzbank dependence, because I use county �xed e�ects, and there is no evidence that,
within the same county, �rms dependent on Commerzbank grew more quickly in recessions.
A recent literature has documented that, across di�erent episodes of history, banking crises have
been correlated with recessions (Reinhart and Rogo� (2009); Schularick and Taylor (2012); Giesecke
et al. (2014); Romer and Romer (2015); Krishnamurthy and Muir (2015)). But, as Reinhart and
Rogo� (2009) note, there is no �de�nitive evidence on the causal e�ects.� The natural experiment
3Gan (2007); Khwaja and Mian (2008); Amiti and Weinstein (2011); Garicano and Steinwender (2013); Bentolilaet al. (2015); Paravisini et al. (2015) present further evidence.
4

literature has provided ambiguous evidence on the e�ects of banking crises. Rosengren and Peek
(2000) and Benmelech et al. (2011) �nd that the reduction in lending by Japanese banks in the
1990s a�ected the US construction sector and unemployment. Ashcraft (2005) shows the failure of
Texas bank branches reduced county income. Mondragon (2015) argues that shocks to household
credit lowered US employment from 2007 to 2010.
On the other hand, Driscoll (2004) and Ashcraft (2006) �nd that shocks to bank loan supply
have zero e�ect on output across US states. Greenstone et al. (2014) report only modest e�ects of
bank lending on county employment from 2007 to 2009. Mian and Su� (2014b) similarly argue that
business �nancing was not an important problem during the Great Recession, and �nd banking crises
unexceptional unless accompanied by �elevated levels of debt� (Mian and Su� (2014a)). Overall, the
literature has provided no evidence that bank lending causally and persistently a�ects GDP.
In addition to the literature on banking crises, this paper contributes to the literature on the
importance of a single �rm, in this case a bank, in shaping macroeconomic outcomes. Models by
Gabaix (2011), Acemoglu et al. (2012), and Baqaee (2015) show that idiosyncratic �rm shocks may
translate into large aggregate �uctuations, countering the traditional argument by Lucas (1977) that
microeconomic shocks average out in the aggregate.
It is a general problem in empirical work that well-identi�ed, partial equilibrium e�ects may not
be informative about the aggregate implications of a given policy or shock (Acemoglu (2010)). The
existing �rm literature on �nancial frictions has had to rely on strong assumptions to extrapolate the
aggregate e�ects of credit market imperfections. In the �nal section of the paper, I take advantage
of the fact that I estimate the e�ects of the lending cut on both �rms and counties. I calculate
the relative importance of �rm-level, partial equilibrium channels to the aggregate economy. The
results provide suggestive evidence that simply summing up the �rm-level, partial equilibrium e�ects
underestimates the aggregate consequences of bank lending.
This paper proceeds in the following section by describing the source of Commerzbank's lending
cut. Section 3 details the instrumental variable strategy. I describe the data in section 4, including a
unique dataset on pre-crisis �rm-bank relationships. Section 5 contains the model and the empirical
strategy; section 6 performs the county analysis; and section 7 reports the �rm analysis. Section 8
calculates the relative importance of the �rm-level, partial equilibrium e�ects. Section 9 concludes.
5
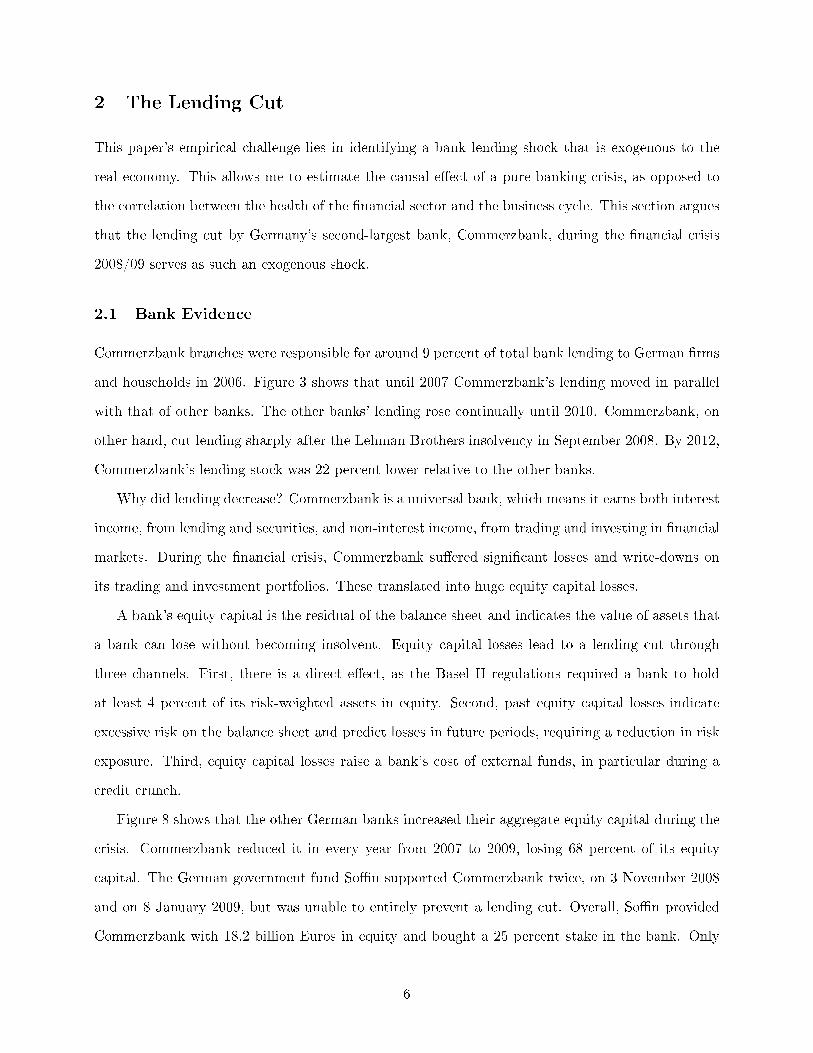
2 The Lending Cut
This paper's empirical challenge lies in identifying a bank lending shock that is exogenous to the
real economy. This allows me to estimate the causal e�ect of a pure banking crisis, as opposed to
the correlation between the health of the �nancial sector and the business cycle. This section argues
that the lending cut by Germany's second-largest bank, Commerzbank, during the �nancial crisis
2008/09 serves as such an exogenous shock.
2.1 Bank Evidence
Commerzbank branches were responsible for around 9 percent of total bank lending to German �rms
and households in 2006. Figure 3 shows that until 2007 Commerzbank's lending moved in parallel
with that of other banks. The other banks' lending rose continually until 2010. Commerzbank, on
other hand, cut lending sharply after the Lehman Brothers insolvency in September 2008. By 2012,
Commerzbank's lending stock was 22 percent lower relative to the other banks.
Why did lending decrease? Commerzbank is a universal bank, which means it earns both interest
income, from lending and securities, and non-interest income, from trading and investing in �nancial
markets. During the �nancial crisis, Commerzbank su�ered signi�cant losses and write-downs on
its trading and investment portfolios. These translated into huge equity capital losses.
A bank's equity capital is the residual of the balance sheet and indicates the value of assets that
a bank can lose without becoming insolvent. Equity capital losses lead to a lending cut through
three channels. First, there is a direct e�ect, as the Basel II regulations required a bank to hold
at least 4 percent of its risk-weighted assets in equity. Second, past equity capital losses indicate
excessive risk on the balance sheet and predict losses in future periods, requiring a reduction in risk
exposure. Third, equity capital losses raise a bank's cost of external funds, in particular during a
credit crunch.
Figure 8 shows that the other German banks increased their aggregate equity capital during the
crisis. Commerzbank reduced it in every year from 2007 to 2009, losing 68 percent of its equity
capital. The German government fund So�n supported Commerzbank twice, on 3 November 2008
and on 8 January 2009, but was unable to entirely prevent a lending cut. Overall, So�n provided
Commerzbank with 18.2 billion Euros in equity and bought a 25 percent stake in the bank. Only
6
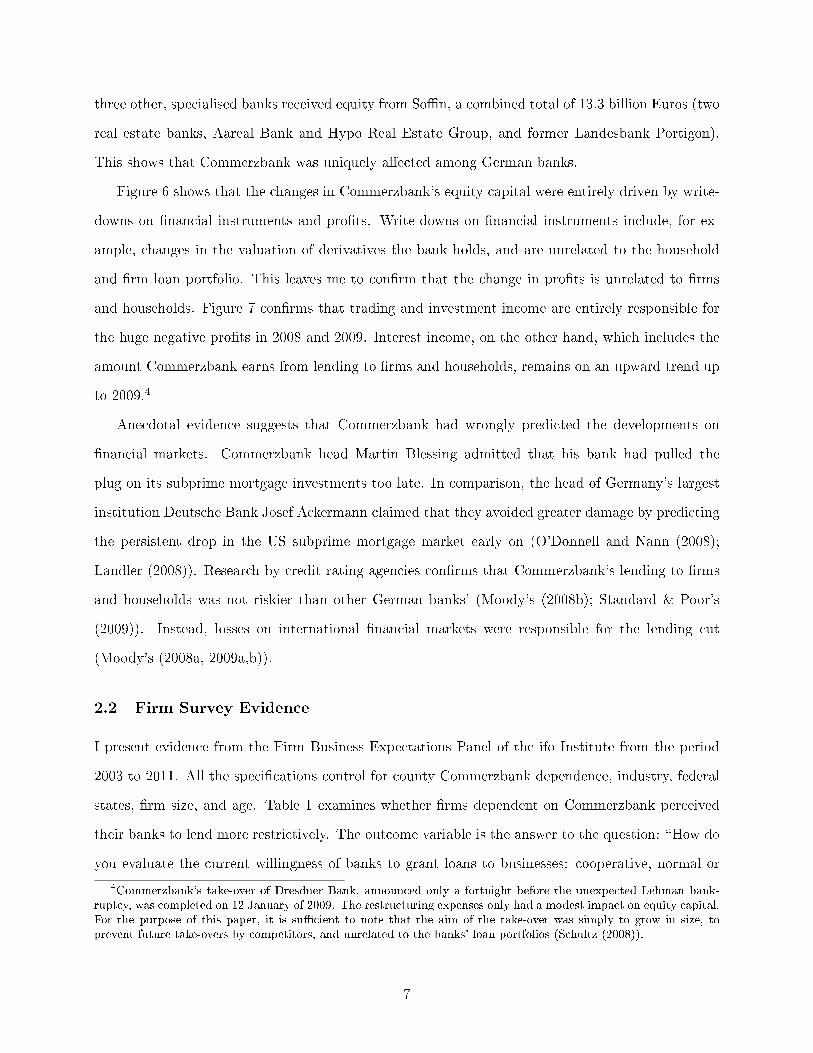
three other, specialised banks received equity from So�n, a combined total of 13.3 billion Euros (two
real estate banks, Aareal Bank and Hypo Real Estate Group, and former Landesbank Portigon).
This shows that Commerzbank was uniquely a�ected among German banks.
Figure 6 shows that the changes in Commerzbank's equity capital were entirely driven by write-
downs on �nancial instruments and pro�ts. Write-downs on �nancial instruments include, for ex-
ample, changes in the valuation of derivatives the bank holds, and are unrelated to the household
and �rm loan portfolio. This leaves me to con�rm that the change in pro�ts is unrelated to �rms
and households. Figure 7 con�rms that trading and investment income are entirely responsible for
the huge negative pro�ts in 2008 and 2009. Interest income, on the other hand, which includes the
amount Commerzbank earns from lending to �rms and households, remains on an upward trend up
to 2009.4
Anecdotal evidence suggests that Commerzbank had wrongly predicted the developments on
�nancial markets. Commerzbank head Martin Blessing admitted that his bank had pulled the
plug on its subprime mortgage investments too late. In comparison, the head of Germany's largest
institution Deutsche Bank Josef Ackermann claimed that they avoided greater damage by predicting
the persistent drop in the US subprime mortgage market early on (O'Donnell and Nann (2008);
Landler (2008)). Research by credit rating agencies con�rms that Commerzbank's lending to �rms
and households was not riskier than other German banks' (Moody's (2008b); Standard & Poor's
(2009)). Instead, losses on international �nancial markets were responsible for the lending cut
(Moody's (2008a, 2009a,b)).
2.2 Firm Survey Evidence
I present evidence from the Firm Business Expectations Panel of the ifo Institute from the period
2003 to 2011. All the speci�cations control for county Commerzbank dependence, industry, federal
states, �rm size, and age. Table 1 examines whether �rms dependent on Commerzbank perceived
their banks to lend more restrictively. The outcome variable is the answer to the question: �How do
you evaluate the current willingness of banks to grant loans to businesses: cooperative, normal or
4Commerzbank's take-over of Dresdner Bank, announced only a fortnight before the unexpected Lehman bank-ruptcy, was completed on 12 January of 2009. The restructuring expenses only had a modest impact on equity capital.For the purpose of this paper, it is su�cient to note that the aim of the take-over was simply to grow in size, toprevent future take-overs by competitors, and unrelated to the banks' loan portfolios (Schultz (2008)).
7

restrictive?� The lower its value, the more restrictive the �rm perceives bank loan supply to be. The
regressor of interest is Commb dep, the fraction of bank relationships with Commerzbank branches
in the year 2006.5
The coe�cient on Commb dep in column (3) has the interpretation that in 2009 a �rm fully
dependent on Commerzbank perceived its banks to be 0.39 standard deviations less willing to grant
loans, compared to a �rm with no Commerzbank relationship. The estimate is statistically signi�cant
at the 5% level. The lagged dependent variable from 2006 has coe�cient of similar magnitude to
Commb dep. This suggests that that the e�ect of Commerzbank dependence is sizeable, because it
is qualitatively similar to the role that time-invariant factors play in explaining bank loan supply.
Columns (4) to (6) show there is no signi�cant association between Commerzbank dependence
and bank loan supply in 2006 and 2003. In fact, the point estimate is always small and positive,
which, if signi�cant, would imply that �rms dependent on Commerzbank faced slightly easier access
to bank loans. The estimates also imply that Commerzbank's lending was not more cyclical, as in
2006 Germany experienced a boom and in 2003 a recession.
Column (1) reports that in 2011, pre-crisis Commerzbank dependence was no longer associated
with di�erences in bank loan supply. The point estimate is essentially zero. This implies that the
lending cut only led to temporary credit constraints. After two years, �rms were able to substitute
other lenders for Commerzbank.
Table 2 �nds that �rms dependent on Commerzbank did not face lower product demand than
other �rms at any point between 2003 and 2011, controlling for county Commerzbank dependence.
The coe�cient on Commb dep is insigni�cant in all years between 2003 and 2011, and the point
estimates are of small magnitude. For example, the (statistically insigni�cant) estimate in column (3)
implies that in 2009, a �rm fully dependent on Commerzbank perceived product demand to be 0.09
standard deviations higher than a �rm with no Commerzbank relationship. This is evidence against
the view that reverse causality from Commerzbank's corporate loan portfolio led to its income losses.
Overall, the survey suggests that �rms dependent on Commerzbank faced a temporary lending cut
in 2009, but that there were no di�erential demand shocks.
5See section 4 for the construction of the variable Commb dep.
8
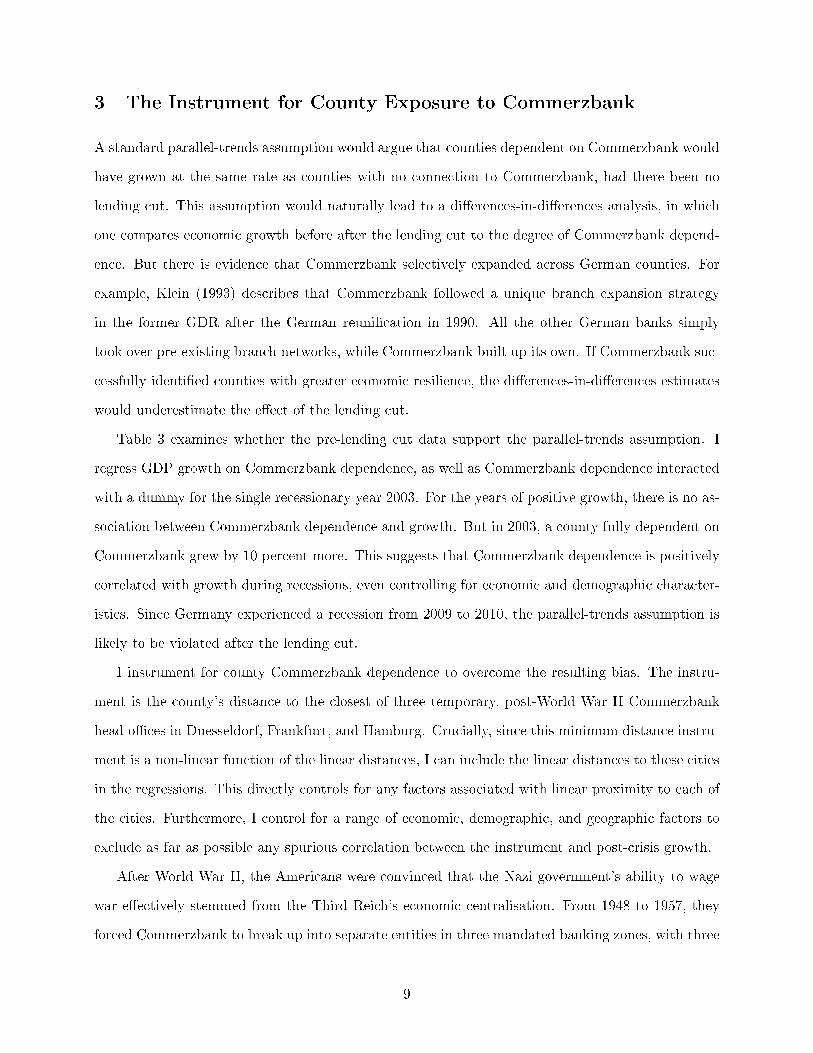
3 The Instrument for County Exposure to Commerzbank
A standard parallel-trends assumption would argue that counties dependent on Commerzbank would
have grown at the same rate as counties with no connection to Commerzbank, had there been no
lending cut. This assumption would naturally lead to a di�erences-in-di�erences analysis, in which
one compares economic growth before after the lending cut to the degree of Commerzbank depend-
ence. But there is evidence that Commerzbank selectively expanded across German counties. For
example, Klein (1993) describes that Commerzbank followed a unique branch expansion strategy
in the former GDR after the German reuni�cation in 1990. All the other German banks simply
took over pre-existing branch networks, while Commerzbank built up its own. If Commerzbank suc-
cessfully identi�ed counties with greater economic resilience, the di�erences-in-di�erences estimates
would underestimate the e�ect of the lending cut.
Table 3 examines whether the pre-lending cut data support the parallel-trends assumption. I
regress GDP growth on Commerzbank dependence, as well as Commerzbank dependence interacted
with a dummy for the single recessionary year 2003. For the years of positive growth, there is no as-
sociation between Commerzbank dependence and growth. But in 2003, a county fully dependent on
Commerzbank grew by 10 percent more. This suggests that Commerzbank dependence is positively
correlated with growth during recessions, even controlling for economic and demographic character-
istics. Since Germany experienced a recession from 2009 to 2010, the parallel-trends assumption is
likely to be violated after the lending cut.
I instrument for county Commerzbank dependence to overcome the resulting bias. The instru-
ment is the county's distance to the closest of three temporary, post-World War II Commerzbank
head o�ces in Duesseldorf, Frankfurt, and Hamburg. Crucially, since this minimum distance instru-
ment is a non-linear function of the linear distances, I can include the linear distances to these cities
in the regressions. This directly controls for any factors associated with linear proximity to each of
the cities. Furthermore, I control for a range of economic, demographic, and geographic factors to
exclude as far as possible any spurious correlation between the instrument and post-crisis growth.
After World War II, the Americans were convinced that the Nazi government's ability to wage
war e�ectively stemmed from the Third Reich's economic centralisation. From 1948 to 1957, they
forced Commerzbank to break up into separate entities in three mandated banking zones, with three
9

separate head o�ces in Duesseldorf, Frankfurt, and Hamburg.6
These cities were chosen due to a combination of historic accident and power struggles among
the Allies, rather than the bank's business considerations. In the �rst banking zone, North-Rhine
Westphalia, the British declared Duesseldorf as the state capital, because it was the only city with a
large building that had survived the war (Düwell (2006)). The banks followed the political power and
settled there. In the second, Northern zone, the British ordered the surviving and non-imprisoned
board members of Commerzbank and Dresdner Bank to set up a central head o�ce in Hamburg.
Frankfurt was chosen as head o�ce for the Southern zone because the Americans had placed the
new central bank there. At the time, Frankfurt was far from its contemporaneous role as Germany's
�nancial centre, but it was chosen for its central location (Horstmann (1991)).7
The literature has established that banks prefer to form relationships with geographically close
customers (Guiso et al. (2004); Degryse and Ongena (2005); Mian (2006)). Table 4 analyses the
e�ect of Commerzbank's relocation to Duesseldorf, Frankfurt, and Hamburg on the location of its
branches, controlling for demographic and economic factors. Columns (1) and (2) show that from
1948 to 1970 Commerzbank was signi�cantly more likely to establish a new branch in counties close
to its new head o�ces. This �nding is con�rmed when looking at the number of branches that were
newly set up in column (3). Column (4) shows that there is no signi�cant relationship between the
establishment of a branch from 1925 to 1948 and the distance to the post-war head o�ce. Column
(5) shows that there is also no association between this distance and the likelihood that a county
had a Commerzbank branch in 1925. Taken together, this evidence suggests that the move to the
post-war head o�ces prompted Commerzbank to set up branches in counties close by.
As I show in table 8, this association survived until 2006. There is a robust �rst-stage relationship
between the instrument and county Commerzbank dependence in 2006. The map in �gure 10
con�rms this visually.
6The former capital Berlin was in the Soviet sector, where commercial banking was forbidden. A temporary state-level break-up between 1948 and 1951 was too short-lived to lead to the creation of signi�cant head o�ces in eachstate.
7Deutsche Bank based its Southern head o�ce in the Bavarian capital Munich - a fact I use for a placebo experiment(Horstmann (1991)).
10
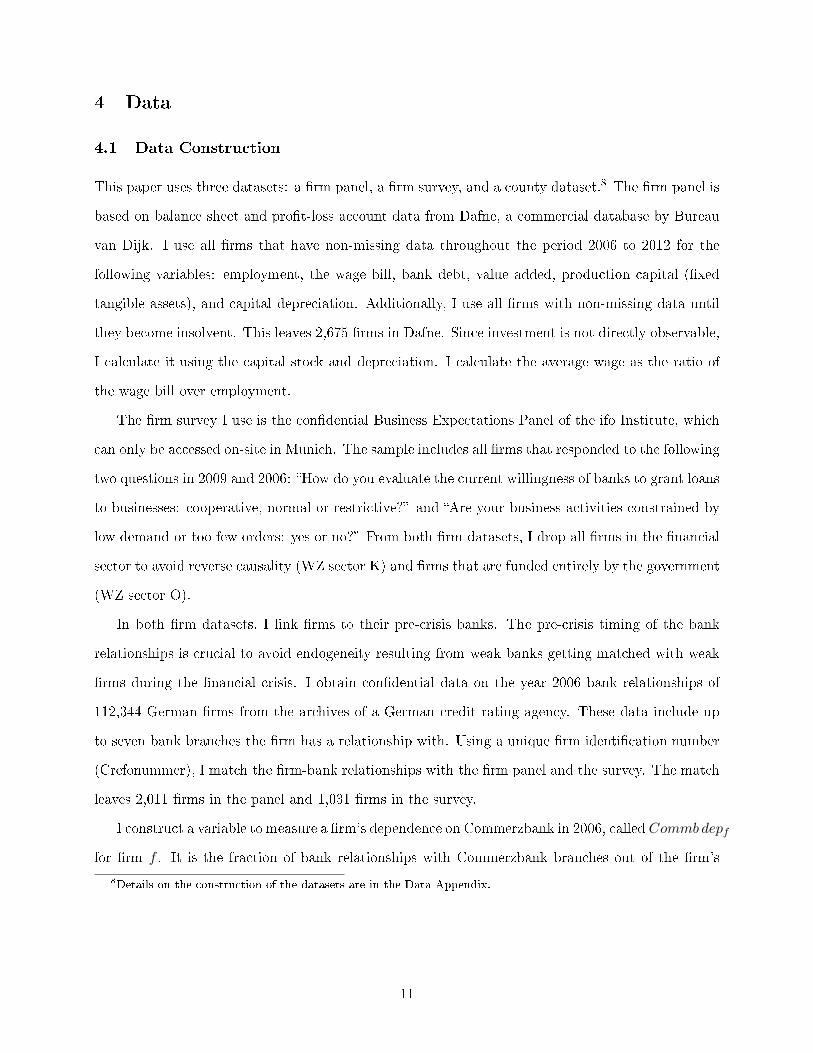
4 Data
4.1 Data Construction
This paper uses three datasets: a �rm panel, a �rm survey, and a county dataset.8 The �rm panel is
based on balance sheet and pro�t-loss account data from Dafne, a commercial database by Bureau
van Dijk. I use all �rms that have non-missing data throughout the period 2006 to 2012 for the
following variables: employment, the wage bill, bank debt, value added, production capital (�xed
tangible assets), and capital depreciation. Additionally, I use all �rms with non-missing data until
they become insolvent. This leaves 2,675 �rms in Dafne. Since investment is not directly observable,
I calculate it using the capital stock and depreciation. I calculate the average wage as the ratio of
the wage bill over employment.
The �rm survey I use is the con�dential Business Expectations Panel of the ifo Institute, which
can only be accessed on-site in Munich. The sample includes all �rms that responded to the following
two questions in 2009 and 2006: �How do you evaluate the current willingness of banks to grant loans
to businesses: cooperative, normal or restrictive?� and �Are your business activities constrained by
low demand or too few orders: yes or no?� From both �rm datasets, I drop all �rms in the �nancial
sector to avoid reverse causality (WZ sector K) and �rms that are funded entirely by the government
(WZ sector O).
In both �rm datasets, I link �rms to their pre-crisis banks. The pre-crisis timing of the bank
relationships is crucial to avoid endogeneity resulting from weak banks getting matched with weak
�rms during the �nancial crisis. I obtain con�dential data on the year 2006 bank relationships of
112,344 German �rms from the archives of a German credit rating agency. These data include up
to seven bank branches the �rm has a relationship with. Using a unique �rm identi�cation number
(Crefonummer), I match the �rm-bank relationships with the �rm panel and the survey. The match
leaves 2,011 �rms in the panel and 1,031 �rms in the survey.
I construct a variable to measure a �rm's dependence on Commerzbank in 2006, called Commbdepf
for �rm f . It is the fraction of bank relationships with Commerzbank branches out of the �rm's
8Details on the construction of the datasets are in the Data Appendix.
11

total number of bank relationships, as given in equation 1.9
Commb depf =number of bank relationships toCommerzbank branchesf
total number of bank relationshipsf(1)
In addition to the �rm datasets, I construct a county panel from 2000 to 2012. It contains
data on GDP and employment from the German Statistical Federal O�ce.10 I calculate a county's
dependence on Commerzbank in 2006 as the average value of Commb depf for �rms with their head
o�ce in the county, using all 112,344 �rms in the bank relationships dataset. I call this measure
(Commb dep)c for county c.11
The instrument for county Commerzbank dependence is based on the county's distance to the
closest of the three Commerzbank post-war head o�ces in Duesseldorf, Frankfurt, and Hamburg.
For each �rm with available pre-crisis bank data, I measure the geodesic distance (as the crow �ies)
between the postcode of the �rm and the post-war head o�ces. I then average this measure across all
�rms in a county to get the distance between the county and each of the three post-war head o�ces.
This method is preferable to simply using the county's geographical centre because the location of
�rms approximates the centre of economic activity. The instrument is given by the minimum of the
three distances, as in equation 2.
Commb min dist instrumentc =
min (Dist toDuesseldorfc, Dist to Frankfurtc, Dist toHamburgc) (2)
4.2 Summary Statistics
Table 5 summarises the �rm panel dataset, and �gure 9 plots a histogram of Commb dep. The data
reveal the high bank dependence of German �rms in 2007. For the average �rm in the panel, bank
debt amounts to 49 percent of liabilities, while liabilities account for 66 percent of total assets. This
9Alternatively, one could measure exposure to Commerzbank using a dummy for a relationship to Commerzbank.The results are in line with using Commbdepf .
10Germany has 402 counties, the dataset contains 385. I drop 17 counties, for which the Statistical Federal O�cedoes not provide data for the pre-crisis years. The results remain unchanged, when I include these counties intoanalyses for the years with data for all counties. The Bundesbank does not provide data on the lending share ofindividual banks at the county level.
11It is not advisable to weight this measure by the number of bank relationships or the size of each �rm, since thereis no reason to believe that large �rms' bank dependence matters more for the county.
12

is consistent with aggregate statistics on the �nancial structure of German �rms. Schwartz (2014)
reports that 36 percent of investment at small and medium �rms (with less than 500 million Euro
revenue) was �nanced through bank debt. For �rms with less than 50 million Euro in revenue, bank
debt is 40 percent of liabilities, while liabilities compose 70 percent of assets (Bundesbank (2015)).
Table 6 analyses whether Commerzbank's corporate customers systemically di�ered from other
�rms before the crisis. I regress �rm Commerzbank dependence (Commb dep) on a cross-section of
�rm observables from 2007. The coe�cients have the interpretation of the approximate change in
Commb dep following a 100 percent increase in the regressor. Only the coe�cient on ln capital has
a coe�cient that is statistically signi�cantly di�erent from zero. The estimate implies that a 100
percent increase in the capital stock is associated with a 0.014 decrease in Commb dep. Conversely,
the estimate on employment implies that a 100 percent increase in the number of workers leads to a
0.008 increase in Commb dep. I therefore conclude that, in the �rm panel, there are no economically
meaningful di�erences between �rms dependent on Commerzbank and other �rms. Table 7 presents
summary statistics for the county panel.
5 Model and Empirical Implementation
5.1 Model
I present a three-period model of a �rm that uses bank debt to �nance capital investment. Period
1 is analogous to the years 2009/10, during which credit constraints a�ected �rms dependent on
Commerzbank. Periods 2 and 3 are the years 2011 and 2012, during which credit constraints had
been overcome.
The �rm's concave production function in each period t is ztf(kt, nt), where kt is production
capital and nt is employment. zt is a parameter that captures the output price and productivity,
both exogenous to the �rm. Capital needs to be installed one period before it can be used. Labour
gets paid out of contemporaneous pro�ts at wage wt.
The �rm chooses the amount of bank debt et it takes out in period t, which needs to be repaid in
period t+1 at price R(st). st is the loan supply of the �rm's relationship banks. A reduction in loan
supply raises the �rm's cost of bank debt because information frictions in �nancial markets make
it costly to �nd new lenders (Sharpe (1990); Chodorow-Reich (2014)). I allow for adjustment costs
13
to capital, given by the convex function χ(kt − kt−1). These costs stem from adjusting the capital
stock from one period to the next, such as from identifying investment opportunities or training the
workforce (Lucas (1967)).
The �rm's objective is to maximise period 3 pro�ts (equation 3), after which the model ends.
π3 = z3f(k3, n3)− w3n3 −R(s2)e2 − χ(k3 − k2) (3)
For simplicity, I assume full depreciation and that the �rm starts period 1 with no capital (k1 = 0).
That means all period 2 capital is paid using bank debt (k2 = e1). To �nance period 3 capital, the
�rm uses both bank debt and period 2 pro�ts (equation 4).
k3 = π2 + e2 = z2f(k2, n2)− w2n2 −R(s1)e1 − χ(k2) + e2 (4)
Optimal employment is given by the standard equality of the wage to the marginal product of labour
(equation 5).12
ztf2(kt, nt) = wt (5)
Solving backwards, in period 3, the marginal product of capital equals the price of bank debt plus
the marginal adjustment cost (equation 6). In period 2, there is an additional term, the ratio of
the marginal adjustment cost to the marginal product of capital (equation 7). Using equation 6, we
know this is strictly below 1, and greater than or equal to zero. The intuition is that lowering the
adjustment costs in period 3 adds an additional bene�t to higher period 2 capital.
z3f1(k3, n3) = R(s2) + χ1(k3 − k2) (6)
z2f1(k2, n2) = R(s1) + χ1(k2)−
θ
1− θ(7)
First, consider �rms that borrow from Commerzbank. A temporary shock to loan supply in
period 1 lowers s1, but leaves s2 una�ected. This raises R(s1), the price of period 2 capital. Period
2 capital and labour fall, since they are complements. The marginal product of capital rises with
12A superscript on a function indicates its derivative with respect to the argument whose number is given in thesuperscript. A subscript indicates the period.
14

the price of capital. The wage is determined exogenously, so the marginal product of labour remains
constant. Since the relative price of capital increases, the capital-employment ratio falls. The capital-
employment ratio remains low in period 3 if the marginal adjustment cost of capital is positive
Consider next the general e�ect of the Commerzbank lending cut on all �rms in an economy, not
just those dependent to Commerzbank. The general e�ect is driven by a number of channels, all of
which a�ect the output price or general productivity, i.e. z2 and z3. These channels are that product
demand shifts from constrained to unconstrained �rms (Chodorow-Reich (2014)); aggregate demand
falls due to household credit constraints and employment losses at �rms dependent on Commerzbank
(Mondragon (2015)); general uncertainty rises when an important bank cuts lending (Baker et al.
(2013)); cascade e�ects, stemming from input-output linkages, amplify the shocks (Acemoglu et
al. (2012); Baqaee (2015)); lower investment into research and development reduces total factor
productivity and technology spill-overs (Aghion et al. (2010); Bloom et al. (2013); Benigno and
Fornaro (2015)). The general channels do not a�ect the relative price of capital and thus do not
change the capital-labour ratio.
5.2 Empirical Implementation
The model describes that the lending cut a�ects a �rm through two e�ects. Equation 8 captures
both e�ects in a �rm panel speci�cation, for an outcome yi,c,t at �rm i in county c at time t.
First, there is the �rm-level, partial equilibrium e�ect. This e�ect is captured by the coe�cient
β. Firms dependent on Commerzbank experience a shock to their loan supply following the lending
cut. Therefore, I identify an exogenous shock to �rm loan supply using variation across �rms in
Commerzbank dependence, interacted with interacted with dt, a dummy for the years following the
lending cut, 2009 to 2012.
Second, there is an e�ect of the lending cut on all �rms, through the general channels described
above. It is captured by the coe�cient ρ. I identify this e�ect using variation in Commerzbank
dependence across counties, where the measure (Commb dep)c is the average Commerzbank de-
pendence of �rms in county c. Xi,c is a vector of time-invariant control variables, again interacted
with dt. γi,c is a �rm �xed e�ect, λt a year �xed e�ect.
yi,c,t = α+ β (Commb dep)i,c ∗ dt + ρ (Commb dep)c ∗ dt + Γ′Xi,c ∗ dt + γi,c + λt + εi,c,t (8)
15

The county analysis in section 6 estimates the aggregate impact of a lending cut, and therefore
the joint impact of β and ρ. By averaging equation 8 over all �rms in a county, one obtains equation
9. This shows the relationship between county outcomes and Commerzbank dependence.
yc,t = α+ (β + ρ) (Commb dep)c ∗ dt + Γ′Xc ∗ dt + γc + λt + εc,t (9)
The �rm analysis in section 7 is concerned with the �rm-level, partial equilibrium e�ect, and hence
estimates β. For the �rm speci�cations, I adapt equation 8 by including county �xed e�ects, which
gives equation 10. This means I only compare �rms within the same county, keeping constant any
county-speci�c shocks and the general e�ect of the lending cut.
yi,c,t = α+ β (Commb dep)i,c ∗ dt + κc ∗ dt + Γ′Xi,c ∗ dt + γi,c + λt + εi,c,t (10)
6 E�ects on Counties
This section exploits variation in Commerzbank dependence across counties to estimate the impact
of a lending cut on county GDP and employment. Figure 1 summarises the �ndings. It plots the
coe�cients and 95 percent con�dence intervals from a regression of the GDP growth rate on the
county minimum distance instrument, interacted with annual dummies. The speci�cation can be
interpreted as the instrumental variable reduced-form speci�cation. It includes the full set of controls
described below.
The �gure shows that only in the years 2009 and 2010 was there a positive association between the
instrument and GDP growth. This means that counties further from the historic head o�ces, with
lower Commerzbank dependence, grew faster during the years of the lending cut. In 2011 and 2012,
the growth rates were once again similar. Recall that �rms dependent on Commerzbank reported
restrictive bank loan supply in 2009, but not in 2011. This means that after credit constraints had
been overcome, GDP remained on a lower, parallel trend. There is no convergence to the pre-crisis
levels and the temporary lending cut has persistently reduced GDP.
16

6.1 County Speci�cation
I estimate equation 9 using county ln GDP and ln employment as outcomes. The following, time-
invariant control variables are all interacted with dummy dt. There are 17 variables for the industry
shares, giving the fraction of �rms in each each of the 17 industries in 2006.13 Population density,
ln total population, and ln GDP per capita are from 2000. Debt index is a 2003 measure of county
household debt, calculated by credit rating agency Schufa, based on credit data of practically the
entire German adult population. The export share is the fraction of exports out of total revenue
and the import share is the fraction of imports out of total costs, both averaged across �rms in
the county. Landesbank in crisis is a dummy for whether the county's Landesbank received state
funding during the �nancial crisis (Puri et al. (2011)).14
I run both OLS and instrumental variable speci�cations. The use of the instrument is motivated
by the �ndings in table 3 that suggest the parallel-trends assumption fails during recessions. I
instrument for Commb depc using Commb min dist instrumentc, the distance to the closest of
Commerzbank's post-war head o�ces. I control for the linear distances to Duesseldorf, Frankfurt,
Hamburg, Berlin, and Dresden, interacted with dt, in all instrumental variable speci�cations. Berlin
and Dresden are included because previous head o�ces of Commerzbank were located there.
Table 8 reports the �rst stage. It shows that a one standard deviation increase in distance to
the historic head o�ces (0.97) leads to a decrease in Commerzbank dependence by about half a
standard deviation (0.03), a sizeable e�ect. The instrument is strong, with a t-statistic of 5.33 in
the speci�cation with all the controls.
To calculate the standard errors, I split the counties into 42 evenly-sized quantile bins for their
industrial production share in 2000 (share out of GDP of agriculture, mining, manufacturing, util-
ities, recycling, construction). Similarly, I split the counties into 42 evenly-sized quantile bins for
their population size. The standard errors are two-way clustered at the level of these two bins. This
is a more general method than clustering at the level of the county. It simultaneously allows for
arbitrary correlations across time for counties with similar industrial structure and similar size.15
13The industries are based on the WZ2008 classi�cation: agriculture, mining, manufacturing, utilities, recycling,construction, retail trade and vehicle repairs, transportation and storage, hospitality, information, �nance, real estate,business services, other services, public sector, education, health.
14The e�ects could also be estimated using a cross-section in �rst di�erences. The results are very similar. Thepanel is preferable because it uses all the available years of data.
15See Angrist and Pischke (2009), page 238, on the choice of 42 bins.
17

6.2 County Results
Table 9 presents the results of the OLS speci�cations. The coe�cient on Commb dep*d, scaled by
100, has the interpretation of the average post-lending cut percentage di�erence in GDP between a
county fully dependent on Commerzbank (Commb dep equal to one) and a county with no Com-
merzbank relationships (Comm dep equal to zero).
The coe�cient in column (1) estimates that a one standard deviation increase in Commerzbank
dependence lowered county GDP by an average of 1.03 percent during the period 2009 to 2012. The
95 percent con�dence interval places the estimated GDP drop between 0.43 and 1.63 percent. This
is an economically large e�ect, and suggests the lending cut had strong e�ects on output growth.
The subsequent columns add control variables. The addition of industry shares in column (2) hardly
a�ects the point estimate and raises the standard error only slightly. Controlling for the county's
population, population density, GDP per capita, and the household debt index in column (3) lowers
the coe�cient slightly to -0.141, but does not a�ect its economic and statistical signi�cance. In
column (4), taking into account the health of the state's Landesbank and the export and import
share does not change the coe�cient at all. This suggests that the previous controls for economic
and demographic factors account for the relevant cross-county variation.
Table 10 presents the results of the instrumental variable speci�cations. The point estimates are
larger, but statistically indistinguishable from the OLS estimates. The point estimate in column
(1) suggests that a standard deviation increase in Commerzbank dependence lowered county GDP
by an average of 2.01 percent. The 95 percent con�dence interval is between 0.76 percent and 3.26
percent. Adding the control variables does not signi�cantly a�ect the instrumental variable point
estimates. This strengthens the argument that controlling for the linear distances removes most of
the spurious correlation between Commerzbank dependence and the instrument.
I use the county estimates to calculate the output loss to the German economy due to the Com-
merzbank lending cut.16 I calculate �tted values for county GDP using the instrumental variable
estimates. I also calculate counterfactual values, assuming there is no e�ect of Commerzbank de-
pendence on GDP growth. Last, I sum the �tted and counterfactual values for the year 2012 over all
counties, and subtract the counterfactual sum from the �tted sum. The instrumental variable point
16Section 8 describes the calculation exercise in detail.
18

estimate suggest that in 2012, German GDP was 3.94 percent lower because of the lending cut.
The employment results in table 11 have a similar �avour to the GDP results. In general, the
employment point estimates are lower than the GDP point estimates. This suggests that the lending
cut reduced output per worker. The OLS coe�cient in column (3) estimates that a one standard
deviation increase in Commerzbank dependence lowered county employment by an average of 0.76
percent during the period 2009 to 2012. The instrumental variable point estimate places the e�ect
at 1.15, with a 95 percent con�dence interval between 0.07 and 2.23. I use the instrumental variable
point estimate to calculate that the total 2012 employment shortfall due to the Commerzbank
lending cut was 2.26 percent, using the methodology described for GDP above.17
Back-of-the-envelope growth accounting sheds light on the e�ects of the lending cut on total
factor productivity (TFP). Assume aggregate output Y = AF (K,L), where A is TFP, F is a concave
production function, K is capital, and L is labour. With competitive factor markets, TFP growth
(gTFP ) is a weighted average of the growth of output per worker and the growth of output per unit
of capital. The weights are the respective factor shares αL and αK (equation 11). Karabarbounis
and Neiman (2014) estimate αL ≈ 0.6 for Germany.
gTFP = αL(gY − gL) + αK(gY − gK) (11)
I need to make two important simplifying assumptions for a meaningful calculation. First, I take
the county point estimates at face value. Subtracting the employment point estimate from the GDP
point estimate implies that the lending cut reduced aggregate output per worker by 1.68 percent.
Second, the capital stock is unobservable at the county level, so I need to make an educated guess
on the growth of capital per worker. The �rm results show that the partial equilibrium e�ect of the
lending cut reduced the capital-labour ratio at �rms by 7.7 percent (table 14). The model predicts
that the general e�ect of the lending cut will not a�ect the capital-labour ratio. I therefore weight
7.7 percent by the average fraction of bank relationships with Commerzbank, which is 0.16. This
calculation suggests that the aggregate capital-labour ratio fell by 1.23 percent, and output per unit
of capital fell by 1.02 percent.
17The German government's short-time work scheme does not signi�cantly a�ect this calculation. Firms could onlyclaim subsidies for a maximum of two years, and the level of short-time workers was back to its pre-crisis value in2011 (Fujita and Gartner (2014)). Burda and Hunt (2011) show that short-time work had a very small overall impacton the German labour market in the Great Recession.
19
Plugging these numbers into equation 11, I calculate that the lending cut reduced TFP by 1.42
percent. This drop in productivity would explain why a�ected counties do not converge after credit
constraints have been overcome. While the concavity of the aggregate production function implies
that shocks to capital do not lead to persistent output losses, there is no such mechanism that
guarantees TFP shortfalls will ever be made up.
6.3 Further County Speci�cations
Table 12 presents the results of additional county speci�cations. Columns (1) and (2) report the
results of a placebo experiment, which estimates the e�ect of Deutsche Bank dependence on GDP
growth. DtB dep and the instrument are de�ned analogously to Commb dep, as the average fraction
of bank relationships with Deutsche Bank branches for �rms in the county in 2006. The instrument
for DtB dep is the county's distance to the closest historic Deutsche Bank head o�ce, interacted
with d. This distance is equivalent to the minimum out of the distances to Duesseldorf, Munich, and
Hamburg for Deutsche Bank. Column (1) shows that there is a strong �rst stage (t-statistic of 7.0),
while column (2) estimates an insigni�cant and positive coe�cient of Deutsche Bank dependence.
Therefore, there is no e�ect of large bank dependence. The Commerzbank estimates are driven by
the Commerzbank lending cut.
Column (3) adds a dummy for the Ruhr region, interacted with d, to the speci�cation. The
Ruhr is an area of �fteen counties that has traditionally been dominated by heavy industry. It is
located about 50 kilometres north of Duesseldorf and therefore has relatively high Commerzbank
dependence. One may worry that this leads to spurious correlation between the instrument and
economic growth. The point estimate implies a slightly larger e�ect, but it remains well within the
con�dence intervals of the previous estimates.
Inspecting �gure 10, one may worry that the e�ect of Commerzbank is driven solely by the fact
that Commerzbank dependence is lower in the Southern states Bavaria and Baden-Wuerttemberg.
Alternatively, one may worry that Commerzbank dependence in North Rhine-Westphalia drives the
e�ect, which is the largest and most densely populated state. Columns (4) to (6) subsequently
add dummies to control for di�erential developments in these states following the crisis. The point
estimates remain signi�cant and of similar magnitude.
20

7 E�ects on Firms
This section uses �rms' Commerzbank dependence to identify exogenous variation in �rm bank loan
supply. The main �ndings of this section are well summarised by �gure 2. Employment at �rms
with a Commerzbank relationship develops in parallel to other �rms before the crisis. Following
the lending cut, they experience lower employment growth for two years. From 2011 onwards, �rms
dependent on Commerzbank report that their bank loan supply has returned to normal. Standard
theory predicts that �rms should return to the employment and capital levels of una�ected �rms.
Nevertheless, they remain on a lower, parallel trend.
7.1 Firm Speci�cation
The �rm analysis in this section estimates equation 10. As outcome variables yi,c,t, I use the ln of
bank debt, employment, capital, the investment rate, value added and the average wage.
By including county �xed e�ects, I isolate the �rm-level, partial equilibrium e�ect of a lending
cut, β, from the general e�ect, ρ. The county �xed e�ects also circumvent the need for an instru-
ment, because there is no evidence that, within the same county, �rms dependent on Commerzbank
grew faster during recessions. In the �rm survey (tables 1 and 2), there is no association between
Commerzbank dependence and �rm constraints in either recession or growth years before the lending
cut. Furthermore, Commerzbank dependence is not signi�cantly correlated with �rm observables
before the lending cut (Table 6).
The identifying assumption in this section is a parallel-trends assumption. I argue that, between
2009 and 2012, �rms dependent on Commerzbank would have developed in parallel to �rms with
no Commerzbank relationship, had there been no lending cut. I control for a range of observables,
all interacted with d. I include industry �xed e�ects for 85 industries, at the three-digit level of the
German industrial classi�cation scheme WZ. I add four �rm size bins, based on the �rm's number
of employees in 2006. The bins are for 1-49, 50-249, 250-999, and over 1000 employees. Further
controls are the export share out of total revenues, the import share out of total inputs, the ln of
the �rm's age, and county �xed e�ects.
The standard errors in all �rm speci�cations are two-way clustered at the level of the county
and the industry. This is a more general method than clustering at the level of the �rm, because it
21

allows for arbitrary correlations across time for �rms in the same county and the same industry.
7.2 Firm Results
Column 1 of table 13 reports the results of a simple panel regression that includes year �xed e�ects,
�rm �xed e�ects, and the regressor Commb dep*d. The point estimate implies that, following the
lending cut, employment at a �rm fully dependent on Commerzbank was 4.4 percent lower than
at a �rm with no Commerzbank relationship. Adding the set of control variables, interacted with
d, increases the point estimates only slightly, to 5.3 percent. This strengthens the assumption that
there were no structural di�erences correlated with Commerzbank dependence. The addition of
county �xed e�ects lowers the standard error by around a third, which suggests that county-speci�c
shocks and the general e�ect of the lending cut make it more di�cult to identify the e�ects precisely.
Export and import dependence do not a�ect the results much, probably because industry and size
already account for much of the variation. The 95 percent con�dence of the employment e�ect
ranges from 2.5 percent to 8.8 percent.
Table 14 reports the results for the other outcomes. It shows that a �rm fully dependent on Com-
merzbank held on average 20.5 percent less bank debt over the period 2009 to 2012. This suggests
that �rms dependent on Commerzbank were not able to substitute other lenders for Commerzbank.
The average investment rate was 4.3 points lower over the four years, while the capital stock fell by
an average of 13 percent. As predicted by the model, the capital-labour ratio fell signi�cantly by
7.7 percent.
The model also predicts that the marginal product of capital should increase following a lending
cut, while the marginal product of labour stays constant. This di�erentiates a lending cut from the
e�ects of a demand or productivity shock, where both marginal products should fall. To identify
the direction of change in the marginal products, I use value added per unit of capital and labour,
i.e. average capital and labour productivity. Table 15 shows that the capital productivity indeed
increased, while labour productivity remained unchanged.
The lending cut did not a�ect the average wage. This is consistent with the model, which takes
the wage as exogenously determined by market forces. There are other theories of the labour market
that could could explain the fact that wages are una�ected, for example sticky nominal wages or
changes in the composition of the labour force. In the United States, the median wage actually
22
rose during the Great Recession, because mainly low-wage employees were laid o�. Further research
is needed on whether a lending cut a�ects wages and the composition of employment di�erently,
compared to aggregate demand or productivity shocks.
To gauge the importance of bank debt, it is useful to set up an instrumental variable strategy.
Ln bank debt is the endogenous regressor, and Commb dep*d the instrument. The �rst stage is the
reduced-form regression of ln bank debt on Commerzbank dependence in table 14. The t-statistic
of the �rst stage regression is only 2.56, but this is not a serious problem, because I am estimating
a single causal e�ect using a single instrument (Angrist and Pischke (2009)).
Table 16 shows the instrumental variable results. A one percent drop in bank debt leads to a
0.26 percent fall in employment and to a 0.64 fall in capital. The 95 percent con�dence intervals
are from 0.10 to 0.42 for employment and from 0.16 to 1.11 for capital. These results are large and
con�rm the importance of bank debt to German �rms.
7.3 Further Firm Speci�cations
Table 17 adds the variable Commb dep*d(2011/2012) to the regression, which interacts Commb dep
with a dummy for the years 2011 and 2012. The coe�cient on this variable tests whether Com-
merzbank dependence has a di�erential e�ect in the years 2011 and 2012. If there is no persistence,
the coe�cient should be of the same magnitude and the opposite sign to the coe�cient on Commb
dep*d. For both capital and labour, the coe�cients on Commb dep*d(2011/2012) are small, neg-
ative, and statistically insigni�cant. The 95 percent con�dence intervals reject the hypothesis that
the �rms recovered to the capital and employment levels of una�ected �rms within two years after
the lending cut. The capital-labour ratio remained persistently depressed, which suggests that there
were signi�cant adjustment costs to capital.
Column (3) reports that there is no e�ect of Deutsche Bank dependence on �rm outcomes
during the Great Recession. The coe�cient is insigni�cant and slightly positive. This shows that
the estimated e�ect on Commerzbank is not simply the result of being attached to a large bank, but
is driven by the Commerzbank lending cut.
One would expect that �rms that rely heavily on banks for external �nancing will be more
a�ected by a bank lending cut. I calculate two evenly-sized bins, based on the 2006 fraction of bank
debt out of liabilities. Firms with low bank debt dependence have up to 50 percent of their liabilities
23
with banks; for �rms with high bank debt dependence it is over 50 percent. Only for �rms with
high bank debt dependence is there a statistically signi�cant e�ect of Commerzbank dependence.
The coe�cient for �rms with high bank debt dependence is still negative, but half the size and
statistically insigni�cant, suggesting these �rms are less a�ected.
The e�ects of Commerzbank dependence are non-linear. For �rms with low Commerzbank
dependence (0 < Commbdep ≤ 0.25), there was no e�ect of the lending cut on employment. These
�rms found it relatively easy to substitute for Commerzbank �nancing, because they already had
over 75 percent of their bank relationships with other banks. On the other extreme, �rms with
high Commerzbank dependence (Commbdep > 0.5) found it signi�cantly more di�cult, and their
employment fell by an average of 6.5 percent after the lending cut. Firms with medium Commerzbank
dependence (0.25 < Commbdep ≤ 0.5) were a�ected, but lost only 1.7 percent of their employment
after the lending cut.
The literature on the United States has found that large �rms are less sensitive to credit shocks
(Gertler and Gilchrist (1994); Chodorow-Reich (2014)). I �nd a small, negative, and statistically
insigni�cant coe�cient when I test whether Commerzbank dependence a�ects large �rms (over 1,500
employees) di�erentially following the lending cut. This suggests there were no heterogeneous e�ects
by �rm size, in line with the conventional wisdom that German �rms of all sizes depend on bank
debt (Bundesbank (2015)).
8 Importance of Partial Equilibrium E�ects
It is a general problem in empirical work that well-identi�ed, partial equilibrium e�ects may not
be informative about the aggregate implications of a given policy or shock (Acemoglu (2010)). The
existing �rm-level literature on �nancial frictions has had to rely on strong assumptions about the
nature of general equilibrium and demand e�ects to extrapolate the aggregate e�ects of credit market
imperfections. In this section, I present suggestive evidence that summing up the �rm-level, partial
equilibrium e�ects underestimates the aggregate e�ect of a lending cut.
The exercise exploits the fact that I estimate both �rm and county e�ects. First, I calculate
what the change in aggregate employment would have been, had there been only �rm-level, partial
equilibrium e�ects of the lending cut. Second, I use the county estimates to calculate what the
24
change in aggregate employment would have been, had there been no e�ects of the lending cut on
counties. Third, I compare the two numbers and conclude on the relative importance of the partial
equilibrium e�ects.
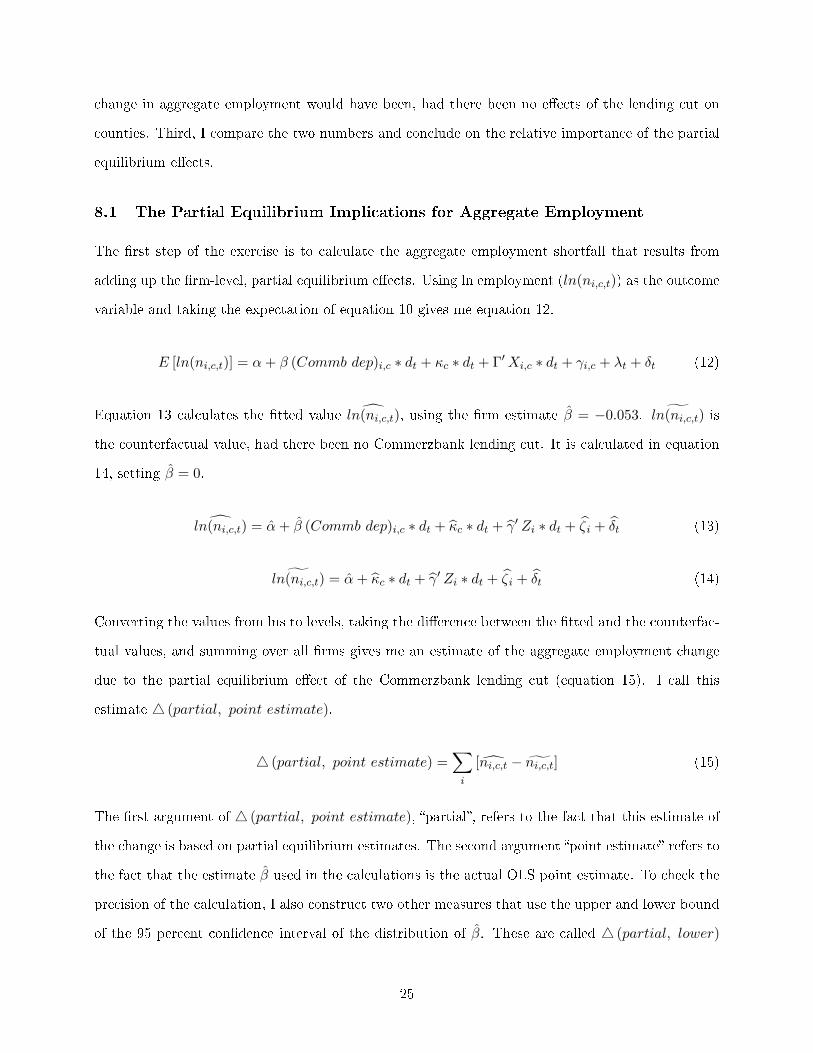
8.1 The Partial Equilibrium Implications for Aggregate Employment
The �rst step of the exercise is to calculate the aggregate employment shortfall that results from
adding up the �rm-level, partial equilibrium e�ects. Using ln employment (ln(ni,c,t)) as the outcome
variable and taking the expectation of equation 10 gives me equation 12.
E [ln(ni,c,t)] = α+ β (Commb dep)i,c ∗ dt + κc ∗ dt + Γ′Xi,c ∗ dt + γi,c + λt + δt (12)
Equation 13 calculates the �tted value ln(ni,c,t), using the �rm estimate β = −0.053. ˜ln(ni,c,t) is
the counterfactual value, had there been no Commerzbank lending cut. It is calculated in equation
14, setting β = 0.
ln(ni,c,t) = α+ β (Commb dep)i,c ∗ dt + κc ∗ dt + γ′ Zi ∗ dt + ζi + δt (13)
˜ln(ni,c,t) = α+ κc ∗ dt + γ′ Zi ∗ dt + ζi + δt (14)
Converting the values from lns to levels, taking the di�erence between the �tted and the counterfac-
tual values, and summing over all �rms gives me an estimate of the aggregate employment change
due to the partial equilibrium e�ect of the Commerzbank lending cut (equation 15). I call this
estimate 4 (partial, point estimate).
4 (partial, point estimate) =∑i
[ni,c,t − ni,c,t] (15)
The �rst argument of 4 (partial, point estimate), �partial�, refers to the fact that this estimate of
the change is based on partial equilibrium estimates. The second argument �point estimate� refers to
the fact that the estimate β used in the calculations is the actual OLS point estimate. To check the
precision of the calculation, I also construct two other measures that use the upper and lower bound
of the 95 percent con�dence interval of the distribution of β. These are called 4 (partial, lower)
25
and 4 (partial, upper).
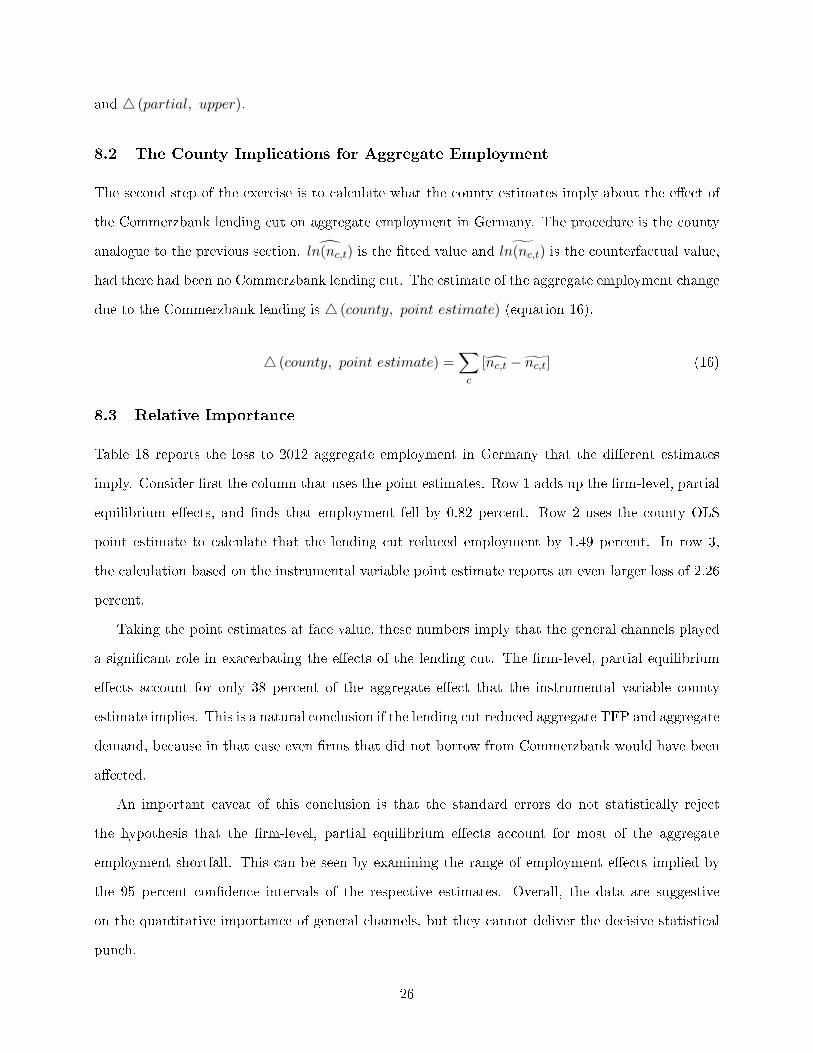
8.2 The County Implications for Aggregate Employment
The second step of the exercise is to calculate what the county estimates imply about the e�ect of
the Commerzbank lending cut on aggregate employment in Germany. The procedure is the county
analogue to the previous section. ln(nc,t) is the �tted value and ˜ln(nc,t) is the counterfactual value,
had there had been no Commerzbank lending cut. The estimate of the aggregate employment change
due to the Commerzbank lending is 4 (county, point estimate) (equation 16).
4 (county, point estimate) =∑c
[nc,t − nc,t] (16)
8.3 Relative Importance
Table 18 reports the loss to 2012 aggregate employment in Germany that the di�erent estimates
imply. Consider �rst the column that uses the point estimates. Row 1 adds up the �rm-level, partial
equilibrium e�ects, and �nds that employment fell by 0.82 percent. Row 2 uses the county OLS
point estimate to calculate that the lending cut reduced employment by 1.49 percent. In row 3,
the calculation based on the instrumental variable point estimate reports an even larger loss of 2.26
percent.
Taking the point estimates at face value, these numbers imply that the general channels played
a signi�cant role in exacerbating the e�ects of the lending cut. The �rm-level, partial equilibrium
e�ects account for only 38 percent of the aggregate e�ect that the instrumental variable county
estimate implies. This is a natural conclusion if the lending cut reduced aggregate TFP and aggregate
demand, because in that case even �rms that did not borrow from Commerzbank would have been
a�ected.
An important caveat of this conclusion is that the standard errors do not statistically reject
the hypothesis that the �rm-level, partial equilibrium e�ects account for most of the aggregate
employment shortfall. This can be seen by examining the range of employment e�ects implied by
the 95 percent con�dence intervals of the respective estimates. Overall, the data are suggestive
on the quantitative importance of general channels, but they cannot deliver the decisive statistical
punch.
26
9 Conclusion
The persistence of the Great Recession poses a challenge for growth theory. A standard model
predicts that the economy should converge to its pre-crisis trend as soon as �nancial frictions are
overcome. Alas, there has been little convergence in developed economies following the �nancial crisis
2008/09, even though the banking sector has stabilised. What is to blame? Summers (2014) and
Gordon (2014) point to structural changes in the economy, while Fernald (2014) and Antolin-Diaz
et al. (2014) �nd that the growth rate had slowed even before the �nancial crisis.
The results in this paper imply an additional narrative. I show that a bank lending cut can
cause an extended hangover, depressing output and employment even after bank loan supply has
normalised. If a banking crisis persistently lowers total factor productivity, as the results in this paper
imply, the persistence of the Great Recession is not surprising. The law of motion for productivity in
standard models implies no convergence, and so the economy can be permanently worse o� following
a productivity shock.
Further research should identify the mechanisms that lead from banking crises to persistent
losses. Likely candidates include the shortfalls in all types of tangible and intangible investment,
such as in production capital, research and development, and relationships to �rms and customers.
In addition, the role of general channels in amplifying partial equilibrium shocks merits further
evidence and analysis.
References
Acemoglu, Daron, �Theory, General Equilibrium, and Political Economy in Development Eco-
nomics,� Journal of Economic Perspectives, 2010, 24 (3), 17�32.
, Vasco M. Carvalho, Asuman Ozdaglar, and Alireza Tahbaz-Salehi, �The Network
Origins of Aggregate Fluctuations,� Econometrica, 2012, 80 (5), 1977�2016.
Aghion, Philippe, George-Marios Angeletos, Abhijit Banerjee, and Kalina Manova,
�Volatility and growth: Credit constraints and the composition of investment,� Journal of Mon-
etary Economics, 2010, 57 (3), 246�265.
27

Almeida, Heitor, Murillo Campello, Bruno Laranjeira, and Scott Weisbenner, �Corporate
Debt Maturity and the Real E�ects of the 2007 Credit Crisis,� Critical Finance Review, 2012.
Amiti, Mary and David E. Weinstein, �Exports and Financial Shocks,� The Quarterly Journal
of Economics, 2011, 126 (4), 1841�1877.
Angrist, Joshua D. and Jörn-Ste�en Pischke, Mostly Harmless Econometrics: An Empiricist's
Companion, Princeton University Press, 2009.
Antolin-Diaz, Juan, Thomas Drechsel, and Ivan Petrella, �Following the Trend: Tracking
GDP when Long-Run Growth is Uncertain,� 2014. CEPR Discussion Paper 10272.
Ashcraft, Adam B., �Are Banks Really Special? New Evidence from the FDIC-Induced Failure
of Healthy Banks,� American Economic Review, 2005, 95 (5), 1712�1730.
, �New Evidence on the Lending Channel,� Journal of Money, Credit and Banking, 2006, 38 (3),
751�775.
Baker, Scott R., Nicholas Bloom, and Steven J. Davis, �Measuring Economic Policy Uncer-
tainty,� 2013. Chicago Booth Research Paper 13-02.
Baqaee, David R., �Cascading Failures in Production Networks,� 2015. LSE Working Paper.
Benigno, Gianluca and Luca Fornaro, �Stagnation Traps,� 2015. Barcelona Graduate School
of Economics Working Papers 832.
Benmelech, Efraim, Nittai K. Bergman, and Amit Seru, �Financing Labor,� 2011. NBER
Working Papers 17144.
Bentolila, Samuel, Marcel Jansen, Gabriel Jiménez, and Sonia Ruano, �When Credit Dries
Up: Job Losses in the Great Recession,� 2015. FEDEA Working Papers 2013-20.
Bloom, Nicholas, Mark Schankerman, and John Van Reenen, �Identifying Technology
Spillovers and Product Market Rivalry,� Econometrica, 2013, 81 (4), 1347�1393.
Bundesbank, �Hochgerechnete Angaben aus Jahresabschlüssen deutscher Unternehmen von 1997
bis 2013,� 2015. Statistische Sonderverö�entlichung 5.
28
Burda, Michael C. and Jennifer Hunt, �What Explains the German Labor Market Miracle in
the Great Recession,� Brookings Papers on Economic Activity, 2011, 42 (1), 273�335.
Chodorow-Reich, Gabriel, �The Employment E�ects of Credit Market Disruptions: Firm-level
Evidence from the 2008-9 Financial Crisis,� The Quarterly Journal of Economics, 2014, 129 (1),
1�59.
Degryse, Hans and Steven Ongena, �Distance, Lending Relationships, and Competition,�
Journal of Finance, 2005, 60 (1), 231�266.
Driscoll, John C., �Does bank lending a�ect output? Evidence from the U.S. states,� Journal of
Monetary Economics, 2004, 51 (3), 451�471.
Düwell, Kurt, �Operation Marriage - Die britische Geburtshilfe bei der Gründung Nordrhein-
Westfalens ,� 2006. Heinrich-Heine-Universität Düsseldorf.
Fernald, John G., �Productivity and Potential Output before, during, and after the Great Reces-
sion,� in �NBER Macroeconomics Annual,� Vol. 29 2014, pp. 1�51.
and Charles I. Jones, �The Future of US Economic Growth,� American Economic Review,
2014, 104 (5), 44�49.
Fujita, Shigeru and Hermann Gartner, �A closer look at the German labor market miracle,�
Business Review, 2014, Q4, 16�24.
Gabaix, Xavier, �The Granular Origins of Aggregate Fluctuations,� Econometrica, 2011, 79 (3),
733�772.
Gan, Jie, �The Real E�ects of Asset Market Bubbles: Loan- and Firm-Level Evidence of a Lending
Channel,� Review of Financial Studies, 2007, 20 (6), 1941�1973.
Garicano, Luis and Claudia Steinwender, �Survive Another Day: Using Changes in the Com-
position of Investments to Measure the Cost of Credit Constraints,� 2013. CEP Discussion Papers
1188.
Gertler, Mark and Simon Gilchrist, �Monetary Policy, Business Cycles, and the Behavior of
Small Manufacturing Firms,� The Quarterly Journal of Economics, 1994, 109 (2), 309�40.
29
Giesecke, Kay, Francis A. Longsta�, Stephen Schaefer, and Ilya A. Strebulaev, �Mac-
roeconomic e�ects of corporate default crisis: A long-term perspective,� Journal of Financial
Economics, 2014, 111 (2), 297�310.
Gordon, Robert J., �The Demise of U.S. Economic Growth: Restatement, Rebuttal, and Re�ec-
tions,� 2014. NBER Working Papers 19895.
Greenstone, Michael, Alexandre Mas, and Hoai-Luu Nguyen, �Do Credit Market Shocks
a�ect the Real Economy? Quasi-Experimental Evidence from the Great Recession and 'Normal'
Economic Times,� 2014. NBER Working Papers 20704.
Guiso, Luigi, Paola Sapienza, and Luigi Zingales, �Does Local Financial Development Mat-
ter?,� The Quarterly Journal of Economics, 2004, 119 (3), 929�969.
Hall, Robert E., �Why Does the Economy Fall to Pieces after a Financial Crisis?,� Journal of
Economic Perspectives, Fall 2010, 24 (4), 3�20.
Horstmann, Theo, Die Alliierten und die deutschen Groÿbanken, Vol. 1, Bouvier, Bonn, 1991.
Ivashina, Victoria and David Scharfstein, �Bank lending during the �nancial crisis of 2008,�
Journal of Financial Economics, 2010, 97 (3), 319�338.
Karabarbounis, Loukas and Brent Neiman, �The Global Decline of the Labor Share,� The
Quarterly Journal of Economics, 2014, 129 (1), 61�103.
Khwaja, Asim Ijaz and Atif Mian, �Tracing the Impact of Bank Liquidity Shocks: Evidence
from an Emerging Market,� American Economic Review, 2008, 98 (4), 1413�42.
Klein, Sebastian, Die Strategie der Grossbanken in den Bundesländern, Springer Fachmedien
Wiesbaden GmbH Finanz, 1993.
Krishnamurthy, Arvind and Tyler Muir, �Credit Spreads and the Severity of Financial Crises,�
2015. Stanford GSB Working Paper.
Landler, Mark, �Deutsche Bank Escapes Subprime Losses,� The New York Times, 8 February
2008.
30
Lucas, Robert E., �Adjustment Costs and the Theory of Supply,� Journal of Political Economy,
1967, 75, 321.
, �Understanding business cycles,� Carnegie-Rochester Conference Series on Public Policy, 1977,
5 (1), 7�29.
Mian, Atif, �Distance Constraints: The Limits of Foreign Lending in Poor Economies,� Journal of
Finance, 2006, 61 (3), 1465�1505.
and Amir Su�, House of Debt, University of Chicago Press, 2014.
and , �What Explains the 2007-2009 Drop in Employment?,� Econometrica, 2014, 82, 2197�
2223.
Mondragon, John, �Household Credit and Employment in the Great Recession,� 2015. Kellogg
Working Paper.
Moody's, �Moody's Downgrades Dresdner Bank's Ratings to Aa3,� Global Credit Research Investors
Service, September 2008.
, �Negative outlook for German banking system re�ects impact of credit crisis and sectoral chal-
lenges,� Global Credit Research Investors Service, April 2008.
, �Moody's a�rms Commerzbank's Aa3 long-term ratings, stable outlook,� Global Credit Research
Investors Service, January 2009.
, �Moody's a�rms Dresdner Bank's Aa3 long-term ratings, stable outlook,� Global Credit Research
Investors Service, January 2009.
O'Donnell, John and Patricia Nann, �Commerzbank Says Subprime Bill Mounting,� Reuters,
22 January 2008.
Paravisini, Daniel, Veronica Rappoport, Philipp Schnabl, and Daniel Wolfenzon, �Dis-
secting the E�ect of Credit Supply on Trade: Evidence fromMatched Credit-Export Data,� Review
of Economic Studies, 2015, 82 (1), 333�359.
31
Puri, Manju, Jörg Rocholl, and Sascha Ste�en, �Global retail lending in the aftermath of
the US �nancial crisis: Distinguishing between supply and demand e�ects,� Journal of Financial
Economics, 2011, 100 (3), 556�578.
Reinhart, Carmen M. and Kenneth S. Rogo�, This Time Is Di�erent: Eight Centuries of
Financial Folly, Princeton University Press, 2009.
Romer, Christina D. and David H. Romer, �New Evidence on the Impact of Financial Crises
in Advanced Countries,� 2015. NBER Working Papers 21021.
Rosengren, Eric S. and Joe Peek, �Collateral Damage: E�ects of the Japanese Bank Crisis on
Real Activity in the United States,� American Economic Review, 2000, 90 (1), 30�45.
Schularick, Moritz and Alan M. Taylor, �Credit Booms Gone Bust: Monetary Policy, Leverage
Cycles, and Financial Crises, 1870-2008,� American Economic Review, 2012, 102 (2), 1029�61.
Schultz, Stefan, �Verkauf der Dresdner Bank: Warum Deutschland eine neue Superbank braucht,�
Der Spiegel, 25 August 2008.
Schwartz, Michael, �Wie viel Kredit darf's sein? Kreditnachfrage für Investitionen im Mittelstand
vor, nach, in der Krise,� 2014. KFW Economic Research 55.
Sharpe, Steven A., � Asymmetric Information, Bank Lending, and Implicit Contracts: A Stylized
Model of Customer Relationships,� Journal of Finance, 1990, 45 (4), 1069�87.
Standard & Poor's, �Commerzbank AG And Dresdner Bank AG Outlooks To Negative On
Worsening Credit Conditions; 'A/A-1' Ratings A�rmed,� Standard & Poor's Research Update,
May 2009.
Summers, Lawrence H., �U.S. Economic Prospects: Secular Stagnation, Hysteresis, and the Zero
Lower Bound,� Business Economics, 2014, 49 (2), 65�73.
32
Figures
-.01
-.00
50
.005
.01
.015
Poi
nt e
stim
ate
2001 2002 2003 2004 2005 2006 2007 2008 2009 2010 2011 2012
Figure 1: Reduced-form impact of the instrument on GDP growth
Notes: This �gure illustrates the reduced-form relationship between county GDP growth and the Commerzbank
minimum distance instrument. It is based on a single regression, in which the dependent variable is the county's annual
GDP growth rate. The plotted point estimates are the coe�cients on dummy variables for each year, interacted with
the instrument. This instrument is the county's distance to the closest historic Commerzbank head o�ce, equivalent
to the minimum out of the distances to Duesseldorf, Frankfurt, and Hamburg. The vertical lines are 95 percent
con�dence intervals. Standard errors are two-way clustered at the level of the county's industrial production share
(share out of GDP of agriculture, mining, manufacturing, utilities, recycling, construction) and its population size,
each split into 42 quantile bins. The regression includes year �xed e�ects and the following, time-invariant control
variables interacted with d, a dummy for the years following the lending cut, 2009 to 2012: 17 variables for industry
shares, giving the fraction of �rms for each of the 17 industries in 2006 (agriculture, mining, manufacturing, utilities,
recycling, construction, retail trade and vehicle repairs, transportation and storage, hospitality, information, �nance,
real estate, business services, other services, public sector, education, health); population density, total population
(in ln) and GDP per capita (in ln) from 2000; a 2003 measure of county household debt, calculated by credit rating
agency Schufa; the fraction of exports out of total revenue and the fraction of imports out of total costs, both averaged
across �rms in the county for 2006; a dummy for whether the county's Landesbank received public funding during
the �nancial crisis; a dummy for the 15 counties of the Ruhr; a dummy for the former GDR; and the linear distances
to Duesseldorf, Frankfurt, Hamburg, Berlin, and Dresden.
33
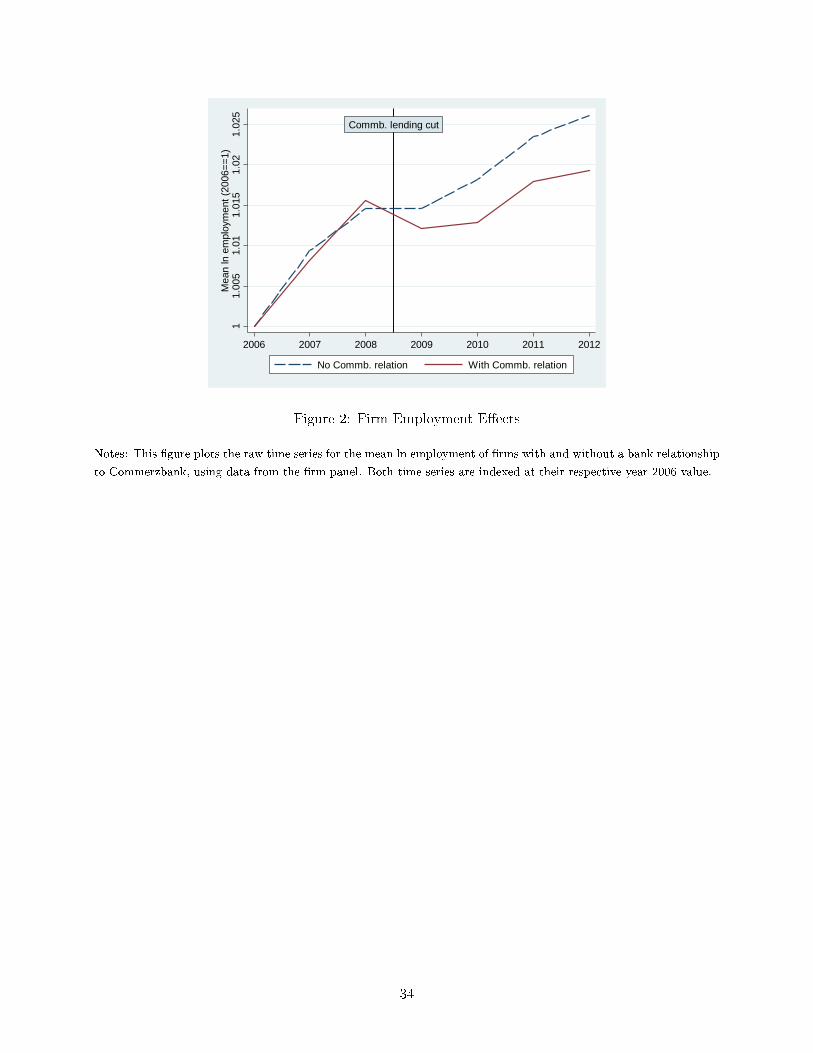
Commb. lending cut
11.
005
1.01
1.01
51.
021.
025
Mea
n ln
em
ploy
men
t (20
06=
=1)
2006 2007 2008 2009 2010 2011 2012
No Commb. relation With Commb. relation
Figure 2: Firm Employment E�ects
Notes: This �gure plots the raw time series for the mean ln employment of �rms with and without a bank relationship
to Commerzbank, using data from the �rm panel. Both time series are indexed at their respective year 2006 value.
34

-.4
-.3
-.2
-.1
0Ln
sto
ck o
f tot
al le
ndin
g (r
elat
ive
to 2
004)
2004 2005 2006 2007 2008 2009 2010 2011 2012 2013
All other German banks CommerzbankDeutsche Bank and Landesbanken
Figure 3: Lending stock to German �rms and households
Notes: The �gure plots the ln stock of total lending relative to 2004, which means the value for 2004 is subtracted
from the annual value. The stock of total lending is measured as the book value of total lending, which includes
overdraft facilities, collateral loans, bonded loans, consumer credit, and loans to municipal governments. The values
are in ln year 2010 billion Euros. The data are from the annual reports of Commerzbank, Eurohypo, Dresdner Bank,
and the Bundesbank. I aggregate the positions of Commerzbank and Dresdner Bank for the years before the 2009
take-over. The �gures for Commerzbank do not include real estate bank Eurohypo, a Commerzbank acquisition from
2005.
35
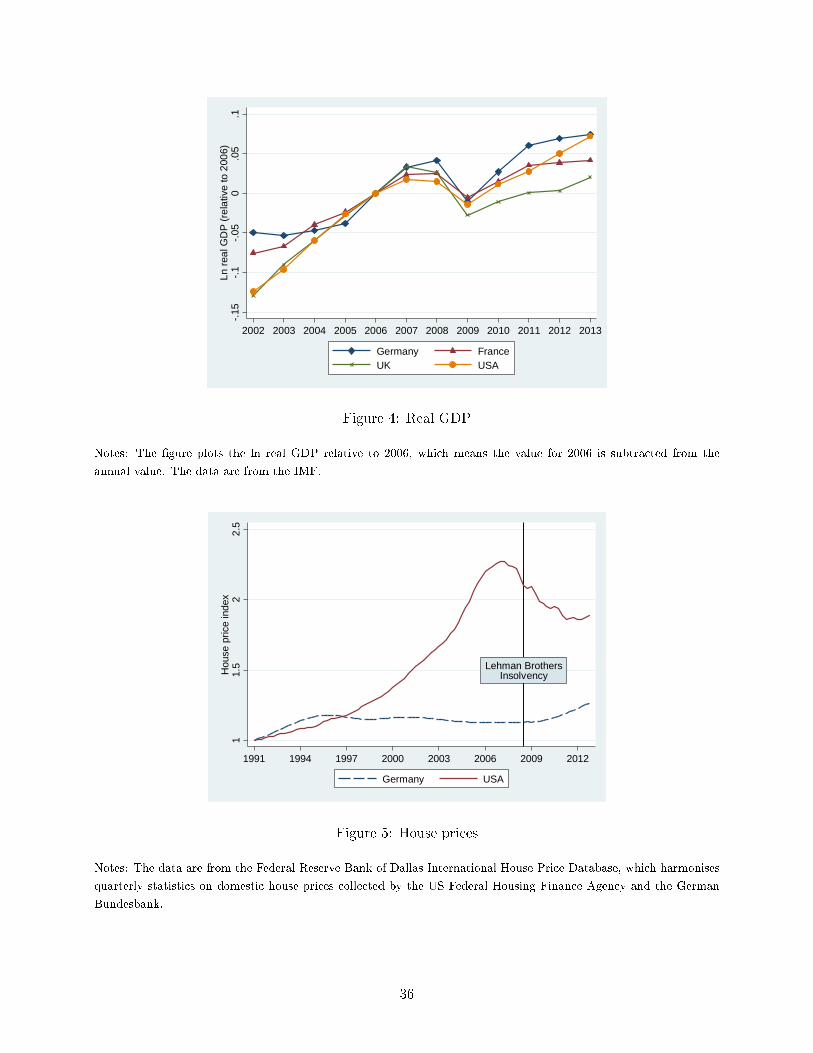
-.15
-.1
-.05
0.0
5.1
Ln r
eal G
DP
(re
lativ
e to
200
6)
2002 2003 2004 2005 2006 2007 2008 2009 2010 2011 2012 2013
Germany FranceUK USA
Figure 4: Real GDP
Notes: The �gure plots the ln real GDP relative to 2006, which means the value for 2006 is subtracted from the
annual value. The data are from the IMF.
Lehman BrothersInsolvency
11.
52
2.5
Hou
se p
rice
inde
x
1991 1994 1997 2000 2003 2006 2009 2012
Germany USA
Figure 5: House prices
Notes: The data are from the Federal Reserve Bank of Dallas International House Price Database, which harmonises
quarterly statistics on domestic house prices collected by the US Federal Housing Finance Agency and the German
Bundesbank.
36

Figure 6: Commerzbank's pro�ts, write-downs and equity
Notes: The data are from the annual reports of Commerzbank, Eurohypo, Dresdner Bank, and the Bundesbank.
I aggregate the positions of Commerzbank and Dresdner Bank for the years before the 2009 take-over. Pro�t is
the after-tax pro�t. Write-downs include changes in revaluation reserve, changes arising from cash �ow hedges and
changes in currency reserve. The monetary values are in year 2010 billion Euros.
37

Figure 7: Components of Commerzbank's income
Notes: The data are from the annual reports of Commerzbank, Eurohypo, Dresdner Bank, and the Bundesbank.
I aggregate the positions of Commerzbank and Dresdner Bank for the years before the 2009 take-over. Interest
income is the pro�t-loss item �net interest income� (interest received from lending and securities minus interest paid
on deposits). Trading & investment income is the sum of the items �net trading income and net income on hedge
accounting� and �net investment income�. Pro�t (pre-tax) is interest income plus trading & investment income minus
costs. The monetary values are in year 2010 billion Euros.
38

Figure 8: Equity capital for Commerzbank and other German banks
Notes: This �gure plots total equity capital for Commerzbank (Commb), Commerzbank minus the capital provided by
the government (Commb (no govt)), Deutsche Bank (Dt Bank), and the aggregate for all other banks. The German
government's Special Financial Market Stabilization Funds So�n supported Commerzbank twice, on 3 November
2008 and on 8 January 2009. Overall, So�n provided Commerzbank with 18.2 billion Euros in equity and bought
a 25 percent stake in the bank. The data are from the annual reports of Commerzbank, Dresdner Bank, Deutsche
Bank, and the Bundesbank. I aggregate the positions of Commerzbank and Dresdner Bank for the years before the
2009 take-over.
39
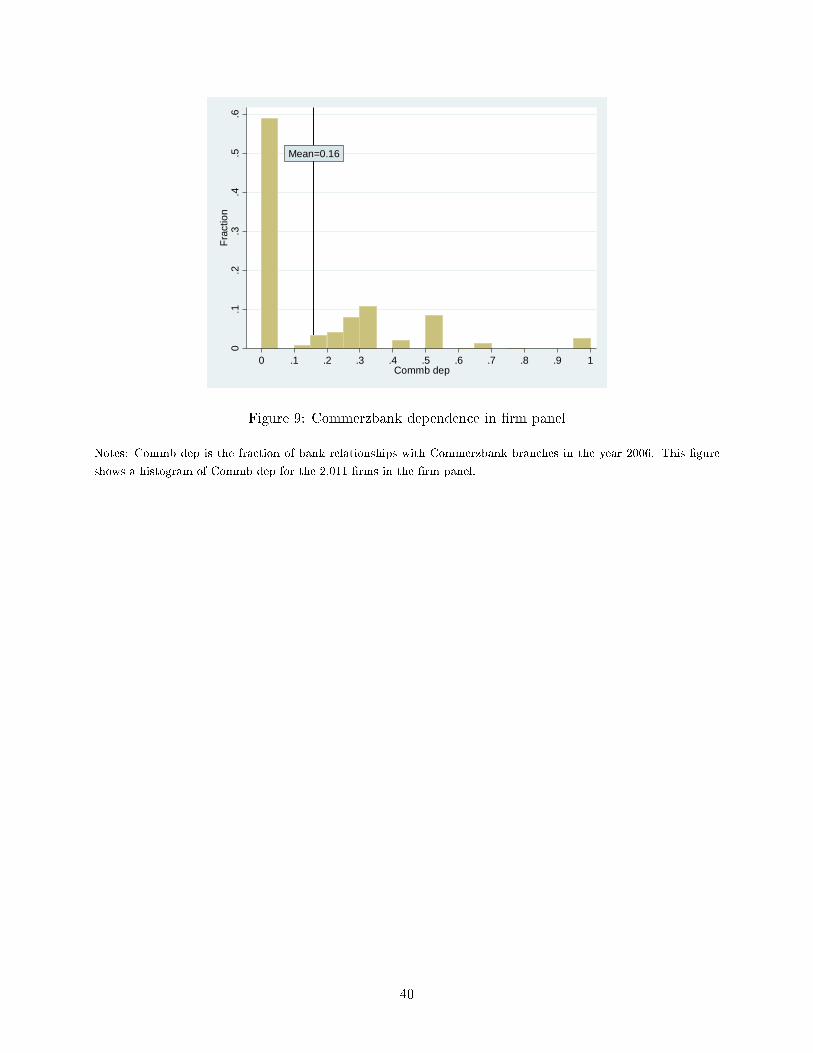
Mean=0.16
0.1
.2.3
.4.5
.6F
ract
ion
0 .1 .2 .3 .4 .5 .6 .7 .8 .9 1Commb dep
Figure 9: Commerzbank dependence in �rm panel
Notes: Commb dep is the fraction of bank relationships with Commerzbank branches in the year 2006. This �gure
shows a histogram of Commb dep for the 2,011 �rms in the �rm panel.
40
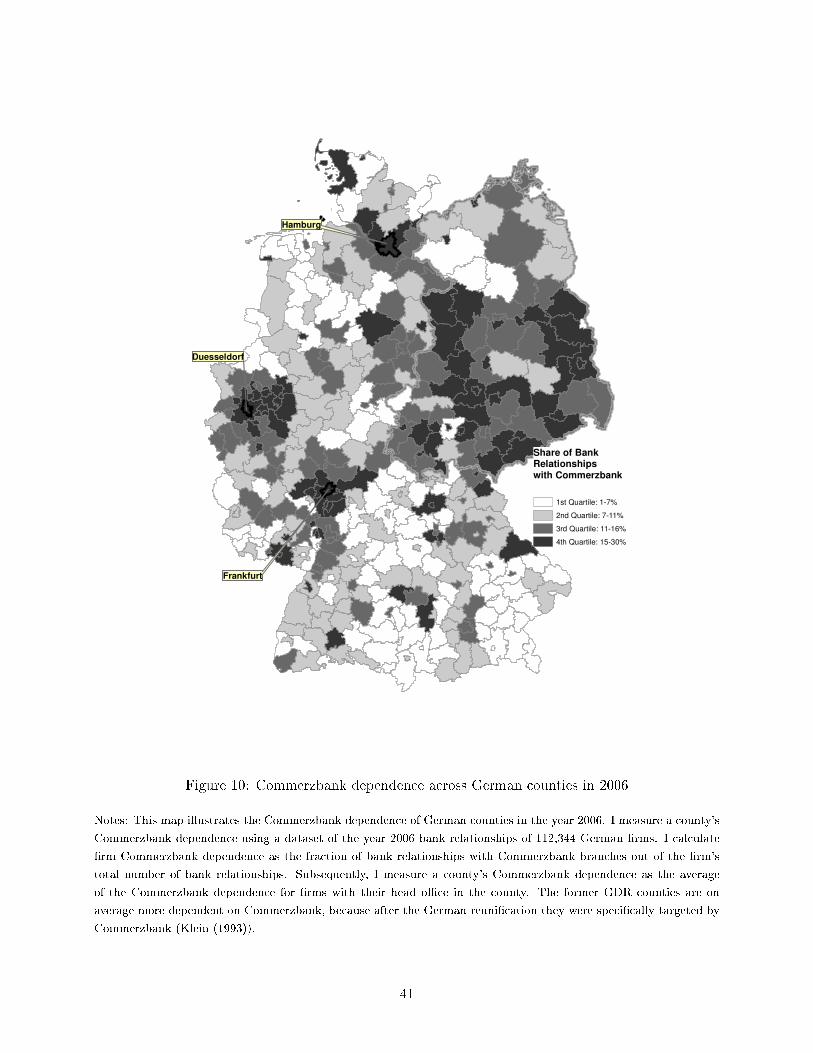
Hamburg
Duesseldorf
Frankfurt
Share of BankRelationshipswith Commerzbank
1st Quartile: 1-7%
2nd Quartile: 7-11%
3rd Quartile: 11-16%
4th Quartile: 15-30%
Figure 10: Commerzbank dependence across German counties in 2006
Notes: This map illustrates the Commerzbank dependence of German counties in the year 2006. I measure a county's
Commerzbank dependence using a dataset of the year 2006 bank relationships of 112,344 German �rms. I calculate
�rm Commerzbank dependence as the fraction of bank relationships with Commerzbank branches out of the �rm's
total number of bank relationships. Subsequently, I measure a county's Commerzbank dependence as the average
of the Commerzbank dependence for �rms with their head o�ce in the county. The former GDR counties are on
average more dependent on Commerzbank, because after the German reuni�cation they were speci�cally targeted by
Commerzbank (Klein (1993)).
41

Tables
(1) (2) (3) (4) (5) (6)YEAR 2011 2009 2009 2006 2006 2003
Commb dep 0.004 -0.324 -0.398 0.230 0.125 0.207(0.192) (0.180) (0.192) (0.185) (0.217) (0.238)
County Commb dep -0.220 -0.009 -0.794 -0.603 -0.086(0.963) (0.890) (0.818) (1.083) (1.383)
Lagged dep var 0.338 0.351 0.370 0.138(0.055) (0.045) (0.049) (0.061)
Observations 856 1,031 1,031 1,031 641 641Industry FE Yes No Yes Yes Yes YesState FE Yes No Yes Yes Yes YesSize Bin FE Yes No Yes Yes Yes Yesln age Yes No Yes Yes Yes Yes
Table 1: Firm survey on banks' willingness to grant loans
Notes: This table reports estimates from OLS cross-sectional �rm regressions for di�erent years, using data from the
con�dential ifo Business Expectations Panel. Commb dep is the fraction of bank relationships with Commerzbank
branches in 2006. County Commb dep is the average of Commb dep over all �rms in the county. The outcome variable
is the answer to the question: �How do you evaluate the current willingness of banks to grant loans to businesses:
cooperative, normal or restrictive?� It is standardised to have zero mean and unit variance. The coe�cients are
interpreted as the standard deviation increase in banks' willingness to grant loans from increasing the regressor by
one. The control variables include �xed e�ects for 36 industries, 16 federal states, 4 size bins (1-49, 50-249, 250-999,
and over 1000 employees in the year 2006), and the ln of the �rm's age. Standard errors are clustered at the level of
the county.
42
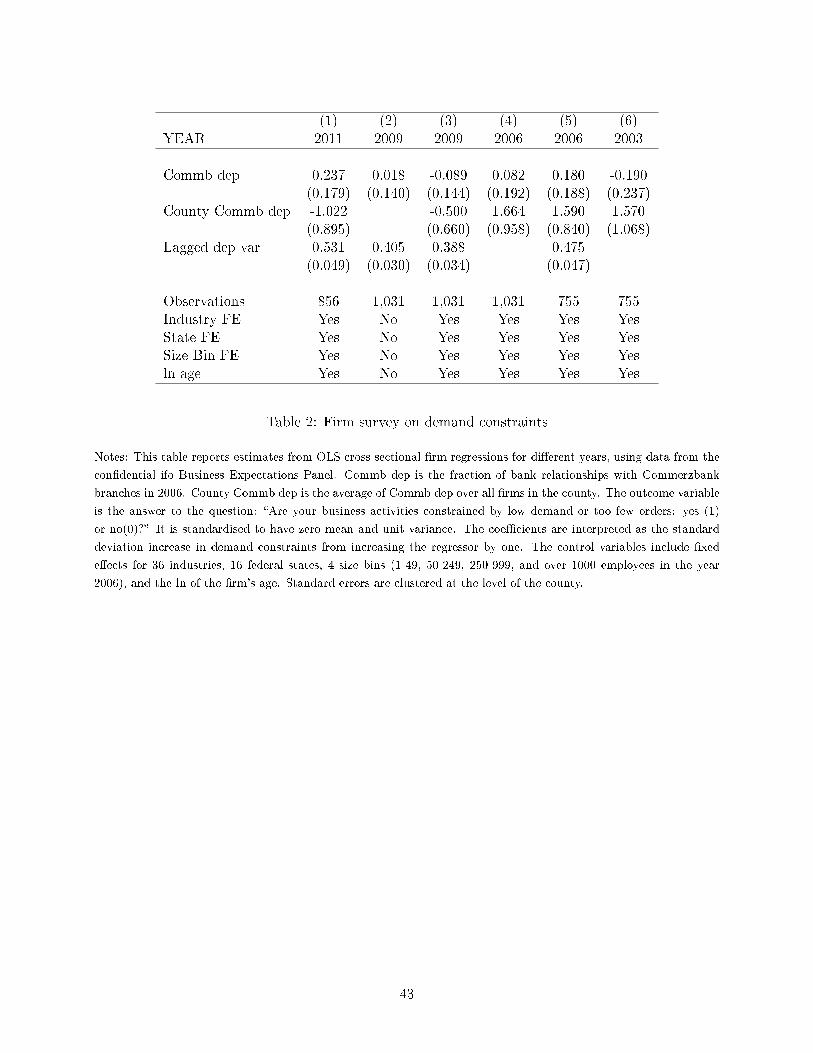
(1) (2) (3) (4) (5) (6)YEAR 2011 2009 2009 2006 2006 2003
Commb dep 0.237 0.018 -0.089 0.082 0.180 -0.190(0.179) (0.140) (0.144) (0.192) (0.188) (0.237)
County Commb dep -1.022 -0.500 1.664 1.590 1.570(0.895) (0.660) (0.958) (0.840) (1.068)
Lagged dep var 0.531 0.405 0.388 0.475(0.049) (0.030) (0.034) (0.047)
Observations 856 1,031 1,031 1,031 755 755Industry FE Yes No Yes Yes Yes YesState FE Yes No Yes Yes Yes YesSize Bin FE Yes No Yes Yes Yes Yesln age Yes No Yes Yes Yes Yes
Table 2: Firm survey on demand constraints
Notes: This table reports estimates from OLS cross-sectional �rm regressions for di�erent years, using data from the
con�dential ifo Business Expectations Panel. Commb dep is the fraction of bank relationships with Commerzbank
branches in 2006. County Commb dep is the average of Commb dep over all �rms in the county. The outcome variable
is the answer to the question: �Are your business activities constrained by low demand or too few orders: yes (1)
or no(0)?� It is standardised to have zero mean and unit variance. The coe�cients are interpreted as the standard
deviation increase in demand constraints from increasing the regressor by one. The control variables include �xed
e�ects for 36 industries, 16 federal states, 4 size bins (1-49, 50-249, 250-999, and over 1000 employees in the year
2006), and the ln of the �rm's age. Standard errors are clustered at the level of the county.
43

(1) (2) (3)VARIABLES
Commb dep*d(2003) 0.101 0.101 0.099(0.038) (0.045) (0.041)
Commb dep -0.011 -0.012(0.014) (0.014)
Observations 3,080 3,080 3,080County FE No No YesYear FE Yes Yes YesFormer GDR FE*d(2003) Yes Yes YesIndustry Shares*d(2003) Yes Yes YesPopulation*d(2003) No Yes YesPop density*d(2003) No Yes YesGDP per capita*d(2003) No Yes YesDebt Index*d(2003) No Yes YesFormer GDR FE*d(2004-2008) Yes Yes YesIndustry Shares*d(2004-2008) Yes Yes YesPopulation*d(2004-2008) No Yes YesPop density*d(2004-2008) No Yes YesGDP per capita*d(2004-2008) No Yes YesDebt Index*d(2004-2008) No Yes YesEstimator OLS OLS OLSNumber of counties 385 385 385
Table 3: County GDP growth rate and Commerzbank dependence (2000-2008)
Notes: This table uses data from 2000 to 2008 to test whether Commerzbank dependence was associated with
di�erences in county GDP growth rates before the Commerzbank lending cut. The table reports estimates from
county panel OLS regressions of the ln GDP growth rate on two regressors of interest. The �rst is Commerzbank
dependence (Commb dep). The second is Commb dep interacted with d(2003), a dummy for the recession year
2003. Commb dep is the average fraction of bank relationships with Commerzbank branches for �rms in the county
in 2006. d(2004-2008) is a dummy for the years 2004-2008. The following time-invariant controls are separately
interacted with d(2003) and d(2004-2008). The industry shares are 17 variables, giving the fraction of �rms for
each of the 17 industries in 2006 (agriculture, mining, manufacturing, utilities, recycling, construction, retail trade
and vehicle repairs, transportation and storage, hospitality, information, �nance, real estate, business services, other
services, public sector, education, health). Population density, total population (in ln) and GDP per capita (in ln)
are from 2000. Debt index is a 2003 measure of county household debt, calculated by credit rating agency Schufa.
The regressions are weighted by year 2000 population. Standard errors are two-way clustered at the level of the
county's industrial production share (share out of GDP of agriculture, mining, manufacturing, utilities, recycling,
construction), and its population size, each split into 42 quantile bins.
44
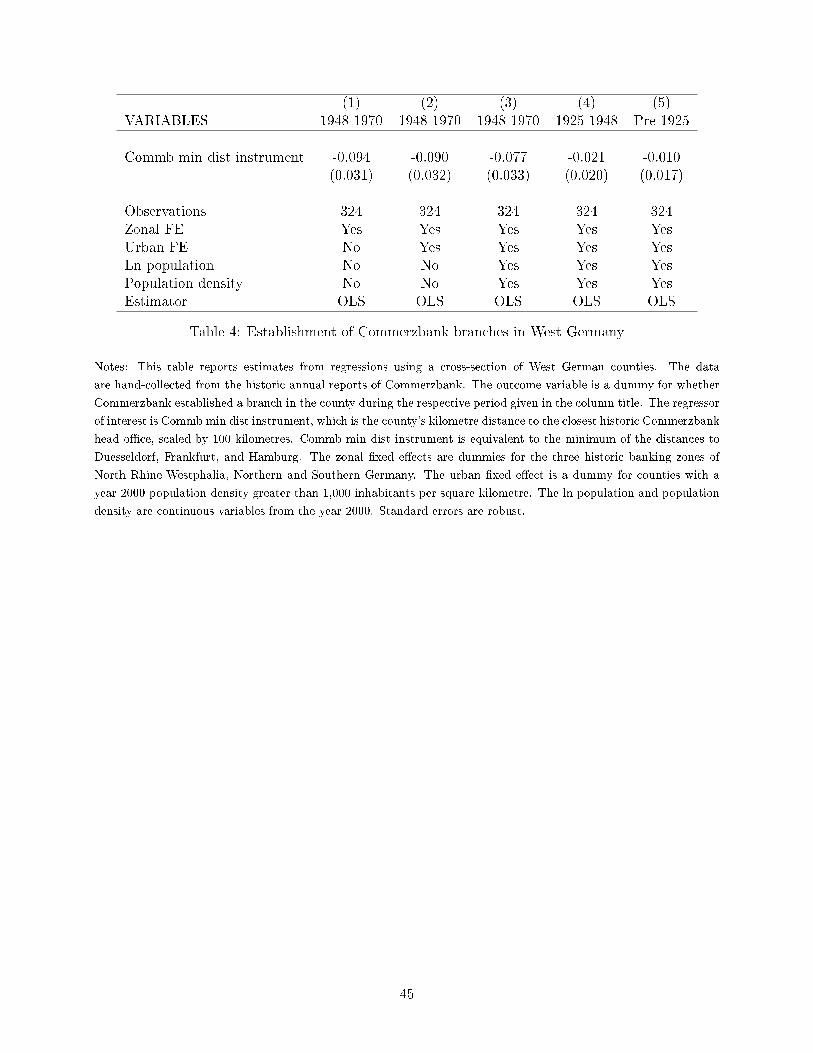
(1) (2) (3) (4) (5)VARIABLES 1948-1970 1948-1970 1948-1970 1925-1948 Pre-1925
Commb min dist instrument -0.094 -0.090 -0.077 -0.021 -0.010(0.031) (0.032) (0.033) (0.020) (0.017)
Observations 324 324 324 324 324Zonal FE Yes Yes Yes Yes YesUrban FE No Yes Yes Yes YesLn population No No Yes Yes YesPopulation density No No Yes Yes YesEstimator OLS OLS OLS OLS OLS
Table 4: Establishment of Commerzbank branches in West Germany
Notes: This table reports estimates from regressions using a cross-section of West German counties. The data
are hand-collected from the historic annual reports of Commerzbank. The outcome variable is a dummy for whether
Commerzbank established a branch in the county during the respective period given in the column title. The regressor
of interest is Commb min dist instrument, which is the county's kilometre distance to the closest historic Commerzbank
head o�ce, scaled by 100 kilometres. Commb min dist instrument is equivalent to the minimum of the distances to
Duesseldorf, Frankfurt, and Hamburg. The zonal �xed e�ects are dummies for the three historic banking zones of
North Rhine-Westphalia, Northern and Southern Germany. The urban �xed e�ect is a dummy for counties with a
year 2000 population density greater than 1,000 inhabitants per square kilometre. The ln population and population
density are continuous variables from the year 2000. Standard errors are robust.
45
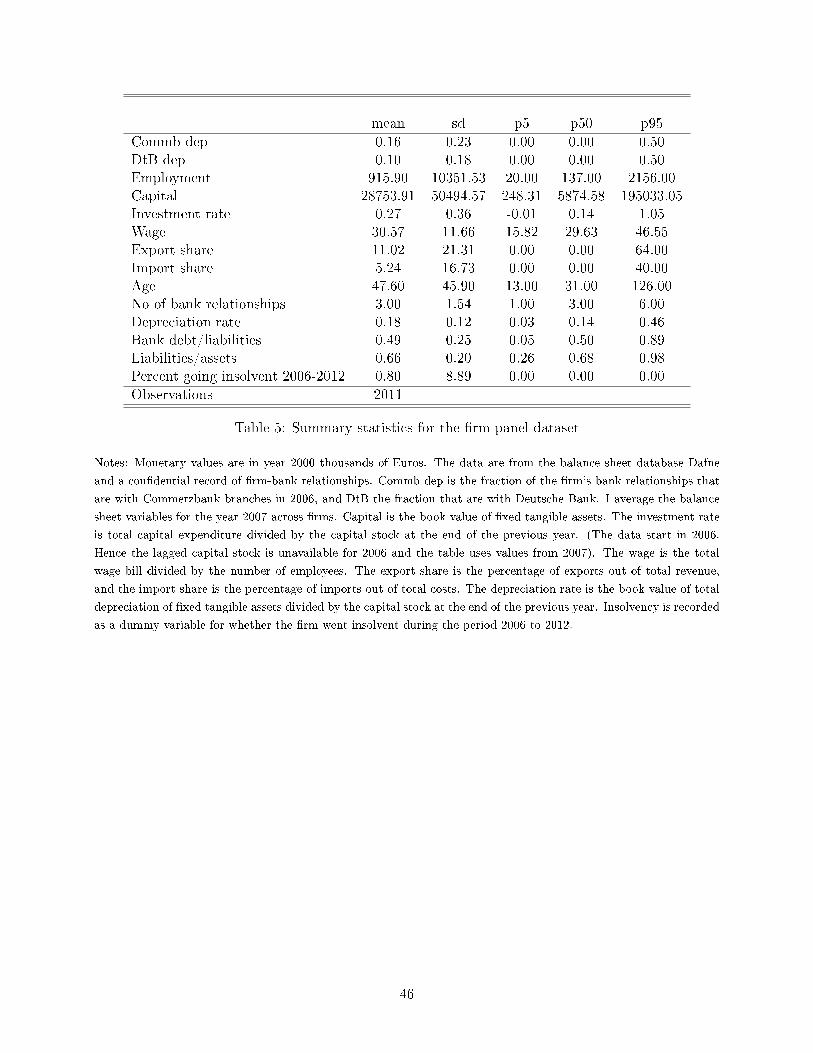
mean sd p5 p50 p95
Commb dep 0.16 0.23 0.00 0.00 0.50DtB dep 0.10 0.18 0.00 0.00 0.50Employment 915.90 10351.53 20.00 137.00 2156.00Capital 28753.91 50494.57 248.31 5874.58 195033.05Investment rate 0.27 0.36 -0.01 0.14 1.05Wage 30.57 11.66 15.82 29.63 46.55Export share 11.02 21.31 0.00 0.00 64.00Import share 5.24 16.73 0.00 0.00 40.00Age 47.60 45.90 13.00 31.00 126.00No of bank relationships 3.00 1.54 1.00 3.00 6.00Depreciation rate 0.18 0.12 0.03 0.14 0.46Bank debt/liabilities 0.49 0.25 0.05 0.50 0.89Liabilities/assets 0.66 0.20 0.26 0.68 0.98Percent going insolvent 2006-2012 0.80 8.89 0.00 0.00 0.00
Observations 2011
Table 5: Summary statistics for the �rm panel dataset
Notes: Monetary values are in year 2000 thousands of Euros. The data are from the balance sheet database Dafne
and a con�dential record of �rm-bank relationships. Commb dep is the fraction of the �rm's bank relationships that
are with Commerzbank branches in 2006, and DtB the fraction that are with Deutsche Bank. I average the balance
sheet variables for the year 2007 across �rms. Capital is the book value of �xed tangible assets. The investment rate
is total capital expenditure divided by the capital stock at the end of the previous year. (The data start in 2006.
Hence the lagged capital stock is unavailable for 2006 and the table uses values from 2007). The wage is the total
wage bill divided by the number of employees. The export share is the percentage of exports out of total revenue,
and the import share is the percentage of imports out of total costs. The depreciation rate is the book value of total
depreciation of �xed tangible assets divided by the capital stock at the end of the previous year. Insolvency is recorded
as a dummy variable for whether the �rm went insolvent during the period 2006 to 2012.
46

VARIABLES
Ln age -0.013(0.009)
Ln value added 0.025(0.016)
Ln capital -0.014(0.007)
Inv rate 0.012(0.014)
Ln employment 0.008(0.013)
Ln bank debt 0.005(0.005)
Observations 2,011Industry FE YesCounty FE YesEstimator OLS
Table 6: Commerzbank dependence and �rm outcome levels in 2007
Notes: This table reports estimates from a cross-sectional �rm regression of Commb dep on �rm variables from the
year 2007. Commb dep is the fraction of the �rm's bank relationships that are with Commerzbank branches in 2006.
Capital is the book value of �xed tangible assets. The investment rate is total capital expenditure divided by the
capital stock at the end of the previous year. (The data start in 2006. Hence the lagged capital stock is unavailable
for 2006 and the regressions uses values from 2007.) The regression includes �xed e�ects for 70 industries and 357
counties. Standard errors are two-way clustered at the level of the county and the industry.
47
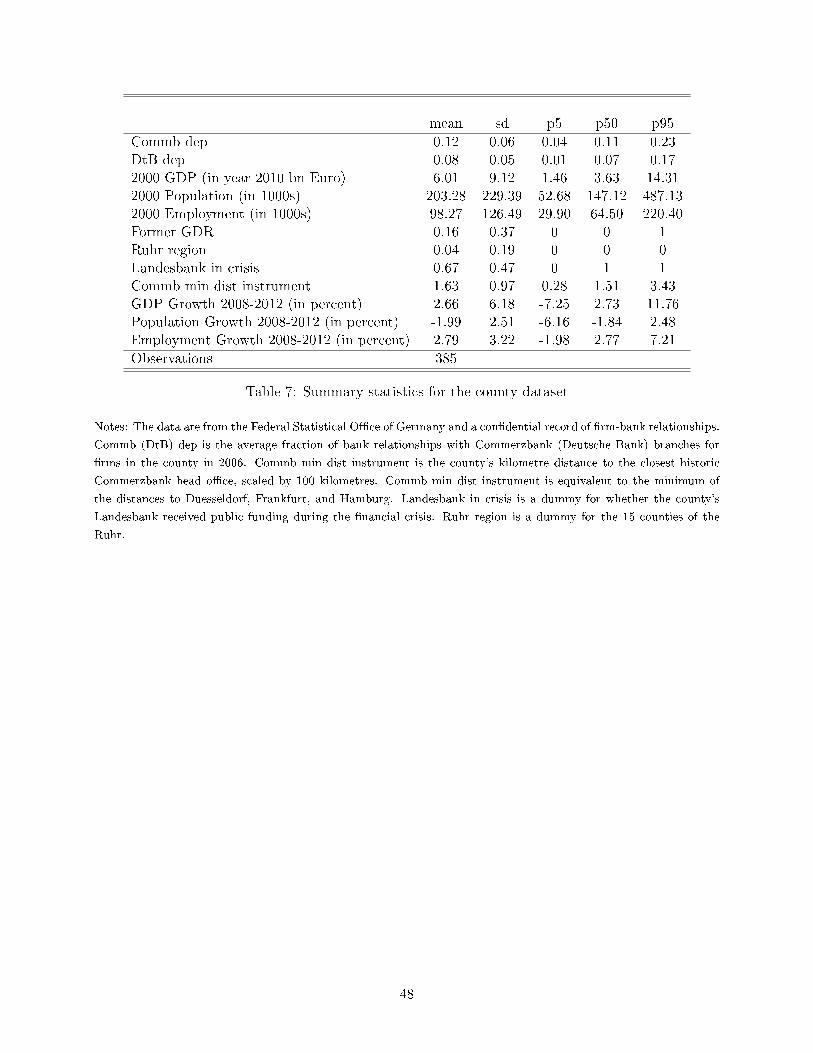
mean sd p5 p50 p95
Commb dep 0.12 0.06 0.04 0.11 0.23DtB dep 0.08 0.05 0.01 0.07 0.172000 GDP (in year 2010 bn Euro) 6.01 9.12 1.46 3.63 14.312000 Population (in 1000s) 203.28 229.39 52.68 147.12 487.132000 Employment (in 1000s) 98.27 126.49 29.90 64.50 220.40Former GDR 0.16 0.37 0 0 1Ruhr region 0.04 0.19 0 0 0Landesbank in crisis 0.67 0.47 0 1 1Commb min dist instrument 1.63 0.97 0.28 1.51 3.43GDP Growth 2008-2012 (in percent) 2.66 6.18 -7.25 2.73 11.76Population Growth 2008-2012 (in percent) -1.99 2.51 -6.16 -1.84 2.48Employment Growth 2008-2012 (in percent) 2.79 3.22 -1.98 2.77 7.21
Observations 385
Table 7: Summary statistics for the county dataset
Notes: The data are from the Federal Statistical O�ce of Germany and a con�dential record of �rm-bank relationships.
Commb (DtB) dep is the average fraction of bank relationships with Commerzbank (Deutsche Bank) branches for
�rms in the county in 2006. Commb min dist instrument is the county's kilometre distance to the closest historic
Commerzbank head o�ce, scaled by 100 kilometres. Commb min dist instrument is equivalent to the minimum of
the distances to Duesseldorf, Frankfurt, and Hamburg. Landesbank in crisis is a dummy for whether the county's
Landesbank received public funding during the �nancial crisis. Ruhr region is a dummy for the 15 counties of the
Ruhr.
48

(1) (2) (3)VARIABLES
Commb min dist instrument -0.020 -0.047 -0.032(0.003) (0.008) (0.006)
Observations 385 385 385Former GDR FE Yes Yes YesLinear distances No Yes YesIndustry Shares No No YesPopulation No No YesPop density No No YesGDP per capita No No YesDebt Index No No YesExport and Import Shares No No YesLandesbank in crisis No No YesEstimator OLS OLS OLS
Table 8: Commerzbank dependence and the minimum distance instrument
Notes: This table reports estimates from cross-county OLS regressions of Commerzbank dependence (Commb dep)
on the minimum distance instrument. Commb dep is the average fraction of bank relationships with Commerzbank
branches for �rms in the county in 2006. The instrument is the county's distance to the closest historic Commerzbank
head o�ce, which is equivalent to the minimum out of the kilometre distances to Duesseldorf, Frankfurt, and Hamburg,
scaled by 100 kilometres. This regressions is equivalent to the �rst-stage of the IV estimation. The second stage is
estimated using a panel and therefore interacts Commerzbank dependence and the instrument with a dummy for the
years 2009-2012. The industry shares are 17 variables, giving the fraction of �rms for each of the 17 industries in 2006
(agriculture, mining, manufacturing, utilities, recycling, construction, retail trade and vehicle repairs, transportation
and storage, hospitality, information, �nance, real estate, business services, other services, public sector, education,
health). Population density, total population (in ln) and GDP per capita (in ln) are from 2000. Debt index is a
2003 measure of county household debt, calculated by credit rating agency Schufa. The export share is the fraction of
exports out of total revenue and the import share is the fraction of imports out of total costs, both averaged across �rms
in the county for 2006. Landesbank in crisis is a dummy for whether the county's Landesbank received public funding
during the �nancial crisis. The linear distances include the county's distances to Duesseldorf, Frankfurt, Hamburg,
Berlin, and Dresden. The regressions are weighted by year 2000 population. Standard errors are two-way clustered
at the level of the county's industrial production share (share out of GDP of agriculture, mining, manufacturing,
utilities, recycling, construction) and its population size, each split into 42 quantile bins.
49

(1) (2) (3) (4)VARIABLES
Commb dep*d -0.171 -0.167 -0.141 -0.141(0.051) (0.065) (0.070) (0.064)
Observations 5,005 5,005 5,005 5,005Number of counties 385 385 385 385County FE Yes Yes Yes YesYear FE Yes Yes Yes YesFormer GDR FE*d Yes Yes Yes YesIndustry Shares*d No Yes Yes YesPopulation*d No No Yes YesPop density*d No No Yes YesGDP per capita*d No No Yes YesDebt Index*d No No Yes YesExport and Import Shares*d No No No YesLandesbank in crisis*d No No No YesEstimator OLS OLS OLS OLS
Table 9: County ln GDP and Commerzbank dependence (OLS)
Notes: This table reports estimates from county panel OLS regressions of ln GDP on Commerzbank dependence
(Commb dep) interacted with d, a dummy for the years following the lending cut, 2009 to 2012. Commb dep is
the average fraction of bank relationships with Commerzbank branches for �rms in the county in 2006. The time-
invariant controls are also interacted with d. The industry shares are 17 variables, giving the fraction of �rms for
each of the 17 industries in 2006 (agriculture, mining, manufacturing, utilities, recycling, construction, retail trade
and vehicle repairs, transportation and storage, hospitality, information, �nance, real estate, business services, other
services, public sector, education, health). Population density, total population (in ln) and GDP per capita (in ln)
are from 2000. Debt index is a 2003 measure of county household debt, calculated by credit rating agency Schufa.
The export share is the fraction of exports out of total revenue and the import share is the fraction of imports out
of total costs, both averaged across �rms in the county for 2006. Landesbank in crisis is a dummy for whether the
county's Landesbank received public funding during the �nancial crisis. The regressions are weighted by year 2000
population. Standard errors are two-way clustered at the level of the county's industrial production share (share out
of GDP of agriculture, mining, manufacturing, utilities, recycling, construction) and its population size, each split
into 42 quantile bins.
50
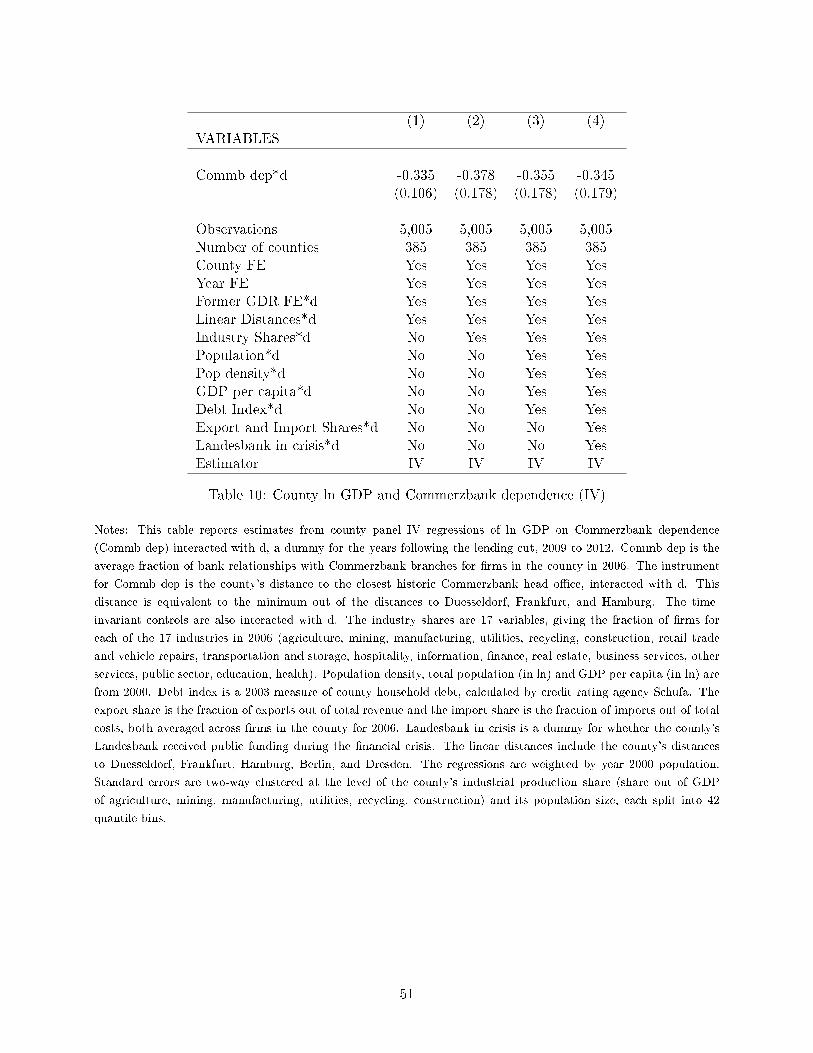
(1) (2) (3) (4)VARIABLES
Commb dep*d -0.335 -0.378 -0.355 -0.345(0.106) (0.178) (0.178) (0.179)
Observations 5,005 5,005 5,005 5,005Number of counties 385 385 385 385County FE Yes Yes Yes YesYear FE Yes Yes Yes YesFormer GDR FE*d Yes Yes Yes YesLinear Distances*d Yes Yes Yes YesIndustry Shares*d No Yes Yes YesPopulation*d No No Yes YesPop density*d No No Yes YesGDP per capita*d No No Yes YesDebt Index*d No No Yes YesExport and Import Shares*d No No No YesLandesbank in crisis*d No No No YesEstimator IV IV IV IV
Table 10: County ln GDP and Commerzbank dependence (IV)
Notes: This table reports estimates from county panel IV regressions of ln GDP on Commerzbank dependence
(Commb dep) interacted with d, a dummy for the years following the lending cut, 2009 to 2012. Commb dep is the
average fraction of bank relationships with Commerzbank branches for �rms in the county in 2006. The instrument
for Commb dep is the county's distance to the closest historic Commerzbank head o�ce, interacted with d. This
distance is equivalent to the minimum out of the distances to Duesseldorf, Frankfurt, and Hamburg. The time-
invariant controls are also interacted with d. The industry shares are 17 variables, giving the fraction of �rms for
each of the 17 industries in 2006 (agriculture, mining, manufacturing, utilities, recycling, construction, retail trade
and vehicle repairs, transportation and storage, hospitality, information, �nance, real estate, business services, other
services, public sector, education, health). Population density, total population (in ln) and GDP per capita (in ln) are
from 2000. Debt index is a 2003 measure of county household debt, calculated by credit rating agency Schufa. The
export share is the fraction of exports out of total revenue and the import share is the fraction of imports out of total
costs, both averaged across �rms in the county for 2006. Landesbank in crisis is a dummy for whether the county's
Landesbank received public funding during the �nancial crisis. The linear distances include the county's distances
to Duesseldorf, Frankfurt, Hamburg, Berlin, and Dresden. The regressions are weighted by year 2000 population.
Standard errors are two-way clustered at the level of the county's industrial production share (share out of GDP
of agriculture, mining, manufacturing, utilities, recycling, construction) and its population size, each split into 42
quantile bins.
51
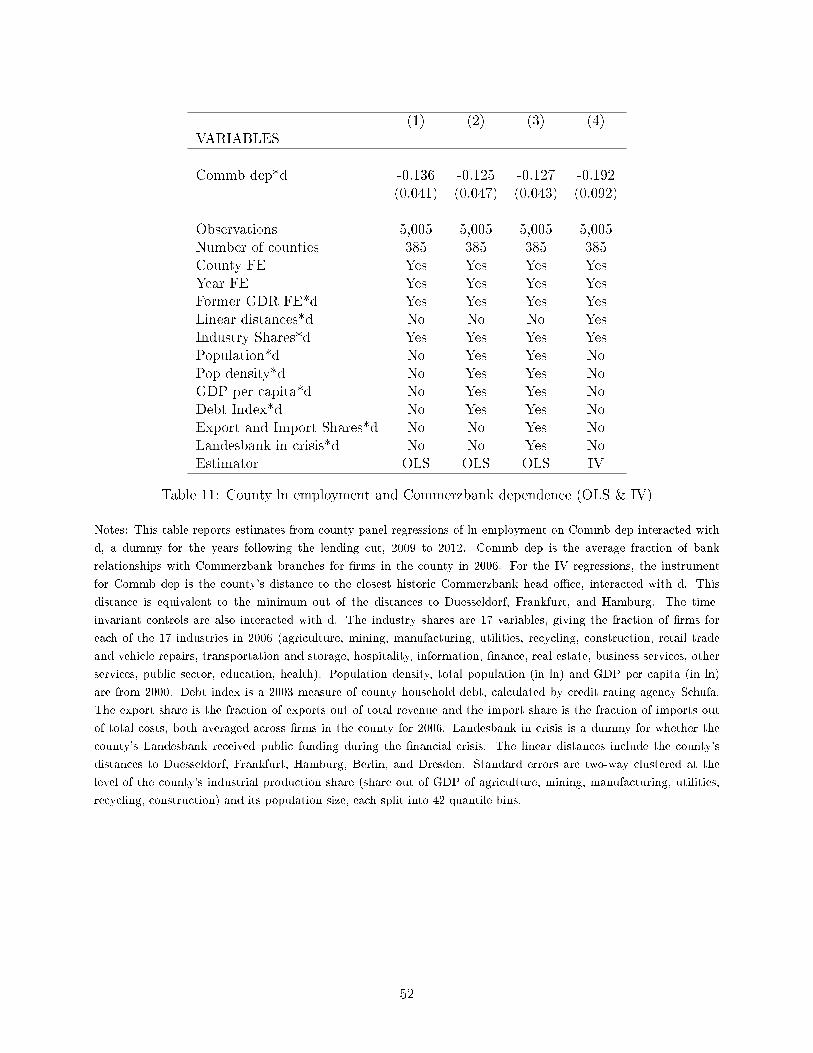
(1) (2) (3) (4)VARIABLES
Commb dep*d -0.136 -0.125 -0.127 -0.192(0.041) (0.047) (0.043) (0.092)
Observations 5,005 5,005 5,005 5,005Number of counties 385 385 385 385County FE Yes Yes Yes YesYear FE Yes Yes Yes YesFormer GDR FE*d Yes Yes Yes YesLinear distances*d No No No YesIndustry Shares*d Yes Yes Yes YesPopulation*d No Yes Yes NoPop density*d No Yes Yes NoGDP per capita*d No Yes Yes NoDebt Index*d No Yes Yes NoExport and Import Shares*d No No Yes NoLandesbank in crisis*d No No Yes NoEstimator OLS OLS OLS IV
Table 11: County ln employment and Commerzbank dependence (OLS & IV)
Notes: This table reports estimates from county panel regressions of ln employment on Commb dep interacted with
d, a dummy for the years following the lending cut, 2009 to 2012. Commb dep is the average fraction of bank
relationships with Commerzbank branches for �rms in the county in 2006. For the IV regressions, the instrument
for Commb dep is the county's distance to the closest historic Commerzbank head o�ce, interacted with d. This
distance is equivalent to the minimum out of the distances to Duesseldorf, Frankfurt, and Hamburg. The time-
invariant controls are also interacted with d. The industry shares are 17 variables, giving the fraction of �rms for
each of the 17 industries in 2006 (agriculture, mining, manufacturing, utilities, recycling, construction, retail trade
and vehicle repairs, transportation and storage, hospitality, information, �nance, real estate, business services, other
services, public sector, education, health). Population density, total population (in ln) and GDP per capita (in ln)
are from 2000. Debt index is a 2003 measure of county household debt, calculated by credit rating agency Schufa.
The export share is the fraction of exports out of total revenue and the import share is the fraction of imports out
of total costs, both averaged across �rms in the county for 2006. Landesbank in crisis is a dummy for whether the
county's Landesbank received public funding during the �nancial crisis. The linear distances include the county's
distances to Duesseldorf, Frankfurt, Hamburg, Berlin, and Dresden. Standard errors are two-way clustered at the
level of the county's industrial production share (share out of GDP of agriculture, mining, manufacturing, utilities,
recycling, construction) and its population size, each split into 42 quantile bins.
52
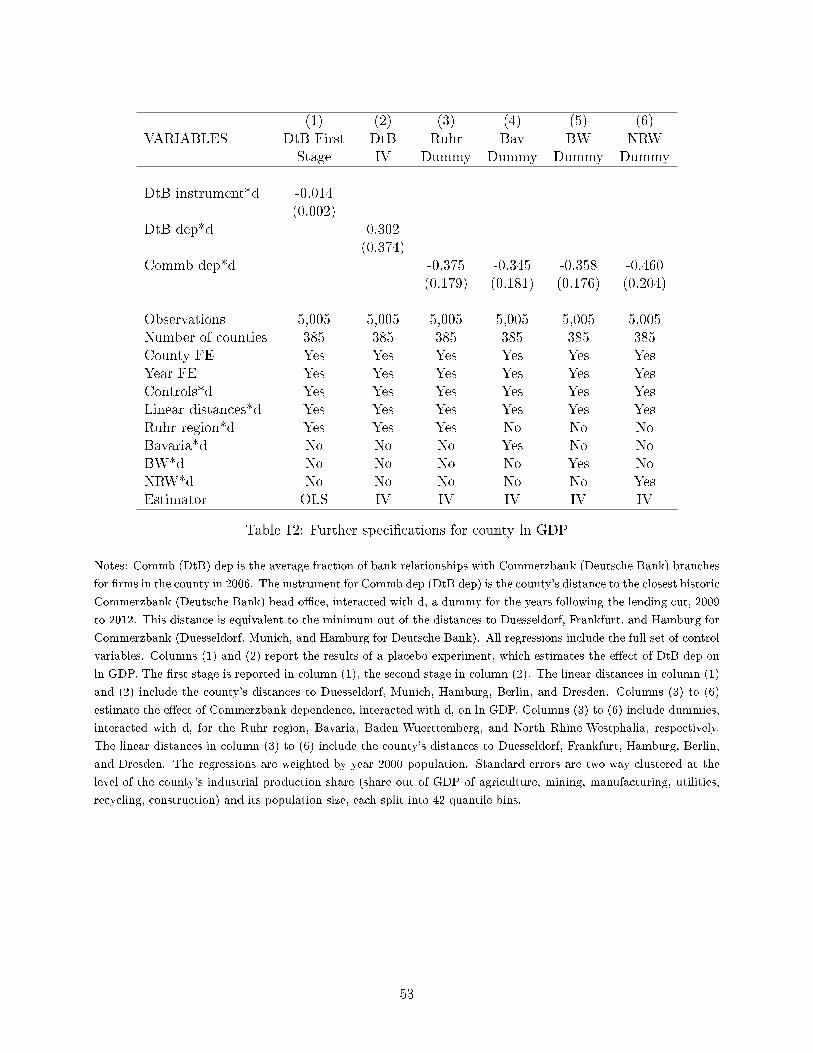
(1) (2) (3) (4) (5) (6)VARIABLES DtB First DtB Ruhr Bav BW NRW
Stage IV Dummy Dummy Dummy Dummy
DtB instrument*d -0.014(0.002)
DtB dep*d 0.302(0.374)
Commb dep*d -0.375 -0.345 -0.358 -0.460(0.179) (0.181) (0.176) (0.204)
Observations 5,005 5,005 5,005 5,005 5,005 5,005Number of counties 385 385 385 385 385 385County FE Yes Yes Yes Yes Yes YesYear FE Yes Yes Yes Yes Yes YesControls*d Yes Yes Yes Yes Yes YesLinear distances*d Yes Yes Yes Yes Yes YesRuhr region*d Yes Yes Yes No No NoBavaria*d No No No Yes No NoBW*d No No No No Yes NoNRW*d No No No No No YesEstimator OLS IV IV IV IV IV
Table 12: Further speci�cations for county ln GDP
Notes: Commb (DtB) dep is the average fraction of bank relationships with Commerzbank (Deutsche Bank) branches
for �rms in the county in 2006. The instrument for Commb dep (DtB dep) is the county's distance to the closest historic
Commerzbank (Deutsche Bank) head o�ce, interacted with d, a dummy for the years following the lending cut, 2009
to 2012. This distance is equivalent to the minimum out of the distances to Duesseldorf, Frankfurt, and Hamburg for
Commerzbank (Duesseldorf, Munich, and Hamburg for Deutsche Bank). All regressions include the full set of control
variables. Columns (1) and (2) report the results of a placebo experiment, which estimates the e�ect of DtB dep on
ln GDP. The �rst stage is reported in column (1), the second stage in column (2). The linear distances in column (1)
and (2) include the county's distances to Duesseldorf, Munich, Hamburg, Berlin, and Dresden. Columns (3) to (6)
estimate the e�ect of Commerzbank dependence, interacted with d, on ln GDP. Columns (3) to (6) include dummies,
interacted with d, for the Ruhr region, Bavaria, Baden-Wuerttemberg, and North Rhine-Westphalia, respectively.
The linear distances in column (3) to (6) include the county's distances to Duesseldorf, Frankfurt, Hamburg, Berlin,
and Dresden. The regressions are weighted by year 2000 population. Standard errors are two-way clustered at the
level of the county's industrial production share (share out of GDP of agriculture, mining, manufacturing, utilities,
recycling, construction) and its population size, each split into 42 quantile bins.
53
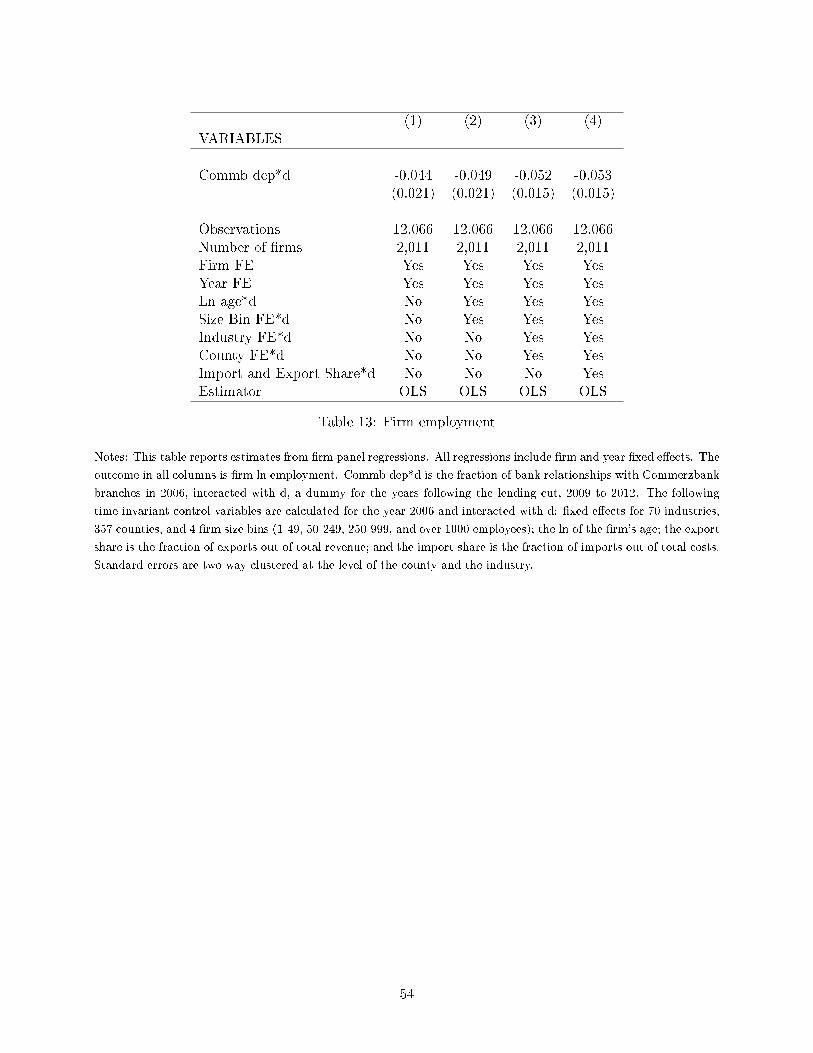
(1) (2) (3) (4)VARIABLES
Commb dep*d -0.044 -0.049 -0.052 -0.053(0.021) (0.021) (0.015) (0.015)
Observations 12,066 12,066 12,066 12,066Number of �rms 2,011 2,011 2,011 2,011Firm FE Yes Yes Yes YesYear FE Yes Yes Yes YesLn age*d No Yes Yes YesSize Bin FE*d No Yes Yes YesIndustry FE*d No No Yes YesCounty FE*d No No Yes YesImport and Export Share*d No No No YesEstimator OLS OLS OLS OLS
Table 13: Firm employment
Notes: This table reports estimates from �rm panel regressions. All regressions include �rm and year �xed e�ects. The
outcome in all columns is �rm ln employment. Commb dep*d is the fraction of bank relationships with Commerzbank
branches in 2006, interacted with d, a dummy for the years following the lending cut, 2009 to 2012. The following
time-invariant control variables are calculated for the year 2006 and interacted with d: �xed e�ects for 70 industries,
357 counties, and 4 �rm size bins (1-49, 50-249, 250-999, and over 1000 employees); the ln of the �rm's age; the export
share is the fraction of exports out of total revenue; and the import share is the fraction of imports out of total costs.
Standard errors are two-way clustered at the level of the county and the industry.
54
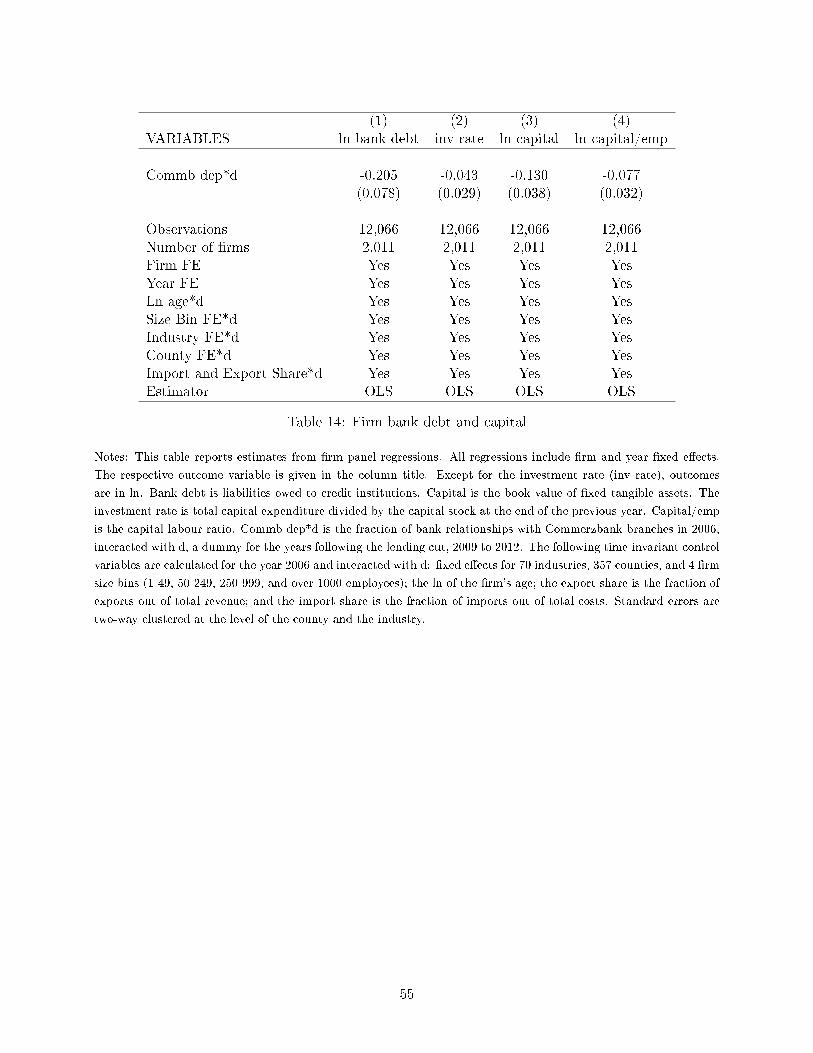
(1) (2) (3) (4)VARIABLES ln bank debt inv rate ln capital ln capital/emp
Commb dep*d -0.205 -0.043 -0.130 -0.077(0.078) (0.029) (0.038) (0.032)
Observations 12,066 12,066 12,066 12,066Number of �rms 2,011 2,011 2,011 2,011Firm FE Yes Yes Yes YesYear FE Yes Yes Yes YesLn age*d Yes Yes Yes YesSize Bin FE*d Yes Yes Yes YesIndustry FE*d Yes Yes Yes YesCounty FE*d Yes Yes Yes YesImport and Export Share*d Yes Yes Yes YesEstimator OLS OLS OLS OLS
Table 14: Firm bank debt and capital
Notes: This table reports estimates from �rm panel regressions. All regressions include �rm and year �xed e�ects.
The respective outcome variable is given in the column title. Except for the investment rate (inv rate), outcomes
are in ln. Bank debt is liabilities owed to credit institutions. Capital is the book value of �xed tangible assets. The
investment rate is total capital expenditure divided by the capital stock at the end of the previous year. Capital/emp
is the capital-labour ratio. Commb dep*d is the fraction of bank relationships with Commerzbank branches in 2006,
interacted with d, a dummy for the years following the lending cut, 2009 to 2012. The following time-invariant control
variables are calculated for the year 2006 and interacted with d: �xed e�ects for 70 industries, 357 counties, and 4 �rm
size bins (1-49, 50-249, 250-999, and over 1000 employees); the ln of the �rm's age; the export share is the fraction of
exports out of total revenue; and the import share is the fraction of imports out of total costs. Standard errors are
two-way clustered at the level of the county and the industry.
55

(1) (2) (3) (4)VARIABLES ln val add ln val add/capital ln val add/emp ln wage
Commb dep*d -0.061 0.069 -0.008 0.001(0.028) (0.038) (0.024) (0.011)
Observations 12,066 12,066 12,066 12,066Number of �rms 2,011 2,011 2,011 2,011Firm FE Yes Yes Yes YesYear FE Yes Yes Yes YesLn age*d Yes Yes Yes YesSize Bin FE*d Yes Yes Yes YesIndustry FE*d Yes Yes Yes YesCounty FE*d Yes Yes Yes YesImport and Export Share*d Yes Yes Yes YesEstimator OLS OLS OLS OLS
Table 15: Firm value added
Notes: This table reports estimates from �rm panel regressions. All regressions include �rm and year �xed e�ects.
The ln outcomes are given in the column title. Value added (val add) is revenue minus expenditure on intermediates.
Value added per worker (val add/emp) and per unit of capital (val add/cap) can be interpreted as labour and capital
productivity. The wage is the total wage bill divided by the number of employees. Commb dep*d is the fraction of bank
relationships with Commerzbank branches in 2006, interacted with d, a dummy for the years following the lending
cut, 2009 to 2012. The following time-invariant control variables are calculated for the year 2006 and interacted with
d: �xed e�ects for 70 industries, 357 counties, and 4 �rm size bins (1-49, 50-249, 250-999, and over 1000 employees);
the ln of the �rm's age; the export share is the fraction of exports out of total revenue; and the import share is
the fraction of imports out of total costs. Standard errors are two-way clustered at the level of the county and the
industry.
56
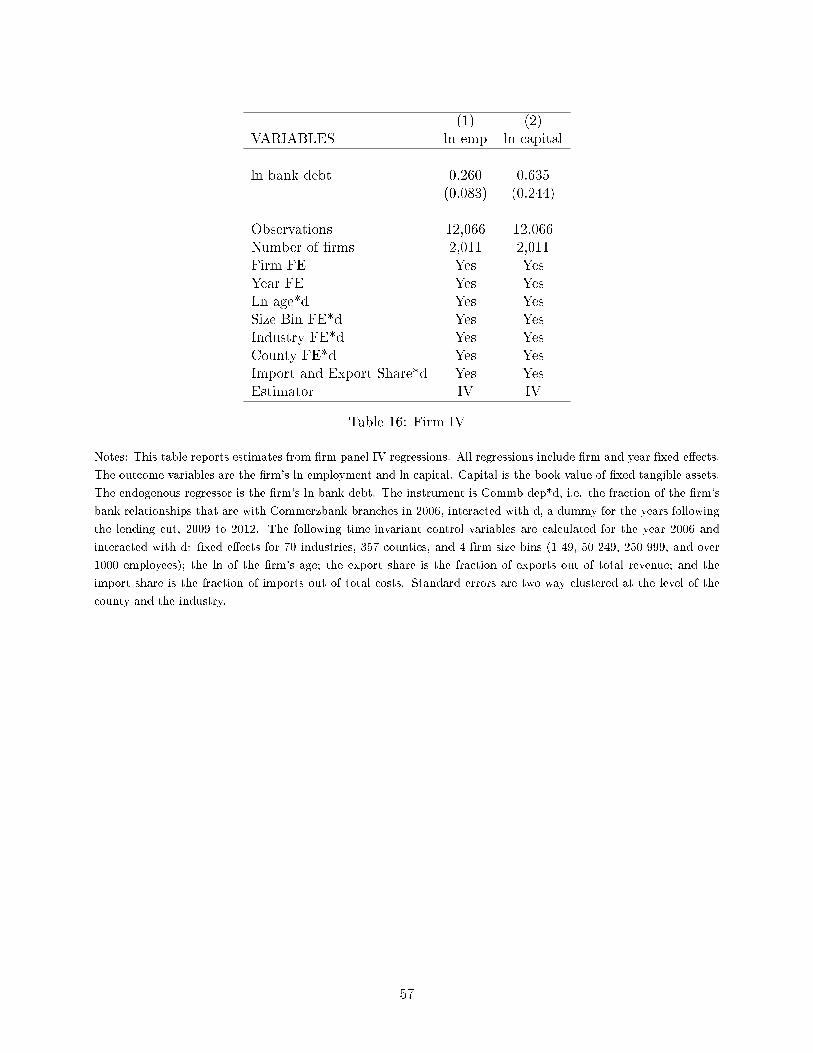
(1) (2)VARIABLES ln emp ln capital
ln bank debt 0.260 0.635(0.083) (0.244)
Observations 12,066 12,066Number of �rms 2,011 2,011Firm FE Yes YesYear FE Yes YesLn age*d Yes YesSize Bin FE*d Yes YesIndustry FE*d Yes YesCounty FE*d Yes YesImport and Export Share*d Yes YesEstimator IV IV
Table 16: Firm IV
Notes: This table reports estimates from �rm panel IV regressions. All regressions include �rm and year �xed e�ects.
The outcome variables are the �rm's ln employment and ln capital. Capital is the book value of �xed tangible assets.
The endogenous regressor is the �rm's ln bank debt. The instrument is Commb dep*d, i.e. the fraction of the �rm's
bank relationships that are with Commerzbank branches in 2006, interacted with d, a dummy for the years following
the lending cut, 2009 to 2012. The following time-invariant control variables are calculated for the year 2006 and
interacted with d: �xed e�ects for 70 industries, 357 counties, and 4 �rm size bins (1-49, 50-249, 250-999, and over
1000 employees); the ln of the �rm's age; the export share is the fraction of exports out of total revenue; and the
import share is the fraction of imports out of total costs. Standard errors are two-way clustered at the level of the
county and the industry.
57
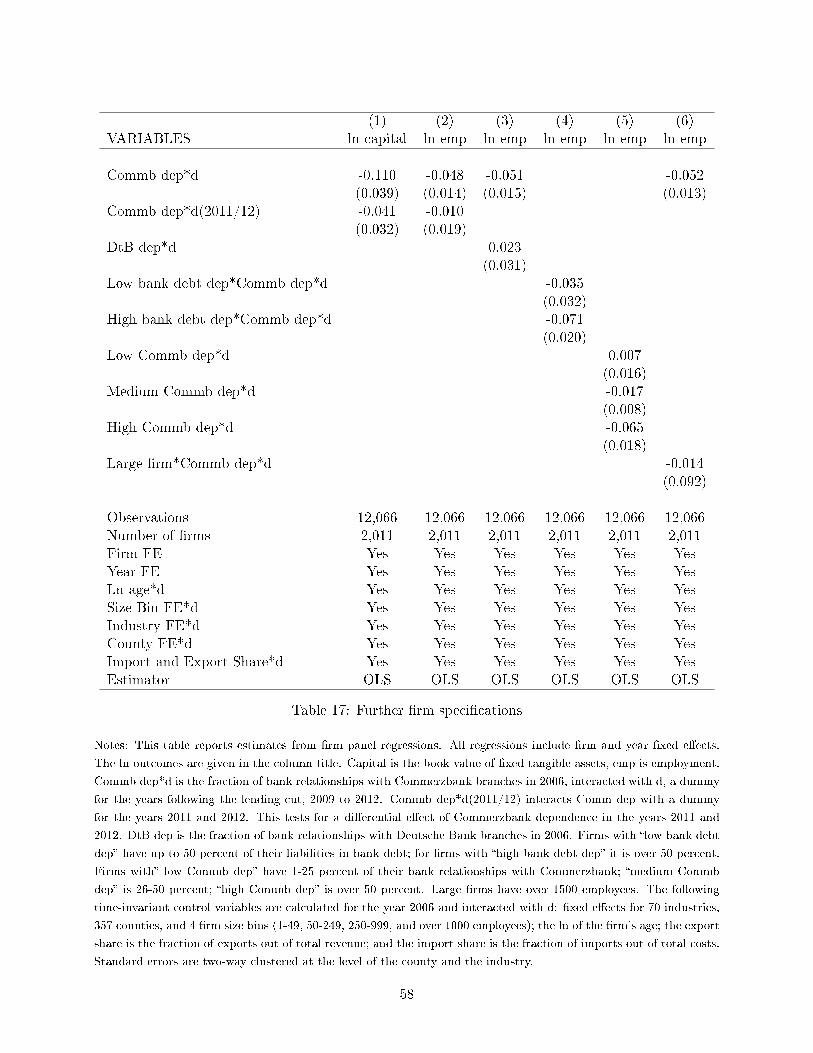
(1) (2) (3) (4) (5) (6)VARIABLES ln capital ln emp ln emp ln emp ln emp ln emp
Commb dep*d -0.110 -0.048 -0.051 -0.052(0.039) (0.014) (0.015) (0.013)
Commb dep*d(2011/12) -0.041 -0.010(0.032) (0.019)
DtB dep*d 0.023(0.031)
Low bank debt dep*Commb dep*d -0.035(0.032)
High bank debt dep*Commb dep*d -0.071(0.020)
Low Commb dep*d 0.007(0.016)
Medium Commb dep*d -0.017(0.008)
High Commb dep*d -0.065(0.018)
Large �rm*Commb dep*d -0.014(0.092)
Observations 12,066 12,066 12,066 12,066 12,066 12,066Number of �rms 2,011 2,011 2,011 2,011 2,011 2,011Firm FE Yes Yes Yes Yes Yes YesYear FE Yes Yes Yes Yes Yes YesLn age*d Yes Yes Yes Yes Yes YesSize Bin FE*d Yes Yes Yes Yes Yes YesIndustry FE*d Yes Yes Yes Yes Yes YesCounty FE*d Yes Yes Yes Yes Yes YesImport and Export Share*d Yes Yes Yes Yes Yes YesEstimator OLS OLS OLS OLS OLS OLS
Table 17: Further �rm speci�cations
Notes: This table reports estimates from �rm panel regressions. All regressions include �rm and year �xed e�ects.
The ln outcomes are given in the column title. Capital is the book value of �xed tangible assets, emp is employment.
Commb dep*d is the fraction of bank relationships with Commerzbank branches in 2006, interacted with d, a dummy
for the years following the lending cut, 2009 to 2012. Commb dep*d(2011/12) interacts Comm dep with a dummy
for the years 2011 and 2012. This tests for a di�erential e�ect of Commerzbank dependence in the years 2011 and
2012. DtB dep is the fraction of bank relationships with Deutsche Bank branches in 2006. Firms with �low bank debt
dep� have up to 50 percent of their liabilities in bank debt; for �rms with �high bank debt dep� it is over 50 percent.
Firms with� low Commb dep� have 1-25 percent of their bank relationships with Commerzbank; �medium Commb
dep� is 26-50 percent; �high Commb dep� is over 50 percent. Large �rms have over 1500 employees. The following
time-invariant control variables are calculated for the year 2006 and interacted with d: �xed e�ects for 70 industries,
357 counties, and 4 �rm size bins (1-49, 50-249, 250-999, and over 1000 employees); the ln of the �rm's age; the export
share is the fraction of exports out of total revenue; and the import share is the fraction of imports out of total costs.
Standard errors are two-way clustered at the level of the county and the industry.
58
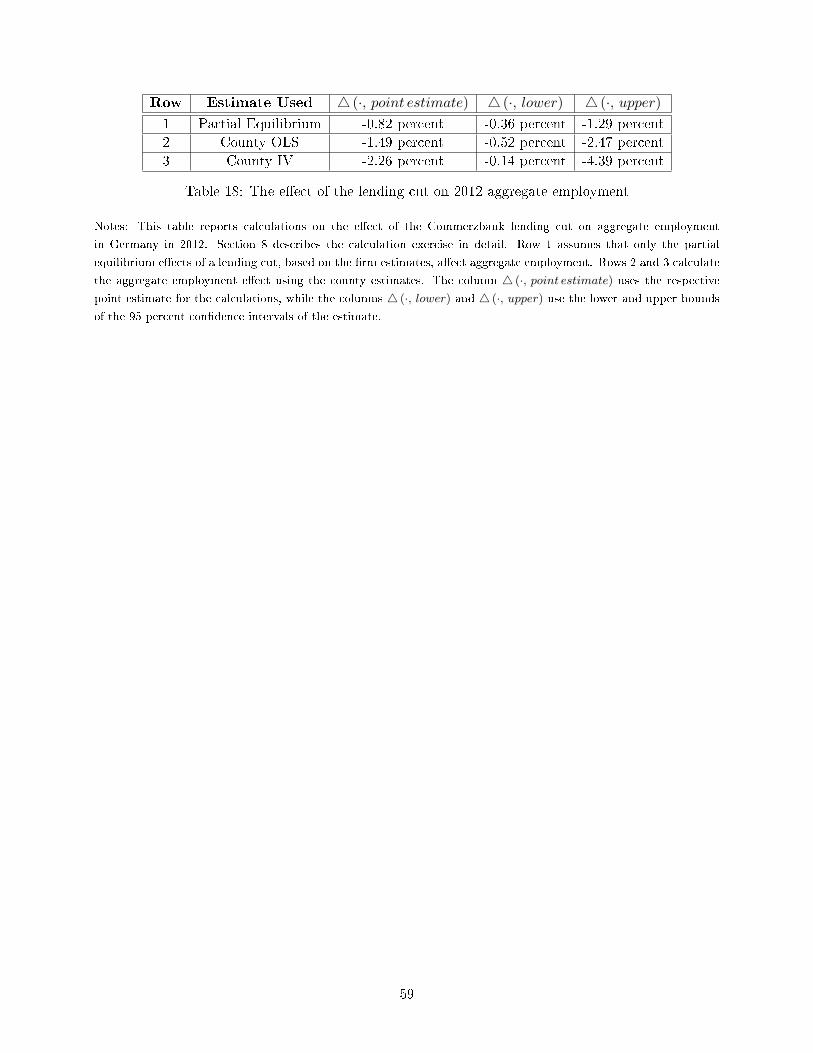
Row Estimate Used 4 (·, point estimate) 4 (·, lower) 4 (·, upper)1 Partial Equilibrium -0.82 percent -0.36 percent -1.29 percent
2 County OLS -1.49 percent -0.52 percent -2.47 percent
3 County IV -2.26 percent -0.14 percent -4.39 percent
Table 18: The e�ect of the lending cut on 2012 aggregate employment
Notes: This table reports calculations on the e�ect of the Commerzbank lending cut on aggregate employment
in Germany in 2012. Section 8 describes the calculation exercise in detail. Row 1 assumes that only the partial
equilibrium e�ects of a lending cut, based on the �rm estimates, a�ect aggregate employment. Rows 2 and 3 calculate
the aggregate employment e�ect using the county estimates. The column 4 (·, point estimate) uses the respective
point estimate for the calculations, while the columns 4 (·, lower) and 4 (·, upper) use the lower and upper bounds
of the 95 percent con�dence intervals of the estimate.
59