the pie charts below are divided into equal segments
DESCRIPTION
The pie charts below are divided into equal segments. By using the information in the pie chart and the number Red represents, write down the values for Blue, Green and Yellow. Red = 8 Blue = ? Green = ? Yellow = ?. Red = 4 x Blue = ? Green = ? Yellow = ?. Red = 12 Blue = ? - PowerPoint PPT PresentationTRANSCRIPT

The pie charts below are divided into equal segments. By using the information in the pie chart and the number Red represents, write down the values for Blue, Green and Yellow.
Red = 8 Blue = ?Green = ?Yellow = ?

Red = 12 Blue = ?Green = ?Yellow = ?
Red = 4x Blue = ?Green = ?Yellow = ?

108Tea sold = 540
36
601 2x
84Coffee sold = 540 2
3601 6x
36Chocolate sold = 54
050
364x
60Cola sold = 540
39
600x
24Milk = 540
33
606x
48Squash = 540
37
602x
Interpreting Pie Charts
Pie charts can be thought of as circle graphs. To calculate the quantities represented by each slice of the pie chart we need to take the angular fraction of the given total.
TeaCoffee
Cola
Squash
Milk
Chocolate
108o84o
60o
48o 36o
24o
360o
A drinks machine dispenses 540 drinks on a Monday. The information is displayed in the pie chart. Use the information to find the number of each drink sold.

75
90
45
60
30
Total 300
Rugby
Football
Cricket
Ice Hockey
Favourite Sport
Squash
90o108o
54o72o
36o
Interpreting Pie Charts
In a survey, 300 people were asked to indicate which one of five sports they liked best. The information is displayed in the pie chart. Calculate the number of people who chose each sport.
RugbyFo
otba
l
l
CricketIce Hockey
Squash
90Rugby = 300
37
605x
108Football = 300
369
00x
54Cricket = 300
34
605x
72Ice Hockey = 30
060
360x
36Squash = 300
33
600x

46Plain = 144
34
606x
40Chicken = 144
31
606x
46
16
22
26
34
Total 144
Interpreting Pie Charts
The information in the pie chart shows the sales of 144 packets of crisps from a shop. Calculate the number of each type sold.
Plain
Chicken
Salt & V
Cheese & On
Crisp Sales
Smokey Bacon
PlainChicken
Salt & V
Cheese & On
Smokey Bacon
115o40o
55o
65o85o55
Salt & V = 1443
260
2x
65Cheese & Onion = 14
024
366x
85Smokey Bacon = 14
034
364x

90o108o
54o72o
36o
RugbyFo
otba
l
l
CricketIce Hockey
Squash
1 2
PlainChicken
Salt & V
Cheese & On
Smokey Bacon
115o40o
55o
65o85o
300 people asked 144 packets sold
Worksheet 1

Musical Instruments
Total 90
35Guitar angle = 360 0
9014 ox
10Violin angle = 36 00
904 ox
15Recorder angle = 36 00
906 ox
5Drum angle = 360 0
902 ox
25Keyboard angle = 360 0
9010 ox
Drawing Pie Charts
In a survey, people were asked to indicate which one of five musical instruments they played. The information is given in the table. Display the information in a pie chart.
Guitar
Violin
Recorder
Drum
35
10
15
5
Musical Instrument
Keyboard 25

Total 90
Guitar35
Guitar angle = 360 090
14 ox
10Violin angle = 36 00
904 ox
15Recorder angle = 36 00
906 ox
5Drum angle = 360 0
902 ox
25Keyboard angle = 360 0
9010 ox
Drawing Pie Charts
In a survey, people were asked to indicate which one of five musical instruments they played. The information is given in the table. Display the information in a pie chart.
Guitar
Violin
Recorder
Drum
35
10
15
5
Musical Instrument
Keyboard 25

Total 90
Drawing Pie Charts
In a survey, people were asked to indicate which one of five musical instruments they played. The information is given in the table. Display the information in a pie chart.
Guitar
Violin
Recorder
Drum
35
10
15
5
Musical Instrument
Keyboard 25
Guitar
35Guitar angle = 360 0
9014 ox
10Violin angle = 36 00
904 ox
15Recorder angle = 36 00
906 ox
5Drum angle = 360 0
902 ox
25Keyboard angle = 360 0
9010 ox

Total 90
Drawing Pie Charts
In a survey, people were asked to indicate which one of five musical instruments they played. The information is given in the table. Display the information in a pie chart.
Guitar
Violin
Recorder
Drum
35
10
15
5
Musical Instrument
Keyboard 25
Guitar
Violin
35Guitar angle = 360 0
9014 ox
10Violin angle = 36 00
904 ox
15Recorder angle = 36 00
906 ox
5Drum angle = 360 0
902 ox
25Keyboard angle = 360 0
9010 ox

Total 90
Drawing Pie Charts
In a survey, people were asked to indicate which one of five musical instruments they played. The information is given in the table. Display the information in a pie chart.
Guitar
Violin
Recorder
Drum
35
10
15
5
Musical Instrument
Keyboard 25
Guitar
Vio
lin
Recorder
35Guitar angle = 360 0
9014 ox
10Violin angle = 36 00
904 ox
15Recorder angle = 36 00
906 ox
5Drum angle = 360 0
902 ox
25Keyboard angle = 360 0
9010 ox

Total 90
Drawing Pie Charts
In a survey, people were asked to indicate which one of five musical instruments they played. The information is given in the table. Display the information in a pie chart.
Guitar
Violin
Recorder
Drum
35
10
15
5
Musical Instrument
Keyboard 25
Guit
ar
Violin
Recorder
Drum
Keyboard
35Guitar angle = 360 0
9014 ox
10Violin angle = 36 00
904 ox
15Recorder angle = 36 00
906 ox
5Drum angle = 360 0
902 ox
25Keyboard angle = 360 0
9010 ox

Total 90
Drawing Pie Charts
In a survey, people were asked to indicate which one of five musical instruments they played. The information is given in the table. Display the information in a pie chart.
Guitar
Violin
Recorder
Drum
35
10
15
5
Musical Instrument
Keyboard 25
Guitar
Vio
lin
Reco
rder
Drum
Keyboard
140o
100o60o
40o
20o
35Guitar angle = 360 0
9014 ox
10Violin angle = 36 00
904 ox
15Recorder angle = 36 00
906 ox
5Drum angle = 360 0
902 ox
25Keyboard angle = 360 0
9010 ox

Ice Creams
Drawing Pie Charts
Total 120
13Vanilla angle = 360 9
1203 ox
Vanilla
Banana
Chocolate
Strawberry
13
22
28
57
Ice-cream SalesThe information in the table shows
sales of ice-cream from an ice-cream van one Saturday afternoon
in the summer. Display the information in a pie chart.
22Banana angle = 360 6
1206 ox
28Chocolate angle = 360 4
1208 ox
57Strawberry angle = 360 1
127
01 ox

Drawing Pie Charts
Total 120
Vanilla
Banana
Chocolate
Strawberry
13
22
28
57
Ice-cream SalesThe information in the table shows
sales of ice-cream from an ice-cream van one Saturday afternoon
in the summer. Display the information in a pie chart.
Van
ill
a
13Vanilla angle = 360 9
1203 ox
22Banana angle = 360 6
1206 ox
28Chocolate angle = 360 4
1208 ox
57Strawberry angle = 360 1
127
01 ox

Drawing Pie Charts
Total 120
Vanilla
Banana
Chocolate
Strawberry
13
22
28
57
Ice-cream SalesThe information in the table shows
sales of ice-cream from an ice-cream van one Saturday afternoon
in the summer. Display the information in a pie chart.
Van
illa
Banana
13Vanilla angle = 360 9
1203 ox
22Banana angle = 360 6
1206 ox
28Chocolate angle = 360 4
1208 ox
57Strawberry angle = 360 1
127
01 ox

Drawing Pie Charts
Total 120
Vanilla
Banana
Chocolate
Strawberry
13
22
28
57
Ice-cream SalesThe information in the table shows
sales of ice-cream from an ice-cream van one Saturday afternoon
in the summer. Display the information in a pie chart.
Banana
Vanilla
Chocolat
eStra
wberry
13Vanilla angle = 360 9
1203 ox
22Banana angle = 360 6
1206 ox
28Chocolate angle = 360 4
1208 ox
57Strawberry angle = 360 1
127
01 ox

Drawing Pie Charts
Total 120
Vanilla
Banana
Chocolate
Strawberry
13
22
28
57
Ice-cream SalesThe information in the table shows
sales of ice-cream from an ice-cream van one Saturday afternoon
in the summer. Display the information in a pie chart.
Banana
Van
ill
a
Cho
cola
te
Strawberry
39o66o
84o
171o
13Vanilla angle = 360 9
1203 ox
22Banana angle = 360 6
1206 ox
28Chocolate angle = 360 4
1208 ox
57Strawberry angle = 360 1
127
01 ox

Drawing pie charts
Use the data in the frequency table to complete the pie chart showing the favourite colours of a sample of people.
No of people
10
3
14
5
4
Favourite colour
Red
Yellow
Blue
Green
Purple
Total 36
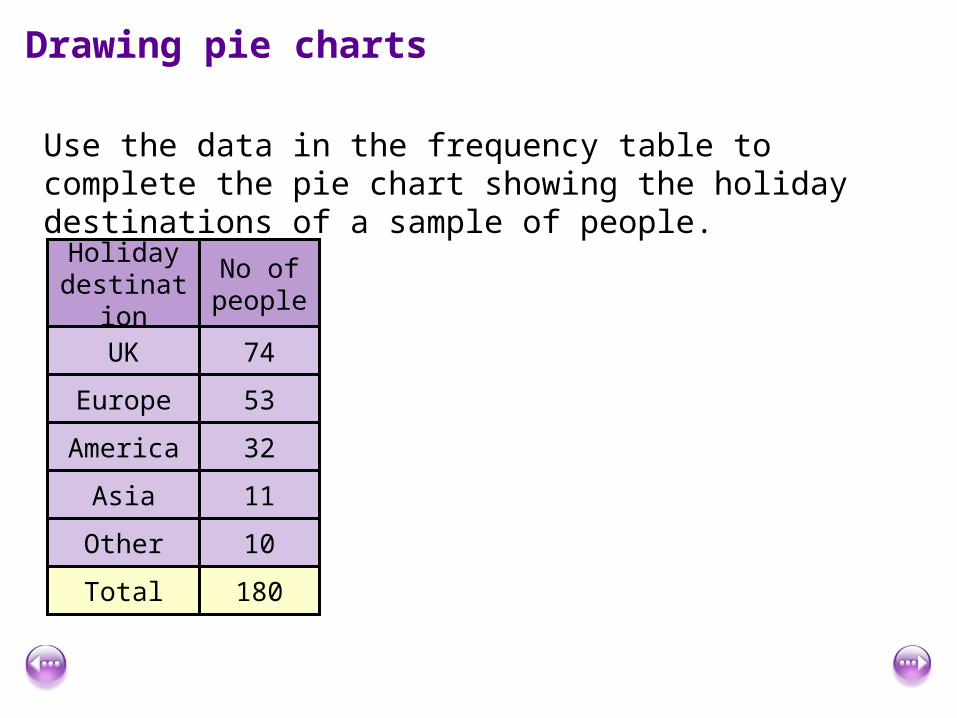
Drawing pie charts
Use the data in the frequency table to complete the pie chart showing the holiday destinations of a sample of people.
Holiday destination
No of people
UK 74
Europe 53
America 32
Asia 11
Other 10
Total 180

Worksheets
Total
Drawing Pie Charts
In a survey, people were asked to indicate which one of five musical instruments they played. The information is given in the table. Display the information in a pie chart.
Guitar
Violin
Recorder
Drum
35
10
15
5
Musical Instrument
Keyboard 25
Worksheet 2

Drawing Pie Charts
Total
Vanilla
Banana
Chocolate
Strawberry
13
22
28
57
Ice-cream SalesThe information in the table shows
sales of ice-cream from an ice-cream van one Saturday afternoon
in the summer. Display the information in a pie chart.
Worksheet 3