the plains nutrition council 2013 spring conference · i the plains nutrition council 2013 spring...
TRANSCRIPT

i
The Plains Nutrition Council
2013 Spring Conference
2012-13 Officers And Executive Committee
Matt cravey, President
Britt Hicks, 1st Vice President
Nathan elam, 2nd Vice President
Mark miller, Past President
Ted McCollum III, Secretary/Treasurer
The Plains Nutrition Council
6500 Amarillo Blvd West
Amarillo, Texas 79106

2
We appreciate the continued support of our 2013-14 Plains Nutrition Council Sponsors
PLATINUM
ELANCO RAMP - SWEET BRAN
GOLD PLUS DR. KENNETH AND CAROLINE MCDONALD ENG FOUNDATION
MERCK ANIMAL HEALTH NUTRITION PHYSIOLOGY CORP.
GOLD ZOETIS NOVA MICROBIAL TECHNOLOGIES ALLTECH CONESTOGA ENERGY GLOBAL ANIMAL PRODUCTS LALLEMAND ANIMAL NUTRITION LHOIST WESTWAY
ZINPRO
SILVER KEMIN AGRIFOODS MIN-AD QUALI TECH PIONEER
BRONZE
ADM ALLIANCE NUTRITION ANIMAL HEALTH INTERNATIONAL CARGILL ANIMAL NUTRITION DIAMOND V HUVEPHARMA LAND O’LAKES LESAFFRE FEED ADDITIVES MICRO MICRONUTRIENTS NOVUS INTERNATIONAL PHIBRO ANIMAL HEALTH PRINCE AGRIPRODUCTS SERVI-TECH LABS TATE & LYLE

3
The 2013 Plains Nutrition Council Spring Conference
Thursday, April 18
8:30 AM - 11:30 AM Preconference Symposium - presented and sponsored by Elanco
11:00 AM - 1:00 PM Graduate research poster presentations
2013 Plains Nutrition Council Spring Conference
1:00 PM Welcome and Introduction - Dr. Matt Cravey, Amarillo, TX
1:10 Domestic and Global Influences Shaping Markets for Beef, Cattle, and Feed
Commodities - Mr.Charles McVean, McVean Trading & Investments, Memphis, TN
2:00 Sorting Feedlot Cattle - Can We Improve Management and Marketing? -
Dr. Steve Armbruster, Steve Armbruster Consulting, Stillwater, OK
2:45 Break and View Graduate Research Poster Presentations
3:15 Research Update – Dr. Harvey Freetly, USDA-ARS, Clay Center, NE
3:45 AIP: Etiology, Management and Environment - Dr. Tim McAllister, Agriculture
and Agri-Food Canada, Lethbridge, Alberta
4:30 Foot Health in Feedlot Cattle - Dr. Shane Terrell, Kansas State Univ., Manhattan
5:15 View Graduate Research Poster Presentations
6:00-7:30 Evening Reception Sponsored by RAMP– Sweet Bran Cargill
Friday, April 19
8:00 AM PNC Business Meeting
8:30 Revision of the NRC Requirements for Beef Cattle - Dr. Mike Galyean, Texas
Tech Univ., Lubbock, Dr. Andy Cole, USDA-ARS, Bushland, TX, Dr. Clint Krehbiel,
Oklahoma State Univ., Stillwater, Dr. Galen Erickson, Univ. of Nebraska, Lincoln
9:00 Growing/Backgrounding Programs for Calves - Management Regimens,
Carryover Influences on Finishing Performance, Carcass Weights and Carcass
Composition - Dr. Robbi Pritchard, South Dakota State Univ., Brookings
9:45 Dr. Kenneth and Caroline Eng Foundation Graduate Student Recognition - Dr.
Kenneth Eng, San Antonio, TX, and Dr. Nathan Elam, Nutrition Services Assoc.,
Hereford, TX
10:00 Break
10:30 Research Update - Dr. Chris Reinhardt, Kansas State University, Manhattan
11:00 Feed Grains, Processing, and Feeding Value – Dr. Fred Owens, Pioneer Hi-bred
International, Johnston, IA
12:00PM Adjourn

4
Sponsor 2013 Pre-conference Symposium

5
Sponsor 2013 Thursday Evening Reception

6

7
TABLE OF CONTENTS
Invited Presentations Page
Sorting Feedlot Cattle by Body Weight
S. L. Armbruster, Steve Armbruster Consulting, Inc., Stillwater, OK, P. T. Anderson,
Midwest PMS, LLC, Firestone, CO, and M.N. Streeter, Merck Animal Health, DeSoto,
KS.………………….………………………………………………………………………………... 20
AIP: Etiology, Management and Environment
Tim McAllister, Agriculture and Agri-Food Canada, Lethbridge, AB……………………… 44
Lameness in Feedlot Cattle
Shane Terrell, Kansas State University, Manhattan…………………………………………... 51
Revision of the NRC Requirements for Beef Cattle
Mike Galyean, Texas Tech University, Lubbock, Andy Cole, USDA-ARS, Bushland,
TX, Clint Krehbiel, Oklahoma State University, Stillwater, and Galen Erickson,
University of Nebraska, Lincoln……...………………….………………………………..…….. 58
Growing/Backgrounding Programs for Calves - Management Regimens,
Carryover Influences on Finishing Performance, Carcass Weights and Carcass
Composition
Robbi Pritchard, South Dakota State University, Brookings…..…………………………….. 65
Grain Processing: Gain and Efficiency Responses by Feedlot Cattle
Fred Owens, DuPont Pioneer, Johnston, IA and Mehmet Basalan, Kirikkale
University, Kirikkale, Turkey………………………………………………………………..……. 76
Research Updates
Research Update - USDA-ARS Meat Animal Research Center Harvey Freetly and Kristin Hales, USDA-ARS, Clay Center, NE………………………….. 102
Research Update - Kansas State University
Chris Reinhardt and Dan Thomson, Kansas State University, Manhattan ……..……….. 108

8
Graduate Student Research Poster
Recognition
The Dr. Kenneth and Caroline McDonald
Eng Foundation

9
TABLE OF CONTENTS (cont'd)
Graduate Student Research Poster Presentations Page
Co-prilling flaxseed and dolomitic hydrate to decrease ruminal biohydrogenation
of polyunsaturated fatty acids C.A. Alvarado1, D.O. Sousa
1, E. van Cleef
1, K.A.
Miller1, C.L. Van Bibber-Krueger
1, F. Scarpino
1, D. Klamfoth
2, and J.S. Drouillard
1,
1Kansas State University, Manhattan,
2Lhoist North America, Fort Worth, TX…….…… 121
The effects of Bovamine® DefendTM
on prevalence and concentration of
Escherichia coli O157:H7, non-O157 O types and Salmonella in finishing steers
S. N. Aragon1, F. R. B Ribeiro
1, L. M. Guillen
1, R. A. McDonald
2, D. R. Ware
2, W. M.
Kreikemeier2, R. S. Swingle
3, M. M. Brashears
1, G. H. Loneragan
1, and B. J. Johnson
1,
1Texas Tech University, Lubbock,
2Nutrition Physiology Company, LLC, Guymon, OK,
3Cactus Operating, LLC, Amarillo, TX……….…………………………..………….….…… 122
Effects of restricted versus conventional dietary adaptation over periods of 9 or 14
days on feedlot of Nellore cattle R. S. Barducci1, M. D. B. Arrigoni
1, and C. L.
Martins1, São Paulo State University (UNESP), Botucatu, São Paulo, Brazil
1………….… 122
Effect of level and source of supplemental protein on rate of ruminal ammonia
production and concentrations of amino acid-utilizing and trypticase-metabolizing
bacteria in Bos taurus and Bos indicus steers fed low-quality forage N. L. Bell1,
R. C. Anderson2, S. L. Murray
1, J. C. McCann
1, K. K. Weldon
1, and T. A. Wickersham
1,
1Texas A&M University, College Station,
2USDA/ARS, College Station.……………......... 123
Comparison of NRC and industry dietary trace mineral standards for yearling
feedlot steers C.J. Berrett, J.J. Wagner, K.L. Neuhold, E. Caldera, and T.E. Engle,
Colorado State University, Department of Animal Science, Fort Collins………………….. 124
Corn Silage: New Thoughts on an Old Ingredient D. B. Burken, B. L. Nuttelman,
J. L. Harding, T. C. Hoegemeyer, T. J. Klopfenstein, and G. E. Erickson, University of
Nebraska, Lincoln………………………………………………………………………………..... 124
Effect of zinc concentration and source on performance and carcass characteristics
of feedlot steers E. Caldera, J. J. Wagner K. L. Neuhold, G. I. Zanton, K. Sellins, and
T. E. Engle, Colorado State University, Department of Animal Sciences, Fort Collins….. 125
Effect of urea inclusion in diets containing dried distillers grains on total tract
digestibility and ruminal fermentation in feedlot cattle I. Ceconi1, M. Ruiz-
Moreno2, A. DiCostanzo
1, and G. I. Crawford
1,
1 University of Minnesota, Saint
Paul, 2 University of Florida, Marianna………………….……………………………………. 126
Immunogenic inhibition of prominent ruminal bacteria as a means to reduce
lipolysis and biohydrogenation in vitro H. D. Edwards1, R. C. Anderson
2, W. L.
Shelver3, N. A. Krueger
2, D. J. Nisbet
2, and S. B. Smith
1,
1Texas A&M University,
College Station, 2USDA/ARS, College Station,
3USDA/ARS, Fargo, ND..……………..…. 127

10

11
TABLE OF CONTENTS (cont'd)
Graduate Student Research Presentations Page
Case Study: Arrival Bovine Respiratory Disease titers and subsequent morbidity
and performance of newly received cattle from New Mexico ranches and south
Texas livestock auctions J. R. Graves1, M. E. Hubbert
2, J. S. Schutz
2, C. A. Löest
1,
and E. J. Scholljegerdes1,
1Department of Animal and Range Sciences, New Mexico
State University, Las Cruces, 2Clayton Livestock and Research Center, New Mexico
State University, Clayton……………………………………………………………………….… 127
Effect of Rumensin and Amaferm on performance of heifers fed high roughage
mixed diets in dry lot and grazed on high quality forage H. C. Gray, P. Beck, K.
Glaubius, and B. Stewart, Department of Animal Science, University of Arkansas,
Fayetteville..…………………………..………………………………………………………... 128
Evaluation of near-infrared reflectance spectroscopy for nutrient prediction of
wheat and barley entering feedlots in western Canada A. R. Harding1, C. F.
O’Neill1, M. L. May
2, L. O. Burciaga-Robles
2, and C. R. Krehbiel
1,
1Department of
Animal Science, Oklahoma State University, Stillwater, 2Feedlot Health Management
Services Ltd., Okotoks, Alberta, Canada…………………………………………………......... 129
Interactive effects of zinc and ractopamine hydrochloride on the β-adrenergic
receptor T.L. Harris1 , A. D. Hosford
1, M. J. Anderson
1, C. K. Larson
2, and B. J.
Johnson1,
1Department of Animal and Food Sciences, Texas Tech University, Lubbock,
2Zinpro Corporation, Eden Prairie, MN………………………………………………………... 130
Comparing condensed distillers solubles concentration in steam-flaked and dry-
rolled corn finishing diets on cattle performance and carcass characteristics M. E.
Harris1, A. H. Titlow
1, A. L. Shreck
1, S. A. Furman
2, G. E. Erickson
1, K. H. Jenkins
2,
and M. K. Luebbe2, 1
Department of Animal Science, University of Nebraska, Lincoln, 2University of Nebraska, Lincoln, Panhandle Research and Extension Center,
Scottsbluff………………………………………………………………………………...….. 130
Effects of corn processing methods on fermentation/digestion characteristics and
feedlot performance of steers fed no-roughage diets R. M. Harvey, J. Sexten, and
M. S. Kerley, Animal Sciences, University of Missouri, Columbia……………………..…… 131
Effect of high dosage ractopamine hydrochloride on growth performance and
carcass characteristics of Holstein steers J. E. Hergenreder1, J. L. Beckett
2, J.
Homm3, and B. J. Johnson
1,
1Department of Animal and Food Science, Texas Tech
University, Lubbock, TX, 2Beckett Consulting Services, Fallbrook, CA ,
3Elanco
Animal Health, Greenfield, IN……………………….…………………………………………… 132

12

13
TABLE OF CONTENTS (cont'd)
Graduate Student Research Presentations Page
Effects of a terminal sorting system with zilpaterol hydrochloride on feedlot
performance and carcass characteristics of yearling steers F.H. Hilscher1, G.E.
Erickson1, D. B. Burken
1, B.L. Nuttelman
1, K. J. Vander Pol
2 , and J.P. Hutcheson
2,
1University of Nebraska-Lincoln,
2Merck Animal Health, De Soto, KS…………………….. 133
Effects of supplemental lysine and methionine with zilpaterol hydrochloride on
feedlot performance, carcass characteristics, and tenderness in finishing feedlot
cattle A.D. Hosford1, W. Rounds
2, and B. J. Johnson
1, 1
Department of Animal and
Food Science, Texas Tech University, Lubbock, 2Kemin Industries, Inc., North
America, Des Moines, IA.…………………………………………………………………………. 133
Effects of wet distillers grains and condensed distillers solubles on growth
performance and carcass characteristics of finishing steers H.D. Hughes, M.S.
Brown, K.J. Kraich, J. Simroth-Rodriguez, and J.O. Wallace, West Texas A&M
University, Canyon…………………………………………………..……………………..……… 134
Effects of corn processing method and dietary inclusion of corn wet distillers
grains with solubles (WDGS) on nutrient metabolism and enteric gas production
in finishing steers J. P Jaderborg1, G. I. Crawford
1, A. DiCostanzo
1, M. J. Spiehs
2, and
K. E. Hales3 ,
1Animal Science, University of Minnesota, Saint Paul,
2Environmental
Management Unit, USDA-ARS U.S. Meat Animal Research Center, 3Nutrition Research
Unit, USDA-ARS Meat Animal Research Center, Clay Center, NE………..……………….. 135
Impact of postweaning residual feed intake in heifers on efficiency of forage
utilization, heart rate and physical activity of pregnant cows A.N. Hafla, J.R.
Johnson, G.E. Carstens, T.D.A. Forbes, L.O. Tedeschi, J.C. Bailey, J.T. Walter, and
J.G. Moreno, Department of Animal Science, Texas A&M University, College Station.… 135
The effects of corn oil removal from distillers grains plus solubles on finishing
performance and carcass characteristics M. L. Jolly, B. L. Nuttelman, D. B. Burken,
C. J. Schneider, G. E. Erickson, and T. J. Klopfenstein, University of Nebraska, Lincoln. 136
Effects of postruminal amino acid supply on dietary protein flow from the rumen
of a forage-based diet using a continuous culture system M. M. Masiero, J. H.
Porter, M. S. Kerley, and W. J. Sexten, University of Missouri, Columbia..…..…............. 137
Advantages of technology enhanced beef production systems C. L. Maxwell1, B. K.
Wilson1, B. T. Johnson
1, B. C. Bernhard
1, D. L. VanOverbeke
1, D. L. Step
2, C. J.
Richards1, and C. R. Krehbiel
1, 1Department of Animal Science, and
2Department of
Veterinary Clinical Sciences, Oklahoma State University, Stillwater................................ 138

14

15
TABLE OF CONTENTS (cont'd)
Graduate Student Research Presentations Page
Effects of cottonseed meal and dried distillers grains supplementation on rice straw
utilization by Brahman steers J. C. McCann, J. E. Sawyer, and T. A. Wickersham,
Texas A&M University, College Station..………………………….………………………... 138
Lactipro improves performance and health of high-risk calves after feedlot arrival
Kevin Miller, Cadra Van Bibber-Krueger, and Jim Drouillard, Kansas State University
Manhattan..……………………………………………………………………………………..….. 139
Prediction of barley silage dry matter by near infrared reflectance spectroscopy
C. F. O’Neill1, A. R. Harding
1, S. E. Murray
1, M. L. May
3, L. O. Burciaga-Robles
3,
O. R. Rasmussen2, and C. R. Krehbiel
1 ,
1Department of Animal Science, Oklahoma
State University, Stillwater, FOSS North America, Eden Prairie, MN, 3Feedlot Health
Management Services Ltd, Alberta, Canada………………………………………....…..….... 140
Effect of skeletal muscle fiber heterogeneity on development of intramuscular fat in
growing beef cattle S.L. Roberts, P.A. Lancaster, U. DeSilva, G.W. Horn, and C.R.
Krehbiel, Department of Animal Science, Oklahoma State University, Stillwater……….….... 140
Wet distillers grain and solubles vs. wet corn gluten feed for newly received and
growing cattle E.R. Schlegel1, S.P. Montgomery
2, C.I. Vahl
1, B.E. Oleen
1, W.R.
Hollenbeck1, and D.A. Blasi
1,
1Kansas State University,
2Corn Belt Livestock Services,
Cedar Rapids, IA…………................................................................................................... 141
Using RAMP to eliminate grain adaptation diets C.J. Schneider, B.L. Nuttelman,
A.L. Shreck, D.B. Burken, T.J. Klopfenstein, and G.E. Erickson, University of
Nebraska, Lincoln……………………………...……………………………………..……….…. 142
Effects of exchanging supplemental N with condensed distillers solubles on growth
performance and carcass characteristics of feedlot steers J. Simroth-Rodriguez1,
M. S. Brown1, J. Kawas
2, J. Wallace
1, B. Coufal
1, R. Butler
1, H. Hughes
1, K. Kraich
1,
and B. Mendonca1,
1Feedlot Research Group, West Texas A&M University, Canyon
and 2Facultad de Agronomía, Universidad Autónoma de Nuevo Leon, Monterrey,
Nuevo Leon, Mexico..…………………………..……………………………………..…………. 143
Non-protein nitrogen supplements to enhance low-quality forage utilization C.C.
Stefan, J.E. Sawyer, and T.A. Wickersham , Texas A&M University, College Station.….. 143
Relationship between chemical intramuscular fat percent measured by FOSS with
ultrasound, carcass, and camera marbling scores A. J. Thompson, F. R. B. Ribeiro,
S. N. Aragon, W.C. Burson, J. Baggerman, A. Romano, A. D. Hosford, J. E.
Hergenreder, and B. J. Johnson, Department of Animal and Food Sciences, Texas Tech
University, Lubbock....…………………………..……………………………………..………… 144

16

17
TABLE OF CONTENTS (cont'd)
Graduate Student Research Presentations Page
The effect of calf age at weaning on cow and calf performance and efficiency in a
drylot/confinement production system J. M. Warner, K. H. Jenkins, R. J. Rasby,
M. K. Luebbe, G. E. Erickson, and T. J. Klopfenstein, University of Nebraska, Lincoln… 145
Effect of supplemental protein amount and degradability on intake and digestion
in Bos indicus and Bos taurus steers fed rice straw K.K. Weldon, J.C. McCann, J.E.
Sawyer, and T.A. Wickersham, Texas A&M University, College Station…………………... 145
Effects of Next Enhance 300 on in vitro fermentation, feedlot performance, carcass
characteristics, meat quality, and consumer sensory characteristics of Longissimus
steaks of beef steers M.C. Westerhold1, Z.D. Callahan
1, M.S. Kerley
1, C.L. Lorenzen
1,
W.J. Sexten1, B.R. Wiegand
1, and T.J. Wistuba
2,
1Division of Animal Sciences,
University of Missouri, Columbia, 2Novus International Inc., St. Charles, MO…………... 146
The effect of Aspergillus oryzae extract on feedlot performance and carcass merit
In yearling steers fed steam-flaked corn based finishing diets K.A. White1, J.J.
Wagner2, T.E. Engle
1, D.R. Woerner
1, R.K. Peel
1, T.C. Bryant
2, J.S. Jennings
3, and K.M.
Brennan3,
1Animal Sciences Department, Colorado State University, Fort Collins,
2JBS
Five Rivers Cattle Feeding, Greeley, CO, 3Alltech, Inc., Nicholasville, KY………..……... 147
Evaluation of multiple ancillary therapies utilized in combination with an
antimicrobial in newly received, high-risk calves treated for bovine respiratory
disease B. K. Wilson1, C. L. Maxwell
1, D. L. Step
2, C. J. Richards
1, and C. R. Krehbiel
1,
1Department of Animal Science, Oklahoma State University, Stillwater,
2Department of
Veterinary Clinical Sciences, Oklahoma State University, Stillwater………………….…… 147

18

19

20
Sorting Feedlot Cattle by Body Weight
S. L. Armbruster1, P. T. Anderson
2 and M. N. Streeter
3
1Steve Armbruster Consulting, Inc., Stillwater, OK
2Midwest PMS, LLC, Firestone, CO
3Merck Animal Health, DeSoto, KS
Introduction
Many cattle feeders are asking their consultants for recommendations regarding sorting feedlot
cattle. Sorting has potential to increase the value of cattle and improve industry-wide product
profile but has associated costs and risks. Applicable research is limited, and specific sorting
strategies are not well proven.
The primary reason to consider sorting is the opportunity to increase the value of a group of
cattle by increasing the value of some of the individual animals within the group. Avoiding
discounts or achieving premiums increases individual animal value. Weight-related discounts
are the most critical to focus on because they have greater economic impact than quality grade or
yield grade factors (Table 1). Weight is also more easily and accurately identified than other
traits, so most current sorting systems focus solely or largely on individual animal live or carcass
weight.
Each National Beef Quality Audit (NBQA) conducted since 1995 listed some measure of size or
uniformity among the highest priority challenges for the industry (Figure 1) so improving the
weight profile of the population would provide industry benefits as well. Other high priority
industry challenges could be addressed by sorting as well. Improving the USDA quality or yield
grade profile of the population would increase value, but muscling and fatness are not easily
quantified in live animals.
Earlier Research
Although numerous studies on sorting have been published, they differed widely in design so
pooling data for a comprehensive overview of the research is not possible. Several trials were
conducted with yearlings from a common grazing background or with calves from a small
number of cow herds (MacDonald et al., 2006; Folmer et al., 2008; Griffin et al., 2009). These
research animals likely were more uniform in genetics, weight, frame, age, and body condition
than many cattle entering commercial feedlots, especially from sale-barn origins.
Sorting trials have been conducted almost exclusively with steers. Considering gender
differences in physiology and growth performance, it could be potentially misleading to
extrapolate sorting data from steers to heifers. In this review, references and comments are for
steers unless noted otherwise.
The majority of research was conducted in small pens with relatively low numbers of animals
(MacDonald et al., 2006; Folmer et al., 2008; Griffin et al., 2009; Hussey et al., 2012; Rolf et
al., 2012). Inherently, there is the question of applicability of small-pen results to large-pen

21
environments. Larger populations might be necessary to evaluate data occurring at low
frequency or to define meaningful distributions of values.
In most studies, sorted steers were fed 1-2 weeks longer and subsequently to heavier weights
than unsorted steers (MacDonald et al., 2006; Folmer et al., 2008; Griffin et al., 2009; Hussey et
al., 2012; Rolf et al., 2012). Those outcomes were by design, because researchers assumed
sorted steers would have less variation in hot carcass weight (HCW), thereby reducing discounts
for carcasses that were too heavy and/or too fat. Consequently, the effects of sorting per se were
confounded by differences between sorted and unsorted steers in days on feed (DOF) and HCW.
Typically steers were sorted by body weight (BW) only once, upon entry into the feedlot
(MacDonald et al., 2006; Folmer et al., 2008; Griffin et al., 2009; Rolf et al., 2012). Limited
research has been reported regarding the effects of sorting at reimplant or nearer slaughter
(Hussey et al., 2012). None included sorting a pen more than once during the finishing period.
Further, no studies were designed to examine the comingling effects of sorting on health,
behavior, or feed intake.
Usually steers were sorted upon entry into three outcome groups, with dissimilar numbers of
steers among the groups (Folmer et al., 2008; Griffin et al., 2009; Rolf et al., 2012). Although
the middle-weight sort was usually the largest head count, the proportion among sort groups
varied from trial to trial. Sorting into groups of disproportionate size might fit the population
better but can create issues in feedlots, especially for light and heavy sorts. Challenges include
inefficient use of pen space and prolonged periods required to complete lots for cattle sorted on
entry. Other sorting strategies examined to a limited extent included 2-way sorting by entry BW
(MacDonald et al., 2006), or “topping off” of pens near the end of the finishing period (Cooper et
al., 2000; Hussey et al., 2012).
Sorting steers by BW alone had no consistent or predictable effect on dry matter intake, average
daily gain or feed efficiency (MacDonald et al., 2006; Folmer et al., 2008; Griffin et al., 2009;
Hussey et al., 2012; Rolf et al., 2012). Because sorted steers were often fed longer and to
heavier weights, one could extrapolate that sorting by BW slightly improved performance in
cattle fed to a common weight. A conservative conclusion is that sorted steers fed 1-2 weeks
longer had similar daily gain and feed efficiency, compared to unsorted contemporaries.
Sorting steers reduced variation in final BW (Folmer et al., 2008; Griffin et al., 2009). Across
studies, ranges in standard deviation (SD) for final BW were 62 to 78 lb and 99 to 100 lb in
sorted and unsorted steers, respectively. The range in SD for initial BW was 42 to 71 lb
depending on study, relatively low variation compared to cattle typically entering commercial
feedlots. Frequently, steers in a study were from a common source, i.e. cow herd or grazing
background. When variation in BW is higher upon entry to a feedlot, a reasonable question is
whether sorting reduces SD of final BW to the same extent as in the research trials.
Sorting reduced variation in HCW in most studies (Folmer et al., 2008; Griffin et al., 2009;
Hussey et al., 2012) except one with a 2-way entry sort of ranch-source calves from a common
grazing background (MacDonald et al., 2006). Ranges in SD for HCW were 39 to 60 lb and 63

22
to 82 lb for sorted and unsorted steers, respectively. As with live BW, the SD of HCW were
often low compared to those observed in commercial feedlots.
In recent trials (Hussey et al., 2012; Rolf et al., 2012) HCW were typical of current industry
weights. In earlier studies (MacDonald et al., 2006; Folmer et al., 2008; Griffin et al., 2009),
HCW were lower. Thus the reduction in HCW variation from sorting in research trials might not
necessarily be representative of results with larger populations of more varied steers fed to
heavier weights.
Sorting did not consistently reduce the percentage of overweight carcasses in most studies.
Thresholds for discounts varied by trial and were > 870 lb (MacDonald et al., 2006), > 950 lb
(Folmer et al., 2008; Griffin et al., 2009), >1000 lb (Griffin et al., 2009; Hussey et al., 2012; Rolf
et al., 2012) and >1050 lb (Hussey et al., 2012). Minimal effect on heavy-carcass discounts was
not surprising, given the low means and SD for HCW in several research trials, compared to
those often observed in the feedlot industry.
Sorting by BW alone had no consistent or predictable effect on carcass composition in these
studies. MacDonald et al. (2006) and Folmer et al. (2008) reported no differences in carcass
traits between sorted and unsorted steers. Griffin et al. (2009) reported higher fat thickness and
higher percentage of yield grade 4 (YG4) in sorted steers but no difference in average YG.
Hussey et al. (2012) noted sorted steers had higher marbling scores, higher percent choice and
above, higher percent YG4 and lower percent YG2. Rolf et al. (2012) reported higher marbling
scores and average YG in sorted steers.
Results in some studies suggested sorted steers were fatter, but data on carcass composition were
confounded by higher HCW in sorted steers, the consequence of more DOF. Research leaves
unanswered the question about the impact of sorting (BW alone) on the percentage of YG4 and
YG5 carcasses, particularly relevant with heifers.
There have been few studies of the relationships between sorting and growth promoting
compounds such as implants and beta agonists. Griffin et al. (2009) reported no interaction
between sorting and Optaflexx. Hussey et al. (2012) noted that Zilmax increased SD of HCW in
unsorted steers, in contrast to the findings of Hilscher et al. (2013) where Zilmax had no effect
on HCW variation. In a practical context, sorting is a tool for managing the additional HCW
resulting from use of the growth-promoting products.
Several studies included detailed economic analyses of sorting effects (Folmer et al., 2008;
Griffin et al., 2009; Hussey et al., 2012; Rolf et al., 2012). Often the conclusion was that sorting
did not improve profitably, even with modest increases in carcass weight and decreases in
carcass-weight variation. However, the models were static rather than dynamic, applied in eras
of lower carcass weights, prices and discounts than those prevalent in the industry today.
Current Terminal Sorting Research
Streeter et al. (2012) reviewed serial harvest research and concluded that carcass weight gain
remains linear for several weeks after cattle were projected to be marketed. This occurs despite

23
declining live performance and reflects increasing proportion of live weight gained as carcass
weight. When the value of daily carcass gain exceeds the daily cost to feed cattle, market
conditions encourage feeding cattle to heavier weights. Carcasses in excess of 1000 or 1050 lb
are discounted and these discounts are often the factor most likely to limit feeding duration of
steers. For heifers, an increasing proportion USDA Yield Grade 4 and 5 carcasses is the carcass
factor most likely to limit feeding duration. Terminally sorting steers based predominantly on
weight is one potential method to reduce the percentage of carcasses exceeding the heavy weight
discount point while increasing the average carcass weight of a pen or lot.
Two large-pen (90 hd/pen) and one medium-pen (25 hd/pen) well replicated studies were
completed under similar protocols (Table 2). The primary objective of these studies was to
determine the impact of terminally sorting steers 50 to 80 days before projected harvest on
standard deviation of HCW and resulting percentage of carcasses greater than industry standard
heavy carcass discount points (>1000 lb and >1050 lb). A secondary objective was to evaluate
live and carcass performance within individual sorted groups. In all studies, steers in the sorted
groups were fed as one group until terminal sorting occurred so dry matter intake (DMI) and feed
efficiency are reported post-sorting. Average daily gain (ADG) is reported pre- and post-sort in
Study 1 and Study 2 where individual BW measurements were obtained at study initiation. In
Study 3, only pen weights were obtained at study initiation eliminating the option to determine
pre-sort ADG. All studies included an unsorted control, unsorted Zilmax (fed for 20 days with
3-day withdrawal) and sorted Zilmax treatments, with four sort groups of equal size, based on
weight. Only the unsorted and sorted Zilmax groups have been included for consideration.
Cattle Origin
Cattle included in Study 1 were of sale barn origin sorted on arrival with a commercial sorting
system and blocked by arrival group (Table 2). Cattle used in Study 2 were also sale barn
derived steers blocked by arrival date but not sorted on arrival. Cattle in Study 3 originated from
5 different ranches. Ranch of origin was the blocking factor such that no block included cattle
from multiple ranches. In this study steers were not sorted on arrival.
Sorting Methodology
Steers in Studies 1 and 2 were terminally sorted 50 days prior to the projected harvest date for
the positive control treatment group; whereas, steers in Study 3 were sorted 80 days prior to
projected harvest. Studies 1 and 3 used a commercial sorting system that included body weight
in combination with a proxy for frame size to identify optimal cattle endpoints based on
predicted formula outcomes. In addition, this commercial system included a model that
modified expected marketing date based on actual DMI and resulting projected performance and
carcass composition. Steers in Study 2 were sorted solely on body weight 50 days prior to
projected harvest for the unsorted positive control group. For all three studies, steers were
proportionately sorted into four equal-sized outcome groups.
Live Performance for Unsorted and Sorted Groups
Compared with the unsorted treatment, DOF were extended for the sorted treatment in all three
studies (Table 3). Live performance was reduced by sorting in Study 1 with sorted steers having
a higher final BW but reduced ADG, DMI and feed efficiency. In Studies 2 and 3 live
performance was not altered by sorting even though sorted groups were fed for additional days

24
compared with their unsorted cohorts. Reasons for differences between studies are not apparent
but differences in origin and day of sorting are likely involved.
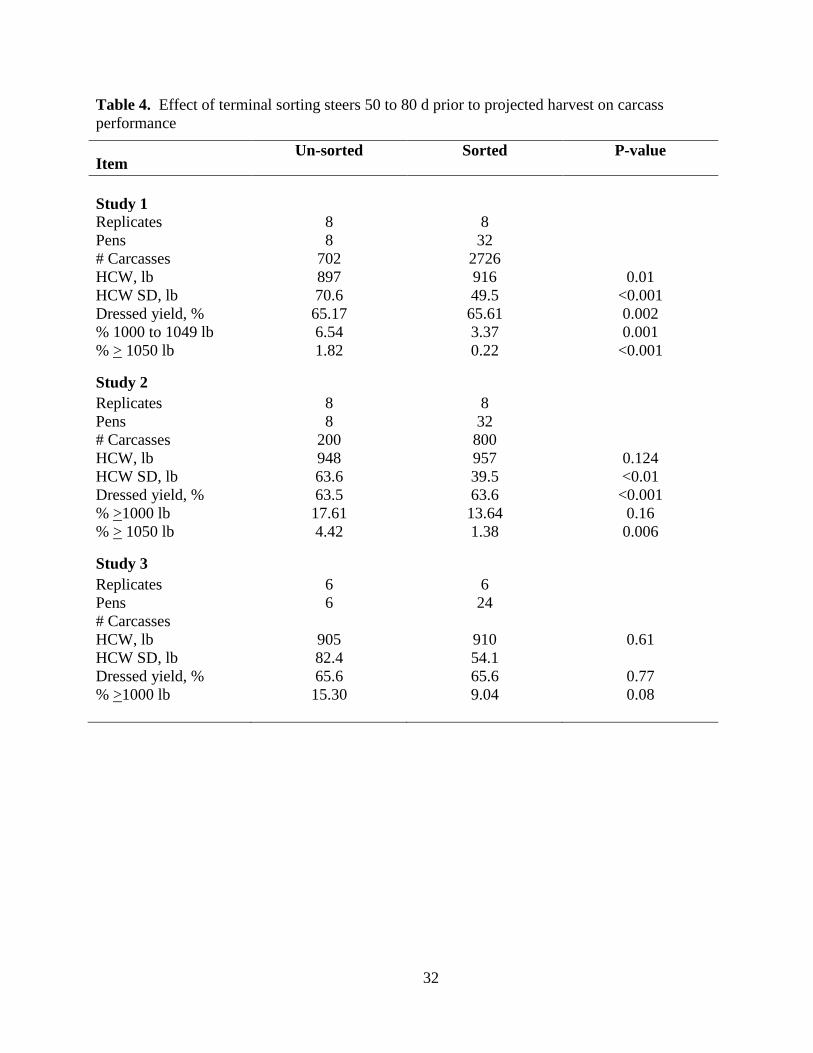
Carcass Performance
HCW was increased (P=0.01) by sorting and adding days for Study 1 and numerically greater for
Studies 2 and 3 (Table 4). Dressed yield was not affected by sorting in Studies 2 and 3 but was
increased (P=0.002) in Study 1. Terminally sorting steers decreased carcass weight variation in
all three studies with standard deviation of carcass weight reduced 30% to 38% across studies.
The net effect of reduced variation in carcass weight was a reduction in the percentage of
carcasses weighing greater than 1000 lb or 1050 lb. Collectively, the three studies support the
use of terminally sorting as an effective tool to reduce heavy weight carcass discounts while
allowing for greater average carcass weight. Yield grade and quality grade distributions were not
altered (P > 0.15) by sorting for any of the studies.
Results from these studies demonstrate that sorting can be used to increase carcass revenue while
adding days on feed by reducing discounts associated with heavy carcasses without adversely
affecting yield grade or quality grade. Further optimization of sorted cattle performance may be
possible by investigating cattle performance and carcass characteristics within sorted groups.
Performance of Sorted Groups
Understanding pre- and post-sort performance is critical in managing sorting expectations. As an
example, cattle could be sorted into a particular weight group due to their growth rate or simply
because they were younger or older than their cohorts when placed. Post-sort performance
would be expected to differ based on the reason for inclusion in their sort group.
In studies 1 and 2, individual steer weights were recorded at study initiation and terminal sorting
allowing ADG determination prior to sorting. These measurements provide insight about how
individuals of sale barn origin become part of specific sorted groups. Similar information is not
available from Study 3 with ranch origin steers. Steers were terminal sorted on a proportional
basis in all studies. Proportional sorting allows for greater pen utilization than sorting into more
discrete outcome groups. Proportional sorting also forces all the variation associated with tails
of a normal distribution to be included in the lightest and heaviest sorted group.
In Study 1 (Table 5), steers had the same (P=0.73) initial weight regardless of their sort group.
However, at terminal sorting the Heavy sort group steers weighed 227 lb more (P<0.001) than
their Light sort group cohorts with the Mid-heavy and Mid-light groups intermediate but
different from other groups. Pre-sort ADG was 2.25 lb/d greater for the Heavy group compared
with the Light group with all four groups differing (P<0.001) from each other. Post-sort ADG
and feed efficiency, adjusted for the effects of Zilmax in periods of differing length, appeared to
be best for the Heavy group, poorest for the Light group, with Mid-Heavy and Mid-light groups
intermediate. The difference between Heavy and Light group performance was less dramatic
post-sort compared with pre-sort. In fact, post-sort ADG was greater than pre-sort for the Light
group, perhaps suggesting that steers in the Light group were unable to effectively compete in
their previous comingled pen environment. DMI could not be determined pre-sort, because of
comingled pens, but post sort DMI was greatest for the Heavy group, least for the Light group
with Mid-heavy and Mid-light intermediate and not different (P>0.05) from each other.

25
In Study 2, initial weight differed among sort groups in a predictable manner with all groups
different from each other (Table 5). The Heavy group weighed 121 lb more than the light group
at study initiation. At terminal sort 110 days later, the Heavy group weighed 214 lb more than
the Light group. The change in sort weight was reflected in pre-sort ADG with the Heavy group
gaining 0.84 lb/d more than the Light group. Post-sort ADG and DMI were greatest for the
Heavy group and least for the Light group with the Mid-heavy and Mid-light groups
intermediate. Reductions in DMI for the Mid-heavy, Mid-light, and Light sort groups were
disproportionate to changes in ADG resulting in poorer feed efficiency for these groups
compared with the Heavy group. As noted in Study 1, adjusted ADG appeared to improve post-
sort for the Light group. Unlike Study 1, adjusted post-sort ADG appeared to be improved in the
Mid-light and Mid-heavy groups compared with pre-sort ADG.
Study 3 steers were from 5 ranches with ranch as the blocking factor. At the time of terminal
sorting the Heavy group weighed 250 lb more than the Light group and all treatments differed
from each other (Table 5). Arrival weights were not available for this so it is unknown whether
steers arrived at the feed yard with differing weights as in Study 2 or similar initial weight as in
Study 1 with differing pre-sort performance levels. As noted in Studies 1 and 2, post-sort DMI
was greatest for the Heavy group and least for the Light group with the Mid-heavy and Mid-light
groups intermediate but all treatments different from each other. Unlike Studies 1 and 2,
changes in DMI appeared to be proportional to post-sort ADG as adjusted feed efficiency
favored the light weight group and was poorest for the Heavy group.
Performance differences pre- and post-sort among sorted groups appear to be influenced by
numerous factors beyond the scope of the studies reviewed. Understanding how individuals are
ultimately sorted into outcome groups represents tremendous opportunity to optimize cattle
performance through various management strategies and to determine appropriate feeding
durations. Generally, when cattle were blocked by ranch, less variation in post-sort ADG and
feed efficiency was observed than with sale-barn derived steers. This might have been due to
chance or might have been the result of less genetic and management variation among ranch
steers.
Carcass weight and characteristics of sorted groups The goal of all three studies was to feed sorted groups to a similar carcass weight. However,
large differences in DMI and feed efficiency resulted in poor predictability of live and ultimately
carcass ADG. As a consequence, HCW varied among sort groups for Study 2 (P <0.05) and
appeared to vary for Study 3 (Table 6). However, HCW was not different (P=0.77) among
sorted groups in Study 1. Standard deviation of HCW differed consistently across studies with
the greatest HCW SD occurring in the Light group, the least in the Mid-heavy and Mid-light
groups, with the Heavy group second greatest. This observation should be expected because
steers were sorted on a proportional basis. Proportional sorting forces variation associated with
the tails of a normal distribution into the Light and Heavy groups. The proportion of carcasses
>1000 lb or > 1050 lb is a function of two factors, HCW and SD of HCW. Consequently, for
Studies 1 and 2 where less variation in HCW between sorted groups was noted, the greatest
proportion of carcasses > 1000 lb occurred in the Light and Heavy groups. In Study 3, HCW
decreased with terminal sort weight resulting in the greatest proportion of carcasses > 1000 lb
occurring in the Heavy group and the least in the Light group.

26
A Model to Describe Unsorted vs. Sorted Populations
To illustrate potential effects of sorting based on live weight, a predictive model was developed.
For the model, a key assumption is that both unsorted and sorted populations are normally
distributed with regard to weight.
The model focuses solely on weight as a sorting factor. Other criteria such as frame size, age, fat
thickness and/or marbling score are relevant but there are too few studies, where these
measurements were components of sorting, to be confident of their impact.
Further, our focus is on the effects of sorting on variation in carcass weight and on management
of carcass weight discounts. Research suggests that sorting by BW alone has minimal influence
on carcass composition traits, such as yield grade and quality grade. Sorting could affect carcass
composition but there is insufficient published data for conclusions and on which to base a
sorting model.
The 2011 NBQA reported an SD of hot carcass weight (HCW) of 102.5 lb. For examples herein,
SD for HCW of unsorted populations will be 100 lb, which is comparable to the NBQA data and
supported by privately viewed data sets.
Sorting is often used as part of a strategy to increase weight while keeping heavy carcass
discounts at an acceptable level. Figure 2 illustrates two normally distributed populations, each
with a mean HCW of 900 lb and with SD of 100 lb (solid line) or 60 lb (dashed line). Figure 3
shows the original population with mean HCW of 900 and SD of 100 along with a heavier
population with mean of 950 and SD of 60. With less variation, the heavier population has only
a few more carcasses over 1000 lb and fewer above 1050 lb.
Data in Table 7 represent normally distributed populations with mean HCW from 700 to 1000 lb
and SD of 100 or 60 and show the percentage of each population that is outside of designated
weight categories. Usually, with the same mean, a smaller SD means that extreme cattle are
closer to the mean and results in fewer penalized cattle. As an example, if mean HCW is 900, a
population with SD of 100 lb would have more than three times as many carcasses over 1000 lb
(15.87% vs. 4.78%) and more than ten times as many over 1050 lb (6.68% vs. 0.62%), compared
to an SD of 60 lb. A rare exception to this would occur if the mean weight is at or above the
penalty line, in which case a lower SD would increase the percentage penalized.
The primary economic factor addressed by the model is gross revenue, from an animal or a pen
of cattle. Costs of sorting are important and include considerations such as pen-space utilization
and yardage, added labor, specialized facilities and equipment, physical stress of cattle,
disruptions of social order and feed intake, and the consequence of commingling on health.
These costs can be quantified once the specifics of a sorting system are defined.

27
Output from the model is shown in linked Tables 8a and 8b. In the panel on the top (8a), the
user has entered the following data (bold and bordered) to describe a population of carcasses and
weight-related discounts:
Mean hot carcass weight: 850 lb
Base carcass price: $200/cwt
Standard deviation of HCW: 100, 80 or 60 lb for comparison
Light penalty: $30/cwt for carcasses lighter than 600 lb
Heavy 1 penalty: $15/cwt for carcasses 1000-1049 lb
Heavy 2 penalty: $35/cwt for carcasses 1050 lb and heavier
The remaining displayed values are calculated by the model. With mean HCW of 850 lb and SD
of 100 lb, 6.5% of the carcasses would fall into penalty weight categories and the average carcass
price would be reduced by $1.25/cwt due to heavy carcass discounts. At SD of 80 or 60 lb, fewer
carcasses fall into penalty weight categories and discounts are reduced. Note that the model
considers weight only and does not attempt to consider quality grade, yield grade or other factors
that influence carcass value.
The panel on the bottom (8b) allows the user to enter additional data and predict what the
population would look like at a heavier mean HCW. In this example, the user entered the
following additional data:
Mean hot carcass weight: 900 lb
Carcass average daily gain: 2.5 lb
Daily cost: $4.00/head
Given these inputs, the model projects that if the weight is added but SD not reduced, penalty
carcasses would increase to 18.0% of the population and discounts would increase to $3.96/cwt.
However, if the population could be sorted to a SD of 80 or 60 lb, fewer heavy penalties would
be incurred, even with a higher mean weight. In this example, consider that the population with
mean HCW of 850 lb and SD of 100 is an unsorted population and the population with mean
HCW of 900 lb and SD of 60 lb is sorted. Given these inputs, revenue is greater and discounts
lower in the sorted population. Compared to the unsorted population, revenue over cost is
increased by $25.39 per head, of which $14.90 is due to added weight and the remainder due to
reduced penalties. Note also that in this scenario, added weight without reduced SD was
negative with SD of 100 lb (-$5.00) but positive ($5.35) with SD of 80 lb and more positive
($14.90) with SD of 60 lb.
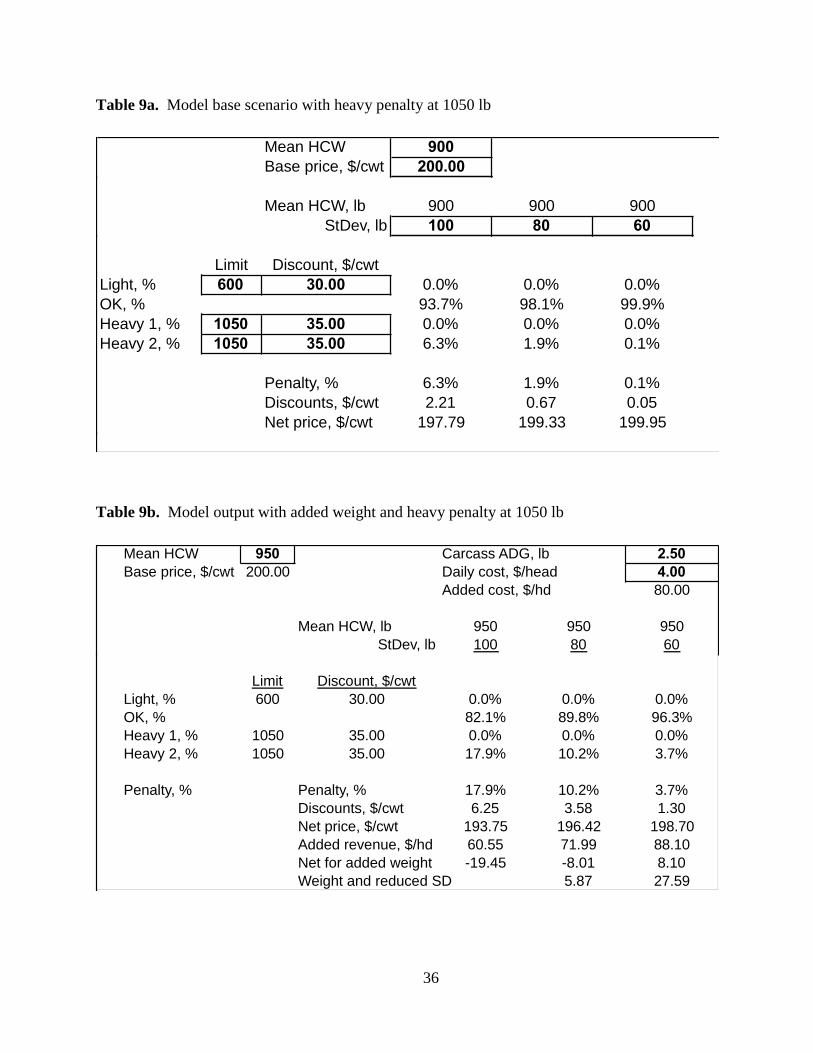
The model can be used to illustrate several key points. In the example shown in Tables 9a and
9b, input has been changed so that heavy penalties are incurred at HCW of 1050, rather than
1000 lb in the previous example. As expected, this allows heavier mean HCW without
substantial penalty, especially with a small SD.
The economics of additional weight are dependent on several key variables, including the rate of
carcass gain, carcass price and daily cost. In the example shown in Tables 10a and 10b, each of

28
these variables was adjusted slightly from the base example (8a and 8b), resulting in dramatically
different output.
Fully describing all potential scenarios is beyond the scope of this paper. The critical message is
that each production and marketing situation is unique. There are a number of economically
relevant variables that must be taken into account when evaluating potential sorting strategies.
Verifying the Model
Data from the Elanco Benchmark© Performance Program (G. Vogel, Elanco Animal Health,
Canyon, TX, personal communication) were used to describe the population with regard to
frequency of heavy carcasses and to validate output from the model developed for this paper.
The Benchmark data represent carcass information from 48,186 lots of steers marketed from
January 2009 through January 2013. Figure 4 is derived from Benchmark data and illustrates the
relationship between the mean HCW of the lot and the percentage of steer carcasses over 1000
lb, or over 1050 lb.
Benchmark mean and SD HCW data were entered into the model and predicted frequency of
heavy carcasses compared to actual Benchmark results in Figure 5. Differences between the
model output and actual Benchmark results are small indicating that the model can be used to
predict frequency of heavy carcasses and suggesting that the Benchmark data represent normally
distributed populations.
Data from recently reported studies by Hilscher et al. (2013) and Merck Animal Health (Study
MS-04-10, M. N. Streeter, Merck Animal Health, DeSoto, KS, personal communication) were
used to compare model predictions of heavy carcasses with research populations. Predicted
(model) values were similar to actual (research) values, either sorted vs. unsorted (Tables 11 and
13), or across sort groups (Tables 12 and 14).
An interesting trend was observed in both the populations reported by Hilscher et al. (2013) and
by Merck Animal Health. Each study included four equal-size weight sort groups to represent
the sorted population. In each case, the outer sort groups had higher HCW SD than the inner
groups. This would be expected in a normally distributed population.
Implications
Terminal sorting of steers by body weight is an effective tool for increasing revenue,
through reduced carcass weight variation, increased carcass weight and minimized
discounts for heavy carcasses.
The economic benefits from sorting can be dynamically modeled, but precisely
estimating costs and risks associated with sorting is more challenging.
Benefits from sorting related to carcass weight are relatively well defined. Data
regarding effects on quality grade and yield grade distributions are not compelling.
Outcomes can be very different among sort groups within a given lot of cattle. Thus
success should be evaluated using the mean of sorted pens within the lot.

29
Understanding why individuals are ultimately sorted into outcome groups represents
tremendous opportunity to optimize cattle performance and carcass value within those
groups.
Accurately estimating pre- and post-sort performance of sort groups is critical in making
decisions about optimum feeding periods and in predicting carcass weight and
composition.
A risk of underestimating the post-sort performance of a group is that, due to reduced
variation, there can be a dramatic increase in weight-discounted carcasses.
Optimum sorting strategy is probably unique to each feedlot and cattle population. Thus
consultants advising clients on profitable sorting strategies will find value in dynamic
sorting models.
Further research is needed on important questions such as time to sort, frequency of
sorting, number of sort groups, distribution among sort groups, post-sort performance,
sorting criteria in addition to live weight, and impact of sorting on heifer performance
and carcass value.
Literature Cited
Cooper, R., T. J. Klopfenstein and T. Milton. 2000. Sorting or topping-off pens of feedlot cattle.
Nebraska Beef Cattle Rep. p. 43-45.
Folmer, J. D., W. A. Griffin, C. N. Macken, M. P. Blackford, T. J. Klopfenstein and G. E.
Erickson. 2008. Effect of intensive winter management, partial season grazing, and sorting
on performance and economics of a long yearling steer production system. Prof. Anim. Sci.
24:411-419.
Griffin, W. A., T. J. Klopfenstein, G. E. Erickson, D. M. Feuz, K. J. Vander Pol and M. A.
Greenquist. 2009. Effect of sorting and Optaflexx supplementation on feedlot performance
and profitability of long yearling steers. Prof. Anim. Sci. 25:273-282.
Hilscher, F., B. Nuttelman, D. Burken, G. Erickson and K. Vander Pol. 2013. Effects of a
terminal sorting system with Zilpaterol hydrochloride on feedlot performance and carcass
characteristics of yearling steers. J. Anim. Sci. 91 (Suppl. 2):56. (Abstr).
Hussey, E. M., G. E. Erickson, B. L. Nuttelman, W. A. Griffin, T. J. Klopfenstein and K. J.
Vander Pol. 2012. Impact of sorting prior to feeding zilpaterol hydrochloride on feedlot
steers. Nebraska Beef Cattle Rep. p. 115-118.
MacDonald, J. C., T. J. Klopfenstein, G. E. Erickson, C. N. Macken, J. D. Folmer and M. P.
Blackford. 2006. Sorting strategies for long yearling cattle grown in an extensive forage
utilization beef production system. Prof. Anim. Sci. 22:225-235.
Rolfe, K. M., W. A. Griffin, T. J. Klopfenstein, D. R. Mark, G. E. Erickson and D. E. Bauer.
2012. Grazing supplementation and subsequent feedlot sorting of yearling cattle. Nebraska
Beef Cattle Rep. p. 112-114.
Streeter, M. N., J. P. Hutcheson, W. T. Nichols, D. A. Yates, J. M. Hodgen, K. J. Vander Pol and
B. P. Holland. 2012. Review of large pen serial slaughter trials – growth, carcass
characteristics, feeding economics. Plains Nutr. Council Spring Conf. Texas A&M Pub.
No. AREC 2012-26:58-92.

30
Table 1. Typical carcass premiums and discounts
Table 2. Description of Merck Animal Health sorting studies
Item Study 1 Study 2 Study 3
Study reference MS-04-10 Hilscher et al., 2013 MS – Zilmax-13-11
Study location Texas Nebraska Idaho
Replicates/ treatment 8 8 6
Approximate pen size 90 25 100
Cattle Source Sale barn Sale barn / UNL pool Ranch origin
Gender Steer Steer Steer
Blocking factor Feed yard arrival date Feed yard arrival date Ranch of origin
Sorted on arrival Yes No No
Terminal sorting
factor
Weight / Frame Weight Weight / Frame
Terminal sort, d* 50 50 80
*Days prior to projected harvest of Unsorted treatment group
Pre mi u m o r
d i sco u n t , $ / cw t We i g h t
I mp a ct ,
$ / ca rca ss
Pri me 12.00 800 96.00
C h o i ce 6.00 800 48.00
St a n d a rd / N o ro l l -1 2 . 0 0 800 -9 6 . 0 0
Y i e l d g ra d e 1 4.00 800 32.00
Y i e l d g ra d e 2 2.00 800 16.00
Y i e l d g ra d e 3 0.00 800 0.00
Y i e l d g ra d e 4 -1 2 . 0 0 800 -9 6 . 0 0
Y i e l d g ra d e 5 -1 5 . 0 0 800 -1 2 0 . 0 0
Light -3 0 . 0 0 599 -1 7 9 . 7 0
H e a vy -3 0 . 0 0 1051 -3 1 5 . 3 0

31
Table 3. Effect of terminal sorting steers 50 to 80 d prior to projected harvest on live
performance.
Item Un-sorted Sorted P-value
Study 1
Replicates 8 8
Pens 8 32
Days on Feed 143 153 <0.001
Initial wt, lb 781 783 0.59
Final wt, lb 1377 1396 0.04
ADG, lb/d 4.18 4.02 0.001
DMI, lb/d 21.8 21.4 0.03
Feed to Gain 5.21 5.32 0.003
Study 2
Replicates 8 8
Pens 8 32
Days on Feed 154 159 0.28
Initial wt, lb 822 824 0.95
Final wt, lb 1492 1503 0.26
ADG, lb/d 4.34 4.30 0.59
DMI, lb/d 26.4 26.10 0.08
Feed to Gain 6.06 6.06 1.00
Study 3
Replicates 6 6
Pens 6 24
Days on Feed 77 81
Initial wt, lb 1105 1093 0.01
Final wt, lb 1381 1386 0.67
ADG, lb/d 3.61 3.66 0.43
DMI, lb/d 21.9 21.8 0.20
Feed to Gain 6.08 5.99 0.43
32
Table 4. Effect of terminal sorting steers 50 to 80 d prior to projected harvest on carcass
performance
Item Un-sorted Sorted P-value
Study 1
Replicates 8 8
Pens 8 32
# Carcasses 702 2726
HCW, lb 897 916 0.01
HCW SD, lb 70.6 49.5 <0.001
Dressed yield, % 65.17 65.61 0.002
% 1000 to 1049 lb 6.54 3.37 0.001
% > 1050 lb 1.82 0.22 <0.001
Study 2
Replicates 8 8
Pens 8 32
# Carcasses 200 800
HCW, lb 948 957 0.124
HCW SD, lb 63.6 39.5 <0.01
Dressed yield, % 63.5 63.6 <0.001
% >1000 lb 17.61 13.64 0.16
% > 1050 lb 4.42 1.38 0.006
Study 3
Replicates 6 6
Pens 6 24
# Carcasses
HCW, lb 905 910 0.61
HCW SD, lb 82.4 54.1
Dressed yield, % 65.6 65.6 0.77
% >1000 lb 15.30 9.04 0.08

33
Table 5. Effect of terminal sorting on live performance within sorted groups
Item Heavy Mid-heavy Mid-light Light p-value
Study 1
Total DOF, d 125d 144
c 157
b 184
a <0.001
Post sort DOF, d 32d 51
c 64
b 90
a <0.001
Initial wt., lb 782 785 781 782 0.73
Sort wt., lb 1256a 1181
b 1129
c 1046
d <0.001
Final wt., lb 1419a 1410
a 1390
ab 1369
b 0.002
ADG, lb/d
Pre-sort 5.08a 4.23
b 3.72
c 2.83
d <0.001
Post-sort 5.14a 4.51
b 4.09
c 3.58
d <0.001
Adjusted Post-sort* 4.47 4.10 3.77 3.37
Overall 5.10a 4.33
b 3.87
c 3.20
d <0.001
Post sort DMI, lb/d 22.6a 22.1
ab 21.4
b 20.3
c <0.001
Post sort F:G 4.41a 4.90
b 5.22
c 5.68
d <0.001
Adjusted F:G* 5.06 5.39 5.68 6.02
Study 2
Total DOF, d 140 154 161 182
Post-sort DOF, d 30d 44
c 51
b 71
a <0.001
Initial wt., lb 887a 840
b 803
c 766
d <0.001
Sort wt., lb 1386a 1302
b 1248
c 1172
d <0.001
Final wt., lb 1543a 1509
b 1490
bc 1473
c <0.001
ADG, lb/d
Pre-sort 4.53a 4.19
b 4.03
c 3.69
d <0.001
Post sort 5.34a 4.75
b 4.77
b 4.19
c <0.001
Adjusted Post-sort* 4.57 4.25 4.35 3.97
Overall 4.69a 4.35
b 4.27
c 3.89
d <0.001
Post sort DMI, lb/d 29.13a 28.40
a 28.13
a 26.75
b <0.001
Post-sort F:G 5.44c 5.98
b 5.88
b 6.35
a <0.001
Adjusted F:G* 6.37 6.68 6.47 6.74
Study 3
Total DOF, d
Post-sort DOF, d 55d 73
c 90
b 107
a 0.04
Initial wt., lb
Sort wt., lb 1216a 1129
b 1059
c 966
d <0.001
Final wt., lb 1427a 1398
ab 1382
b 1338
c <0.001
Post sort ADG, lb/d 3.82a 3.73
ab 3.58
bc 3.49
c 0.004
Adjusted ADG, lb/d* 3.47 3.41 3.37 3.29
Post sort DMI, lb/d 22.8a 22.2
b 21.6
c 20.7
d <0.001
Post sort F:G 5.99 5.97 6.05 5.95
Adjusted F:G* 6.57 6.51 6.41 6.29
*Zilmax was assumed to increase live weight gain by 20 lb, based on pooled summary of 18
studies involving 226 pens/treatment group and approximately 10,900 steers/treatment group.

34
Table 6. Effect of terminal sorting on carcass characteristics of sorted groups.
Item Heavy Mid-heavy Mid-light Light P-value
Study 1
HCW, lb 917 920 916 911 0.77
SD of HCW 44.7b 37.3
c 42.2
bc 59.9
a <0.001
Dressed Yield, % 64.64d 65.28
c 65.87
b 66.54
a <0.001
Carcasses >1000, % 4.30a 1.53
b 2.33
ab 5.09
a 0.002
Carcasses >1050, % 0 0 0 0
Study 2
HCW, lb 977a 959
b 947
bc 945
c <0.05
SD of HCW 39.4b 32.6
bc 29.4
c 56.7
a <0.05
Dressed Yield, % 63.3b 63.6
b 63.6
b 64.1
a <0.05
Carcasses >1000, % 28.1a 9.5
bc 4.0
c 15.3
b <0.05
Carcasses >1050, % 5.6a 0.0
b 0.0
b 1.0
b <0.01
Study 3
HCW, lb 932 914 914 878
SD of HCW 55.5 45.2 48.5 67.3
Dressed Yield, % 65.3 65.4 66.2 65.6
Carcasses >1000, % 18.33 8.32 5.93 3.56
Table 7. Percentage of carcasses discounted due to weight
Mean HCW 700 800 900 1000 700 800 900 1000
Std Dev 100 100 100 100 60 60 60 60
<600 lb 15.87 2.28 0.00 0.00 4.78 0.04 0.00 0.00
>1000 lb 0.13 2.28 15.87 50.00 0.00 0.04 4.78 50.00
>1050 lb 0.02 0.62 6.68 30.85 0.00 0.00 0.62 20.23
Total 16.00 4.56 15.87 50.00 4.78 0.08 4.78 50.00

35
Table 8a. Model base scenario
Table 8b. Model output with additional weight
Mean HCW 850
Base price, $/cwt 200.00
Mean HCW, lb 850 850 850
StDev, lb 100 80 60
Limit Discount, $/cwt
Light, % 600 30.00 0.1% 0.0% 0.0%
OK, % 93.5% 98.1% 99.9%
Heavy 1, % 1000 15.00 5.0% 1.8% 0.1%
Heavy 2, % 1050 35.00 1.4% 0.1% 0.0%
Penalty, % 6.5% 1.9% 0.1%
Discounts, $/cwt 1.25 0.32 0.02
Net price, $/cwt 198.75 199.68 199.98
Mean HCW 900 Carcass ADG, lb 2.50
Base price, $/cwt 200.00 Daily cost, $/head 4.00
Added cost, $/hd 80.00
Mean HCW, lb 900 900 900
StDev, lb 100 80 60
Limit Discount, $/cwt
Light, % 600 30.00 0.0% 0.0% 0.0%
OK, % 82.0% 89.7% 96.3%
Heavy 1, % 1000 15.00 11.7% 8.4% 3.6%
Heavy 2, % 1050 35.00 6.3% 1.9% 0.1%
Penalty, % Penalty, % 18.0% 10.3% 3.7%
Discounts, $/cwt 3.96 1.93 0.59
Net price, $/cwt 196.04 198.07 199.41
Added revenue, $/hd 75.00 85.35 94.90
Net for added weight -5.00 5.35 14.90
Weight and reduced SD 13.30 25.39
36
Table 9a. Model base scenario with heavy penalty at 1050 lb
Table 9b. Model output with added weight and heavy penalty at 1050 lb
Mean HCW 900
Base price, $/cwt 200.00
Mean HCW, lb 900 900 900
StDev, lb 100 80 60
Limit Discount, $/cwt
Light, % 600 30.00 0.0% 0.0% 0.0%
OK, % 93.7% 98.1% 99.9%
Heavy 1, % 1050 35.00 0.0% 0.0% 0.0%
Heavy 2, % 1050 35.00 6.3% 1.9% 0.1%
Penalty, % 6.3% 1.9% 0.1%
Discounts, $/cwt 2.21 0.67 0.05
Net price, $/cwt 197.79 199.33 199.95
Mean HCW 950 Carcass ADG, lb 2.50
Base price, $/cwt 200.00 Daily cost, $/head 4.00
Added cost, $/hd 80.00
Mean HCW, lb 950 950 950
StDev, lb 100 80 60
Limit Discount, $/cwt
Light, % 600 30.00 0.0% 0.0% 0.0%
OK, % 82.1% 89.8% 96.3%
Heavy 1, % 1050 35.00 0.0% 0.0% 0.0%
Heavy 2, % 1050 35.00 17.9% 10.2% 3.7%
Penalty, % Penalty, % 17.9% 10.2% 3.7%
Discounts, $/cwt 6.25 3.58 1.30
Net price, $/cwt 193.75 196.42 198.70
Added revenue, $/hd 60.55 71.99 88.10
Net for added weight -19.45 -8.01 8.10
Weight and reduced SD 5.87 27.59

37
Table 10a. Model base scenario
Table 10b. Model output with added weight
Mean HCW 850
Base price, $/cwt 190.00
Mean HCW, lb 850 850 850
StDev, lb 100 80 60
Limit Discount, $/cwt
Light, % 600 30.00 0.1% 0.0% 0.0%
OK, % 93.5% 98.1% 99.9%
Heavy 1, % 1000 15.00 5.0% 1.8% 0.1%
Heavy 2, % 1050 35.00 1.4% 0.1% 0.0%
Penalty, % 6.5% 1.9% 0.1%
Discounts, $/cwt 1.25 0.32 0.02
Net price, $/cwt 188.75 189.68 189.98
Mean HCW 900 Carcass ADG, lb 2.30
Base price, $/cwt 190.00 Daily cost, $/head 4.20
Added cost, $/hd 91.30
Mean HCW, lb 900 900 900
StDev, lb 100 80 60
Limit Discount, $/cwt
Light, % 600 30.00 0.0% 0.0% 0.0%
OK, % 82.0% 89.7% 96.3%
Heavy 1, % 1000 15.00 11.7% 8.4% 3.6%
Heavy 2, % 1050 35.00 6.3% 1.9% 0.1%
Penalty, % Penalty, % 18.0% 10.3% 3.7%
Discounts, $/cwt 3.96 1.93 0.59
Net price, $/cwt 186.04 188.07 189.41
Added revenue, $/hd 70.00 80.35 89.90
Net for added weight -21.30 -10.96 -1.41
Weight and reduced SD -3.00 9.08

38
Table 11. Actual vs. predicted heavy carcasses, sorted vs. unsorted (Hilscher et al., 2013)
Table 12. Actual vs. predicted heavy carcasses, among sort groups, (Hilscher et al., 2013)
Neg Ctl Pos Ctl 1 Sort 4 Sort
HCW, lb 914 947 954 956
HCW SD, lb 63.9 63.7 58.6 39.4
Actual >1000 lb, % 9.8 17.6 22.3 13.6
Model >1000 lb, % 8.8 17.8 20.1 13.3
Actual >1050 lb, % 2.0 4.4 2.0 1.4
Model >1050 lb, % 0.6 4.4 3.7 0.2
Heavy Mid-H Mid-L Light
HCW, lb 976 958 945 943
HCW SD, lb 39.4 32.6 29.3 56.6
Actual >1000 lb, % 28.1 9.5 4.0 15.3
Model >1000 lb, % 27.1 9.5 1.7 15.1
Actual >1050 lb, % 5.6 0.0 0.5 1.0
Model >1050 lb, % 1.8 0.0 0.0 1.8

39
Table 13. Actual vs. predicted heavy carcasses, sorted vs. unsorted (Merck Animal Health
Study MS-04-10)
Table 14. Actual vs. predicted heavy carcasses, among sort groups (Merck Animal Health Study
MS-04-10)
Figure 1. Beef quality challenges as reported by the National Beef Quality Audit.
Ranked by priority, 1991 to 2011
Unsorted Sorted
HCW, lb 897 916
HCW SD, lb 70.6 49.5
Actual >1000 lb, % 6.5 3.4
Model >1000 lb, % 5.4 3.1
Actual >1050 lb, % 1.8 0.2
Model >1050 lb, % 0.7 0.0
Sort 1 Sort 2 Sort 3 Sort 4
HCW, lb 917 920 916 911
HCW SD, lb 44.7 37.3 42.2 59.9
Actual >1000 lb, % 4.3 1.5 2.3 5.1
Model >1000 lb, % 1.8 0.6 1.2 5.6
Actual >1050 lb, % 0.0 0.0 0.0 0.0
Model >1050 lb, % 0.0 0.0 0.0 0.3
1991 1995 2000 2005 2011External fat Uniformity Uniformity Traceability Food safety
Seam fat Palatability Carcass weights Uniformity Easting satisfaction
Overall palatability Marbling Tenderness Instrument grading
How and where
cattle were raised
Tenderness Tenderness Marbling Market signals Lean, fat and bone
Cutability
External and seam
fat
Reduced quality due
to implants Segmentation Weight and size
Marbling Cut weights External fat Carcass weights Cattle genetics

40
Figure 2. Normally distributed populations with mean HCW of 900 lb and standard deviation of
100 lb or 60 lb
Figure 3. Normally distributed populations with mean HCW of 900 lb and standard deviation of
100 lb or mean of 950 lb and standard deviation of 60 lb
660
680
700
720
740
760
780
800
820
840
860
880
900
920
940
960
980
1000
1020
1040
1060
1080
1100
1120
1140
1160
1180
1200
1220
NumberofCarcasses
CarcassWeight,lbs
CarcassWeightDistribu on
StDev=100
StDev=60660
680
700
720
740
760
780
800
820
840
860
880
900
920
940
960
980
1000
1020
1040
1060
1080
1100
1120
1140
1160
1180
1200
1220
NumberofCarcasses
CarcassWeight,lbs
CarcassWeightDistribu on
StDev=100
StDev=60

41
Figure 4. Percentage of heavy carcasses by mean HCW - steers, Benchmark Performance
Program
Figure 5. Comparison of model output and data from Benchmark Performance Program, steer
data
0%
5%
10%
15%
20%
25%
30%
35%
40%
45%
764 789 813 838 863 887 911 935 960 984
HCW>1000lb
HCW>1050lb
0%
5%
10%
15%
20%
25%
30%
35%
40%
45%
50%
764 789 813 838 863 887 911 935 960 984
Benchmark>1000lb
Model>1000lb
Benchmark>1050lb
Model>1050lb

42

43

44
AIP: Etiology, Management and Environment
Tim A. McAllister
Agriculture and Agri-Food Canada
Lethbridge Research Centre
For decades an often fatal respiratory syndrome of cattle has been recognized and described by
various names including acute or atypical interstitial pneumonia (AIP) (Dungworth, 1993;
Schiefer et al., 1974; Blood, 1962), acute bovine pulmonary emphysema (ABPE) (Blake and
Thomas, 1974) pulmonary adenomatosis (Seaton, 1958) and acute respiratory distress syndrome
(ARDS) (Breeze et al., 1978). Affected cattle have an acute onset of severe dyspnea, often with
open-mouthed breathing and an expiratory grunt. Postmortem evaluation of cattle with this
syndrome reveals dark red, heavy lungs that fail to collapse. The best characterized cause of this
condition is associated with movement of beef cattle from heavily grazed summer pasture to lush
pasture in the fall (Hammond et al., 1979). This form of the disease, also commonly known as
ABPE or "fog fever", is due to damage of the lung by pneumotoxins resulting from ruminal
conversion of forage-derived L-tryptophan. More recent evidence has also shown that the same
pathway plays a role in feedlot AIP; however the connection is not near as clear, as feedlot AIP
appears to be much more multi-factorial in nature. Bovine AIP can also be caused by
pneumotoxic compounds ingested in moldy sweet potatoes (Doster et al., 1978) purple mint
(Wilson et al., 1977), and rape, turnip tops, or kale (Wikse et al., 1978). Other factors and insults
like bacterial or viral pneumonia can play a role, as can dust-borne allergens. These pneumotoxic
compounds induce the final common result of AIP through damage of the alveolar wall. It
appears that there are a number of combined factors as well as 3-methylindole metabolism that
cause AIP in a feedlot setting.
Rates of death due to feedlot AIP have ranged from 0.5% to 5.3% (Jensen et al., 1976), with a
case fatality rate of 50% to 60% (Ayroud et al., 2000; Loneragan et al., 2001). Occurrence of the
disease is sporadic (Loneragan et al., 2001), although heifers are more likely to die of feedlot
AIP than steers, and outbreaks are most common during the hot and dusty summer months
(Ayroud et al., 2000). Compared to the typical BRD pneumonia-type cases that are observed
within cattle in the first 40 days of the feedlot, AIP afflicts older cattle in which there has been a
lot of money invested in terms of feed and management.
Acute interstitial pneumonia can only be confirmed by histologic evaluation. The hallmark
histologic lesions of AIP are fibrin accumulation and hyaline membrane formation in alveolar
spaces, alveolar epithelial hyperplasia and congestion and edema (Breeze et al., 1978). Within
the lung tissue itself, neutrophils and macrophages invade into the alveolar tissue and the
alveolar spaces fill with proteinaceous fluid. There is a thickening of the alveolar walls
associated with the hyperplasia of type-2 pneumocytes. Respiratory cells can also slough off into
the lumen of the alveoli. Grossly, lungs fail to collapse and their texture is firm and rubbery
In the past, individual feedlots have estimated losses of about $14,000 over a month to AIP.
There are significant costs associated with the disease in terms of loss of carcass value upon
marketing. When AIP outbreaks occur, the cattle industry recognizes it as a significant problem
and scrambles for solutions, but its sporadicity of occurrence often results in it not being seen as

45
a serious infliction for extended periods of time. The small amount of available information
related to feedlot AIP provides some clues with regard to possible causes.
Pasture associated AIP results from damage to the alveolar wall by pneumotoxins generated by
metabolism of 3-methylindole by mixed function oxidases and prostaglandin H synthetase in
type II pneumocytes and Clara cells (Yost, 1989; Formosa and Bray, 1988). The pathway for
production of 3-methylindole involves tryptophan metabolism to indole-3-acetic acid and then to
3-methylindole which forms reactive intermediates. 3-methylindole itself is not the toxin, but
rather it is the reactive intermediates that result in pneumotoxicity. There are a number of
enzymes and mechanisms involved in the conversion of 3-methylindole to reactive intermediates
many of which are toxic, the most prominent of these being 3-methyleneindolenine (Yost, 1989).
Cytochrome P450, mixed function oxidase and prostaglandin synthetase all play a role in the
conversion of 3-methylindole to these reactive intermediates. Pasture AIP typically occurs when
cattle are switched from a mature to a green pasture high in protein and tryptophan content. This
leads to the excessive production of 3-methylindole from tryptophan and the formation of toxic
metabolites. In the feedlot, AIP most frequently occurs in cattle that are being fed finishing diets
comprised of 85% - 90% grain and at a point in the feeding period where cattle have already
adapted to these diets for a period of 60-80 days. There is no obvious explanation as to how an
increase in tryptophan intake could take place and account for the occurrence of AIP at this point
in the feeding period. Consequently, it is difficult to draw a direct linkage between tryptophan
concentration in the diet and the occurrence of feedlot AIP.
Research from our laboratory monitored close to a million head of feedlot cattle on finishing
diets from 1998 through 2000 (Stanford et al., 2006). Plasma, urine, and lung tissue were
collected at slaughter from 299 cattle clinically diagnosed with AIP and from 156 healthy pen
mates and analyzed for 3-methylindole derivatives and reduced glutathione concentration. From
each animal, the left lung was subsampled for histologic examination. We analyzed the urine,
blood and lung tissues for glutathione concentration as it may potentially impact the formation of
toxic metabolites. Collection was structured based on a clinical diagnosis of AIP by a
veterinarian familiar with AIP. Collected samples were histologically examined and this was
used as the basis for confirmation of AIP. About 11% of the cases clinical diagnosed as AIP by
the veterinarian were not confirmed as being AIP after histological examination. The fact that
AIP occurs sporadically, makes it difficult to obtain positive cases at the same time as funds are
available to undertake research. Considerable resources must be spent in just monitoring for the
occurrence of the disease and being in a position to collect positive cases 24 h per day, 7 days a
week, 365 days of the year.
Results from a study in southern Alberta found 299 suspect AIP cases, of which 89% were
histologically confirmed with 121 cases in year one, 85 cases in year two and 59 cases in year
three. Cattle histologically confirmed as having AIP had higher levels of 3-methylindole protein
adducts in blood and lung tissue than cattle that were AIP negative, but still underwent
emergency slaughter. As observed previously, incidence of feedlot AIP was higher in heifers
than steers. In 1998 and 1999, 92% and 94% of observed AIP cases occurred in heifers. All
heifers had been on feed for a period of 130 days or more. Occurrences of AIP were strongly
seasonal whereby cattle were 598 times more likely to exhibit AIP in June, July and August as
compared to other months of the year (Ayroud et al., 2000).

46
Considerable research has been conducted to assess the value of ionophores in controlling AIP in
terms of their ability to inhibit Gram-positive bacteria like Lactobacillus. Monensin is
recognized to decrease the pulmonary damage arising from the metabolites of tryptophan
metabolism (Hammond et al., 1978) however, the use of monensin has not prevented death from
feedlot AIP in field studies (Ayroud et al., 2006; Woolums et al., 2004),
Other work from our laboratory (Popp et al., 1998) provided evidence that feeding melengestrol
acetate (MGA), a synthetic progesterone used for estrus suppression in feedlot heifers, increased
the susceptibility to pulmonary edema after oral administration of 3-methylindole to sheep. In
1999, we examined the incidence of AIP in relation to the dosage of MGA (Stanford et al.,
2006). Feedlot heifers were fed MGA at levels of 0, 0.44, or 0.48 mg/head/d and the incidence
of death and emergency slaughter attributable to AIP was recorded over the 7-mo AIP season
(April through October). Results showed that there was a higher level of emergency slaughters
and death loss for the heifers that did not feed any MGA. Specifically, within feedlots, where
pens of heifers were fed either a standard dosage of MGA or none, the rate of death attributable
to AIP was similar between treatment groups, but emergency slaughter after clinical diagnosis of
AIP was 3.2 times higher (P < 0.001) in MGA-fed heifers than in those not fed MGA. Inclusion
of MGA did not alter levels of glutathione in blood.
In another study we examined the impact of a number of potential control measures on the
incidence of AIP (Stanford et al., 2007). These included i) inclusion of feather meal (1.5%) and
vitamin E supplementation (500 IU) in the diet as well as ii) therapeutic treatment of AIP with
acetylsalicylic acid (aspirin) in an effort to prolong life of afflicted cattle until they could be
harvested. If 3-methylindole is involved in feedlot AIP, prophylactic treatment with aspirin
could decrease prostaglandin H synthetase activity, an enzyme involved in the production of the
pneumotoxin, 3-methyleneindolenine. As the cytotoxic metabolites of 3-methylindole can cause
oxidative damage to cells, vitamin E supplementation might also decrease the severity of the
disease by increasing the concentrations of glutathione, a free radical scavenger. Feather meal is
a protein source high in cysteine and as cysteine is a precursor to the synthesis of glutathione,
which inactivates oxidative intermediates, supplementation with feather meal may also provide
some measure of protection against AIP. In a previous study using goats, supplementation with
cysteine reduced the production of toxic metabolites when they were challenged with a dose of
3-methlyindole (Merrill and Bray, 1983).
In our study, blood and lung tissue were collected at slaughter from 83 cattle clinically
diagnosed with AIP, 40 asymptomatic penmates, and 40 heifers receiving either feather meal or
vitamin E with the left lung being subsampled for histologic examination (Stanford et al., 2007).
Blood and lung tissue were analyzed for thiol adducts of 3-methyleneindolenine and reduced
glutathione. Supplementation with feather meal or vitamin E had no effect on the rates of death
or emergency slaughter attributable to AIP and did not influence the levels of 3-methylindole or
reduced glutathione in blood or lung tissue. Although supplementation with greater amounts of
feather meal or vitamin E may mitigate feedlot AIP, increased supplementation would be
uneconomical for commercial feedlots, given the low incidence and sporadic nature of the
disease.

47
To examine the effects of aspirin, heifers with clinical signs of AIP (n=30) were treated with
31.2 g aspirin every 12 h until slaughter. The left lung was subsampled for histological
examination, analysed for 3-methyleneindolenine adduct and reduced glutathione. Of the heifers
treated with aspirin, 63.3% survived to be slaughtered through normal channels, with 33.3%
requiring emergency slaughter and 3.3% dying prior to slaughter. These results suggested that
there may be some value in using aspirin to prolong the life of cattle suspected of suffering from
AIP.
Because it is not possible to state with certainty the cause or causes of feedlot AIP, it is also not
possible to outline control measures. However, based on the information summarized here,
means of control can be theorized. In some lots where dust is particularly related to AIP,
aggressive dust control measures such as sprinklers or decreased cattle density may significantly
decrease losses. In any given lot the cost of the disease must be weighed against the cost of such
intervention strategies. Ongoing research is necessary to clarify the most important etiologic
factors, but has not been very forthcoming due to the challenges associated with studying this
disease. More information is required so that consultants can determine which etiologic factors
are most important in lots with excessive AIP deaths, enabling the development of rational and
cost-effective control measures.
Literature cited
Ayroud, M., J.D. Popp, M.A VanderKop, G.S. Yost, D.M. Haines, W. Majak, D. Karren, L.J.
Yanke, T.A. McAllister. 2000. Characterization of acute interstitial pneumonia in cattle in
southern Alberta feedyards. Can. Vet. J. 41:547–554.
Blake, J. and D.H. Thomas. 1971. Acute bovine pulmonary emphysema in Utah. J. Am. Vet.
Med. Assoc. 158:2047-2052.
Blood, D. 1962. Atypical interstitial pneumonia of cattle. Can. Vet. J. 3:40-47.
Breeze, R., I.E. Selma, H.M. Pirie, and A. Wiseman. 1978. A reappraisal of atypical interstitial
pneumonia in cattle. Bovine Pract. 13:75-81.
Doster, A.R., F.E. Mitchell, R.L. Farrell, and B.J.Wilson. 1978. Effects of 4-ipomeanol, a
product from mold-damaged sweet potatoes, on the bovine lung. Vet Pathol. 15:367-375.
Dungworth, D. 1993. The respiratory system In: K. Jubb, P.C. Kennedy, and N. Palmer, ed.
Pathology of Domestic Animals. 4th ed. San Diego: Academic Press, Inc., pp. 598-608.
Formosa, P, and T. Bray. 1988. Evidence for metabolism of 3-methylindole by prostaglandin H
synthetase and mixed-function oxidases in goat lung and liver microsomes. Biochem.
Pharmacol. 37:4359-4366.
Hammond, A., B.J. Bradley, and M.T. Yokoyama. 1978. 3-methylindole and naturally occurring
acute bovine pulmonary edema and emphysema. Am. J. Vet. Res. 40:1398-1401.
Jensen, R., R.E. Pierson, P.M. Braddy. 1976. Atypical interstitial pneumonia in yearling feedlot
cattle. J. Am. Vet. Med. Assoc. 169:507-510.
Loneragan, G.H., D.H. Gould, G.L. Mason, F.B. Garry, G.S. Yost, D.L. Lanza, D.G. Miles,
B.W. Hoffman, and L.J. Mills. 2001. Association of 3-methyleneindolenine, a toxic
metabolite of 3-methylindole with acute interstitial pneumonia in feedlot cattle. Am. J. Vet.
Res. 2001;62:1525–1530.
Merrill, J.C., and T.M. Bray. 1983. The effect of dietary and sulphur compounds in alleviating 3-
methylindole-induced pulmonary damage. J. Nutr. 113:1725–1731.

48
Popp, J.D., T.A. McAllister, J.P. Kastelic, W. Majak, M. Ayroud, M.A. VanderKop, D. Karren,
G.S. Yost, and K.J. Cheng. 1998. Effect of melengestrol acetate on development of 3-
methylindole-induced pulmonary edema and emphysema in sheep. Can. J. Vet. Res.
62:268–274.
Schiefer, B., M.U. Jayasekara, and J.H.L. Mills. 1974. Comparison of naturally occurring and
tryptophan-induced bovine atypical interstitial pneumonia. Vet. Path. 11:327-339.
Seaton, V. 1958. Pulmonary adenomatosis in Iowa cattle. Am J Vet Res 29:600-609.
Stanford, K, T.A. McAlliste, M. Ayroud, T.M. Bray, and G.S. Yost GS. 2007. Acute interstitial
pneumonia in feedlot cattle: effects of feeding feather meal or vitamin E. Can. J. Vet. Res.
71:152-156.
Stanford, K., T.A. McAllister, M. Ayroud, T.M. Bray, and G.S. Yost. 2006. Effect of dietary
melengestrol acetate on the incidence of acute interstitial pneumonia in feedlot heifers. Can
J. Vet. Res. 70:218-225.
Wikse, S., C.W. Leathers, and S.M. Parish. 1978. Diseases of cattle that graze turnips. Comp.
Cont. Ed. Pract.Vet. 9:F112-F121.
Wilson, B.J., J.E. Garst, R.D. Linnabary, and R.B. Channell. 1977. A potent lung toxin from the
mint plant, Perilla frutescens. Science 197:573-574.
Woolums, A.R., G.L. Mason, L.L. Hawkins, C.C. Brown, S.M. Williams, J.A. Gould, J.J. Fox,
S.D. Sturgeon, J.L. Anderson, F.E. Duggan, S. Sanchez, P.B. Barrett, and S.W. Chitwood.
2004. Microbiologic findings in feedlot cattle with acute interstitial pneumonia. Am. J. Vet.
Res. 65:1525–1531.
Yost, G. 1989. Mechanisms of 3-methylindole pneumotoxicity. Chem. Res. Toxicol .2:273-275.

49

50

51
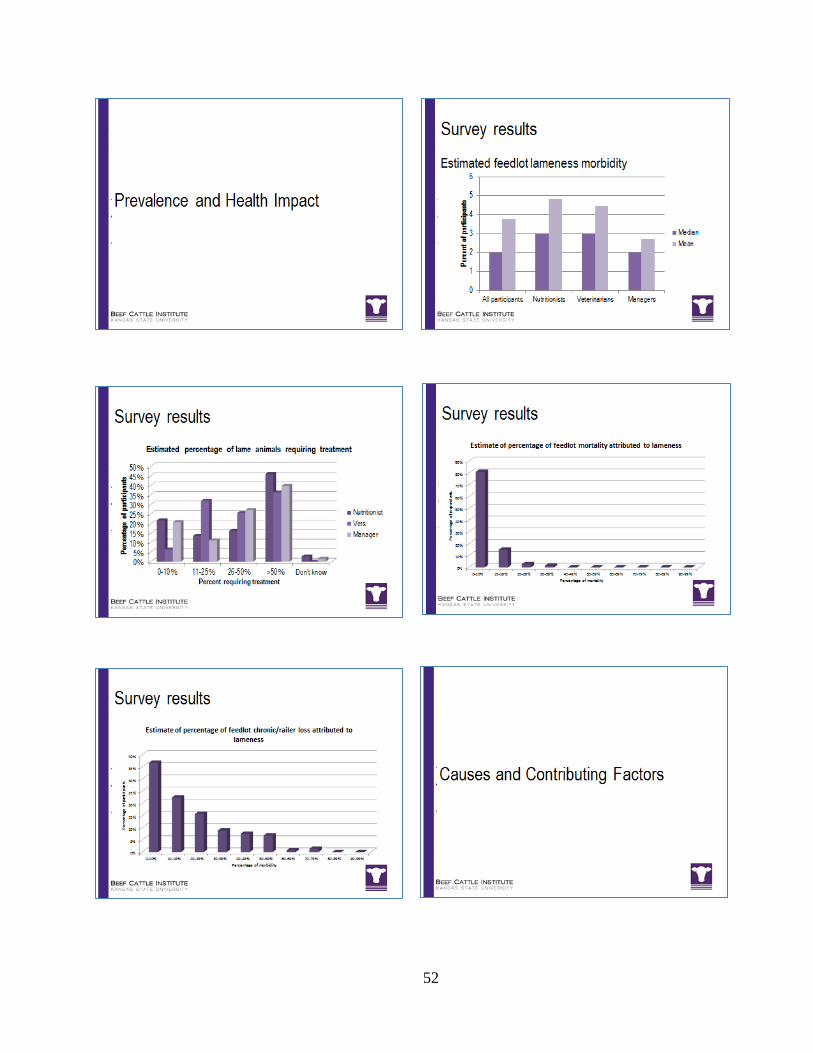
52

53

54

55

56

57

58

59

60
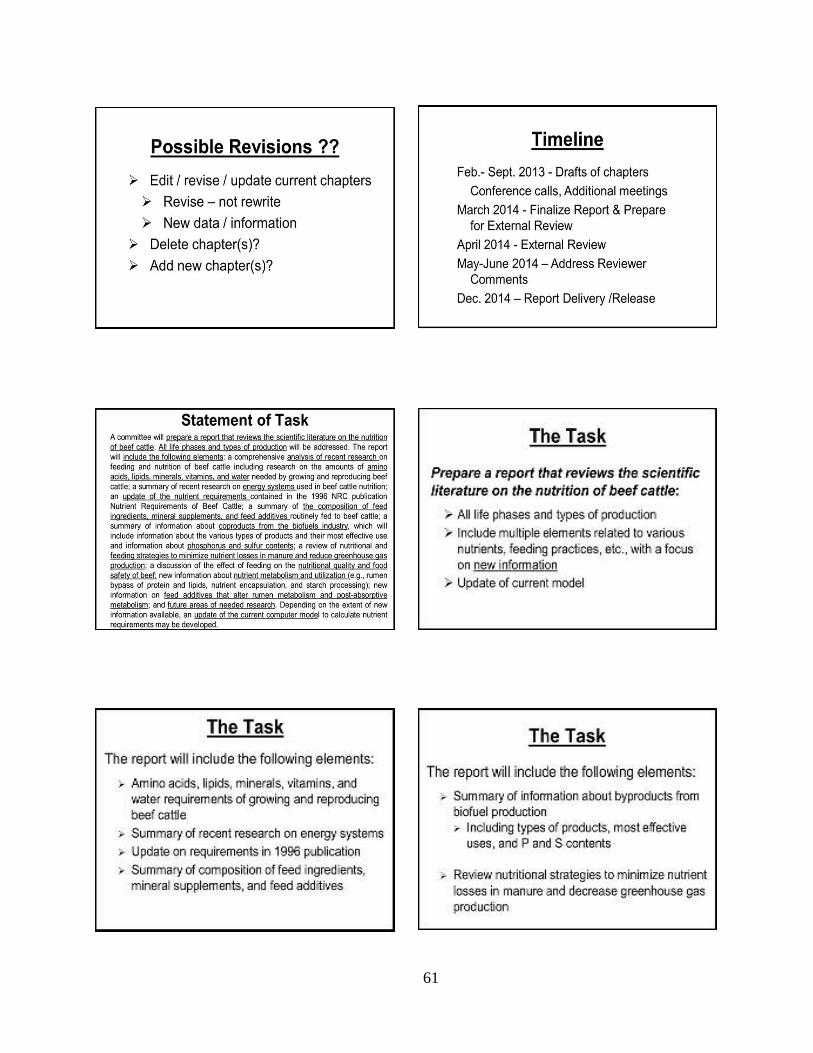
61

62

63

64

65
Growing/Backgrounding Programs for Calves – Management Regimens,
Carryover Influences on Finishing Performance, Carcass Weights and
Carcass Composition
Dr. Robbi Pritchard
South Dakota State University
Brookings, SD
Introduction
Approaches to growing or backgrounding feeder cattle are manifested in a wide variety of ways.
The variety is spurred by the many different drivers that make this activity appealing. The
paramount driver that we need to make more public is that growing calves is a sophisticated
biotech process for converting cellulosic biomass into a high quality, high cash value product
that benefits society.
Backgrounding is as diverse as calves grazing wheat or meadows, being fed hay or corn silage or
limit feeding on a high concentrated diet. All of these systems contribute to key elements of:
rebalancing feeder cattle supplies from unbalanced calving seasons; 2) weeding out defective
cattle; and 3) significantly boosting the production system efficiency by increasing harvest body
weight. A coordinated system also creates the opportunity for feedlots to streamline the logistics
of cattle flows and to produce a more standardized incoming feeder. In creating this
standardized calf we would like to specify the days, diet and implant that will optimize finishing
phase performance and carcass value outcomes.
Much, if not most, of the backgrounding phase management influence on subsequent outcomes
is a function of the backgrounding program impact on the calf growth curve. This is done by
exploiting the prioritization of nutrient partitioning and tissue system differences in coefficients
of allometric growth as described by Wilson and Osbourn (1960). The tissue prioritization for
energy to support growth is: 1) CNS; 2) skeleton and connective tissue; 3) visceral organs; 4)
skeletal muscle; and 5) adipose. In circumstances of limited nutrient availability bone growth
can occur at a “normal” pace while muscle accretion is somewhat restricted and adipose growth
is impaired. In other words we can frame out cattle.
Two excellent references addressing manipulations of the growth curve and carcass composition
of beef cattle are Owens et al (1995) and the symposium proceeding “The Composition of
Growth in Beef Cattle in honor of Rodney L. Preston” (1996). The content and citations
included in those publications are very comprehensive. This essay will not suffice as an
alternative brief; rather I will try to address some additional production issues that pertain to
current industry circumstances.
Growth Channel
The backgrounded yearling steer model on which many of us base our paradigm is depicted in
Table 1. It is the calf-fed versus yearling model of beef production. A prolonged grower phase
causes the yearling steer to exhibit compensatory intake and growth during finishing and to

66
produce a heavier carcass at a common Yield Grade. Janovick Guretzky et al (2005) used spring
born and fall born calves to essentially create a dose titration of how extending the grower phase
impacts feedlot production and carcass traits (Table 2). These data fit the paradigm that if cattle
are older when they enter the feedlot, they will eat more and grow faster. The impact on
efficiency may however be more variable. In their study a prolonged backgrounding program
resulted in poorer feed conversions during finishing than occurred with a shorter backgrounding
phase. That too, tends to fit general perceptions in the industry.
We may be inclined to extrapolate this model to fit how any degree of a backgrounding program
may impact finishing performance. We must do so cautiously today because of 3 major factors
that have changed in cattle production. The foremost change is the significant increase in the
size and growth potential of cattle. Our paradigm is rooted in understanding the concept of a
growth channel (Jackson, 1990). The historical data was based, more or less, on a 425 lb, 7 mo
old, weaned calf with a mature BW of 1050 lb. Today there is a significant population of calves
that can weigh 600 lbs at weaning with a mature BW >1300 lbs at 14 mo age. The unintended
consequences of this shift in the growth channel have not yet been well defined.
The second important change from historical growth channel data is access to estradiol-
trenbolone acetate implants and ß-agonists. These growth enhancement technologies cause a
significant increase in mature BW (Guiroy et al, 2002). The third important change is a shift
from live weight to hot carcass weight basis for marketing. Now the factors that influence
dressing percentage (fill, visceral mass…) that might be influenced by the age/backgrounding
program can alter feedlot economics.
In theory the growth channel of large framed, high growth potential steers should minimize the
benefits of using a grower program to allow cattle to achieve adequate size. Jennings et al
(2012) compared the effects of lower energy (LE) or higher energy (HE) 116d grower programs
on growth traits and composition of steers fed to a common fat endpoint (0.4 in ribfat) or a
constant days on feed. In those 8 mo old steer calves, grower phase ADG were 2.8 lb and 3.5 lb
(Table 3). At 0.4 in ribfat the LE treatment resulted in heavier HCW and more carcass protein
mass while carcass fat masses were similar. A unique aspect of young growing cattle is that
when HE steers were fed to the same days endpoint as LE steers, the HE steers achieved the
same carcass protein mass as the LE steers. Young growing steers on a high calorie plane of
nutrition can fatten prematurely, but that does not impair their potential for true growth. As a
consequence of continued true growth, the feed efficiency in this class of feeder cattle grown on
higher energy backgrounding diets may not be adversely affected during finishing. In 2
subsequent studies with the same class of feeder steer calves, the HE backgrounding program led
to higher (P < .05) ADG and lower (P < .05) DMI and F/G (Table 4). There were essentially no
differences in HCW or marbling if HCW was covariately adjusted to a constant ribfat thickness.
Brethour (2000) modeled the effect of initial ribfat thickness on days required to reach 0.4 in
ribfat. Since ribfat increases exponentially during the finishing phase, small differences in initial
ribfat (2mm v 4mm) lead to substantial differences in ribfat by 80d into the finishing phase.
Those 850 lb steers were 12-14 mo old when placed on feed and the effect of initial flesh fits the
yearling steer paradigm. Those relationships, between days on feed and ribfat accretion rates,
should re-evaluated in younger, higher growth potential, more aggressively implanted steers.

67
Contrasts of Diets and Growth Rates
McCurdy et al (2010) backgrounded calves (532 lb) on either wheat pasture (WP), sorghum
silage (SS) or limit fed a high concentrate (LFHC) diet for 112d. Although backgrounding ADG
were similar (Table 5) calves grazing WP appeared to have lower fat content in their empty body
gain. The EB fat content of steers grazing WP actually declined to 15.0% from the 16.9% EB fat
in the initial kill group. At the conclusion of the backgrounding phase EB fat content differed (P
< .05) with values of 15.0%, 17.3% and 17.4% for WP, SS and LFHC treatments respectively.
These feeder steers were subsequently fed to a fat constant finished endpoint.
During finishing, the WP steers did not exhibit compensatory growth to make up for the deficit
in body fat content caused during backgrounding. To reach the common fatness endpoint the
WP steers required a higher fat content in LWG during finishing which translates into a higher
energy content of LWG. The WP steers did not exhibit compensatory DMI to meet this added
caloric requirement. Consequently ADG and G/F were lower (P < .05) for WP steers than for SS
and LFHC steers.
The other end of the spectrum may be the comparison of WP with very low ADG (1.5)
backgrounding programs. Hersom et al (2004) noted that steers backgrounded on native range
(NR) lost more energy to heat production during the finishing phase than steers backgrounded on
WP. At feedlot entry the NR steers were lighter and had lower EB fat than the WP steers.
Accretion rates for mass and fat were variable across experiments. Sharman et al (2013)
observed higher (P < .05) omental fat and lower (P < .05) fill for steers grown on WP, compared
to steers grazing NR that gained 0.42 lb/d. When the ADG of NR steers was 1.0 lb in a second
experiment those differences disappeared. Carstens et al (1991) observed that energy restriction
had a greater impact on non-carcass fat than carcass fat. If non-carcass fat tends to equilibrate at
the end of finishing, the differences in non-carcass fat accretion due to initial mass differences
would impact NEG required to reach a common carcass fat endpoint. It would be one of the
inconspicuous effectors of F/G occurring in feedlots.
Sainz et al (1995) implemented three calf feeding strategies. These included immediately
starting a high concentrate finishing diet fed ad libitum (AHC); limit feeding a high concentrate
diet (LFHC) and ad libitum feeding a forage based diet (AF). The LFHC ration was limited to
achieve ADG comparable to the AF diet. The growing phase was scheduled for 520 to 720 lb
BW. All 3 groups were fed the AHC diet during the finishing phase from 720 lb to a BW
constant endpoint of 1060 lb.
Several important points that intertwine with things previously discussed come together in this
experiment. From a production stand point it is noteworthy that diets affected fill at the end of
backgrounding (Table 6), but not at the end of finishing. The LFHC diet caused more fill than
occurred with the ad libitum high concentrate diet. There were LFHC finishing treatments as
well (data not shown here) that also caused more fill than occurred with ad libitum feeding.
During finishing, DMI was similar between LFHC and AF grower treatments and both were
higher (P < .05) than feed AHC during the grower phase.

68
Backgrounding diets altered (P < .05) the finishing phase heat production with values of 258c,
292b and 330
a Mcal/kg W
.75 for AHC, LFHC and AF treatments, respectively. This is opposite
the ranking of F/G calculated on an EBW basis (Table 3). We are inclined to think heat
production is a loss in efficiency. However in this situation the heat production appears to be a
reflection of higher DMI and daily protein gain. Although they are associated with higher heat
production, higher DMI and protein gains generally result in improved production/economic
efficiency in feedlot cattle.
I took some liberties with the data of Sainz et al (1995) and calculated F/G using their treatment
means for DMI, fasted body weight and HCW. The ranking for F/G are similar for the reported
EBW basis F/G and Apparent F/G (based on fasted BW). However the magnitude of difference
in F/G between LFHC and AF was much greater on an Apparent basis. Since dressing
percentage was altered by backgrounding diet, the ranking of F/G based upon HCW was altered.
On this HCW basis, the F/G was highest for the AF cattle and the magnitude of differences in
F/G is noteworthy (Table 6). The bottom line is that the biological efficiencies diverged from
production efficiencies and the production efficiencies depended very much on the marketing
method used in my derived calculations.
Implant use should be considered as well when evaluating backgrounding management.
Pritchard et al (2003) demonstrated that a comprehensive suckling, backgrounding, finishing
production system implant strategy increases HCW (P < .05) and lowers finishing phase F/G (P
< .05). Implants effectively increase the frame size of cattle (Loy et al 1988; Guiroy et al 2002).
Prolonged exposure to implants seems to increase frame size more than occurs with shorter
periods of implant exposure (Pritchard’s closet). Duckett and Andrae (2001) concluded that
response to implants used across segments of the cattle production system are additive. If dietary
energy appropriate implant potency is used, backgrounding phase implants should increase total
LWG and lower F/G in each segment of the production system.
Summary
Backgrounding diets and backgrounding growth rates have obvious as well as inconspicuous
impacts on feedlot production. Differences in fill, composition of gain, intake, total LWG and
dressing percent can have significant impacts on finishing cattle economics. The dynamics are
complex and traditional paradigms do not consistently apply in the current cattle production
environment. From a feedlot performance perspective the most appealing system appears to be
feeders backgrounded on a limit fed high concentrate diet. On the basis of total LWG and F/G,
wheat pasture cattle are the least appealing, although other issues in total system sustainability
will continue to make this a viable option. Backgrounding diet substrate (i.e. starch v fiber)
seems to have little bearing on final quality grade. Only the very low ADG, extensive systems
have much of an impact on marbling of the finished cattle.
Literature Cited
Brethour, J.R. 2000. Using serial ultrasound measures to generate models of marbling and
backfat thickness changes in feedlot cattle. J. Anim. Sci. 78:2055-2061.

69
Carstens, G.E., D.E. Johnson, M.A. Ellenberger, and J.D. Tatum. 1991. Physical and chemical
components of the empty body during compensatory growth in beef steers. J. Anim. Sci.
69:3251-3264.
Composition of Growth in Beef Cattle in honor of Rodney L. Preston. 1996. Texas Tech Univ.
Dept. Anim. Sci. and Food Tech.
Duckett, S.K. ang J.G. Andrae. 2001. Implant strategies in an integrated beef production system.
J.Anim. Sci. 79 (E Suppl): E110-E117.
Guiroy, P.J., L.O. Tedeschi, D.G. Fox, and J.P. Hutcheson. 2002. The effects of implant strategy
on finished body weight of beef cattle. J. Anim. Sci. 80:1791-1800.
Hersom, M.J., G.W. Horn, C.R. Krehbiel, and W.A. Phillips 2004. Effect of live weight gain of
steers during winter grazing: I. Feedlot performance, carcass characteristics, and body
composition of beef steers. J. Anim. Sci. 82:262-272.
Janovick Guretzky, N.A., J.R. Russel, D.R. Strohbehn, and D.G. Morrical. 2005. Grazing and
feedlot performance of yearling stocker cattle integrated with spring- and fall-calving beef
cows in a year-round grazing system. J. Anim. Sci. 83-2696-2704.
Jennings, J.S., A.E. Wertz-Lutz, R.H. Pritchard, A.D. Weaver, D.H. Keisler and K. Bruns. 2011.
Circulating ghrelin and leptin concentrations and growth hormone secretagogue receptor
abundance in liver, muscle, and adipose tissue of beef cattle exhibiting differences in
composition of gain. J. Anim. Sci. 89:3954-3972.
Loy, D. D., H.W. Harpster, and E.H. Cash. 1988. Rate, composition and efficiency of growth in
feedlot steers reimplanted with growth stimulants. J.Anim. Sci 66:2668-2677.
McCurdy, M.P., C.R. Krehbiel, G.W. Horn, P.A. Lancaster, and J.J. Wagner. 2010a. Effect of
winter growing program on visceral organ mass, composition, and oxygen consumption of
beef steers during growing and finishing. J. Anim. Sci. 88:1554-1563.
McCurdy, M.P., G.W. Horn, J.J. Wagner, P.A. Lancaster, and C.R. Krehbiel. 2010b. Effects of
winter growing programs on subsequent feedlot performance, carcass characteristics, body
composition, and energy requirements of beef steers. J. Anim. Sci. 88:1564-1576.
Owens, F.N., D.R. Gill, D.S. Secrist, and S.W. Coleman. 1995. Review of some aspects of
growth and development of feedlot cattle. J. Anim. Sci. 73:3152-3172.
Pritchard, R.H., K.W. Bruns, and D.L. Boggs. 2003. A comparison of lifetime implant strategies
for beef steers. SD Agr Exp Sta. Beef Report BEEF 2003-11 pp 70-79.
Reuter, R.R. and P.A. Beck. 2013. Carry over effects of stocker cattle systems on feedlot
performance and carcass characteristics. J. Anim. Sci. 91:508-515.
Sainz, R.D., F. De la Torre, and J.W. Oltjen. 1995. Compensatory growth and carcass quality in
growth restricted an refed beef steers. J. Anim. Sci. 73:2971-2979.
Sharman, E.D., P.A. Lancaster, C.P. McMurphy, G.G. Hilton, J.D. Starkey, C.R. Krehbiel, and
G.W. Horn. 2013. Effect of rate of weight gain of steers during the stocker phase. II.
Visceral organ mass and body composition of growing-finishing beef cattle. J. Anim. Sci.
doi 10.2527/jas. 2012-5451.

70
Table 1. Age – Backgrounding effects on steer performance during finishing and carcass
traits1
Age at Onset, mo 10 15
Initial BW, lb 706 863
Out BW, lb 1179 1313
Days on feed 144 104
ADG, lb 3.29 4.33
DMI, lb 22.14 25.94
F/G 6.74 5.99
HCW, lb 737 792
Ribfat, in 0.60 0.59
Marbling2 537 463
YG 3.42 3.31
DMI/MBS3 100.6 106.9
1 Pritchard’s closet
2500 = small°; 400 = select°
3 g DMI/kg W
0.75
Table 2. Accelerated and Extensive production system influences on finishing phase
performance and carcass traits.
Accelerated
Fall born
Extensive
Spring born
Extensive
Age at Fdlt entry, mo 6.1 11.8 16.4
BW at Fdlt entry, lb 551 631 838
BW at Fdlt exit, lb 1129c 1250
b 1349
a
ADG, lb 2.87b 3.75
a 3.97
a
DMI, lb‡ 18.53 23.52 28.86
F/G, lb 6.25b 6.25
b 7.14
a
Dress, % 60.4a 60.1
b 60.0
b
HCW, lb 683c 739
b 812
a
REA, in2 12.4
b 12.6
b 14.0
a
YG 2.3 2.2 2.4
Marbling2 572 561 563
1 Janovick Guretzky et al (2005)
2 400 = Slight°; 500 = Small°
abc means differ (P < .05) as noted by authors
‡ Calculated from published means for ADG and G/F

71
Table 3. Allometric growth in steer calves caused by higher energy grower programs1
Grower Diet
Lower
Energy
Higher
Energy
1 to 116d
ADG, lb 2.87a 3.48
b
BW d116 943a 1011
b
HCW, lb 532a 613
a
Carcass fat, % 20.1a 23.3
b
At 0.4 Ribfat
Higher
Energy2
Total Days 209 165 209
HCW, lb 776 710 800
Carcass protein, lb 95 83 93
Carcass fat, lb 207a 207 258
b
Carcass fat, % 26.7a 29.1 32.4
b
1 from Jennings et al (2012)
2 at constant days with Lower Energy treatment
ab Means differ (P<0.05)
Table 4. Influence of Grower Phase on Finishing Performance and Carcass Traits of
Steers1
Exp 1 Exp 2
Background phase
Lower
Energy
Higher
Energy
Lower
Energy
Higher
Energy
days 91 77 112 82
NEG, Mcal/cwt 40 51 43 56
Initial BW, lb 723 721 717 718
End BW, lb 951 941 977 982
ADG, lb 2.51 * 2.85 2.33 * 3.22
Finishing phase Common Diet
days 97 85 89 80
Out BW, lb 1337 1285 1245 1265
ADG, lb 3.98 * 4.05 3.01 * 3.54
DMI, lb 25.75 * 24.69 24.69 * 23.85
F/G 6.47 * 6.12 8.25 * 6.77
HCW, lb 836 * 805 777 791
Rib fat, in 0.49 * 0.45 0.40 * 0.45
YG 3.16 * 2.95 3.01 2.94
Marbling2 531 527 524 546
Carcass Fat, %3
28.1 29.1 27.4 28.0 1 Pritchard’s closet
2 marbling score 500 = small°, 400 = select°
3 determined from 9-10-11 rib composition
*means differ (P < .05)

72
Table 5. The effect of backgrounding calves for 112d on wheat pasture, silage, or a limit fed
high concentrate diet on finishing phase performance1.
Grower Phase Diet
Wheat
Pasture
Sorghum
Silage/grain
Limit fed
High Concentrate
Grower Phase
Initial BW, lb 558a 522
b 516
c
Final BW, lb 842 813 831
ADG, lb 2.54a 2.42
b 2.60
a
EB fat, % 15.0b 17.3
a 17.4
a
EE in EBW gain, %‡ 12.0 18.1 18.5
Finishing Phase Common diet
Days 123 104 104
Final BW, lb 1287 1281 1260
ADG, lb 3.62c 4.45
a 4.08
b
DMI, lb 22.93ab
24.03a 22.27
b
F/G2 6.41
a 5.38
b 5.38
c
EE in EBW gain, %‡ 37.6 32.0 33.6 1
McCurdy et al (2010a) 2
originally reported as G/F
‡ derived data calculated from published means abc
means differ (P < .05)

73
Table 6. Influence of a limit fed grower program on finishing phase production traits1
Grower Phase Diet
Ad libitum
(AHC)
Finisher
Limit fed
(LFHC)
Finisher
Ad libitum
(AF)
Forage based
Initial BW --- 539 ---
End of Grower Phase
days 57 112 112
BW, lb 776a 683
b 701
b
Empty BW, lb 668a 644
b 624
c
Fill, % EBW 8.4c
11.6b
15.1a
Carcass fat, % 22.3a
15.9b 12.2
c
End of Finish Phase Only
days 96 89 111
BW, lb 1034b
1096a
1107a
Empty BW, lb 994b 990
b 1003
a
CarcAdj BW, lb2‡ 1086 1069 1045
Fill, % EBW 7.4 7.8 6.5
DMI, lb 19.93b 24.21
a 25.86
a
EBW basis
ADG 2.69c 4.23
a 3.84
b
F/G 7.46a 5.71
c 6.80
b
Apparent basis‡
ADG, lb
F/G
2.69
2.69
4.64
4.57
3.66
7.07
CarcAdjusted basis2‡
ADG, lb 3.23 4.34 3.10
F/G 6.17 5.58 8.34
Dress, %3‡ 65.7 61.0 59.0
HCW, lb 679a 668
a 653
b
Carcass fat, % 28.9 26.7 28.5
Fat gain, g/d 529b 774
a 763
a
Protein gain, as g/d 162c 250
a 201
b
1 From Sainz et al, 1995
‡ derived data calculated from published means 2 CarcAdj based on final BW = HCW ÷ 0.625
3‡ derived from treatment means using equation 100(HCW/fasted BW)
abc means differ (P < .05) as noted by authors

74

75

76
Grain Processing: Gain and Efficiency Responses by Feedlot Cattle
Fred Owens, DuPont Pioneer, Johnston, IA 50131 and
Mehmet Basalan, Kirikkale University, Kirikkale, Turkey
Executive summary
Published information from the past 15 years related to growth performance by feedlot steers and
heifers fed various grains processed in different ways (389 diets within 139 trials with a mean of
40 cattle per diet) was compiled. The energy values for these various diets and grains were
calculated from performance data and analyzed for this review. A summary of these results
comparing dry rolled with steam flaked dent corn grain is presented in Table 1 together with
estimates from previous reviews.
Table 1. Compiled information on performance and energy response to flaking of dent corn
grain.
Information
source
Measurement Dry rolled
corn
Steam
flaked corn
Benefit
%
Basis
Owens et al.,
1997
ADG, kg 1.45 1.43 -1.4 12 paired trials
Zinn et al.,
2011
ADG, kg - - 6.3 Literature
This review ADG, kg 1.51 1.51 -0.1 Across all trials
This review ADG, kg 1.55 1.61 3.9 17 paired trials
Zinn et al.,
2011
DMI, kg/day - - -4.3 12 paired trials
Owens et al.,
1997
DMI, kg/day 9.45 8.35 -11.6 Literature
This review DMI, kg/day 9.48 8.6 -9.3 Across all trials
This review DMI, kg/day 9.22 8.87 -3.8 17 paired trials
Owens et al.,
1997
Gain/Feed 0.152 0.170 11.9 Literature
This review Gain/Feed 0.16 0.176 10.0 Across all trials
This review Gain/Feed 0.167 0.181 8.4 17 paired trials
Firkins et al.,
2001
Ruminal starch
digestion %
52.3 56.9 8.8 Ground for cows
Zinn et al.,
2011
Ruminal starch
digestion %
60.6 84.2 38.9 Across 26 trials
This review Ruminal starch
digestion %
68.3 83.9 22.8 Across all trials
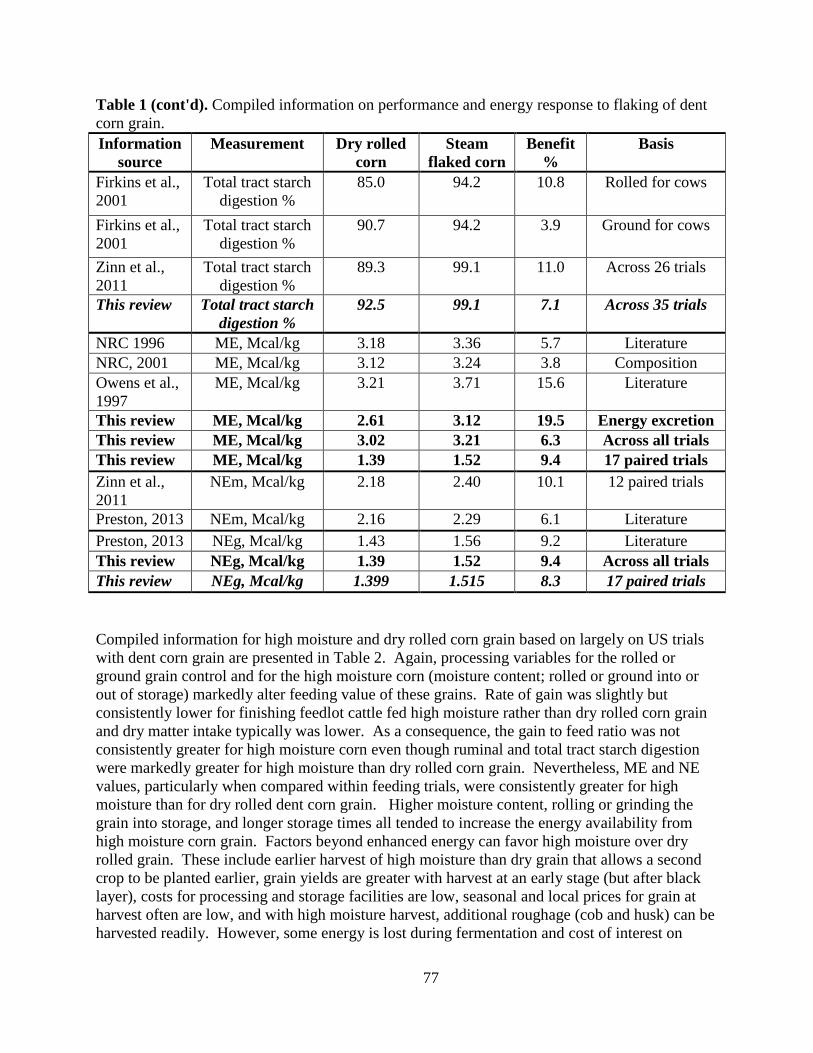
77
Table 1 (cont'd). Compiled information on performance and energy response to flaking of dent
corn grain.
Information
source
Measurement Dry rolled
corn
Steam
flaked corn
Benefit
%
Basis
Firkins et al.,
2001
Total tract starch
digestion %
85.0 94.2 10.8 Rolled for cows
Firkins et al.,
2001
Total tract starch
digestion %
90.7 94.2 3.9 Ground for cows
Zinn et al.,
2011
Total tract starch
digestion %
89.3 99.1 11.0 Across 26 trials
This review Total tract starch
digestion %
92.5 99.1 7.1 Across 35 trials
NRC 1996 ME, Mcal/kg 3.18 3.36 5.7 Literature
NRC, 2001 ME, Mcal/kg 3.12 3.24 3.8 Composition
Owens et al.,
1997
ME, Mcal/kg 3.21 3.71 15.6 Literature
This review ME, Mcal/kg 2.61 3.12 19.5 Energy excretion
This review ME, Mcal/kg 3.02 3.21 6.3 Across all trials
This review ME, Mcal/kg 1.39 1.52 9.4 17 paired trials
Zinn et al.,
2011
NEm, Mcal/kg 2.18 2.40 10.1 12 paired trials
Preston, 2013 NEm, Mcal/kg 2.16 2.29 6.1 Literature
Preston, 2013 NEg, Mcal/kg 1.43 1.56 9.2 Literature
This review NEg, Mcal/kg 1.39 1.52 9.4 Across all trials
This review NEg, Mcal/kg 1.399 1.515 8.3 17 paired trials
Compiled information for high moisture and dry rolled corn grain based on largely on US trials
with dent corn grain are presented in Table 2. Again, processing variables for the rolled or
ground grain control and for the high moisture corn (moisture content; rolled or ground into or
out of storage) markedly alter feeding value of these grains. Rate of gain was slightly but
consistently lower for finishing feedlot cattle fed high moisture rather than dry rolled corn grain
and dry matter intake typically was lower. As a consequence, the gain to feed ratio was not
consistently greater for high moisture corn even though ruminal and total tract starch digestion
were markedly greater for high moisture than dry rolled corn grain. Nevertheless, ME and NE
values, particularly when compared within feeding trials, were consistently greater for high
moisture than for dry rolled dent corn grain. Higher moisture content, rolling or grinding the
grain into storage, and longer storage times all tended to increase the energy availability from
high moisture corn grain. Factors beyond enhanced energy can favor high moisture over dry
rolled grain. These include earlier harvest of high moisture than dry grain that allows a second
crop to be planted earlier, grain yields are greater with harvest at an early stage (but after black
layer), costs for processing and storage facilities are low, seasonal and local prices for grain at
harvest often are low, and with high moisture harvest, additional roughage (cob and husk) can be
harvested readily. However, some energy is lost during fermentation and cost of interest on

78
investment with the longer term grain inventory should be considered. One benefit from
processing of grains that seldom is recognized is the reduced variability in rate and extent of
digestion among batches of grain. In most feeding trial experiments, only one or a few batches
of grain will be used so inconsistency from day to day in grain source and processing is low,
much lower than at commercial feedlots. Improved consistency among batches of grain that
differ in type and hardness should improve animal performance and health of cattle at
commercial feedlots.
Table 2. Compiled information related to performance and energy responses to high moisture
dent corn grain.
Information
source
Measurement Dry rolled
corn
High moisture
corn
Benefit
%
Basis
Owens et al.,
1997
ADG, kg 1.45 1.37 -5.5 Literature
Zinn et al.,
2011
ADG, kg - - -0.6 Literature
This review ADG, kg 1.51 1.5 -0.7 Across all trials
This review ADG, kg 1.55 1.54 -0.7 15 paired trials
Zinn et al.,
2011
DMI, kg/day - - -2.3 Literature
Owens et al.,
1997
DMI, kg/day 9.45 8.72 -7.7 Literature
This review DMI, kg/day 9.48 9.67 2.0 Across all trials
This review DMI, kg/day 9.82 9.28 -5.5 15 paired trials
Owens et al.,
1997
Gain/Feed 0.152 0.156 2.2 Literature
This review Gain/Feed 0.16 0.155 -3.1 Across all trials
This review Gain/Feed 0.158 0.167 5.4 15 paired trials
Firkins et al.,
2001
Ruminal starch
digestion %
52.3 86.8 66.0 Ground for cows
Zinn et al.,
2011
Ruminal starch
digestion %
60.6 91 50.2 Across 7 trials
This review Ruminal starch
digestion %
68.3 77.5 13.5 Across 5 trials
Firkins et al.,
2001
Total tract starch
digestion %
85.0 94.2 10.8 Rolled for cows
Firkins et al.,
2001
Total tract starch
digestion %
90.7 98.8 8.9 Ground for cows
Zinn et al.,
2011
Total tract starch
digestion %
89.3 99.2 11.1 Across 7 trials
This review Total tract starch
digestion %
92.5 98.1 6.1 Across all trials

79
Table 2 (cont'd). Compiled information related to performance and energy responses to high
moisture dent corn grain.
Information
source
Measurement Dry rolled
corn
High moisture
corn
Benefit
%
Basis
NRC 1996 ME, Mcal/kg 3.18 3.36 5.7 Literature
NRC, 2001 ME, Mcal/kg 3.12 3.23 3.5 Composition
Owens et al.,
1997
ME, Mcal/kg 3.21 3.43 6.9 Literature
This review ME, Mcal/kg 3.02 2.96 -2.0 Across all trials
This review ME, Mcal/kg 2.93 3.06 4.4 15 paired trials
Zinn et al.,
2011
NEm, Mcal/kg 2.18 2.23 2.3 Literature
Preston, 2013 NEm, Mcal/kg 2.16 2.29 6.1 Literature
Preston, 2013 NEg, Mcal/kg 1.43 1.56 9.2 Literature
This review NEg, Mcal/kg 1.39 1.34 -3.6 Across all trials
This review NEg, Mcal/kg 1.323 1.412 6.7 15 paired trials
Introduction
Various aspects concerning effects of grain processing on site and extent of starch digestion and
on energy value have been summarized in numerous publications (NRC, 1996; Huntington,
1997; Owens et al., 1997; Rowe et al., 1999; Firkins et al., 2001; NRC, 2001; Zinn et al., 2002;
Armbruster, 2006; Drouillard and Reinhardt, 2006; Hicks and Lake, 2006; Huntington et al.,
2006; Mader and Rust, 2006; McAllister et al., 2006; McLeod et al., 2006; Owens and
Soderlund, 2006; Peters, 2006; Sindt et al., 2006; Soderlund and Owens, 2006; Zinn and Owens,
2008; Zinn et al., 2011). For additional information and viewpoints, readers can refer to those
publications.
How should energy value of grain or diet be calculated?
Net energy (NE) values often are used for feed formulation. Tabular NE values for maintenance,
gain, or lactation for feeds generally are calculated from estimates of metabolizable energy (ME)
that in turn are estimated from data from trials where total digestible nutrient (TDN) of a feed or
diet has been physically measured. Although NE values of individual feeds are not summative to
calculate NE of the diet, ME values of individual feeds can be numerically summed to calculate
the ME of a mixed diet. Therefore, ME values form the most convenient intermediate basis for
estimating energy content of feeds. ME value of a diet in turn can be calculated in two ways –
by the factorial approach through measuring energy lost by an animal (similar to TDN) or from
the quantity of energy that presumably was used by an animal for maintenance and production.
By the factorial method, ME is dietary gross energy minus energy loses in feces, urine, and gas.
By the energy retention approach, the amounts of ME used by the animal for energy retention
and secretion (NEg and NEL) is added to the ME used for maintenance (NEm) to calculate the
total ME that was available to the animal. In either case ME intake divided dry matter intake
yields ME per unit of mass (ME/kg) of the diet.

80
To calculate ME value of a single ingredient in a mixed diet, the ME contributed by other diet
components must be subtracted from the ME of the total mixed diet to calculate the amount of
ME provided by that single ingredient. Dividing that amount of ME from an ingredient by the
proportion of diet DM contributed by that ingredient yields ME/kg of the test ingredient. The
factorial approach is quite labor intensive but can help differentiate among various factors
causing ME to differ. In contrast, the ME estimates by the energy retention approach should be
directly applicable at feed intake levels and environmental conditions used for commercial
production. Feeding trials also generate data related to feed or ME intake and gain to feed ratios
(directly applicable for economic evaluation) from large groups of animals under a variety of
environmental conditions. Although gain to feed ratio can be used directly for calculating
economic return from a specific study, a response in gain to feed ratio can differ markedly from
the true response in ME of the diet. This is most evident when feed intake or mean weights of
cattle fed different diets differ. For example, the gain to feed ratio is improved more than ME
value when intakes by cattle fed different test ingredients differs (as with substitution of
distillers’ products for grain) due to dilution of maintenance. A similar condition exists when
groups of cattle are fed for the same number of days but some have slower rates of gain and
lower mean feeding weight (as with high forage diets). Furthermore, it is difficult to subdivide
gain to feed ratios into the impact of a single diet component of a mixed diet. In contrast, ME or
NE values are automatically adjusted for differences in feed intake and mean body weight to
help quantify the amount of energy available from the diet that should apply for all trials where
that test ingredient is fed.
The energy retention approach inherently includes any differences in efficiency of converting
ME to NE. Also, the energy retention approach relies fully on specific equations that have been
derived from results of past research trials. Those equations for calculating ME from
performance have evolved over time, and can differ with specific dietary (ionophore), animal
(type, shrunk and equivalent weights), seasonal and environmental conditions. These factors
reduce the precision of estimates of ME from individual trials. However, when two feeds are
compared WITHIN a trial, impact of those factors should be minimal. Because all the
information needed to calculate ME by the energy retention method can be gathered under
commercial production conditions from hundreds of pens of cattle over time, the quantity of data
available for calculating ME of a diet or a grain used at a specific feedlot is much greater than by
the factorial approach. By comparing ME (or NE values calculated from ME) for a diet with
expected values, efficiency of individual sets of cattle or a total feedyard can be generated. This
can help in auditing performance, its consistency, and pinpoint specific pens or issues that need
attention. Such checks also can be used to evaluate results from published research trials to
determine if the reported performance results seem “reasonable and logical” based on diet
composition and feed intakes. Both the factorial and the energy retention systems suffer from
variability due to 1) the associative effects of feeds, 2) composition differences within a grain or
feed source attributable to genetic (e.g., flint versus dent) or growing conditions, 3)
inconsistencies in the characteristics of the processed feed or grain (e.g., flake weight, moisture
and storage time for high moisture corn, particle size distribution of ground or rolled corn), and
4) environmental factors that can alter nutrient requirements. Because these environmental and
processing factors should be more consistent within a feedlot or region than across the diverse
locations where research trials are conducted, local estimates for ME should be less variable than
literature summaries compiled across diverse locations. Although the ME means for a specific

81
processing method can prove quite variable, the relative differences among means still should be
meaningful. Within-trial or “paired” comparisons where a grain from a single source processed
by multiple methods is fed within an experiment are preferable to reduce animal and
environmental effects. Compared to the total number of feeding trials, the number of such
“paired” comparisons is quite limited. Unfortunately, grain processing methods seldom are
standardized and factors of importance often are not reported. The objective of this review is to
summarize effects of various grain processing methods on site and extent of digestion, on
performance, and on ME for corn and other grains, and to evaluate the relative impact of several
processing and additional dietary factors on ME estimates.
What factors influence energy value of grain or feed?
Grains typically are fed as a source of net energy, and most of the digested energy from cereal
grains is derived from starch. Because starch digestibility is altered by most processing methods,
total tract starch digestion often is used as an index and in some cases as a predictor of available
energy. However, grain components beyond starch are altered by processing, and processing can
alter the site and thereby the products of digestion. For example, the amount of energy lost as
gas (methane) can be altered by processing. Such factors are not appropriately credited when
evaluating energy availability simply from a difference in starch digestibility.
First and foremost, grain processing usually increases digestibility of specific nutrients,
particularly starch, through reducing the amount of starch protected by the kernel’s pericarp.
And with steam flaking and fermentation of grains, denaturation of proteins that encapsulate
starch within the more vitreous grains (corn, sorghum) will increase the accessibility of starch to
microbial and animal enzymes. Protein denaturation with steam flaking or fermentation thereby
alters ruminal and total tract digestibility of protein. Ruminal and total tract starch digestibility
of the less vitreous grains (wheat, barley, oats) is quite high even without processing, so the need
for and benefit from extensive processing is lower than with more vitreous grains. Yet, grinding
to reduce particle size can increase the rate and extent of ruminal digestion of starch of grains
that have a thick or fibrous pericarp when ruminal residence time is short as with lactating cows
consuming very high amounts of diets rich in NDF. Simply reducing mean particle size by
grinding usually increases starch digestibility of corn grain by lactating cows but has very limited
benefit with feedlot cattle fed high concentrate diets. Presumably, this difference is associated
with differences either in the degree of mastication during eating or ruminal retention time.
Ruminal retention time is decreased at high feed intakes and high dietary NDF concentrations.
Consequently, with higher fiber diets, feedlot cattle might benefit from fine grinding of grains.
Through increasing accessibility and exposure of fiber and fat to bacterial or enzyme attack, the
digestibility of fat and fiber also may be increased by fine grinding and heat treatment. But
because fat and fiber content of cereal grains typically is quite low (except for NDF in oats), any
digestibility increases associated with fat and fiber will be low relative to benefits with starch
and protein.
When rolled or ground, dry grains yield particles strewn across a wide range of particle sizes.
This distribution is not reflected by mean particle size or geometric mean diameter alone.
Because of their greater surface area, rate and extent of digestion is greater for finer than coarser
particles. The prevalence of very small, rapidly fermented particles is greater for floury hybrids
than more vitreous, flinty hybrids. This difference in particle size alone between floury and

82
94
94
92
9589
95
93
91
95
95
99
99
99
99
9999
99
99
99
100
100
99
99
99
100
99
99
100
85
95
Dry rolled
Flaked
HMC
Mean
Dry rolled 93.4
Flaked 99.3
HMC 99.3
Std Dev
Dry rolled 2.00
Flaked 0.09
HMC 0.25
1
2
3
4
5
6
7
8
9
10
Total Tract Starch Digestion, g/100g fed
10 Hybrids
vitreous hybrids following processing may explain much if not all of the difference in
digestibility between floury and vitreous hybrids according to Ramos et al. (2009).
Processing can alter site of digestion even if processing does not alter total tract digestibility.
Generally, extent of ruminal digestion of starch is increased by fermenting a feedstuff prior to
feeding; in contrast digestibility of the starch reaching the small intestine is increased by steam
flaking of cereal grains. Why might an alteration in site of digestion alter the energy value of
grain? Fermentation within either the rumen or large intestine involves loss of methane whereas
digestion in the small intestine does not. Consequently, flushing more starch to the small
intestine should prove beneficial energetically if the additional starch can readily digested within
the small intestine and if absorbed nutrients are used productively by the animal.
Do hybrids differ in site of digestion?
Comparisons across hybrids within a trial Grain from ten Pioneer hybrids grown in adjacent plots in a single irrigated location in Nebraska
that were isolated to avoid the cross-pollination that can alter numerous starch traits within corn
kernels. Grain was harvested early as 1) high moisture corn at 28 to 32% moisture and ensiled or
2) harvested later as dry grain. The dry grain thereafter was either 2a) coarsely rolled or 2b)
steam flaked at 360 to 410 g/L (28 to 32 pounds per bushel) and fed in rotation to 6 growing
Holstein heifers (320 kg) equipped with both duodenal and ileal cannulas. Diets contained 10%
roughage and a protein-vitamin-mineral supplement plus chromic oxide to monitor site of
digestion. Total tract digestibility of starch from each of the 10 hybrids is illustrated in Figure 1.
Figure 1. Total tract starch digestibility by Holstein heifers fed diets containing 10 different corn
grain hybrids in different forms.

83
7070
70
6860
75
74
71
76
74
80
85
88
79
81
81
79
83
83
80
82
80
82
86
80
86
80
84
87
50
60
70
80
90
100
Dry rolled
Flaked
HMC
Mean
Dry rolled 70.8
Flaked 81.9
HMC 82.7
Std Dev
Dry rolled 4.5
Flaked 2.7
HMC 2.8
1
2
3
4
5
6
7
8
9
10Ruminal Starch
Digestion, g/100 g fed10 Hybrids
Total tract starch digestibility from individual hybrids fed as dry rolled corn ranged from 89% to
95%. In contrast, when fed as steam flaked or high moisture corn (HMC), total tract starch
disappearance from these same hybrids was very high and had a very small range (99 to 100%).
Hybrids with higher total tract starch digestibility tended to be those hybrids with lower protein
content and lower vitreousness of starch. The degree that total tract starch digestibility was
increased by processing differed among hybrids ranged from a 10 unit increase in starch
digestibility (11% of the initial value) for the hybrid with the lowest digestibility (and was most
vitreous) when was fed as dry rolled corn to only a 4 unit increase (4% of the initial value) for
the hybrid that had the highest digestibility when fed as dry rolled corn. Thereby, the degree that
starch digestibility was increased varied primarily with the baseline value, not with the starch
digestibility of the processed grain. Ruminal starch disappearance values from this same trial are
shown in Figure 2. Ruminal starch disappearance was less with every hybrid when fed as dry
rolled than when fed as high moisture or steam flaked grain. This means that the quantity of
starch flowing to the small intestine was considerably greater when the grain was fed as dry
rolled than as high moisture or steam flaked corn grain.
Figure 2. Ruminal starch disappearance as a fraction of starch fed from 10 different corn grain
hybrids.
Note that the variability among hybrids in the extent of ruminal starch digested was much greater
among the various hybrids fed as dry rolled grain than when fed as flaked or high moisture corn.
This would indicate that switching cattle from one grain hybrid or from one batch of grain to
another could markedly disrupt the pattern of ruminal fermentation. Abrupt changes in ruminal

84
y = -1.4963x + 165.5R² = 0.7421
y = 1.919x - 108.39R² = 0.8247
0
10
20
30
40
50
60
70
80
90
100
88 90 92 94 96 98 100
Ru
min
alo
r S
ma
ll In
tes
tin
al S
tarc
h
Dis
ap
pea
ran
ce
, %
of
fed
Total tract starch digestion, % of fed
Ruminal disappearance
Small intestinal disappearance
Dry rolledSteam flakedHigh moisture
starch availability of can precipitate acidosis. In research trials where a small number of cattle
are fed, only one or a few batches of grain often are processed for the entire feeding trial. In
contrast, cattle in commercial feedlots typically receive numerous batches of grain during their
feeding period. An improved consistency among batches of grain and of processing should
improve the health and performance of feedlot cattle in feedlots, a benefit seldom detected in
small feeding trials. Improved consistency among batches of processed grains is an advantage
from grain processing that often is not recognized or appreciated.
Despite its lower total tract digestibility, the fraction of dietary starch reaching and digested
within the small intestine was greater for hybrids fed as dry rolled than as flaked or high
moisture corn grain (Figure 3). Starch influx and its disappearance within the small intestine was
greater when extent of ruminal starch digestion was reduced. Variation in the intestinal starch
supply also can prove hazardous. Intestinal influx of a large bolus of readily fermented grain
might precipitate intestinal acidosis and result in the hemorrhagic bowel syndrome, a perplexing
and often fatal malady among high producing lactating cows. This condition often occurs
immediately following a sudden or abrupt shift in composition of the diet, in grain processing, or
in feed intake or management.
Figure 3. Site of disappearance of starch from 10 hybrids that were dry rolled, steam flaked, or
fermented as high moisture corn prior to feeding to intestinally cannulated heifers.

85
Comparisons across locations and trials
Site of starch disappearance within the digestive tract of steers and heifers has been measured in
numerous metabolism trials, but postruminal starch disappearance seldom has been divided
between the small versus the large intestine. Published literature values for site of digestion for 5
cereal grains processed by various methods were compiled; results are presented in Table 3.
Unfortunately, literature information on the impact of processing on site of intestinal starch
digestion is quite limited.
Table 3. Influence of grain source and processing on extent of digestion of starch from grains
fed in the dry rolled (DR), steam flaked (SF), steam rolled (SR), or high moisture (HM) forms as
a fraction of starch entering specific segments of the digestive tract of steers and heifers from
research published in refereed journals. References and data set are available on request.
Grain Process Diets
Starch digestion, % entering segment
Ruminal Post-
ruminal
Total
Tract
Small
intestine
Large
intestine
Barley DR 7 82.9 b 89.1 98.0
b 75.6 63.1
Barley SF 13 90.5 a 90.9 99.2
a - -
Barley SR 5 90.4 a 92.4 99.3
a 80.0 62.0
Corn DR 35 68.3 b 71.2
b 92.5
b 58.0
b 43.5
a
Corn HM 5 77.5 a 87.2
a 98.1
a 61.7
b -17.3
b
Corn SF 84 83.9 a 93.9
a 99.1
a 80.2
a 65.2
a
Corn W 4 78.1 b 57.8
c 90.8
b - -
Oats DR 1 92.7 76.3 98.3 - -
Oats SF 2 94.3 79.0 98.8 - -
Sorghum DR 18 70.0 b 51.4
b 85.9
b 31.2
c 28.8
b
Sorghum HM 4 75.7 ab
82.6 a 95.7
a 57.4
b 59.4
a
Sorghum SF 12 85.0 a 92.2
a 98.8
a 81.4
a 53.0
a
Wheat DR 4 81.7 98.6 99.8 95.2 72.0
Wheat SF 1 91.6 86.2 98.8 - -
Total tract starch digestibility responses to processing differed with grain, being small and
generally not significant for barley, oats and wheat. Ruminal and total tract digestion of starch
from these three grains were high even without extensive processing; nevertheless the extent of
ruminal digestion often was numerically increased by flaking these grains. Total tract digestion
tended to be increased by flaking barley and oats. In contrast with these three grains, total tract
digestibility was markedly increased (6 and 13 percentage points) by steam flaking of the two
grains with high prolamin content, dent corn and sorghum grain. Although most of the response
to processing these two grains can be attributed to an increased ruminal disappearance of starch,
disappearance of starch reaching the small intestine also was significantly increased by steam
flaking and tended to be increased by fermentation prior to feeding. Surprisingly, ruminal

86
y = 0.7458x - 147.67R² = 0.6327
y = 0.8842x - 50.43R² = 0.8196
y = 332.78ln(x) - 1706.7R² = 0.5289
-200
0
200
400
600
800
1000
1200
0 500 1000 1500Sm
all
in
tes
tin
al s
tarc
h d
ige
sti
on
, g
/d
Duodenal starch flow, g/day
Dry rolledHMCSteam flaked
digestion of starch digestion tended to be greater for whole than dry rolled corn grains. High
moisture corn grain had significantly greater ruminal digestion than dry rolled corn grain, but the
impact of fermentation on ruminal sorghum grain was more muted. Based on the assumption
that starch disappearance in the small intestine must exceed about 80% for ruminal starch escape
to be preferred (having an energetic advantage for digestion of starch in the small intestine over
fermentation in the rumen) as described by McLeod et al. (2006) and Huntington et al. (2006),
increasing the extent that starch escapes ruminal fermentation would not prove energetically
beneficial when starch digestibility in the small intestine is below 80%. On that basis, increasing
flow of starch to the small intestine should prove beneficial only for flaked corn, sorghum grain,
and dry rolled wheat. With other grains and other processing methods, ruminal fermentation of
starch should be advantageous energetically over postruminal starch digestion.
Is there a ceiling to the amount of starch that can be digested in the small intestine?
Based on infusion studies and extrapolations across a variety of diets, several researchers have
proposed that the amount of starch digested in the small intestine is limited to some maximum
value. Once this ceiling is exceeded, they propose that the remaining starch simply passes to the
large intestine where it is inefficiently fermented. Based on data from trial used to compile
Table 3, starch disappearance in the small intestine (duodenal minus ileal starch flow) was
calculated and plotted against duodenal starch flow in grams per animal per day (Figure 4) for
corn grain processed by various methods. The plots for steam flaked corn and dry rolled corn
were different but both remained linear (R2 > 0.83 and >0.63, respectively) with no plateau in or
ceiling to starch disappearance being evident. However, the intercept where intestinal starch
digestion would be zero was considerably greater for diets based on dry rolled than on steam
flaked corn grain, possibly reflecting lower availability of non-gelatinized or amylose starch.
Figure 4. Small intestinal starch disappearance versus duodenal starch flow from corn-based
diets.

87
12.50.6
14.30.8
13.00.7
17.9
0.7
12.7
18.7
11.6
15.1
12.2
18.8
10.1
16.7
9.3
6.9
11.1
6.1
11.4
7.0
10.7
8.5
4
4
4
4
4
4
4
4
61.569.8
59.0
74.0
59.469.5
57.370.1
0
10
20
30
40
50
60
70
80
90
100
DR SF DR SF DR SF DR SFHybrid A Hybrid B Hybrid C Hybrid D
Fra
cti
on
of
gro
ss
en
erg
y, %
MetabolizableUrine energyMethaneFecal OM-Not starchFecal Starch
+13%
(7%)
+25%
(13%)
+17%
(8%)
+22%
(14%)
Grain Processing & Energy Subdivisions
ME
Starch
If values for the individual grain processing methods had not been separated and an overall curve
were drawn, as is shown in the dashed line of Figure 4, one could conclude that digestibility of
starch reaching in the small intestine decreased as starch supply increased and might plateau at
some point. The slopes of the regression lines represent estimates of starch digestibility for each
unit of added starch flowing to the duodenum. These values are greater than the fractional starch
digestion rates shown in Table 3. Had these lines been forced through a zero intercept, estimates
of starch digestibility would be 57%, 80%, and 63% for dry rolled, steam flaked, and high
moisture corn grain, respectively, and similar to estimates in Table 3. Which values are more
appropriate for estimating small intestinal starch digestion is debatable.
Can increased starch digestibility fully explain the energy response of grains to processing?
Corn grain from four individual Pioneer hybrids that differed in vitreousness but grown in the
same location the same year were fed after being either dry rolled or steam flaked at 360 g/L (28
pounds per bushel) to 8 steers equipped with ruminal and duodenal cannulas. Energy lost in
feces, methane, and urine were measured or estimated as a fraction of total gross energy intake.
Methane loss was calculated from ruminal concentrations of various volatile fatty acids and
extent of ruminal starch digestion. Metabolizable energy was calculated by difference. Results
are presented in Figure 5.
Figure 5. Energy loss from 4 corn grain hybrids fed to ruminally and duodenally cannulated
steers.

88
Energy loss of starch in feces was markedly reduced by flaking each of these grains even though
the amount of non-starch organic matter in feces was greater for steers fed flaked grain, probably
reflecting decreased ruminal fiber digestion for steers fed flaked corn diets that had a lower
ruminal pH. Ruminal methane loss, calculated from ruminal volatile fatty acid concentrations,
was substantially lower for steers fed the flaked grain due to higher ruminal concentrations of
propionate. Urinary energy loss was similar among all diets. As a result, the metabolizable
energy content as a fraction of gross energy was estimated to be 13 to 25% greater from the
flaked than from the dry rolled corn diets. The increase in ME from reduced starch excretion
across these hybrids alone would be 7 to 14%, only half the observed change in ME. With corn
grain at 4.4 kcal/g DM, the calculated ME mean for the dry rolled and for steam flaked corn
grain in this trial was 2.61 and 3.12 Mcal/kg, respectively. Why the value for dry rolled corn is
slow low is not apparent. Nevertheless, these values indicate that increased digestibility of
starch, though correlated with increase ME of the diet, cannot fully explain the alterations in ME
associated with the flaking process.
To what degree does grain processing alter cattle performance and net energy value of
various grains?
Data from performance trials where high grain diets were fed to finishing steers and heifers were
compiled from published trials with complete information on animals and diet compositions.
Beta agonists had not been fed within these trials. Because beta agonists alter body composition
and weight gain, they will alter calculated energy values for diets, but it seems unlikely that they
will alter the relative differences among feedstuffs in their energy values or the responses to
grain processing. Maintenance energy requirements used for calculating NEm by the NRC
(1996) equations were assumed to be reduced by 12% when an ionophore was being fed. Again,
a larger protein mass would be expected to increase maintenance energy requirements so some
adjustment in energy requirements for maintenance for based on condition at the beginning as
well as the end of a feeding trial probably would be appropriate. ME value for each diet was
calculated from rate of gain and feed intake using NRC (1996) empty body weight equations. To
calculate equivalent weight, shrunk weight at harvest was assumed to be equal to the weight at
which cattle had reached a low choice quality grade. ME values for diets also were calculated
based on equations derived by Zinn et al. (2008) based on equivalent weight adjusted shrunk
weights but with no adjustment for feeding an ionophore. ME of the grain in each trial was
calculated by subtracting the ME provided by the other diet ingredients listed in NRC (1996)
tables from the total ME of the diet and dividing the remaining ME by the percentage of grain in
diet dry matter. Least squares means for each processing method were calculated. Statistically,
values were weighted by the square root of the number of cattle per diet to balance for the
relative power of the various trials. Mathematical interconversions among ME, NEg, and NEm
that were used followed those described by NRC (1996) and Zinn et al. (2011). Values for barley
are shown in Table 4.
Rate of gain for cattle fed barley was greatest for cattle fed unprocessed (whole) barley due to
slightly more rapid gain and higher intake as a percentage of body weight. However, diet ME
and ME of the grain was greater for rolled, high moisture, and steam flaked barley than for
whole barley. Compared with other grains, ME of barley was not markedly altered by grain

89
processing method. This matches with failure of processing to alter ruminal or total tract starch
digestibility from barley grain (Table 3).
Table 4. Performance and energy value for unprocessed and processed barley fed to feedlot
steers and heifers across all published trials. Data set and references are available on request.
Grain Barley
Process Basis Dry
rolled
High
moisture
Steam
flaked
Steam
rolled
Whole
Diets Number 49 5 13 10 2
Cattle/diet Number 33.5 44.8 35.0 30.1 47.5
Grain % of diet 87.8 83.9 78.8 89.6 81.7
Initial wt lb 369.1 339.2 361.5 383.2 262.2
Time fed days 112.1 115.9 100.4 127.9 212.8
Non-grain NDF % of diet 4.9 7.5 9.8 3.0 2.7
Dressing % % shrunk wt 57.8 56.2 56.8 57.7 55.9
ADG kg 1.41 1.33 1.36 1.45 1.51
ADG response % - -5.49 -3.48 3.10 7.11
DMI kg/d 8.85 8.53 8.89 9.43 8.53
DMI response % - -3.69 0.38 6.54 -3.61
DMI % BW 1.98 2.05 2.07 2.00 2.07
DMI response % BW - 3.58 4.40 1.02 4.32
Gain:Feed ratio 0.16 0.16 0.15 0.16 0.18
Gain:Feed
response
% - -1.61 -3.08 -0.95 12.58
ME of diet Mcal/kg,
NRC
2.97 2.91 2.88 2.88 2.89
ME intake Mcal/d,
NRC
26.20 24.70 25.56 27.15 24.56
ME of grain Mcal/kg,
NRC
3.12 3.08 3.06 2.91 2.98
ME of grain Mcal/kg,
Zinn
3.13 3.12 3.09 2.93 2.99
NEg of grain Mcal/kg,
NRC
1.45 1.43 1.41 1.31 1.36
NEg of grain
response
% - -1.57 -2.61 -9.89 -6.59
NEg of grain Mcal/kg,
Zinn
1.46 1.45 1.44 1.32 1.37
NEg Preston,
2013
Mcal/kg 1.34 - 1.54 1.34 -
Responses to processing oats and wheat are shown in Table 5. The number of feeding trials
where these grains comprised the primary or only source of starch in the diet was quite small.
Steam flaking had little impact on animal performance or energy values of oats. With wheat,

90
steam flaking depressed daily gain primarily by reducing feed intake substantially so that ME
intake was lowered. However, ME of wheat was not altered by steam flaking or rolling. Intake
depression was less for steam rolled than steam flaked wheat possibly reflecting greater
prevalence of fine particles with flaked wheat diets.
Table 5. Performance and energy value for processed oats and wheat fed to feedlot steers and
heifers across all published trials. Data set and references are available on request.
Grain Oats Wheat
Process Basis Dry
rolled
Steam
flaked
Dry
rolled
Steam
flaked
Steam
rolled
Diets Number 1 2 4 1 2
Cattle/diet Number 24.0 24.0 16.2 65.0 26.5
Grain % of diet 74.2 74.2 87.8 70.2 81.5
Initial wt lb 311.8 312.5 298.4 323.0 352.2
Time fed days 118.0 118.0 109.5 121.0 114.9
Non-grain NDF % of diet 5.8 5.8 3.3 7.4 4.4
Dressing % % shrunk wt 62.0 62.0 57.7 64.5 63.6
ADG kg 1.53 1.49 1.50 1.34 1.54
ADG response % - -2.94 - -10.50 2.59
DMI kg/d 9.20 9.12 8.88 7.61 9.28
DMI response % - -0.87 - -14.30 4.51
DMI % BW 2.29 2.28 2.37 1.89 2.12
DMI response % BW - -0.43 - -20.44 -10.55
Gain:Feed ratio 0.17 0.16 0.17 0.18 0.17
Gain:Feed
response
% - -2.40 - 4.37 -1.90
ME of diet Mcal/kg,
NRC
2.89 2.87 2.92 3.09 2.91
ME intake Mcal/d,
NRC
26.61 26.20 25.94 23.53 26.98
ME of grain Mcal/kg,
NRC
2.94 2.92 3.07 3.05 3.04
ME of grain Mcal/kg,
Zinn
2.92 2.91 3.06 3.09 3.04
NEg of grain Mcal/kg,
Obs
1.33 1.31 1.42 1.41 1.40
Neg of grain Response, % - -1.49 - -1.01 -1.56
NEg of grain Mcal/kg,
Zinn
1.32 1.31 1.41 1.44 1.40
NEg Preston,
2013
Mcal/kg 1.15 1.43 1.43 1.52 -

91
Performance and diet energy values from studies in which corn or sorghum grain was the
primary or only source of grain in the diet are shown in Table 6.
Table 6. Performance responses and energy values for processed corn and sorghum grain to
feedlot steers and heifers based on all published studies. Data set and references are available on
request.
Grain Corn Sorghum
Process Basis Dry
rolled
High
moisture
Steam
flaked
Steam
rolled
Whole Dry
rolled
Steam
flaked
Diets Number 75 52 106 6 15 11 27
Cattle/diet Number 47.7 59.4 48.1 37.5 60.8 39.1 54.0
Grain % of diet 77.7 78.5 75.3 84.0 82.7 81.6 70.2
Initial wt lb 344.2 349.6 333.8 358.8 331.0 353.2 346.1
Time fed days 136.2 118.5 138.3 137.7 134.1 121.0 134.1
Non-grain
NDF
% of diet 6.0 5.2 6.4 4.1 4.3 5.3 9.4
Dressing % % shrunk wt 62.2 62.2 63.2 60.3 60.2 60.0 62.3
ADG kg 1.51 1.50 1.51 1.42 1.40 1.41 1.45
ADG
response
% - -0.72 -0.09 -5.71 -7.45 - 2.71
DMI kg/d 9.48 9.67 8.60 9.06 8.84 10.74 8.97
DMI response % - 1.99 -9.27 -4.44 -6.82 - -16.49
DMI % BW 2.13 2.20 1.97 1.99 2.08 2.44 2.02
DMI response % BW - 3.02 -7.48 -6.91 -2.59 - -16.99
Gain:Feed ratio 0.160 0.155 0.176 0.157 0.157 0.133 0.162
Gain:Feed
response
% - -2.80 10.21 -1.70 -1.71 - 21.76
ME of diet Mcal/kg,
NRC
2.87 2.84 3.03 2.90 2.88 2.61 2.91
ME intake Mcal/d,
NRC
27.16 27.38 26.01 26.25 25.40 27.90 26.05
ME of grain Mcal/kg,
NRC
3.02 2.96 3.21 2.99 2.94 2.66 3.10
ME of grain Mcal/kg,
Zinn
3.02 2.95 3.21 3.01 2.96 2.67 3.11
NEg of grain Mcal/kg,
Obs
1.39 1.34 1.52 1.36 1.33 1.13 1.44
NEg of grain Benefit, % - -3.31 9.29 -1.64 -4.18 - 27.88
NEg of grain Mcal/kg,
Zinn
1.38 1.34 1.52 1.38 1.34 1.13 1.45
NEg Preston,
2013
Mcal/kg 1.43 1.56 1.56 - 1.43 1.30 1.50

92
Daily gain tended to be less for steers fed steam rolled or whole corn grain than for steers fed
grain in other forms largely due to decreased intake of ME. Dry matter intake of corn was
markedly reduced by steam flaking corn, but because rate of gain was not reduced, gain to feed
ratio and ME and NEg values were increased markedly (6% and 10%) by steam flaking. This
matches with the increased starch digestibility associated with flaked corn grain (Table 3).
Although high moisture corn also had increased starch digestibility (Table 3), gain to feed ratio
and energy values for corn grain were no greater for high moisture than for dry rolled grain when
averaged across all experiments based on the moisture levels and forms of high moisture corn
tested. As discussed later, analysis within paired comparison trials rather than across all trials
detected a significant energy response to high moisture over dry rolled corn indicating that
averages across all trials may yield results that differ from paired comparisons.
Feeding unprocessed (whole) corn grain typically is reserved for calves fed diets containing low
amounts of NDF as was apparent in these trials (Table 3). These two factors typically reduce
feed intake but increase the gain to feed ratio. However, when ME of the diet is calculated from
performance, other diet ingredients and feed intakes should be adjusted appropriately. Based on
performance, ME was slightly lower for whole than for dry rolled dent corn across all
experiments.
Among all the cereal grains tested, dry rolled sorghum grain had the highest dry matter intake
and the lowest ME value even though total ME intake was not markedly different from other
grains. Likewise the response in ME to steam flaking was greater for sorghum grain than for the
other grains reaching a value among the highest for all grains. This again matches with the
marked increases in ruminal and total tract starch digestibility from steam flaking of sorghum
grain.
The ME values in tables 4 through 6 were derived from animal performance estimates based on
equations relating performance to feed intake. These ME values differ from ME estimates
provided by the NRC (1996) as illustrated in Figure 6, being somewhat greater for oats and
barley but less than the NRC estimates for corn, wheat, and sorghum grain. As compared with
earlier estimates of ME (Owens et al., 1997) the adjustment for ionophore feeding (decreasing
the ME requirement for maintenance by 12% according to NRC, 1996) reduces the ME
estimates. Yet, ME values from equations developed by Zinn et al. (2011) where maintenance
requirements were not adjusted for feeding an ionophore still closely matched values derived
from performance using NRC equations. Perhaps other factors that alter requirements such as
environmental stress, the assumption that slaughter weight matches weight at 28% body fat,
imprecision of measuring initial or final weight, or overestimation of empty body weight from
initial shrunk weight through use of a constant empty body percentage (89.1% according to
NRC, 1996) are responsible for this difference between the ME estimates derived from these
research trials and the ME values reported previously for grains processed by various methods
summarized by the NRC (1996).

93
2.5
2.6
2.7
2.8
2.9
3.0
3.1
3.2
3.3
2.5 2.7 2.9 3.1 3.3 3.5
ME
Es
tim
ate
s f
rom
Pe
rfo
rma
nc
e, M
ca
l/k
g
ME Estimates from NRC (1996), Mcal/kg
Corn
Sorghum
Oats
Barley
Wheat
Figure 6. Metabolizable energy of grains as reported by the NRC (1996) and calculated from
feedlot performance studies.
Can more precise estimates of performance and energy responses to grain processing be
determined?
Values in Tables 4 through 6 are based on averages across all studies that were located in the
published literature. By testing response to grain processing within rather than across studies
helps to remove trial differences associated with environmental effects, animal selection, and
measurement inconsistencies. Though the impact of these specific factors may be minimized,
other factors that remain that are associated with the grain processing method used within each
trial (e.g., particle size distribution, rolled versus ground grain, flake weight, moisture content)
remain but seldom are quantified in research reports. Nevertheless, pairing of comparisons
within each trial markedly increases the statistical and mathematical precision for detecting
responses to grain processing.
Results of testing of paired comparisons within trials where steam flaked and dry rolled corn
both were fed in the same study are presented in Table 7. Providing steam flaked grain to cattle
increased (P < 0.04) rate of gain while decreasing feed intake (P < 0.01). This resulted in an
increased (P < 0.01) gain to feed ratio, the ME content of the diet, and the ME content of the
grain (by over 5%). ME intake was not different between diets containing dry rolled and steam
flaked corn grain. The increases in ME parallel the substantial increases in starch digestion
noted with flaking corn grain. Although high moisture and steam flaked corn had similar extents
of starch digestion in the rumen and total tract (Table 3), greater (P < 0.05) digestion of starch

94
reaching the small intestine for steam flaked than high moisture corn (Table 8) and a decrease in
loss of methane (Figure 4) may be responsible for the greater increase in ME over dry rolled corn
for steam flaked corn than for high moisture corn (noted later).
Table 7. Paired comparisons within 17 trials where steers or heifers were fed diets based on
corn in both the dry rolled and steam flaked form.
Process Basis Dry rolled Steam flaked Difference P <
Trials number 17 17 percent level
Time fed days 144.4 144.4 0.0 0.20
Grain level % of diet 73.1 72.5 -0.82 0.29
Initial wt kg 325.4 325.5 0.04 0.83
Final wt kg 547.5 555.1 1.40 0.08
Carcass wt kg 356.2 361.4 1.48 0.08
Dressing % % shrunk wt 63.0 63.1 0.19 0.13
ADG kg 1.55 1.61 3.89 0.04
DMI kg/day 9.22 8.87 -3.83 0.01
DMI% kg/100kg BW 2.11 2.01 -4.77 0.01
Gain:Feed ratio 0.167 0.181 8.40 0.01
Diet ME NRC Mcal/kg diet 2.92 3.04 4.14 0.01
Diet ME Zinn Mcal/kg diet 2.91 3.02 3.84 0.01
ME Intake Mcal/day 26.9 26.9 0.12 0.92
ME Grain NRC Mcal/kg Obs 3.04 3.21 5.61 0.01
ME Grain Zinn Mcal/kg Obs 3.03 3.19 5.30 0.01
NEg Grain NRC Mcal/kg Obs 1.40 1.52 8.57 0.01
NEg Grain Zinn Mcal/kg Obs 1.39 1.50 7.91 0.01
Results of trials with paired comparisons where high moisture and dry rolled corn both were fed
in the same study are presented in Table 8. Dry matter intake in kg per day and as a fraction of
mean shrunk body weight were decreased by more than 5% (P < 0.01) when high moisture corn
replaced dry rolled corn in the diet; rate of gain was not altered. This in turn led to an increase in
the gain to feed ratio of about 5%. ME of the grain by both the NRC and by Zinn et al. (2008)
equations was about 4% greater for high moisture than for dry rolled corn (P < 0.02). Intake of
ME was lower for cattle fed high moisture than dry rolled corn, perhaps reflecting more rapid
and extensive ruminal metabolism of starch from the fermented than dry rolled grain as noted in
Table 3.
What additional animal factors or diet components alter the feeding value of processed
corn grain?
The relationships of various trial measurements to ME intake and ME of the diet within each
corn processing method were calculated. ME intake of the diet was well correlated with daily
gain (r = 0.84 to 0.91) and ME of the grain was correlated with gain to feed ratio (r = 0.67 to

95
0.84). Some additional significant correlations that were detected are presented in Table 9.
Through altering these conditions in the correct direction, rate of gain and gain to feed ratio
might be improved for cattle fed grains processed in a specific manner.
Table 8. Paired comparisons within 19 trials where steers or heifers were fed diets based on corn
in both the dry rolled and high moisture form.
Process Basis Dry rolled High moisture Difference P <
Trials number 19 19 percent level
Time fed days 129.6 129.6 0.0 1.00
Grain level % of diet 78.4 78.4 0.01 0.96
Initial wt kg 325.8 327.0 0.35 0.56
Final wt kg 529.2 529.1 -0.02 0.98
Carcass wt kg 368.6 367.9 -0.19 0.90
Dressing % % shrunk wt 62.3 62.3 0.05 0.66
ADG kg 1.55 1.54 -0.67 0.78
DMI kg/day 9.82 9.28 -5.46 0.01
DMI % kg/100kg BW 2.31 2.17 -5.71 0.01
Gain:Feed ratio 0.158 0.167 5.36 0.09
Diet ME NRC Mcal/kg diet 2.82 2.91 3.30 0.03
Diet ME Zinn Mcal/kg diet 2.80 2.90 3.42 0.02
ME Intake Mcal/day 27.6 27.0 -2.38 0.04
ME Grain NRC Mcal/kg Obs 2.93 3.06 4.28 0.02
ME Grain Zinn Mcal/kg Obs 2.91 3.04 4.42 0.01
NEg Grain NRC Mcal/kg Obs 1.32 1.42 7.58 0.02
NEg Grain Zinn Mcal/kg Obs 1.30 1.40 7.69 0.01
Table 9. Correlations between diet and animal measurements with ME intake and grain ME
across trials within a grain form.
Response Alteration Dry rolled Steam flaked High moisture
ME intake Initial wt 0.38 - 0.52
ME intake Non-grain
NDF
-0.27 - 0.47
ME intake Grain % of diet - 0.38 -0.56
ME intake Days fed -0.34 -0.47 -
ME intake Flake wt - 0.41 -
Grain ME Grain moisture - - 0.51
Grain ME Days fed - - 0.32
As might be expected based on standard equations used to predict mean feed intake (NRC,
1996), ME intake and rate of gain were greater when the cattle in research trials had a heavier
initial weight when they were fed either dry rolled or high moisture grain. The direction of the

96
y = 0.0343x + 2.0204
2.5
2.6
2.7
2.8
2.9
3.0
3.1
3.2
3.3
3.4
3.5
18 23 28 33 38
Gra
in M
E c
on
ten
t, M
ca
l/k
g D
M
Moisture content of HMC, %
response to adding more NDF to the diet differed with processing method. Added NDF
decreased ME intake when added to dry rolled corn diets but increased ME intake when added to
high moisture corn diets. Whether this reflects alleviation of ruminal acidosis, less propionate
production from greater ruminal starch escape due to faster ruminal turnover from added NDF,
or some other alteration in efficiency related to site or products of digestion is uncertain. The
higher the percentage of grain in the diet, the higher the ME intake with steam flaked corn grain
but the lower the ME intake with high moisture corn diets. Combined with effects of added
NDF, this may indicate that dilution of the diet is more beneficial with high moisture corn grain
than with the other forms of corn tested. Longer feeding trials resulted in less ME intake with
diets based on dry rolled or steam flaked grain.
With steam flaked grain, higher flake weights increased ME intake. As clearly demonstrated in
feeding trials by Zinn and Plasciencia (1996) and summarized across trials by Zinn et al. (2002),
flaking corn to produce thinner or lighter test weight flakes increases energy availability but
often decreases feed intake and rate of gain. Hence, the optimum flake weight will depend on
the relative economic importance of feed efficiency versus rate of gain. ME content of grain
increased with moisture content of high moisture grain about 1.2% for every 1% increase in
moisture content (Figure 7). Confirming an earlier suggestion (Owens et al., 1997), this
indicates that corn fermented at 30% moisture should have about 5% greater feeding value than
Figure 7. Influence of moisture content of HMC on ME content of grain in HMC diets.
high moisture corn at 26% moisture. Research from Nebraska (Benton et al., 2005) and a
summary by Soderlund and Owens (2006) have clearly demonstrated that disappearance of
ruminal DM increases with time in storage and with moisture content of fermented corn either
harvested with high innate moisture or with reconstituted corn where water is added before the
grain is ensiled. This indicates that the fermentation process or fermentation products are

97
responsible for the increased energy availability of fermented corn grain. Longer feeding trials
also increased the ME of high moisture corn grain, perhaps a longer time for the high moisture
corn to ferment and increase in energy availability.
Overview
Comparisons of NEg values calculated from cattle performance using NRC (1996) or Zinn et al.
(2008) equations with the NEg values from various publications are presented in Table 10.
Table 10. NEg estimates for various processed grains calculated from performance or literature
sources
Grain Process Calculated using Published
NRC
equations
Zinn
equations
NRC Beef
1996
NRC Dairy
2001
Preston
2013
Barley Dry rolled 1.39 1.38 1.40 1.36 1.34
Barley High moisture 1.34 1.34 - - -
Barley Steam flaked 1.52 1.52 - - 1.54
Barley Steam rolled 1.36 1.38 - - 1.34
Barley Whole 1.33 1.34 - - -
Corn Dry rolled 1.39 1.38 1.50** 1.3 1.43
Corn Steam flaked 1.52 1.52 1.62 1.55 1.56
Corn High moisture 1.34 1.36 1.62** 1.48** 1.56**
Corn Whole 1.33 1.34 1.50** - 1.30
Oats Dry rolled 1.33 1.32 1.22 1.26 1.15**
Oats Steam flaked 1.31 1.31 - - 1.43*
Sorghum Dry rolled 1.13 1.13 1.35** 1.30** 1.30**
Sorghum Steam flaked 1.44 1.45 1.50 1.51 1.50
Wheat Dry rolled 1.42 1.41 1.50 1.47 1.43
Wheat Steam flaked 1.41 1.44 - - -
Wheat Steam rolled 1.40 1.40 - - -
* Differs by more than 5% from calculated values.
**Differs by more than 10% from calculated values.
Values with a star deviate more than 5% from the current estimates of NEg. With dry rolled
corn and whole corn grain, the newly derived values are lower than estimated by NRC (1996) as
indicated previously by Zinn et al. (2002) but more similar to estimates from NRC (2001) and
Preston (2013). The newly derived values for high moisture corn are lower than all previous
estimates; this may be associated with insufficient moisture content for adequate fermentation of
high moisture corn grain fed in trials published more recently. NEg values for oats were above
values indicated by Preston (2013) and were not increased by steam flaking as he suggested.
With small grains, starch content and therefore energy values can differ widely with crop
growing conditions. New estimates for dry rolled sorghum were substantially lower than all
previous estimates. Perhaps a coarser roll or grind size has been used in more recent trials;
presence of small berries that are not fractured by rolling or grinding certainly reduce

98
digestibility and energy value of rolled or ground sorghum. In most cases, differences among
grain sources reflect differences in starch content or digestibility whereas responses in ME to
processing reflect alterations in starch digestibility, site of digestion, and methane loss. The
degree that the responses to grain processing differ with either hybrid or growing conditions is
uncertain, but greater response to more extensive processing (flaking, high moisture harvest)
would be expected with more vitreous samples of grain (corn, sorghum) where starch
digestibility is reduced when grain is less extensively processed. Why the absolute ME values in
this literature summary for corn grain are lower than often reported and summarized by others is
unclear. Selection of hybrids with high test weight for reduced kernel damage during handling
or changes and evolution of the equations relating animal performance to energy requirements,
especially related to ionophores, may be involved. Responses in digestibility and energy
availability to grain processing for feedlot cattle generally parallel those reported for lactating
dairy cows, but the shorter time for ruminal fermentation with cows consuming high amounts of
diets rich in NDF generally results in lower digestibility for less fully processed grain; this in
turn leads to a greater response to grain processing with lactating cows than feedlot steers. As
indicated by Preston (2013), cattle use NE for maintenance and gain; for typical feedlot cattle,
between 40 and 50% of consumed energy is used for gain. Consequently, when using
computerized feed formulation programs, the NEm+g value to employ for an individual feedstuff
should be a value midway between NEm and NEg, not NEg alone. The task of the nutrition
consultant and advisor is to balance the numerous factors involved with sourcing grain and
forage and to optimize and standardize the diet and the processing method for optimum
economic return for each specific feedlot. The ultimate task of the feedlot operation is to
produce and deliver a consistent, high quality diet for cattle to achieve maximum productivity,
economic return, and animal health.
Literature cited
Armbruster, S. 2006. Steam flaking grains for feedlot cattle: A consultant's perspective. In:
Cattle Grain Processing Symposium, Oklahoma State University. Available at:
http://beefextension.com/proceedings/cattle_grains06/06-7.pdf.
Corona L., F. N. Owens, and R. A. Zinn. 2006. Impact of corn vitreousness and processing on
site and extent of digestion by feedlot cattle. J. Anim. Sci. 84:3020-3031.
Drouillard, J., and C. Reinhardt. 2006. Flaked grain variables: Control points and evaluation of
flaked grains. In: Cattle Grain Processing Symposium, Oklahoma State University.
Available at: http://beefextension.com/proceedings/cattle_grains06/06-11.pdf.
Firkins, J. L., M. L. Eastridge, N. R. St-Pierre and S. M. Noftsger. 2001. Effects of grain
variability and processing on starch utilization by lactating dairy cattle. J. Anim. Sci.
79:E218-E238.
Harmon, D. L., Yamka, R. M. and Elam, N. A. 2004. Factors affecting intestinal starch digestion
in ruminants: A review. Can. J. Anim. Sci. 84: 309–318.
Hicks, R. B., and R. Lake. 2006. High moisture corn quality control at Hitch. In: Cattle Grain
Processing Symposium, Oklahoma State University. Available at:
http://beefextension.com/proceedings/cattle_grains06/06-8.pdf
Huntington, G. B. 1997. Starch utilization by ruminants: from basics to the bunk. J Anim. Sci.
75:852-867.

99
Huntington, G. B., D. L. Harmon and C. J. Richards. 2006. Sites, rates, and limits of starch
digestion and glucose metabolism in growing cattle. J. Anim. Sci. 84:E14-E24.
Mader, T., and S. Rust. 2006. High moisture grains: Harvesting, processing and storage. pp 88-
92. In: Cattle Grain Processing Symposium, Oklahoma State University. Available at:
http://beefextension.com/proceedings/cattle_grains06/06-12.pdf.
McAllister, T. A., D. J. Gibb, K. A. Beauchemin and Y. Wang. 2006. Starch type, structure and
ruminal digestion. In: Cattle Grain Processing Symposium, Oklahoma State University.
Available at: http://beefextension.com/proceedings/cattle_grains06/06-5.pdf.
McLeod, D. R., R. L. Baldwin, VI, W. El-Kadi Samer, and D. L. Harmon. 2006. Site of starch
digestion: Impact on energetic efficiency and glucose metabolism in beef and dairy cattle.
pp. 129-136. In: Cattle Grain Processing Symposium, Oklahoma State University. Available
at: http://beefextension.com/proceedings/cattle_grains06/06-18.pdf
NRC. 1996, Nutrient Requirements of Beef Cattle. National Academy Press, Washington, D.C.
NRC. 2001. Nutrient Requirements of Dairy Cattle. National Academy Press, Washington, D.C.
Owens F. N., R. A. Zinn, and Y. K. Kim. 1985. Limits to starch digestion in the ruminant small
intestine. J Anim. Sci. 63:1634-1648.
Owens, F. N., and S. Soderlund. 2006. Ruminal and postruminal starch digestion by cattle. pp.
116-128. In: Cattle Grain Processing Symposium, Oklahoma State University. Available
at: http://beefextension.com/proceedings/cattle_grains06/06-17.pdf
Owens, F. N., D S Secrist, W J Hill and D R Gill. 1997. The effect of grain source and grain
processing on performance of feedlot cattle: a review. J. Anim. Sci. 75:868-879.
Peters, T. M. 2006. Comparing cost versus benefits of corn processing for feedlot cattle. In:
Cattle Grain Processing Symposium, Oklahoma State University. Available at:
http://beefextension.com/new%20site%202/proceedings06.html.
Preston, R. L. 2013. Nutrient values for 300 cattle feeds. Beef. Feb. 25, 2013.
Ramos, B.M.O., M. Champion, C. Poncet, I.Y. Mizubuti, and P. Noziere. 2009. Effects of
vitreousness and particle size of maize grain on ruminal and intestinal in sacco degradation
of dry matter, starch and nitrogen. Anim. Feed Sci, Tech. 148:253-266.
Rowe, J. B., M. Choct, and D. W. Pethick. 1999. Processing cereal grains for animal feeding.
Aust. J. Agric. Res. 50:721-736.
Sindt, J. J., J. S. Drouillard, S. P. Montgomery and E. R. Loe. 2006; Factors influencing
characteristics of steam-flaked corn and utilization by finishing cattle. J. Anim. Sci. 84:154-
161.
Soderlund, S., and F. N. Owens. 2006. Corn hybrid by processing method considerations. Pp. 62-
72. In: Cattle Grain Processing Symposium, Oklahoma State University. Available at:
http://beefextension.com/proceedings/cattle_grains06/06-9.pdf
Szasz, J. I., C. W. Hunt, P. A. Szasz, R. A. Weber, F. N. Owens, W. Kezar and O. A. Turgeon.
2007. Influence of endosperm vitreousness and kernel moisture at harvest on site and extent
of digestion of high-moisture corn by feedlot steers. J. Anim. Sci. 85:2214-2221.
Zinn R. A, A. Barreras, F. N. Owens, and A. Plascencia. 2008. Performance by feedlot steers and
heifers: daily gain, mature body weight, dry matter intake, and dietary energetics. J Anim.
Sci. 86:2680-2699.
Zinn R. A., A. Barreras, L. Corona, F. N. Owens, and A. Plascencia. 2011. Comparative effects
of processing methods on the feeding value of maize in feedlot cattle. Nutr. Res. Rev.
24:183-190.

100
Zinn R. A. and F. N. Owens.1983. Influence of feed intake level on site of digestion in steers fed
a high concentrate diet. J. Anim. Sci. 56:471-475.
Zinn, R. A. and A. Plasciencia. 1996. Influence of flake density on the feeding value of steam-
processed corn in diets for lactating cows. J. Anim. Sci. 74:310-316.
Zinn, R. A., F N Owens and R A Ware. 2002. Flaking corn: processing mechanics, quality
standards, and impacts on energy availability and performance of feedlot cattle. J. Anim.
Sci. 80:1145-1156.

101

102
Feedlot Research at the U.S. Meat Animal Research Center
Harvey Freetly and Kristin Hales
USDA, ARS, U.S. Meat Animal Research Center
Clay Center, NE
Introduction
The U.S. Meat Animal Research Center (U.S. MARC) conducts research in several areas to
support the feedlot industry and the U. S. consumer. These areas include
Determining the nutrient value of emerging coproduct feeds and nutrient requirements of
cattle that have diverse genetics
Defining underlying mechanism associated with enteric greenhouse gas production
Predicting and mitigating heat stress
Preharvest food safety
Developing genomic-based tools for selection for feed efficiency and for making
management decisions to improve production efficiency.
Determining the nutrient value of emerging coproduct feeds and nutrient requirements of
cattle that have diverse genetics
The metabolizable energy value of steam-flaked rations decrease with increased distillers grains
inclusion suggesting that metabolizable energy concentration of distillers grains in not constant
and may need to be discounted as inclusion rate increases (Hales et al., 2013a). The decrease in
energy value is being driven by an increased loss of methane and fecal energy as distillers
concentration is increased.
Wet distillers grains with solubles (WDGS) are relatively high in NDF and average daily gain
compared to corn suggesting that lower concentrations of ingredients considered to be high in
roughage could be included in diets that replace WDGS for corn. Hales et al. (2013b)
determined that final body weight tended to increase as alfalfa hay increased from 2 to 6% but
then decreased from 6 to 14% inclusion. Similiarly, average daily gain responded quadratically
in which it increased from 2 to 6% and subsequently decreased from 6 to 14% alfalfa hay
inclusion. Dry matter intake increased linearly as alfalfa hay inclusion increased in the diet. The
Gain:Feed ratio increased from 2 to 6% alfalfa hay inclusion and then decreased linearly from 6
to 14% alfalfa hay inclusion.
Concentration of alfalfa hay in the finishing diet did not affect hot carcass weight, marbling
score, or the proportion of cattle grading USDA choice. However, dressing percent and ribeye
area did respond in a quadratic manner in which they decreased from 2 to 10% alfalfa hay
inclusion and increased from 10 to 14% alfalfa hay in the diet. Yield grade and adjusted 12th
rib
fat responded quadratically in which both increased from 2 to 6% alfalfa hay inclusion and
decreased from 6 to 14% inclusion. Analysis of responses of Gain:Feed and average daily gain
on alfalfa hay predict the apex at 3 and 7% for Gain:Feed ratio and average daily gain,
respectively, when fed in diets based on dry-rolled corn containing 25% WDGS.

103
Defining underlying mechanism associated with enteric greenhouse gas production
Methane gas released by cattle is a product of feed fermentation in the digestive tract. Released
methane represents both a lost opportunity to capture dietary energy and a source of greenhouse
gas. Developing strategies to reduce methane emissions from cattle have the potential to
increase production efficiency as well as reducing the impact of cattle on the environment.
Numerous factors contribute to the relative methane emissions amongst groups of cattle. In our
previous research, we have shown that 3% of intake energy consumed by steers fed a high-corn
diet is lost as methane energy (Archibeque et al., 2007). Cattle eating a high-forage diet
typically release a greater percentage of their dietary energy as methane and cattle with a lower
feed intake emit less methane Flatt et al., 1965; Reynolds et al., 1991; Freetly and Nienaber,
1998). Nkrumah (2006) and Hegarty et al. (2007) found reduced methane emissions from steers
that have a low residual feed intake.
Zhou et al. (2010) determined that cattle that differ in feed efficiency also differ in prevalence of
methanogenic rumen species which may be a possible mechanism for the reduced CH4
emissions. In our studies, cattle that had a positive residual gain had higher enteric methane
productions compared to cattle that had a negative residual gain at a similar feed intake. The
vitro capacity to produce methane and total methanogens in rumen fluid did not differ between
groups suggesting an increased methane production with increased feed efficiency. A potential
driver of the increased methane production may be the result of more efficient cattle having
higher digestion rates of feed resulting in increased nutrient availability to the animal and an
increased methane production resulting from increased rates of fermentation.
The primary driver of methane production is the number of days an animal is alive. Reducing
the number of days it takes to feed a calf will have the greatest impact on total methane
production. The second greatest driver of methane production is the amount of feed the calf
consumes. Using selection indexes, such as residual feed intake (RFI), are thought to potentially
reduce methane production by decreasing feed intake for a fixed rate of gain. However, if
selecting for RFI increases the days on feed to reach a given weight advantages in reduced feed
intake will be offset by the increased number of days on feed.
Predicting and mitigating heat stress
Heat waves have been associated with increased mortality of cattle in the feedlot as well as
reductions in animal performance. A model has been developed to predict heat events that will
result in heat stress in cattle (Eigenberg et al., 2008). The model can be found at the U. S.
MARC website (http://www.usmarc.usda.gov). The model is based on a regression equation that
predicts respiration rate in cattle. When the ambient temperature is above 25°C and a steer is
taking between 74 and 85 breaths per minute (BPM), the condition is considered to be normal.
An alert is issued if the predicted BPM is between 85 and 110. When predicted BPM is between
110 and 133, a danger alert is issued. When BPM exceeds 133, an emergency alert is issued.
The equation is a function of ambient temperature, relative humidity, wind speed, and solar
radiation (estimated from cloud cover). The model uses the predicted data from the National
Weather Service to create the extend heat stress forecast.

104
Animal characteristics are also associated with heat stress. Hide color, history of respiratory
pneumonia, body fat, and behavior have been associated with variation in susceptibility to heat
stress (Brown-Brandl et al., 2006).
Preharvest food safety
Feedlot soils are a source of E. coli O157:H7 and are a potential means of transmission to
animals. Escherichia coli can be reduced in feedlot soils by solarization. Covering soil with
plastic for one week resulted in a two-log decrease in E. coli, and a three-log decrease after six
weeks (Berry et al., 2012).
Diet can contribute to the level of E. coli O157:H7 in feedlot cattle. Cattle fed diets that
contained 40 or 70% distiller grains with solubles had more E. coli O157:H7 in their feces than
calves not fed distillers grains (Wells et al., 2011).
Developing genomic based tools for selection for feed efficiency and for making
management decisions to improve production efficiency
The U.S. MARC has long been associated with the evaluation of different breeds of cattle. The
historical project has been the Germplasm Evaluation Project (GPE). In GPE, sires within
breeds were sampled and bred to a base cow herd at U.S. MARC and the progeny were
subsequently evaluated for production traits as well as product quality (Wheeler et al., 1996,
1997, 2001, 2004, 2005, 2010; Casas et al., 2006, 2010). These studies have been pivotal to
developing predictions of animal performance and developing nutrient requirements of feedlot
cattle.
The difficulty with implementing the information that has been gleaned from these studies is that
we rarely know the genetic background of calves when they arrive at the feedlot. Often, the
most information we have is the coat color of the calf. In an effort to develop tools that more
accurately predict the genetic potential of a calf for feed efficiency and product quality, a new
experiment was undertaken to find genetic markers associated with economically relevant traits.
The first step was the development of a set of markers across the genome of cattle (Matukumalli
et al., 2009) that could be associated with production traits. The second step is collecting
production data in cattle that have been evaluated for these genetic markers. The U.S. MARC
has undertaken a multiple year project to measure feed intake and growth in fed cattle to identify
markers associated with feed efficiency. The goal has been to produce a cost effective test that
predicts the genetic potential of a calf to gain weight on a given set of feed resources and the
quality of the product at the end of the feeding period. This approach is sometimes referred to as
“marker-assisted management.” A number of studies have reported associations between genetic
markers and production traits (Snelling et al. 2011). However, the ability of genetic markers to
predict performance is often reduced when marker-trait relationships are developed in one
population and are then applied in a population that is not closely genetically related (Lindholm-
Perry et al., 2011). This loss in relationship between markers and traits has resulted in an effort
to identify the mutations that lead to differential expression of traits. Initial approaches have
been through fine mapping; however, advances in technology have led to an approach that
involves sequencing large segments of the genome.

105
Literature Cited
Archibeque, S. L., H. C. Freetly, N. A. Cole, and C. L. Ferrell. 2007. The influence of
oscillating dietary protein concentrations on finishing cattle. II. Nutrient retention and
ammonia emissions. J. Anim. Sci. 85:1496-1503.
Berry, E. D., and J. Wells. 2012. Soil solarization reduces Escherichia coli O157:H7 and total
Escherichia coli on cattle feedlot pen surfaces. J. Food Protect. 75(1):7-13.
Brown-Brandl, T. M., R. A. Eigenberg, and J. A. Nienaber. 2006. Heat stress risk factors of
feedlot heifers. Livestock Sci. 105:57-68.
Casas, E., and L. V. Cundiff. 2006. Postweaning growth and carcass traits in crossbred cattle
from Hereford, Angus, Norwegian Red, Swedish Red and White, Friesian, and Wagyu
maternal grandsires. J. Anim. Sci. 84:305-310.
Casas, E., R. M. Thallman, L. A. Kuehn, and L. V. Cundiff. 2010. Postweaning growth and
carcass traits in crossbred cattle from Hereford, Angus, Brangus, Beefmaster, Bonsmara,
and Romosinuano maternal grandsires. J. Anim. Sci. 88:102-108.
Eigenberg, R., T. M. Brandl, and J. A. Nienaber. 2008. Development of a graphical web-based
heat stress forecast for feedlot cattle ASABE Paper No. 083887 Providence, Rhode Island.
Flatt, W. P., C. E. Coppock, and L. A. Moore. 1965. Energy balance studies with lactating, non-
pregnant dairy cows consuming rations with varying hay to grain ratios. Pages 121-130 in
Energy Metabolism, Proc. 3rd Symp. Troon, Scotland. EAAP Publ. No. II, Academic Press,
London.
Freetly, H. C., and J. A. Nienaber. 1998. Efficiency of energy and nitrogen loss and gain in
mature cows. J. Anim. Sci. 76:896-905.
Hales, K. E., N. A. Cole, J. C. MacDonald. 2013a. Effects of increasing concentrations of wet
distillers grains with solubles on energy metabolism, carbon-nitrogen balance, and methane
emissions of cattle. J. Anim. Sci. 91:819–828.
Hales, K. E., H. C. Freetly, S. S. Shackelford, D. A. King. 2013b. Effects of roughage
concentration in dry-rolled corn-based diets containing wet distillers grains with solubles on
performance, carcass characteristics, and in vitro dry matter digestibility of finishing beef
steers. J. Anim. Sci. accepted.
Hegarty, R. S., J. P. Goopy, R. M. Herd, and B. McCorkell. 2007. Cattle selected for lower
residual feed intake have reduced daily methane production. J. Anim. Sci. 85:1479-1486.
Lindholm-Perry, A. K., A. K. Sexten, L. A. Kuehn, W. M. Snelling, T. P. L. Smith, D. A. King,
S. D. Shackelford, T. L. Wheeler, C. L. Ferrell, T. G. Jenkins, and H. C. Freetly. 2011.
Association, effects and validation of polymorphisms within the NCAPG - LCORL locus
located on BTA6 with feed intake, gain, meat and carcass traits in beef cattle. BMC Genet.
12:103. 2011.
Matukumalli, L. K., C. T. Lawley, R. D. Schnabel, J. F. Taylor, M. F. Allan, M. P. Heaton, J.
O'Connell, S. S. Moore, T. P. Smith, T. S. Sonstegard, and C. P. Van Tassell. 2009.
Development and characterization of a high density SNP genotyping assay for cattle. PLoS
One 4:e5350.
Nkrumah, J. D., E. K. Okine, G. W. Mathison, K. Schmid, C. Li, J. A. Basarab, M. A. Price, Z.
Wang, and S. S. Moore. 2006. Relationships of feedlot feed efficiency, performance, and
feeding behavior with metabolic rate, methane production, and energy partitioning in beef
cattle. J. Anim. Sci. 84:145-153.

106
Reynolds, C. K., H. F. Tyrrell, and P. J. Reynolds. 1991. Effects of dietary forage-to-
concentrate ratio and intake on energy metabolism in growing beef heifers: Whole body
energy and nitrogen balance and visceral heat production. J. Nutr. 121: 994-1003.
Snelling, W. M., M. F. Allan, J. W. Keele, L. A. Kuehn, R. M. Thallman, G. L. Bennett, C. L.
Ferrell, T. G. Jenkins, H. C. Freetly, M. K. Nielsen, and K. M. Rolfe. 2011. Partial-genome
evaluation of postweaning feed intake and efficiency of crossbred beef cattle. J. Anim. Sci.
89:1731-1741.
Wells, J., S. D. Shackelford, E. D. Berry, N. Kalchayanand, J. M. Bosilevac, and T. L. Wheeler.
2011. Impact of reducing the level of wet distillers grains fed to cattle prior to harvest on
prevalence and levels of Escherichia coli O157:H7 in feces and on hides. J. Food Protect.
74(10):1611-1617.
Wheeler, T. L., L. V. Cundiff, R. M. Koch, and J. D. Crouse. 1996. Characterization of
biological types of cattle (Cycle IV): carcass traits and longissimus palatability. J. Anim.
Sci. 74:1023-1035.
Wheeler, T. L., L. V. Cundiff, R. M. Koch, M. E. Dikeman, and J. D. Crouse. 1997.
Characterization of different biological types of steers (cycle IV): wholesale, subprimal, and
retail product yields. J. Anim. Sci. 75:2389-2403.
Wheeler, T. L., L. V. Cundiff, S. D. Shackelford, and M. Koohmaraie. 2001. Characterization
of biological types of cattle (Cycle V): carcass traits and longissimus palatability. J. Anim.
Sci. 79:1209-1222.
Wheeler, T. L, L. V. Cundiff, S. D. Shackelford, and M. Koohmaraie. 2004. Characterization of
biological types of cattle (Cycle VI): carcass, yield, and longissimus palatability traits. J.
Anim. Sci. 82:1177-1189.
Wheeler, T. L., L. V. Cundiff, S. D. Shackelford, and M. Koohmaraie. 2005. Characterization
of biological types of cattle (Cycle VII): Carcass, yield, and longissimus palatability traits.
J. Anim. Sci. 83:196-207.
Wheeler, T.L., L. V. Cundiff, S. D. Shackelford, and M. Koohmaraie. 2010. Characterization of
biological types of cattle (Cycle VIII): carcass, yield, and longissimus palatability traits. J.
Anim. Sci. 88:3070-3083.
Zhou, M., E. Hernandez-Sanabria, and L. L. Guan. 2010. Characterization of variation in rumen
methanogenic communities under different dietary and host feed efficiency conditions, as
determined by PCR-denaturing gradient gel electrophoresis analysis. Appl. Environ.
Microbiol. 76:3776-3786.

107
Figure 1. Relationship of inclusion of alfalfa hay and ADG and G:F in a dry-rolled corn-based
finishing diet with 25% wet distillers grains and solubles.

108
Research Update: Kansas State University Chris Reinhardt and Dan Thomson
The Beef Cattle Institute at Kansas State University
Kansas State University, Manhattan, KS
A novel systematic approach to evaluate cattle health and well-being in commercial
feedlots. D.J. Rezac1, D.U. Thomson
1, F.L. Prouty
2, J.B. Osterstock
2, C.D. Reinhardt
1.
1Kansas
State University; 2Pfizer Animal Health. To evaluate the prevalence and performance affiliation
of tissue anomalies, individual carcass and lesion data were collected on 19,229 feeder cattle
from 6 commercial feedlots in Kansas and Texas at 2 commercial packing plants in Kansas and
Texas from July 2011 through July 2012. Individual pre-harvest health data was also collected
on 13,226 head. Data collection methods utilized automated data capture and carcass tracking
systems already in place within commercial packing plants. Data captured included HCW, DP%,
REA, 12th rib fat thickness, marbling score, quality grade, and yield grade. Individual pre-
harvest records included initial weight, sex, days on feed, ADG, and health treatment history.
Lesion scoring data included lung lesions (Normal, mild, or severe), liver lesions (0, A-, A0, or
A+), and rumen lesions (Normal, mild, or severe). Associations between lesions and outcomes of
interest were modeled utilizing Mixed Models (PROC GLIMMIX of SAS, Cary, NC) for each
outcome. Comparison of univariate models were used to monitor for confounding among
covariates. Covariates of interest where forced into the multivariable model in a stepwise
fashion and Bayesian Information Criteria monitored to achieve the best model fit. G-Side
random effects included feedyard, feedyard Lot, and Kill Lot; covariates included lesions, initial
weight, days on feed, hot carcass weight, sex, metaphylaxsis, BRD treatment, sort group, and
initial month placed on feed. Thirty-two percent of lungs had lesions, 9.8% were severe; 20.6%
of livers had abscesses, 4.6% were severe; 32% of rumens had lesions, 14% were severe. All
comparisons were made vs. normal. Severe rumen lesions were associated (P<0.05) with -4.7 lb
HCW; mild lesions were associated (P<0.05) with +1.3 lb HCW. Mild and moderate liver
abscesses were not associated (P>0.05) with changes in HCW, but severe abscesses were
associated (P<0.05) with -20.0 lb HCW. Severe lung lesions were associated (P<0.05) with -
13.6 HCW but mild lesions were associated (P<0.05) with +1.3 lb HCW.
Implementation of an industry-oriented animal welfare and quality assurance assessment
tool in commercial feedlots. Tera J. Rooney, Daniel U. Thomson, Dan Frese, Shane B. Terrell,
D.J. Rezac, Abby C. Jones, and Chris D. Reinhardt, Kansas State University. Consumer interest
in production agriculture has prompted the beef industry to develop tools to increase the
accountability and transparency of management practices within the industry. The purpose of
this project was to demonstrate the implementation of an industry-oriented animal welfare
assessment, while recording data to shed light on current practices within the commercial cattle
feeding industry. The NCBA BQA Animal Welfare Self-Assessment Guide was used to
objectively evaluate animal handling, antibiotic residue avoidance, cattle comfort, and food
safety in 56 commercial feedyards throughout Kansas. The average one-time feeding capacity
was 35,455 animals (3,000 to 135,000 animals), representing a total one-time capacity of
1,985,500 animals, or roughly 85% of the one-time cattle feeding capacity of all feedyards in
Kansas. The following areas were evaluated and assessed: documentation of 18 best
management practices, animal housing, care, and processing facilities, and cattle handling
practices. Ten randomly selected pens within each feedyard were inspected for cattle comfort,

109
water tank cleanliness, and feed quality. To evaluate animal handling, processing procedures
were observed on a minimum of 100 animals within each feedyard for usage of driving aides,
incidences of cattle falling, tripping, vocalizing, or jumping, and accuracy of restraint. All
feedyards passed the facilities and cattle comfort portion of the assessment; 98% of pens had
acceptable stocking density, mud scores, and feed bunk evaluation, and 83% of all pens had
acceptable water tanks with 17% of pens considered unacceptable due to presence of algae or
debris accumulation. All feedyards were considered acceptable with respect to cattle handling
procedures; a driving aide was required for 3.98% of all cattle observed (benchmark = 10%),
0.2% of cattle fell while exiting the chute (benchmark = 5%); 1.8% of cattle tripped while exiting
the chute (benchmark = 10%); 0.9% of cattle vocalized while in the chute before a procedure
was performed (benchmark = 5%); 5.9% of cattle jumped when exiting the chute (benchmark =
25%); and 0.2% of cattle were improperly restrained before processing (benchmark = 0%).
Seventy-eight percent of feedyards passed all areas assessed; however, only 34% of feedyards
maintained complete and current documentation of the 18 best management practices required.
Commercial feedyards in Kansas do an excellent job in maintaining cattle comfort and welfare;
however, documentation of best management practices is an area which requires additional
focus.
Comparison of gamithromycin, tilmicosin, and tulathromysin for control of bovine
respiratory disease in feedlot and pasture cattle. T. Miller1, D.U. Thomson
1, M. Hubbert
2,
and C.D. Reinhardt1.
1Kansas State University;
2New Mexico State University. Bovine
Respiratory Disease (BRD) continues to be one of the largest animal health concerns in the cattle
industry. BRD is a multifaceted group of pathogens, both viral and bacterial, that take advantage
of an immune compromised calf to cause disease. This study compared metaphylactic
treatments for BRD in both the feedlot and pasture setting. In the feedlot study, heifers (n=579,
403.7 ± 27.4 lbs) from Southwest Texas were identified as being at high risk for BRD and
shipped to the Clayton Livestock Research Center in Clayton, NM. Cattle were randomly
allocated within truck load lots into 20-head treatment pens (n = 30 pens; 3 treatments; 10 pens
per treatment). Cattle were given 1 of 3 metaphylactic treatments based on the randomly
assigned treatment for their pen within a replicate: 1) Gamithromycin (6.0 mg/kg), 2) Tilmicosin
(13.3 mg/kg), and 3) Tulathromycin (2.5 mg/kg). Cattle were fed a starter diet for the first 56-60
d with a step-up ration change at day 28. At the end of the 60-d feeding period, cattle were
weighed. Cattle administered tulathromycin had higher ADG than cattle administered
gamithromycin (P<0.05) and tended (P=0.09) have higher ADG than cattle that received
tilmicosin. Tulathromycin-treated cattle tended (P = 0.12) to have improved F:G compared to
gamithromycin-treated cattle. Cattle that received tulathromycin (5.2%) had lower morbidity
rates (P < 0.05) than those which received tilmicosin (14.6%) or gamithromycin (12.79%).
There were no treatment differences in dry matter intake or mortality. For the wheat pasture
study, heifers (n=120, 393.2 ± 28.6 lbs) from the same origin and risk as the feedlot study were
processed and trailed to a nearby wheat pasture. Cattle were randomly assigned the same
treatments as the feedlot study (3 treatments, 40 animals per treatment). Cattle were allowed to
graze on wheat for 54 days with free-choice mineral mixed with lasalocid. The cattle were
trailed back to the CLRC facilities and final individual weights were recorded. No differences
were identified for ADG (P=0.98), morbidity (P=0.46) or mortality (P=0.36) among the three
treatment groups.

110
Comparison of gamithromycin and tulathromycin for control and treatment of BRD in
high-risk calves in commercial feedlots. S. Torres1, D.U. Thomson
1, B. Nosky
2, and C.D.
Reinhardt1.
1 Kansas State University;
2 Merial, Ltd. To compare the efficacy of gamithromycin
with that of tulathromycin for control of undifferentiated bovine respiratory disease complex
(BRDC) in feedlot calves, 2,529 weaned crossbred beef calves at 2 commercial feedlots at risk of
developing BRDC were administered a single dose of either gamithromycin (6.0 mg/kg, SC; n =
1,263) or tulathromycin (2.5 mg/kg, SC; 1,266) metaphylactically. Health (BRDC morbidity,
mortality, case-fatality, and retreatment rates) and performance (ADG, DMI, and F:G) outcomes
were compared. Bioequivalence limits for gamithromycin and tulathromycin were established
for outcomes for which no significant difference between treatments was detected. Morbidity
rate (31.0%) for calves administered gamithromycin was greater than that (22.9%; P = 0.03) for
calves administered tulathromycin, otherwise health and performance did not differ between
treatments. To evaluate the clinical efficacy of the same drugs for the treatment of BRDC in
feedlot calves under field conditions, 1,049 calves in six feedlots diagnosed with BRDC were
randomly assigned to the same 2 treatments as the control study. Fatality rate, re-treatment rate,
average daily gain (ADG), and body weight during 120 days post-enrollment were evaluated; in
addition, two sites evaluated clinical scores during 10 days after treatment to determine
comparative recovery rates. Re-treatment rate was higher among animals treated with
gamithromycin (17.7± 7%) compared with those treated with tulathromycin (9.0±4%).
Treatments were bioequivalent (P < 0.05) for case fatality rate, and performance (final BW and
ADG). Clinical scores during 10 days post-treatment were not significantly different (P = 0.97)
between treatments. When used for either control or treatment of BRDC, gamithromycin had
greater percent pulled for subsequent treatment, but gamithromycin and tulathromycin had
similar case fatality rate, mortality, ADG, and final BW. Based on the limits established for this
dataset, gamithromycin is considered bioequivalent to tulathromycin.
A survey to describe current feeder calf health and well-being program recommendations
made by feedlot veterinary consultants in the United States and Canada. S.P. Terrell, D.U.
Thomson, and C.D. Reinhardt, Kansas State University. Consulting veterinarians (CV; n=23)
representing 11,295,000 head of cattle on feed in the United States and Canada participated in a
beef cattle health and well-being recommendation survey. Veterinarians were directed to an
online survey to answer feeder cattle husbandry, health and preventative medicine
recommendation questions. The CV visited their feedyards 1.7 times per month. All CV train
employees on cattle handling and pen riding; only 13% of CV speak Spanish. All CV
recommend IBR and BVD vaccination for high-risk (HR) calves at processing; other vaccines
were not recommended as frequently by CV. Autogenous bacterins were recommended by
39.1% CV for HR cattle. Metaphylaxis and feed-grade antibiotics were recommended by 95%
and 52% of CV, respectively, for HR calves. Banding was recommended with increasing
frequency vs. surgical castration for calves with increasing calf body weight. The CV
recommended starting HR calves in smaller pens (103 hd/pen) and allowing 13 inches/hd of
bunk space. The CV indicated feedlots need to employ one feedlot doctor per 7,083 hd of HR
calves and one pen rider per 2,739 hd of HR calves. Ancillary therapy for treating respiratory
disease was recommended by 47.8% of CV. Vitamin C was recommended (30.4%) twice as
often as any other ancillary therapy. Cattle health risk on arrival, weather patterns and labor
availability were the most important factors in predicting feedlot morbidity while metaphylactic
antibiotic, therapy antibiotic and brand of vaccine were the least important.

111
Effects of delayed implanting on feeder cattle health, performance, and carcass quality.
R.D. Munson, D.U. Thomson, D.J. Rezac, and C.D. Reinhardt, Kansas State University. High-
risk feeder calves (n=1,601; 603± 10.5 lb.) were used to examine the effects of delayed
administration of the initial steroid implant on health, performance, and carcass characteristics of
feedlot cattle. Control steers received a steroid implant (Revalor-XS, 20 mg estradiol and 200 mg
trenbolone acetate) as part of normal processing procedures following arrival at the feedyard, and
the Delayed Implant group received the same implant at 45 DOF. Delaying the initial implant
reduced the percentage of railers (1.8 vs. 3.3%; P = 0.02) and tended to decrease percentage
morbidity (24.7 vs. 28.5%; P=0.13), carcass weight (842 vs. 853 lb; P=0.20), and average yield
grade (2.10 vs. 2.24; P=0.16). There was little health advantage to delaying the initial implant,
and delaying the implant 45 days, even in high risk cattle, could be detrimental to performance
and economics.
Comparison of the effects of three different dehorning techniques on behavior and wound
healing in feeder cattle in a Western Kansas feedlot. C.D. Neely1, D.U. Thomson
1, C.A. Kerr
2,
and C.D. Reinhardt1, 1Kansas State University;
2Dodge City Veterinary Clinic, Dodge City, KS.
Cross-bred horned steers and heifers (n = 40; 686 ± 10.3 lb) were used to determine the effect of
dehorning methods on pain, cattle behavior, and wound healing. Cattle were blocked by weight
and sex and randomly assigned to 1 of 4 treatments: 1) control (CON); 2) banded using high
tension elastic rubber (BAND); 3) mechanically removed (MECH); or 4) tipped (TIP).
Vocalization and behavior were recorded during the dehorning process. Scores for wound
healing, attitude, gait and posture, appetite, and lying were recorded daily. Data were analyzed
using the Wilcoxon Rank Sum and mixed model procedures (SAS, Cary, NC). Vocalization
scores were highest for MECH cattle and BAND cattle vocalized more than TIP and CON (P <
0.05). Attitude, appetite, gait and posture, and lying scores (P < 0.10) were higher for BAND
cattle across all days following processing compared to MECH, TIP and CON. Wound healing
scores (horn bud and bleeding) were greater for BAND cattle than MECH, TIP and CON cattle
(P < 0.05) 21 days after processing. These data indicate that MECH is a painful procedure for
cattle at the time of the procedure, but also that banding adversely affects behavior for an
extended period after processing; banding to remove horns from cattle is not recommended
based on the data and observations from this study.
Effects of diet energy density on performance and morbidity of newly received beef heifers. C.J. Redding
1, D. U. Thomson
1, J. S. Schutz
2, S.J. Bartle
1, C. D. Reinhardt
1, and M. E. Hubbert
2.
1 Kansas State University;
2New Mexico State University. Lightweight heifers (n=120; 447±
26.0 lb) were randomly assigned to 1 of 2 treatments and were fed for 56 days. Treatments
consisted of either a (1) low starch diet (15% steam flaked corn, SFC) or a (2) moderate starch
diet (30% SFC). A 74:26 blend of wet corn gluten feed and dried distillers was included at either
65% or 50% of the low and moderate starch diets, respectively. There were no differences in 56-
day body weight, ADG, dry matter intake or feed efficiency across treatments (P ≥ 0.35). The
moderate starch group tended (P = 0.09) to have higher dry matter intake in the first 28-day
period, but this did not persist through the end of the trial. Additionally, there were no
differences observed between treatments for percentage of calves never pulled, pulled once, and
pulled twice or more (P ≥ 0.74). These data suggest that newly received feedlot calves respond
similarly to either 15% or 30% SFC diets and increasing the level of SFC to 30% neither
compromised nor enhanced the productivity of these calves.

112
Perception of lameness management, education, and animal welfare implications in the
feedlot from consulting nutritionists, veterinarians, and feedlot managers. S. P. Terrell1, D.
U. Thomson1, C. D. Reinhardt
1, M. D. Apley
1, K. Stackhouse-Lawson
2.
1Kansas State University;
2National Cattlemen's Beef Association. The purpose of this survey was to describe perceptions
of lameness within the feedlot industry. Consulting nutritionists (CN; n=37), consulting
veterinarians (CV; n=47) and feedlot managers (YM; n=63) from the US and Canada
participated in the survey. The majority of the participants (98.4%) either manage or consult
open air/dirt floor feedyard facilities. Participants were directed to an online survey to answer
questions pertaining to management, incidence, perception, and economic impact of lameness.
The median response for an estimate of lameness incidence in the feedyard was 2%, with a mode
of 1%. Forty-one percent of participants believed that ≥ 50% of feedyard cattle suffering from
lameness require treatment. Eighty-one percent estimated the contribution of lameness to total
feedyard mortality to be less than 10%. In comparison, 46% of participants estimated the
contribution of lameness to the overall chronic/realizer loss in the feedyard to be ≥ 10%. Footrot
was measured as the most common cause of lameness by 42% of participants; compared to 35%
who considered injury the most common cause. Lameness was considered a welfare concern by
58% of participants, a growing concern by 20% of participants, and not a welfare concern by
22% of participants.
Restricted nutrient intake does not alter serum-mediated measures of implant response in
cell culture. C.D. Reinhardt, T.L. Lee, D.U. Thomson, L.K. Mamedova, and B.J. Bradford.
Kansas State University. Sixteen crossbred steers (293 ± 19.3 kg) were used to evaluate the
impact anabolic implants may have on animals in either an adequate or a restricted nutritional
state. Steers were trained to individual Calan gates, and then randomly assigned to 1 of 4
treatments in a 2 × 2 factorial arrangement. Treatments consisted of the following:
administration or absence of an anabolic growth implant (Revalor-XS, 200 mg TBA and 40 mg
estradiol; IMPLANT or CONTROL) and either 2.0 × or 1.0 × maintenance energy (NEM)
requirements of a moderate energy, pelleted, starting cattle diet (HIGH or LOW). Animals were
weighed on d 0, 14, and 28 of the trial, and total gain, ADG, and feed efficiency were determined
for each time point. Blood samples were drawn for each animal at d 0, 14, and 28 of the trial and
used to determine serum IGF-1 and plasma urea nitrogen (PUN). Serum (d 0, 14, and 28) was
also used for application to satellite cells (previously isolated from a non-study steer and frozen).
After treatment with the serum (20% of total media) from the trial cattle, the satellite cells were
incubated for 72 hours. Protein abundance of myosin heavy chain (MHC; d 0, 14, and 28),
phosphorylated extracellular signal-related kinase (pERK; d 0 and 28), and phosphorylated
mammalian target of rapamycin (pmTOR; d 0 and 28) were analyzed to determine the effects of
implant, intake, and their interaction (applied via the serum). There was a diet × intake
interaction for DMI (P < 0.01) and a tendancy (P ≤ 0.10) for an interaction for d 14 ADG and d
14 G:F; however, there were no interactions (P ≥ 0.38) for ADG or G:F through d 28. Cattle on
the HIGH intake level had greater (P = 0.05) IGF-1 concentrations across days and had greater
(P = 0.04) PUN concentrations on d 28, but implant status did not affect either PUN or IGF-1 (P
≥ 0.55). Intake had no effect on MHC (P = 0.82) but IMPLANT increased (P < 0.01) MHC
abundance vs. CONTROL across days. Implant status, intake status, and the interaction had no
effect on the abundance of pERK (P ≥ 0.41). Implanting increased pmTOR (P < 0.01) but there
was no effect (P ≥ 0.44) of intake or intake × implant. The nearly complete lack of interaction

113
between implant and nutritional status indicates that the signaling molecules measured herein
respond to implants and nutritional status independently.
Agreement between observational and necropsy-derived diagnosis for cause of death for
cattle in a commercial beef feedlot. D. Anspaugh1, D.U. Thomson
1, B. Wileman
1, M. Apley
1, W.
Taylor2, T. Noffsinger
2, and C.D. Reinhardt
1.
1 Kansas State University;
2 Production Animal
Consulting, Oakley, KS. This study was conducted during the months of June and July 2009 in a
feedlot in Western Kansas. Mortalities (n=54) were brought to a designated necropsy area and
data pertaining to location (home pen, hospital pen, chronic pen) was recorded. Feedlot health
personnel were asked to record the cause of death based only on prior medical history and
location where the animal was found. Study investigators, blinded to the pre-necropsy
diagnoses, then conducted a thorough necropsy to determine the cause of death. The pre-
necropsy and post-necropsy cause of death data were categorized into 7 categories for data
analysis: 1) BRD, 2) AIP, 3) tracheal edema, 4) bloat, 5) traumatic injury/buller, 6) peritonitis,
and 7) dystocia. A kappa test was performed to estimate the agreement between pre-necropsy
and post-necropsy determined cause of death. The overall kappa value of agreement between
pre-necropsy and post-necropsy determined cause of death was 0.6039 indicating a moderate
level of agreement. However, there was 100% agreement between pre- and post- necropsy cause
of death for BRD cases; therefore, a necropsy is not warranted on mortalities previously
diagnosed and treated for BRD, especially those found in the hospital or chronic pens. Bloat also
had an equal pre- and post-necropsy determined cause of death. All 5 of these animals were
found in their home pens and did not have a medical history. This indicates that necropsy of
bloat mortalities are not warranted. AIP was under-reported in pre-necropsy determined cause of
death (n=12) compared to post-necropsy determined cause of death (n=15), suggesting that
animals found in their home pen without symptoms of bloat or history of BRD treatment should
receive a necropsy. The poor agreement between pre- and post-necropsy diagnosis for injured
animals supporting the concept that for mortalities with a history of severe physical trauma
necropsy is not only unwarranted but may also provide misleading evidence contrary to the
obvious, primary lesion. Most feedyard mortalities can be accurately diagnosed without the
time, expense, and risk of performing necropsy; however, some questionable mortalities should
still be investigated.
Time of onset, location, and duration of lameness in beef cattle in a commercial feedyard.
T.M. Green1, D.U. Thomson
1, B.W. Wileman
1,
P.T. Guichon
2, and C.D. Reinhardt
1;
1 Kansas
State University; 2
Guichon Veterinary Services Inc., Okotoks, AB. A total of 3,243 feedlot steers
in a commercial feedlot were observed for lameness prior to processing, immediately following
processing, and 1, 2, and 3 weeks post-processing. Calves were observed once weekly while in
their respective home pens. Animals were recorded as lame based on the presence of an altered
gait. During this study, approximately 90,000 steers were on feed across the entire feedyard.
Performance data and medical history were collected through the pre-harvest sort date
(approximately 100 DOF). Cattle history factors (age, health risk, region of origin, state of
origin, month placed on feed) were included in the analysis as possible contributors to lameness.
The proportion of cattle observed lame pre-processing was 1.6% and was less (P=0.02) than the
proportion of cattle observed lame after processing (2.5%). Cattle that were lame during weeks
0 and 1 had numerically (P>0.15) lower ADG than sound cattle (3.25 vs. 3.60 lb/d), and cattle
observed lame at any time tended (P=0.11) to have lower ADG than cattle that were not lame

114
(3.41 vs. 3.60 lb/d). Age, risk, region of origin, state of origin, month placed on feed were not
significant in predicting prevalence of lameness (P>0.05). Of the 3,243 head observed, 0.15%
had foot rot, 1.94% were bullers, 1.39% had musculoskeletal injuries, and 0.22% had arthritis.
The majority of lameness appears to be associated with handling events; further study is needed
to determine if these cases may be reduced by improving facilities or handling technique.
Figure 1. Effects of lung, liver, or rumen lesions on live animal feedlot ADG vs. “normal”
animals (no lesions observed). Asterisk (*) indicates a significant (P < 0.05) difference (vs.
“normal”) within a lesion type. n = 19,229 feeder cattle from 6 commercial feedlots in Kansas
and Texas at 2 commercial packing plants in Kansas and Texas slaughtered between July, 2011
– July, 2012.
-0.06
0.02
-0.18
-0.03
0.00
-0.13
0.02
-0.20 -0.15 -0.10 -0.05 0.00 0.05
Severe
Mild
A+
Ao
A-
Severe
Mild
Ru
men
Live
rLu
ng
Live feedlot ADG, lb (vs. "normal", no lesion observed)
*
*
*

115
Table 1. Performance and health data for calves given gamithromycin, tilmicosin, or
tulathromycin for control of bovine respiratory disease either in starting pens or on wheat
pasture.
Treatment Gamithromycin Tilmicosin Tulathromycin P-value
Feeding pen study:
n, Pens 10 10 10
n, Head 190 190 190
Initial wt, lb 405.1 402.7 403.5 0.73
Final wt, lb 540.1b 544.3
ab 553.0
a 0.10
DMI, lb 11.99 12.28 12.52 0.20
ADG, lb (deads out) 2.36b 2.48
ab 2.62
a 0.02
F:G (deads out) 5.10 5.01 4.82 0.27
Mortality, % 1.53 1.55 1.02 0.93
Morbidity, % 12.79b
14.62b
5.16a
0.02
Retreatment, % 1.50 2.56 0.00 0.16
Wheat pasture study:
Initial wt, lb 392.7 390.6 395.9 0.72
Finalwt, lb 449.7 447.9 452.9 0.90
ADG, lb 1.06 1.08 1.07 0.98
Morbidity, % 12.50% 12.50% 5.13% 0.46
Mortality, % 12.50% 5.00% 5.13% 0.35
Table 2. Effect of gamithromycin vs. tulathromycin for control and for treatment of bovine
respiratory disease on performance and health parameters of high-risk feedlot calves in
commercial feedlots. Bioequivalence limit indicates the minimum required difference between
compounds to conclude a difference for each variable.
Variable Gamithromycin Tulathromycin SEM Bioequiva-lence
limits
Control study:
Final body weight (lb) 1,165 1,166 13.9 ± 20.9
ADG (lb/d) 2.64 2.64 0.022 ± 0.22
Feed-to-gain 6.60 6.50 0.594 ± 1.32
Retreatment rate (%) 41.5 39.5 4.20 ± 10.0
Mortality rate (%) 4.2 3.5 1.7 ± 3.5
Treatment study:
Final BW (lb) 990 1,003 15.4 ± 28.6
ADG, (lb/day) 3.34 3.45 0.132 ± 0.22
Case fatality rate (%) 3.7 2.4 4.2 ± 2.4
P-value
Initial body weight (lb) 517 519 3.52 0.41
Init. rectal temp. (°F) 104.4 104.4 0.18 0.79
Days on feed at enrollment 3.6 3.7 0.7 0.52
Re-treatment (%) 17.7 9.0 6.7 < 0.01

116
Table 3. Ranking of seven factors utilized by consulting feedlot veterinarians to predict
morbidity and mortality in feeder cattle in commercial feedyards (These items are listed in order
of importance by mean and mode with 1 (most predictive) to 7 (least predictive)).
Item Mean Mode
Cattle health risk 1.32 1
Weather patterns 3.18 2
Amount and quality of labor 3.41 4
Receiving nutrition program 3.86 3
Class of antibiotic used for metaphylaxis 4.36 5
Class of Antibiotic used of treatment 5.64 6
Brand of Vaccine 6.23 7

117
Figure 2. Myosin heavy chain abundance in cultured myocytes. Myocytes from a non-study
steer were treated with serum (20% of total media) from study steers drawn on d 0, 14, and 28,
and myosin heavy chain abundance was measured. In chart A, steers were either implanted
(gray bars) or not implanted (open bars) with a long-acting TBA:E2 implant; in chart B, steers
were fed a common diet at either 2.0 (HIGH; gray bars) or 1.0 (LOW; open bars) × maintenance
NE requirements. (Effect of day P < 0.01; intake P = 0.82; implant P < 0.01; intake × implant P
= 0.41; day × intake P = 0.75; day × implant P = 0.99; day × intake × implant P = 0.52; Error
bars represent pooled SEM for treatment means = 0.086.)
0.0
0.5
1.0
1.5
2.0
2.5
d 14 d 28
Arb
itra
ry D
en
sity U
nits
(re
lative
to
1st b
ar)
CONTROL
IMPLANT
0.0
0.2
0.4
0.6
0.8
1.0
1.2
1.4
1.6
1.8
d 14 d 28
Arb
itra
ry D
en
sity U
nits
(re
lative
to
1st b
ar)
LOW
HIGH
A
B

118
Figure 3. Agreement between identification of cause of death between personnel with only
treatment records and location of mortality vs. personnel with only necropsy diagnosis by
category. n = 54 mortalities within a single commercial feedyard in Kansas.
Table 4. Feedlot performance, health data, and carcass traits for steers at high relative risk for
BRD that were implanted either immediately upon feedlot arrival (Arrival) or 45 days post-
arrival (Delayed). n = 1,601 cattle fed in a commercial feedyard in Kansas.
Arrival Delayed SEM P-Value
Pens, n 10 10
Animals, n 801 800
Initial BW, lb 604 603 10.5 0.97
Final BW, lb 1,303 1,296 12.2 0.56
ADG, lb 3.17 3.09 0.59 0.56
DMI, lb 19.45 19.24 0.24 0.40
F:G 6.21 6.30 0.309 0.77
HCW, lb 853 842 8.0 0.20
Choice, % 42.8 44.1 3.00 0.67
Avg. Yield grade 2.24 2.10 0.098 0.16
Morbidity, % 28.5 24.7 2.35 0.13
Retreatment, % 9.4 8.2 1.18 0.31
Respiratory mortality, % 3.3 4.5 1.49 0.43
Pleural adhesions, % 20.1 21.3 2.45 0.63
Lung lesions, % 55.5 58.1 2.94 0.41
0
10
20
30
40
50
60
70
80
90
100
BRD AIP Bloat Injury
Mo
rtal
itie
s, %
Cause of Death
Pre-necropsy
Post-necropsy

119
Figure 3. Effect of dehorning method (negative control (CON), high-tension banding (BAND),
mechanical (MECH), tipping to 1” diameter (TIP)) on average depression score for the entire
duration of the trial by treatment. Main effect of treatment, P = 0.06; a,b means without a
common superscript differ (P < 0.10).
Figure 4. Number of animals observed to be lame, as a percentage of animals observed lame
immediately post-processing, by number of weeks post-arrival. n = 3,243 total animals
processed and n = 48 lame animals observed immediately post-processing during the summer of
2009 at a commercial feedlot in Nebraska.
0.00
0.20
0.40
0.60
0.80
1.00
1.20
1.40
CON BAND MECH TIP
Ave
rage
de
pre
ssio
n s
co
re
0
20
40
60
80
100
Week 0 Week 1 Week 2 Week 3
Lam
e a
nim
als
by
wee
k, %
o
f w
eek
0 la
me
an
imal
s
a
b
a a

120

121
Graduate Student Research Presentations
Co-prilling flaxseed and dolomitic hydrate to decrease ruminal biohydrogenation of
polyunsaturated fatty acids C.A. Alvarado1, D.O. Sousa
1, E. van Cleef
1, K.A. Miller
1, C.L. Van
Bibber-Krueger1, F. Scarpino
1, D. Klamfoth
2, and J.S. Drouillard
1,
1Kansas State University,
Manhattan, 2Lhoist North America, Fort Worth, TX
Three experiments were conducted to evaluate ruminal biohydrogenation of flaxseed embedded
in matrices consisting of dolomitic lime hydrate or a blend of hydrate and dolomitic limestone. In
Study 1, ground flaxseed (F) and a 50:50 flaxseed:dolomitic hydrate blend (H) were placed into
Dacron bags (1 g in duplicate), sealed, suspended in the rumens of fistulated cattle for 16 hours,
removed from the rumen, rinsed, and then dried to determine in situ disappearance. Six
ruminally fistuled steers were used, 3 of which were fed a 50:50 forage:concentrate diet, and 3 of
which were fed a 90:10 concentrate:forage diet. In study 2, steers (n=45, 557±40 lb) were
blocked by weight and randomly assigned to individual pens and dietary treatments (15
replicates). Steers were fed for 14 d with a basal diet consisting of 30% corn gluten feed, 25%
wheat straw, 25% prairie hay, 12.8% steam-flaked corn, and 3% linseed meal containing either
no flaxseed (C); 2.79% ground flaxseed (F); or 8.13% of a flaxseed-dolomitic hydrate blend (H)
to provide an amount of alpha-linolenic acid (ALA) equivalent to the F diet. Cattle were fed once
daily ad libitum and DMI was determined each day. For study 2, heifers (n=40, 604±24 lb) were
blocked by weight and allocated randomly to each of 4 diets (10 replicates). The basal diet
consisted of 30% corn silage, 27% wet corn gluten feed, 22% steam-flaked corn, and 15% alfalfa
hay with either no flaxseed (C); 1 lb/d ground flaxseed (F); 1 lb/d of a 50:50 flaxseed:dolomitic
hydrate blend (H); or 1 lb/d of a 50:25:25 flaxseed:dolomitic hydrate:dolomitic carbonate blend
(HC). On d 0 and 14 of each study, blood samples were collected, plasma was recovered by
centrifugation, and concentrations of fatty acid methyl esters were determined by gas
chromatography. In study 1, in situ dry matter disappearance was not affected by basal diet (P >
0.05), but we observed greater resistance (P < 0.05) to ruminal degradation when flaxseed was
encapsulated in a dolomitic hydrate matrix. In studies 2 and 3, plasma fatty acid profiles were
similar among treatments on day 0 of each study. By day 14 of each study, plasma ALA
concentrations remained low in C, but increased by d 14 for cattle fed all sources of flaxseed (P
< 0.01). In study 2, plasma ALA was 2.4-fold greater for H than for F (P < 0.01, SEM: 1.69)
after 14 d (16, 35, and 85 μg/mL for C, F, and H, respectively). In study 3, embedding flaxseed
in dolomitic hydrate-carbonate or dolomitic hydrate matrices resulted in 195 and 339% greater
assimilation of ALA, respectively, compared to ground flaxseed (11, 93, 96, and 153 μg/mL for
C, F, H, and HC, respectively; P < 0.01). These studies indicate that matrices consisting of
dolomitic hydrate or dolomitic hydrate and carbonate are effective barriers to ruminal
biohydrogenation of unsaturated fats.
Components of this abstract were published previously:
C.A. Alvarado, C.C. Aperce, E. van Cleef, K.A. Miller, C.L. Van Bibber-Krueger, F. Scarpino,
D. Klamfoth, and J.S. Drouillard. 2013. Hydrated lime matrix decreases ruminal
biohydrogenation of flaxseed fatty acids, pp 52, In: Cattlemen’s Day Research Report, SRP
1083, Kansas Agricultural Experiment Station, Manhattan, Kansas.

122
The effects of Bovamine® DefendTM
on prevalence and concentration of Escherichia coli
O157:H7, non-O157 O types and Salmonella in finishing steers S. N. Aragon1, F. R. B
Ribeiro1, L. M. Guillen
1, R. A. McDonald
2, D. R. Ware
2, W. M. Kreikemeier
2, R. S. Swingle
3, M.
M Brashears1, G. H. Loneragan
1,and B. J. Johnson
1,
1Texas Tech University, Lubbock,
2Nutrition Physiology Company, LLC, Guymon, OK,
3Cactus Operating, LLC, Amarillo, TX
Two studies were conducted to determine the effects of Bovamine Defend supplementation as a
pre-harvest intervention on performance, carcass characteristics, and prevalence and
concentration of E. coli O157:H7, non-O175 O types, and Salmonella in finishing steers.
Treatments were CON (placebo) and BD (Bovamine Defend). Exp.1: A small pen study where
steers (n=112; initial BW=877 lb) were blocked by BW and allotted randomly to 28 pens (14
pens/treatment; 4 pens/block; 4 steers/pen) at Texas Tech University’s Burnett Center and fed for
117 d. From each steer, rectal fecal samples were collected on d 117 and subiliac lymph node
samples were taken at the plant. Exp. 2: A large pen study where steers (n=1800; initial BW=782
lb) were blocked by source and randomly assigned to 24 pens (12 pens/treatment; 75 steers/pen)
at Cactus Research Feedyard and fed for 142 d. Fecal floor pads (n=600; 25 pads/pen) were
collected on d 140 and subiliac lymph nodes (n=600; 25 samples/pen) were collected at the plant.
For both studies, pen was the experimental unit in a randomized block design. Performance and
carcass traits were analyzed using the MIXED and GLIMMIX procedures of SAS and microbial
data were analyzed using a binomial response model. No significant differences in performance
or carcass traits were observed in either study. In Exp. 2, fecal E. coli O157:H7 and lymph node
Salmonella concentrations were reduced by 87% (P<0.03) and 90% (P<0.03), respectively. Fecal
E. coli O157:H7 prevalence was reduced by 60% in Exp. 1 and 45% in Exp. 2 (P<0.10 and
P=0.015, respectively). Prevalence of Salmonella in lymph nodes was reduced by 88% (P<0.05)
and 25% (P=0.005) in Exp. 1 and Exp. 2, respectively. Prevalence of E. coli O26, O45, O103,
and O121 in Exp. 2 were reduced by 53% (P=0.02), 41% (P=0.02), 35% (P=0.03) and 47%
(P=0.02), respectively. Prevalence of E. coli O111 and O145 was too low in both treatments to
calculate reduction. There were too few positive samples in Exp. 1 were to compare
concentrations of E. coli O157:H7 and Salmonella, and the prevalence of non-O157 O types was
very low. Overall, Bovamine Defend supplementation did not significantly affect performance or
carcass characteristics but effectively reduced fecal E. coli O157:H7 and lymph node Salmonella
concentrations and prevalence, and the prevalence of fecal E. coli non-O157 O types.
*Bovamine Defend and NPC are trademarks of Nutrition Physiology Co., LLC
*Each package of Bovamine Defend contains a minimum of 2x10¹³
CFU of Propionibacterium
freudenreichii and Lactobacillus acidophilus
Effects of restricted versus conventional dietary adaptation over periods of 9 or 14 days on
feedlot of Nellore cattle R. S. Barducci1, M. D. B. Arrigoni
1, C. L. Martins
1, São Paulo State
University (UNESP), Botucatu, São Paulo, Brazil1
One hundred and twenty, 24-mo-old Nellore bulls (361.3±30.2 kg) were fed in 24 pens for 84-d
to determine effects of adaptation protocol and period length on feedlot performance, carcass
traits, rumenitis incidence (RI), hepatic abscesses (HA) and rumen wall absorptive surface area
(RASA) of Nellore cattle. The experiment was conducted at the Sao Paulo State University
feedlot, Botucatu Campus, Brazil, using a completely randomized block design with a 2×2
factorial arrangement, replicated 6 times (5 bulls/pen). Factors include adaptation protocols,
restricted finishing diet intake (REST) as a means of dietary adaptation compared with diets
increasing in concentrate (STEP) over periods of either nine or 14 d. The STEP program

123
consisted of ad libitum feeding of 3 adaptation diets over periods of 9-d or 14-d with concentrate
level increasing from 55% to 85% of diet DM. The REST program consisted of restricted intake
of the finishing diet (85% concentrate) with programmed increases in feed offered until bulls
reached ad libitum access over periods of 9-d or 14-d. After adaptation, one animal per pen was
slaughtered for rumen papillae evaluations, RI and HA. The remaining 96 animals were
harvested at 505 ± 36.4 kg of BW. Days of adaptation did not effect (P>0.05) feedlot
performance, carcass traits, RI and HA. Adaptation protocol did not influence (P>0.05) final
BW, ADG, carcass traits, RI and HA for the 84 d finishing phase. However, adaptation protocol
influenced (P<0.05) 0-28 d DMI (STEP = 9.67 kg, REST = 9.01 kg); 0-28 d DMI, %BW (STEP
= 2.52%, REST = 2.36%), and 0-56 d (STEP = 2.58%, REST = 2.47%); 0-84 d G:F ratio (STEP
= 0.157, REST = 0.165); and 0-84 d cost to gain 1 kg of BW (STEP = US$1.91, REST =
US$1.81). No interaction (P>0.05) between adaptation protocol and period length was observed
for performance or carcass traits. REST had larger (P<0.05) mean papillae area (0.59 cm2 vs.
0.52 cm2) than STEP. Number of papillae per cm2 of rumen wall (NOP) interactions was
observed (P<0.05) between adaptation period length and feeding phase. Rumen wall absorptive
surface area (RASA) in cm2 interactions were observed (P<0.05) between adaptation period
length and feeding phase and adaptation protocols and feeding phase. No differences (P > 0.05)
in RASA and NOP were observed during the finishing phase; however, NOP was reduced (P <
0.05) for 9-d during the adaptation phase and RASA was reduced (P < 0.05) for STEP and 9-d
during the adaptation phase. REST were more feed efficient and exhibited lower cost of gain
than STEP, while a 9-d adaptation period did not negatively impact feedlot performance.
Effect of level and source of supplemental protein on rate of ruminal ammonia production
and concentrations of amino acid-utilizing and trypticase-metabolizing bacteria in Bos
taurus and Bos indicus steers fed low-quality forage N. L. Bell1, R. C. Anderson
2, S. L.
Murray1, J. C. McCann
1, K. K. Weldon
1, and T. A. Wickersham
1 ,
1Texas A&M University,
College Station, 2USDA/ARS, College Station
Five ruminally cannulated Bos taurus (Bt, 303 ± 10 kg initial BW) and five ruminally cannulated
Bos indicus (Bi, 323 ± 28 kg initial BW) steers were used to quantify differences in source and
level of protein on rate of ammonia production and concentrations of amino acid-utilizing and
trypticase-metabolizing bacteria in Bt and Bi cattle. Bos taurus and Bi steers were assigned to
concurrent 5 × 5 Latin squares and fed low-quality forage (4.5% CP). Treatments were a 2 × 2
factorial plus a control: the first factor was level of protein 60 or 120 mg N/kg BW daily; and the
second was source DIP (degradable intake protein; 72% DIP) or UIP (undegradable intake
protein; 72% UIP). Rumen fluid was collected immediately after feeding and 4h later then
processed according to standard laboratory protocols. There were no significant differences
between breeds for any of the measured variables (P ≥ 0.21). There was a main effect of protein
supplementation on in vitro NH3–producing activity for both Bt (P = 0.04) and Bi (P = 0.03)
steers. In both cases, rates of NH3 production were higher in steers fed 120 mg N/kg BW DIP
(0.053 ± 0.02 and 0.048 ± 0.02 μmol NH3/mL per h, respectively) and lower in steers receiving
0 mg N/kg BW (0.031 ± 0.01 and 0.033 ± 0.01 μmol NH3/mL per h, respectively). For Bt steers
there was a treatment × time interaction (P = 0.04) for most probable number (MPN) of amino
acid-utilizing bacteria resulting from decreases in MPN from h 0 to 4 when DIP was supplied at
both levels and increases for control and 60 mg N/kg BW UIP. More specifically, steers fed 60
or 120 mg N/kg BW DIP had decreased MPN with time after feeding (0 to 4 h; from 5.96 to 5.37
and 6.41 to 5.85 log10 cells/mL, respectively) versus steers fed 60 mg N/kg BW UIP which

124
increased MPN from 5.74 to 6.07 log10 cells/mL and 120 mg N/kg BW UIP which decreased
slightly from 6.0 to 5.8 log10 cells/mL. In Bi steers there was no effect of dietary treatment (P =
0.77) or time after feeding (P = 0.85) on MPN. There was a main effect of time after feeding on
recoverable trypticase-metabolizing bacteria for both Bt (P ≤ 0.01) and Bi (P ≤ 0.01) with log10
CFU mL-1 being lower at 4 h after feeding (7.00 ± 0.77 and 7.12 ± 0.64) versus 0 h (7.51 ± 0.88
and 7.53 ± 0.86) for Bt and Bi, respectively. Results indicate that irrespective of breed, microbial
N-metabolizing populations responded more rapidly to diets supplemented with DIP than UIP.
Comparison of NRC and industry dietary trace mineral standards for yearling feedlot
steers C.J. Berrett, J.J. Wagner, K.L. Neuhold, E. Caldera, and T.E. Engle, Colorado State
University, Department of Animal Science, Fort Collins
Effect of trace mineral (TM) concentration and source on yearling feedlot steer performance,
carcass characteristics, and liver TM status, were determined utilizing 360 crossbred steers
(initial BW=350 ± 4.0 kg). Steers were blocked by initial BW and randomly assigned to one of 4
treatments (10pens/treatment; 9 hd/pen). Treatments consisted of: 1) negative control (NC), no
supplemental TM (basal diet contained 7.65 mg Cu/kg DM, 50.5 mg Zn/kg DM, 27.7 mg Mn/kg
DM, and 0.12 mg Co/kg DM); 2) basal diet supplemented with 10 mg Cu/kg DM from CuSO4,
30 mg Zn/kg DM from ZnSO4, 20 mg Mn/kg DM from MnSO4, 0.50 mg I/kg DM from EDDI,
0.10 mg Se/kg DM from Na2O3Se, and 0.10 mg Co/kg DM from CoCO3 (NRC); 3) basal diet
supplemented with inorganic forms of Cu, Zn, Mn, EDDI, Se and Co at consulting nutritionist
recommendations (CNI, 20, 100, 50, 0.50, 0.20, and 0.20 mg of mineral/kg DM, respectively);
and 4) basal diet supplemented with 66.6% inorganic and 33.4% organic Cu, Zn, Mn and Co,
and inorganic forms of I and Se at iso-concentration to consulting nutritionist recommendations
of treatment 3 (CNO). All steers were fed a high concentrate steam-flaked corn-based diet for
154 d. Steers were individually weighed on d -1, 0, 35, 121, 153, and 154. Continuous data
were analyzed on a pen mean basis using a mixed model appropriate for a randomized block
design (fixed effects = treatment and time; random effect = replicate). Categorical data were
analyzed utilizing GLIMMIX (fixed effect = treatment; random effect = replicate). Initial and
final BW, ADG, DMI, F:G and G:F ratios and calculated net energy recoveries were similar (P >
0.23) across treatments. Subcutaneous adipose tissue depth, HCW, KPH, yield grade, marbling
score, and quality grade were similar across treatments (P > 0.17). Final liver Zn, Mn, Se, and
Co concentrations were similar across treatments (P > 0.37). Under the conditions of this
experiment, it appears that basal dietary concentrations of Cu, Zn, Mn, and Co were adequate for
growth and performance of finishing yearling feedlot steers.
Corn Silage: New Thoughts on an Old Ingredient D. B. Burken, B. L. Nuttelman, J. L.
Harding, T. C. Hoegemeyer, T. J. Klopfenstein, and G. E. Erickson, Univ. of Nebraska, Lincoln
The use of corn silage in beef finishing diets has been shown to be economical in times of high
priced corn. Whole corn plant samples were collected from a commercial grain yield research
plot to evaluate corn hybrid (season length), plant density, and harvest time effects on whole
corn plant quality and yield. There were interactions (P ≤ 0.001) between hybrid, plant density,
and harvest time for variables tested; however interactions were ignored due to replication and
for data interpretation clarity. There was a quadratic response to harvest time for DM yield and
TDN yield per acre (P ≤ 0.01), with yield increasing between first two harvest dates and then
decreasing thereafter. There was a quadratic increase for DM yield (P ≤ 0.01) with increased
plant density. There was an increase in DM yield (P ≤ 0.01) for longer season in comparison to

125
shorter season hybrids. Data from this experiment illustrate that corn hybrid, plant density, and
harvest time affect corn silage yield and quality characteristics. A finishing experiment evaluated
substitution of corn with corn silage in diets with modified distillers grains with solubles
(MDGS). Steers (n=324; BW=714 ± 37 lb) were separated into two BW blocks and assigned
randomly to one of 36 pens (9 steers/pen). Dietary treatments fed were 15, 30, 45, or 55% corn
silage in diets with 40% MDGS. Two other treatments were tested with 30% corn silage and
65% MDGS and 45% corn silage and 0% MDGS. All steers were on feed for 173 days.
Performance measures were calculated from HCW adjusted to a common dressing percentage
(63%). As corn silage inclusion increased in diets containing 40% MDGS, DMI and ADG (4.04
and 3.53 lb for steers consuming 15% and 55% corn silage, respectively) linearly decreased (P <
0.05), which equated to a linear decrease in F:G (P < 0.01) with the steers on the 15% corn silage
treatment being 1.5%, 5.0%, and 7.7% more efficient than steers on treatments containing 30%,
45%, and 55% corn silage, respectively. Cattle fed 45% corn silage with 40% MDGS instead of
0% MDGS had increased DMI and ADG (P < 0.05) with no difference in F:G (P = 0.30). For
steers fed 30% dietary corn silage, the addition of 65% MDGS (compared to 40% MDGS)
resulted in decreases in DMI and ADG (P < 0.01) with no difference in F:G (P = 0.12). Dressing
percentage, HCW, 12th rib fat, and calculated YG decreased linearly (P < 0.01) with increasing
corn silage inclusion in diets containing 40% MDGS. Even with modest performance
depressions and the assumption of additional DOF for cattle fed elevated levels of corn silage,
there is an economic incentive to feeding higher levels of corn silage in diets containing MDGS.
Effect of zinc concentration and source on performance and carcass characteristics of
feedlot steers E. Caldera, J. J. Wagner K. L. Neuhold, G. I. Zanton, K. Sellins, and T. E. Engle,
Colorado State University, Department of Animal Sciences, Fort Collins
Three-hundred and sixty cross-bred steers (348.1 kg ± 28.9) were utilized to investigate the
effects of zinc (Zn) concentration on performance and carcass characteristics of feedlot steers.
Steers were blocked by weight and randomly assigned to one of the 5 supplemental Zn
treatments (8 pens per treatment; 9 steers per pen). Treatments consisted of: 1) Control-50
(CON-50; 50 mg of supplemental Zn/kg DM from ZnSO4); 2) Methionine control [MetCON-
50; 50 mg of supplemental Zn/kg DM from ZnSO4 plus MHA to equalize HMTBa
concentrations across treatments; 3) Organic-50 (ORG-50; Control diet supplemented with 50
mg of Zn/kg DM from Mintrex Zn plus MHA to equalize HMTBa intake across treatments); 4)
Organic-100 (ORG-100; Control diet supplemented with 100 mg of Zn/kg DM from
MINTREX Zn plus MHA to equalize HMTBa intake across treatments 2-5); and 5) Organic-
150 (ORG-150; Control diet supplemented with 150 mg of Zn/kg DM from Mintrex Zn). All
steers were fed a typical high concentrate steam-flaked corn based finishing diet twice daily.
Steers were individually weighed on d −1, 0, 144, and 145 and pen weighed on d 28, 56, 84, and
111. Ractopamine HCl was fed for the final 29 d of the finishing period to all treatments. On d
145, all steers were transported to a commercial abattoir for slaughter. Initial and final body
weights, overall ADG, DMI, and feed efficiency (g/f), were similar across treatments. Fat
thickness, internal fat, hot carcass weight, KPH, marbling score, and dressing percentage were
similar across treatments. Steers receiving ORG-150 had a greater (P < 0.03) yield grade
compared to steers receiving ORG-50 (2.99 vs. 2.76 ± 0.08; respectively). Steers receiving 1080
Zn also had greater (P < 0.01) yield grades compared to steers receiving ORG-100 (2.99 vs. 2.68
± 0.08; respectively). There was a trend (P < 0.07) for steers receiving MetCON to have a greater
yield grade compared to CON-50 (2.82 vs. 2.67 ± 0.08; respectively). In addition, liver biopsies

126
and blood samples were analyzed for Zn, Cu, and Fe concentrations. Blood samples were also
analyzed for alkaline phosphatase activity. Initial liver biopsy Cu and Fe concentrations were
similar across treatments. Whereas, the Zn concentrations were greater ( P < 0.01) in the CON-
50 group compared to the Methionine treatment group ( 218.7 vs. 170.2 ± 12.9). Day 111 liver
Zn concentrations tended ( P < 0.05) to be lower for CON-50 and MetCON-50 treatments
compared to ORG-50 treatment, while no other differences were noted among treatments (117.8,
123.7 vs. 158.0 ± 16.1). Initial and final plasma concentrations of Zn, Cu, and Fe and alkaline
phosphatase activity were similar across treatments. These data indicate that under conditions of
this trial, increasing Zn concentration in the diet above NRC recommendations has little impact
on performance, however, may impact lipid partitioning in steers.
Effect of urea inclusion in diets containing dried distillers grains on total tract digestibility
and ruminal fermentation in feedlot cattle I. Ceconi1, M. Ruiz-Moreno
2, A. DiCostanzo
1, and
G. I. Crawford1,
1University of Minnesota, Saint Paul,
2University of Florida, Marianna
A high proportion of CP in distillers grains (DG) is undegradable in de rumen. Therefore,
addition of degradable intake protein (DIP) to feedlot rations containing DG may be beneficial.
An experiment was conducted to evaluate the effect of DIP supplementation in feedlot cattle
finishing diets on total tract digestibility and ruminal fermentation. Four ruminally cannulated
Holstein steers (765 40 lb initial BW) were assigned randomly to a duplicated 2 x 2 Latin
square design. Each period consisted of a 16-d adaptation and a 5-d collection phase. Steers were
fed ad libitum once daily one of two dietary treatments containing (DM basis) 52% dry-rolled
corn, 20% dried corn DG with solubles, 12% high-moisture corn, 10% ryegrass haylage,
mineral-vitamin supplement, and 0% (CON) or 0.6% (U) urea. Energy, CP, and DIP
concentrations were 0.60 or 0.59 Mcal NEg/lb, 14 or 15.6%, and 6.4 or 8.0% for CON or U,
respectively. Steers were intra-ruminally dosed every 12 h with 7.5 g of chromic oxide from d 11
to 21 and fecal grab samples collected from d 17 to 21 to determine OM digestibility. Ruminal
VFA and ammonia-N (NH3-N) concentrations were measured in ruminal fluid samples collected
on d 21 at multiple time points after feeding. Ruminal pH was continuously recorded by probes
residing in the rumen for 5 d. Organic matter intake (21.8 0.2 lb) and ruminal pH (5.86 0.02)
were not affected by treatment (P 0.13). Ruminal VFA and NH3-N concentration, and OM
digestibility were higher for U than CON (119.1 and 89.3 5.9 mM, 8.5 and 3.9 1.1 mg/dL,
and 72.3 and 69.1 2.9% for U and CON, respectively; P 0.04). Results from this experiment
agree with those from a concurrent feedlot finishing experiment by these authors where ADG
and feed efficiency were improved by 11% and 7%, respectively, for U compared with CON.
Increasing DIP through the inclusion of urea to dry-rolled and high-moisture corn-based feedlot
diets containing 20% dried DG resulted in increased OM digestibility and concentration of NH3-
N and total VFA without affecting feed intake and ruminal pH.
Similar abstract previously published:
Ceconi, I., M. Ruiz-Moreno, A. DiCostanzo, and G. I. Crawford. 2013. Effect of urea inclusion
in diets containing distillers grains on total tract digestibility and ruminal fermentation in feedlot
cattle. Proc. ADSA-ASAS Joint Annual Meeting, Indianapolis, IN.

127
Immunogenic inhibition of prominent ruminal bacteria as a means to reduce lipolysis and
biohydrogenation in vitro H. D. Edwards1, R. C. Anderson
2, W. L. Shelver
3, N. A. Krueger
2, D.
J. Nisbet2 and S. B. Smith
1,
1Texas A&M University, College Station,
2USDA/ARS, College
Station, 3USDA/ARS, Fargo, ND
Biohydrogenation is a ruminal process that almost quantitatively saturates free fatty acids, thus
limiting the availability of unsaturated fatty acids for absorption and assimilation. In order for
biohydrogenation to occur, free fatty acids must first be hydrolyzed from their triacylglycerol
precursor, a process known as lipolysis. Ruminants saturate up to 80% or more of their dietary
unsaturated fatty acids through the microbial processes of lipolysis and biohydrogenation,
therefore promoting the accumulation of saturated fatty acids in their meat and milk.
Anaerovibrio lipolyticus 5s, Butyrivibrio fibrisolvens H17C, Propionibacterium avidum and
acnes are prominent ruminal bacteria that have been identified as active contributors to lipolytic
activity in the rumen. For this study, antibodies generated against these bacteria were tested as a
means to inhibit lipolysis. Additionally, an antibody was also generated against a Pseudomonas
lipase to determine if an antibody specific against a purified lipase would be more effective than
an antibody against whole cells. Butyrivibrio fibrisolvens uniquely participates in both lipolysis
and biohydrogenation processes and thus the anti-B. fibrisolvens antibody also was tested to
determine its effectiveness at reducing biohydrogenation against itself in pure culture. Each
bacterium was cultured in anaerobic medium until late log phase and 4 ml of culture was
transferred to tubes containing 2 ml anaerobic assay buffer and a bed of glass beads. Tubes were
treated without (controls) or with antibody (0.6 mL). To determine cross-reactivity of the
antibodies on lipolysis, each antibody was tested against each bacterium. Tubes were
supplemented with either 0.3 ml olive oil to measure lipolysis or 6 mg linoleic (18:2n-6) or α-
linolenic acid (18:3n-3) to measure biohydrogenation. Tubes containing olive oil were incubated
for 12 h and tubes containing linoleic or α-linolenic acid were incubated for 1 and 3 h at 39°C.
Lipolysis was measured colorimetrically to determine the accumulation of free fatty acids and
biohydrogenation was determined by measuring fatty acid products by gas chromatography. All
five antibodies were effective at reducing lipolysis. The anti-Pseudomonas lipase was the most
effective, averaging a 77% reduction in free fatty acid accumulation. A reduction in lipolytic
activity was caused by each antibody for nearly all bacteria, suggesting that the lipases for these
bacteria are likely genetically similar. Thus, an antibody generated against a single lipase may be
universally effective in reducing lipolytic activity for any lipase-producing bacteria.
Biohydrogenation of α-linolenic acid was depressed by 22% at 3 h compared to controls (50 ± 13
nmol ml-1
h-1
). Biohydrogenation was not affected in the presence of the antibody with linoleic
acid as substrate, likely a result of it not being unsaturated to the extent that α-linolenic acid is.
This study demonstrated that a prominent ruminal bacterium responsible for freeing and
hydrogenating ruminal fatty acids can be immulogically inhibited in vitro.
Case Study: Arrival Bovine Respiratory Disease titers and subsequent morbidity and
performance of newly received cattle from New Mexico ranches and south Texas livestock
auctions J. R. Graves1, M. E. Hubbert
2, J. S. Schutz
2, C. A. Löest
1, and E. J. Scholljegerdes
1,
1Department of Animal and Range Sciences, New Mexico State University, Las Cruces,
2Clayton
Livestock and Research Center, New Mexico State University, Clayton
This study was designed to evaluate titer levels for three major precursors to Bovine Respiratory
Disease (BRD), Infectious Bovine Rhinotracheitis (IBR), Bovine Virus Diarrhea (BVD), and
Parainfluenza-3 (PI-3), over the course of a 56 d feeding period. Five hundred and thirty-three

128
crossbred steer calves (Initial BW = 555 ± 3.0 lb) were used in a completely randomized design.
Four loads of approximately 90 head of cattle per load were obtained from New Mexico ranches
with differing calf health management protocols and two loads (n = 90/load) of cattle originating
from Texas livestock auctions with unknown calf health management programs. On d 0, cattle
were weighed, bled and administered metaphylaxis and vaccinated for IBR, BVD, and PI-3.
Cattle were randomly assigned to one of six pens within load. Cattle were then bled and weighed
on d 28 and 56. Cattle were accessed daily for symptoms of BRD and treated accordingly. At the
conclusion of the study, a subset of animals not treated (Healthy; n = 46) were selected to serve
as a control group for comparative analysis to treated cattle (Morbid; n = 44). Serum was
analyzed for BRD antibody titers. Overall morbidity was 8.3%. Average daily gain for healthy
cattle was greater (P < 0.001) than morbid between d 0 and 28 and d 0 and 56. Irrespective of
health status 87.8% and 28.5% (P < 0.01) of cattle arrived with no serum titer for IBR and PI-3,
respectively. Arrival (d 0) antibody titers for IBR and BVD did not differ (P ≥ 0.15) across
morbid and healthy cattle. However, d 0 serum antibody titers for PI-3 were lower (P = 0.08) in
morbid cattle and varied across sources of cattle (P < 0.001), which was likely due to differences
in calf management at the ranch. Day 28 serum IBR antibody titers were greater (P = 0.09) for
morbid cattle than healthy with no differences being observed for BVD or PI-3 (P ≥ 0.26).
Serum antibody titers on arrival for IBR and PI-3 differed (P = 0.07) and did not differ (P =
0.54) for BVD between healthy and morbid cattle. Specifically, serum antibody titers were
lower for PI-3 in morbid cattle than healthy. Conversely, serum antibody titers were greater for
IBR in morbid cattle when compared to healthy. Serum antibody titers differed (P ≤ 0.02) across
loads of cattle. Due to the variation in management of cattle from New Mexico it is difficult to
identify one overarching factor that may influence arrival antibody titers. Nonetheless, cattle
from ranch 4, which were considered well-managed by receiving mineral, vaccinations at
branding and weaning, and preconditioned at the ranch after weaning, had the highest antibody
titers for PI-3 only (P < 0.001) but were intermediate or lower for IBR and BVD compared to
other loads of cattle coming from New Mexico ranches and Texas livestock auctions.
Interestingly, arrival serum antibody titers for BVD were greater for ranches whose calves were
not vaccinated or preconditioned (P < 0.001). Health and nutritional management of calves at
the ranch may have an influence on arrival antibody titers to viruses involved in the BRD
complex; however, due to the low number of cattle and relatively low incidence of morbidity in
this experiment, it is difficult to identify one factor that may influence calf health in the feedlot.
Therefore, future work is needed to further elucidate the management factors on the ranch that
may predispose cattle to BRD in the feedlot. This will allow for the development of predictive
tools or management recommendations for cow/calf producers to reduce morbidity as it relates to
BRD in the feedlot.
Effect of Rumensin and Amaferm on performance of heifers fed high roughage mixed diets
in dry lot and grazed on high quality forage H. C. Gray, P. Beck, K. Glaubius, and B.
Stewart, Department of Animal Science, University of Arkansas, Fayetteville
Previous studies have found adding Rumensin to diets will increase cattle performance by
improving ruminal efficiency. Previous research has also shown that by adding Amaferm to the
diet, fungal activity in the rumen increases, allowing more surface area for bacteria to attach to
and maximize the digestion of high fiber forages. The objective of this research was designed to
test the effects of adding Rumensin and Amaferm on performance of growing beef heifers fed
high roughage mixed diets in dry lot over two yr and while grazing wheat pasture in yr 1. Angus

129
influenced cross-bred heifers (n = 72 yr 1 and 60 yr 2; BW = 484 ± 12.1 lb yr 1 and 519 ±16.3 lb
yr 2) were placed in twelve (99’ x 21’) dry lot pens located in Hope, AR. In yr 1 of the study,
calves were fed a diet of corn stalk hay (50% as fed) and corn distiller’s grains, and corn as the
primary concentrate energy sources for 83-d beginning in early November. Heifers were then
placed on 12, 2 acre cool-season annual pastures keeping heifers within their original feeding
groups, feeding Amaferm and/or Rumensin in two lbs corn per heifer daily. In yr 2 of the study,
calves were fed a diet of mature ryegrass hay (50% as fed) using corn as primary concentrate
energy source and cottonseed meal and urea were added as primary protein source for 66-d. Dry
lot data were analyzed as a randomized complete block design with 2x2 factorial arrangement of
treatments and the grazing period performance was analyzed as a completely randomized design
using mixed procedure of SAS. Pen (or Pasture) treatment was the experimental unit and heifer
the sampling unit. There was no year by treatment interaction for dry lot (P ≥ 0.75) so data were
pooled across YR for analysis. Total BW gain and ADG tended (P = 0.07) to be increased with
the addition of Rumensin (153 vs 161 ± 8.1 and 1.62 vs 1.73 ± 0.11, for control vs Rumensin,
respectively). There, however, was no effect (P = 0.95) of Amaferm on BW performance or an
Amaferm by Rumensin interaction (P = 0.80). Treatment did not affect DMI (P ≥ 0.11) or feed
efficiency (P ≥ 0.43). These results indicate Rumensin may increase performance of these high
roughage low energy diets but Amaferm inclusion had no effect on performance in dry lot. On
pasture, however, there was a tendency (P = 0.10) for Amaferm to increase BW gain by 18 lbs
and ADG by 0.2 lb/d. These results indicate Amaferm did not affect performance of heifers fed
these high roughage low energy diets in dry lot but Amaferm inclusion provided improved
performance on high-quality pasture.
Evaluation of near-infrared reflectance spectroscopy for nutrient prediction of wheat and
barley entering feedlots in western Canada A. R. Harding1, C. F. O’Neill
1, M. L. May
2, L. O.
Burciaga-Robles2, and C. R. Krehbiel
1,
1Department of Animal Science, Oklahoma State
University, Stillwater, 2Feedlot Health Management Services Ltd., Okotoks, Alberta, Canada
Near infrared reflectance spectroscopy (NIRS) has been used to predict nutrient composition of
feed commodities. Barley and wheat grains are commonly used in the cattle feeding industry in
western Canada, and feedlots are challenged with large variation in nutrient composition of these
commodities. The objective of this study was to evaluate the use of NIRS for nutrient prediction
of barley and wheat grains. Barley (n = 98) and wheat (n = 75) samples were selected from seven
feedlots in western Canada from September, 2011 to August, 2012, representing a range in
nutrient compositions as predicted by commercially available NIRS prediction equations
(InfraXact, FOSS North America, Eden Prairie, MN). Based on nutrient distributions for each
grain, samples were selected for HIGH, MED, or LOW nutrient composition of dry matter (DM),
starch, and crude protein (CP). In addition, random samples of each commodity were selected to
make up a majority of the respective study populations. Laboratory analysis was completed on
all samples. PROC REG of SAS 9.3 (SAS Institute, Cary, N.C.) was used to determine
correlations between laboratory assayed and NIRS values across the ranges (HIGH, MED, and
LOW samples) for each constituent. Correlation of NIRS predictions and lab assayed values for
DM was poor for wheat (R2 = 0.20, P = 0.09, n = 15) but strong for barley (R
2 = 0.86, P < 0.05,
n = 21.) When comparing NIRS and lab predictions of CP for barley and wheat samples, strong
correlations were observed (R2
= 0.63, P < 0.05, n = 24, and R2 =0.92, P < 0.01, n = 15,
respectively.) Poor correlations were observed when comparing NIRS predictions and lab
assayed values for starch content of barley (R2 = 0.17, P < 0.05, n = 23) and wheat (R
2 = 0.27, P

130
≤ 0.05, n=15), respectively. NIRS technology can adequately predict CP of barley and wheat
grain and accurately predict DM of barley grain. Additional research must be done to improve
current calibrations evaluating DM of wheat and starch content of barley and wheat grain.
Interactive effects of zinc and ractopamine hydrochloride on the β-adrenergic receptor
T.L. Harris1 , A. D. Hosford
1, M. J. Anderson
1, C. K. Larson
2, and B. J. Johnson
1,
1Department
of Animal and Food Sciences, Texas Tech University, Lubbock, 2Zinpro Corporation, Eden
Prairie, MN
β-adrenergic receptor (βAR) agonists are commonly used in the beef cattle industry in the United
States to improve carcass characteristics, growth rate, and feed efficiency. A commonly used
growth promotant, ractopamine hydrochloride (RH), has been shown to increase muscle
hypertrophy by binding to the βAR. When activated, the βAR signals intracellularly beginning
with an increase in cAMP production. Zinc has been shown to have an allosteric binding site on
the βAR and previous studies have indicated that zinc may increase βAR affinity for agonists
such as isoproterenol. The objective of this study was to determine if zinc (Zn), when used in
combination with RH, would stabilize the interaction of RH with the βAR, indicated by altered
cAMP production, mRNA quantity, or protein abundance. Cultures of bovine satellite cells were
established and treated at 120 h for 6, 24, and 96 additional h. Preliminary data was collected
from dose titrations of Zn and RH to establish the optimum biological effect of each molecule.
Treatments were applied in a 2 X 2 factorial arrangement with two levels of zinc (0 μM or 1 μM)
and two levels of RH (0 μM or 10 μM) in differentiation media. cAMP was measured at 6, 24,
and 96 h, while mRNA and protein were measured at 24 and 96 h. At 6 h, no differences (P
>0.05) were detected in cAMP production between any of the treatments. However, at 24 h the
10 μM RH, 1 μM zinc treatment had a greater concentration of cAMP (P <0.05) compared to all
other treatments. At 96 h the 10 μM RH, 0 μM zinc treatment had a lower concentration of
cAMP (P =0.05) compared to the control. A tendency for an interaction of Zn and RH (P <0.10)
was determined at 96. Using RT-QPCR analysis, no differences were detected in mRNA
abundance between any of the treatments for the genes evaluated. Genes of interest included, β1
adrenergic receptor, β2 adrenergic receptor, AMPKα, myosin heavy chain I, myosin heavy chain
IIA, and myosin heavy chain IIX. Protein quantification was performed via western blotting
procedures to assess the abundance of the β1 adrenergic receptor, β2 adrenergic receptor, and
AMPKα; However, no differences were detected in protein abundance between treatments..
These results indicate that zinc in combination with a β-agonist, may help to sustain the response
during prolonged exposure. These changes in cAMP response may prolong the biological
response in skeletal muscle to β-adrenergic agonists.
Comparing condensed distillers solubles concentration in steam-flaked and dry-rolled corn
finishing diets on cattle performance and carcass characteristics M. E. Harris1, A. H.
Titlow1, A. L. Shreck
1, S. A. Furman
2, G. E. Erickson
1, K. H. Jenkins
2, and M. K. Luebbe
2 ,
1Department of Animal Science, University of Nebraska, Lincoln,
2University of Nebraska,
Lincoln, Panhandle Research and Extension Center, Scottsbluff
Two experiments were conducted to 1) determine if a corn processing by condensed distillers
solubles (CCDS) concentration interaction exists, and 2) determine the optimum concentration of
CCDS in steam-flaked corn (SFC) based diets. Experiment 1 was arranged in a 2x3 factorial with
factors including corn processing method [dry-rolled (DRC) or SFC] and level of CCDS (0, 15,
or 30% diet DM). The objective of Exp. 2 was to determine the optimum concentration of CCDS

131
(0, 9, 18, 27, or 36% diet DM) in SFC-based diets. Urea and soybean meal were included in all
diets to meet or exceed NRC requirements for MP. In both experiments, crossbred steers were
utilized in a randomized block design, blocked by BW, stratified by BW within block, and
assigned randomly to pens. Pens were assigned randomly to treatments within BW block.
Experiment 1 consisted of 42 pens with 7 pens/treatment and 11 steers/pen. Experiment 2 used
40 pens with 8 pens/treatment and 11 steers/pen. In Exp. 1, DMI decreased quadratically
(P<0.04) as CCDS level increased for both SFC and DRC based diets. No differences (P=0.30)
in DMI were observed between corn processing method, although numeric differences exist. For
DRC-based diets, final BW, and ADG increased quadratically (P<0.01) as solubles concentration
increased. There was a quadratic improvement (P<0.03) in F:G as CCDS increased in the DRC-
based diets. With SFC-based diets, final BW and ADG increased linearly (P=0.01), while F:G
showed a quadratic improvement (P=0.07). Steam-flaked corn diets had greater (P=0.02) 12th
rib
fat thickness compared to DRC diets. Diets with SFC tended (P=0.09) to have greater yield
grade than DRC-based diets. Dry matter intake for Exp. 2 also decreased quadratically (P<0.01)
as CCDS concentration increased. Average daily gain increased quadratically (P<0.01) with
greatest gains observed at 27%. There was a quadratic improvement (P<0.01) in F:G, with
optimum F:G observed at 27% before slightly increasing at 36% CCDS. Hot carcass weight
increased quadratically (P<0.01), and peaked at 27% CCDS. Calculated YG and marbling score
increased quadratically (P=0.06 and 0.08, respectively). Fat thickness and LM area also tended
to quadratically increase (P=0.13 and 0.07, respectively) as CCDS concentration increased.
Dressing percent increased linearly (P=0.01) as CCDS increased in the diet. For Exp. 1, these
results demonstrate a positive interaction when a more intensely processed corn (SFC) source is
used with CCDS. These results disagree with previous work when feeding wet distillers grains
plus solubles and SFC-based diets. In Exp. 2, the optimum inclusion of CCDS was 17.5% and
25% for gain and efficiency, respectively. Distillers solubles can replace SFC up to 36% of the
diet DM, while maintaining or improving performance.
Effects of corn processing methods on fermentation/digestion characteristics and feedlot
performance of steers fed no-roughage diets R. M. Harvey, J. Sexten, and M. S. Kerley,
Animal Sciences, University of Missouri, Columbia
Two experiments were conducted to evaluate the effect of corn processing on fermentation/
digestion characteristics and feedlot performance in steers. Experiment 1 was a site and extent
study that used five Hereford steers with rumen fistula and duodenal “T”-type cannula in a 5x5
Latin square design to evaluate the effect of corn processing method on rumen digestion and
microbial growth when fed with or without roughage. Diets were whole-shelled corn (WC),
cracked corn (CC), CC with 8% hay (CC+H), steam-flaked corn (SF:CC) and SF with 8% hay
(SF:CC+H). Each of five periods consisted of four days for diet adaption and three days for
sample collection. All diets were fed at 1.8% BW DMI and were balanced to meet or exceed
NRC (2000) nutrient requirements. Data were analyzed using the GLM procedure in SAS
version 9.3 (2011). MOEFF was not significantly different across treatments ( P > 0.10).
Treatment diet did not affect pH ( P > 0.10). OM digestibility did not differ between treatment
diets ( P > 0.10). There was no difference in ruminal crude protein digestibility across treatments
( P > 0.10). Microbial N flow post-ruminally was not significantly different ( P > 0.10) between
treatments but was numerically highest for both the WC and SF:CC+H treatments (97.70 and
99.80 g, respectively). Experiment 2 consisted of 80 head of crossbred steers (441.8 ± 10.86 kg)
assigned to a completely randomized design to determine the effect of feeding high concentrate

132
diets with or without roughage on feedlot performance. Four high concentrate diets were fed at
2.0 % BWDMI for 55 days. Diets consisted of (WC), WC with 8% fescue hay (WC+H), (CC)
and CC with 8% fescue hay (CC+H). Treatments were randomly assigned to pen with 4
steers/pen and 5 replicates/treatment. Diets were fed once daily into GrowSafe bunks (1
bunk/pen) to measure individual steer intake. Individual body weights were captured on two
consecutive days at the initiation and end of the study with an interim 27 day weight. Data were
analyzed using GLM procedure in SAS. There was no difference in initial, d27 or final BW
between treatments ( P > 0.10). Average daily gain was different among treatments ( P < 0.02).
Steers fed WC+H and CC+H had greater gains compared to the WC and CC treatment diets
(1.52 and 1.67 vs 1.49 and 1.35 kg, respectively). Individual steer intake was different across
treatment diets ( P < 0.01). CC+H had the greatest intake (13.54 kg/d) with steers fed the WC
and CC diets eating the least (10.40 and 10.47 kg/d, respectively). Feed conversion ratio (FCR)
was not statistically significant ( P > 0.10) but did numerically improve with WC inclusion in
treatment diet compared to CC treatment diets (7.57 and 8.13, respectively). Overall, WC diets
with no roughage have yet to be studied. The site and extent study showed that pH change over
time was more consistent and ammonia concentration was increased with the WC compared to
the other diets. We concluded from our growth study that roughage removal reduced intake
without concomitant from reduced ADG, so that FCR was improved. Though not statistically
significant, numerical differences in the site and extent study paralleled the growth study
indicating that when diets are balanced for RDP/RDN along with post-ruminal amino acids,
improvements in digestibility and feedlot performance do occur.
Effect of high dosage ractopamine hydrochloride on growth performance and carcass
characteristics of Holstein steers J. E. Hergenreder1, J. L. Beckett
2, J. Homm
3, and B. J.
Johnson1,
1Department of Animal and Food Science, Texas Tech University, Lubbock,
2Beckett
Consulting Services, Fallbrook, CA , 3Elanco Animal Health, Greenfield, IN
Objectives were to evaluate the effects of feeding ractopamine HCl at 400 mg/hd/d for the last
28 d of the feeding period on growth performance and carcass characteristics of Holstein steers.
Steers (n = 1,498; initial BW = 547 kg) were randomly assigned to pens (10 pens/treatment) and
to a treatment: 1) no ractopamine HCl (C); 2) Ractopamine HCl fed at 400mg/hd/d (RH).
Treatment period averaged 28 d. Steers were fed a conventional finishing diet based on steam-
flaked corn and alfalfa hay with monensin (33.3 g/ton; 100% DMB: Rumensin: Elanco,
Greenfield, IN) added. Dry matter intake decreased (P < 0.05), while ADG was greater (P <
0.05), and F:G was lower (P < 0.05) in RH steers. Ractopamine HCL fed steers had heavier final
BW and HCW (P < 0.05), and higher DP (P < 0.05). Control steers had a smaller loin eye area
(P < 0.05), and tended to have more back fat (P = 0.07) than RH steers. Ractopamine HCl fed
cattle had lower calculated yield grades (P < 0.05), a higher percentage of yield grade 1 (P <
0.05), and a lower percentage of yield grade 3 (P < 0.05) cattle. Marbling score did not differ
between treatments (P > 0.10), however RH steers had a lower percentage of cattle grading
Choice (P < 0.05), and a higher percent grading Select (P < 0.05). These data indicate that 400
mg/hd/d of ractopamine HCl fed to Holstein steers can improve feedlot performance, dressing
percentage, hot carcass weight, and LM area while having a minimal impact on quality grade.

133
Effects of a terminal sorting system with zilpaterol hydrochloride on feedlot performance
and carcass characteristics of yearling steers F.H. Hilscher1, G.E. Erickson
1, D. B. Burken
1,
B.L. Nuttelman1, K. J. Vander Pol
2 , and J.P. Hutcheson
2,
1University of Nebraska-Lincoln,
2Merck Animal Health, De Soto, KS
Crossbred yearling steers (n=1400, 829 ± 64 lb) were used to evaluate the effects of Zilpaterol
hydrochloride (ZH) and terminal sorting 50 d prior to harvest on feedlot performance and carcass
characteristics. Steers were blocked by arrival group (25 steers/pen, 56 pens) and assigned
randomly to pen to receive 1 of 4 treatments: 1) unsorted non-ZH negative control (-CON); 2)
unsorted ZH fed positive control (+CON); 3) early weight sort fed ZH (1-Sort) with heaviest
20% identified at d 1 and sorted 50 d from harvest and marketed 14 d prior to –CON and +CON,
with the remaining 80% of the pen fed 7 d longer than –CON and +CON; and 4) four-way sort
50 d from harvest fed ZH (4-sort) with steers sorted into a heavy, mid-heavy, mid-light, and light
group, marketed -14 d, 0 d, +7 d, and +21 d from the –CON and +CON, respectively. Because
the heaviest steers were sorted early, the remaining steers in the sorted treatments were fed
longer than the –CON and +CON as a treatment. All steers fed ZH were fed 7.56 g/ton of DM
for 20 d followed by 3 d withdrawal. Dry matter intake was lower (P<0.01) for 4-sort cattle
when compared to the unsorted controls, but was not different compared to 1-sort. Carcass
weight for +CON (948 lb) was 33 lb heavier (P<0.01) than –CON (915 lb), and HCW for 4-sort
was numerically greater than +CON (957 lb; P0.12). Carcass weight SD was not different
(P>0.95) between +CON and –CON, while carcass weight SD of 4-sort was reduced (P<0.01)
compared to unsorted controls. Steers fed ZH had a greater percentage of carcasses over 1000 lb
than –CON (P<0.01). Although not statistically different, % of carcasses over 1000 lb were
reduced by 22% for 4-sort compared to +CON. The percentage of carcasses over 1050 lb was
significantly lower (P <0.05) for 4-sort compared to all other treatments. Longissimus muscle
area was greater in +CON and sorted treatments (P<0.01) than –CON, and 4-sort had increased
(P<0.05) LM area vs. +CON. Fat depth was lower (P<0.05) in +CON than –CON, but did not
differ in ZH treatments. Marbling was lower (P<0.04) for; 1-sort, 4-sort, and +CON when
compared to -CON. Feeding ZH increases carcass weight, but sorting reduces variation and
increases carcass weight further due to greater days on feed.
Effects of supplemental lysine and methionine with zilpaterol hydrochloride on feedlot
performance, carcass characteristics, and tenderness in finishing feedlot cattle A.D.
Hosford1, W. Rounds
2, and B. J. Johnson
1, 1
Department of Animal and Food Science, Texas
Tech University, Lubbock, 2Kemin Industries, Inc., North America, Des Moines, IA
Feeding rumen protected (RP) amino acids (AA) with zilpaterol hydrochloride (ZH) was
evaluated in a small-pen feeding trial. Crossbred steers (n = 180; initial BW = 366 kg) were
blocked by weight and then randomly assigned to treatments (45 pens; 9 pens/treatment).
Treatment groups consisted of a RP lysine supplement (Lys) LysiPEARLTM
and ZH, a RP
methionine supplement (Met), MetiPearlTM
and ZH, a RP lysine and methionine (Lys+Met)
and ZH, no AA and no ZH (Cont-), and no AA and ZH (Cont+). Zilpaterol hydrochloride (8.3
mg/kg DM) was fed for the last 20 d of the finishing period with a 3 d withdrawal. Lysine and
Met were top dressed daily for the 134 d feeding trial to provide 12 or 4 g·hd-1
·d-1
, respectively
to the small intestine. Carcass characteristics and striploins were collected following harvest at a
commercial facility. Steaks from each animal were aged for 7, 14, 21 and 28 days, and Warner
Bratzler shear force (WBSF) was determined as an indicator of tenderness. Cattle fed
supplemental Met and Lys+Met had increased final BW (P = 0.02 and 0.03), and ADG (P <

134
0.05) compared to Cont-. Supplementation of Lys, Met, and Lys+Met improved G:F (P < 0.05)
compared to Cont- during the ZH feeding period (d 111 to 134) as well as the entire feeding
period (P < 0.05). Zilpaterol hydrochloride increased carcass ADG (P < 0.05) when compared to
non-ZH fed cattle. Methionine and Lys+Met treatments had heavier hot carcass weights (HCW:
P < 0.05) as compared to Cont-. Yield grade was decreased (P < 0.05) for Cont+ cattle compared
to Lys, Lys+Met, and Cont- treated cattle. Quality grade distribution was unaffected between
treatments. Tenderness was reduced (P < 0.05) with ZH regardless of AA supplementation.
Lysine, Met, Lys+Met, and Cont+ had less tender steaks (P < 0.05) throughout all aging groups
as compared to Cont-. Steaks from Lys treated cattle were less tender (P < 0.05) than Cont+
during the 7 and 14 d aging periods. After 21 d of aging, all steaks from AA supplemented steers
had similar WBS (P > 0.05) as Cont+. Control- had the highest percentage of tender steaks after
21 days of aging (P < 0.05). Supplementation of AA, in conjunction with ZH feeding increased
ADG and HCW. These findings indicated that cattle fed ZH may require additional AA absorbed
from the small intestine in order to maximize performance.
Effects of wet distillers grains and condensed distillers solubles on growth performance and
carcass characteristics of finishing steers H.D. Hughes, M.S. Brown, K.J. Kraich, J. Simroth-
Rodriguez, and J.O. Wallace, West Texas A&M University, Canyon
Few data exist describing the feeding value of condensed distillers solubles (CDS) in diets
typical of the southern High Plains. Crossbred steers (n=384) were adapted to a common
finishing diet, blocked by BW, implanted with Revalor-IS (80 mg trenbolone acetate and 16 mg
estradiol) and assigned to treatments of CDS concentration (0, 7.5, or 15% of diet DM) in diets
containing 15% wet distillers grains with solubles (WDGS; represented by 0/15, 7.5/15, and
15/15, respectively) or to a control treatment containing 0% CDS and 0% WDGS. Cattle were
housed in 36 soil-surfaced pens (9 pens/treatment). Diets contained equal fat and crude protein
content across treatments. The WDGS and CDS replaced portions of steam-flaked corn,
cottonseed meal, yellow grease, and urea. Cattle were fed twice daily for 167 days (initial BW =
794 + 24 lb). Dry matter intake tended to increase (P=0.12) with increasing CDS concentration
(19.9, 20.0, and 20.4 +/- 0.4 lb/d for 0/15, 7.5/15, and 15/15, respectively), but DMI was not
different between the control (19.6 lb/d) and the average of remaining treatments (P=0.58). Steer
ADG on a live basis was 7.3% greater by cattle fed WDGS and CDS diets (3.37, 3.31, and 3.36
+/- 0.06 lb/d for 0/15, 7.5/15, and 15/15, respectively) compared to cattle fed the control diet
(3.14 lb/d; P=0.007), but ADG was not different among CDS concentrations (P>0.43). Cattle
fed the control were 4.2% less efficient on either a live or carcass basis than the average of those
fed CDS (P=0.005), while no differences in F:G were observed as CDS concentration increased.
Hot carcass weight (P=0.02) and 12th
rib fat thickness (P=0.09) were both greater for cattle fed
WDGS and CDS compared to the control. No differences (P > 0.10) were observed for
remaining carcass measurements among treatments. Based on cattle performance, the NEg of
WDGS and CDS were 100 and 85%, respectively, of the NEg of steam-flaked corn. Results
suggest that WDGS is an effective replacement for steam-flaked corn in finishing rations at 15%
inclusion rates. Results also suggest that including CDS up to 15% of ration DM in equal fat
diets, in combination with WDGS, will not have a negative impact on performance or carcass
characteristics.

135
Effects of corn processing method and dietary inclusion of corn wet distillers grains with
solubles (WDGS) on nutrient metabolism and enteric gas production in finishing steers J. P Jaderborg
1, G. I. Crawford
1, A. DiCostanzo
1, M. J. Spiehs
2, and K. E. Hales
3 ,
1Animal
Science, University of Minnesota, Saint Paul, 2Environmental Management Unit, USDA-ARS
U.S. Meat Animal Research Center, 3Nutrition Research Unit, USDA-ARS Meat Animal
Research Center, Clay Center, NE
Dry rolled (DRC) and high moisture (HMC) corn are common corn processing methods used by
feedlots in the Upper Midwest. Research is limited on higher inclusion rates of wet distillers
grains with soluble (WDGS). Therefore, the effects of increasing the concentrations of WDGS in
dry rolled and high moisture corn-based diets on energy metabolism and enteric methane (CH4)
production were evaluated in eight MARC III (initial BW = 394 kg) steers using respiration
calorimetry head boxes. A 4 x 4 replicated Latin square with 2 x 2 factorial arrangement of
treatments was used with the following dietary treatments: 1) DRC-based diet with 25% WDGS
(DRC-25); 2) DRC-based diet with 45% WDGS (DRC-45); 3) HMC-based diet with 25%WDGS
(HMC-25); 4) HMC-based diet with 45% WDGS (HMC-45). Density of dry rolled and high
moisture corn used in treatment diets were 678.4 and 605.1 kg/L respectively. Dry matter intake
tended to decrease (P = 0.10) and CH4 production was reduced (P < 0.01) as WDGS
concentration increased in the diet. The CO2 to CH4 ratio increased (P = 0.02) and RQ
decreased (P < 0.01) when WDGS increased in the diet. Retained energy tended to be greater (P
= 0.07) for DRC vs HMC. Urinary N excretion as proportion of N intake was not affected by
corn processing method or WDGS inclusion rate, while feces was increase (P = 0.01 and < 0.01;
respectively) for HMC and 25% WDGS diets. However, as a proportion of N intake, urinary N
excretion was increased (P < 0.01), whereas, fecal N excretion was decreased (P < 0.01) when
WDGS concentration increased in the diet. As a percent of intake, ether extract apparent
digestibility was greater (P < 0.01) for WDGS at 45 than 25% of DM. Diets containing 25%
WDGS or HMC had a lower (P < 0.01) NDF digestibility. Starch apparent digestibility as
percent of intake was increased (P < 0.01) for diets containing DRC, while it was not affected (P
= 0.29) for WDGS concentrations in diet. Retained energy as a percentage of GE intake was
similar (P = 0.21) using 25 and 45% WDGS diets, while retained N as a percentage of N intake
was greater (P = 0.02) for 45% diets.
Impact of postweaning residual feed intake in heifers on efficiency of forage utilization,
heart rate and physical activity of pregnant cows A.N. Hafla, J.R. Johnson, G.E. Carstens,
T.D.A. Forbes, L.O. Tedeschi, J.C. Bailey, J.T. Walter, and J.G. Moreno, Department of Animal
Science, Texas A&M University, College Station
Residual feed intake (RFI) of growing cattle has been shown to be positively associated with
biological processes (e.g., energy expenditures, digestibility) that affect efficiency of feed
utilization. However, few studies have examined the association between RFI in growing
animals, and life-cycle efficiency of integrated beef production systems. The objectives of this
study were to determine if RFI classification of beef heifers is associated with efficiency of
forage utilization, body composition, feeding behavior, heart rate and physical activity of mid-
gestation females. Postweaning RFI was measured in growing Bonsmara heifers for 2
consecutive yr (N = 115) while fed a high-roughage diet (2.04 Mcal ME/kg DM). RFI was
calculated as the residual from the linear regression of DMI on mid-test BW0.75
and ADG, and
heifers with the lowest (n = 24) and highest (n = 24) RFI were retained for breeding. During the
postweaning trial, heifers with low RFI (more efficient) consumed 20% less (P < 0.001) DMI,

136
but had similar BW and ADG compared to high-RFI heifers. First-parity (N =23) and 2nd
-parity
(N =19) females were subsequently fed a diet consisting of 30% alfalfa and 70% sorghum hay
(2.11 Mcal ME/kg DM), and DMI and feeding behavior traits measured with a GrowSafe®
system. Body condition scores and ultrasound measurements of rump-fat depth and LM area
were obtained on days 0 and 77 of the study. Heart rate was measured using Polar® monitors,
and physical activity measured using IceTag® accelerometers. Interactions between heifer RFI
classification and age (1st vs 2
nd parity) were non-significant (P > 0.10). Pregnant females with
low RFI as heifers consumed less (P < 0.001) hay (9.0 vs 11.6 ± 0.6 kg/d), spent less (P < 0.001)
time consuming hay (149 vs 198 ± 13 min/d), and had lower (P < 0.05) meal eating rates (27.4
vs 33.3 ± 1.8 g/min) than pregnant females with high RFI as heifers. However, BW, ADG, BCS,
rump-fat depth and physical activity (step count, lying bout frequency and duration) were similar
in pregnant females with divergent RFI as heifers. Heart rates were lower (P < 0.05; 66.1 vs 71.1
± 1.7 beats/min) for pregnant females with low RFI. Mid-gestation 1st-parity females had lower
(P < 0.05) initial BW and ADG, but similar DMI, rump-fat depth and BCS compared to mid-
gestation 2nd
-parity females. First-parity females had 53% higher frequency of bunk visits, 31%
more daily step counts, 9% more lying bouts and 8% higher heart rates then 2nd
-parity females.
Females with low RFI as growing heifers consumed 23% less forage and had 7% lower heart
rates, while maintaining the same BW and BCS during the 2nd
trimester of gestation compared to
females with high RFI as heifers. Results from this study suggest that a strong association exist
between RFI in growing heifers and efficiency of forage utilization in pregnant cows.
The effects of corn oil removal from distillers grains plus solubles on finishing performance
and carcass characteristics M. L. Jolly, B. L. Nuttelman, D. B. Burken, C. J. Schneider, G. E.
Erickson, and T. J. Klopfenstein, University of Nebraska, Lincoln
Two studies evaluated the effects of corn oil removal from distillers byproducts on finishing
performance and carcass characteristics. Oil is removed from thin stillage using centrifugation
which is the new process used by most plants, but different than previous work. In Exp. 1, a
180-d finishing study was conducted utilizing 225 calf fed steers (659 ± 20 kg) in a randomized
block design. Treatments consisted of 27% inclusion of condensed distillers solubles (CDS) with
de-oiled (6.0%) and normal (21.1%) fat, 40% inclusion of modified distillers grains plus solubles
(MDGS) with de-oiled (9.2%) fat and normal (11.8%) fat, and a corn based control (CON).
Dietary fat was 4.7% for de-oiled CDS, 8.8% for normal CDS, 6.1% for de-oiled MDGS, and
7.2% for normal MDGS compared to 4.4% for CON. There were no fat x by-product type
interactions observed (P > 0.34) and no differences in DMI, ADG, or F:G between de-oiled and
normal CDS (P > 0.25) or de-oiled and normal MDGS (P > 0.44). However, when compared to
CON, feeding CDS decreased DMI (P < 0.01) and improved F:G (P < 0.01), regardless of fat.
Feeding MDGS resulted in similar DMI (P > 0.48), greater ADG (P < 0.01), and improved F:G
(P < 0.01) compared to CON, regardless of fat. No differences (P > 0.20) were observed in
carcass characteristics due to fat content of CDS and MDGS. In Exp. 2, a 147-d finishing study
was conducted utilizing 336 yearling steers (774 ± 42 kg) to evaluate increasing inclusions of de-
oiled wet distillers grains plus solubles (WDGS). Treatments consisted of 35, 50, and 65%
dietary inclusion of WDGS with de-oiled (7.9%) and normal (12.4%) fat and a corn based
control (CON). Dietary fat was 5.6% for de-oiled 35%, 7.2% for normal 35%, 6.2% for de-oiled
50%, 8.5% for normal 50%, 6.7 for de-oiled 65%, and 9.8% for normal 65% WDGS compared
to 4.3% for CON. An inclusion x fat interaction was observed for DMI (P < 0.10). Dry matter
intake was greater for normal 35%, de-oiled 35%, and de-oiled 50%, intermediate for normal

137
50% and de-oiled 65%, and lowest for normal 65% (P < 0.01). Fat content had no effect on final
BW, ADG, and F:G (P > 0.20). Level of WDGS had no effect on FBW or ADG (P > 0.88) but
was significant for F:G (P < 0.01). Feed conversion decreased linearly (P < 0.01) with increasing
inclusion of WDGS, regardless of fat content (P > 0.20). No differences (P ≥ 0.29) were
observed in carcass characteristics due to fat content or level of WDGS. Overall, these data
suggest that removal of fat had no impact on finishing performance or carcass characteristics by
centrifuging distillers solubles.
Effects of postruminal amino acid supply on dietary protein flow from the rumen of a
forage-based diet using a continuous culture system M. M. Masiero, J. H. Porter, M. S.
Kerley, and W. J. Sexten, University of Missouri, Columbia
Three diets with increasing ruminal undegraded protein level (LO, MID and HI) were fed
(50g/d) to continuous culture fermenters (FER) to characterize RUP (porcine blood meal and
Aminoplus) supplementation effect on post-ruminal amino acid flow in a forage-based diet. We
hypothesized that increasing diet RUP concentration would increase RUP flow from the rumen
without influencing microbial fermentation. Diets were randomly distributed over FER (N=24),
acclimated for 4d, and sampled over 3d. FER content was monitored at 0h and 4h post feeding
for pH and analyzed for VFA (mM) and ammonia concentration (AM) (mM/dL). Diets, FER
content and bacteria were used to measure amino acid digestibilities (g of digested AA/g AA
fed). The pH was greater (P = 0.005 and 0.0008) for HI, 6.46 and 6.42, compared to MID, 6.34
and 6.27, and LO, 6.32 and 6.24, for 0h and 4h, respectively. AM increased as RUP increased
(LO 3.18; MID 5.30; HI 8.79) at 0h, however at 4h AM was greater (P < 0.0001) for HI (10.58)
compared to MID (6.10) and LO (4.26). Acetic, propionic, valeric, total VFA and
acetic:proponic did not differ (P = 0.44) at 0h and 4h. Butyric did not differ (P = 0.37) at 0h. At
4h butyric was greater (P = 0.036) for LO (16.9) compared to HI (15.4), however MID (16.5) did
not differ between treatments. Isobutyric was greater (P < 0.0001) for HI (1.5) compare to MID
(1.2) and LO (1.1) at 0h. At 4h, isobutiric increased as RUP increased (LO 1.2; MID 1.4; HI 1.6;
P < 0.0001). Isovaleric was greater (P < 0.0001) for HI, 2.9 and 3.0, compared to MID, 2.5 and
2.6, and LO, 2.2 and 2.4, for 0h and 4h, respectively. OM, NDF and ADF digestibility, microbial
efficiency and g of Bacterial N/d did not differ (P = 0.4). Protein digestibility (%) was greater (P
= 0.042) for LO (47.2) and HI (46.0) compared to MID (38.3). Threonine (P = 0.175) and
methionine (P = 0.55) digestibility did not differ. Lysine digestibility was greater (P = 0.041) for
LO (0.5) compared to MID (0.38), however HI (0.46) did not differ between treatments.
Arginine digestibility was greater (P = 0.014) for LO (0.59) compared to MID (0.48), however
HI (0.54) did not differ between treatments. Histidine digestibility was greater (P = 0.002) for
LO (0.56) compared to MID (0.38) and HI (0.44). Total AA digestibility was greater (P = 0.056)
for LO (0.53) compared to MID (0.43), however HI (0.49) did not differ between treatments. At
the lower RUP inclusion level (MID) RUP was recovered in total from effluent flow. At the
higher RUP inclusion level (HI) less than half of supplemental RUP was recovered in effluent
flow. In conclusion, RUP supplementation in forage-based diets increased RUP flow from the
rumen without negatively influencing microbial fermentation. RUP fraction of rumen-stable
proteins may be influenced by supplemental protein level.

138
Advantages of technology enhanced beef production systems C. L. Maxwell1, B. K. Wilson
1,
B. T. Johnson1, B. C. Bernhard
1, D. L. VanOverbeke
1, D. L. Step
2, C. J. Richards
1, and C. R.
Krehbiel1,
1Department of Animal Science,
2Department of Veterinary Clinical Sciences,
Oklahoma State University, Stillwater
The objective of this study was to evaluate conventional and natural production systems through
annual pasture and finishing with 2 roughage levels. Beef steers (n = 180; initial BW = 250 ±
19.1 kg) from a single ranch in Oklahoma were randomized to one of two treatments in the
pasture phase. Steers were implanted with 40 mg of TBA, 8 mg estradiol, and 29 mg tylosin
tartrate (Conventional; CONV) or received no implant (Natural; NAT). The 2 treatments were
comingled and grazed winter annual pasture for 109 d. During pasture grazing, CONV steers had
an 18.5% improvement in ADG (1.22 vs. 1.03 kg/d; P < 0.01), and a heavier final BW (385 vs.
366 kg, P < 0.01), compared with NAT steers. Steers (160 steers; 5 steers/pen; 8 pens/trt) were
assigned to a 2 x 2 factorial RCBD in the feedlot phase. The first factor was production program
(NAT vs. CONV), and the second factor was 7 vs. 12% roughage (DM basis; LOW vs. HIGH).
During finishing, CONV steers were given 120 mg of TBA, 25 mg estradiol and 29 mg tylosin
tartrate at processing, were fed monensin and tylosin for the entire feeding period, and fed
zilpaterol hydrochloride for the last 20 d of the trial. Both groups were fed 135 d. At harvest, 17-
18 strip loins/treatment were collected for retail meat analysis. There were no system x roughage
level interactions (P ≥ 0.07). Conventional steers ate 6.9% more fed (11.8 vs. 11.0 kg/d; P <
0.01), gained 28.4% faster (1.90 vs. 1.48 kg/d; P < 0.01), and were 24.2% more efficient (0.164
vs. 0.132; P < 0.01), compared with NAT. There was a trend for LOW steers to eat less feed
(11.3 vs. 11.5 kg/d; P = 0.13) and gain faster (1.73 vs. 1.66 kg/d; P = 0.09), resulting in an
improvement in feed efficiency (0.153 vs. 0.144; P < 0.01) compared with HIGH. There was a
26% improvement in estimated daily carcass weight gain (1.55 vs. 1.23 kg/d), 17.8%
improvement in carcass efficiency (0.132 vs. 0.112; P < 0.01), and 14.9% improvement (1.31 vs.
1.14 Mcal/kg; P < 0.01) in calculated NEg retained for CONV vs. NAT. There were no effects of
treatment on 12th rib-fat thickness (P ≥ 0.16). Hot carcass weight was increased by 62 kg (424
vs. 362 kg; P < 0.01), dressing percentage increased 1.6% units (64.9 vs. 63.3%; P < 0.01), and
ribeye area was increased by 16.9 cm2
(100.9 vs. 84.0 cm2; P < 0.01), decreasing USDA Yield
Grade (3.09 vs. 3.54; P < 0.01) for CONV compared with NAT. Natural steers had a higher
percentage grading Premium Choice (48.7 vs. 18.7%; P < 0.01), a higher percentage of USDA
Yield Grade 4 and 5 (25.4 vs. 9.3%; P < 0.01), and a higher percentage of abscessed livers (39.6
vs. 10.5%; P < 0.01) compared with CONV. Conventional had increased Warner-Bratzler shear
force values (3.89 vs. 3.40, kg; P < 0.01) compared with NAT, resulting in lower overall
tenderness scores in a trained taste panel (6.8 vs. 6.4; P < 0.01). Conventional cattle had lower
feedlot cost of gains, resulting in $203.69/steer greater net returns (P < 0.01) compared with
NAT. The results of these data show that the technologies used in CONV production result in
significant improvement in efficiency, performance and profitability with minimal effects on
carcass and retail meat quality, regardless of roughage level.
Effects of cottonseed meal and dried distillers grains supplementation on rice straw
utilization by Brahman steers J. C. McCann, J. E. Sawyer, and T. A. Wickersham, Texas
A&M University, College Station
Seven ruminally cannulated Brahman steers were used in a 7 × 4 incomplete block design to
determine the effects of cottonseed meal (CSM; 43.9% CP, 82.9% degradable protein) or dried
distiller’s grain (DDG; 27.5% CP, 43.6% degradable protein) supplementation on rice straw

139
utilization. Treatments consisted of a control (no supplement) and three levels (60, 120, and 180
mg N/kg BW) of either CSM or DDG. Periods were 14 d with 9 d for adaptation and 5 d for data
collection. Steers had ad libitum access to rice straw (4.7% CP, 68% NDF) and were fed
supplements at 0630 daily. Increased supplementation resulted in a linear increase (P ≤ 0.06) in
forage OM intake from 13.5 g/kg BW (control) to 16.1 and 15.5 g/kg BW for 180 mg N/ kg BW
of CSM and DDG respectively, with no difference between sources (P = 0.84). Total digestible
OM intake was increased by supplementation (linear, P < 0.01) from 8.0 g/kg BW (control) to
11.7 and 12.9 g/kg BW for 180 mg N/ kg BW of CSM and DDG respectively. A greater
response was observed for DDG (P = 0.05) due to greater provision of supplement (g DM/d) to
achieve isonitrogenous treatment levels. Total tract OM digestion was linearly increased (P <
0.01) by CSM and DDG supplementation. Although CSM and DDG improved NDF digestibility
(linear, P ≤ 0.06) from 49.6% (control) to 53.7% and 54.9% at 180 mg N/kg BW respectively,
estimated forage NDF digestibility was not significantly increased (P > 0.10). Ruminal ammonia
concentrations peaked 4 h after supplementation with the greatest concentration (4.0 mM)
observed for 180 mg N/kg BW of CSM and the lowest concentration observed in the control (0.8
mM). Provision of CSM resulted in a linear increase (P < 0.01) in ruminal ammonia in contrast
to the quadratic response (P = 0.02) observed with DDG supplementation. Total VFA production
followed a similar trend with a linear increase for CSM and DDG supplementation, respectively
(P = 0.09, P = 0.01). Protein supplements containing high and low levels of degradable intake
protein were effective at improving intake and utilization of rice straw.
Lactipro improves performance and health of high-risk calves after feedlot arrival
Kevin Miller, Cadra Van Bibber-Krueger, and Jim Drouillard, Kansas State University
Manhattan
Two experiments were conducted to determine the effect of a 100-mL oral dose of the
Megasphaera elsdenii-containing product, Lactipro®, at initial processing, on the health and
performance of high-risk calves during the receiving period. In Exp. 1, 1294 crossbred steers
(BW = 262 ± 1.3 lb) were received from Mexico over a 13-d period in November and December
of 2011. Steers were provided hay upon arrival and processed approximately 24 h later. At
processing steers were assigned to a Control group (no Lactipro®) or a Lactipro
® treatment group
(100-mL oral dose of Lactipro®) based on alternating order through the chute. Steers were
housed in 10 concrete-surfaced pens with 15 or 16 steers/pen or 28 dirt-surfaced pens with 39 to
42 steers/pen. All steers were fed a 55% concentrate receiving diet ad libitum. Steers were
observed daily for signs of bovine respiratory disease (BRD). Steers determined to be sick with
BRD were taken to the processing area and given antibiotic therapy (1st antibiotic therapy,
Micotil; 2nd
antibiotic therapy, Baytril; 3rd
antibiotic therapy, LA-200). There were no
differences between treatments for DMI, ADG, feed efficiency, overall morbidity, or mortality
(P ≥ 0.53). Incidence of 1st- and 3
rd-time antibiotic therapy were not different between Control
and Lactipro® steers (P ≥ 0.16); however, Lactipro
® steers tended to have a lower incidence of
2nd
-time antibiotic therapies (P = 0.06). In Exp. 2, crossbred calves (504 bulls, 141 steers; BW =
443 ± 10.8 lb) were received from Texas over a 2-wk period in January, 2012. Bulls were
castrated at processing and treatments and allocation to treatment were the same as Exp. 1.
Calves were housed in 24 dirt-surfaced pens with 25 to 30 calves/pen, fed a 55% concentrate
receiving diet, observed daily for clinical signs of respiratory disease and treated for BRD as
described for Exp. 1. Calves dosed with Lactipro® had greater DMI, ADG, and improved feed
efficiency (P ≤ 0.05) compared Control calves. Instances of 1st- and 2
nd-time therapeutic

140
treatments for BRD were 31% and 33% less for calves given Lactipro® compared to the control
group (P < 0.05). Third-time antibiotic therapy for BRD and mortalities were not different
between treatments (P > 0.10), but BRD therapeutic treatment cost per calf was decreased by
13% (P < 0.05) for calves in the Lactipro® treatment. Dosing calves with Lactipro
® at
processing was effective as a method for improving performance and decreasing clinical signs of
BRD.
Prediction of barley silage dry matter by near infrared reflectance spectroscopy
C. F. O’Neill1, A. R. Harding
1, S. E. Murray
1, M. L. May
3, L. O. Burciaga-Robles
3, O. R.
Rasmussen2, and C. R. Krehbiel
1 ,
1Department of Animal Science, Oklahoma State University,
Stillwater, FOSS North America, Eden Prairie, MN, 3Feedlot Health Management Services Ltd,
Alberta, Canada
Near infrared reflectance spectroscopy (NIR) has been shown to accurately predict the nutrient
composition of various feedstuffs, including forages. For this study, the use of NIR for the
prediction of barley silage DM was examined and NIR equations were developed using
commodity specific or broad based calibration sets. Fifteen fresh samples of both barley silage
and barley straw were split into two groups: water added (WTR) and fresh. Water was added to
WTR samples to ensure a broad range of DM values were represented in the equations. Samples
were split, weighed and scanned using NIR technology (InfraXact, FOSS North America, Eden
Prairie, MN). Samples were dried in a forced air oven at 55°C, in twelve 4 hour intervals. At
each interval the samples were weighed and scanned. For each sample DM was calculated and
correlated to NIR spectra at each interval using WINISI software (FOSS North America). Data
from barley silage samples were blocked by calculated DM and randomized to either the
validation set (n = 128) or calibration set (n = 639). A commodity specific barley silage NIR
equation (SIL) was developed from the silage calibration set data (SE of calibration (SEC) =
3.77, R2 = 0.98). A second calibration set (n = 1406) was developed with the addition of data
from barley straw samples (n = 767) to the barley silage calibration set data and a broad based
barley silage NIR equation (SIL-STR) was derived (SEC = 2.93, R2 = 0.98). The SIL and SIL-
STR equations for DM of barley silage were validated using the independent barley silage
validation set. The R2 and SE of prediction (SEP) for the validation of SIL and SIL-STR
equations were 0.98 and 3.78 and 0.98 and 3.96, respectively. The DM content of barley silage
can be accurately predicted using NIR technology. The use of a broad based barley silage
calibration provides comparable results to a commodity specific calibration while increasing the
robustness of a NIR equation.
Effect of skeletal muscle fiber heterogeneity on development of intramuscular fat in
growing beef cattle S.L. Roberts, P.A. Lancaster, U. DeSilva, G.W. Horn, and C.R. Krehbiel,
Department of Animal Science, Oklahoma State University, Stillwater
Previous research indicates that metabolism and fiber type of skeletal muscle is related to
intramuscular lipid content. The objective of this study was to determine differences in
metabolism, angiogenesis, and intercellular signaling of skeletal muscle fibers within the same
muscle group that could be responsible for the initiation of intramuscular adipose tissue
development and differentiation. Longissimus dorsi (LD) muscle samples were collected from
steers (n = 12; 385 days of age; 378 kg) grazing wheat pasture. LD samples were dissected under
magnification and sorted into 3 categories based on visual stage of development: immature
(MM), intermediate (ME) and mature (MA) intramuscular fat (IM). In addition, muscle fibers

141
lying adjacent to each IM category and those not associated with IM tissue were collected and
stored separately. Quantitative RTPCR was used to determine relative fold change in genes
involved in metabolism, angiogenesis, and intercellular signaling pathways in both LD and IM
samples. Gene expression data were analyzed using a general linear model that included the
fixed effect of tissue. Pearson correlation coefficients were also computed between gene
expression in LD and IM tissue samples that were at the same stage of development. Fatty acid
binding protein 4 and PPARγ expression were greater (P<0.05) in more mature IM while PREF-
1 expression was less (P<0.01) indicating successful separation into different maturity
categories. Genes associated with metabolism and angiogenesis in LD tissue showed no
differences among stages of development. Myostatin expression did not change in LD tissue, but
mysotatin receptor and follistatin expression decreased (P<0.01) as IM matured. Angiogenic
growth factors in MM IM tissue had a strong positive correlation (r>0.88) with angiogenic
growth factors in LD associated with MM IM; however, no correlation was observed in ME or
MA IM. These data indicate a coordinated effort between LD and IM in early stages of IM
development.
Wet distillers grain and solubles vs. wet corn gluten feed for newly received and growing
cattle E.R. Schlegel1, S.P. Montgomery
2, C.I. Vahl
1, B.E. Oleen
1, W.R. Hollenbeck
1, and D.A.
Blasi1,
1Kansas State University,
2Corn Belt Livestock Services, Cedar Rapids, IA
In many instances, due in part to price per unit of energy and proximity to production, Kansas
beef producers have the opportunity to incorporate grain processing industry byproducts such as
wet distillers grains and solubles (WDGS) and wet corn gluten feed (WCGF) into newly arrived
and growing cattle diets. While a number of previous studies have compared these two
byproducts for use in finishing diets, little information is available for receiving and growing
cattle diets. Therefore, the objective of this study was to compare the performance outcomes of
newly arrived and growing calves fed either WDGS or WCGF relative to a standard corn – based
diet. Over a 7-day period (May 15 through 23, 2012), 280 steers and bulls (30% bulls; 518 lb
initial body weight) were assembled through sale-barn market facilities in Tennessee and
transported to the Kansas State University Beef Stocker Unit. Upon arrival, all calves were
weighed, tagged, mass medicated with Draxxin® (1.1 mL/100 lb), and palpated for sex (bull or
steer). Calves were given ad libitum access to long-stem prairie hay and water overnight. The
following day, calves were vaccinated against clostridial and respiratory diseases and dewormed,
and bulls were surgically castrated. Each load (three total) was then blocked by arrival date and
randomly assigned to one of three treatments for a total of 24 pens. Castrated bulls were equally
distributed among the eight pens within each string. Experimental treatments consisted of
feeding a diet that did not contain any corn byproducts (Control) or diets containing either 30%
WCGF or 30% WDGS on a dry matter basis. Feed bunks were checked twice daily, and feed
was delivered in amounts sufficient to result in clean feed bunks both morning and afternoon.
Calves were fed their respective diets at approximately 7:00 a.m. and 3:00 p.m. daily for 58 days.
Calves were then fed a common diet for an additional 14 days to equalize gut fill after which
time cattle were weighed to determine a final body weight. Daily dry matter intake, gains, and
feed efficiencies were determined for each pen of calves. Growth performance and feed intake
data was analyzed as a randomized complete block design using SAS. Health data was analyzed
using Pearson’s chi-square using the FREQ procedure. Feeding WDGS during the receiving
period increased dry matter intake (P<0.04) but did not improve growth performance compared
to cattle fed the Control and WCGF diets. Feeding WDGS during the growing period provided

142
for increased ADG (P<0.01) and improved feed efficiency (P<0.05) compared to cattle fed the
Control or WCGF diets. Based on Pearson’s residual, it appears there is a reduction for 1st
treatments for BRD for those calves fed WDGS.
Using RAMP to eliminate grain adaptation diets C.J. Schneider, B.L. Nuttelman, A.L.
Shreck, D.B. Burken, T.J. Klopfenstein, and G.E. Erickson, University of Nebraska, Lincoln
Three experiments evaluated transitioning cattle from RAMP, a complete starter feed (Cargill
Corn Milling, Blair, NE), to a finishing diet to determine if adaptation diets can be eliminated
when using RAMP for grain adaptation. In Exp. 1, 300 steers (BW=638±48 lb) were assigned to
30 pens resulting in10 steers/pen. The control adaptation treatment involved a 4-step system (4-
STEP) which gradually decreased RAMP inclusion (100 to 0%) while increasing finishing ration
which contained 47.5% Sweet Bran (0 to 100%) equally over 4 periods (4, 6, 6, and 6 d) by
mixing RAMP with a finishing ration. Additional treatments involved either a 2-step system (2-
STEP) which fed RAMP for 10 d followed by a 50:50 blend of RAMP and finisher for 4 d
before feeding the finishing diet on d 15, or a 1 step adaptation system (1-STEP) which involved
feeding RAMP for 10 d and switching directly to a finishing diet on d 11. From d 29 until
slaughter a common finishing diet was fed. Daily gain, DMI, and G:F were not different (P >
0.20) among treatments on d 39 or over the entire feeding period. Adaptation treatment did not
affect carcass traits (P > 0.30) or the incidence of liver abscesses (P > 0.61). Liver abscess
prevalence was very low at 3% overall which may suggest that acidosis was minimal in this trial.
In Exp.2, individually fed yearling steers (n=60; BW=844 ± 33 lb) were assigned randomly to 1
of 3 adaptation treatments. Adaptation treatments included 4-STEP and 1-STEP from Exp. 1 and
a traditional adaptation program (TRD) which decreased alfalfa hay inclusion (45 to 7.5%) while
corn inclusion increased (25 to 62.5%) over 4 periods (4, 6, 6, and 6 d). On d 28, all cattle were
switched to a common finishing diet and remained on a common diet for the entire 138 d
finishing period. During grain adaptation, 1-STEP cattle had greater ADG (P=0.02) and G:F
(P=0.04) compared to TRD and tended to have greater ADG compared to 4-STEP (P=0.10).
Feed intake variance among d for animals was greater for TRD compared to 4-STEP and 1-
STEP (P < 0.04), but DMI were not different (P = 0.50) during the adaptation period. Feedlot
performance over the 138 d period and carcass traits were not affected (P>0.15) by adaptation
treatment. In Exp. 3, ruminally fistulated steers (n=12; BW = 877 ± 66 lb) were used to evaluate
the effects of using the same adaptation programs used in Exp. 2 on ruminal pH and DMI.
Intakes were similar for all treatments during the 28 d adaptation period (P = 0.53) or during the
14 d period when cattle were fed a common finishing diet. (P = 0.77). Cattle on the 4-STEP
treatment cattle spent more time eating when compared to 1-STEP (P = 0.02) or TRD (P < 0.01)
during the adaptation period and compared to TRD (P = 0.04) while on a common finishing diet.
During the adaptation system, average ruminal pH was greater for 1-STEP (P = 0.04) and 4-
STEP (P = 0.10) and time below pH of 5.6 was lower for 1-STEP (P = 0.03) when compared to
TRD. While cattle were fed a common finishing diet, there were no differences among
treatments for average ruminal pH, pH variance, or time and area below pH 5.6 (P > 0.16).
Regardless of adaptation period length, RAMP treatments increased eating time and average
ruminal pH during the adaptation period which may suggest less risk of acidosis when using
RAMP to start cattle on feed. Cattle fed RAMP for 10 d can be transitioned directly to a
finishing diet containing 47.5% Sweet Bran without affecting performance.

143
Effects of exchanging supplemental N with condensed distillers solubles on growth
performance and carcass characteristics of feedlot steers J. Simroth-Rodriguez1, M. S.
Brown1, J. Kawas
2, J. Wallace
1, B. Coufal
1, R. Butler
1, H. Hughes
1, K. Kraich
1, and B.
Mendonca1,
1Feedlot Research Group, West Texas A&M University, Canyon,
2Facultad de
Agronomía, Universidad Autónoma de Nuevo Leon, Monterrey, Nuevo Leon, Mexico
Further assessment of the feeding value of condensed distillers solubles (CDS) is needed.
Crossbred steers (initial BW = 827 +/- 24 lb) previously adapted to a finishing diet were blocked
by BW and randomly assigned to treatments in a 2 x 2 + 1. Diets contained equal fat. The
control diet was based on steam-flaked corn, with urea and cottonseed meal (CSM) providing
supplemental N. In remaining diets, N from CDS replaced urea N or CSM N, with CDS
included at either 10 or 20% of DM (11 pens/treatment). Composite samples for each diet were
assayed and contained 13.45, 13.65, 13.90, 14,55, and 14.60% CP for the control, 10% CDS
replacing urea N, 10% CDS replacing CSM N, 20% CDS replacing urea N, and 20% CDS
replacing CSM N, respectively. The effects of CDS concentration and source of N replaced did
not interact for growth performance or carcass measures (P>0.12). Steer DMI was 3.8% lower
(P =0.07) for the control than when CDS N replaced a portion of urea N. Steer DMI was 3.4%
higher and ADG was 3.7% greater (P<0.06) when CDS N replaced urea N than when CSM N
was replaced. Steer DMI and ADG were not altered by CDS concentration. Steer ADG and
feed efficiency were not different between the control and when CDS N replaced a portion of
urea N nor when CDS N replaced urea or CSM N. However, feed efficiency was 3.0% poorer
(P=0.02) when 20% CDS was fed compared to 10% CDS. Carcass measures were not different
between the control and when CDS N replaced a portion of urea N (P>0.49). Hot carcass weight
was lighter and LMA was larger (P<0.08) when CDS N replaced CSM N. Fat thickness, average
yield grade, and calculated empty body fat were also lower (P<0.03) when CDS N replaced CSM
N, whereas 20% CDS increased marbling score compared to 10% CDS (P=0.03). Results
suggest that CDS N is a more effective replacement of urea N than cottonseed meal N.
Replacing CSM N reduced ADG and carcass weight, and produced leaner carcasses, whereas
carcass quality was slightly improved when more CDS was fed.
Non-protein nitrogen supplements to enhance low-quality forage utilization C.C. Stefan,
J.E. Sawyer, and T.A. Wickersham, Texas A&M University, College Station
Efficacy of four NPN-based protein supplements for stimulating intake and digestion in cattle
consuming low-quality forage (6.8% CP) was evaluated. Five ruminally-cannulated steers (238
kg ± 9.1 kg) were used in a 5 × 5 Latin square consisting of four supplements and a negative
control (CON). Supplements were infused directly into the rumen, prior to feeding and included
a 40% CP mineral mix (40MM; 100% of CP from biuret), 60% CP mineral mix (60MM; 100%
of CP from biuret), 25% CP liquid (25L; 61% of CP from slow-release N source; RumaPro™,
Anipro/Xtraformance Feeds), or 35% CP liquid (35L; 74% of CP from RumaPro™). Mineral
mixes were provided at 114 g/d and liquids at 310 g/d. Periods were 14 d; 8 d adaptation to
treatment and 6 d sample collection. Forage OM intake tended to be greater for 25L (5.56 kg/d;
P = 0.06) and 35L (5.53 kg/d; P = 0.08) than CON (5.20 kg/d), but was similar to CON for
40MM (5.34 kg/d; P = 0.44) and 60MM (5.13 kg/d; P = 0.71). Total OM intake was greater (P <
0.01) for both liquid supplements (5.81 and 5.79 kg/d; 25L and 35L, respectively) than CON
(5.20 kg/d), but 40MM (5.38 kg/d; P = 0.33) and 60MM (5.18 kg/d; P = 0.92) were comparable
to CON. There were no differences (P ≥ 0.11) between supplements and CON for total tract OM
digestion, which ranged from 56.0 – 58.6%. Total digestible OM intake was greater (P < 0.01)

144
for 25L (3.4 kg/d) and 35L (3.36 kg/d) compared to CON (2.94 kg/d), but not for 40MM (3.03
kg/d; P = 0.43) or 60MM (3.06 kg/d; P = 0.27). Average ruminal NH3 concentrations were
greater (P < 0.01) with supplementation, 0.33 mM (CON) versus 1.06, 1.96, 1.71, and 2.09 mM,
for 40MM, 60MM, 25L, and 35L; respectively. Ruminal VFA concentrations were greater (84.7
vs 98.7 mM) with supplementation (P < 0.06). Supplementation with liquids increased intake of
digestible OM. In contrast, delivery of the mineral mixes did not significantly impact digestible
OM intake. These data suggest a potential benefit to providing readily fermentable OM when
delivering supplemental NPN to cattle consuming forage near the 7% CP thresh-hold, below
which protein supplementation typically stimulates forage utilization.
* Abstract submitted to National Animal Science Meeting 2013
Relationship between chemical intramuscular fat percent measured by FOSS with
ultrasound, carcass, and camera marbling scores A. J. Thompson, F. R. B. Ribeiro, S. N.
Aragon, W. C. Burson, J. Baggerman, A. Romano, A. D. Hosford, J. E. Hergenreder, and B. J.
Johnson, Department of Animal and Food Sciences, Texas Tech University, Lubbock
The objective of this study was to determine the relationship between intramuscular fat
percentage measured by FOSS with marbling scores from real-time ultrasound (RTU), carcass
and camera data to determine body composition in feedlot steers (n = 72). The RTU, camera and
carcass data were collected on 72 crossbred feedlot steers within a 76 h period. Measurements of
RTU were taken by a certified ultrasound technician approximately 24 h prior to slaughter using
an Aloka 500-V instrument with a 17-cm 3.5 MHz transducer. Hair was clipped to less than 0.64
cm and vegetable oil was applied to enhance image quality. The RTU measured traits consisted
of 12-13th
rib backfat thickness (uBF, mean = 1.04 cm), 12-13th
LM area (uREA, mean = 102.7
cm2), and marbling score (uMARB, mean = 4.6). Intramuscular fat was converted to uMARB
by using the equation: uMARB = ((769.7 + (56.69×uIMF))/100) – 5. Overall means for 48 h
chill carcass data were 12-13th
rib backfat thickness (cBF, 0.97 cm), 12-13th
LM area (cREA,
103.5 cm2), and marbling score (cMARB, 5.0). Marbling scores were converted to a numeric
cMARB (Slight00
= 4, Small00
= 5, and Modest00
= 6). Carcass camera data consisted of 12-13th
rib backfat thickness (camBF, 0.99 cm), 12-13th
LM area (camREA, 103.8 cm2), and marbling
score (camMARB, 4.5). A face steak was collected from the 12-13th
rib LM, trimmed of all
excess fat to isolate the muscle, and chemical fat percentage was determined using a FOSS
FoodScan near-infrared spectrophotometer. Data were analyzed using the PROC REG, MEANS
and CORR procedures of SAS. Results show that all three carcass data collection methods were
highly correlated to each other. Correlations ranged from 0.79 to 0.82, 0.68 to 0.95 and 0.57 to
0.87 for BF, REA, and MARB, respectively. Chemical measurement of IMF percent by FOSS
was highly correlated to uMARB (0.62), cMARB (0.86), and camMARB (0.86). Ultrasound
marbling scores overpredicted IMF (0.22%), while cMARB and camMARB under predicted
IMF (-0.34 and -1.11% respectively). Carcass BF and camBF were over predicted by RTU (0.07
and 0.06 cm, respectively), however, REA was under predicted by RTU when compared to
cREA and camREA (-0.78 and -1.13 cm2, respectively). Camera MARB was over predicted by
uMARB (0.17) and cMARB was under predicted (-0.32). These results show that linear
measurements of carcass traits can be more accurately predicted by RTU when compared to a
non-linear measurement (MARB). Validation through FOSS near-infrared spectrophotometry
shows that we can also predict percent IMF from RTU, carcass and camera marbling scores.

145
The effect of calf age at weaning on cow and calf performance and efficiency in a
drylot/confinement production system J. M. Warner, K. H. Jenkins, R. J. Rasby, M. K.
Luebbe, G. E. Erickson, and T. J. Klopfenstein, University of Nebraska, Lincoln
Recent changes in production economics have impacted the long-term sustainability of the beef
cow-calf industry. Confinement of beef cows may be an alternative to improve production
efficiency and reduce the land base needed for cow-calf production. Therefore, the objectives of
this research were to evaluate the effect of calf age at weaning on cow and calf performance and
the efficiency of producing a weaned calf to 205 d of age in a total confinement production
system. Multiparous, crossbred (Red Angus x Red Poll x Tarentaise x South Devon x Devon),
lactating beef cows (n = 84) with summer-born calves at side were blocked by prebreeding BW
(H, M, L), stratified by calf age, and randomly assigned to 1 of 4 treatments within strata. The
experiment was a randomized complete block design with a 2 x 2 factorial arrangement of
treatments. Cow-calf pairs managed at 1 of 2 research feedlots (ARDC or PREC) were weaned
at 90 (EW) or 205 (NW) d of calf age. Early weaning coincided with the onset of the breeding
season. Regardless of location, EW calves and cows and NW pairs were fed a common diet
(60:40 distillers grains:crop residue, DM) from the time of early to normal weaning. EW cows
were limit-fed (15.0 lb DM/cow/d) while EW calves were fed ad libitum. NW pairs were limit-
fed the equivalent amount of DM consumed by EW cows and calves. All cow-calf pairs were
managed in earthen feedlot pens throughout the experiment. Pen was considered the
experimental unit. Cow BW and BCS prebreeding were similar (P = 0.56) between EW and NW
cows. At normal weaning, EW cows had greater (P = 0.05) BW than NW cows. Body weight
change from early to normal weaning was 46 lb greater (P ≤ 0.01) for EW than NW. Cow BCS
at normal weaning was not impacted (P = 0.23) by weaning regimen or location. Calf BW at
early weaning was not different (P = 0.85) between EW or NW calves. EW calves gained 22 lb
less than NW from early to normal weaning. EW cows and calves consumed 23.5 lb DM total/d
while NW pairs consumed 22.8 lb/pair/d. Final pregnancy rates were similar (P = 0.74) between
EW and NW cows. Early weaning has minimal impact on cow or calf performance or cow
reproduction when pairs are limit-fed in confinement.
Effect of supplemental protein amount and degradability on intake and digestion in Bos
indicus and Bos taurus steers fed rice straw K.K. Weldon, J.C. McCann, J.E. Sawyer, and T.A.
Wickersham, Texas A&M University, College Station
We evaluated effects of amount and degradability of supplemental protein on utilization of low-
quality forage in 5 Angus steers (Bos taurus- Bt, BW = 303 ± 10 kg) and 5 Brahman steers (Bos
indicus- Bi, BW = 323 ± 28 kg). Steers fitted with ruminal and duodenal cannulas were used in
concurrent 5 × 5 Latin squares. Treatments were arranged as a 2 × 2 factorial plus a control
(CON; no supplementation). Isonitrogenous (27% CP) supplements were formulated to provide
different proportions of ruminally degradable protein (DIP; L = 28% DIP or H = 72% DIP).
Each type of supplement was fed to deliver 60 or 120 mg of N/kg BW. Steers had ad libitum
access to rice straw (4.4% CP, 72.8% NDF). Experimental periods were 15 d; 9 d adaptation and
6 d sample collection. Forage OM intake (FOMI) was greater for Bt than Bi (P = 0.05).
Supplementation increased FOMI in both Bt and Bi (P < 0.05); Bi FOMI was increased from
13.5 g/(kg BW·d) to 14.8 g/(kg BW·d) and Bt from 16.5 g/(kg BW·d) (CON) to 17.6 g/(kg
BW·d). Neither protein source, amount, nor their interaction affected FOMI within Bi or Bt (P >
0.20). OM digestibility (OMD) was greater in Bi than Bt (P < 0.01). Supplementation did not
affect OMD in Bt (P = 0.53; 54.4% vs. 53.6% for CON vs. supplement), but increased OMD for

146
Bi (P = 0.02) from 53.4% (CON) to 57.0% (supplemented). There were no source, amount, or
source × amount effects (P > 0.37) within Bi or Bt for OMD. Total digestible OM intake
(TDOMI) was similar between breeds (P = 0.12), and increased (P < 0.01) with
supplementation. A 14% increase in TDOMI was observed from CON for Bt (P = 0.04); TDOMI
increased 29% from CON for Bi (P = 0.05). There were no source, amount, or source × amount
effects (P > 0.22) within either breed for TDOMI. While Bt had significantly higher FOMI, an
increase in OMD for Bi with supplementation resulted in similar overall TDOMI between
breeds.
Effects of Next Enhance 300 on in vitro fermentation, feedlot performance, carcass
characteristics, meat quality, and consumer sensory characteristics of Longissimus steaks
of beef steers M.C. Westerhold1, Z.D. Callahan
1, M.S. Kerley
1, C.L. Lorenzen
1, W.J. Sexten
1,
B.R. Wiegand1, and T.J. Wistuba
2,
1Division of Animal Sciences, University of Missouri,
Columbia, 2Novus International Inc., St. Charles, MO
Three experiments were conducted to evaluate how feeding Next Enhance 300 (NE) affects in
vitro fermentation, feedlot performance, carcass traits, meat quality, and consumer sensory
characteristics of LM steaks from beef steers. Dual-flow continuous culture (CC) fermenters
were used to assess the fermentation characteristics of rumen microbiota in CC with increasing
NE levels (EXP1). A feedlot trial (EXP2) was conducted using crossbred steers (n=98) to
evaluate the effect of NE on growth performance and carcass characteristics. At harvest, the
heaviest steer/pen (five steers/treatment; TRT) was sent to the University of Missouri abattoir.
LM steaks from these steers were used to evaluate meat quality and consumer sensory
characteristics (EXP3). In EXP1 two CC fermentation runs were conducted using a corn based
diet with treatment (TRT) levels of 0, 15, 30, 60, 120, and 240 mg·kg-1
DM. Microbial
efficiency, pH, ammonia, and VFA concentrations were not affected by NE (P>0.10). OM
(P=0.05) and CP (P=0.02) digestibility quadratically increased, with 30 and 60 mg·kg-1
DM
being the highest. In EXP2, TRT consisted of 0 (CON, n=25), 150 (n=24), 300 (n=25), and 600
(n=24) mg·hd-1
·d-1
NE. NE caused a linear decrease (P<0.05) in DMI at d 28, 56, and 84.
However, overall DMI did not differ (P=0.19). ADG of steers fed the 150 diet was the highest at
d 28 (P=0.05) and 56 (P=0.10). However, due to the decreased performance of steers fed the 300
and 600 diets, a linear decrease (P<0.05) was observed for d 28, 56, and overall ADG. D 28 G:F
of steers fed the 150 diet did not differ from CON but was improved (P<0.05) when compared to
300 and 600 steers. There was a linear decrease (P=0.01) in overall G:F due to decreased
efficiency of steers fed the 600 diet. A quadratic increase (P=0.01) in dressing percent (DP) and
a quadratic decrease (P=0.05) in 12th
rib backfat (BF) were observed, with CON steers having
the lowest DP and the most BF. NE tended to cause a quadratic increase (P=0.10) in LM area
(LMA) and LMA/45.4 kg. Consequently, there was a quadratic decrease (P=0.04) in calculated
USDA yield grade in response to NE. HCW and marbling score did not differ (P>0.05) among
TRT. In EXP3, NE inclusion did not affect a* or b* color values at 96 h post mortem (d 0) or d
14. NE linearly decreased (P=0.05) L* values a d 0, but did not affect d 14 L* values. NE caused
a linear decrease (P=0.07) in cook loss. A consumer sensory panel (n=55) was performed on one
steak/steer, with 4-5 panelists evaluating each sample. There was no difference (P>0.05) among
TRT for Warner-Bratzler Shear Force, drip loss, percent moisture, percent fat, consumer opinion
of overall like, or liking and level of tenderness, juiciness, and flavor. Including NE at 30 and 60
mg·kg-1
diet DM increased digestion in vitro. When fed to feedlot steers at 150 and 300 mg·hd-

147
1·d
-1 (levels similar to those eliciting a response in EXP1) NE improved ADG, DP, BF, LMA,
and yield grade, and had no effect on sensory characteristics of LM steaks from beef steers.
The effect of Aspergillus oryzae extract on feedlot performance and carcass merit in
yearling steers fed steam-flaked corn based finishing diets K.A. White1, J.J. Wagner
2, T.E.
Engle1, D.R. Woerner
1, R.K. Peel
1, T.C. Bryant
2, J.S. Jennings
3, and K.M. Brennan
3,
1Animal
Sciences Department, Colorado State University, Fort Collins, 2JBS Five Rivers Cattle Feeding,
Greeley, CO, 3Alltech, Inc. Nicholasville, KY
Crossbred yearling steers (n = 540) averaging 319.8 ± 7.11 kg initial BW were utilized in a
randomized block design experiment to evaluate the effects of supplementing a steam-flaked
corn based finishing diet with Aspergillus oryzae extract containing α-amylase activity on feedlot
performance and carcass characteristics. Within each of 2 years, steers were ranked by weight
and allocated into 15 weight block replicates. Within each weight block replicate, steers were
randomly assigned to 1 of 2 treatments resulting in 9 steers per pen. Treatments consisted of: 1.
Amaize® (AMZ; 5 g/head daily providing 750 fungal α-amylase units/g, Alltech Inc.
Nicholasville, KY) and 2. Control (CON; providing 5 g/head daily of a corn meal placebo).
Cattle were fed for 152 d in year 1 and 149 d in year 2. Initiation of treatment diets was on d 0 in
year 1 and on d 21 in year 2. Initial and final BW were the average of 2 individual weights
obtained on study d -1 and 0 and on 2 consecutive days immediately prior to harvest,
respectively. Feedlot performance and continuous carcass data were analyzed using PROC
MIXED of SAS. Fixed classification variables in the model included treatment, year, and
treatment*year. Random variables included weight block replicate and weight block replicate
within year. Initial BW was included in the model as a covariate when (P < 0.10). Categorical
carcass data were analyzed using PROC GLIMMIX of SAS using the same model as for
continuous data but assuming a binomial distribution. Final BW (P = 0.71), DMI (P = 0.80),
ADG (P = 0.78), gain efficiency (P = 0.54), and net energy for maintenance (P = 0.57) and gain
(P = 0.58) calculated from performance were similar across treatments. Dressing percentage (P =
0.01) and hot carcass weight (P < 0.10) was increased for steers fed AMZ as compared with
CON (63.4 vs 62.9% ± 0.13 and 365.6 vs 361.5 kg ± 1.95, respectively). Carcass maturity,
marbling score, and the distribution of USDA quality grade was not influenced (P > 0.15) by
treatment. Longissimus muscle area (P = 0.10) was increased for the AMZ treatment as
compared with CON. Remaining carcass variable were not impacted by treatment (P > 0.15).
The year by treatment interaction was significant (P < 0.01) for liver abscess rate suggesting that
AMZ reduced liver abscesses in year 1 but increased the percentage of abscessed livers in year 2.
The results of this study suggest that feeding AMZ had minimal impact on feedlot performance
but did increase dressing percentage, LM area, and hot carcass weight.
Evaluation of multiple ancillary therapies utilized in combination with an antimicrobial in
newly received, high-risk calves treated for bovine respiratory disease B. K. Wilson1, C. L.
Maxwell1, D. L. Step
2, C. J. Richards
1, and C. R. Krehbiel
1,
1Department of Animal Science,
Oklahoma State University, Stillwater, 2Department of Veterinary Clinical Sciences, Oklahoma
State University, Stillwater
Bovine respiratory disease (BRD) is the leading cause of morbidity, mortality, and decreased
production in feedlots, with estimated annual economic losses in excess of $1 billion. The
standard protocol when treating for BRD or undifferentiated fever in feedlot cattle is to
administer some class of injectable antimicrobial. However, it is common to provide some form

148
of additional treatment, or ancillary therapy, in conjunction with an antimicrobial when treating
for suspected BRD in feedlot cattle. The goal of ancillary therapy is to improve the response to a
BRD challenge in calves treated with antimicrobials, not to replace antimicrobial treatment. This
can be accomplished by relieving the harmful effects of inflammation, blocking histamine
activity, or boosting immune system function to aid in the defense against infectious pathogens
(Apley, 1994). The objective of this experiment was to evaluate the effects of 3 commonly used
ancillary therapies in combination with an antimicrobial in newly received, high-risk calves
treated for bovine respiratory disease (BRD). Crossbred steers (n = 516; initial BW = 217 ± 20
kg) were monitored daily by trained personnel for clinical signs of BRD. Calves that met
treatment criteria (n = 320) were given an antimicrobial and then randomly assigned to 1 of 4
experimental treatment groups: intravenous flunixin meglumine injection (NSAID), intranasal
viral vaccination (VACC), intramuscular vitamin C injection (VITC), or no ancillary therapy
(NOAC). First treatment morbidity was 66.5% and mortality attributed to BRD was 12.6%.
Steers receiving VACC tended (P = 0.10) to require a second BRD treatment less frequently than
steers receiving NSAID or NOAC. Calves receiving NSAID or VITC tended (P = 0.09) to
require a third BRD treatment less often than calves receiving NOAC. Of calves treated 3 times
for BRD, those receiving NOAC had lower (P = 0.05) severity scores than those receiving
VACC or VITC and heavier (P = 0.02) BW than those receiving NSAID, VACC, or VITC at the
time of third treatment. Between the second and third BRD treatments, calves receiving NOAC
also had greater (P = 0.03) ADG than those receiving VACC or VITC and tended (P = 0.06) to
have greater ADG than those receiving NSAID. Calves receiving NOAC tended (P = 0.07) to
have heavier BW on d 28 than NSAID, VACC, or VITC with mortalities and removals excluded.
When contrasted with the average of NSAID, VACC, and VITC calves, NOAC calves tended (P
< 0.10) to have heavier BW on d 56, greater ADG and DMI from first BRD treatment through d
28, greater DMI from d 28 through d 56, and had greater (P = 0.05) DMI from first BRD
treatment through d 56 with mortalities and removals excluded. Responses to the 3 ancillary
therapies used in this experiment were negligible. The use of NSAID, VACC, and VITC appears
to have minimal benefits and could potentially be detrimental to animal performance in severely
challenged calves.