the political economy of social protection …. 20102011 the political... · the political economy...
TRANSCRIPT

THE POLITICAL ECONOMY OF SOCIAL PROTECTION REFORMS IN INDONESIA
OFFICE OF THE VICE PRESIDENT
THE REPUBLIC OF INDONESIA
Dr. Bambang WidiantoDeputy for Social Welfare and Poverty Alleviation/ Executive Secretary of The National Team for the Acceleration of Poverty Reduction
International Conference “Reforming Social Protection Systems in Developing Countries”, 20-21 October 2011, Institute of Development Research and Development Policy, RUHR-Univesitat, Bochum, GERMANY

I. Introduction
II. Evolution of Social Protection Policy
III. Evolution of Social Protection Programs
IV. Pressure from the International Crude oil Price Increase
V. Shifting into more targeted program
VI. Compensation Scheme
VII. Systematize the Targeted Program
VIII. Instability of Fuel and Commodities Prices
IX. Programs Performance and Political Support
X. Coordination, Bureaucracy, Decentralization
XI. Attempt to Improve Coordination
XII. The Political Economy of National Social Security System
XIII. (SJSN) Law
OUTLINE AND STORY LINE
2

I. INTRODUCTIONMAP OF SOUTHEAST ASIA

Economic Crisis in 1998
1. Democratization
2. Economic Reform
3. Decentralization
BIG-BANG AND SIMULTANEOUS REFORM
4
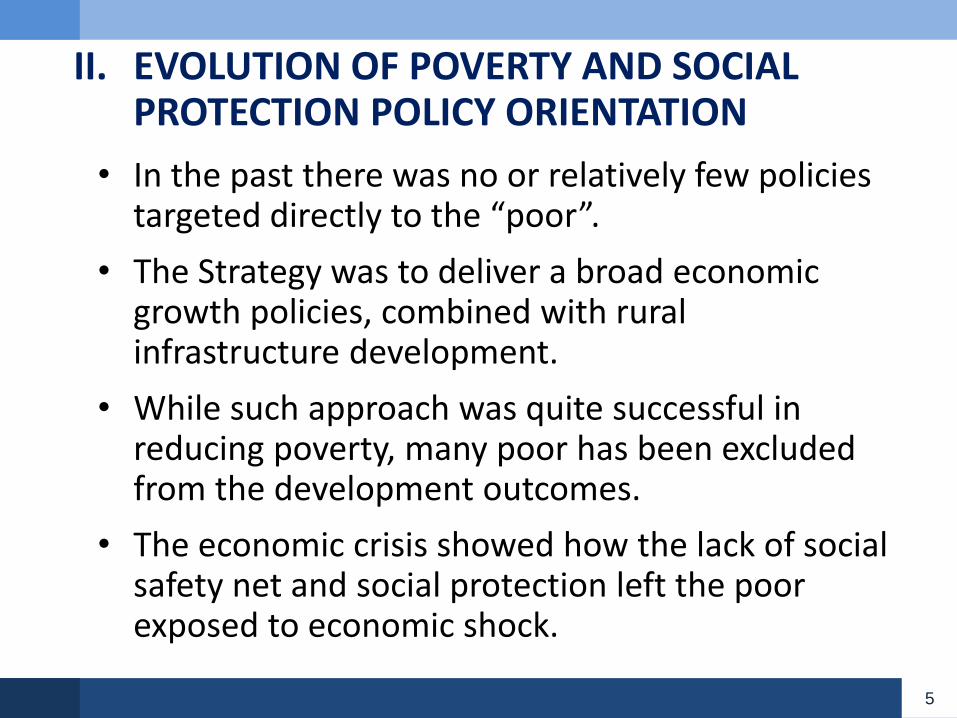
• In the past there was no or relatively few policies targeted directly to the “poor”.
• The Strategy was to deliver a broad economic growth policies, combined with rural infrastructure development.
• While such approach was quite successful in reducing poverty, many poor has been excluded from the development outcomes.
• The economic crisis showed how the lack of social safety net and social protection left the poor exposed to economic shock.
II. EVOLUTION OF POVERTY AND SOCIAL PROTECTION POLICY ORIENTATION
5

• Government’s approach towards policy alleviation has changed, from general economic development to more targeted policies
• Democracy, openness has brought poverty from a merely restricted, academic discourse to a significant political issue
• More targeted programs and attempts to build social insurance after the crisis
EVOLUTION OF POVERTY AND SOCIAL PROTECTION POLICY ORIENTATION
6

• Before The Crisis:
Most efforts were mainly non-targeted (general price subsidies)
Rural Development (BIMAS, KUK, Massive school and health facilities development) Later, targeted to regions (IDT)
• During the Crisis:
Targeted but reactive measures under safety net umbrella Cash for work, Rice for the poor, health for the poor, scholarships. To keep consumption level of the poor
III. EVOLUTION OF POVERTY AND SOCIAL PROTECTION PROGRAM
7

IV. PRESSURE FROM THE INTERNATIONAL CRUDE OIL PRICE INCREASE
8
Fuel And Electricity Subsidies Take Funding Away From Pro-poor Development Sectors…
6,9
9
12
,19
16
,00
14
,04
15
,74
18
,79
13
,99
25
,99
45
,30
50
,84
55
,30
84
,92
90
,82
91
,00
2,3
0
2,6
5
2,9
9
3,1
0
3,3
4
5,0
1
95
,60
64
,21
83
,79
13
9,1
1
45
,04
82
,35
12
9,7
2
8,9
0
30
,39
33
,07
83
,91
49
,55
57
,60
65
,57
0
20
40
60
80
100
120
140
160
2005 2006 2007 2008 2009 2010 2011
Health
Education
Social Assistance
Fuel Subsidy
Electricity Subsidy
Tril
lio
n ID
R

FUEL PRICE IN SOME ASIAN COUNTRIES (CENT USD/LITRE) – 2008
9
77
9890
81
52 53
76
50
89
21
80
124
107
91
43
53
92
50
94
38
0
20
40
60
80
100
120
140
Vietn
am
Thailan
d
Singap
ore
Ph
ilipp
ines
Myan
mar
Malaysia
Lao P.D
.R
Ind
on
esia
Cam
bo
dia
Bru
nei
Gasoline
Diesel
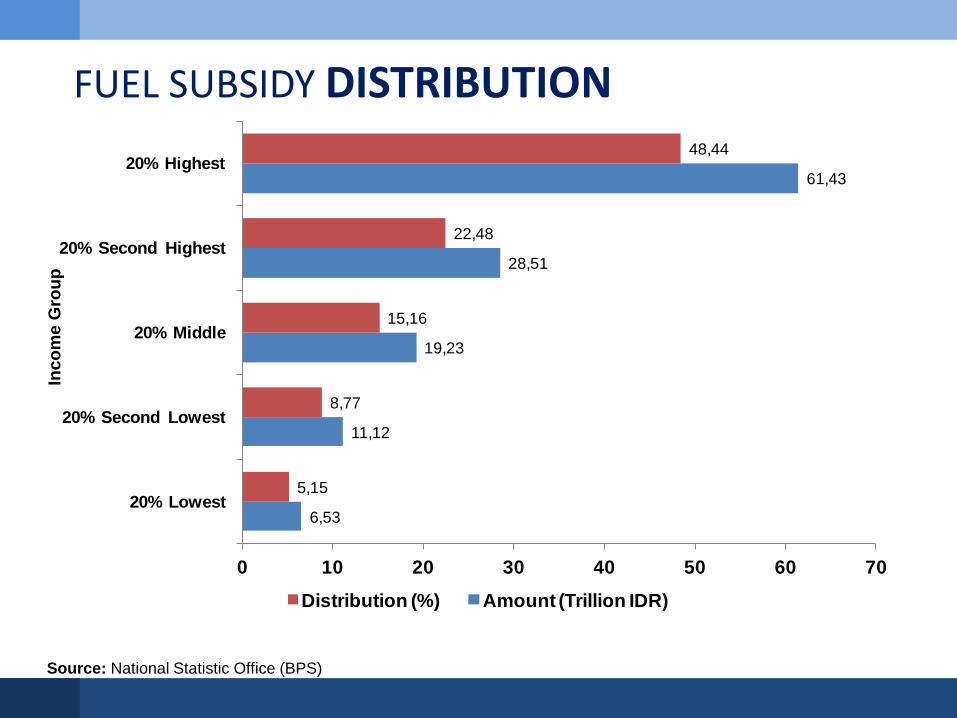
FUEL SUBSIDY DISTRIBUTION
Source: National Statistic Office (BPS)
Inco
me G
rou
p
6,53
11,12
19,23
28,51
61,43
5,15
8,77
15,16
22,48
48,44
0 10 20 30 40 50 60 70
20% Lowest
20% Second Lowest
20% Middle
20% Second Highest
20% Highest
Distribution (%) Amount (Trillion IDR)
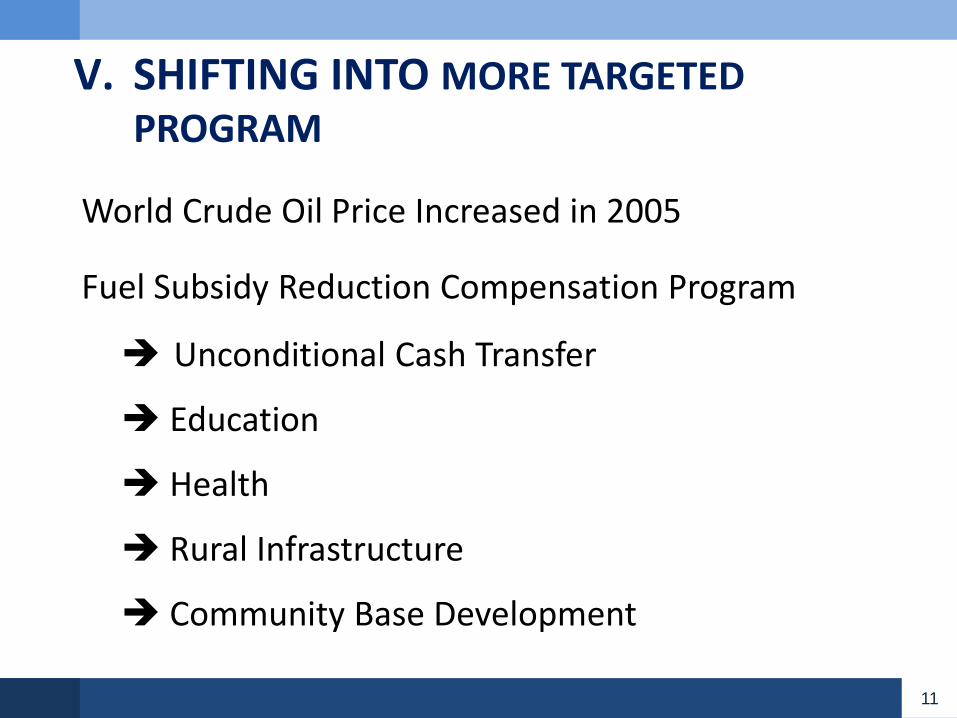
World Crude Oil Price Increased in 2005
Fuel Subsidy Reduction Compensation Program
Unconditional Cash Transfer
Education
Health
Rural Infrastructure
Community Base Development
V. SHIFTING INTO MORE TARGETED PROGRAM
11

EXAMPLES OF A SPECIFIC VULNERABLE GROUPS
12
1. Bottom Poor, Poor, and Near Poor
2. Orphans, Street Children
3. Homeless Without Support
4. Isolated Tribal Community
5. Mentally Ill
6. Displaced Population

TARGETING OPTIONS:
13
Means-testing, although this requires high-quality data that is notavailable in many countries and may be expensive to put in place.
Geographical targeting, whereby transfers are provided toeveryone living in areas where there is high incidence of poverty.
Community-based targeting, which uses community structures toidentify the poorest members of a community or those eligibleaccording to agreed criteria.
Providing benefit to those recognized as belonging to a specificvulnerable category of the population; and
Self-targeting such as in work program that offer a below-marketwage, based on the logic that individuals choose to opt to theprogram.

Targeting Beginning in July 2005, BPS undertook the task of developing
database of poor households through a "poverty census".
BPS
Step1: BPS interviewed the village leader and gathered information on the poorest households in that particular community.
Community Leaders
Initial List of Poor
Step2: Cross-checked with other sources of poverty information, such as Family Planning Office data, previous poverty census (in certain provinces).
Step3: BPS surveyed the economic and social characteristics of the selected households. BPS used a Proxy Means Test (PMT) to decide eligibility.
Final List of Poor
PROXY MEANS TESTING

15

SELF TARGETING:
KEROSENE CONVERSIONS TO LPG
16
Government provides free small bottles (3 kg) of LPG to poor households, small restaurants, food vendors and other micro business establishments
Bil
lio
n L
itre
s
59.7
39.3 36.8
1.5
0
10
20
30
40
50
60
70
2005 2008 2009
Fuel Consumption
Conversion from
Kerosene to LPG
(Estimation)

Unconditional Cash Transfers (BLT)
Program Description and Size:
The GOI implemented an unconditional cash transfer (UCT)program for 19.1 million poor and near-poor families tocompensate them for inflationary effects of the fuel priceincrease.
Each beneficiary family receives Rp. 100.000 per month,paid quarterly, beginning October 2005 – December 2006.
The 2005 - 2006 budget for the program is Rp. 23 trillions.
The 2008 budget for the program is Rp. 13 trillions.
VI. COMPENSATION SCHEME

Operational Aid for Schools and Scholarship Program
Program Description and Size:
Block grants to participating public and private schools atthe primary and junior secondary school levels.
The objective of the program is to provide aid to schools inorder to reduce the pupil’s contribution, but also allow theschool to maintain the quality of educational services to thecommunity.
The size of the grant to schools is based on enrollment andschool level: for primary schools– Rp. 235,000 /pupil/year,for junior secondary schools– Rp. 324,500/pupil/year.
The 2005 budget for the program is Rp. 6.3 trillion.

Basic Health Care and Health Insurance for the Poor
Program Description and Size:
The objective is to increase access and health servicequality to all people in particular to the poor so as toachieve better health outcomes.
The program is designed to cover:
Free of charge health services at Puskesmas (public healthclinics) for everyone and;
Free in-patient treatment at Third Class hospitals for thepoor.
The 2005 budget for the program is Rp. 3.9 trillion.

20
The GOI will channel funding to the puskesmas through the District Government in order to cover:
Free Basic Health Services at Puskesmas for all and puskesmas operational and management activities
Obstetric services in Puskesmasand by Village Midwives to cover childbirth including birth with complicating factors
Revitalization of Posyandu and nutrition improvement.
The GOI will channel funding through PT ASKES which will reimburse assigned Third Class hospitals for their services to the poor for outpatient and inpatient treatment. The activities will cover:
Inpatient treatment in Third Class hospitals
Follow-up outpatient treatment
Emergency services including ambulance service
Basic Health Care Health Services Insurance

Rural Infrastructure Program
Program Description and Size:
Block grants to districts for the construction ofroads/bridges and other infrastructure facilities at thevillage level decided by the local community.
The objective is to enhance village level infrastructurethrough participatory decision-making at local level andat the same time create employment for the poor in12,835 poor villages.
The 2005 budget for the program is Rp. 3.3 trillion.
Reallocation Schemes
21

National Program for Community Empowerment (PNPM)
22
1. Providing “small scale of goods and services” that can be done by community in order to promote job creation through: a) Infrastructure developmentb) Local economic developmentc) Improving human resources
2. Involving the poor into development process
3. Maintaining the sustainability principles, i.e.:a) To build ownership of the development resultb) To build capacity for community and local government in terms
of planning, budgeting and implementation c) To achieve pro-poor planning and budgeting
4. Municipality Coverage:2007 28002008 38002009 5623

• Cluster I Program Targeted To Household/Family
Family Centered Integrated Social Assistance
a. Unconditional Cash Transfers (BLT)
b. Conditional Cash Transfers (PKH)
c. Social Health Assistance for the Poor (JAMKESMAS)
d. Scholarship Programs (BSM)
e. Rice for the Poor (RASKIN)
• Cluster II Program Targeted To Community
a. Community Based Development Program (PNPM)
• Cluster III Program Targeted To Micro and Small Enterprise
a. Guaranteed Loan For Micro, Small, and Medium Enterprise(KUR)
VII. SYSTEMATIZE THE TARGETED PROGRAM
23

VIII. INSTABILITY OF FUEL AND COMMODITIES PRICE
24
Crude Oil (Petroleum) Monthly Price 2005-20011 (USD/Barrel)
42,89
132,55
64,65
84,14
116,32
0
20
40
60
80
100
120
140
JAN
FEBM
AR
AP
RM
AY
JUN
JUL
AU
GSEPO
CT
NO
VD
ECJA
NFEBM
AR
AP
RM
AY
JUN
JUL
AU
GSEPO
CT
NO
VD
ECJA
NFEBM
AR
AP
RM
AY
JUN
JUL
AU
GSEPO
CT
NO
VD
ECJA
NFEBM
AR
AP
RM
AY
JUN
JUL
AU
GSEPO
CT
NO
VD
ECJA
NFEBM
AR
AP
RM
AY
JUN
JUL
AU
GSEPO
CT
NO
VD
ECJA
NFEBM
AR
AP
RM
AY
JUN
JUL
AU
GSEPO
CT
NO
VD
ECJA
NFEBM
AR
AP
RM
AY
JUN
2005 2006 2007 2008 2009 2010 2011

Indonesia has experienced two large food price shocks in the last six years. Current trends suggest another shock is possible in the near future
-30
-20
-10
0
10
20
30
40
50
60
-5
0
5
10
15
20
25Ja
n-0
3
May
-03
Sep
-03
Jan
-04
May
-04
Sep
-04
Jan
-05
May
-05
Sep
-05
Jan
-06
May
-06
Sep
-06
Jan
-07
May
-07
Sep
-07
Jan
-08
May
-08
Sep
-08
Jan
-09
May
-09
Sep
-09
Jan
-10
May
-10
Sep
-10
Jan
-11
May
-11
Year-on
-Year Percentage C
han
geYe
ar-o
n-Y
ear
Perc
enta
ge C
han
ge
CPI Food Component (LHS) Wholesale Rice Price (RHS)
Retail Rice Price (RHS)
Source: BPS
2005-06 Food and Fuel Price Shock 2008 Food Price Shock Food and rice prices increased
sharply before the harvest
25

IX. PROGRAMS PERFORMANCE AND POLITICAL SUPPORT
Program
Raskin
BLT
PKH
BSM
Cash for Work(PNPM)
Quick?
Yes, if rice available
Yes
Moderate
No
Potentially, if pre-planned projects
ready.
Benefit levels right?
No. Not enough Raskin rice reaches
households, and rice gets shared out.
Yes
Yes
Yes
Not in aggregate. Not enough householdshave surplus labour,
and unlikely to be enough work in a
major shock.
Targeted well?
No, but could be if Unified Database
used and enforced.
No, but could be if Unified Database
used.
No, but could be if Unified Database
used.
No, but could be if Unified Database
used.
Yes
Cost-effective?
No. Raskin has very high administrativecosts, and too little
rice reaches households.
Yes
Not in the long-run. Long-term programs,
so beneficiaries receive benefits long
after shock ends.
Not in the long-run. Long-term programs,
so beneficiaries receive benefits long
after shock ends.
??
Politically supported?
Yes
No resistance but no full support by
parliament, and current targeting has been contentious in
communities.
Yes
??
Yes
26

Is there political support for the response? Raskin enjoys the most popular support, while BLT the least
Program Degree of Political and Community Support
Raskin Good– Popular program amongst politicians– Popular program amongst communities
BLT Weak– Not popular amongst opposition politicians– Receives the most complaints in communities
PKH Moderate– Does not suffer from BLT political antipathy– Still a pilot program that is not well-known by the public
Scholarships Good– 20 percent government spending requirement supports
sustainability of scholarships
Cash for Work(PNPM)
Good
27

Modifications to a number of responses may make them more Politically Acceptable
Program
Raskin
Cash with Light Conditionalities
Cash for Work(PNPM)
Main Issues
Too little rice is received by each household Cost of delivering benefits is too high
BLT politically not popular Targeting contentious in communities
Will not benefit all households May not be sufficient pre-planned projects
to support demand
Potential Modifications
Could be used as a popular de-facto price stabilisation mechanism instead of OPK
Not a cost-effective or sufficient option for household assistance
Add light conditionalities so that it is not “free” money
Better socialisation of intended recipients, combined with PPLS11 to improve targeting and perceptions
Rename to disassociate with old brand
Might best be included as a supplementary response, and not the main one
28

Can the benefits be delivered to the right households? BLT is the most pro-poor, while BSM and Raskin are less so
Share of Total Benefits by Consumption
Source and notes: Susenas February 2010, MoF data and World Bank staff estimates.
Around one-third of total benefits from the four largest programs goes to the top half of households– Reflecting issues with targeting, benefit-
incidence analysis based on Susenas indicates that around one-third of the total benefit spending from BLT, Raskin, Jamkesmas and BSM go to ineligible households in the top half of the consumption distribution.
The BSM program is the least pro-poor, followed by Raskin– Almost 40% of BSM benefits and 33% of
Raskin benefits go to the top half. In contrast, only 27% of BSM benefits and 30% of Raskin benefits go to poor and near-poor HHs in the bottom 20% of the distribution.
BLT is the most pro-poor– Around one-quarter of BLT benefits go
the top half, and 37% to the bottom 20%.
29
0%
10%
20%
30%
40%
50%
Bottom 20% Next 30% Top 50%
Consumption divisions
BLT Jamkesmas Raskin BSM

For all programs, many benefits go to non-target households. However, the new targeting system being developed will improve beneficiary selection
Source and notes: Susenas February 2010, MoF data and World Bank staff estimates.
Share of Benefits to Non-target Households A new targeting system is being established
– In July 2011, a very large new survey of the poor is being conducted.
– Improved data collection methods are being combined with effective household selection methods
Approximately the poorest 40 percent of households can be targeted with the new system
The unified registry in the new system means the full range of social assistance currently enjoyed by households can be determined
30
0
10
20
30
40
50
60
70
80
Raskin BLT Scholarships

Is the response cost-effective? The larger programs spend too little on administration, particularly safeguarding or support operations…
Administrative costs per beneficiaryand as share of total budget
BSM, Jamkesmas and, to a lesser extent, BLT spend too little on safeguarding to ensure good performance – All spend IDR 50,000 per beneficiary (or 5% of
total budgets) or less
Raskin – like food programs worldwide – spends a lot on administration overall, but very little on actual safeguarding– Raskin spends >IDR 200,000 per beneficiary on
administration and has the highest overhead ratio (26%) despite its large scale. However, most of this spending is absorbed by the physical transportation and distribution of rice rather than support operations
PKH spends a reasonable amount on safeguarding considering its pilot status and small scale– Per beneficiary costs for PKH is high, reflecting
its small scale, but administrative overhead ratios have been declining and are now 14%; this trend should continue as the programs expand and realize greater economies of scale. In comparison, the international benchmark for cash transfers is 8% and for well-run CCTs up to 12%
Source and notes: MoF data and World Bank staff estimates. Data for 2009 unless otherwise stated.
31
0%
5%
10%
15%
20%
25%
30%
,0
150000,0
300000,0
450000,0
600000,0
Rupiah cost per beneficiary (LHS)
Administrative overhead ratio
(RHS)
IDR, nominal Percent

…and Raskin in particular is not cost-effective, and the existing PKH probably will not be either, since can benefits accrue long after price shocks recede
Efficiency in benefit delivery (non-benefit costs as share of benefit costs)
BSM seemingly delivers cash benefits ‘efficiently’ –i.e. with minimal overheads – but cannot be considered effective– It spends just 1% per Rupiah delivered to
beneficiaries. However, effectiveness is hampered by poor targeting, inadequate benefits and lack of timeliness
Raskin spends the most but delivers the least and is possibly the least cost-effective program– Raskin spends 35% per Rupiah value of rice
delivered in non-benefit costs
BLT and PKH represent better value for money –balancing efficiency with effectiveness…– These programs spend between 5-16% per
Rupiah delivered
…but PKH and BSM benefits are enjoyed for many years, and may continue to accrue long after prices fall…– Households can enjoy PKH benefits for up to
six years
…and PKH MIS and service providers may not be adequate to cope with significant new intakes
Source and notes: MoF data and World Bank staff estimates. Data for 2009 unless otherwise stated.
32
0%
10%
20%
30%
40%
BSM (MoNE
SD)
BLT (2008-09)
JSPACA JSLU PKH Raskin (2010)
Percent

• Bureaucracy is still a big hurdle for delivering quality public services effective social assistances
• Capacity or more of the mindset?
• Why coordination is difficult
Among central government agencies Central-provincial-district relationshipMindset? Project-oriented? Institutional Rivalry? Leadership?
• Budget Issues
Cycle Channels to direct and allocate resources Audit and evaluation process
• The Case of PKH:
Involves Ministry of Social, Education, Health, and Manpower.
X. COORDINATION, BUREAUCRACY, DECENTRALIZATION
33
Why the Social Protection Programs Performance is not as Expected?

• After decentralization, District Government are the frontline of public services:
Capacity issues
Local Politics
Relationship with the higher level of governments
• Fiscal process is not fully decentralized
Current budget cycle creates lags and bottlenecks
High power at the district government, but lack of instruments to reach villages and the people
• Performance Evaluation
Auditing process emphasis heavily on the “process”
Performance-based budgeting?34
Why the Social Protection Programs Performance is not as Expected?
XI. ATTEMPT TO IMPROVE COORDINATION
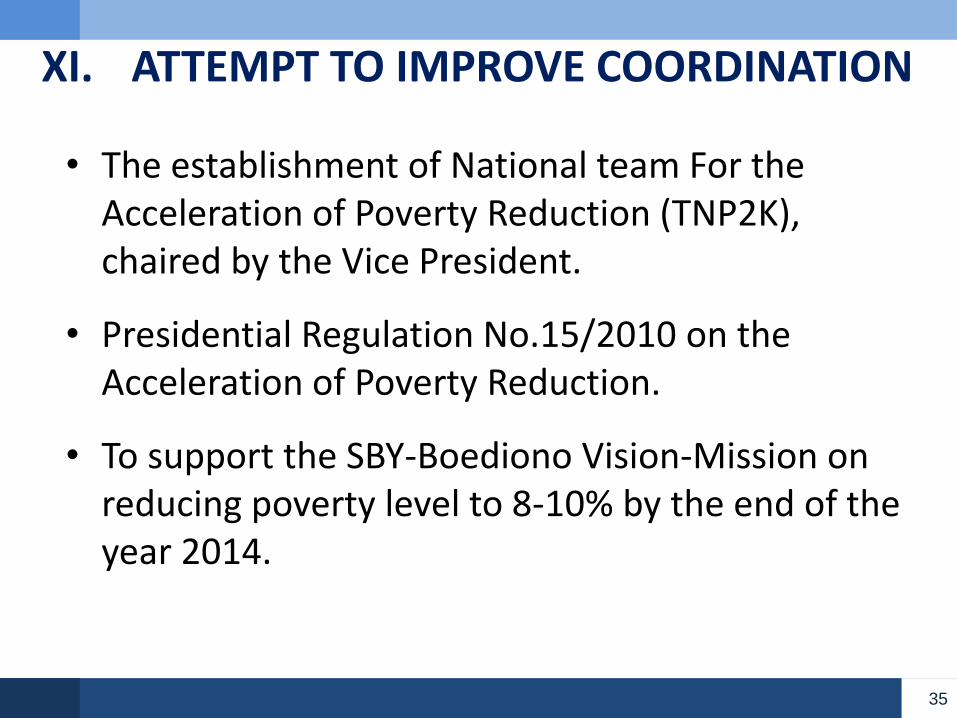
• The establishment of National team For the Acceleration of Poverty Reduction (TNP2K), chaired by the Vice President.
• Presidential Regulation No.15/2010 on the Acceleration of Poverty Reduction.
• To support the SBY-Boediono Vision-Mission on reducing poverty level to 8-10% by the end of the year 2014.
35

POVERTY RATE
36
15,97
17,75 16,58
15,42
14,15
13,33
12,49
12,011,5
10,5
9,5
8,0
13,5
12,5
11,5 10,510,0
2004 2005 2006 2007 2008 2009 2010 2011 2012 2013 2014 2015
Poverty Rate RPJM Target (Optimistic Scenario) RPJM Target (Moderate Scenario)

CLUSTER 1: FAMILY CENTERED INTEGRATED SOCIAL
ASSISTANCE Unification of National Household Targeting System Improving PKH Improving JAMKESMAS
CLUSTER 2: COMMUNITY BASED POVERTY REDUCTION
PROGRAM - PNPM Improving PNPM
CLUSTER 3: POVERTY REDUCTION PROGRAM TARGETED
TO MICRO AND SMALL SIZED ENTERPRISES Formulating Financial Inclusion Strategy
TNP2K Main Priority
37

1963
Embryo of PN TASPEN
1968
PN ASKES, Government Civil Servant and retired Police and Armed
Forces Health Insurance
PN TASPEN, Government Civil Servant Pension Program
PN ASABRI, Police and Armed Forces Pension Program
1977
PT Asuransi Tenaga Kerja (ASTEK), embryo of PT JAMSOSTEK,
Social Protection Scheme for formal workers
1992
JAMSOSTEK LAW
Health Protection, work accident Protection, Old Age Protection,
scheme, Life Insurance scheme.
XII.THE POLITICAL ECONOMY OF NATIONAL SOCIAL PROTECTION SYSTEM (SJSN)
38
Evolving Toward a National Comprehensive Social Security

• Supreme Advisory Council (DPA) in 2000, sent a letter to the President to urge forming a National Social Security Administering Body that integrates all existing social security administering bodies.
• Amendment of Constitution 2001, article 34 (2): The State shall develop a system of Social Security for all of the people and shall empower the underprivileged in society.
• People Assembly Decree No. X, 2001, Order the President to establish a National Social Security System.
• In March, 2001, Formation of a National Social Security System Working Group.
• SJSN Law was signed in 19 October, 2004.
Health Protection
Working accident protection
Old Age Protection
Pension Plan
Life Insurance scheme
Defined Contribution
Government will pay contribution for the poor
39
The Long Way Of Making a Consensus
NATIONAL SOCIAL SECURITY SYSTEM (SJSN)

• Judicial Review of the SJSN Law
Within four months after SJSN law passed, on February 21, 2005, the SJSN law had been presented for judicial review. This judicial review was proposed by representatives of East Java parliaments and Jawa timur Public Health Insurance administering body. The plaintiff claimed that SJSN law undermined their constitutional rights and responsibilities, hence it is in contrary with the 1945 Constitution.
The Plaintiff also claimed that the Central Government (the Ministry of Health) had interpreted the SJSN Law unilaterally by appointing PT ASKES as Manager of the Health Insurance Program for Poor People (JAMKESMAS).
The ruling was announced on 31st August, 2005. Rule that article 5 clauses (2), (3), and (4) of SJSN Law are not legally Binding. Clauses (2), (3), and (4) basically is a statement to convert PT ASKES, PT TASPEN, PT ASABRI, and PT JAMSOSTEK into Single Social Security Administering Body. Articles 5 clause (1) states that Social Security Administering Body should be establish by LAW. This is the remaining clause left. Hence, open an opportunity for the Regional Government to establish a Social Security Administering Body.
After this ruling nothing happen. The National Social Security Council was established in September 2008.
40
The Long Way Of Making a Consensus
NATIONAL SOCIAL SECURITY SYSTEM (SJSN)

Lack of political will or technically the current SJSN Law is just not feasible and sustainable?
The intention of team that drafting the law, SJSN should be based on defined contribution, so it is fully funded, except for the poor the government will contribute and only for the health protection. And implementation should be gradually up to 20 years.
for some reasons labor unions, employer, and political parties perceive it as everything will be covered immediately universally.
Creates resistance from the employer, government, and even from the unions.
The Judicial review complicated the matter.
41
The Long Way Of Making a Consensus
NATIONAL SOCIAL SECURITY SYSTEM (SJSN)

In July, 2010, the Indonesia Parliament use their “Initiative Rights” drafting the Law of National Social Protection Administering Body (BPJS).
The government in the defensive mode, formed a team consist of 8 ministers, chaired by the minister of finance. The President asks the Vice President to supervise the whole process.
Main area of disputes:
1. Is the law of BPJS should only establishing BPJS or also contains details regulations of how BPJS operates. The Government doesn’t agree if contains details regulations.
42
The Long Way Of Making a Consensus
NATIONAL SOCIAL SECURITY SYSTEM (SJSN)
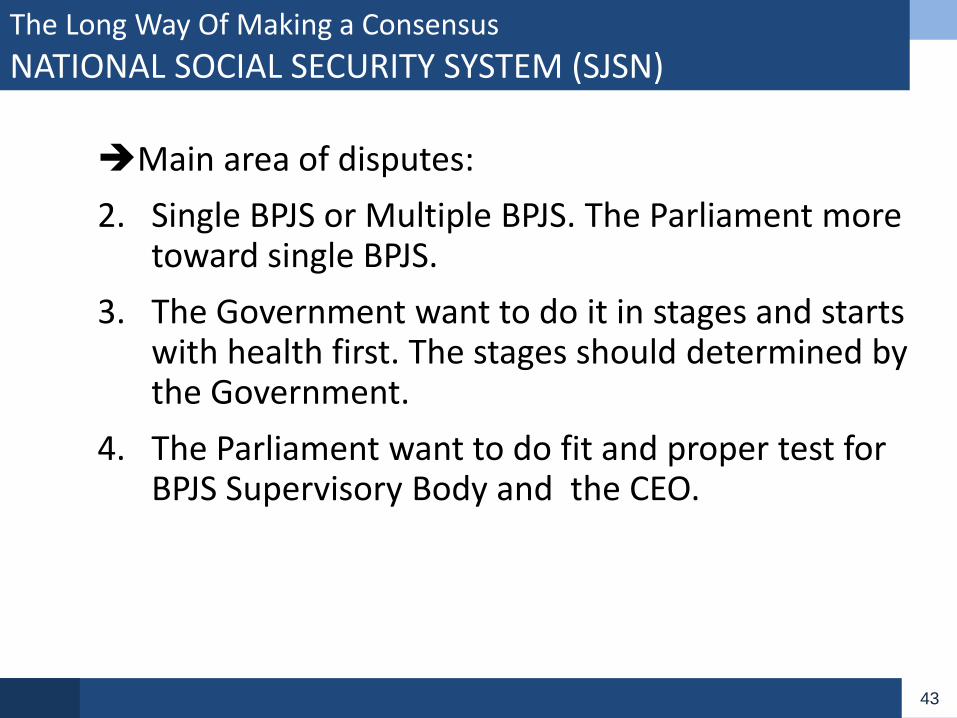
Main area of disputes:
2. Single BPJS or Multiple BPJS. The Parliament more toward single BPJS.
3. The Government want to do it in stages and starts with health first. The stages should determined by the Government.
4. The Parliament want to do fit and proper test for BPJS Supervisory Body and the CEO.
43
The Long Way Of Making a Consensus
NATIONAL SOCIAL SECURITY SYSTEM (SJSN)

Compromises and Prospect
Still on going process
After several meeting chaired by the Vice President and hundreds of meeting between the Parliament and the 8 ministers:
1. BPJS Law will only mandate to establish the Body with without details on how BPJS works. But still contain some general principles on how BPJS works.
2. Only 2 BPJS will be established. Base on “short term” or “long term” social protection contract. First, is Health related BPJS, second is the BPJS related to “old age”.
3. Health related BPJS will start first.
4. Supervisory Body and CEO will be appointed by the Government
44
The Long Way Of Making a Consensus
NATIONAL SOCIAL SECURITY SYSTEM (SJSN)

45
PT ASKES BPJS I
PT JAMSOSTEK BPJS II
PT TASPEN TASPEN(HIGHER PENSION PROTECTION)
PT ASABRI
Scenario of Transformation
ASABRI(HIGHER PENSION PROTECTION)
The Long Way Of Making a Consensus
NATIONAL SOCIAL SECURITY SYSTEM (SJSN)

KONDISI TERKINI PELAKSANAAN PROGRAM KELUARGA HARAPAN (PKH)
THANK YOU

TASKS OF THE NATIONAL TEAM
a. Design, plan and budgeting for poverty reduction
policies and programs;
b. Synergize, synchronize, harmonize, and integration
of poverty reduction policies and programs;
c. Supervise and control the implementation of the
poverty reduction programs and activities.
47

MEMBERS OF THE NATIONAL TEAM
- Chairman : Vice President
- Vice Chairman I : Coordinating Minister for People’s Welfare
- Vice Chairman II : Coordinating Minister for Economy
- Executive Secretary
: Deputy for Social Welfare and
Poverty Alleviation, Office of the Vice President
48
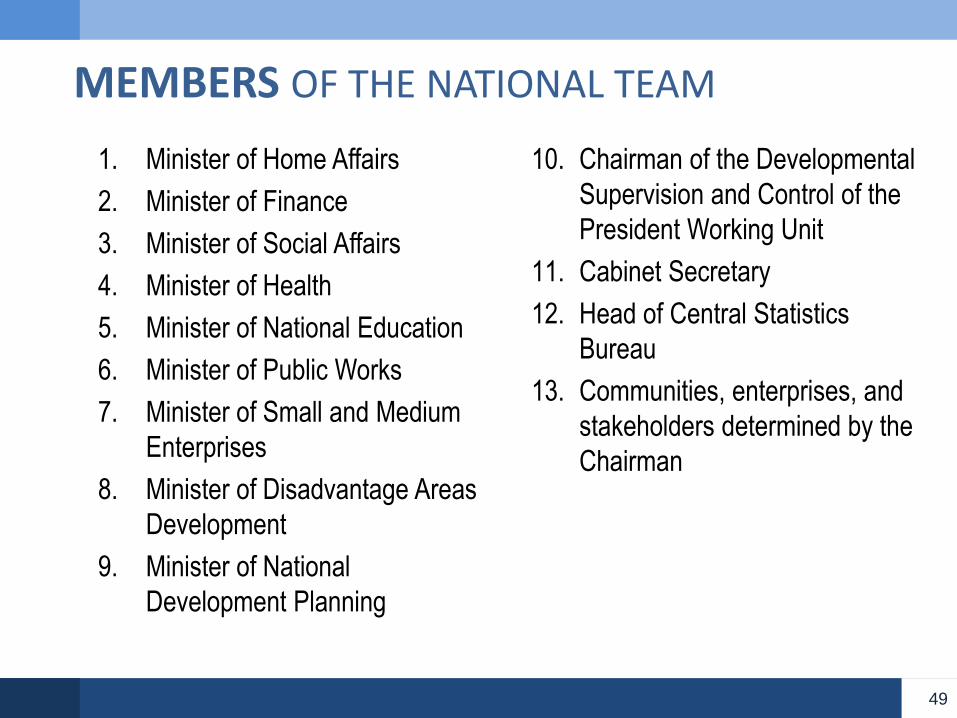
1. Minister of Home Affairs
2. Minister of Finance
3. Minister of Social Affairs
4. Minister of Health
5. Minister of National Education
6. Minister of Public Works
7. Minister of Small and Medium
Enterprises
8. Minister of Disadvantage Areas
Development
9. Minister of National
Development Planning
10. Chairman of the Developmental
Supervision and Control of the
President Working Unit
11. Cabinet Secretary
12. Head of Central Statistics
Bureau
13. Communities, enterprises, and
stakeholders determined by the
Chairman
MEMBERS OF THE NATIONAL TEAM
49

ORGANIZATION STRUCTURE OF THE NATIONAL TEAM
50
CHAIRMAN VICE PRESIDENVICE CHAIRMAN I COORDIANTING MINISTER FOR PEOPLE’S WELFAREVICE CHAIRMAN II COORDINATING MINISTER FOR ECONOMY
MEMBERS
Financing Tim
MINISTER OF NATIONAL DEVELOPMENT PLANNING
EXECUTIVE SECRETARYDEPUTY FOR SOCIAL WELFARE AND POVERTY ALLEVIATION, OFFICE OF THE VICE PRESIDENT
Task Force For Family Based Integrated Social Assistances
Vice Presiden Office
Task Force For Community Based Poverty Reduction Programs/ PNPM Mandiri
Coord. Ministry for People’s Welfare Office
Task Force For Strengthening Micro dan Small Enterprise Based Poverty Reduction Programs
Coord. Ministry for Economy Office

SECRETARIAT OF THE NATIONAL TEAM
51

FINANCING TEAM OF THE NATIONAL TEAM
FINANCING TEAM
CHAIR : MINISTER OF NATIONAL DEVELOPMENT PLANNING
DOMESTIC FINANCE
(STATE BUDGET REVENUES AND EXPENDITURES)
FOREIGN GRANT FINANCE
(MULTIDONORS)
52