the potential for natural ventilation as a viable passive ... monitoring methodology: given that...
TRANSCRIPT

Dima Albadra is a PhD candidate at the University of Bath, Bath, UK. Stephen Lo is a senior lecturer in Sustainable Environmental Engineering at the Department of Architecture and civil engineering, University of Bath, Bath, UK.
The Potential for Natural Ventilation as a
viable Passive Cooling Strategy in Hot
Developing Countries
Dima Albadra, MSc Stephen Lo, PhD University of Bath University of Bath
ABSTR ACT
Natural ventilation offers opportunities for reducing cooling energy-demand at low-cost in
developing countries with limited resources. In this paper the natural day- and night-time ventilation
potential for cooling in hot-arid and hot-humid Mediterranean climates is characterised against the key
weather and building parameters affecting its performance. In particular, the study seeks to quantify the
limits of outdoor environmental conditions under which natural ventilation is an effective strategy for
achieving thermal comfort. Furthermore, the study explores the effects of certain building
characteristics that enhance the performance of natural ventilation such as ventilation rates and thermal
mass. This is achieved by short-term environmental monitoring and dynamic energy modelling of
selected naturally ventilated domestic buildings in Lebanon and Jordan. The summer monitoring regime
compared external and internal temperatures, relative humidity and air velocity in free-running ‘well-
designed’ buildings in order to identify the external environmental limits for effective day- and night-
time ventilation. Computer modelling of the monitored buildings was undertaken using IES VE to
determine the design parameters affecting the performance of natural ventilation. Initial results show
that computer modeling overestimate ventilation rates through windows with Venetian shutters.
INTRODUCTION
Natural ventilation is considered one of the simplest passive cooling strategies that allow the
provision of a comfortable indoor environment at low operating costs. The two most beneficial natural
ventilation regimes were considered:
• Day time ventilation DTV (direct cooling); when buildings are ventilated during the day, and internal
temperature and humidity are expected to follow closely external environmental conditions. DTV can
enhance occupant comfort through higher indoor air velocities so DTV should only be applied when
outdoor temperatures are within comfort limits and acceptable indoor air speed may be achieved,
(Givoni, 1998).
• Night time ventilation NTV (indirect cooling); where buildings are ventilated only at night can reduce
the peak internal temperatures from external levels by pre-cooling the interior exposed thermal mass of a
building.
Many studies have been conducted to examine the potential of natural ventilation and the effect of
different parameters on its performance. De Graca, Chen, Glicksman and Norford (2001), investigated
DTV and NTV for an apartment building in Beijing and Shanghai. Shaviv, Yrzioro and Capeluto (2001),
assessed the potential of NTV in terms of the reduction in maximum internal temperature as a function
30th INTERNATIONAL PLEA CONFERENCE16-18 December 2014, CEPT University, Ahmedabad
1
of the diurnal temperature swing. They concluded that in hot-humid Mediterranean climates a reduction
of 3-6° C could be achieved by NTV depending on the level of thermal mass, air change rate and diurnal
temperature swing. Artmann, Manz and Heiselberg (2008), conducted a parameter study on the
performance of NTV for different moderate climates, building constructions, heat gains, air flow rates
and heat transfer coefficients. The study found that even with moderate air change rates, overheating
degree hours were considerably reduced by NTV. Yao, Li, Steemers and Short (2009) summarised
current research on the potential of natural ventilation in two categories, the first focused on the
calculation of ventilation driving forces (wind or stack effect) and the second on calculation of internal
air temperature using computer thermal simulation or CFD programs.
All the above studies used dynamic computer modelling tools in their assessment of natural
ventilation. The vast majority of recent research on real naturally ventilated buildings was conducted to
assess air quality or thermal comfort expectations and boundaries and were mostly related to studies on
the adaptive thermal comfort theory. Fewer studies report on actual monitored cooling performance of
naturally ventilated buildings. Examples of such studies are, Kolokotroni, Webb and Hayes (1998) on
the applicability of NTV as a summer cooling strategy for office buildings by taking field temperature
measurements. The results found that internal temperature was up to 4°C lower than the external
temperature at the start of the following working day; however, due to internal gains the internal
temperature had risen again by midday. Givoni (1998) examined fan assisted night ventilation for both
shaded and unshaded windows in San Diego with three different levels of thermal mass levels, (light,
medium and heavyweight). The study found that higher thermal mass lowered the maximum internal
temperatures by 2°C and that they remained lower than external air temperatures throughout the day.
However, buildings with low thermal mass failed to reduce internal temperatures below outside
conditions and in some cases interior temperatures were higher. Based on this and several other studies
on natural ventilation Givoni developed building bioclimatic charts BBCC with recommended
boundaries for the external environmental conditions under which natural ventilation would be an
effective strategy.
It is well established that there are also key supporting factors for successful natural ventilation,
namely adequate shading to limit unwanted excess solar heat gains, limiting internal heat gains from
appliances, appropriate thermal mass and insulation. However, there is a lack of post-occupancy
performance data from naturally ventilated buildings in hot climates where such strategies were applied.
Most post-occupancy studies focus on the energy consumption of buildings rather than their passive
performance. Computer simulation tools are widely used to predict the performance of natural
ventilation without validation through real building monitoring. This paper reports on the monitoring of
two naturally ventilated, best practice, new domestic buildings. Short-term environmental performance
monitoring was conducted to establish the true natural ventilation potential of ‘well-designed’ buildings.
The monitoring results were compared with the natural ventilation potential suggested by Givoni’s
BBCC, and then the performance predicted by Dynamic building simulation tool IES.
METHODS:
The selected buildings:
1. Aqabba house AREE: a three story house, with a total floor area is 235 m2. The house was
designed to be a prototype for low energy houses in the Aqabba region in hot-arid climates of
Southern Jordan; it has 45 cm thick cavity walls of concrete blocks.
2. Casa Batroun: First and only BREEAM excellent awarded house in in the hot-humid climate of
the eastern Mediterranean region of Lebanon, The house is separated into a ground floor flat
and a 1st floor flat with two different constructions, masonry and timber, respectively.
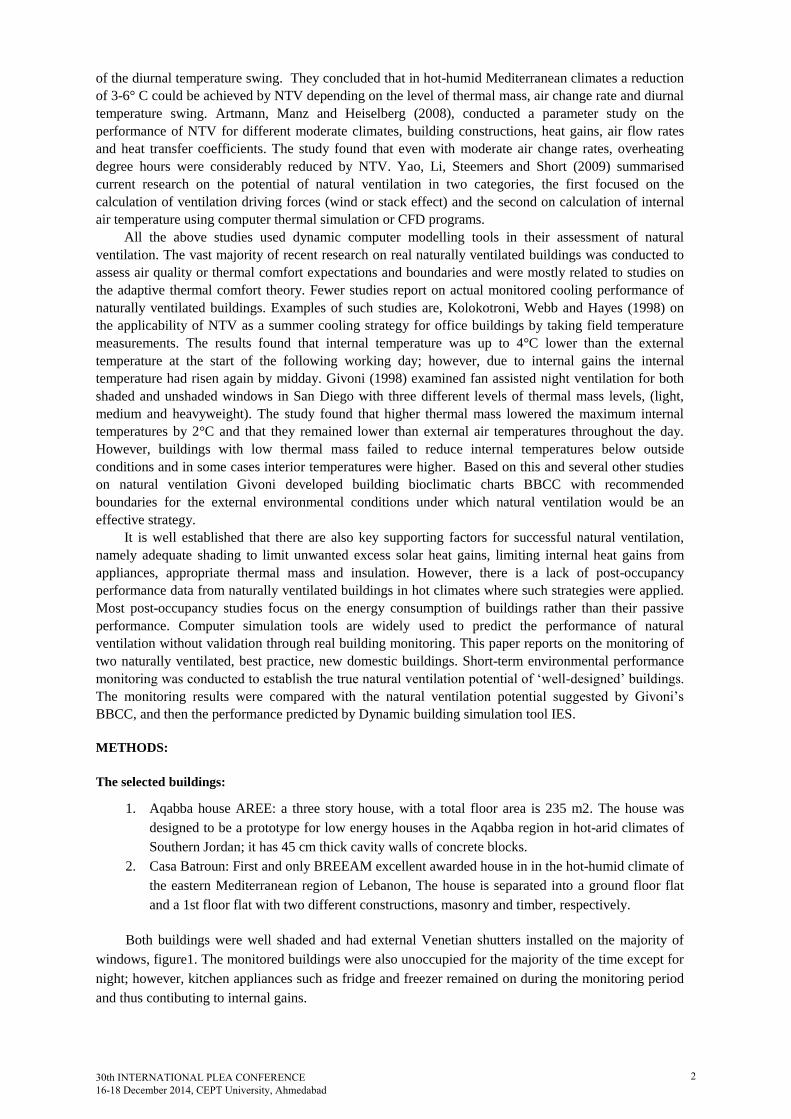
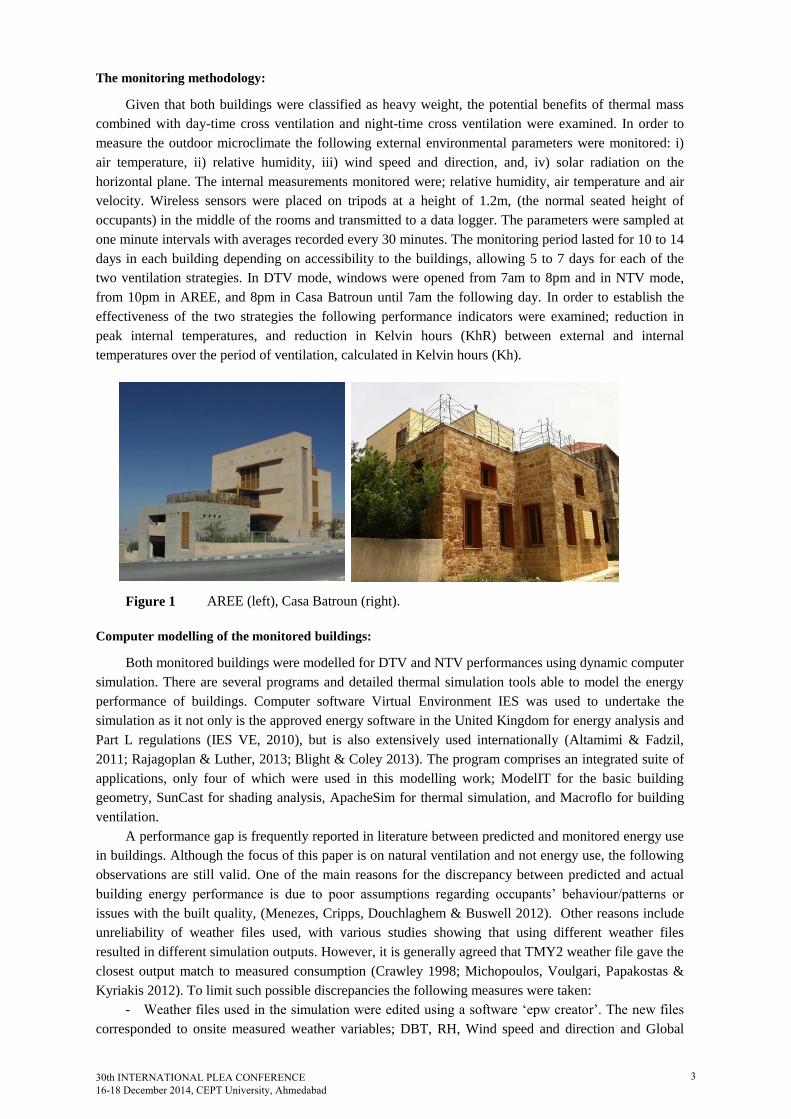
Both buildings were well shaded and had external Venetian shutters installed on the majority of
windows, figure1. The monitored buildings were also unoccupied for the majority of the time except for
night; however, kitchen appliances such as fridge and freezer remained on during the monitoring period
and thus contibuting to internal gains.
30th INTERNATIONAL PLEA CONFERENCE16-18 December 2014, CEPT University, Ahmedabad
2
The monitoring methodology:
Given that both buildings were classified as heavy weight, the potential benefits of thermal mass
combined with day-time cross ventilation and night-time cross ventilation were examined. In order to
measure the outdoor microclimate the following external environmental parameters were monitored: i)
air temperature, ii) relative humidity, iii) wind speed and direction, and, iv) solar radiation on the
horizontal plane. The internal measurements monitored were; relative humidity, air temperature and air
velocity. Wireless sensors were placed on tripods at a height of 1.2m, (the normal seated height of
occupants) in the middle of the rooms and transmitted to a data logger. The parameters were sampled at
one minute intervals with averages recorded every 30 minutes. The monitoring period lasted for 10 to 14
days in each building depending on accessibility to the buildings, allowing 5 to 7 days for each of the
two ventilation strategies. In DTV mode, windows were opened from 7am to 8pm and in NTV mode,
from 10pm in AREE, and 8pm in Casa Batroun until 7am the following day. In order to establish the
effectiveness of the two strategies the following performance indicators were examined; reduction in
peak internal temperatures, and reduction in Kelvin hours (KhR) between external and internal
temperatures over the period of ventilation, calculated in Kelvin hours (Kh).
Figure 1 AREE (left), Casa Batroun (right).
Computer modelling of the monitored buildings:
Both monitored buildings were modelled for DTV and NTV performances using dynamic computer
simulation. There are several programs and detailed thermal simulation tools able to model the energy
performance of buildings. Computer software Virtual Environment IES was used to undertake the
simulation as it not only is the approved energy software in the United Kingdom for energy analysis and
Part L regulations (IES VE, 2010), but is also extensively used internationally (Altamimi & Fadzil,
2011; Rajagoplan & Luther, 2013; Blight & Coley 2013). The program comprises an integrated suite of
applications, only four of which were used in this modelling work; ModelIT for the basic building
geometry, SunCast for shading analysis, ApacheSim for thermal simulation, and Macroflo for building
ventilation.
A performance gap is frequently reported in literature between predicted and monitored energy use
in buildings. Although the focus of this paper is on natural ventilation and not energy use, the following
observations are still valid. One of the main reasons for the discrepancy between predicted and actual
building energy performance is due to poor assumptions regarding occupants’ behaviour/patterns or
issues with the built quality, (Menezes, Cripps, Douchlaghem & Buswell 2012). Other reasons include
unreliability of weather files used, with various studies showing that using different weather files
resulted in different simulation outputs. However, it is generally agreed that TMY2 weather file gave the
closest output match to measured consumption (Crawley 1998; Michopoulos, Voulgari, Papakostas &
Kyriakis 2012). To limit such possible discrepancies the following measures were taken:
- Weather files used in the simulation were edited using a software ‘epw creator’. The new files
corresponded to onsite measured weather variables; DBT, RH, Wind speed and direction and Global
30th INTERNATIONAL PLEA CONFERENCE16-18 December 2014, CEPT University, Ahmedabad
3

solar radiation. Diffused and direct normal radiation were calculated from the measured data and
included in the new weather files.
- Occupancy profiles: Both monitored buildings were unoccupied for the majority of time, at
durations were there was limited occupancy, detailed use of the building was recorded and reflected in
the model.
- Information on the buildings’ material specifications and constructions were provided by the
architect and consultants (Karkoor, Visser 2013). However, issues with poor build quality and
inaccuracies in the specifications of locally produced materials may still exist.
RESULTS:
DTV & NTV monitoring of AREE:
Main observations, figure 2:
1) Up to 7K reduction in maximum temperature from external maxima with DTV and up to 9K
with NTV. The lowest recorded temperatures were on the ground floor in the north-east room L0R3.
The highest recorded internal temperatures were in room L1R4 on the 1st floor corridor, which had a
south-west-west facing window and higher glazing ratio than other rooms. Additionally, this room had
an external overhang while most other rooms had Venetian shutters.
2) Using NTV the day time internal temperature increased by only 2K compared to night time
levels.
To quantify and compare the overall performance, the Reductions in Kelvin degree hours (KhR)
between internal and external temperatures were calculated and are shown in figure 3. Higher values of
Kelvin degree hours indicate better ventilation/cooling performance.
Figure 2 a) Internal peak temperatures for DTV (left), b) for NTV (right) at AREE.
It is apparent from figures 2 & 3 that NTV has a better cooling potential than DTV for the hot arid
climate of Aqabba, because of lower peak temperatures and more extended periods of reduction from
outdoor temperatures. However, even with NTV internal temperatures remained above 30°C at all times
during the monitoring period in peak summer.
GFGF
Tem
per
atu
re °
C
30th INTERNATIONAL PLEA CONFERENCE16-18 December 2014, CEPT University, Ahmedabad
4

Figure 3 Kelvin degree hour reduction from external temperature levels, DTV, NTV average
KhR=53.2Kh, 72Kh respectively, a 36.8% increase from DTV.
DTV & NTV monitoring of Casa Batroun:
Similar observations to AREE were made in terms of the reduction in internal temperature.
However, more interestingly the performance of the two different floors differed significantly.
Temperatures in the top flat were higher than the ground floor flat, (shown in figure 4), because; a) the
ground floor was better shaded by nearby trees and adjacent buildings, b) the 1st floor had a higher
exposed surface area resulting in additional solar gains through the roof, and walls, c) the effect of the
ground floor’s higher thermal mass in storing coolth was more noticeable with NTV, where day time
internal temperatures remained only 2K higher than night time levels. As for KhR an average
KhR=44.5Kh, 61Kh for DTV and NTV, respectively, which is a 37% increase for NTV from DTV.
Figure 4 Internal temperatures in the Ground floor (masonry construction) in red, 1st floor (timber
construction) in green at Casa Batroun, a) DTV (right), b) NTV (left).
Figure 5 a) internal peak temperatures for DTV (left); b) for NTV (right) at Casa Batroun.
Tem
per
atu
re °
C
Tem
per
atu
re °
C
30th INTERNATIONAL PLEA CONFERENCE16-18 December 2014, CEPT University, Ahmedabad
5

The monitored data of both buildings indicated that, the internal relative humidity followed external
RH very closely. Recorded airspeed in the middle of the rooms that had Venetian shutters was minimal,
while a maximum of 0.4m/s was recorded in a room that had an open terrace door with no shutters. Such
low air velocities mean that relying on naturally driven air movement to provide cooling sensation for
occupants is not possible.
Building Bioclimatic charts BBCC:
BBCC offer an easy method for initial assessment of the potential of a passive design strategy at
early design stages. It suggests a comfort zone and the boundaries of climatic conditions within which
DTV and NTV and other passive strategies can provide comfort. The boundaries are plotted on a
conventional psychrometric chart. The best-known BBCCs are those developed by Givoni (lomas, Fiala,
Cook & Cropper 2004). In this study, although internal temperatures remained above comfort levels for
the majority of the time, the enhancement of internal conditions when adopting DTV strategy is much
higher than that expected in conventional buildings, or of that suggested in Givoni’s BBCC; where it
was limited to only 2K reduction. One possible explanation for this discrepancy between the findings of
Givoni and those observed in this study, is that Givoni based his work on the monitoring of ‘thermally
heavy’ buildings which had only 10cm thick concrete walls with insulation (Givoni, 1988), while AREE
and Casa Batroun had about 45cm thick walls. On the other hand, for NTV the BBCC suggests up to 8K
extension of the comfort zone which is consistent with the results reported in this paper. Therefore,
based on the initial results of this study, high mass, well insulated and well shaded buildings, with
limited internal heat gains would exhibit boundaries for DTV and NTV as shown in figure 6.
Figure 6 Givoni’s BBCC for developing countries with new suggested boundaries for DTV.
IES modeling results:
The initial analysis of DTV performance has resulted in the model over predicting the rise in
internal temperature in both models (figure 7a). In other words, the buildings performed better in reality
than predicted by the simulation software. Similarly in NTV analysis (figure 7b), predicted temperatures
dropped down below measured values during ventilation periods and increased above monitored levels
during day-time. Clearly there was a discrepancy between measured and modelled results and the
building seemed to perform better than predicted through simulation. The following sensitivity analysis
was undertaken to identify the reasons behind such a gap.
30th INTERNATIONAL PLEA CONFERENCE16-18 December 2014, CEPT University, Ahmedabad
6

Figure 7 comparison between modelled and monitored results for one room in AREE, a) DTV (left),
b) NTV (right).
Sensitivity analysis:
1. Thermal mass: a range of thermal capacities were modelled, by increasing either the specific
heat capacity of materials or their density, each material specification was increased to its highest
realistic value as given in CIBSE guide A. Although such increases resulted in aligning the monitored
and modelled temperatures closer when windows were closed, it had no significant impact when
windows were opened. During ventilation hours, the model behaved in a similar way to the base case
model. This indicated that the main issue could be in higher predicted ventilation rates.
2. Ventilation rates: most windows in both buildings had louvered Venetian shutters installed in
addition to bug meshes, which will have an impact on the airflow rate through these windows. Macroflo
allows the user to choose a window type for each window; louvered windows were chosen for windows
with Venetian shutters. Data inputs required were the openable area and the discharge coefficient CD. A
discharge coefficient relates the volume flow rate through an orifice to its area and the applied pressure
difference (Karave, Stathopoulos & Athientis 2007). Several parameters affect the CD; these parameters
are the opening area, wind speed, wind incident angle, and location of the opening in the façade (Karava,
Stathopoulos & Athientis 2004). Due to the difficulty in determining the CD without testing, a range of
discharge coefficients were considered. The discharge coefficient for a sharp edged orifice such as a
window is usually taken as approximately 0.6 to 0.65 (ASHRAE fundamentals 2009), manufacturers’
data showed that louvered ventilators CD ranged from 0.3 to 0.1 (Renson 2009; Architectural louvers
2007). Therefore, a series of simulations with different CD was conducted. 5 cases were studied with CD
equaling 0.4, 0.3, 0.2, 0.1 and 0.05. For every 0.1 reduction in CD, a reduction of approximately 25%
was achieved in air change rates ach for the house. However, not even the lowest ventilation rates
achieved (8 to 20ach, for CD = 0.05) brought the predicted internal temperatures significantly closer to
the measured ones, figure 8 (a). Going below CD = 0.05 is realistically not possible as it results in an
effective orifice area < 3% of window area. Figure 9 (a) shows the airflow in L0R5 for different CD, (b)
shows airflow in different rooms for CD = 0.3.
Tem
per
atu
re °
C
30th INTERNATIONAL PLEA CONFERENCE 16-18 December 2014, CEPT University, Ahmedabad
7

Figure 8 AREE DTV measured and modelled internal temperatures, a (left), b (right).
Figure 9 AREE DTV a) airflows l/s in L0R5 (left), b) air flows l/s for CD = 0.3 (right).
IES provides an option where Macroflo can be turned off and ventilation introduced through
ApacheSim as natural or auxiliary ventilation. In order to determine the ventilation rate that would bring
predicted temperatures down to the monitored levels; natural ventilation was introduced starting from
1ach to 10ach in addition to a continuous infiltration rate equal to 1ach. As could be seen in figure 8b,
higher ventilation rates resulted in higher internal temperatures and the best match to monitored internal
temperatures was achieved for 1ach. Additionally, low ventilation rates resulted in a mismatch in some
observed ventilation patterns, such as the drop in internal temperature early in the morning when
windows are first opened, as seen in Figure 8b.
DISCUSSION:
It was not possible to determine the actual ventilation rates in the monitored buildings as no such
measurements were taken onsite. However, the recorded airspeeds in the middle of rooms indicated that
there was a considerable air movement in some rooms which had no Venetian shutters, yet internal
temperatures were much lower than predicted by the model. The model only achieved similar internal
temperatures to the measured ones when there was very little to no ventilation. This indicates that
whenever the modelled building is ventilated, internal temperatures closely follow external DBT
regardless of the levels of thermal mass or ventilation rates. Additionally, it is clear from the sensitivity
analysis that there is an issue in representing open windows in computer dynamic simulation tools such
as IES because very high ventilation rates were predicted even for very small CD. A study by Coley
(2008) on top hung window performance in IES found that the ventilation rate depends, to a great extent,
on how the windows are represented, whether as a vertical ‘arrow slit’ hole in the wall or as a horizontal
‘letter box’ opening. False representation can result in up to four times higher airflows. Although IES
provides an option for windows with louvers, their representation is not clear. Other parameters may be
causing this performance gap and require further detailed investigation.
30th INTERNATIONAL PLEA CONFERENCE16-18 December 2014, CEPT University, Ahmedabad
8

CONCLUSIONS:
The study presented investigated the free-running performance of two well-designed buildings in
hot climates. The study found that up to 6K reduction could be expected for DTV and 9K for NTV.
These findings were compared to previous studies and plotted on BBCC. Using computer modelling
tools is a widely used approach for evaluating the performance of natural ventilation. Therefore, the
monitored buildings were then modelled using computer software IES VE, in order to validate such an
approach. The initial modelling of both buildings predicted higher internal temperatures than
experienced in reality. A sensitivity analysis for AREE was conducted, thermal mass and ventilation
rates were analysed. It was found that a ventilation rate of 1ach gave the closest match to monitored
values. Low air-change rates however, were not possible to achieve in IES through opening windows in
Macroflo, but rather it should be introduced in the thermal model ApacheSim as a fixed natural
ventilation rate. Further investigation is required in order to fully understand how best to represent
complex windows geometries in computer models, as this variable has a great impact on ventilation rates
and consequently the internal temperatures. Further research is needed to identify other key factors
responsible for the performance gap.
REFERENCES
Al-Tamimi, N & Fadzil, S. (2011). The potential of shading devices for temperature reduction in high-
rise residential buildings in the tropics. Procedia Engineering, 21:273–282
Architectural louvers., (2007). Louver Performance data. Retrived June 8, 2014 from:
http://www.archlouvers.com/louvers/drawings/E2JS.pdf
Artmann, A., Manz, H., & Heiselberg, P. (2008). Parameter study on performance of building cooling by
night-time ventilation. Renewable energy,33: 2589-2598
ASHRAE. (2009). ASHRAE Handbook-Fundamentals. Atlanta: American Society of Heating
Refrigeration and Air Conditioning Engineers, Inc.
Blight, T & Coley, D. (2013). Sensitivity analysis of the effect of occupant behaviour on the energy
consumption of passive house dwellings. Energy and Buildings, 66: 183-192
CIBSE, (2006). CIBSE Guide A – Environmental design. Norfolk: CIBSE Publications.
Coley D. (2008). Representing top hung windows in thermal models. International journal of ventilation, 7: 151-158
Crawley, D. (1998). Which weather data should you use for energy simulations of commercial
buildings? ASHRAE 1998 Transactions, 104 part 2
De Graca, G., Chen, Q., Glicksman, L., & Norford, L. (2001). Simulation of wind-driven ventilative
cooling systems for an apartment building in Beijing and Shanghai. Energy and building , 1-11.
Givoni, B. (1998). Climate considerations in building and urban design. New York: John Wiley & sons
IES VE Integrated environmental solutions, (2010). Free IES VE-SBEM Approved for 2010 Regulations.
Retrieved June 9, 2014 from: http://www.iesve.com/news/free-ies-ve-sbem-approved-for-2010-
regulations_1674_/corporate
Karava, P., Stathopoulos, T & Athienitis, A. (2007). Wind-induced natural ventilation analysis. Solar
Energy, 81: 20-30
Karava, P., Stathopoulos, T & Athienitis, A. (2004). Wind driven flow through openings: A review of
discharge coefficients. International Journal of Ventilation, 3: 255-266
Karkour, M., ([email protected]), September 02, 2013. Casa Batroun. Email to Albadra. D
Kolokotroni M, Webb BC, Hayes SD. (1998). Summer cooling with night ventilation for office
buildings in moderate climates. Energy buildings, 27: 231-237.
Lomas, K., Fiala, D., Cook, M., Cropper, P. (2004). Building bioclimatic charts for non-domestic
buildings and passive downdraught evaporative cooling. Building and environment, 39: 661-676.
Menezes, A., Cripps, A., Douchlaghem, D., Buswell, R.. (2012). Predicted vs. actual energy
performance of non-domestic buildings: Using post-occupancy evaluation data to reduce the
performance gap. Applied energy, 97: 335-364.
Michopoulos A, Voulgari V, Papakostas K, Kyriakis N. (2012). Evaluation of different weather files on
energy analysis of Buildings. International journal of energy and environment, 3, pp.195-208.
30th INTERNATIONAL PLEA CONFERENCE 16-18 December 2014, CEPT University, Ahmedabad
9

Rajagopalan P & Luther, M., (2013). Thermal and ventilation performance of a naturally ventilated sport
hall within an aquatic centre. Energy and Buildings, 58: 111- 122
Renson., (2009). Louvre panels and grilles, retrived June 8, 2014 from:
http://www.alunor.no/images/Marketing/kataloger/Renson/louvres_eng.pdf
Shaviv, E., Yezioro, A., & Capeluto, I. (2001). Thermal mass and night ventilation as passive cooling
design strategy. Renewable energy, 24: 445-452.
Visser, F., ([email protected]), January 07, 2013. AREE. Email to Albadra. D
Yao, R., Li, B., Steemers, K., Short, A. (2009). Assessing the natural ventilation cooling potential of
office buildings in different climatic zones in China. Renewable Energy, 34: 2697-2705
30th INTERNATIONAL PLEA CONFERENCE16-18 December 2014, CEPT University, Ahmedabad
10