the powder’s inability to flow
TRANSCRIPT

Comparison of Binder Jetting Additive Manufacturing to Press and Sinter 316L Stainless Steel
Alexander Zwiren, Thomas F. Murphy
GKN Hoeganaes
1001 Taylors Lane, Cinnaminson NJ 08077
Although the fabrication method of Binder Jetting Additive Manufacturing (AM) is completely different
to typical compaction methods in traditional Powder Metallurgy (PM); the technological intersection is a
need for sintering of the “green” parts. In this study, comparisons are made between the two production
methods in regards to their overall density, mechanical properties, microstructure, and pore structure as a
result of sintering variations. Vacuum sintered binder jetting 316L mechanical test samples exhibited
robust mechanical properties in relation to the sintered density (7.3 g/cm3) of the tested sample due to the
unique combination of fine powder size (D50~ 10 µm), production method, and sintering method. This is
analyzed and explained through porosity and microstructural analyses in comparison to typical press and
sinter results. The sintering conditions in this study vary from sintering via vacuum furnace, tube furnace,
and belt furnace; sintering in temperature ranges from 1260 °C to 1380 °C in two hydrogen atmosphere
conditions, a hydrogen partial pressure and 100% hydrogen.
Introduction
Binder-jetting additive manufactured parts are dependent on two significant features; the properties of the
metal powder and the sintering conditions. Prior studies have shown that as particle size decreases, the
sinterability of components increases, resulting in higher levels of densification.6 Yet, the major
drawbacks for using extremely fine powder as the feedstock material are the powder’s inability to flow
through current binder jetting systems in addition to the higher cost. The fine powder is prone to
agglomeration in the hoppers and necessitates an alternative or tailored method of dispensing. Once a
method of printing this very fine powder has been established, there still remains the process of sintering
the printed parted. Due to the low green density of the binder jetted parts, high temperature sintering is
necessary to achieve the sintered densities where mechanical properties are at the minimums for practical
applications. This study focuses on the results of binder jetting 316L tensile samples after sintering in the
temperature range of 1288 °C (2300 °F) to 1380 °C (2516 °F). Although sintering at such high
temperatures increases the sintered density of the binder jetted parts, there are influences that the high
temperatures have on the part’s microstructure, the porosity that will inherently remain, and the overall
shape of the final as-sintered parts, Figure 1. These features have major influences on the mechanical
properties and in some cases, to be shown later, yield comparable results to traditional manufacturing
methods when considering tensile properties.
In the present work, the relationship of directional porosity to mechanical properties is investigated. In the
test sample “Enhanced Recoater”, which will be referred to as E.R., sintered at 1380 °C (2516 °F),
photomicrographs and fractography indicate an evolution of porosity from near circular to cylindrical as
the sample is viewed from the grip location, away from plastic deformation, to near the fracture surface,
within the plastically deformed matrix. Although it is understood in traditional PM that in test samples of
the same material, density approaching the theoretical density yields higher mechanical properties; the
following results indicate that the lower density E.R. 316L test sample exhibits comparable mechanical

properties than the higher density pressed and sintered (P/S) 316L sample in the highest temperature
sintering condition. The porosity and microstructures were observed under a light optical microscope
(LOM) and the fracture surfaces were observed using a scanning electron microscope (SEM).
Specifically, this paper will compare the densities and the associated mechanical properties of binder
jetted 316L mechanical test parts with press and sinter through various sintering environments.
Procedure
Mechanical test samples were produced according to three routes; traditional pressing with a Tinius Olson
press at compaction pressures of 830 MPa with 316L powder of D50 ~ 79 µm,3 binder jet printing via the
ExOne Innovent with powder of D50 ~ 18 µm, and finally printing via the ExOne Innovent with a
dispensing system engineered to process powder with a D50 ~ 9 µm. The ExOne Company has
engineered a proprietary dispensing system that targets the processing of these extremely fine powders.
Tensile test samples were produced by ExOne and shipped for testing and analysis. Following the
production of mechanical test samples via binder jetting, the samples were exposed to a de-binding stage.
The de-binding stage occurred in an Abbott tube furnace at 2050 °F (1121 °C) in 100% H2 for 1 hour. The
test samples were then vacuum sintered in a Solar vacuum furnace under a 15 Torr partial pressure of
hydrogen at the following temperatures; 2300 °F (1288 °C), 2400 °F (1316 °C), and 2516 °F (1380 °C).
Two fundamentally different sections were used to analyze the broken and untested tensile bars. The
typical, undisturbed condition of the microstructure was examined on transverse sections taken through
the grip end of the bar. The samples analyzed for porosity distribution and pore anisotropy were sectioned
in a plane located near the center of a broken bar using a wafering saw. This plane exposed the area from
the fracture surface to the grip end, perpendicular to the build direction. All sections were mounted using
compression mounting powders with the correct combination of the temperature and pressure used for the
specific powders. Grinding and polishing were accomplished with procedures typical for austenitic
stainless steel alloys. Glyceregia was used to reveal the etched microstructures. In addition to the
previously mentioned pore analyses, photomicrographs were taken in representative and specific areas
using these sections to evaluate the microstructure further.
Both the anisotropy index and porosity distribution were measured using an automated image analysis
(AIA) system. These analyses were made using an AIA procedure customized to provide the desired
information and meet the dimensional requirements of the samples. To acquire the data for both analyses,
the as-prepared (un-etched) samples were placed in a multi-sample holder on the automated microscope
stage and oriented in the direction coinciding with the x-direction movement of the stage. The microscope
magnification was 200x, with the corresponding pixel resolution of 0.34 µm/pixel, was found to be
appropriate for viewing the features of interest, e.g., the pores. Dimensions of the rectangular stage
pattern used to cover the cross-section of each bar were unique. This required a modification of the
number of x and y fields due to the differences in bar length and width from elongation and reduction of
area during testing. Considering the individual bar cross-sectional dimensions varied from bar-to-bar, the
total number of analyzed fields ranged from approximately 350 to 550 fields to cover a bar. Only whole
microscope fields were used in the data collection, resulting in small regions at the periphery of the
sample remaining untested.
To measure the anisotropy, arrays of equally-spaced parallel lines in both the x and y directions were
overlaid on each acquired field and counts of the x and y line segments coinciding with the pores were

made separately on each field. Count adjustments were made for incomplete line segments crossing the
field edges. The anisotropy index was calculated as the ratio of the number of adjusted line segments
counted by the y-directed lines divided by the number of segments from the x-directed lines.5 This was
calculated for each field, with averages determined for each column in the stage pattern.
The area percent porosity was estimated on the same fields used for the anisotropy measurements. For
the porosity, the data was acquired for each field and organized in the same pattern as what was used for
stage movement. These data were then used in the Excel software for plotting the contour maps.
The anisotropy of the porosity present in the samples presented is calculated as per ASTM standard
E1268.5
Figure 1. Green part vs. sintered part depicting the shrinkage following high temperature sintering
Results
After exposing the test samples of each manufacturing method to the previously mentioned sintering
conditions, the following densities and mechanical properties were achieved:
Table 1. Sintered at 1260 °C for 1 hour in partial pressure of H2
Type 0.2% Yield
Strength
(MPa)
UTS (MPa) Elong. (%) Imm. Density
(g/cm3)
D50 (µm) % Porosity
(%)
ExOne-
Enhanced
Recoater
165.5 286.1 12.3 5.90 9
26.25%
Normal
System 130.3 199.9 8.3 6.34 17
20.75%
Pressed 830
MPa 147.5 337.2 24.6 7.06 79
11.75%

Table 2. Sintered at 1316 °C for 1 hour in partial pressure of H2
Type 0.2% Yield
Strength
(MPa)
UTS
(MPa)
Elong. (%) Imm. Density
(g/cm3)
D50 (µm) % Porosity
(%)
ExOne
Enhanced
Recoater (E.R.)
185.1 457.1 38.05 7.17 9
10.38%
ExOne-
conventional
recoater
135.8 246.8 10.38 6.97 17
12.88%
Pressed 830
MPa 145.5 399.2 41.57 7.21 79
9.88%
Table 3. Sintered at 1380 °C for 1 hour in partial pressure of H2
Type 0.2% Yield
Strength
(MPa)
UTS
(MPa)
Elong. (%) Imm. Density
(g/cm3)
D50 (µm) % Porosity
(%)
ExOne
Enhanced
Recoater (E.R.)
190.3 588.8 52.47 7.46 9
6.75%
ExOne-
conventional
recoater
156.5 435.1 37.84 7.40 17
7.50%
Pressed 830
MPa 164.8 542.9 51.42 7.77 79
2.88%
Table 1 indicates the relationship between the sintered densities of the test samples to the mechanical
properties after sintering at 1260 °C. Test sample E.R. has the lowest density of the three test samples but
maintains higher and comparable mechanical properties to the “ExOne- conventional recoater” and P/S
respectively. Similarly, the trend remains consistent when analyzing the values from Table 2 and 3. As
the sintering temperature is increased to 1316 °C, as in Table 2, the sintered densities increase as well for
the three test samples. The E.R. density surpasses the “ExOne- conventional recoater” sample at this
point, due to the fine powder’s high potential for sintering.6 The density of the E.R. sample is slightly
lower than the P/S sample but still exhibits greater 0.2% yield strength and UTS, while the elongation of
the E.R. is slightly lower than the P/S. Finally, at 1380 °C, Table 3 indicates the same trend as in Table 2
but the elongation of the E.R. rises to levels exceeding expectation with a density of 7.46 g/cm3;
especially in comparison to the density of P/S which is 7.77 g/cm3.
In order to identify an explanation for the mechanical properties of the less dense sample exceeding that
of the higher density sample, an analysis was completed on the morphology and behavior of the porosity
contained in the samples.

Table 4. Average pore size (area) in µm2 of E.R. and P/S after sintering at 1316 °C and 1380 °C
1316 °C 1380 °C
Grip Middle Fracture Grip Middle Fracture
E.R. 53.3 104.7 154.6 57.9 125.5 176.1
P/S 177.5 176.8 287.9 51.9 60.5 73.4
The values tabulated in Table 4 are representative of the average pore area in µm2. Figure 2 indicates the
necessary values useful for the calculation of the average pore size in addition to morphological
characteristics like circularity and aspect ratio. The latter two characteristics are not tabulated because of
the redundancy of the data with respect to the anisotropy index detailed later in this paper.
Figure 2. Photomicrograph of E.R. 1380 °C identifying the details gathered on the pore morphology
Discussion
As tabulated in Tables 2 and 3, the elongation exceeds the expected levels for 316L stainless steel with
the amount of porosity observed. Photomicrographs were taken of the samples in both the grip section
and near the fracture to observe the evolution and behavior of the material before and after plastic
deformation. These figures indicate the deformation experienced by the pores and the material
surrounding the pores.

Figure 3. Photomicrographs of the evolution of pores going from the grip area (a) and (b) to near the
fracture surface (c) and (d) for E.R. 1380°C
(a)
(d) (c)
(b)
(a) (b)
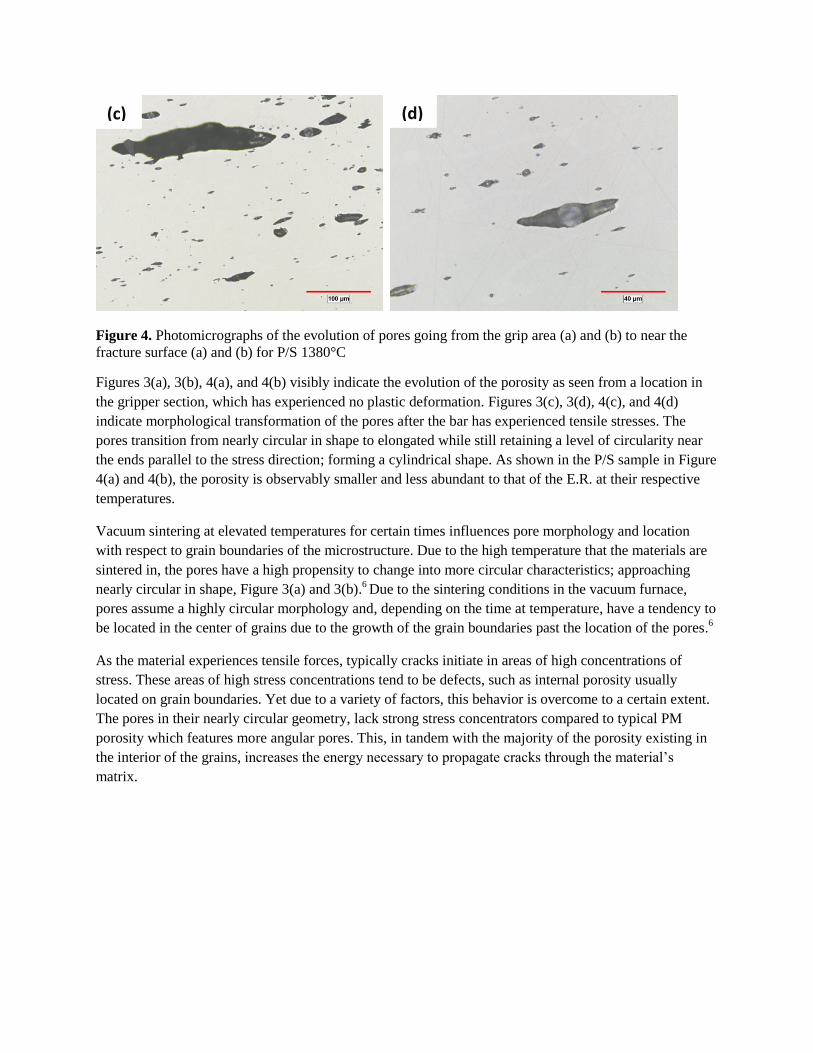
Figure 4. Photomicrographs of the evolution of pores going from the grip area (a) and (b) to near the
fracture surface (a) and (b) for P/S 1380°C
Figures 3(a), 3(b), 4(a), and 4(b) visibly indicate the evolution of the porosity as seen from a location in
the gripper section, which has experienced no plastic deformation. Figures 3(c), 3(d), 4(c), and 4(d)
indicate morphological transformation of the pores after the bar has experienced tensile stresses. The
pores transition from nearly circular in shape to elongated while still retaining a level of circularity near
the ends parallel to the stress direction; forming a cylindrical shape. As shown in the P/S sample in Figure
4(a) and 4(b), the porosity is observably smaller and less abundant to that of the E.R. at their respective
temperatures.
Vacuum sintering at elevated temperatures for certain times influences pore morphology and location
with respect to grain boundaries of the microstructure. Due to the high temperature that the materials are
sintered in, the pores have a high propensity to change into more circular characteristics; approaching
nearly circular in shape, Figure 3(a) and 3(b).6 Due to the sintering conditions in the vacuum furnace,
pores assume a highly circular morphology and, depending on the time at temperature, have a tendency to
be located in the center of grains due to the growth of the grain boundaries past the location of the pores.6
As the material experiences tensile forces, typically cracks initiate in areas of high concentrations of
stress. These areas of high stress concentrations tend to be defects, such as internal porosity usually
located on grain boundaries. Yet due to a variety of factors, this behavior is overcome to a certain extent.
The pores in their nearly circular geometry, lack strong stress concentrators compared to typical PM
porosity which features more angular pores. This, in tandem with the majority of the porosity existing in
the interior of the grains, increases the energy necessary to propagate cracks through the material’s
matrix.
(d) (c)

Figure 5. Contour maps of the E.R. 1380 °C and P/S 1380 °C tensile bars indicating the change in pore
volume moving from the grip to the middle of the bar (a) and from the middle of the bar to the fracture (b)
Figures 5(a) and 5(b) represent porosity data logged from an image analysis system. The transition of the
overall volume % of porosity in the E.R. is quite dramatic in comparison to the P/S sample which only
begins to exhibit the volume % growth of porosity very close to the area of the fracture. This further
indicates the evolution of the porosity as the tensile stresses were induced along with evidence of the
elastic behavior of the samples even with the abundance of porosity. These contour maps also align with
(a)
(b)

the data extracted from the image analysis testing concerning the average pore area, Table 4. As the pore
size increases moving from the grip to the fracture, the volume % of porosity increases as well for the
same transition in location on the tensile bar. The pore size increases drastically in the E.R. sample
compared to the P/S sample and this is analogous to the contour map image concerning the volume %
porosity. Consequently, in further analysis of the porosity, information concerning individual porosity
shape was analyzed. The pore shape is represented by a value known as the Anisotropy Index (AI).
Figure 6. Pore anisotropy of the E.R. sintered at 1380 °C from the grip end of the tensile bar to the
fracture surface after mechanical testing
Figure 7. Pore anisotropy of the P/S sintered at 1380 °C from the grip end of the tensile bar to the
fracture surface after mechanical testing
0.0
0.5
1.0
1.5
2.0
2.5
3.0
0 10 20 30 40 50 60 70
An
iso
tro
py
Ind
ex
Distance from Grip End (mm)
Pore Analysis
0.0
0.5
1.0
1.5
2.0
2.5
3.0
0 10 20 30 40 50 60
An
iso
tro
py
Ind
ex
Distance from Grip (mm)
Pore Analysis

What is observed in Figure 6 is that the porosity in the E.R. sample sintered at 1380 °C evolves from
highly circular to that of a nearly cylindrical geometry.
Anisotropy Index (AI) is defined as:
𝐴𝐼 = 𝑁𝐿⊥
𝑁𝐿∥
Where 𝑁𝐿⊥ is the summation of feature interceptions with test lines perpendicular to the deformation
direction divided by the true test length in mm. 𝑁𝐿∥ is the summation of feature interceptions with test
lines parallel to the deformation direction divided by the true test length in mm.5
From the images of the porosity in the grip section of the tensile bars from Figures 3(a), 3(b), 4(a), and
4(b), the pores are observably circular in morphology on average, correlating to the anisotropy index of
left most side of the graphs (the grip section of the tensile bar) in Figures 6 and 7. As the anisotropy index
approaches the value of 1, the shape of the pore approaches a circle. This is evident in Figure 6 as the
anisotropy index varies from 1 to about 1.5 in the grip section. Moving towards the fracture of the tensile
bar, the pore anisotropy begins to increase. Typically, in materials with similar amounts of porosity,
elongation hardly reaches values this high because pores begin to grow and coalesce resulting in
catastrophic failure.1 However, in the case of the E.R. 1380 °C, the pores appear to stretch uniformly
parallel to the tensile force. This is supported not only by the pore anisotropy index in Figure 6 but also
by the fracture surfaces in Figure 9. The fracture surfaces indicate a glide mechanism called serpentine
glide which results from the deformation of grains the porosity resides in and the neighboring grains.
Serpentine glide is further explained later.
A similar trend is observed in the anisotropy index graph, Figure 7, of P/S 1380 °C. As one would expect,
the lower % porosity 316L sample, P/S 1380 °C, would exhibit better mechanical properties than the
higher % porosity 316L samples. This appears to be the case initially; however as the porosity approaches
anisotropy values similar to that of the E.R. sample the material fails. This can be explained by the
presence of inclusions in the P/S tensile bar, visible in Figures 4(d), 11, and 14. The inclusions inhibit the
flow of material and initiate failure prematurely for the higher density P/S 1380 °C sample. After
completing an EDS analysis on the inclusions, it was determined that the inclusions present are SiO2.
As shown in Figure 6, the anisotropy of the pores increases which indicates that the pores are extending
parallel to the tensile direction. Due to the morphology of the pores in combination with the ratio of the
grain size, this may be a driving factor for the levels of elongation recorded. In typical dimpling
phenomena, the failure mechanism is driven by large amounts of plastic deformation. This leads to the
formation of voids, their growth, followed by coalescence, leading to the distinctive dimple structure of
the fracture surface seen in Figure 10.1, 11
What is unique about the fracture surface of the E.R. sample in
comparison to typical dimpling is the behavior of the pore during the elongation of the material
surrounding it. It would appear that the pore behaves as the defect in terms of the location of the large
dimple-like fracture surface.

Figure 8. Fracture surface of E.R. 1316 °C
Figure 9. Fracture surface E.R. 1380 °C

Figure 10. Fracture surface of MIM produced 17-4 PH steel indicating dimpling
Figure 10, in comparison to Figure 11 below, specifies the similarities between the two failure modes.
The dimpling is quite prominent in Figure 11 even with the addition of inclusions in the dimpled surfaces.
Figure 11. Fracture surface P/S 1380 °C
Figures 8 and 9 of the E.R. indicate various levels of a mechanism called serpentine glide. Through these
fracture surfaces between the E.R. sintered at 1316 °C and 1380 °C there is a visible difference in the
amounts of serpentine glide present. This matches with the associated density and elongation values
tabulated in Tables 2 and 3. The E.R. sintered at 1316 °C exhibits lower mechanical properties and
density compared to the E.R. sintered at 1380 °C and the serpentine glide apparent in the enhanced
recoater sintered at 1316 °C is also less abundant compared to the E.R. sintered at 1380 °C.
This mechanism is not evident in Figure 11 of the P/S 316L samples. To varying degrees, the fracture
surfaces indicate abundant dimpling at the onset of fracture. Similarly, in comparing the high
magnifications shots of Figure 9 and Figure 11, the textures of the walls of the pores where the fracture
occurred are quite different.2 A difference that is apparent between the E.R. and the P/S samples is the

amount of inclusions present in the dimples of the P/S samples, which is evident in Figure 4(d) and 14
and will be addressed in the chemical analysis.
Figure 12. Slip step formation in serpentine glide and ripples on dimple wall 4
Figure 12 is a schematic of a mechanism called serpentine glide. Serpentine glide is glide plane
decohesion on several sets of planes simultaneously. This mechanism is thought to be formed by
combinations of pencil or wavy slip, and cross slip, and is often found in poly-crystalline materials where
deformation in a given grain must accommodate the deformation of neighboring grains.4 In Figure 9,
serpentine glide is observed on the entire surface of the porosity which indicates that the deformation is
homogenous throughout the fracture surface. This provides further evidence supporting the influence pore
anisotropy has on the failure mode; cracks have a more difficult time forming and rather than the typical
propagation of cracks connecting and coalescing pores, serpentine glide is visible.
Chemical Analysis
The differences in chemical composition are tabulated in Table 5. Again, the production routes on the
powder utilized in the binder jetting system and in the press and sinter system are gas atomized and water
atomized respectively. Due to the inherent qualities of the production methods, chemical compositions
vary in order to effectively produce acceptable powder. For example, lower manganese levels must be
confirmed in the feedstock material for water atomization due to the tendency to oxidize on the powder
surface. This is not a concern when processing powder via gas atomization. Similarly, higher levels of
silicon are used in water atomized feedstock because of the resistance to surface oxidation it provides.8
Table 5. Sintered chemistry of tensile bars
C S O N Si Mn Cr Ni
E.R. 1380 °C 0.11 <0.001 0.026 0.002 0.63 0.91 17.06 10.60
P/S 1380 °C 0.016 0.001 0.015 0.001 0.91 0.08 17.31 12.80

Figure 13. Metal-Metal oxide equilibria in pure Hydrogen atmospheres 10
Figure 13 depicts the trends for reduction and oxidation of various metal oxides. Depending on the
temperature and the atmosphere exposed to the material, the behavior of the oxides varies. The water
atomized powder also has higher levels of oxygen which means that the silicon and oxygen react and
form the silicon oxides visible in both the fracture surface images and the porosity images.
Figure 14. DIC image of P/S 1380 °C highlighting the presence of inclusions located in each pore after
elongation. This image was taken in the area in close proximity to the fracture surface
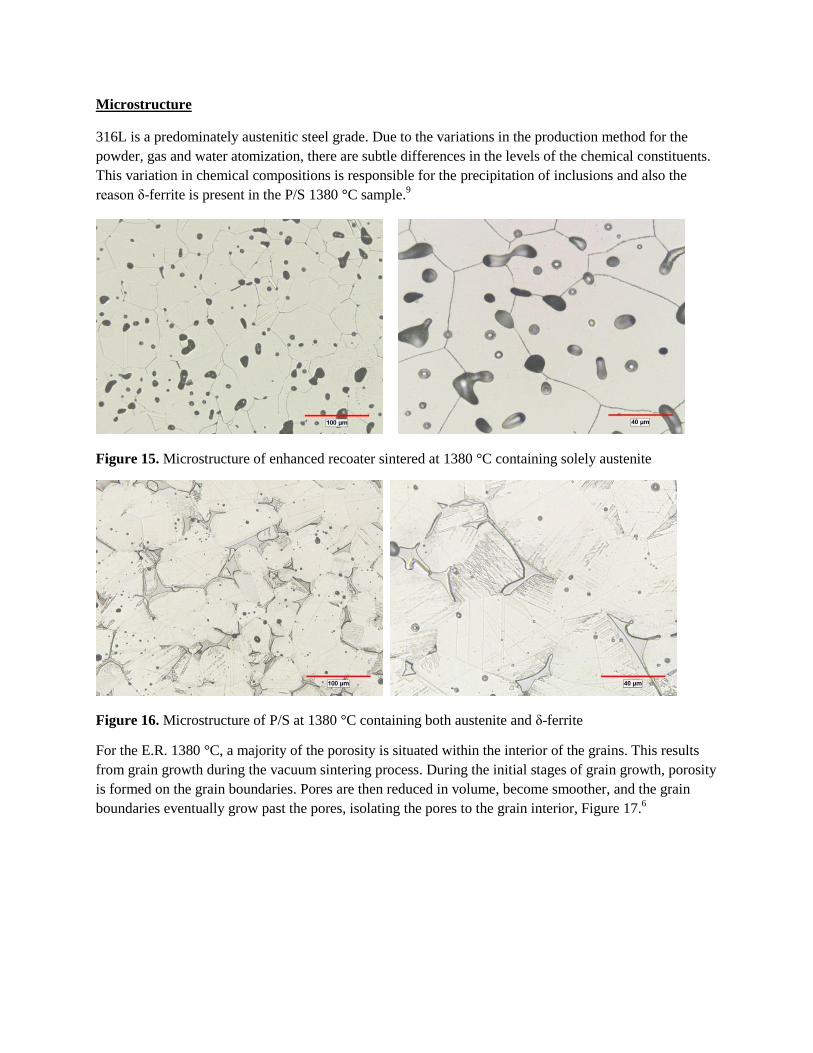
Microstructure
316L is a predominately austenitic steel grade. Due to the variations in the production method for the
powder, gas and water atomization, there are subtle differences in the levels of the chemical constituents.
This variation in chemical compositions is responsible for the precipitation of inclusions and also the
reason δ-ferrite is present in the P/S 1380 °C sample.9
Figure 15. Microstructure of enhanced recoater sintered at 1380 °C containing solely austenite
Figure 16. Microstructure of P/S at 1380 °C containing both austenite and δ-ferrite
For the E.R. 1380 °C, a majority of the porosity is situated within the interior of the grains. This results
from grain growth during the vacuum sintering process. During the initial stages of grain growth, porosity
is formed on the grain boundaries. Pores are then reduced in volume, become smoother, and the grain
boundaries eventually grow past the pores, isolating the pores to the grain interior, Figure 17.6

Figure 17. Temperature and time dependent porosity and grain boundary evolution 6
A major difference between the P/S and E.R. both sintered at 1380 °C is not only the amount of porosity
and inclusions but also the resulting microstructure. The E.R. is fully austenitic with very few twins
present, Figure 15. The P/S 1380 °C is primarily austenite with larger amounts of twins present with an
additional presence of δ-ferrite, Figure 16. The δ-ferrite results from high temperature sintering and is
promoted by ferrite formers such as chromium, molybdenum, and silicon. The presence of δ-ferrite has
been shown to increase the yield strength and UTS while decreasing ductility.7 Additionally the SiO2
inclusions in the same sample as the δ-ferrite, affects the tensile properties in a similar manner by
restricting the elongation of the sample. Even though the sintering conditions are the same between the
two sets of samples, the resulting microstructure is different due to the variation in chemical composition.
In comparing the interstitial chemical composition, Table 5, the enhanced recoater maintains a solely
austenitic microstructure while also having a much higher level of sintered carbon. Carbon is an
austenitizer and may be the reason why the austenite is completely uninterrupted by δ-ferrite in the
enhanced recoater sample; the higher levels of carbon may also play a role in the enhanced mechanical
properties.
Summary
The influences resulting in elevated tensile properties for the less dense 316L tensile samples in
comparison to the higher density pressed 316L samples were investigated. In order to discern the origin of
this phenomenon, porosity analyses, microstructural photomicrographs, and fractography were employed
comparing the observable differences. As a result, the following points provide reasoning for the
occurrence of high mechanical properties for the less dense 316L:

The morphology, size, and location of porosity with respect to the microstructure influences the
crack growth and connection affect, ultimately affecting the ultimate tensile strength. In the
enhanced recoater samples sintered at 1380 °C (2516 °F), pores are localized more prominently in
the interior of the grains rather than being situated on grain boundaries.
The pores in the enhanced recoater sintered at 1380 °C (2516 °F) are able to stretch unperturbed
due to the lack of inclusions and their location within the grain.
The evolution of pores nearing circular (AI ~1) in the grip end of the E.R. tensile bar to
directional pores (AI>1) is highlighted in the photomicrographs of the fractured tensile bar,
Figure 3, and also through the anisotropy index graphs that indicate the transition of the pores
into more elongated shapes parallel with the direction of the applied force.
The transition of circular pores into unidirectional oriented cylindrical pores can be described
through an occurrence called serpentine glide.
The location of the pores within the grain in coordination with the pore size being significantly
smaller than the grains enables the pores to deform, drawing material from the surrounding grain
as the material stretches and exhibits serpentine glide.
The full chemical composition of the samples must be taken into consideration upon choosing a
route to high temperature sinter in, especially if the route is via vacuum and/or in the presence of
a reducing atmosphere like hydrogen.
References
1. H.C. Burghard JR., “The Influence of Precipitate Morphology on Microvoid Growth and
Coalescence in Tensile Fracture”, Metallurgical Transactions, September 1974, Volume 5, Issue
9, pp. 2083- 2094
2. H.C. Burghard and D.L Davidson, “Fracture Mechanisms and Fracture Surface Topography”,
Proceedings of the First International Conference on Fracture, Japanese Society for Strength and
Fracture of Materials, 1966, Vol. 2, pp. 571
3. Annual Book of ASTM Standards 2017, ASTM International, Volume 03.01
4. Metals Handbook, ASM International, Ninth Edition, Volume. 12 Fractography, March 1987
5. ASTM Standard E1268, 2001 (2016), “Standard Practice for Assessing the Degree of Banding or
Orientation of Microstructures,” ASTM International, West Conshohocken, PA, 2016, DOI:
101520/E1268-01R16
6. R.M. German, Powder Metallurgy & Particulate Materials Processing, 2005, Metal Powder
Industries Federation, Princeton, NJ.
7. P.V. Muterlle, M. Zendron, M. Perina, A. Molinari, “Influence of Delta Ferrite on Mechanical
Properties of Stainless Steel Produced by MIM”, 20th Congress of Mechanical Engineering, 2009,
Gramado, RS, Brazil
8. C. Schade, “Influence of Melt Chemistry on Stainless Steel Powders”, Proceedings of the 2002
Electric Furnace Conference, San Antonio, Texas, 2002.
9. F.C. Hull, “Delta Ferrite and Martensite Formation in Stainless Steels” Welding Journal, May
1973, pp. 193- 203
10. N. Bredzs & C.C. Tennenhouse, Metal-Metal Oxide-Hydrogen Atmosphere Chart for Brazing or
Bright Metal Processing, Supplement to the Welding Journal, May, 1970, pp. 189s-193s.
11. M. Kuna, Finite Elements in Fracture Mechanics, 2013, Springer, Dordrecht, NL.