the power of benchmarking - corporate citizenship · the power of benchmarking ... performance...
TRANSCRIPT

The Power of Benchmarking | 2014 | © Corporate Citizenship Page 1
The Power of BenchmarkingHarnessing data for performance in corporate responsibility and sustainability

Page 2 © Corporate Citizenship | 2014 | The Power of Benchmarking

The Power of Benchmarking | 2014 | © Corporate Citizenship Page 1
Contents
Introduction ................................................................................................................................................................................................2
Benchmarking defined .......................................................................................................................................................................2
The value for business ........................................................................................................................................................................3
Five aims of benchmarking .............................................................................................................................................................5
Benchmarking best practice ........................................................................................................................................................6
Conclusion ..................................................................................................................................................................................................12

Page 2 © Corporate Citizenship | 2014 | The Power of Benchmarking
Introduction
The business world is driven by data. In the economy and society we use numbers to understand what has happened in the past, and forecast what might occur in the future. Investment decisions are guided by financial data. Consumer purchasing choices are informed by information on price and quality. Even the drugs that doctors can prescribe have been the subject of detailed number crunching to set the price of the medicine and assess drug efficacy.
In the world of corporate responsibility (CR) and sustainability, data is crucial to understanding and improving company performance. It is also vital to explain to stakeholders how the company compares in terms of best in class performance and other measures. Issues range from understanding how your company contributes to employment across the value chain to measuring the impact of community investment
programmes. The modern CR practitioner simply couldn’t do their job without high quality, reliable data.
But data in isolation is meaningless. We need to compare that data to something. Past performance in your own organisation sets a base line which is essential for monitoring progress. But real value stems from comparisons with the wider world. Is your performance world-class? Are you lagging behind the pack of peers and best practice companies on a particular issue? Comparing CR and sustainability metrics with a wider set of companies is fundamental to understanding not just your current performance in context, but also your future potential. In addition, a company’s economic, social and environmental performance needs to be evaluated against norms, laws and standards set by society. They act as the external benchmark by which a company’s behaviour is judged.
Benchmarking defined
Benchmarking is an objective evaluation, based on clear definitions and metrics, that compares performance against a specific norm, standard or group of companies.
It is most popular as a means of assessment to review a company’s performance in the context of peers and best practice companies. Internally, this can drive improvements, create a sense of competition and inspire fresh ideas. For example, if a competitor has made significant progress to eliminate conflict minerals from its supply chain, they might be using a novel approach from which you could learn. Externally, it can show stakeholders how the company compares with others and what progress it is making to address an issue. If your own corporate responsibility strategy is world class, then your external recognition through ratings, standards, and awards should compare favourably with direct competitors as well as a wider set of best practice companies.
There are countless different types of benchmarking: financial benchmarking compares the financial competiveness of companies; process benchmarking
reviews how business procedures are carried out; benchmarking against a standard sets a minimum performance level to be met. This paper looks at performance benchmarking in a corporate responsibility and sustainability context. Performance benchmarking assesses how a company manages or addresses a particular issue in comparison to a set of companies or standards. This can be quantitative, such as comparing the amount of water used to create a unit of product, or qualitative, such as comparing supplier sourcing schemes.
The ability to benchmark in the field of CR has been greatly helped by the increasing number, and standardisation of, sustainability reporting. Approximately 95% of the Global 250 issue sustainability reports and organisations like Global Reporting Initiative and Sustainability Accounting Standards Board have been working to standardise reported information.1 This trend not only tells external stakeholders what is happening within the company’s sustainability strategy, but also allows companies to compare performance just as they do in other aspects of the business.
1 Value of Sustainability Reporting, Ernst & Young (2013)
The Power of Benchmarking | 2014 | © Corporate Citizenship Page 3
The value for business
First and foremost, benchmarking allows businesses to learn from one another and make smarter decisions. By evaluating performance against peers or a standard, companies are able to drive incremental improvements across the business and increase productivity. Pioneered by quality management expert W. Edwards Deming, recent research has shown that quality benchmarking improves performance in fields as diverse as manufacturing processes, corporate governance, health and safety, diversity and supply chain integrity.2 Critical analysis of data gathered can also point to future trends and help companies stay abreast of and even get ahead of peers.
Benchmarking can be used publically to defend from attack by critics or underpin claims that companies want to make. For example, companies with large supply chains in developing countries increasingly need to demonstrate that their raw materials and manufactured products are produced with integrity. These businesses have found it critical to benchmark supplier labour practices, such as the right to trade union membership and the elimination of child and forced labour, against international standards as well as local laws and norms. The UN Universal Declaration of Human Rights has provided a standard against which business behaviour can be judged.
2 Out of the Crisis: Quality, Productivity and Competitive Position, William Edward Deming (1986)
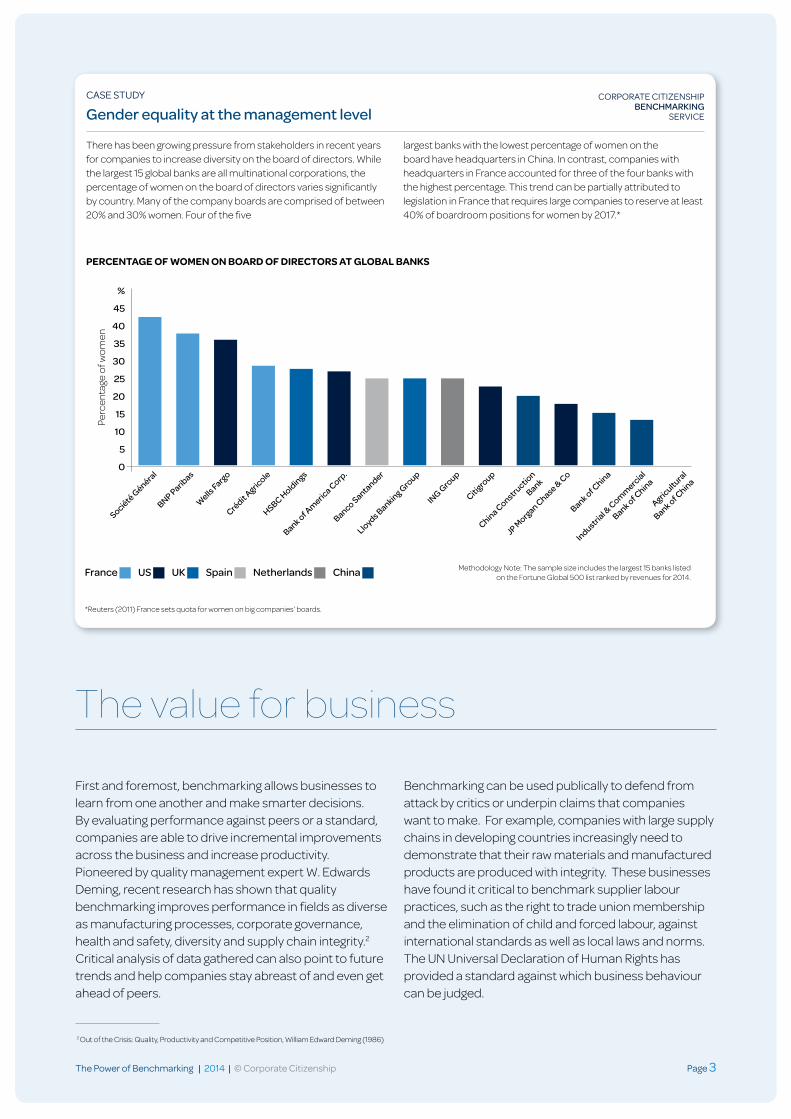
CASE STUDY
Gender equality at the management level
There has been growing pressure from stakeholders in recent years for companies to increase diversity on the board of directors. While the largest 15 global banks are all multinational corporations, the percentage of women on the board of directors varies significantly by country. Many of the company boards are comprised of between 20% and 30% women. Four of the five
largest banks with the lowest percentage of women on the board have headquarters in China. In contrast, companies with headquarters in France accounted for three of the four banks with the highest percentage. This trend can be partially attributed to legislation in France that requires large companies to reserve at least 40% of boardroom positions for women by 2017.*
Methodology Note: The sample size includes the largest 15 banks listed on the Fortune Global 500 list ranked by revenues for 2014. France US UK Spain Netherlands China
Société Général
BNP Paribas
Wells
Fargo
Crédit Agricole
HSBC Hold
ings
Bank of Am
erica Corp.
Banco Santander
Lloyds Banking Group
ING G
roup
Citigroup
China Construction
Bank
JP Morgan C
hase & C
o
Bank of China
Industrial &
Com
mercial
Bank of China
Agricultural
Bank of China
%
45
40
35
30
25
20
15
10
5
0
*Reuters (2011) France sets quota for women on big companies’ boards.
Perc
enta
ge o
f wo
men
PERCENTAGE OF WOMEN ON BOARD OF DIRECTORS AT GLOBAL BANKS
CORPORATE CITIZENSHIP BENCHMARKING
SERVICE

Page 4 © Corporate Citizenship | 2014 | The Power of Benchmarking
Benchmarking assessments can be of particular value to CR and sustainability executives working in companies. Understanding how you compare on a particular issue can inform decision making and strengthen communication channels with internal and external stakeholders.
There are two main advantages for the CR practitioner to gain from a robust benchmark:
1 The case can be made that the company needs to do more to achieve best practice standards in a certain
area. For example, if it can be shown that your supplier code of conduct is missing several elements viewed
as best practice by supply chain experts, the case can neatly be constructed that it may be time to update your code of conduct to align with best practice.
2 Secondly, accurate benchmarked data can back up claims of leadership. This is particularly useful in
cases we have seen where the company either wants to make a claim of superiority, or when performance in under attack from external stakeholders. For example, if the proportion of union membership in your business is significantly higher than the national average in every country of operation, the data might support the case against accusations of being anti-organised labor.
CASE STUDY
Workers’ rights in the supply chain
Companies often feature in external surveys that evaluate performance against peers. One such survey, Oxfam’s Behind the Brands, assess the agricultural sourcing policies of the 10 largest food companies across seven dimensions. In the agricultural workers dimension, the highest score awarded was 7 out of 10. Oxfam suggests that all the companies assessed can do more to support worker rights. At this stage, most companies have recognised international labour standards and committed to ending child labour. Leaders have taken an additional step to draft commitments to support workers rights. For example, Unilever has committed to developing a framework for fair compensation. However, Oxfam highlights that progress still needs to be made in improving pay conditions
AGRICULTURAL WORKERS’ RIGHTS SCORE
Bad benchmarking Benchmarking has its limitations. Whilst good benchmarking is about performance and best practice, bad benchmarking can lead to mediocrity. Bad benchmarking is using data to justify average performance, rather than challenging and driving improvements. This usually stems from selecting the wrong comparison group. Simply because others are performing at a particular level, does not mean this is the level at which you should perform. If your entire industry does not address the issue of a living wage, this does not mean that your compensation philosophy is necessarily a good one.
In addition to justifying mediocre performance, bad benchmarking can stifle innovation. While you may have a set peer comparison group within your sector, individual companies and industries excel in different areas. Companies that gain the most value from a benchmark often think outside the box and look to borrow ideas from others sectors by asking who is the best at a particular issue and what are they doing differently? For example, Southwest Airlines sought to improve its on time performance. Instead of benchmarking against other airlines, the company looked to NASCAR where pit crews quickly and efficiently get their race cars back on the track as source of innovation.
Unilever
Nestlé
Coca-Cola
Associated
British Foods
DanoneMars
Mondelez
PepsiCo
General M
ills
Kellogg’s
9
8
7
6
5
4
3
2
1
0
Co
mp
any
sco
re
Source: The scores are taken from the Oxfam’s February 2014 Behind the Brands survey.
Good Fair Some progress Poor Very poor
CORPORATE CITIZENSHIP BENCHMARKING
SERVICE

The Power of Benchmarking | 2014 | © Corporate Citizenship Page 5
Five aims of benchmarking
Benchmarking can offer a fresh take on an issue and yield critical insights to enhance performance. But before diving into detailed data analysis, it is important to set out what you want to achieve. Here are five potential aims:
1. Identify a position in the peer group: To understand overall performance, take stock of how you compare. How does my performance compare on my priority areas? Is my recent drop in performance still within typical
industry practices?
2. Inform strategy development: To recognise areas of strength, opportunities to differentiate, key vulnerabilities and potential performance gaps. In which areas do I lag behind my peers? Where can I
distinguish myself as a leader?
3. Determine best practice elements and set targets: To set sustainability targets and inspire action, examine the actions of best in class companies, the performance of innovative leaders, and the highest standards
within an industry and across industries. How does my performance compare to world-class standards? To what degree have leading companies outside of my sector improved their performance?
4. Understand trends over time: To track how the market is moving on a key issue, review available data over the past years and analyse for trends. Has the variation among companies decreased? Has overall sector
performance improved? Has an improvement programme been successful?
5. Communicate performance to external stakeholders: To build a constructive dialogue with allies, partners and even critics, make the findings from a benchmark public. A narrative should accompany any benchmark
that sets performance in context.
CASE STUDY
Affordability of products in developing countries
It is often difficult to find publically verified benchmarks to indicate companies are selling products at a fair and affordable price to local consumers. In this example, Unilever has overcome this hurdle by creating its own benchmark that compares the price of toothpaste in four countries to the cost of six eggs. The chart demonstrates that in India and Indonesia a tube of toothpaste costs, at most, half the price of six eggs. In Nigeria and the Philippines, the cost drops even further. While not a scientific analysis, this comparison helps develop a general understanding of the company in society in the absence of a proper Consumer Price Index.
COST OF TOOTHPASTE IN FOUR COUNTRIES (% OF PRICE OF 6 EGGS)
50% 50%
32%
6%
INDIA INDONESIA NIGERIA PHILIPPINES
Source: 2006 Unilever Sustainable Development Report
CORPORATE CITIZENSHIP BENCHMARKING
SERVICE
Page 6 © Corporate Citizenship | 2014 | The Power of Benchmarking
Benchmarking best practice
A clear process is needed to identify the right metrics and to transform the available data into valuable insights. We recommend using a five step process:
1 Identify objectives: Pinpoint exactly what
you aim to achieve. Prioritise gaps in current knowledge and issues of high concern to stakeholders. See “Five Aims of Benchmarking”.
2 Select the comparison group: Identify a peer
group that aligns with your objectives. Comparisons can be made to peer companies or best in class performers. Consider factors such as industry and geography. A wide range of companies in the comparison group can help to evaluate your place in the industry landscape. Leaders, often outside of your industry, provide the necessary challenge and inspiration for improvement.
3 Define specified key questions: Select
questions that support the objectives. Ensure the questions are specific, available and comparable. Consider any relevant laws, standards, or norms to qualitatively evaluate performance among the comparison group. Use clear metrics to understand how companies compare on quantitative criteria. For example, under workplace diversity, are you interested in the percentage of women in leadership or the percentage of the workforce comprised of the local population? These small differences can yield major divergences in datasets.
4 Collect and analyse information: Collect
the data for the comparison group. If the data is quantitative, normalise this for comparison and adjust the variables to see what different results arise. Analyse the information to make comparisons across the group.
5 Take action: Share your findings to the
relevant parties. Review your objectives and identify how to engage others to further these objectives. To improve internal processes, approach the relevant department with your conclusions. To respond to stakeholder concerns, release a statement on the issue. Above all, don’t let the benchmark just sit on a shelf or in your inbox: take action to improve performance.
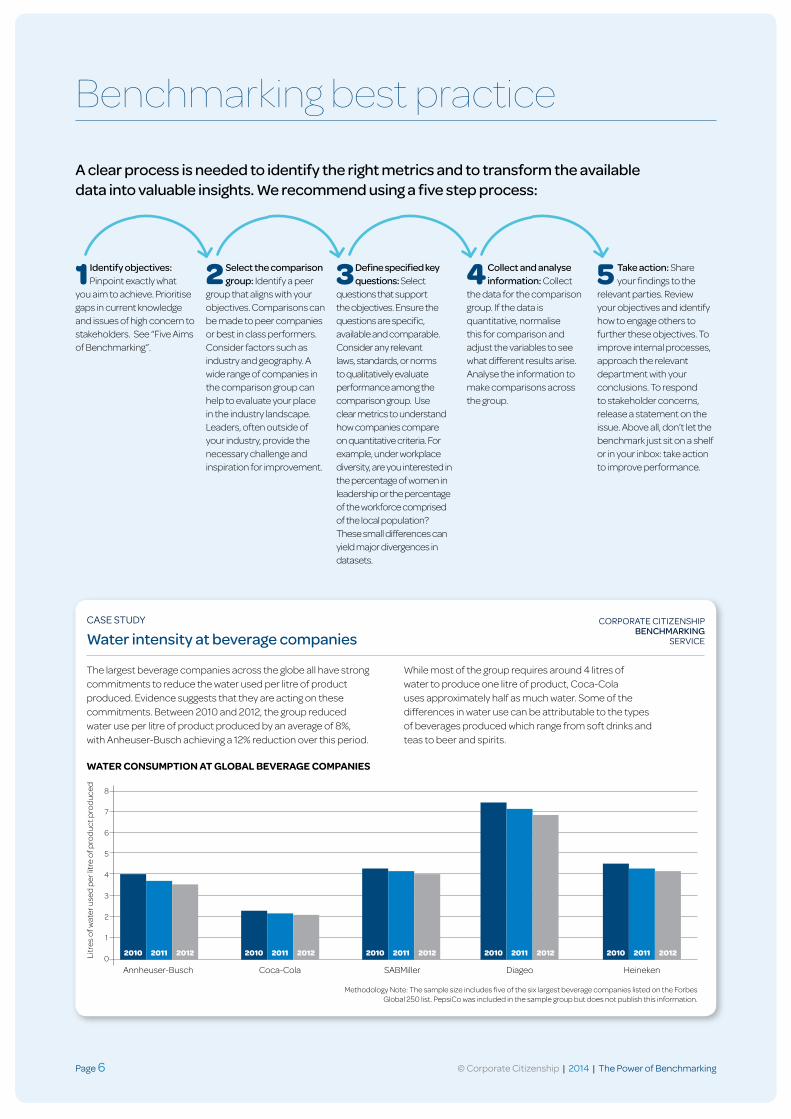
CASE STUDY
Water intensity at beverage companies
The largest beverage companies across the globe all have strong commitments to reduce the water used per litre of product produced. Evidence suggests that they are acting on these commitments. Between 2010 and 2012, the group reduced water use per litre of product produced by an average of 8%, with Anheuser-Busch achieving a 12% reduction over this period.
While most of the group requires around 4 litres of water to produce one litre of product, Coca-Cola uses approximately half as much water. Some of the differences in water use can be attributable to the types of beverages produced which range from soft drinks and teas to beer and spirits.
8
7
6
5
4
3
2
1
0
Annheuser-Busch Coca-Cola SABMiller Diageo Heineken
Litr
es o
f wat
er u
sed
per
litr
e o
f pro
duc
t pro
duc
ed
Methodology Note: The sample size includes five of the six largest beverage companies listed on the Forbes Global 250 list. PepsiCo was included in the sample group but does not publish this information.
WATER CONSUMPTION AT GLOBAL BEVERAGE COMPANIES
2010 2010 2010 2010 20102011 2011 2011 2011 20112012 2012 2012 2012 2012
CORPORATE CITIZENSHIP BENCHMARKING
SERVICE
The Power of Benchmarking | 2014 | © Corporate Citizenship Page 7
Conclusion
The end goal of benchmarking is not a benchmark. The real benefit stems from understanding the market and identifying how to improve performance and develop new ideas.
Benchmarking can have its limitations. It cannot provide all the answers. There is often the temptation to look for a single right answer – the underlying explanation for performance differences can sometimes be complex. Most data only makes sense when understood in context, for example, where aggressive target-setting has driven superior performance for an organisation. For this reason,
benchmarking is best thought of as a first step. After interpreting the data, it’s the action that follows that really differentiates companies.
“The real benefit stems from understanding the market and identifying how to improve performance and develop new ideas.”
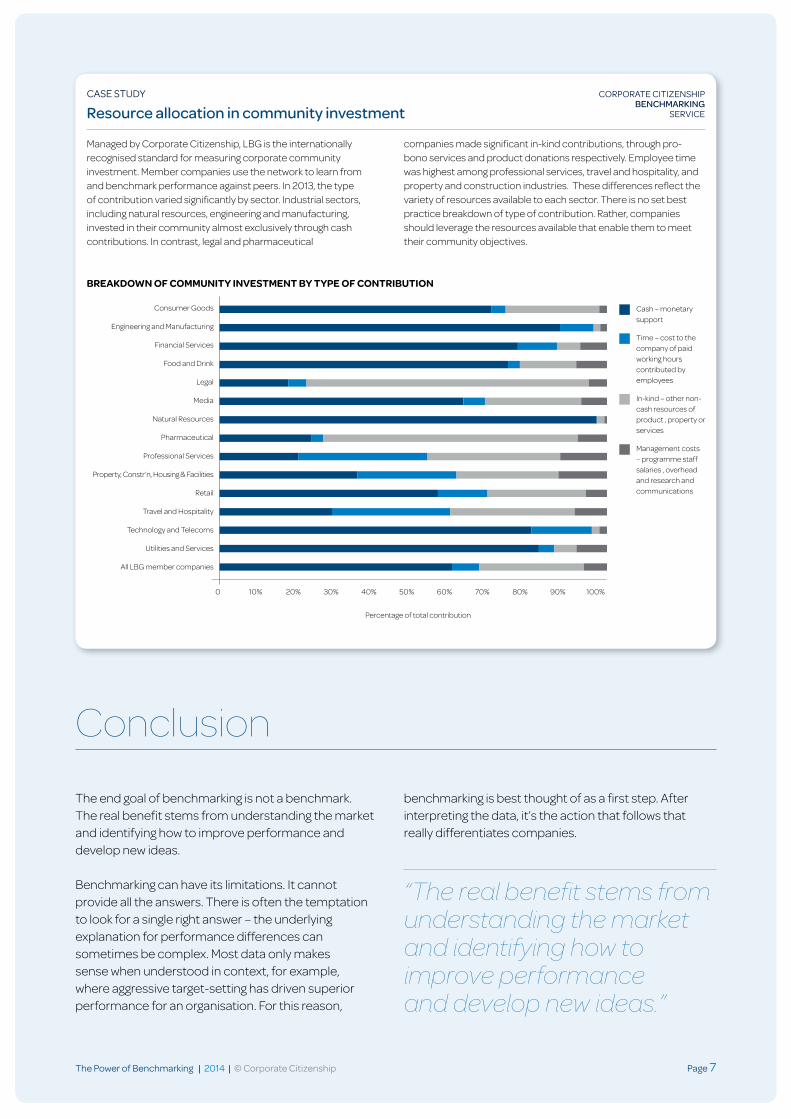
CASE STUDY
Resource allocation in community investment
Managed by Corporate Citizenship, LBG is the internationally recognised standard for measuring corporate community investment. Member companies use the network to learn from and benchmark performance against peers. In 2013, the type of contribution varied significantly by sector. Industrial sectors, including natural resources, engineering and manufacturing, invested in their community almost exclusively through cash contributions. In contrast, legal and pharmaceutical
companies made significant in-kind contributions, through pro-bono services and product donations respectively. Employee time was highest among professional services, travel and hospitality, and property and construction industries. These differences reflect the variety of resources available to each sector. There is no set best practice breakdown of type of contribution. Rather, companies should leverage the resources available that enable them to meet their community objectives.
Percentage of total contribution
0 10% 20% 30% 40% 50% 60% 70% 80% 90% 100%
Consumer Goods
Engineering and Manufacturing
Financial Services
Food and Drink
Legal
Media
Natural Resources
Pharmaceutical
Professional Services
Property, Constr’n, Housing & Facilities
Retail
Travel and Hospitality
Technology and Telecoms
Utilities and Services
All LBG member companies
Cash – monetary support
Time – cost to the company of paid working hours contributed by employees
In-kind – other non-cash resources of product , property or services
Management costs – programme staff salaries , overhead and research and communications
BREAKDOWN OF COMMUNITY INVESTMENT BY TYPE OF CONTRIBUTION
CORPORATE CITIZENSHIP BENCHMARKING
SERVICE

Page 8 © Corporate Citizenship | 2014 | The Power of Benchmarking
Illustrative Quantitative Benchmarking Criteria The table outlines common quantitative indicators that can be benchmarked in the field of corporate responsibility and sustainability. This list is just the beginning.
Each benchmark assessment should be customised to include the qualitative information that is critical to better understand performance in context and identify actions going forward.
ECONOMIC ETHICS
• Spend on local procurement
• Tax contribution by country
• Direct economic value generated and distributed:
– Employee wages and benefits
– Tax contributions to local governments
• Ratio of annual total compensation for the highest-paid individual in each country of significant operations to the median employee salary in that country
• Number of ethics breaches reported to ethics hotline
• Number of incidents of non-compliance with regulations and voluntary codes around marketing
• Value and breakdown of political contributions
ENVIRONMENT SOCIAL
• Weight or volume of materials used
• Percentage of recycled inputs materials used to manufacture products
• Total energy consumption
• Total fuel consumption from renewable and non-renewable resources
• Total energy consumed
• Energy requirements of sold products or services
• Total volume of water withdrawn by source
• Total volume of water recycled or reused
• Tonnes of greenhouse gas emissions, included Scopes 1, 2, and 3
• Tonnes of NOx, SOx, ozone depleting substance emissions
• Volume of water discharged by quality and destination
• Breakdown of total weight of waste generated by disposal method
• Total volume of significant spills
• Number of grievances reported related to the environmental impacts
• Gender breakdown of employees by employment type, management level and region
• Employee turnover by age group, gender, and region
• Percentage of managers local to the country of operations
• Value of investment in communities broken down by cash, time, and in-kind contributions
• Percentage of pre-tax profits donated
• Percentage of employees that participate in volunteering or matching gift programmes
• Lost time injury frequency rate
• Average hours of training per employee by gender and employee category
• Percentage of diverse employees by employee category
• Average salary at each employee level by gender
• Percentage of employees that are members of labour unions or covered by collective bargaining agreements
• Percentage of suppliers screened for labour issues
• Hours of human rights training per employee
• Number of reported incidents of discrimination
The Power of Benchmarking | 2014 | © Corporate Citizenship Page 9
The Corporate Citizenship Benchmarking Service provides customized benchmarking reports on the full range of corporate responsibility and sustainability issues. How does your performance on social, environmental and economic metrics compare to peers? What are the key themes, standards and KPIs used by your competitors? How do your policies and processes compare to international standards and norms?
Corporate Citizenship has over 20 years of experience helping companies to understand how they are positioned. Back in 1994, we founded LBG, now the international standard for measuring corporate community investment used by over 300 companies worldwide. We continue to run an annual benchmarking service for the members.
Drawing on published information from across the world, and by contacting peers and competitors directly, our research team applies bespoke measurement and analysis tools to help organisations understand their place in the market, identify best practice and harness powerful insights that drive performance.
A lot of the benchmarking we do is also qualitative, such as understanding how a draft policy (e.g a Code of Ethics) or proposed process (e.g. stakeholder engagement), compared to that of peers. Comparisons can be made against international standards, such as those set by the United Nations (UN) or International Labor Organization (ILO).
CORPORATE CITIZENSHIP BENCHMARKING SERVICE

The Power of Benchmarking | 2014 | © Corporate Citizenship Page 1080%
About Corporate Citizenship Corporate Citizenship is a global corporate responsibility consultancy that uses clear insight and a simplified approach to sustainability to deliver growth and long-term value for business and society. We work globally across industry sectors. Our work spans Europe, United States, Asia, Africa and Latin America. We help our clients make the smart choices that will enable them to survive and thrive in an increasingly challenging business environment.
Corporate Citizenship promotes the idea that companies can be a force for good. We advise global client list on a number of areas: strategy, reporting, supply chain, socio-economic impacts, inclusive business models and assurance. Our long standing clients include Unilever, Shell, Abbott and Vodafone.
For further information about the report and our services, please contact: [email protected]
DISCLAIMER: Every possible effort has been made to ensure that the information contained in this publication is accurate at the time of going to press, and the publishers and author cannot accept responsibility for any errors or omissions, however caused. No responsibility for loss or damage occasioned to any person acting, or refraining from action, as a result of the material in this publication can be accepted by the editor, the publisher or author.
Singapore office:10 Anson Road #39-07International Plaza Singapore 079903T: +65 6836 9098
UK office:5th Floor, Holborn Gate 26 Southampton Buildings London WC2A 1PQT: +44(0)20 7861 1616E: [email protected]: www.corporate-citizenship.com
US office:241 Centre Street4th Floor New York, NY 10013T: 1-212-226-3702