the power of technical communication: how and where we impact the bottom line
TRANSCRIPT

The Power of Tech Comm
How and Where We Impact the Bottom Line
Sharon Burton

Thank you for attending!
▪ Sharon Burton
▪ I solve post-sales customer experience problems▪ Research how people feel about product instructions
▪ Support clients in creating better product instructions
▪ And fixing the workflow
▪ Teach communication at various universities
▪ These slides will go up on SlideShare tomorrow
▪ Twitter: sharonburton

Where is the data from?
▪ I’m pulling data from different places▪ Including my own work
▪ I have references at the end for you

How it’s always been
This may sound familiar

Technical Documentation
No one reads the product instructions
Customers will just call support anyway
A Good ProductTM
doesn’t need docs
▪ We fought to be in engineering▪ They didn’t think of us as part of
the product
▪ Often, no one knows how docs get done
▪ No one told us about upcoming projects

Technical Documentation
Can this look prettier?
We can’t tell them that
Why won’t a brochure be enough?
▪ We moved to Marketing▪ They didn’t think of us as part of
the product or the marketing collateral
▪ Often, no one knows how docs get done
▪ No one told us about upcoming projects

We’re in the Wild West
It’s all changing as I speak

Content is king
And Queen
And the whole royal court
▪ Marketing has discovered content
▪ Customers want content
▪ We have that▪ We have lots of that
▪ How do we connect what we do to what the company needs?

Sales
It starts here

Sales funnel
▪ The way sales come into your company
▪ Marketing gets the top of the funnel
▪ Sales gets the bottom▪ Your sales people live
and die here
▪ Product instructions are being used by sales as tools
Leads
Customers (conversion)

Sales funnel
IBM: Product content affected purchase decision
89%
▪ Make product instructions available to people in the sales funnel
▪ Shows ▪ How the product works
▪ How easy the product is to use
▪ General perception of “suitability of purpose”
▪ Impacts the CAC

Getting customers is expensive
It costs 6–7 times more to acquire a new customer than retain an existing one –Bain & Company
▪ Customer Acquisition Cost (CAC) is the cost of convincing people to buy your product or service
▪ Basically, it’s the total cost of sales and marketing divided by the # of customers you got
▪ B2C is typically less, B2B is typically more

Sales cycle
▪ B2C
▪ Household decisions
▪ Consumer products▪ Often short
▪ Commodities
▪ Big ticket items▪ Longer
▪ Cars
▪ Low risk
▪ B2B
▪ Business decisions
▪ Solve business problems▪ Long, often several
years
▪ More specialized
▪ Very big ticket items
▪ High risk

Tie us to the sales cycle
Find out where your docs are being used
▪ How many times are docs involved in a sale?
▪ What is the average sale?
▪ Ask the customer if the docs influenced and how much?

Post sales
Our work starts after the sale is made

Keeping customers
A 5% increase in customer retention can increase profitability by 75% —Bain and Co
▪ Customer churn is customers leaving from the back door as you welcome new ones in the front door
▪ Customer churn is one of the most expensive things you can have
▪ An entire industry exists to analyze churn

Clear instructions feel good
71% think the company cares about them
7 out of 10

Customer churn
IBM: Affects product satisfaction
92%
▪ Customers who can use the product use the product
▪ They don’t leave and purchase someone else
▪ Clear product instructions reduce customer churn
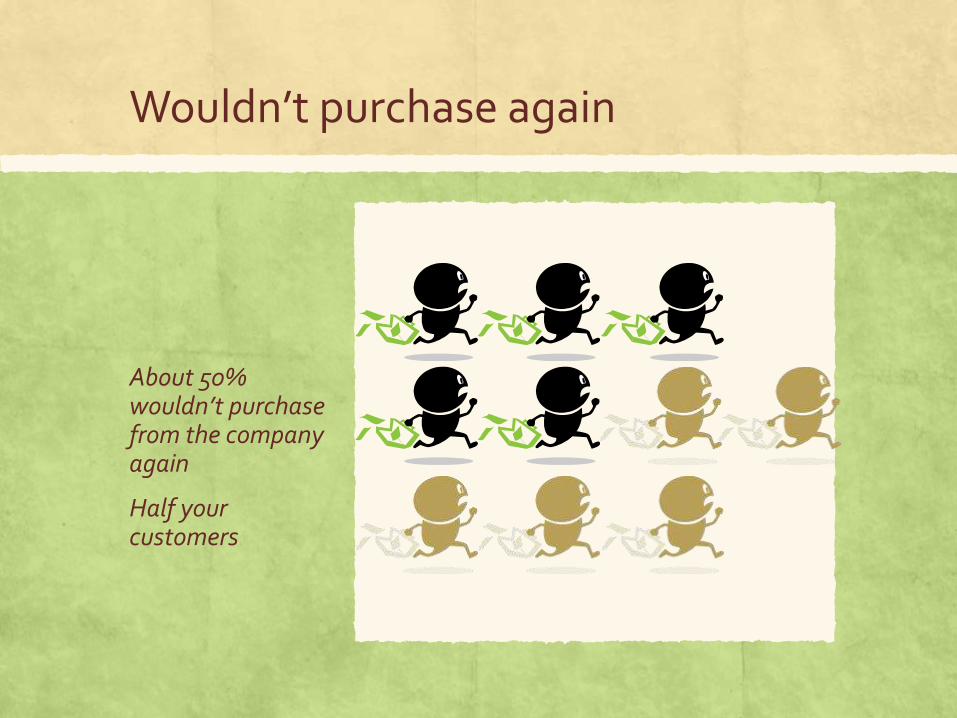
Wouldn’t purchase again
About 50% wouldn’t purchase from the company again
Half your customers

Return rate
Returns have increased 21 percent since 2007, according to an Accenture research report (Dec 2011)
▪ 5% of returns are related to actual product defects
▪ 27% reflect “buyer’s remorse”
▪ 68% of returned products are “No Trouble Found”

Defective or broken
About 25% feel the product is defective
1 in 4

Customer Lifetime Value (CLV)
The probability of selling to an existing customer is 60 – 70%. The probability of selling to a new prospect is 5-20% —Marketing Metrics
▪ Existing customers are already engaged with your products or services
▪ They have a lower cost to keep
▪ They should buy more stuff
▪ Higher monetary value to the business

Clear instructions and lifetime value
IBM: Clear instructions add to the product quality
97%
▪ Increased perception of product quality▪ If this is good, more of this is also
good
▪ Who wants to buy low quality products?
▪ Who can afford that?

Reduce confidence in the product
About 24% report they don’t feel confident about the product
1 in 4

Out of box experience (OOB)
The average U.S. consumer spends 20 minutes trying to make a device work before giving up and returning it to the seller—2006 study by Dutch scientist Elke den Ouden
▪ The feelings when you open the box▪ Printers have set up docs right
there
▪ Apple product are pretty
▪ Can reduce customer support
▪ Give people that feeling of competence▪ Or totally destroy it with bad
instructions

Use product instructions
About 91% of customers use the product instructions

Corporate iniatives
Other places we belong

Customer experience
81% of companies …delivering customer experience excellence are outperforming their competitors —Peppers and Rogers, 2009 Customer Experience Maturity Monitor
▪ Customer experience is the outcome of all of the touch points that your customer has with your organization *
▪ The perception that customers have across all of their interactions with your organization *
▪ It’s a customer-centric view of your company from every touch point
* From Customer Experience Overview, 2011, Bruce Tempkinand Jeanne Bliss

Customer experience is a big deal
Product instructions are a critical part of the customer experience. If customers can’t use the product, it impacts the bottom line —Sharon Burton
▪ Product instructions are the central to the post-sales customer experience
▪ Technical communication is a subset of customer experience ▪ We have so much in common
▪ Tech comm is concerned with the post-sales part

Customer Journey
The process a customer goes through while interacting with your company
Only the customer knows if it was good or not
▪ Typically though of in column phases, for example▪ Awareness
▪ Interest
▪ Desire
▪ Action
▪ Can have customer rows▪ Activity
▪ Motivations
▪ Questions
▪ Barriers

Activity • Setup• Install• Create first thing• Save• Output
Motivations • Get started with product
• Feel confident about feeling confident
• Every day use/work• Make life easier• Not feel dumb• Feel confident• Just tell me• Not get in trouble
• Feel confident and ready to explore
• Ready for details and concepts
• Make use/work easier
Questions • How do I?• What do I need? • Why won't it…?• Now what?
• How do I…? • The previous product
did…?• Why is…so hard?• Where did I see…? • Surely this must…?• Why did… happen? • How do I undo that?
• Can I? • Remind me how I…? • If…, then…?• Why do…this way? • Is there a better way
to do…? • Why did… happen? • How do I undo that?
Barriers • Wrong information format
• Wrong domain of knowledge
• Not enough/too much information
• Bad or wrong information
• No information
• Lots of words or videos
• Many different sources
• Poor keywords for search
• Wrong vocabulary
• Information simply not available in docs
• Don't know the right special words to search
• Multiple sources of content
Customer journey
Out of Box Experience (OOBE)
moved thru quickly
Common/basic tasks Common advanced or common infrequent
tasks
Power User tasks
~67% of your customers live here

Touchpoints
The places where a customer interacts with your company in some manner during the customer journey
Attended and unattended
▪ Touchpoints include: ▪ Letters
▪ Knowledgebase
▪ Support
▪ Website
▪ Product content
▪ Exposes internal processes
▪ Attended vs unattended

Attended vs unattended touchpoints
Customers develop their feelings about us through their interactions with us – the touchpoints
▪ Attended▪ We can monitor what the
customer is doing/how they are interacting with us and have the opportunity to guide that touchpoint experience.
▪ Unattended▪ We can’t monitor to know what
the customer is doing and we have no way to guide that touchpoint experience should it go poorly.

Most of our content is unattended
We often throw something over the wall and hope for the best
▪ We need data for unattended touchpoints
▪ Google Analytics▪ Website
▪ Product instructions
▪ Other tools help here, too
▪ Might also be good to allow ratings and comments

Customer ecosystem
The entire system the customer is involved in during a journey
Including internal stuff the customer never sees
▪ Nothing happens in a vacuum
▪ Customer touchpoints are the tips of icebergs
▪ Processes internal to your company “bubble up” to touchpoints
▪ Often, entire groups have no idea of their customer impact

Customer ecosystems
Mapping out a journey to an ecosystem potentially identifies unknown customer impact
▪ Sort of like root cause analysis
▪ But deeper and more systematic
▪ Allows people to see groups who have customer impact several levels up from where they are making decisions▪ These groups may be very happy
with how they’re doing
▪ But the customer isn’t

What does this mean for our content?
▪ In most companies, we don’t really know how content gets created and distributed▪ Or what is involved in that
creation or distribution
▪ And what barriers that may create for our customers
▪ We need to know this
▪ We need the ecosystem mapped out to show our integration
We may be delighted with our content
Our customer may not be delighted
The customer wins

Measurements
How do start showing our value?

Customer Satisfaction Survey
Your company cares deeply about what the customers think
Get docs in there
▪ Your company probably has a Customer Experience program▪ May be called the “Voice of the
Customer”
▪ Find them
▪ Bring them chocolates
▪ Annual survey▪ Get a few questions on that
▪ About the value of the docs
▪ Don’t ask if it’s all spelled correctly or if the grammar is good

Net Promoter Score (NPS)
“How likely is it that you would recommend [company name/product/service] to a friend or colleague?”
▪ Intended behavior metric▪ Scale 0 to 10
▪ Associates loyalty to future behavior
Group Score Feelings
Promoters 9 or 10 Loyal
Passives 7 or 8 Generally satisfied
Detractors 0 to 6 Unhappy

Calculate your NPS
% of Promoters - % of Detractors = NPS
Often expressed as a number, such as 6.35
Can be a negative number, which is very bad
▪ Happy customers have ▪ Higher lifetime value
▪ Lower churn rate
▪ Lower return rate
▪ Cheaper to sell to
▪ A good follow up to the NPS question is ▪ “Why?”

Can we use this elsewhere?
“How likely is it that you would recommend our instructions [or content] to a friend or colleague?”
▪ Measure the intended behavior for your content
▪ Use the same scale and measurements as the rest of the NPS
▪ If your content isn’t as high (or is higher) as the rest of your NPS▪ That’s something to look at

Customer Effort Score (CES)
"How much effort did your request/ purchase/etc take?“
“How much effort did finding the right information take?”
▪ Customer Effort Score▪ How hard is it to do business
with a company
▪ People don’t like doing business when it’s hard
▪ Increased churn rate
▪ PDFs on a website▪ Hard
▪ Scale of 1 (very easy) to 5 (giant effort)

Resources
Some resources to start making the case for your environment
▪ Customer Journey maps http://bit.ly/18ioSuHhttp://bit.ly/1B5koC3
▪ Sharon Burtonhttp://bit.ly/1NdeAga
▪ Webworkshttp://bit.ly/1wRXKZX
▪ I can’t release the IBM data▪ I know. I’m bummed, too.
