the preparatory study on the siem reap ...open_jicareport.jica.go.jp/pdf/12034732_01.pdfministry of...
TRANSCRIPT
MINISTRY OF INDUSTRY, MINES AND ENERGY SIEM REAP WATER SUPPLY AUTHORITY THE KINGDOM OF CAMBODIA
THE PREPARATORY STUDY
ON THE SIEM REAP WATER SUPPLY
EXPANSION PROJECT IN
THE KINGDOM OF CAMBODIA
FINAL REPORT 2
VOLUME II
MAIN REPORT
August 2011
JAPAN INTERNATIONAL COOPERATION AGENCY NJS CONSULTANTS CO., LTD. KOKUSAI KOGYO CO., LTD.
GED
JR
11-140

The applied exchange rate is:
US$ 1.00 = KHR(Khmer Riel) 4,165 = ¥ 90.5 (as of May 2010)

The Preparatory Study on The Siem Reap Water Supply Expansion Project
Final Report
THE STUDY AREA

The Preparatory Study on The Siem Reap Water Supply Expansion Project
Final Report Photo-i
PHOTOS ON GROUNDWATER STUDY (1/2)
Photo 1: General View of Siem Reap Area nearWest Baray
Photo 2: West Baray
Photo 3: Canal Outlet from West Baray Photo 4:Siem Reap River
Photo 5: SRWSA Water Purification Plant (JapanGrant Aid Project)
Photo 6:Control Room (Check of OperatingCondition of SRWSA Production Wells)
Photo 7: SRWSA Production Well (PW-4)located along Canal
Photo 8:SRWSA Production Well (PW-4)& Control Box

The Preparatory Study on The Siem Reap Water Supply Expansion Project
Final Report Photo-ii
PHOTOS ON GROUNDWATER STUDY (2/2)
Photo 9 : LTb-1 Monitoring Well(Location: In Front of Angkor Wat)
Photo 10: Monitoring Facility of Landsubsidence and Groundwater Level
Photo 11 : WT-4 Monitoring Well Photo 12:Monitoring Equipment & Well(WT-4)
Photo 13 : Khvein Monitoring Well (CompletionDate: May 2011)
Photo 14: Kravan Monitoring Well (CompletionDate: October 2009)
Photo 15 : Monitoring Equipment & Well(Kravan Monitoring Well)
Photo 16:Water Supply Facility of Private Hotel(Water Source: Groundwater)
The Preparatory Study on The Siem Reap Water Supply Expansion Project
Final Report Sum-i
EXECUTIVE SUMMARY
1. Background of the Project
1.1 Authorization
The Preparatory Study on The Siem Reap Water Supply Expansion Project is in pursuance to the
Scope of Work, signed on 29th January 2009, between the Ministry of Industry, Mines and Energy
(MIME), the Siem Reap Water Supply Authority (SRWSA), and Japan International Cooperation
Agency (JICA).
The Study started in May 2009, and completed in August 2011. During the approximately
28-month period, the Study Team will undertake the study in close cooperation with the MIME and
SRWSA counterpart officials. This Final Report presents the results of the activities in the field of
groundwater study.
1.2 Objective of the Study
The objectives of the Study are:
1) To select new water sources(s) for an efficient and sustainable water supply system in Siem
Reap;
2) To conduct surveys of existing wells and assess the potential yield of groundwater
3) To identify an urgent water supply expansion project to satisfy the estimated water demand for
Siem Reap up to a selected target year of the Project;
4) To conduct a feasibility study for the proposed water supply expansion project, provided that the
Project is to be implemented under finance by the Japan’s ODA loan;
5) To formulate a long-term water supply development plan up to year 2030; and
6) To pursue technology transfer to the Cambodian counterpart during the course of the Study.
1.3 Study Area
The study area covers all the communes of the newly established Siem Reap City and one adjacent
commune of the City, for a total of 14 communes.
1.4 Target Year
The year 2030 has been set as the target year for the proposed long-term water supply development
plan, as agreed by and between the JICA mission and Cambodian side in January 2009.
1.5 Methodology of the Study and Component of Final Report 2
The methodology envisaged by the Team in their Inception Report was kept through the study.
Since the Study was conducted in three phases, Final Report 1 (water supply planning) and Final
The Preparatory Study on The Siem Reap Water Supply Expansion Project
Final Report Sum-ii
Report 2 (groundwater study) were prepared in the course of the Study.
In the field of groundwater study, Phase 1 included basic study such as well inventory survey,
electric sounding, water use awareness survey, and basic examination on possibility of
groundwater development by computer simulation. Phase 2 was mainly formed by preparation of
facility development plans and the feasibility study in the field of water supply. Phase 3 was
conducted based on basic information from Phase 1.
• Phase 1 Basic Study on Structure of Groundwater Basin, Well Inventory, and Basic Examination on Possibility of Groundwater Development by Computer Simulation
• Phase 2 Preparation of facility development plans and the feasibility study • Phase 3 Study on groundwater use and assessment
1.6 Contents of Final Report 2
This Final Report 2 deals with the results of the study for Phase 1 and 3.
2. Survey Results for Groundwater Sources
2.1 Geophysical Survey
A Vertical Electrical Sounding (VES) was conducted in the zone along the shore of Tonle Sap lake
extending 30 km on the east and west side of Phnon Kraom hill. In the Study on Water Supply
System for Siem Reap Region in Cambodia (2000), a four-layer subsurface structure was
established as a result of the analysis. By reference to results of the study (2000), the geophysical
survey data of this study were analyzed and the analyzed geological structures are shown in Table
2.2.
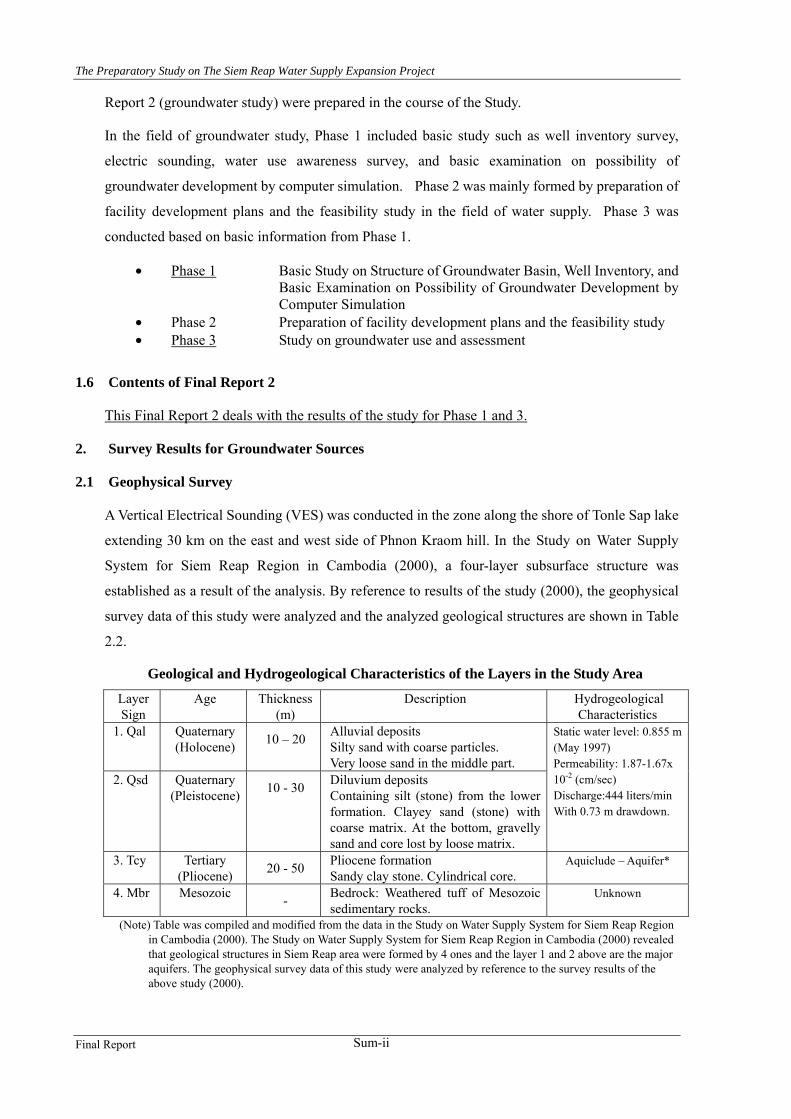
Geological and Hydrogeological Characteristics of the Layers in the Study Area
Layer Sign
Age Thickness (m)
Description Hydrogeological Characteristics
1. Qal Quaternary(Holocene) 10 – 20 Alluvial deposits
Silty sand with coarse particles. Very loose sand in the middle part.
2. Qsd
Quaternary(Pleistocene) 10 - 30
Diluvium deposits Containing silt (stone) from the lower formation. Clayey sand (stone) with coarse matrix. At the bottom, gravelly sand and core lost by loose matrix.
Static water level: 0.855 m (May 1997) Permeability: 1.87-1.67x 10⁻² (cm/sec) Discharge:444 liters/min With 0.73 m drawdown.
3. Tcy Tertiary (Pliocene) 20 - 50 Pliocene formation
Sandy clay stone. Cylindrical core. Aquiclude – Aquifer*
4. Mbr Mesozoic - Bedrock: Weathered tuff of Mesozoic sedimentary rocks.
Unknown
(Note) Table was compiled and modified from the data in the Study on Water Supply System for Siem Reap Region in Cambodia (2000). The Study on Water Supply System for Siem Reap Region in Cambodia (2000) revealed that geological structures in Siem Reap area were formed by 4 ones and the layer 1 and 2 above are the major aquifers. The geophysical survey data of this study were analyzed by reference to the survey results of the above study (2000).

The Preparatory Study on The Siem Reap Water Supply Expansion Project
Final Report Sum-iii
Survey period July 22 to August 29, 2009 Survey method • Interview with structured questionnaire
• On-site measurement
Major survey items
1. Basic information of the site 2. Basic information of the water
supply system 3. Well Structure and water use 4. Water use awareness 5. Water quality
No. of survey targets Total 280
2.2 Well Inventory Survey
Well Inventory survey was
conducted mainly to obtain
basic data for groundwater use
and demand estimation. The
survey targets are large
consumers of groundwater as
outlined in the right table.
All the surveyed establishments use wells deeper than 20 m and 15 % of hotels and guesthouses use
more than 2 wells. On the other hand, 35 % of the hotels, guesthouses, and restaurants use public
water supply system as well.
Average Number of Wells and Depth of Wells Category Hotel Guest house Restaurant Factory Other
Number of wells 1.37 1.06 1.40 1.60 1.03
Depth *(GL-m) 45.5 30.9 31.0 43.6 32.1
(Note) * In each establishment with more than 2 wells, depth of frequently-used well was adopted. Above table shows average depth of the wells. .
The data for water use amount had to be estimated due to the lack of measurement record. It was
estimated based on pump capacity, tank volume, and operational hours of pumps. The results are
summarized in the following table.
Estimated Daily Average Water Use Amount by Category (m3/day/establishment)
Category Hotel Guest house Restaurant Factory Other
Rainy Season Mean 30.35 4.62 8.89 39.00 8.89
Dry Season Mean 47.27 5.65 9.91 85.4 8.51
Due to the increased number of tourists, the water use during the dry season is much larger except
under category “Other” where majority of the establishments are car wash places.
Majority of respondents under tourism related categories (hotel, guesthouse, and restaurants) are
aware of the possible negative effect (lowering of groundwater level and occurrence risk of land
subsidence) of groundwater pumping to the surrounding environment as can be seen in the table
below.
Ratio of Awareness on the Groundwater Issues
Category Hotel Guest house Restaurant Factory Other
Ratio of Awareness (%) 64 53 65 10 17.5
Many of the surveyed establishments are willing to connect to the public supply system when it
becomes available. The main reason is to cut down the operational cost of current groundwater
pumping system.
Outline of the Inventory Survey

The Preparatory Study on The Siem Reap Water Supply Expansion Project
Final Report Sum-iv
The information for the 280 surveyed establishments have been converted to a MS-Access
database and handed over to SRWSA.
2.3 Important Findings from the Inventory Data
The total amount of daily groundwater use in Siem Reap at present (year 2009) was estimated using
the data obtained in the well inventory survey. The following set of data and conditions were
adopted to estimate the daily groundwater use amount for both dry and wet seasons.
Summary of Estimated Present Groundwater Use Amount in Siem Reap Use amount (m3/day) Category
Wet season Dry season Conditions of estimation
Large establishments with own groundwater pumping facilities
3,908 5,786 - Total from 280 establishments in the inventory. Separately calculated for dry and wet seasons.
Large establishments connected to public water supply of SRWSA except the above establishments
3,739 5,009 - Number of : hotels = 61, Guesthouses = 43, Restaurants = 190 (source: SRWSA list of registered customers), - Average pumping amount data for the above category was taken from the inventory data. . - Some part of water is supplied by their own groundwater pumping facilities
Small establishments and ordinary houses
21,569
24,418
- Population of Siem Reap in 2009 = 203,483 (source: department of planning Siem Reap province) - Part of the water is supplied by SRWSA’s public supply system - Unit water use amount = 0.106 m3/day/capita for wet season , 0.120m3/day/capita for dry season
Total 29,216 35,213
The data for monthly average O/M cost and installation cost of water supply facilities obtained in
the inventory survey were used to estimate the unit water production cost (US$ per one cubic meter
of water) for each category. The result is shown below. The figures are also larger than the current
water tariff of public water supply system.
Water Production Cost of Groundwater Users Category Hotel Guest House Restaurant Factory Other
Average unit water production cost* (US$)
0.781 – 0.815 0.802 – 0.835 0.734 – 0.745 0.446 – 0.460 1.028 – 1.048
(Note): Production cost*:production cost range was calculated by estimation that major repair cost of main facilities correspond to 30-35 % of construction cost.
2.4 Field Water Quality Tests
The quality of groundwater in the areas of possible groundwater sources for the water supply was
tested in the field. The water samples were taken mainly from tube wells with a hand pump and
tested for the following indicators. The results were compiled, for the three areas of west of Siem
Reap, East of Siem Reap and Phnon Kraom as in the table below.

The Preparatory Study on The Siem Reap Water Supply Expansion Project
Final Report Sum-v
Average Value of Water Quality by Area (Unit: mg/L)
Item pH EC (μS/cm) Fe Mn NH3-N
DWS* 6.5 – 8.5 1600** 0.3 0.1 1.5
East 5.43 48 1.21 0 0.18
West 5.60 83 2.08 0 0.15
Phnon Kraom 4.90 518 0.45 0.17 0.15 (Note) DWS*: Drinking Water Quality Standards, January 2004, Ministry of Industry, Mines, and Energy
Similar to the water quality test results of the Well Inventory survey, the water quality of the
samples were characterized by low pH and sporadic high iron concentration. In every area,
average values of pH and iron concentration exceed drinking water quality standards and it may
need water treatment for drinking.
2.5 Survey Result of Core Sample
Under this study, a monitoring well (shallow well) was constructed in the premise of Kravan
primary school on October 2009 and two monitoring wells (shallow and deep wells) were
constructed in Khvein primary school on October 2009 and May 2011, respectively.
At the same time, in the same locations as the monitoring wells, a core boring of 80 m in depth were
conducted at each site on October 2009 and the observation survey for the core samples was
followed on January 2011. In addition, in the observation survey, core samples which JSA
(Japanese Government Team for Safeguarding Angkor) carried out in the yards of Angkor ruins
(Angkor Wat and Bayon shrine) in 1995 were also observed as reference samples.
The survey results were different from accepted concept on geological structures in Siem Reap area
based on the study results of “the Study on Water Supply System for Siem Reap Region in
Cambodia (2000)”, namely, geological structures that Quaternary formations of Alluvium and
Diluvium were underlain by claystone (equivalent formations of Tertiary). Claystone in the core
samples by this observation survey was not observed.
According to the above study (2000), in Siem Reap area, geological structures are made up of 4
ones: Alluvium and Diluvium are distributed in the depth of ground surface to about 30 m to 50 m
and are underlain by Tertiary formations with layer thickness of about 40 to 50 m, and basement
rocks of sandstone, siltstone, shale, and tuffaceous breccias of Upper Jurassic, andesite, basaltic
intrusive rocks, and diorite of Late Mesozoic to Tertiary are distributed in the depth of about 70 m
to 80 m.
However, the observation of the core samples in both sites of Khvein and Kravan led to the
following results: (1) In the depth around 40 m, change of formation facies which clearly divide
between Diluvium and Tertiary formations together with the boundary of both formations cannot
be recognized and it can be deemed to be consecutive formations. (2) Formations equivalent to
Tertiary formations does not exist in core samples as a result of core observation. These facts are

The Preparatory Study on The Siem Reap Water Supply Expansion Project
Final Report Sum-vi
also observed in the core samples of Angkor ruins by JSA.
3. Current Status of Groundwater Use
3.1 Present Status of Groundwater Monitoring
In the Study Area, 10 monitoring wells were constructed under the Study on Water Supply System
for Siem Reap Region in Cambodia (2000). SRWSA has collected the monitoring data every
month. Manual measurement of groundwater level has been conducted once a month to confirm the
reliability of monitoring systems since July 2007.
However, Activities done by SRWSA so far is not necessarily enough in reference to
recommendations made in the Basic Design Study (report) on the Project for Improvement of
Water Supply System in Siem Reap Town in the Kingdom of Cambodia (2003). As shown in
“Chapter 3, Table 3.2 Existing Monitoring Wells, Reliability of Monitoring Data, and Necessity
of Calibration”, equipment of many monitoring wells normally does not function and needs its
calibration. SRWSA should take proper measures such as restoring of mal-functioned monitoring
equipment to improve this situation as described in chapter 6, conclusion
Under this study, a monitoring well (shallow well) was constructed in the premise of Kravan
primary school on October 2009 and 2 monitoring wells (shallow and deep wells) were constructed
in Khvein primary school on October 2009 and May 2011, respectively.
3.2 Private Wells
Current status of groundwater use by private wells distributed in Siem Reap area was examined by
using well inventory information and monitoring well data.
・ Tapped aquifers and withdrawal volume of groundwater
Private wells pumping up more than 10 m3/day and owned by large establishments are
concentrated in the city center areas. Those private wells with a pumping capacity of more than 10
m3/day extract 96 % of the total amount of groundwater usage (5,786 m3/day) surveyed by well
inventory survey. The extracting volume of groundwater by private wells is 5,554 m3/day in the dry
season. These private wells mainly extract groundwater from Diluvium formation distributed in the
depths of 20 m to 50 m and partially from Tertiary formation distributed in depth of 60 m to 70 m.
・ Influence of pumping up
Influence of pumping up by the private wells was examined by using WT-5, and LTb-1 and LTb-2
well data collected on the same day on 7 to 9 January 2008. The automatic monitoring data include
low reliability ones in some period due to malfunction of monitoring equipment. Reliability of the
data was confirmed by comparison between automatic and manual measuring data and only data
with high reliability were used for data analysis.
The WT-5 well is located in the center of the city and it monitors groundwater level of Tertiary
The Preparatory Study on The Siem Reap Water Supply Expansion Project
Final Report Sum-vii
formation. The monitoring data of WT-5 well with the lowering of groundwater level of 3 to 6 cm
indicates the influence of pumping of groundwater by private wells in the Tertiary formation in
Siem Reap City area. It also suggest that its pumping have not an influence LTb-1 monitoring site
(due to no fluctuation of groundwater level), tapped to the same Tertiary formation, where is
located apart 5 km from WT-5 monitoring well.
The screens of LTb-2 are set in the Diluvium formation. In the same day, the lowering of
groundwater level of LTb-2 was larger than that of WT-5 because extracting volume of
groundwater from the Diluvium formation by private wells shall be much larger than that of the
Tertiary formation.
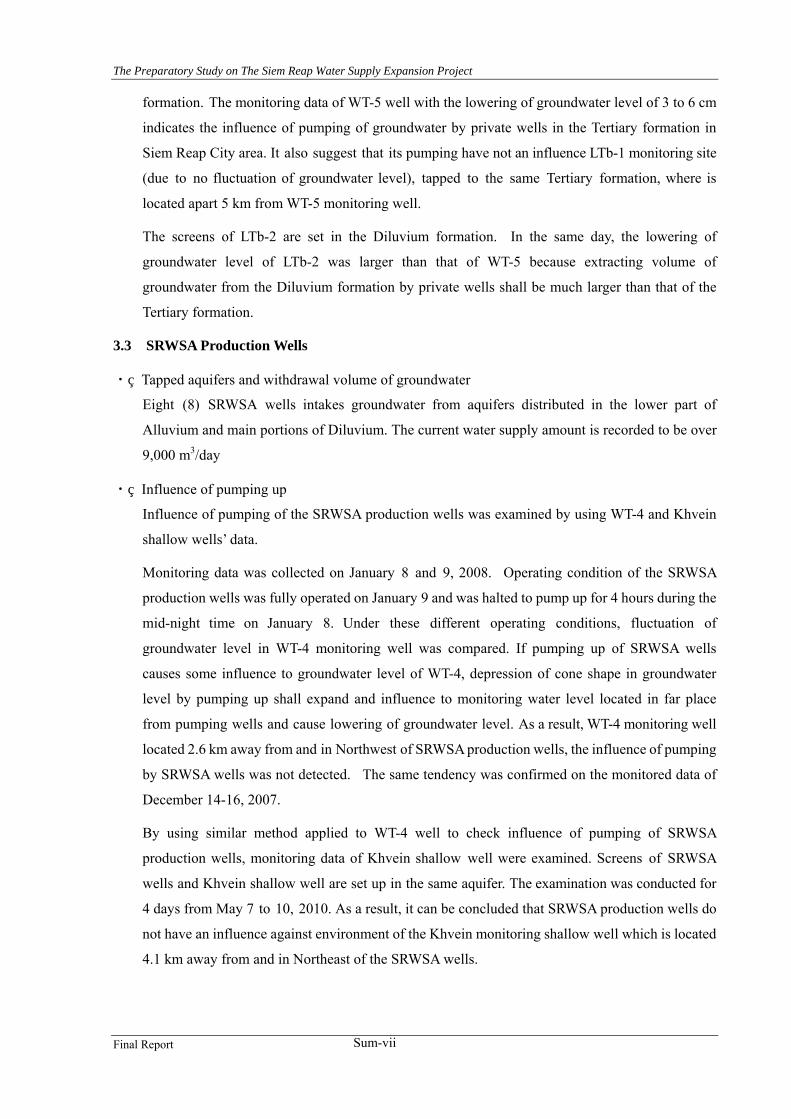
3.3 SRWSA Production Wells
・ Tapped aquifers and withdrawal volume of groundwater
Eight (8) SRWSA wells intakes groundwater from aquifers distributed in the lower part of
Alluvium and main portions of Diluvium. The current water supply amount is recorded to be over
9,000 m3/day
・ Influence of pumping up
Influence of pumping of the SRWSA production wells was examined by using WT-4 and Khvein
shallow wells’ data.
Monitoring data was collected on January 8 and 9, 2008. Operating condition of the SRWSA
production wells was fully operated on January 9 and was halted to pump up for 4 hours during the
mid-night time on January 8. Under these different operating conditions, fluctuation of
groundwater level in WT-4 monitoring well was compared. If pumping up of SRWSA wells
causes some influence to groundwater level of WT-4, depression of cone shape in groundwater
level by pumping up shall expand and influence to monitoring water level located in far place
from pumping wells and cause lowering of groundwater level. As a result, WT-4 monitoring well
located 2.6 km away from and in Northwest of SRWSA production wells, the influence of pumping
by SRWSA wells was not detected. The same tendency was confirmed on the monitored data of
December 14-16, 2007.
By using similar method applied to WT-4 well to check influence of pumping of SRWSA
production wells, monitoring data of Khvein shallow well were examined. Screens of SRWSA
wells and Khvein shallow well are set up in the same aquifer. The examination was conducted for
4 days from May 7 to 10, 2010. As a result, it can be concluded that SRWSA production wells do
not have an influence against environment of the Khvein monitoring shallow well which is located
4.1 km away from and in Northeast of the SRWSA wells.

The Preparatory Study on The Siem Reap Water Supply Expansion Project
Final Report Sum-viii
4. Hydrological Conditions in Siem Reap
4.1 Available Meteorological and Groundwater Monitoring Data
Data from five (5) meteorological stations and eight (8) groundwater monitoring wells have been
collected to be used for groundwater recharge analysis. A strict inspection has conducted for data
availability checking to avoid using wrong data in analysis.
4.2 Groundwater Recharge Analysis
Of the many methods of groundwater recharge analysis, the tank model was selected because it is
excellent for obtaining relatively high precision results by directly linking the precipitation,
evaporation and groundwater level fluctuation.
The annual groundwater recharge is calculated as 341 mm/year, corresponding to an annual
groundwater recharge amount of 435,517,000 m3 in the whole recharge area.
Considering the groundwater basin structure, the recharge amount in upstream area near the Kulen
mountain range has little effect on the water supply area in Siem Reap. Then, groundwater recharge
amount in the Siem Reap area can be calculated as 188,320,000 m3/year, corresponding to a daily
amount of 516,000 m3.
This value is far more than the maximum daily water demand of 86,300 m3/day. However, the
water supply area is a sensible area on land subsidence by groundwater level drawdown because of
the existence of many world famous heritages. And groundwater drawdown is unavoidable when
groundwater is withdrawn. Hence, the magnitudes of groundwater drawdown in different
groundwater use plans should be taken as the main issue for groundwater evaluation.
4.3 Simultaneous Groundwater Observation
To make clear the groundwater level distribution and fluctuation in different seasons in Siem Reap,
simultaneous groundwater observations were conducted twice, in the rainy and dry seasons. The
observation for the rainy season was conducted at the end of September 2009, and the observation
for the dry season at the end of April, 2010.
A relative large groundwater level drawdown in the dry season can be found in town area, when
comparing the water level in the rainy season. This large drawdown in town area can be considered
as the result of large amount of groundwater use by many private wells in town area of Siem Reap.
4.4 Comparison of Groundwater Level Observation Result
In the Study on Water Supply System for Siem Reap Region in Cambodia (2000), 79 wells have
been used for monthly groundwater level observation from February 1998 to November 1999.
More than 25 wells were extracted from the each of two studies for comparison.
The following 2 tables show the water levels in rainy season and dry season in different months and

The Preparatory Study on The Siem Reap Water Supply Expansion Project
Final Report Sum-ix
years. The values in the tables give the water level (m) below the ground surface.
Comparison of Water Level in Rainy Season in Town Area
Time Sept_09 Sep_98 Oct_98 Nov_98 Sep_99 Oct_99 Nov_99Average (m) 1.63 1.41 1.2 1.32 1.24 0.85 0.6 Maximum (m) 5.12 3.51 3.1 3 3.26 2.9 2.32 Minimum (m) 0.2 0.1 0 0.3 0.23 -0.28 -0.41
Comparison of Water Level in Dry Season in Town Area
Time Apr_10 Apr_98 May_98 Apr_99 May_99Average (m) 4.19 3.5 3.5 2.5 2 Maximum (m) 7.4 5 5.1 4.6 4.81 Minimum (m) 2.6 2.35 2.25 1.46 0.82
Compared to the average of observation result in 1998 and 1999, the groundwater level in 2009 got
down in a range from 0.22 m* to 1.03 m* in rainy season and 0.69 m* to 2.19 m* in dry season.
That is, obviously the groundwater drawdown has happened in the town are in Siem Reap.
(Note: 0.22 m* = {1.63 m (2009/9) – 1.41 m (1998/9)}; 1.03 m* = {1.63 m (2009/9) – 0.6 m (1999/11)}; 0.69 m* = {4.19 m (2010/4)
– 3.5 m (1998/4)}; 2.19 m*= {4.19 m (2010/4) – 2 m (1999/5)})
5. Groundwater Simulation
Daily water demand in Siem Reap has been estimated at a maximum of 86,300 m3/day in 2030,
about one sixth of the groundwater recharge amount of 516,000 m3/day. However, not only the
balance between groundwater recharge and withdrawal, but also the effect of groundwater
development has to be taken into consideration. In Siem Reap the most important effect from
groundwater development is the groundwater level drawdown, because the groundwater
drawdown can cause land subsidence.
In this study, several scenarios which combined surface water and groundwater as water supply
sources were supposed. The effect of these plans is evaluated by a groundwater simulation model
created on the basis of hydrogeological survey results and other relative surveys.
5.1 Groundwater Simulation Model Structure
The domain of the groundwater simulation model covers whole water supply service area and
surrounding area, with a extent of 39 km in west-east direction and 46.5 km in north-south
direction.
5.2 Layer Specification
5 layers area is specified in the model: Layer 1 and Layer 2: Shallow aquifer / Layer 3: Aquiclude /
Layer 4: Deep Aquifer / Layer 5: Basement rock. (Note: as shown in “Table 2.2 Geological and
hydrological characteristics of 2-1 Geophysical Survey”, a part of Tertiary formation forms
aquifer. Thus, Tertiary formation in this simulation model is supposed to divide into an aquiclude

The Preparatory Study on The Siem Reap Water Supply Expansion Project
Final Report Sum-x
of 3rd layer and a deep aquifer of 4th layer. As a result, the model including basement rocks (5th
layer) assumes 5 layers as groundwater basin structures.)
5.3 Boundary Condition Specification
Therefore the following features were specified into the model as constant water boundaries. Siem
Reap River / Angkor Wat moat / West Baray (lake) and its channels for water conveyance in its
upstream and downstream sides / Tonle Sap Lake
5.4 Parameter Specification
Hydraulic conductivities are specified for each layer based on the pumping test results of the Study
on Water Supply System for Siem Reap Region in Cambodia (2000). Other parameters are
specified for Storage Coefficient, Effective Porosity, and Specific Yield based on empirical values.
5.5 Model Calibration
1) Steady flow simulation: Steady flow simulation is conducted for model convergence and
general parameter’s specification confirmation.
2) Transient flow simulation: Transient flow simulation is conducted for parameter calibration
by using the last 3 years (2006 - 2008) relative data of precipitation, evaporation, groundwater
withdrawal amount.
5.6 Model Specification for Groundwater Prediction
1) Specification of external factors
Precipitation and Evaporation: The last 20 years of observation results from 1989 to 2008 in
meteorological station Siem Reap City were taken for
precipitation specification.
Water Head for Constant Head Boundary: The result of hydrological observation and the last 10
years water level observation results of Tonle Sap Lake were
used for constant head boundary specifications.
2) Specification of scenarios
Scenario 1: Natural condition without any groundwater use.
Scenario 2: Continue groundwater use by the present amount
{Total withdrawal volume = average 22,176 m3/day: (SRWSA wells’ extraction
volume = 9,000 m3/day) + (private wells’ extraction volume)}
Scenario 3: Expending groundwater supply capability by an amount of 77,000 m3/day.
{Total withdrawal volume = 86,000 m3/day: (SRWSA wells’ extraction volume =
9,000 m3/day) + (Groundwater development volume by new wells 77,000
m3/day)}
Scenario 4: Taken KTC project into consideration and then expending groundwater supply

The Preparatory Study on The Siem Reap Water Supply Expansion Project
Final Report Sum-xi
capability by an amount of 43,000 m3/day.
{Total withdrawal volume = 52,000 m3/day: (SRWSA wells’ extraction volume =
9,000 m3/day) + (Groundwater development volume by new wells 4,300 m3/day)}
Scenario 5: Also taken KTC project into consideration, but the expanding amount is set
following maximum water demand to be 60,000 m3/day.
{Total withdrawal volume = 69,000 m3/day: (SRWSA wells’ extraction volume =
9,000 m3/day) + (Groundwater development volume by new wells 60,000
m3/day)}
Scenario 6: Don’t Build New Wells on the East Side of Siem Reap River, and then set the
expanding amount as 30,000 m3/day.
{Total withdrawal volume = 39,000 m3/day: (SRWSA wells’ extraction volume =
9,000 m3/day) + (Groundwater development volume by new wells 30,000
m3/day)}
Scenario 7: Stop all deep wells withdrawal except SRWSA production wells, using surface
water as water supply source.
(Total withdrawal volume = SRWSA wells’ extraction volume = 9,000 m3/day)
5.7 Simulation Results
1) Groundwater level
Five (5) provisional observation wells are specified in deep aquifer under and near main
heritages. The maximum groundwater level drawdown in these wells are calculated and
summarized in the table below.
Summary of Water Level Drawdown (Unit: m)
Scenario Near_ANW* ANW* ANT* Near WB* WB* Scenario 2 0.73 0.59 0.57 1.34 1.17 Scenario 3 0.7 0.65 0.74 3.31 2.12 Scenario 4 0.41 0.38 0.49 2.31 1.62 Scenario 5 0.51 0.47 0.6 2.83 1.9 Scenario 6 0.45 0.38 0.49 1.71 1.34 Scenario 7 0.13 0.12 0.23 1.16 0.96
(Note): (Column heading*)is the code of each provisional observation well and the locations of each provisional observation well are shown in Figure 5.21. Each location which is indicated by each well number is as follows:
2) Land subsidence
The potential land subsidence amount are calculated and shown in the tables below.
ANW: under Angkor Wat Near ANW: near Angkor Wat ANT: under Angkor Thom WB: under West Baray Near West Baray: near West Baray

The Preparatory Study on The Siem Reap Water Supply Expansion Project
Final Report Sum-xii
Potential Land Subsidence Amount Prediction (Unit: mm)
Location Near_ANW* ANW* ANT* Near WB* WB* Scenario 2 7.02 5.67 5.48 5.84 5.1 Scenario 3 6.73 6.25 7.12 14.43 9.24 Scenario 4 3.94 3.65 4.71 10.07 7.06 Scenario 5 4.9 4.52 5.77 12.34 8.2 Scenario 6 4.33 3.65 4.71 7.46 5.84 Scenario 7 1.25 1.15 2.21 5.06 4.19
(Note): (Column heading*)is the code of each provisional observation well and the locations of each provisional observation well are shown in Figure 5.21. Each location which is indicated by each well number is as follows:
Potential Land Subsidence Amount Prediction for Heritage Site of Bakong (Unit: mm)
Scenario S 2 S 3 S 4 S 5 S 6 S 7 Shallow A 1.59 48.73 20.45 29.93 1.9 0.34 Deep A 0.71 24.23 11.19 16.51 0.92 0.11 Total 2.3 72.96 31.64 46.44 2.82 0.45
(Note) Shallow A: potential land subsidence amount in shallow aquifer. Deep A: potential land subsidence amount in deep aquifer. S: Scenario Total: Sum of potential land subsidence amount of both shallow and deep aquifers
3) Evaluation of all considerable plans
The simulation results reveal that potential land subsidence would occur in all water supply
expansion plans. The following table summarizes the amount of groundwater production and
the potential land subsidence amount in the main heritage sites.
Effect Evaluation of All Considerable Scenarios
Scenario PA (m3/d) LD_ANW LD_WB Bakong Risk Level Scenario 3 77,250 6.25 9.24 72.96 1 Scenario 2 0 5.67 5.1 2.3 2 Scenario 5 60,250 4.52 8.28 46.44 3 Scenario 4 43,060 3.65 7.06 31.64 4 Scenario 6 30,000 3.65 5.84 2.82 5 Scenario 7 0 1.15 4.19 0.45 6 (Note) PA: production amount from new wells (well locations are shown in Figure 5.16). Existing
production amount of SRWSA wells is not included in the figure. LD_ANW: potential land subsidence (mm) under the Angkor Wat heritage site. LD_WB: potential land subsidence (mm) under the West Baray heritage site. Bakong: potential land subsidence (mm) under the Bakong heritage site. Risk Level: the primary standard for risk level setting is the magnitude of the effect to the most important
heritage, Angkor Wat; while the second standard setting is the effect to the second most
ANW: under Angkor Wat Near ANW: near Angkor Wat ANT: under Angkor Thom WB: under West Baray Near West Baray near West Baray

The Preparatory Study on The Siem Reap Water Supply Expansion Project
Final Report Sum-xiii
important heritage, West Baray.
The scenario 7 has the smallest effect to the heritages. However the effect is not zero. Therefore,
it is indispensible to examine if the scenario 7 is really an adaptable plan or not.
The effect on Angkor Wat is 1.15 mm. It is nearly unimaginable to cause inspectable uneven
settlement by this amount of land subsidence. Therefore, it can be considered as safe for
Angkor Wat and other heritages, such as Angkor Thom, which is further than Angkor Wat from
the existing SRWSA well sites.
The effect for West Baray might reach a magnitude of 4.19 mm. Considering the structure of
the heritage West Baray, it was created mainly using clay, which has almost the highest
plasticity among construction materials. On the hand, the groundwater drawdown is not a
suddenly occurring event, but a gradually changing process. For a clay created work on a scale
of several km2 like West Baray, the plasticity is more than enough to compensate for land
subsidence on a magnitude not more than 4.19 mm in a period of several months. Therefore, not
only the deformation would not be detected, because 4.19 mm is too small to be perceived by
humans in a work with the size of West Baray, but also no breaks or cracks could be predicated
from the viewpoint of experience and geotechnical engineering. Therefore, the effect on
heritage of West Baray form the scenario 7 can also be considered sufficiently small as to be
ignored.
The potential land subsidence including both shallow aquifer and deep aquifer for Bakong is as
small as 0.45 mm, smaller than the effect to the Angkor Wat and West Baray. Therefore, the
effect of scenario 7 to Bakong heritage group can be considered as within safe limits.
6. Conclusion and Recommendation
6.1 Conclusion
Survey purposes for the Study are to evaluate groundwater use at present and in the future and to
assess the influence to world heritage-Angkor Wat ruins by pumping of much groundwater due to
rapid increase of tourists and tourist facilities such as hotels and restaurants in recent years in the
Siem Reap City, and to review the reinforcement of groundwater monitoring system.
(1) Evaluation of Groundwater use at Present and in the Future
In Siem Reap City area, current status of groundwater use of large establishments was surveyed by
well inventory survey. As a result, the survey revealed that there were 280 establishments of tourist
facilities such as hotels and public facilities including schools and factories in the city area and they
withdraw groundwater of about 5,786 m3/day in the dry season. In addition, SRWSA pumps up
groundwater of about 9,000 m3/day for water supply and ordinary houses use groundwater of about

The Preparatory Study on The Siem Reap Water Supply Expansion Project
Final Report Sum-xiv
24,000 m3/day by shallow wells. Thus, it is estimated that groundwater of 38,000 m3/day is
presently at least extracted in the city area.
On the other hand, a part of world heritage ruins are located near the city center area and many
tourist facilities such as hotels are also concentrated in the area. If in the future, a large number of
tourist facilities are continuously constructed in the city center area and withdrawal volume of
groundwater increases, it is supposed that groundwater level (hydraulic head) in the area is lowered
and land subsidence by consolidation may be caused and they may have an impact to world
heritage.
To identify this phenomenon, monitoring data of groundwater level of existing observation wells
were analyzed. As a result, in monitoring data, small fluctuation of groundwater level influenced
by pumping wells near monitoring wells was identified but constant and large drawdown of
groundwater level was not observed. In addition, lowering of groundwater level by pumping of
SRWSA production wells in WT-4 monitoring well was not observed. WT-4 well is located along
National Road No.6 and apart about 2.6 km from SRWSA wells. As a result, the influence of
groundwater withdrawal was not identified under existing conditions.
To review the influence to world heritage in future water demand, groundwater simulation was
conducted. In this simulation, the following 6 scenarios to deal with future water demand (86,000
m3/day) for water supply planning year 2030 were prepared and reviewed.
Scenario Scenario Condition Scenario 2 To continue groundwater use by the present amount. Scenario 3 To use groundwater as the only source for water supply. Scenario 4 Scenario 5
To use irrigation canal water from West Baray reservoir for water supply and diminish a part of groundwater development volume (Withdrawal volume including SRWSA production wells: 52,000 m3/day – 69,000 m3/day)
Scenario 6 To lessen the impact to Bakong ruins, new production wells are not planned in eastern bank area of the Siem Reap River.
Scenario 7 As water sources for water supply, pumping by existing wells excluding SRWSA production wells are halted. Only lake water of Tonle Sap is used.
(Note) Scenario 1 is natural condition without groundwater use and a case for comparison for other scenario and for calculation. Thus, it was omitted.
Groundwater development as future water sources for the above scenarios was planned to construct
new production wells in the area of more than 10 m in elevation and about 4 - 5 km in south of
National Road No.6 with width of about 30 km in East – Northwest direction (Well locations are
shown in Figure 5.16).
The simulation results revealed that potential drawdown of groundwater level and land
subsidence to world heritage would occur in all scenarios in a dry year of 50 return years.
Especially, of these scenarios, scenario 3 which used groundwater as the only source for water
supply resulted in the largest land subsidence and the highest risk. Subsequently, scenario 2
which continued groundwater use by the present amount had secondary higher risk. Furthermore,

The Preparatory Study on The Siem Reap Water Supply Expansion Project
Final Report Sum-xv
scenarios 4 to 6 also did not recommend having impact to world heritage. Of these scenarios,
scenario 7 which utilized lake water of Tonle Sap as future source for water supply had the lowest
risk.
For these results, to use lake water of Tonle Sap as alternative water sources without new
groundwater development in Siem Reap area for future water demand was concluded to be
reasonable.
(2) Enforcement of Monitoring System
Since Angkor Wat ruins which are important world heritage are formed by architectural structures
with only piling stones without cements, they are very weaken against land subsidence. Thus, to
conserve ruins from drawdown of groundwater level and land subsidence which may be caused
by over-pumping of groundwater in the city area in the future is very important. In Siem Reap
area, 9 monitoring wells for groundwater levels at 8 sites and 4 observation wells for land
subsidence at 2 sites has been constructed and they monitor groundwater levels and land
subsidence. However, it was revealed by this study that a part of these facilities normally did not
function and their monitoring data had not high reliability. Operating conditions and necessity of
calibration of monitoring equipment in each monitoring wells are shown in Chapter 3. SRWSA
which manages these monitoring wells presently collects and keeps the data as routine works.
They should be able to collect high reliable data by restoring malfunction monitoring equipment.
In Siem Reap area, in addition to SRWSA, Monitoring of groundwater levels by APSARA is
conducted. Though DOWRAM presently does not have any groundwater monitoring system, they
own position to conduct study and research on water resources utilization of the area. At present,
there is no linkage among these organizations. In the future, to conserve important world heritage
in Siem Reap area, it is necessary to enforcement groundwater monitoring systems by creating
their linkage.
6.2 Recommendation
(1) In a dry year of 50 return years, groundwater simulation results revealed that potential land
subsidence to world heritage would occur, not only scenario 3 which used groundwater as
the only source for water supply but also scenario 2 which continued groundwater use by the
present amount. To improve these situations, it is hoped that new water supply system
which is supplied by lake water of Tonle Sap as water source is completed as soon as
possible.
(2) If new water supply system which is supplied by lake water of Tonle Sap is completed in the
future, the ban of pumping by private large establishments’ wells should be conducted. For
this purpose, ordinances and regulations by Siem Reap Province and APSARA should be

The Preparatory Study on The Siem Reap Water Supply Expansion Project
Final Report Sum-xvi
enforced together with campaign to enhance residence’s awareness.
(3) SRWSA generally collects monitoring data of groundwater levels and land subsidence once
a month from monitoring wells and also conducts manual measurement of groundwater
level to check data reliability at the same time. However, collected data of manual
measurement often lack for mismatch of collecting time. SRWSA should keep and conduct
thoroughly setting manners for data collection.
(4) SRWSA should check reliability of auto monitoring data by comparison between manual
measurement and auto monitoring data. It is necessary to compare and put manual
measurement and auto monitoring data at the same observation day/time in the same table
and to check the difference of groundwater levels and correlation by drawing on graph.
(5) SRWSA immediately should restore mal-function monitoring equipment. Present
conditions of each monitoring wells are described in “Chapter 3, 3-1 Current Status of
Groundwater Monitoring.”
(6) SRWSA should builds up mechanism and structure for sharing and putting each monitoring
data to practical use with APSARA and DOWRAM.

The Preparatory Study on The Siem Reap Water Supply Expansion Project
Final Report TOC-i
FINAL REPORT 2
THE PREPARATORY STUDY ON THE SIEM REAP WATER SUPPLY EXPANSION PROJECT
IN THE KINGDOM OF CAMBODIA Study Area Map Photos Target Year Table of Contents List of Tables List of Figures Abbreviations
TABLE OF CONTENTS
Chapter 1. Background of the Project ................................................................................................ 1-1
1-1 Authorization ............................................................................................................................ 1-1 1-2 Objective of the Study............................................................................................................... 1-1 1-3 Study Area................................................................................................................................. 1-1 1-4 Target Year ................................................................................................................................ 1-1 1-5 Methodology of the Study and Component of Final Report 2 ................................................ 1-2 1-6 Contents of Final Report 2 ....................................................................................................... 1-2
Chapter 2. Survey Results for Groundwater Sources........................................................................ 2-1 2-1 Geophysical Survey................................................................................................................... 2-1
2-1-1 Background and Outline ............................................................................................ 2-1 2-1-2 Results ......................................................................................................................... 2-1
2-2 Well Inventory Survey ............................................................................................................ 2-15 2-2-1 Background and Outline .......................................................................................... 2-15 2-2-2 Results ....................................................................................................................... 2-19
2-3 Field Water Quality Test ........................................................................................................ 2-28 2-4 Survey Result of Core Samples.............................................................................................. 2-28
Chapter 3. Current Status of Groundwater Use................................................................................ 3-1 3-1 Present Status of Groundwater Monitoring............................................................................ 3-1 3-2 Construction of New Monitoring Wells.................................................................................... 3-4 3-3 Private Wells ............................................................................................................................. 3-5
3-3-1 Distribution of Private Wells...................................................................................... 3-5 3-3-2 Analysis on Tapped Aquifers and Withdrawal Volume ............................................ 3-7 3-3-3 Analysis on Influence of Pumping Up of Private Wells.......................................... 3-10
3-4 SRWSA Production Wells ....................................................................................................... 3-12 3-4-1 Well Structures and Intake Aquifers ....................................................................... 3-12 3-4-2 Operation of SRWSA Production Wells ................................................................... 3-14 3-4-3 Analysis on Influence of Pumping Up of SRWSA Production Wells...................... 3-14
Chapter 4. Hydrological Conditions in Siem Reap ............................................................................ 4-1 4-1 River Basin Division in Water Supply Area............................................................................ 4-1 4-2 Climatic Conditions .................................................................................................................. 4-2 4-3 Available Meteorological Data ................................................................................................. 4-4 4-4 Available Groundwater Monitoring Data................................................................................ 4-5
4-4-1 Existing Monitoring Wells.......................................................................................... 4-5

The Preparatory Study on The Siem Reap Water Supply Expansion Project
Final Report TOC-ii
4-4-2 Inspection of Groundwater Monitoring Result.......................................................... 4-6 4-4-3 Result of Land Displacement Monitoring................................................................ 4-19
4-5 Groundwater Recharge Analysis............................................................................................ 4-29 4-5-1 Examination of Data Availability............................................................................. 4-29 4-5-2 Result of Groundwater Recharge Calculation for Each Monitoring Site .............. 4-32 4-5-3 Summary of Groundwater Recharge Calculation ................................................... 4-36
4-6 Simultaneous Groundwater Observation.............................................................................. 4-39 4-6-1 Groundwater Level Distribution and Change......................................................... 4-39 4-6-2 Groundwater Level Observation in Previous JICA Study (2000) .......................... 4-45 4-6-3 Comparison of Groundwater Observation Result ................................................... 4-50
Chapter 5. Groundwater Simulation.................................................................................................. 5-1 5-1 Distribution of Heritages in Siem Reap................................................................................... 5-2 5-2 Groundwater Simulation Model Structure.............................................................................. 5-3
5-2-1 Model Domain..............................................................................................................5-5 5-2-2 Boundary Condition Specification.............................................................................. 5-7 5-2-3 Elevation Specification ............................................................................................... 5-7
5-3 Specifications of Parameters .................................................................................................... 5-9 5-3-1 Hydraulic Conductivity............................................................................................... 5-9 5-3-2 Storage Coefficient (dimensionless) ......................................................................... 5-10 5-3-3 Effective Porosity (dimensionless) ........................................................................... 5-10 5-3-4 Specific Yield (dimensionless)................................................................................... 5-10
5-4 Model Calibration - Steady Flow Simulation ........................................................................ 5-10 5-5 Model Calibration - Transient Flow Simulation ................................................................... 5-11
5-5-1 Amount of Groundwater Use.................................................................................... 5-12 5-5-2 Precipitation, Evaporation, Groundwater Recharge and Consumption................ 5-13 5-5-3 Result of Transient Flow Simulation ....................................................................... 5-14
5-6 Model Specification for Groundwater Prediction .................................................................. 5-16 5-6-1 Purpose and Basic Consideration of Groundwater Simulation ............................. 5-16 5-6-2 Station Selection for Precipitation Probability Calculation ................................... 5-19 5-6-3 Methods and Results of Probability Analysis.......................................................... 5-20 5-6-4 Specification of External Factors ............................................................................. 5-21 5-6-5 Specification of Internal Factors - Scenario Specification...................................... 5-24 5-6-6 Specification of Provisional Observation Wells ....................................................... 5-31
5-7 Simulation Results.................................................................................................................. 5-32 5-7-1 Water Level Fluctuation in Provisional Observation Wells ................................... 5-32 5-7-2 Examination of the Land Subsidence ...................................................................... 5-41 5-7-3 Result of Groundwater Level Drawdown Prediction .............................................. 5-43 5-7-4 Evaluation of All Considerable Plans ...................................................................... 5-45
Chapter 6. Conclusion & Recommendation........................................................................................ 6-1 6-1 Conclusion.................................................................................................................................. 6-1 6-2 Recommendation ....................................................................................................................... 6-3

The Preparatory Study on The Siem Reap Water Supply Expansion Project
Final Report TOC-iii
LIST OF TABLES
Table 2.1 Outline of the Geophysical Survey .................................................................................... 2-1 Table 2.2 Geological and Hydrogeological Characteristics of the Layers in the Study Area......... 2-2 Table 2.3 Outline of the Inventory Survey ...................................................................................... 2-15 Table 2.4 Surveyed Establishments by Category ........................................................................... 2-15 Table 2.5 Average Number of Wells and Depth of Wells ................................................................ 2-19 Table 2.6 Estimated Daily Average Water Use Amount by Category............................................ 2-19 Table 2.7 Measured Static Water Level of Main Well by Category ............................................... 2-20 Table 2.8 Measured Dynamic Water Levels.................................................................................... 2-21 Table 2.9 Ratio of Awareness on the Groundwater Issues ............................................................. 2-21 Table 2.10 Items of Analysis and Method........................................................................................ 2-22 Table 2.11 Summary of the Database.............................................................................................. 2-23 Table 2.12 Summary of Estimated Present Groundwater Use Amount in Siem Reap ................ 2-24 Table 2.13 Summary of Water Production Cost of Groundwater Users (Case A)......................... 2-25 Table 2.14 Summary of Water Production Cost of Groundwater Users (Case B)......................... 2-25 Table 2.15 Major Findings from Well Inventory Survey ................................................................ 2-27 Table 2.16 Items of Analysis and Method........................................................................................ 2-28 Table 2.17 Average Value of Water Quality by Area ....................................................................... 2-28 Table 3.1 Outline of Monitoring Wells............................................................................................... 3-2 Table 3.2 Monitoring Activities Done by SRWSA ............................................................................. 3-2 Table 3.3 Existing Monitoring Wells, Reliability of Monitoring Data, and Necessity of Calibration
...................................................................................................................................................... 3-3 Table 3.4 Outline of Newly Constructed Monitoring Wells in 2009 and 2011 ................................ 3-4 Table 3.5 Well Structures of SRWSA Production Wells.................................................................. 3-13 Table 4.1 Basic Information about the Meteorological Stations for Precipitation Analysis .......... 4-5 Table 4.2 Basic Information about Existing Automatic Observation Wells.................................... 4-6 Table 4.3 Basic Information about Existing Automatic Observation Wells.................................... 4-6 Table 4.4 Monthly Summarizing Result of Measured Values in Land Displacement Measurement
Gauge in Deep Aquifer of LTa .................................................................................................. 4-20 Table 4.5 Monthly Summarizing Result of Measured Values in Land Displacement Measurement
Gauge in Shallow Aquifer of LTa ............................................................................................. 4-20 Table 4.6 Monthly Summarizing Result of Measured Values in Land Displacement Measurement
Gauge in Deep Aquifer of LTb.................................................................................................. 4-26 Table 4.7 Monthly Summarizing Result of Measured Values in Land Displacement Measurement
Gauge in Shallow Aquifer of LTb............................................................................................. 4-26 Table 4.8 Result of Data Availability Examination for Tank Model Creation .............................. 4-32 Table 4.9 Monthly and Yearly Average Recharge for Each Station ............................................... 4-37 Table 4.10 Summary of Tank Model Calculation Result................................................................ 4-37 Table 4.11 Summary of Groundwater Level in the Rainy Season ................................................. 4-43 Table 4.12 Summary of Groundwater Level in the Dry Season .................................................... 4-43 Table 4.13 Summary of Groundwater Level Change between Rainy and Dry Seasons............... 4-44 Table 4.14 Comparison of Water Level in Rainy Season by Wells along Main Roads in Siem Reap
.................................................................................................................................................... 4-51 Table 4.15 Comparison of Water Level in Dry Season in Wells along Main Roads in Siem Reap
.................................................................................................................................................... 4-52 Table 4.16 Comparison of Water Level in Rainy Season in Town Area......................................... 4-53 Table 4.17 Comparison of Water Level in Dry Season in Town Area ............................................ 4-53 Table 5.1 Yearly Precipitation at Meteorological Stations in Siem Reap...................................... 5-18 Table 5.2 Result of Precipitation Probability Analysis................................................................... 5-20 Table 5.3 Summary of Water Level Fluctuation for the 5 Provisional Observation Wells Specified
Under or Near Heritage Sites .................................................................................................. 5-40 Table 5.4 Amount of Groundwater Drawdown for Each Scenario in the Groundwater Simulation
Model Cell of Heritage Bakong ................................................................................................ 5-41 Table 5.5 Potential Land Subsidence Amount Prediction.............................................................. 5-42 Table 5.6 Potential Land Subsidence Amount Prediction for Heritage Site of Bakong ............... 5-43 Table 5.7 Effect Evaluation of All Considerable Scenarios ............................................................ 5-46

The Preparatory Study on The Siem Reap Water Supply Expansion Project
Final Report TOC-iv
LIST OF FIGURES
Figure 2.1 Location of Resistivity Sounding Points..........................................................................2-4 Figure 2.2 Location of Resistivity Cross-Sections.............................................................................2-5 Figure 2.3 Cross-sectional View of the Layered Structure in the Surveyed Area (1/8) ..................2-6 Figure 2.4 Cross-sectional View of the Layered Structure in the Surveyed Area (2/8) ..................2-7 Figure 2.5 Cross-sectional View of the Layered Structure in the Surveyed Area (3/8) ..................2-8 Figure 2.6 Cross-sectional View of the Layered Structure in the Surveyed Area (4/8) ..................2-9 Figure 2.7 Cross-sectional View of the Layered Structure in the Surveyed Area (5/8) ................2-10 Figure 2.8 Cross-sectional View of the Layered Structure in the Surveyed Area (6/8) ................ 2-11 Figure 2.9 Cross-sectional View of the Layered Structure in the Surveyed Area (7/8) ................2-12 Figure 2.10 Cross-sectional View of the Layered Structure in the Surveyed Area (8/8) ..............2-13 Figure 2.11 N-S Cross-Sectional View of the Interpreted Geology and Hydrogeology in Siem Reap
....................................................................................................................................................2-14 Figure 2.12 Location of Surveyed Establishments .........................................................................2-18 Figure 2.13 Distribution of Well Screen Location by Category......................................................2-20 Figure 2.14 Ratio of Intention of Connection by Establishment Type...........................................2-22 Figure 2.15 Quality of Water by Well Depth ...................................................................................2-23 Figure 2.16 Location of Wells for Field Water Quality Tests .........................................................2-31 Figure 2.17 Distribution of High Iron Concentration Wells...........................................................2-32 Figure 3.1 Location Map of New and Existing Monitoring Wells ....................................................3-1 Figure 3.2 Distribution of Private Wells with Pumping Capacity of Over 10 m3/day ....................3-5 Figure 3.3 Distribution of Private Wells with Pumping Capacity of Over 10 m3/day ....................3-6 Figure 3.4 Distribution of Extraction Volume by Private Wells with Pumping Capacity of Over 10
m3/day ..........................................................................................................................................3-7 Figure 3.5 Well Depth and Extracted Volume of Groundwater by Private Wells...........................3-8 Figure 3.6 Well Structures and Geological Conditions of WT-5, LTa, and LTb...............................3-9 Figure 3.7 Groundwater Level at WT-5, January 2004..................................................................3-10 Figure 3.8 Groundwater Level at WT-5, 7-9 January 2008............................................................ 3-11 Figure 3.9 Recorded Daily Fluctuation of Groundwater Level at LTb-2, 7-9 January 2008 ....... 3-11 Figure 3.10 Recorded Groundwater Level at LTb-1 Deep Well, 7-9 January 2008 ......................3-12 Figure 3.11 Intake Aquifers of SRWSA Production Wells ..............................................................3-13 Figure 3.12 Monthly Data of SRWSA Production Wells, October 2005 to February 2010...........3-14 Figure 3.13 Geological Conditions and Depth of Screens of WT-4.................................................3-15 Figure 3.14 Groundwater Level at WT-4, March 2007 to February 2008 .....................................3-16 Figure 3.15 Operating Record of SRWSA Production Wells, 8 and 9 January 2008 ....................3-17 Figure 3.16 Daily Fluctuation of Groundwater Level of WT-4 on 8 and 9 January 2008 ............3-17 Figure 3.17 Comparison of Daily Fluctuation on 8 and 9 January 2008 of WT-4.........................3-18 Figure 3.18 Comparison of Daily Fluctuation on 8 and 9 January 2008 of LTb-2 .......................3-19 Figure 3.19 Operation of SRWSA Production Wells, 7 to 10 May 2010.........................................3-20 Figure 3.20 Comparison of Daily Fluctuation of Khvein Shallow Well, 7 to 10 May 2010 ..........3-21 Figure 4.1 Water Supply Service Area and Relevant River Basins .................................................4-1 Figure 4.2 Recharge Area of the Water Supply Service Area...........................................................4-2 Figure 4.3 Distribution of Monthly Precipitation and Evaporation in the Study Area..................4-4 Figure 4.4 Location of Meteorological Stations Within the Study Area ..........................................4-5 Figure 4.5 Observation Result of Groundwater Level Fluctuation (WT-3) .....................................4-7 Figure 4.6 Examination of Auto Observation Result with Manual Observation Data (WT-3) ......4-7 Figure 4.7 Observation Result of Groundwater Level Fluctuation (WT-4) .....................................4-8 Figure 4.8 Examination of Auto Observation Result with Manual Observation Data (WT-4) ......4-8 Figure 4.9 Observation Result of Groundwater Level Fluctuation (WT-5) .....................................4-9 Figure 4.10 Examination of Auto Observation Result with Manual Observation Data (WT-5) ....4-9 Figure 4.11 Observation Result of Groundwater Level Fluctuation (WT-6) .................................4-10 Figure 4.12 Examination of Auto Observation Result with Manual Observation Data (WT-6) .. 4-11 Figure 4.13 Observation Result of Groundwater Level Fluctuation (WT-7) .................................4-12 Figure 4.14 Photograph of the Observation Cabin of Monitoring Site WT-7 (September 11, 2009)
....................................................................................................................................................4-12
The Preparatory Study on The Siem Reap Water Supply Expansion Project
Final Report TOC-v
Figure 4.15 Examination of Auto Observation Result with Manual Observation Data (WT-7).. 4-13 Figure 4.16 Observation Result of Groundwater Level Fluctuation (WT-8)................................. 4-13 Figure 4.17 Observation Result of Groundwater Level Fluctuation (LTa) ................................... 4-14 Figure 4.18 Manual Observation Result in Monitoring Site (LTa)................................................ 4-14 Figure 4.19 Examination of Auto Observation Result with Manual Observation Data (LTa; Deep
aquifer) ...................................................................................................................................... 4-15 Figure 4.20 Examination of Auto Observation Result with Manual Observation Data (LTa; Shallow
aquifer) ...................................................................................................................................... 4-15 Figure 4.21 Observation Result of Groundwater Level Fluctuation (LTb)................................... 4-16 Figure 4.22 Examination of Auto Observation Result with Manual Observation Data (LTb; Deep
Aquifer)...................................................................................................................................... 4-18 Figure 4.23 Examination of Auto Observation Result with Manual Observation Data (LTb; Shallow
Aquifer)...................................................................................................................................... 4-18 Figure 4.24 Land Displacement Observation Result in LTa.......................................................... 4-19 Figure 4.25 Monthly Fluctuation of Land Displacement in Deep Aquifer of LTa ........................ 4-22 Figure 4.26 Monthly Fluctuation of Land Displacement in Shallow Aquifer of LTa ................... 4-22 Figure 4.27 Monthly Average Values of Precipitation, Water Level and Land Displacement in LTa
(Shallow Aquifer; During August 2003 to June, 2009) ........................................................... 4-23 Figure 4.28 Monthly Average Values of Precipitation, Water Level and Land Displacement in LTa
(Deep Aquifer; During August 2003 to June 2009) .............................................................. 4-23 Figure 4.29 Yearly Average of Land Displacement in LTa and Result of Land Displacement
Observation in LTb ................................................................................................................... 4-24 Figure 4.30 Land Displacement Observation Result in LTb ......................................................... 4-25 Figure 4.31 Monthly Fluctuation of Land Displacement in the Deep Aquifer of LTb................. 4-27 Figure 4.32 Monthly Fluctuation of Land Displacement in the Shallow Aquifer of LTb............ 4-27 Figure 4.33 Monthly Average Values of Precipitation, Water Level and Land Displacement in
Observation Site LTb (Deep Aquifer)....................................................................................... 4-28 Figure 4.34 Monthly Average Values of Precipitation, Water Level ............................................. 4-28 Figure 4.35 Yearly Average of Land displacement in LTb.............................................................. 4-29 Figure 4.36 Concept of the Tank Model........................................................................................... 4-31 Figure 4.37 Locations of Groundwater Monitoring Well Sites and Meteorological Observation
Stations in the Study Area ....................................................................................................... 4-31 Figure 4.38 Result of Groundwater Level Simulation by Tank Model in Monitoring Site WT-3 4-32 Figure 4.39 Result of Groundwater Level Simulation by Tank Model in Monitoring Site WT-4 4-33 Figure 4.40 Result of Groundwater Level Simulation by Tank Model in Monitoring Site WT-5 4-33 Figure 4.41 Result of Groundwater Level Simulation by Tank Model in Monitoring Site WT-6 4-34 Figure 4.42 Result of Groundwater Level Simulation in Monitoring Site WT-7 by Tank Model and
Corresponding Precipitation Data of the Meteorological Station Angkor Thom.................. 4-35 Figure 4.43 Result of Groundwater Level Simulation in Monitoring Site WT-7 by Tank Model and
Corresponding Modified Precipitation of the Meteorological Station Prasat Bakong ......... 4-35 Figure 4.44 Result of Groundwater Level Simulation in Monitoring Site WT-7 by Tank Model and
Corresponding Precipitation Data of the Meteorological Station Prasat.............................. 4-36 Figure 4.45 Result of Groundwater Level Simulation by Tank Model in Monitoring Site LTb .. 4-36 Figure 4.46 Result of Simultaneous Groundwater Observation the Rainy Season (September 2009)
.................................................................................................................................................... 4-40 Figure 4.47 Result of Simultaneous Groundwater Observation the Dry Season (April 2010).... 4-41 Figure 4.48 Groundwater Level Change between the Rainy (September 2009) and Dry Seasons
(April 2010)................................................................................................................................ 4-42 Figure 4.49 Relation of Precipitation and Average Groundwater Level ....................................... 4-45 Figure 4.50 Location of Wells Used for Simultaneous Groundwater Level Observation in the Study
on Water Supply System for Siem Reap Region in Cambodia (2000) and This Study. ........ 4-46 Figure 4.51 Distribution of the Highest Groundwater Level in the Study on Water Supply System
for Siem Reap Region in Cambodia (2000) in November 1999 .............................................. 4-47 Figure 4.52 Distribution of the lowest Groundwater Level in the Study on Water Supply System for
Siem Reap Region in Cambodia (2000) in May 1998.............................................................. 4-48 Figure 4.53 Groundwater Level Change between the Highest Month (November 1999) and the
Lowest Month (May 1998) in the Study on Water Supply System for Siem Reap Region in Cambodia (2000) ....................................................................................................................... 4-49
The Preparatory Study on The Siem Reap Water Supply Expansion Project
Final Report TOC-vi
Figure 4.54 Location Map of Selected Wells for Water Level Observation Result Comparison ..4-50 Figure 4.55 Location Map of Selected Wells in Town Area in Siem Reap for Water Level
Observation Result Comparison ..............................................................................................4-52 Figure 5.1 Distribution Map of Main Heritage sites in Siem Reap .................................................5-2 Figure 5.2 Groundwater Simulation Model Domain ........................................................................5-5 Figure 5.3 Specification of Constant Head Boundary ......................................................................5-7 Figure 5-4 Example of Vertical Section in North – South Direction................................................5-8 Figure 5-5 Example of Vertical Section in East – West Direction ...................................................5-9 Figure 5.6 Result of Steady Flow Simulation.................................................................................. 5-11 Figure 5.7 Production Amount of SRWSA Existing Wells and Private Wells in Urban Area in Siem
Reap from 2006-2008 ................................................................................................................5-13 Figure 5.8 Observed Precipitation, Evaporation, Specified Groundwater Recharge and
Consumption..............................................................................................................................5-14 Figure 5.9 Location of Provisional Observation Wells (5 Shallow Wells) and Well Cells.............5-15 Figure 5.10 Groundwater Level Fluctuation in the Specified Observation Wells (5 Shallow Wells) in
the Last 3 Years (2006-2008) ....................................................................................................5-15 Figure 5.11 Monthly Precipitation Fluctuation in Siem Reap City Meteorological Station ........5-19 Figure 5.12 Probability Curve of Precipitation in Siem Reap City Meteorological Station.........5-21 Figure 5.13 Specification of Recharge and Consumption for the Simulation Span 2009 -2030 Based
on the Observation Data from 1989 to 2008 and Probability Analysis Result with a Return Year of 50 ...................................................................................................................................5-22
Figure 5.14 Specification of River Level Fluctuation .....................................................................5-23 Figure 5.15 Specification of Tonle Sap Lake Water Level Fluctuation..........................................5-24 Figure 5.16 Location of New Production Wells for Scenario 3 .......................................................5-26 Figure 5.17 Specification of Groundwater Withdrawal for Scenario 3..........................................5-26 Figure 5.18 Water Supply Development Plan .................................................................................5-27 Figure 5.19 Specification of Water Supply Apportionment for Scenario 4 ....................................5-28 Figure 5.20 Specification of Water Supply Apportionment for Scenario 5 ....................................5-28 Figure 5.21 Specified New Production Wells and Provisional Observation Wells (5 Deep Wells) for
Examination of Effect to the Heritage sites in Each Simulation Scenario ...........................5-29 Figure 5.22 Specification of Water Supply Apportionment for Scenario 6 ....................................5-30 Figure 5.23 Specification of Water Supply Apportionment for Scenario 7 ....................................5-31 Figure 5.24 Water Level Fluctuation of Provisional Observation Well No.1 (Central Part of Siem
Reap City, Shallow Aquifer)......................................................................................................5-32 Figure 5.25 Water Level Fluctuation of Provisional Observation Well No.2 (Central Part of Existing
SRWSA Wells, Shallow Aquifer)...............................................................................................5-33 Figure 5.26 Water Level Fluctuation of Provisional Observation Well No.3 (Near Angkor Wat, Deep
Aquifer) ......................................................................................................................................5-34 Figure 5.27 Water Level Fluctuation of Provisional Observation Well No.4 (Near West Baray, Deep
Aquifer) ......................................................................................................................................5-35 Figure 5.28 Water Level Fluctuation of Provisional Observation Well No.5 (Under West Baray,
Deep Aquifer).............................................................................................................................5-36 Figure 5.29 Water Level Fluctuation of Provisional Observation Well No.6 (Under Angkor Thom,
Deep Aquifer).............................................................................................................................5-36 Figure 5.30 Water Level Fluctuation of Provisional Observation Well No.7 (Under Angkor Wat,
Deep Aquifer).............................................................................................................................5-37 Figure 5.31 Water Level Fluctuation of Provisional Observation Well No.8 (Southwest of West
Baray, Shallow Aquifer) ............................................................................................................5-38 Figure 5.32 Water Level Fluctuation of Provisional Observation Well No.9 (Southeast of Siem Reap
City, Shallow Aquifer) ...............................................................................................................5-38 Figure 5.33 Water Level Fluctuation of Provisional Observation Well No.10 (Southern Part of Siem
Reap City, Shallow Aquifer)......................................................................................................5-39 Figure 5.34 Groundwater Level Drawdown in Shallow Aquifer (Scenario 1-Scenario 2) ............5-48 Figure 5.35 Groundwater Level Drawdown in Deep Aquifer (Scenario 1-Scenario 2) .................5-48 Figure 5.36 Groundwater Level Drawdown in Shallow Aquifer (Scenario 1-Scenario 3) ............5-49 Figure 5.37 Groundwater Level Drawdown in Deep Aquifer (Scenario 1-Scenario 3) .................5-49 Figure 5.38 Groundwater Level Drawdown in Shallow Aquifer (Scenario 1-Scenario 4) ............5-50 Figure 5.39 Groundwater Level Drawdown in Deep Aquifer (Scenario 1-Scenario 4) .................5-50

The Preparatory Study on The Siem Reap Water Supply Expansion Project
Final Report TOC-vii
Figure 5.40 Groundwater Level Drawdown in Shallow Aquifer (Scenario 1-Scenario 5) ............ 5-51 Figure 5.41 Groundwater Level Drawdown in Deep Aquifer (Scenario 1-Scenario 5)................. 5-51 Figure 5.42 Groundwater Level Drawdown in Shallow Aquifer (Scenario 1-Scenario 6) ............ 5-52 Figure 5.43 Groundwater Level Drawdown in Deep Aquifer (Scenario 1-Scenario 6)................. 5-52 Figure 5.44 Groundwater Level Drawdown in Shallow Aquifer (Scenario 1-Scenario 7) ............ 5-53 Figure 5.45 Groundwater Level Drawdown in Deep Aquifer (Scenario 1-Scenario 7)................. 5-53

The Preparatory Study on The Siem Reap Water Supply Expansion Project
Final Report TOC-viii
ABBREVIATIONS
AMSL ANT ANW BOT CA D/D DOWRAM DWL EC EIA EIRR E/N FIRR GDP GPS GW I/P JICA JPY L/A L/s MIME MOWRAM M/P NPV ODA O&M PS PVC SAPROF SRWSA STEP SWL TOR UTM VES WB WL WMO
Above Mean Sea Level Angkor Thom Angkor Wat Build Operate Transfer Concession Agreement Detailed Design Department of Water Resources and Meteorology Dynamic Water Level Electric Current Environmental Impact Assessment Economic Internal Rate of Return Exchange of Notes Financial Internal Rate of Return Gross Domestic Product Global Positioning System Groundwater Implementation Program Japan International Cooperation Agency Japanese Yen Loan Agreement Liter per second Ministry of Industry, Mines and Energy Ministry of Water Resources and Meteorology Master Plan Net Present Value Official Development Assistance Operation and Maintenance Pumping Station Polyvinyl Chloride Special Assistance for Project Formation Siem Reap Water Supply Authority Special Terms for Economic Partnership Static Water Level Terms of Reference Universal Transverse Mercator Vertical Electric Sounding West Baray Water Level World Meteorological Organization

Chapter 1. Background of the Project
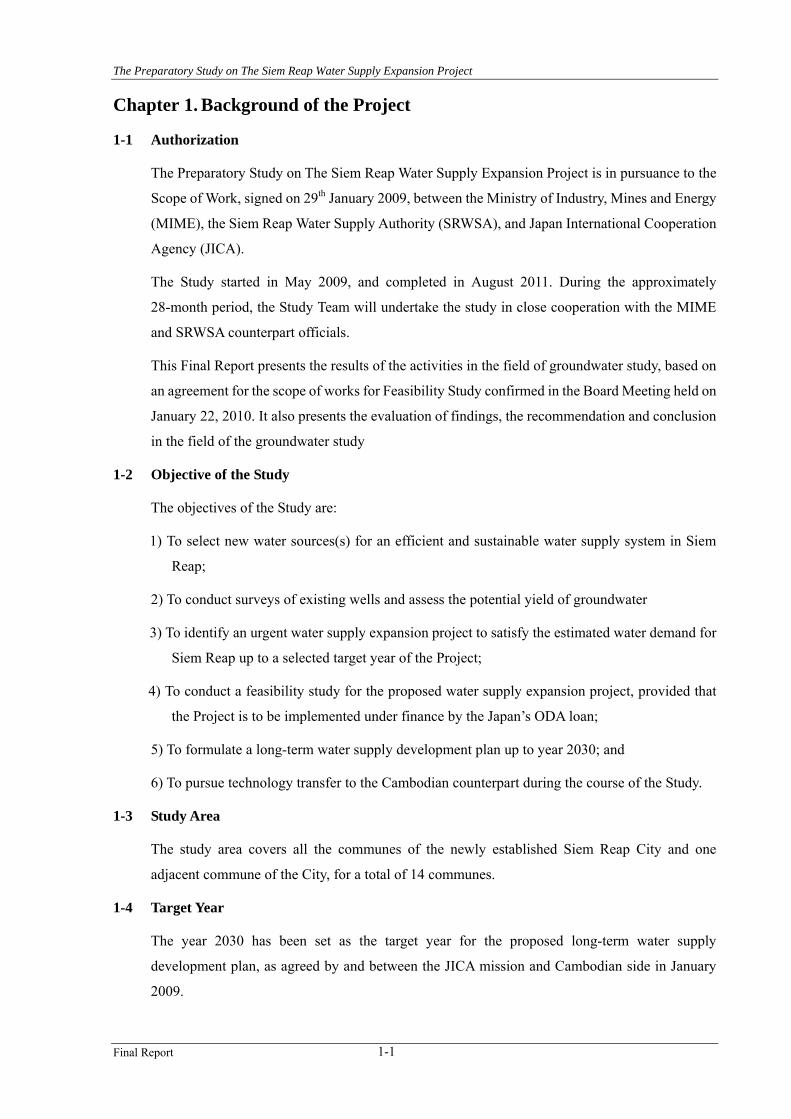
The Preparatory Study on The Siem Reap Water Supply Expansion Project
Final Report 1-1
Chapter 1. Background of the Project
1-1 Authorization
The Preparatory Study on The Siem Reap Water Supply Expansion Project is in pursuance to the
Scope of Work, signed on 29th January 2009, between the Ministry of Industry, Mines and Energy
(MIME), the Siem Reap Water Supply Authority (SRWSA), and Japan International Cooperation
Agency (JICA).
The Study started in May 2009, and completed in August 2011. During the approximately
28-month period, the Study Team will undertake the study in close cooperation with the MIME
and SRWSA counterpart officials.
This Final Report presents the results of the activities in the field of groundwater study, based on
an agreement for the scope of works for Feasibility Study confirmed in the Board Meeting held on
January 22, 2010. It also presents the evaluation of findings, the recommendation and conclusion
in the field of the groundwater study
1-2 Objective of the Study
The objectives of the Study are:
1) To select new water sources(s) for an efficient and sustainable water supply system in Siem
Reap;
2) To conduct surveys of existing wells and assess the potential yield of groundwater
3) To identify an urgent water supply expansion project to satisfy the estimated water demand for
Siem Reap up to a selected target year of the Project;
4) To conduct a feasibility study for the proposed water supply expansion project, provided that
the Project is to be implemented under finance by the Japan’s ODA loan;
5) To formulate a long-term water supply development plan up to year 2030; and
6) To pursue technology transfer to the Cambodian counterpart during the course of the Study.
1-3 Study Area
The study area covers all the communes of the newly established Siem Reap City and one
adjacent commune of the City, for a total of 14 communes.
1-4 Target Year
The year 2030 has been set as the target year for the proposed long-term water supply
development plan, as agreed by and between the JICA mission and Cambodian side in January
2009.
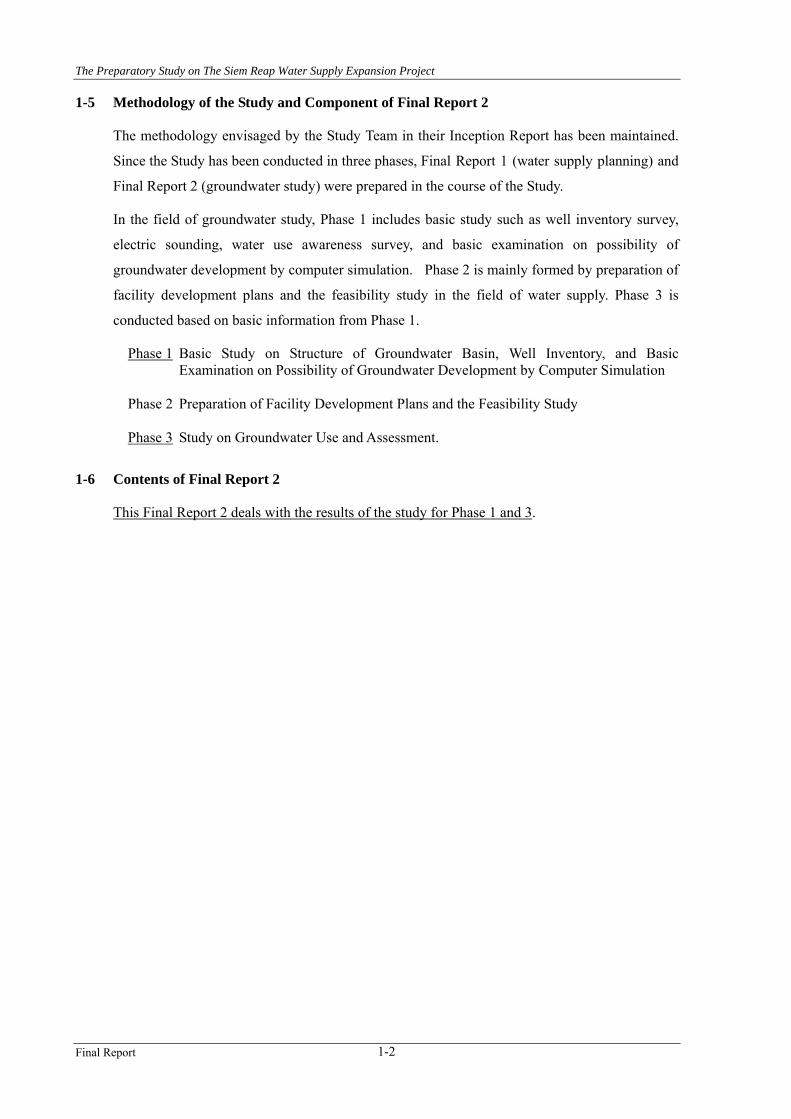
The Preparatory Study on The Siem Reap Water Supply Expansion Project
Final Report 1-2
1-5 Methodology of the Study and Component of Final Report 2
The methodology envisaged by the Study Team in their Inception Report has been maintained.
Since the Study has been conducted in three phases, Final Report 1 (water supply planning) and
Final Report 2 (groundwater study) were prepared in the course of the Study.
In the field of groundwater study, Phase 1 includes basic study such as well inventory survey,
electric sounding, water use awareness survey, and basic examination on possibility of
groundwater development by computer simulation. Phase 2 is mainly formed by preparation of
facility development plans and the feasibility study in the field of water supply. Phase 3 is
conducted based on basic information from Phase 1.
Phase 1 Basic Study on Structure of Groundwater Basin, Well Inventory, and Basic Examination on Possibility of Groundwater Development by Computer Simulation
Phase 2 Preparation of Facility Development Plans and the Feasibility Study Phase 3 Study on Groundwater Use and Assessment.
1-6 Contents of Final Report 2
This Final Report 2 deals with the results of the study for Phase 1 and 3.
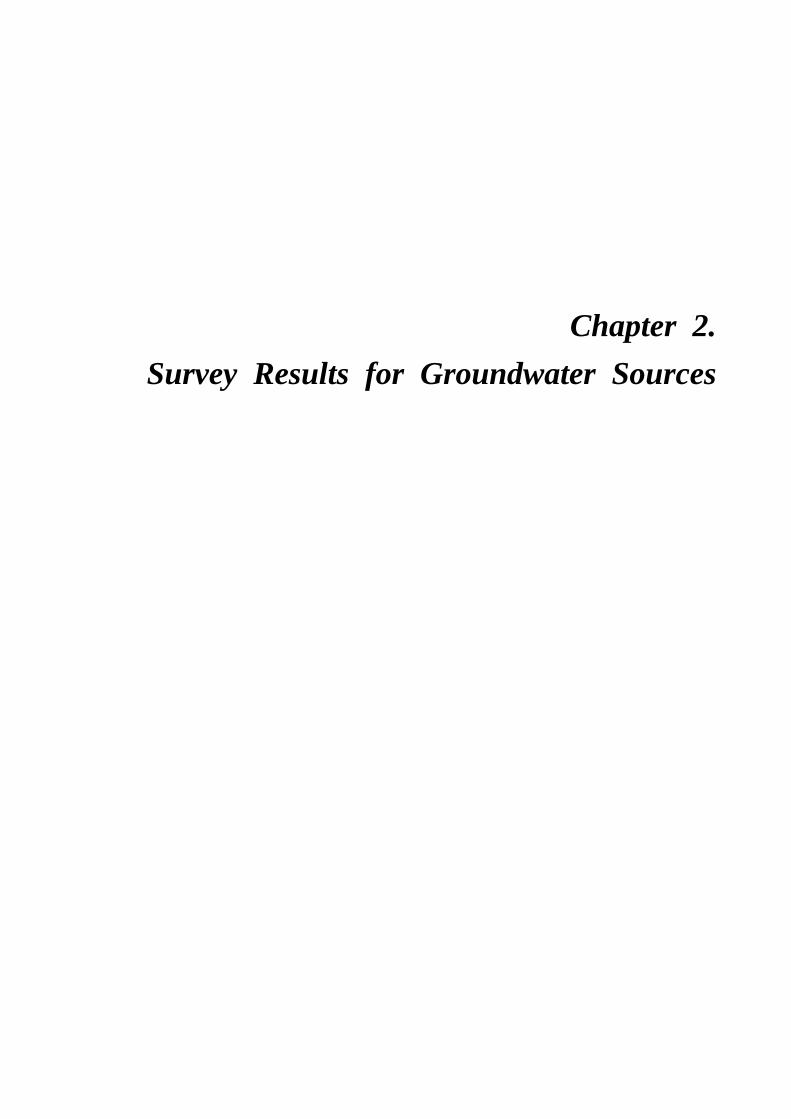
Chapter 2. Survey Results for Groundwater Sources

The Preparatory Study on The Siem Reap Water Supply Expansion Project
Final Report 2-1
Chapter 2. Survey Results for Groundwater Sources
2-1 Geophysical Survey
2-1-1 Background and Outline
The use of groundwater in the plain area along the shore of Tonle Sap Lake located to the west of
Phnon Kroam hill was proposed by the preliminary study team as a possible alternative source for
water supply to the city of Siem Reap. Some geological surveys had already been conducted and
had clarified the underground geology of the urban and suburban areas of Siem Reap city prior to
the preliminary study. However, there has been little geological information available on the zone
along the shore of Tonle Sap Lake. For this reason, a resistively sounding survey to investigate the
underground geology was first planned for this zone. Later, the study team (of this study), had a
discussion with SRWSA staff at the beginning of the study in July 2009 and decided to extend the
target area for the survey to the east of Phnon Kraom hill, in consideration of their request.
The entire survey area, as a result, extended about 30 km on both western and eastern sides of
Phnon Kraom hill along the shore of Tonle Sap Lake. The survey primarily aimed at determining
the position of the bedrock in the area and attempted to discern different types of aquifers
overlying the bedrock. The surveyed points are shown in Figure 2.1 along with the locations of
the resistivity survey points of the Study on Water Supply System for Siem Reap Region in
Cambodia (2000). The outline of the survey is summarized below:
Table 2.1 Outline of the Geophysical Survey Survey period July 13 to 30, 2009 Type of sounding Vertical resistivity sounding (VES) No. of survey points 53 Electrode array Schlumberger Target depth 150 m
The survey points were arranged at intersections of crude grid lines to cover the area as uniformly
as possible. However, since the survey was conducted in the middle of the rainy season, most of
the surveyed sites had to be located in a small piece of dry land in an inundated terrain.
2-1-2 Results
The survey results were analyzed together with existing borehole geological log data to
distinguish aquifers and the bedrock. The sounding data for each survey point was interpreted
using a computer program for inversion analysis. In the Study on Water Supply System for Siem
Reap Region in Cambodia (2000), a four-layer subsurface structure was established as a result of
the analysis of over 100 sounding points and geological log data from eight test boreholes. In the
Study on Water Supply System for Siem Reap Region in Cambodia (2000), a four-layer
subsurface structure was established as a result of the analysis. By reference to results of the
study (2000), the geophysical survey data of this study were analyzed and the analyzed

The Preparatory Study on The Siem Reap Water Supply Expansion Project
Final Report 2-2
geological structures are shown in Table 2.2 and the results of the analysis (resistivity curve
fitting with a layered model) is given in the Supporting Report.
Table 2.2 Geological and Hydrogeological Characteristics of the Layers in the Study Area Layer Sign
Age Thickness (m)
Description Hydrogeological Characteristics
1. Qal Quaternary(Holocene) 10 – 20
Alluvial deposits Silty sand with coarse particles. Very loose sand in the middle part.
2. Qsd
Quaternary(Pleistocene) 10 - 30
Diluvium deposits Containing silt (stone) from the lower formation. Clayey sand (stone) with coarse matrix. At the bottom, gravelly sand and core lost by loose matrix.
Static water level: 0.855 m (1997 May) Permeability: 1.87-1.67 x 10⁻² (cm/sec) Discharge:444 liters/min with 0.73 m drawdown.
3. Tcy Tertiary (Pliocene) 20 - 50
Pliocene formation Sandy clay stone. Cylindrical core.
Aquiclude – Aquifer*
4. Mbr Mesozoic -
Bedrock: Weathered tuff of Mesozoic sedimentary rocks.
Unknown
(Note) Table was compiled and modified from the data in the Study on Water Supply System for Siem Reap Region in Cambodia (2000). The Study on Water Supply System for Siem Reap Region in Cambodia (2000) revealed that geological structures in Siem Reaap area were formed by 4 ones and the layer 1 and 2 above are the major aquifers.
The only available geological log data for the surveyed area is of the test well drilling work
carried out in 2000 at the south-eastern foot of Phnon Kraom hill, some 300 m to the south of VES
53. Bedrock was struck at depths of 27 to 43 m from the ground at this site. Based on the analysis
results and in consideration of horizontal geological continuity, several cross-sections of
resistivity structure of the surveyed area were prepared and presented as Figure 2.2 –Figure 2.10.
The interpreted geological section that cuts across the entire Siem Reap is given in Figure 2-11
along with some hydrogeological information.
(1) Bedrock
The analysis revealed that the depth to the bedrock is likely to be 50 to 80 m below ground level,
except around Phnon Kraom hill where the bedrock is exposed and forms the hill. The drilling
logs mentioned above show that the bedrock is located deeper than 30 m, a few hundreds of
meters away from the hill. This suggests that this topographic rise of the bedrock is limited to this
point. The resistivity of the bedrock itself is highly variable due to that fact that it consists of
different type of layered rocks and that they steeply dip southeast with a strike of 60 degrees
bearing. Bedrock of high resistivity values is found on the western side of Phnon Kraom hill
around VES 010 and VES 22. These rocks have resistivity values of more than 1000 ohm-m and
interpreted as impermeable rocks such as siliceous acidic tuff and fresh crystalline diorite.
(2) Overlying Layers
There are three overlying layers above the bedrock. The first layer from the ground is alluvial
deposits made up of alternation of thin layers of sand, silt, and clay. It is possible that more
fine-grained sediments are deposited in the surveyed area in comparison with the area surveyed in

The Preparatory Study on The Siem Reap Water Supply Expansion Project
Final Report 2-3
the Study on Water Supply System for Siem Reap Region in Cambodia (2000), since the
surveyed area is located downstream and its topography is very gentle. The thickness of this layer
is variable, ranging from 10 to 25 m, and the resistivity values range from 5 to 1,000 Ohm-m.
The second layer consists of sandy deposits characterized by relatively higher resistivity values as
compared to the third layer underneath. The thickness ranges from 5 to 35 m and the resistivity
values are generally between 30 to 500 Ohm-m.
The third layer is characterized by low resistivity values of normally less than 100 ohm-m. The
layer is much thicker than the overlying two layers and the thickness ranges from 10 to 55 m.
It should be noted that the geological information available in the surveyed area to date is very
limited. Thus the interpretation above primarily counted on the resistivity sounding data. It is very
likely that geological and, thus, hydrogeological characteristics of the layers differ further
upstream in the Seam Reap town area: coarser sediment and higher permeability. It is
recommended that several drilling cores be taken to confirm this interpretation.

The Preparatory Study on The Siem Reap Water Supply Expansion Project
Final Report 2-4
Figure 2.1 Location of Resistivity Sounding Points
Master Plan Study: The Study on Water Supply Sysem for Siem Reap Region in Cambodia (2000)

The Preparatory Study on The Siem Reap Water Supply Expansion Project
Final Report 2-5
Figure 2.2 Location of Resistivity Cross-Sections
(Note, Master Plan 2000: the Study on Water Supply System for Siem Reap Region in Cambodia (2000))

The Preparatory Study on The Siem Reap Water Supply Expansion Project
Final Report 2-6
Note: Numbers beside the bars are resistivity values of the layers in Ohm-m
A A'
0 4000 8000 12000
Horizontal Distance (m)
-150
-100
-50
0El
evat
ion
(m A
MSL
)
20970
13
8
82
1
243140
44
5
24
10
147
331
63
4
32
7
313
20756
5
49
6
582
28176
14
20
2
89
1043
34522
39
4
17
19
7
VES 001 VES 002 VES 004 VES 005 VES 006 VES 007
Cross Section A
Qal
Qsd
Tcy
Mbr
Figure 2.3 Cross-sectional View of the Layered Structure in the Surveyed Area (1/8)

The Preparatory Study on The Siem Reap Water Supply Expansion Project
Final Report 2-7
0 4000 8000 12000 16000
Horizontal Distance (m)
-150
-100
-50
0El
evat
ion
(m A
MSL
)113480
16
18
3
163
1314
80821379
5
47
2
1
40103
11
14
3
24
35
67
40
9
19
14530334
42
134
3
623
1754148
1718
5
7128
108
36
6
25
VES 010 VES 013 VES 016 VES 020 VES 023 VES 053 VES 030
Cross Section B
Note: Numbers beside the bars are resistivity values of the layers in Ohm-m
B B'
Qal
Qsd
Tcy
Mbr
Exploratory wells
Phnon Kraom hill
Figure 2.4 Cross-sectional View of the Layered Structure in the Surveyed Area (2/8)

The Preparatory Study on The Siem Reap Water Supply Expansion Project
Final Report 2-8
0 4000 8000 12000 16000
Horizontal Distance (m)
-150
-100
-50
0El
evat
ion
(m A
MSL
)
1754148
1718
5
24575
46
299
5
54
27948237193
772
2
238
499
59108
932
93
5
112
421536
14
115
2321
123
1119
17
2
112
838
155
798
7
25
9
VES 053 VES 032 VES 035 VES 038 VES 041 VES 048 VES 051
Cross Section C
Note: Numbers beside the bars are resistivity values of the layers in Ohm-m
C C'
Qal
Qsd
Tcy
Mbr
Figure 2.5 Cross-sectional View of the Layered Structure in the Surveyed Area (3/8)
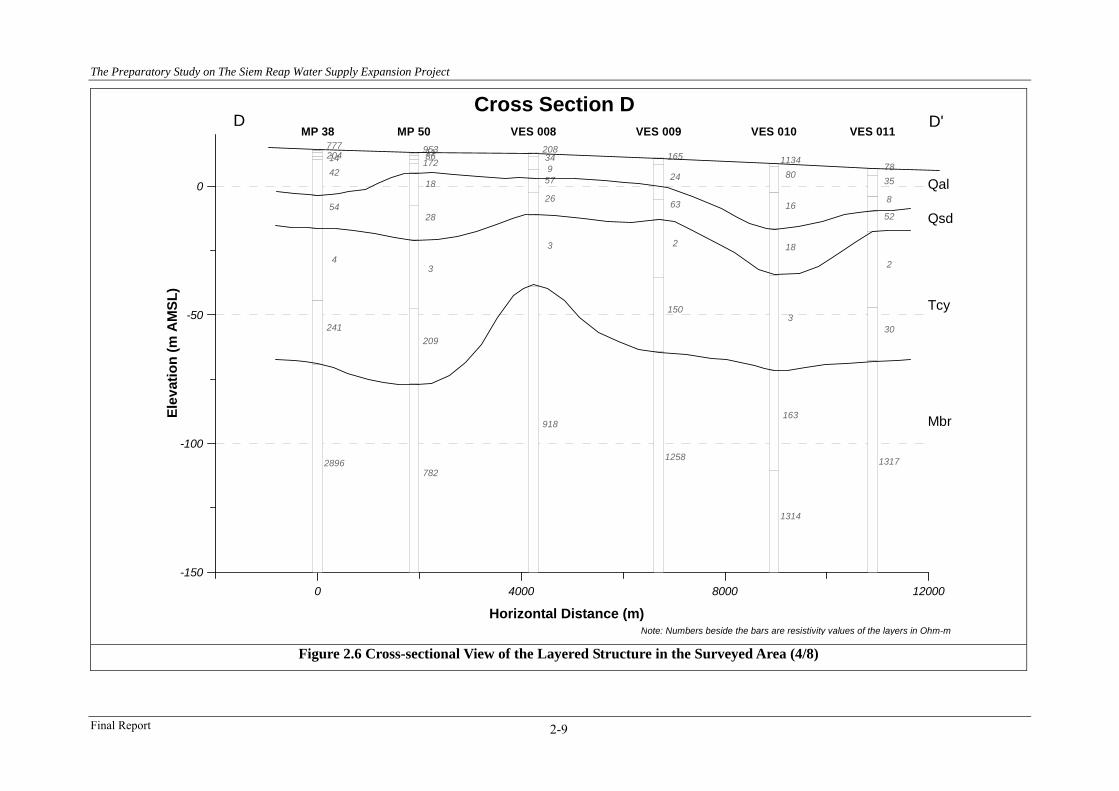
The Preparatory Study on The Siem Reap Water Supply Expansion Project
Final Report 2-9
0 4000 8000 12000
Horizontal Distance (m)
-150
-100
-50
0El
evat
ion
(m A
MSL
)
7772041442
54
4
241
2896
9531186172
18
28
3
209
782
208349
57
26
3
918
165
24
63
2
150
1258
113480
16
18
3
163
1314
7835
8
52
2
30
1317
MP 38 MP 50 VES 008 VES 009 VES 010 VES 011
Cross Section D
Note: Numbers beside the bars are resistivity values of the layers in Ohm-m
D D'
Qal
Qsd
Tcy
Mbr
Figure 2.6 Cross-sectional View of the Layered Structure in the Surveyed Area (4/8)
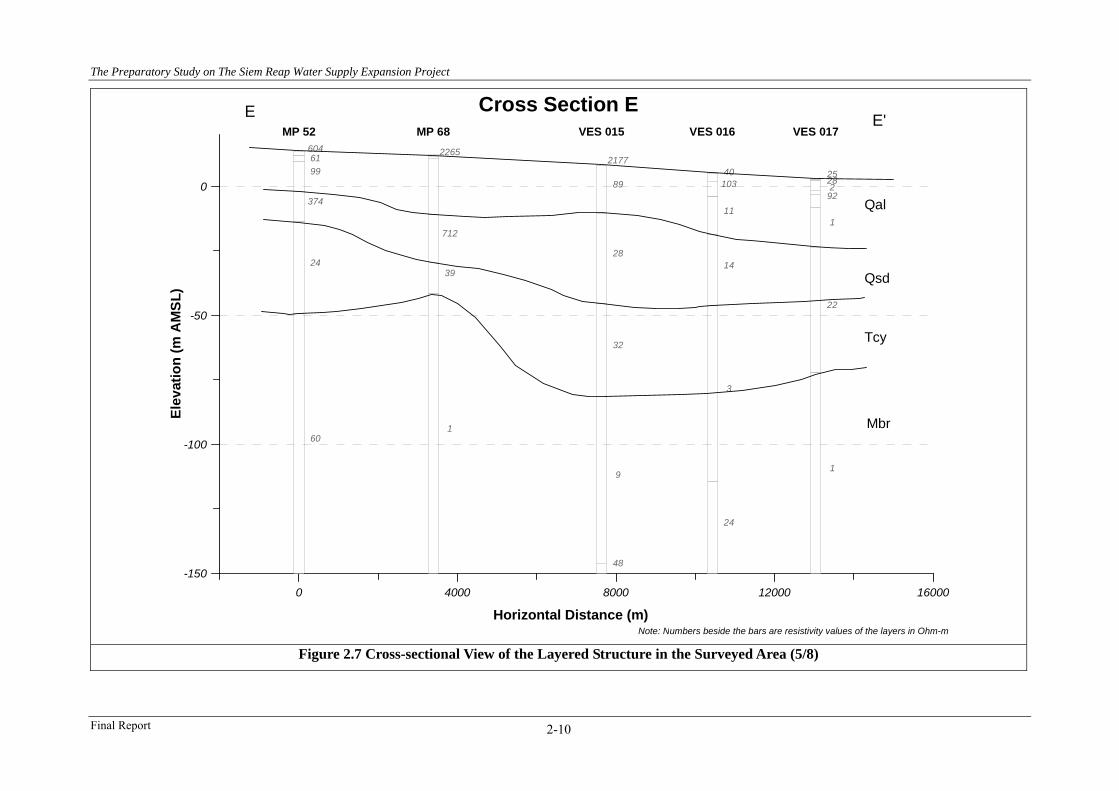
The Preparatory Study on The Siem Reap Water Supply Expansion Project
Final Report 2-10
0 4000 8000 12000 16000
Horizontal Distance (m)
6046199
374
24
60
2265
712
39
1
2177
89
28
32
9
48
40103
11
14
3
24
25282
92
1
22
1
MP 52 MP 68 VES 015 VES 016 VES 017
-150
-100
-50
0El
evat
ion
(m A
MSL
)
Cross Section E
Note: Numbers beside the bars are resistivity values of the layers in Ohm-m
E E'
Qal
Qsd
Tcy
Mbr
Figure 2.7 Cross-sectional View of the Layered Structure in the Surveyed Area (5/8)

The Preparatory Study on The Siem Reap Water Supply Expansion Project
Final Report 2-11
0 4000 8000 12000
Horizontal Distance (m)
16471648121
205
47
1000
3857
16017
2081
23
287
4
7
3
11164555
715
1
46
122
347
3182
43
59
1
7128
108
36
6
25
MP 87 MP 86 VES 028 VES 029 VES 030
-150
-100
-50
0El
evat
ion
(m A
MSL
)
Cross Section F
Note: Numbers beside the bars are resistivity values of the layers in Ohm-m
F F'
Qal
Qsd
Tcy
Mbr
Figure 2.8 Cross-sectional View of the Layered Structure in the Surveyed Area (6/8)
The Preparatory Study on The Siem Reap Water Supply Expansion Project
Final Report 2-12
0 4000 8000
Horizontal Distance (m)
3705
406
500
47
184
5
1867225
115
823
6
167
37
75339652
500
46
167
7
49959
108
932
93
5
123889
46
457
7
263
MP 73 MP 95 VES 037 VES 038 VES 039
-150
-100
-50
0El
evat
ion
(m A
MSL
)
Cross Section G
Note: Numbers beside the bars are resistivity values of the layers in Ohm-m
G G'
Qal
Qsd
Tcy
Mbr
Figure 2.9 Cross-sectional View of the Layered Structure in the Surveyed Area (7/8)
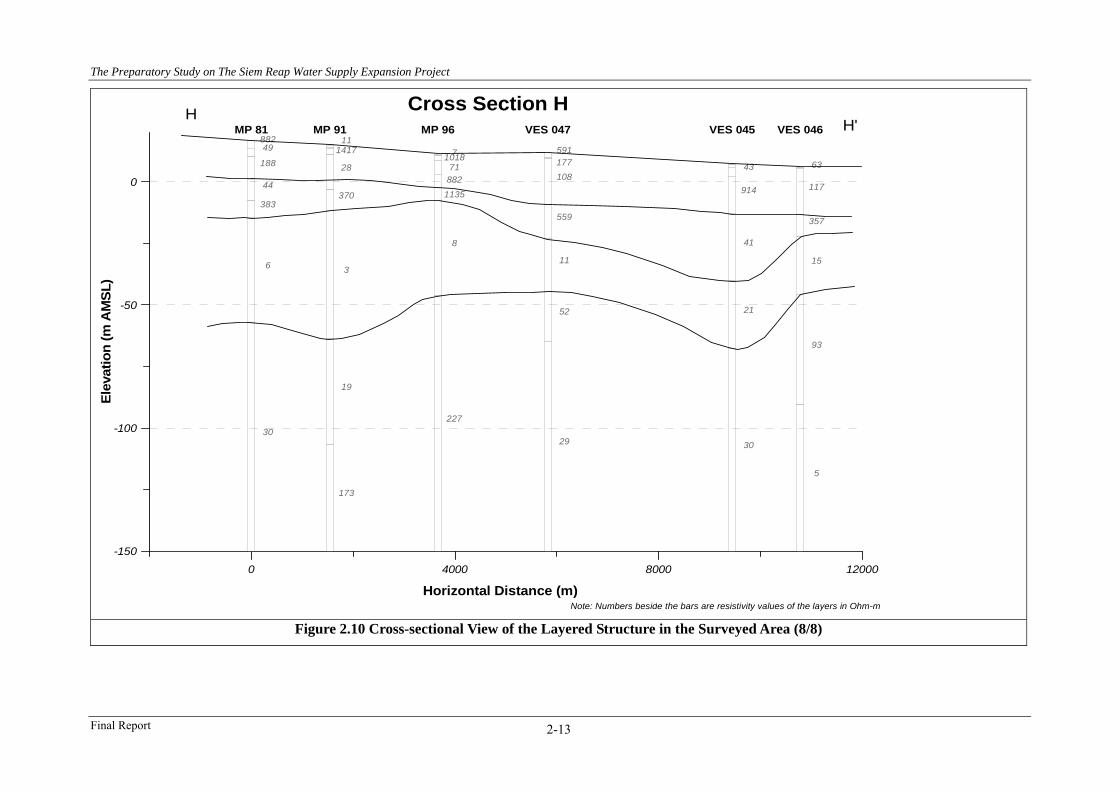
The Preparatory Study on The Siem Reap Water Supply Expansion Project
Final Report 2-13
0 4000 8000 12000
Horizontal Distance (m)
88249
188
44
383
6
30
111417
28
370
3
19
173
7101871
882
1135
8
227
591177108
559
11
52
29
43
914
41
21
30
63
117
357
15
93
5
MP 81 MP 91 MP 96 VES 047 VES 045 VES 046
-150
-100
-50
0
Elev
atio
n (m
AM
SL)
Cross Section H
Note: Numbers beside the bars are resistivity values of the layers in Ohm-m
HH'
Figure 2.10 Cross-sectional View of the Layered Structure in the Surveyed Area (8/8)

The Preparatory Study on The Siem Reap Water Supply Expansion Project
Final Report 2-14
Note: Numbers beside the bars are resistivity values of the layers in Ohm-m
I I'
Qal
Qsd
Tcy
Mbr
-150
-100
-50
0
50
Elev
atio
n (m
AM
SL)
0 5000 10000 15000 20000 25000
Horizontal Distance (m)
2200
186315
180
147
4
20801566600
213
125
10
2560
333
170
550
233
69
3600220
560
180
88
13
220078
460
78
36
6
39072
325
9
135
164
107
29
9174615
89
405
9
22
280357546
299
5
54
905466
157
141
111
9
MP 8 MP 12MP 23 Mp 58 MP 66
MP 84 MP 94 VES 31 VES 32 VES 33
Cross Section I
Tonle Sap Lake
Angkor Tom
sand
sand(stone)
claystone
shaleandesite
shale
Mbr: Mesozoic bedrock( shale, tuff, andesite) Thickness: unknown
Tcy: Pliocene sediment ( sandy clay stone) Thickness: 20 - 50mAquiclude - aquifer
Qsd: Plistocene deposits (silt-clay with coase sand and gravel at the bottom)Thickness: 10 - 30mAquifer (K = 1.9 - 1.7 x 10⁻² cm/sec)
Qal: Holocene alluvial deposit ( silty sand) Thickness: 10 - 20mAquifer (K = 1.9 - 1.7 x 10⁻² cm/sec)
WT-1WT-2 WT-5
Figure 2.11 N-S Cross-Sectional View of the Interpreted Geology and Hydrogeology in Siem Reap

The Preparatory Study on The Siem Reap Water Supply Expansion Project
Final Report 2-15
2-2 Well Inventory Survey
2-2-1 Background and Outline
(1) Background
This survey was conducted for
the purpose of assessing the
influence of lowering of
groundwater table on the
cultural remains in Siem Reap,
and also to obtain basic data for
groundwater use and demand
estimation. The survey targets are large consumers of groundwater such as hotels, restaurants
and schools, and an interview survey was conducted using a structured questionnaire. Since this
survey and the water use awareness survey share the same survey targets and items to ask, these
two surveys were conducted together.
The outline of the survey is
summarized above and the location of
surveyed establishments is shown in
Figure 2.12.
(2) Survey Target
The survey targets are mainly large
commercial and public establishments
that have a groundwater drawing
system (borehole with a motor pump). The survey was sub-contracted to a local consulting firm
and a total of 280 establishments were surveyed as shown in Table 2.4.
The survey targets were selected based on the list of hotels/guesthouses and restaurants
registered under the Ministry of Tourism (December 2008) and on some other data that was
available. In principle, larger water users were preferentially selected as survey targets within
each category. It turned out, at the beginning of the survey, that many hotels and guest houses
were already connected to the public water supply and had stopped using groundwater. Thus,
these hotels were excluded from the survey. The study team obtained a list of customers from
SRWSA, in which a total of 314 establishments are registered (61 hotels, 43 guest houses, 190
restaurants).
(3) Survey Method
The survey was conducted by two teams that are made up of two interviewers. The teams visited
Table 2.3 Outline of the Inventory Survey Survey period July 22 to August 29, 2009 Survey method • Interview with structured
questionnaire • On-site measurement
Major survey items 1. Basic information of the site 2. Basic information of the water supply
system 3. Well Structure and water use 4. Water use awareness 5. Water quality
No. of survey targets Total 280
Table 2.4 Surveyed Establishments by Category Establishment Detail Q’ty Total
Hotel 75Guesthouse 115
190
Restaurant 40 40 Factory/Manufacturer 10 10
Car wash 31School 4Entertainment 4
Other
Clinic 1
40
Total 280
The Preparatory Study on The Siem Reap Water Supply Expansion Project
Final Report 2-16
the person responsible, generally the manager or the owner, at each establishment and conducted
an interview with a questionnaire form. The questionnaire form was first prepared by the study
team and field tested and modified before it was actually used for the survey. The teams also
conducted measurement of water levels in wells and checked the quality of water using a field
test kit and portable pH and EC meters. The copy of survey sheets used for the work is attached
in the Supporting Report.
(4) Survey Contents
The questions in the survey sheets are grouped into five sections. The following is the
description of purposes and contents of each of the sections.
Section 1 (Basic information of the site): this section is about basic information of the
establishment that is surveyed. Its type, size, name and contact number etc. are surveyed through
interview with the owner or the manager.
Survey Items Name of establishment, GPS data, Elevations, etc.
Section 2 (Basic information of the water supply system): this section is about basic information
of the water supply system of the surveyed establishment. Type, use, capacity of the system etc.
are asked and also installation/construction date is confirmed through interview and actual site
inspection.
Survey Items Water source type, Purpose of use, No. of wells, Pump type, With/without of treatment system, etc.
Section 3 (Well inventory): this section is about the structure, operation and performance of the
boreholes (with a pump) that are the main water source of water supply in Siem Reap. When the
establishment has several wells, they are named A, B, and C and separately surveyed. The
questions will provide vital data on groundwater use by the establishments. Questions about
operation and construction cost of the water supply system, and also a question on “ease of
switching to public water supply system” are asked in this section, in order to help assess the
possibility of shifting to the public water supply in future.
Survey Items Well depth, Casing diameter, Screen depth, Pumping rate, SWL, DWL, Operating hours, Total O & M cost, etc.
Section 4 (Water use awareness survey): is mostly about the social aspects of groundwater use.
The questions are designed to reveal the awareness of the users of negative groundwater issues
caused by excessive groundwater pumping and their intention to switch to the public water
supply system.

The Preparatory Study on The Siem Reap Water Supply Expansion Project
Final Report 2-17
Survey Items Satisfaction (Amount, Quality), No. of O & M person, Technical problems, etc.
Section 5 (Water quality test): is about the quality of water from the water supply system of the
surveyed establishments. The water samples are taken either directly from the well or from the
reservoir tank to check if there are any quality problems (above standard items). This section
will provide data on natural groundwater conditions and also is expected to find any water
quality issues that may prompt users to shift to the use of public water supply system.
Survey Items EC, pH, Fe, Mn
The list of questions along with the explanation for each question given to the survey team is
attached as Table 2.2.1, 2.2.2, 2.2.4 and Figure 2.2 in the Supporting Report.

The Preparatory Study on The Siem Reap Water Supply Expansion Project
Final Report 2-18
Figure 2.12 Location of Surveyed Establishments

The Preparatory Study on The Siem Reap Water Supply Expansion Project
Final Report 2-19
2-2-2 Results
The following sections give detailed explanation of major finings extracted from the result of the
analysis of the survey data. A more comprehensive list of findings is also presented as Table 2.15.
(1) Water Supply Facilities and Water Use
The water source for all the surveyed establishments has been found to be boreholes (tube wells)
of at least 20 m deep. Approximately 15 % of the hotels and guest houses have more than two
wells and the same ratio for restaurants and factories is approximately 23 % and 50 %
respectively. Most establishments under category “Other” use only one well. A substantial
proportion (around 35 %) of hotels, guest houses, and restaurants are also connected to the public
water supply system. They generally use the public water supply as a backup or for specific
purposes and thus the use of public water supply by these establishments is limited.
Table 2.5 Average Number of Wells and Depth of Wells Category Hotel Guest house Restaurant Factory Other
Number of wells 1.37 1.06 1.40 1.60 1.03
Depth *(GL-m) 45.5 30.9 31.0 43.6 32.1
(Note) * depth of the main well (“well A” in the survey sheet) if there are more than 2 wells.
The depth of the wells ranges from 20 to 80 m and the average depth for hotels and factories are
around 45 m and around 30 m for the other types of establishments. Few wells are equipped with
a water meter or an observation pipe (only about 4 % of the total). On the other hand, the use of
water treatment is common in hotels and factories and over 90 % have water treatment facilities.
The most commonly used treatment is sand filtration and it accounts for 40 to 60% of all the
treatment facilities for all categories. At most establishments, the water is pumped up by an
automatically operated ground pump to an elevated water tank and then distributed by gravity.
As anticipated somewhat, it was found difficult for the interviewees to provide any reliable
information on the amount of water they use every day. Therefore, in most of the cases the
surveyors had to estimate the amount of daily water use based on the capacity of the pump, the
size of reservoir tank, and the operation hours of the pump. The results are summarized in the
following table.
Table 2.6 Estimated Daily Average Water Use Amount by Category (m3/day/establishment)
Category Hotel Guest house Restaurant Factory Other
Rainy Season Mean 30.35 4.62 8.89 39.00 8.89
Dry Season Mean 47.27 5.65 9.91 85.4 8.51
The water consumption is higher during the dry season and lower in the rainy season for all the
categories except for “Other” due to extra consumption to cope with increased number of tourists.
The reason for the decreased water use amount under “Other” is that most of the surveyed

The Preparatory Study on The Siem Reap Water Supply Expansion Project
Final Report 2-20
establishments are car wash places and cars become dirty less often during the dry season.
The survey team obtained information about the location of screen casings at 49 establishments
across the categories. According to this data, boreholes are screened at no shallower than 16 m
and the average length of the screen casing is 9.6 m. The distribution of the screen location is
illustrated in Figure 2.13. Most of the wells (80 – 90 %) were constructed after the year 2000 at
the time the buildings were constructed.
For pumping groundwater, a ground pump of around one (1) Kw capacity is commonly used for
guest houses and restaurants and those of four (4) Kw capacities for hotels and factories. The
pumps are generally automatically operated by the water level sensor in the reservoir tanks.
Submersible pumps are only used at large hotels (36 %) and some factories (30 %). The
prevalence of use of ground pumps suggests that the water table is generally high and rarely goes
down below 10 m in the surveyed area.
1 0
2 0
3 0
4 0
5 0
6 0
7 0
H-1
H-4
H-7
H-1
0
H-1
3
H-1
6
H-1
9
GH
-2
GH
-5
GH
-8
GH
-11
R-2 F-3
F-6
F-9
O-3
O-6
dept
h (G
L -m
)
H o t e l G u es t h o u s e F ac t o ry O t h erR es t Figure 2.13 Distribution of Well Screen Location by Category
Static water levels of the wells were measured at majority of hotels (92 %) and Factories (80 %)
either through the opening between the casing pipe and the pump riser pipe or using the
observation pipe. The result of the measurement at “well A”, the main well, is summarized in the
table below.
Table 2.7 Measured Static Water Level of Main Well by Category (GL-m)
Min Max Mean Mode STD Hotel (Borehole A = 69) 1.30 2.90 1.76 1.60 0.34
Guesthouse (Borehole A = 27) 1.35 2.20 1.68 1.60 0.22
Restaurant (Borehole A = 5) 0.85 1.90 1.50 NA 0.43
Factory/Manufacturer (Borehole A = 8) 1.50 2.30 1.73 1.60 0.25
Others (Borehole A = 19) 1.40 2.20 1.78 1.80 0.24
(Note) STD: standard deviation
The static water levels measured during the survey range between 0.85 m and 2.9 m and the

The Preparatory Study on The Siem Reap Water Supply Expansion Project
Final Report 2-21
average for each category is quite uniform, being around 1.7 m. The static water level for the dry
season was only obtained at two hotels where they keep the record. The data shows that the water
level is about 1.5 m deeper at both sites in dry season. The dynamic water level was found
difficult to measure properly due to the limitation of pump operation time that is automatically
controlled. Thus the measurements were done at about 40 % of the establishments across the
category and typically after 15 to 20 min of pump operation. The results are summarized in the
table below.
Table 2.8 Measured Dynamic Water Levels (GL - m-)
Category Hotel Guest house Restaurant Factory Other
Rainy Season Mean 6.2 5.82 3.37 7.14 7.24
(2) Water Use Awareness
Section 4 of the survey is designed to understand the perception of the interviewees on the
groundwater use and to find out their intention to connect to the public water supply system in the
future. The survey revealed that the majority of the hotels, guest houses, and restaurants are aware
of the possible negative effect (lowering of groundwater level and occurrence risk of land
subsidence) of groundwater withdrawal on the environment. On the other hand, establishments
under the other two categories are not quite aware of this issue. This is perhaps due to the effect of
the environmental education designed for these tourist related businesses.
Table 2.9 Ratio of Awareness on the Groundwater Issues
Category Hotel Guest house
Restaurant Factory Other
Ratio of Awareness (%) 64 53 65 10 17.5
Many of the surveyed establishments are willing to connect to the public water supply system
when it becomes available and can supply enough water volume. The main reason is to cut down
the operational cost of current groundwater pumping system. Although it was assumed that the
public water supply will provide stable and good quality water at a reasonable cost, some
respondents raised concern about the service interruption. Also, many establishments are not
satisfied with the quality of water they use, and expect that they will receive water of better
quality from the public supply system.
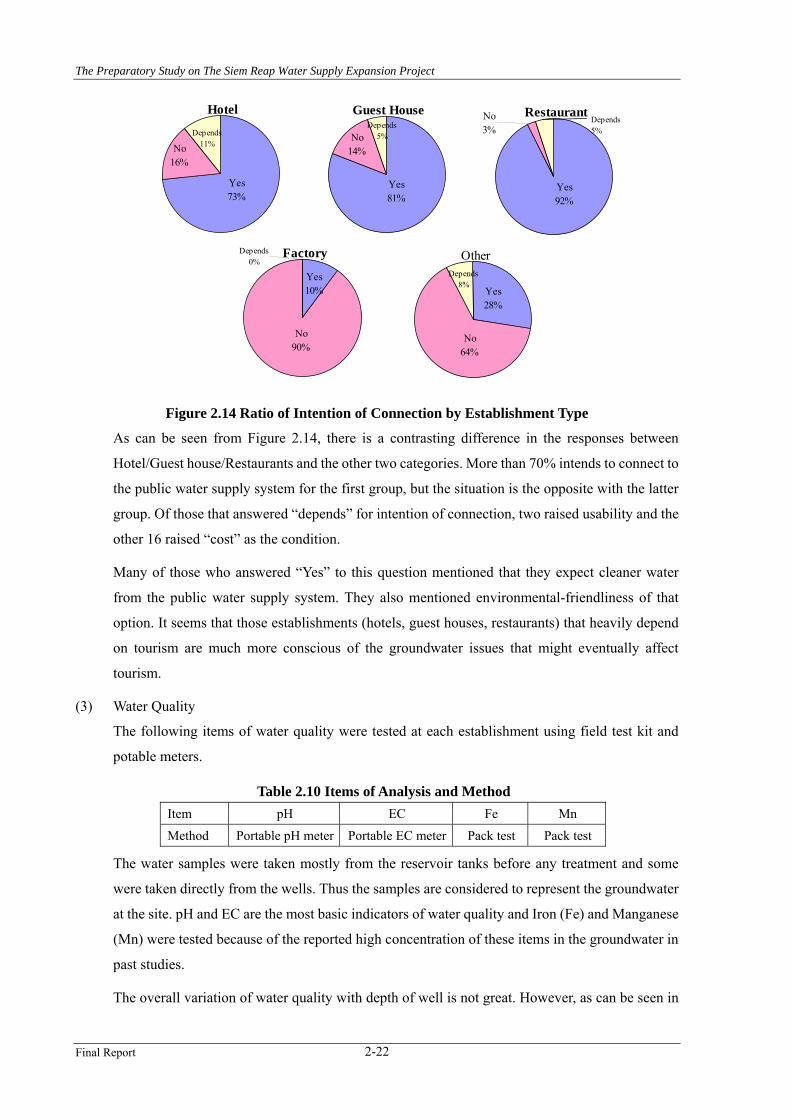
The Preparatory Study on The Siem Reap Water Supply Expansion Project
Final Report 2-22
Hotel
No16%
Depends11%
Yes73%
Guest House
No14%
Depends5%
Yes81%
RestaurantNo3%
Depends5%
Yes92%
Factory
Yes10%
Depends0%
No90%
Other
Yes28%
Depends8%
No64%
Figure 2.14 Ratio of Intention of Connection by Establishment Type
As can be seen from Figure 2.14, there is a contrasting difference in the responses between
Hotel/Guest house/Restaurants and the other two categories. More than 70% intends to connect to
the public water supply system for the first group, but the situation is the opposite with the latter
group. Of those that answered “depends” for intention of connection, two raised usability and the
other 16 raised “cost” as the condition.
Many of those who answered “Yes” to this question mentioned that they expect cleaner water
from the public water supply system. They also mentioned environmental-friendliness of that
option. It seems that those establishments (hotels, guest houses, restaurants) that heavily depend
on tourism are much more conscious of the groundwater issues that might eventually affect
tourism.
(3) Water Quality
The following items of water quality were tested at each establishment using field test kit and
potable meters.
Table 2.10 Items of Analysis and Method Item pH EC Fe Mn
Method Portable pH meter Portable EC meter Pack test Pack test
The water samples were taken mostly from the reservoir tanks before any treatment and some
were taken directly from the wells. Thus the samples are considered to represent the groundwater
at the site. pH and EC are the most basic indicators of water quality and Iron (Fe) and Manganese
(Mn) were tested because of the reported high concentration of these items in the groundwater in
past studies.
The overall variation of water quality with depth of well is not great. However, as can be seen in

The Preparatory Study on The Siem Reap Water Supply Expansion Project
Final Report 2-23
the following figure, the shallow groundwater is characterized by 1) higher iron and manganese
contents, 2) higher EC values, and 3) lower pH values. The quality of groundwater from deeper
wells tends to be relatively better in these respects.
0
50
100
150
200
250
50 - 8040 - 4930 - 3920 - 29Depth range (m)
mic
roS/
cm
0
1
2
3
4
5
6
mg/
L or
pH
sca
le
EC
pH
Fe
Mn
Figure 2.15 Quality of Water by Well Depth
Shallow well users are mostly small establishments that cannot afford expensive water treatment
facilities. Thus, they suffer from the water with high iron concentration. This can be also
demonstrated in other questions about satisfaction with water quality, where only 38 % of the
guest houses and 15 % of restaurants answered that they are satisfied, as opposed to 88 %
satisfaction ratio by hotels. These small establishments are considered highly motivated to switch
to the public water supply system when it is in place.
(4) Database Construction
The information for the 280 surveyed establishments have been converted to a MS-Access
database and handed over to SRWSA. The specification of the database is summarized below.
Table 2.11 Summary of the Database
Title Well Inventory of Large Groundwater Consumers
Software MS-Access
Record number 280 records in text and number
Contents 11 tables corresponding to each section in the questionnaire except for section 4 (water use awareness survey)
Query 9 default queries
Language and units English and metric system
Positional information
The data comes with GPS coordinates for each record and can be integrated into a GIS
The structure of the tables and list of queries are given in the Supporting Report.

The Preparatory Study on The Siem Reap Water Supply Expansion Project
Final Report 2-24
(5) Important Findings from the Inventory Data
1) Present groundwater use amount
The total amount of daily groundwater use in Siem Reap at present (year 2009) can be estimated
using the data obtained in the well inventory survey. Since the groundwater is used by the large
commercial and public establishments surveyed in the well inventory survey and also by smaller
establishments and ordinary houses (domestic users), the total amount is the sum of water use
amount by the two main groups of users. In this report, the following set of data and conditions
were adopted to estimate the daily groundwater use amount for both dry and wet seasons.
Table 2.12 Summary of Estimated Present Groundwater Use Amount in Siem Reap
Use amount (m3/day)Category
Wet season
Dry season
Conditions of estimation
Large establishments with own groundwater pumping facilities
3,908 5,786 - Total from 280 establishments in the inventory. Separately calculated for dry and wet seasons.
Large establishments connected to public water supply of SRWSA except the above establishments
3,739 5,009 - Number of : hotels=61, Guesthouses=43, Restaurants=190 (source: SRWSA list of registered customers), - Average pumping amount data for the above category was taken from the inventory data (see table 2-6). - Some part of water is supplied by their own groundwater pumping facilities
Small establishments and ordinary houses
21,569 24,418
- Population of Siem Reap in 2009 = 203,483 (source: department of planning Siem Reap province) - Part of the water is supplied by SRWSA’s public supply system - Unit water use amount = 0.106 m3/day/capita for wet season , 0.120 m3/day/capita for dry season
Total 29,216 35,213
(Note) It should be noted that the figures for the total groundwater consumption calculated here are those of the collective consumption by domestic users, commercial users, and tourists regardless of the types of supply facilities. In other words, the groundwater consumption by SRWSA customers is also included.
2) Cost of operation and maintenance (O/M) for groundwater supply facilities
In the inventory survey, the cost of operating and maintaining various types of water supply
facilities of each establishment was roughly estimated by the interviewers by using the
information they obtained during the site visits. The monthly operation and maintenance cost
estimated here consists of labor cost and energy cost in addition to other regular running costs
such as the cost for chlorine (disinfectant) and minor repair costs. The obtained data for monthly
average O/M cost and installation cost of water supply facilities were used to estimate the unit
water production cost (US$ per one cubic meter of water) for each category of the five
establishments. Since the total cost of unit water production over a long period (15 years) is
considered, major repair cost was included in the calculation. The following two cases of different
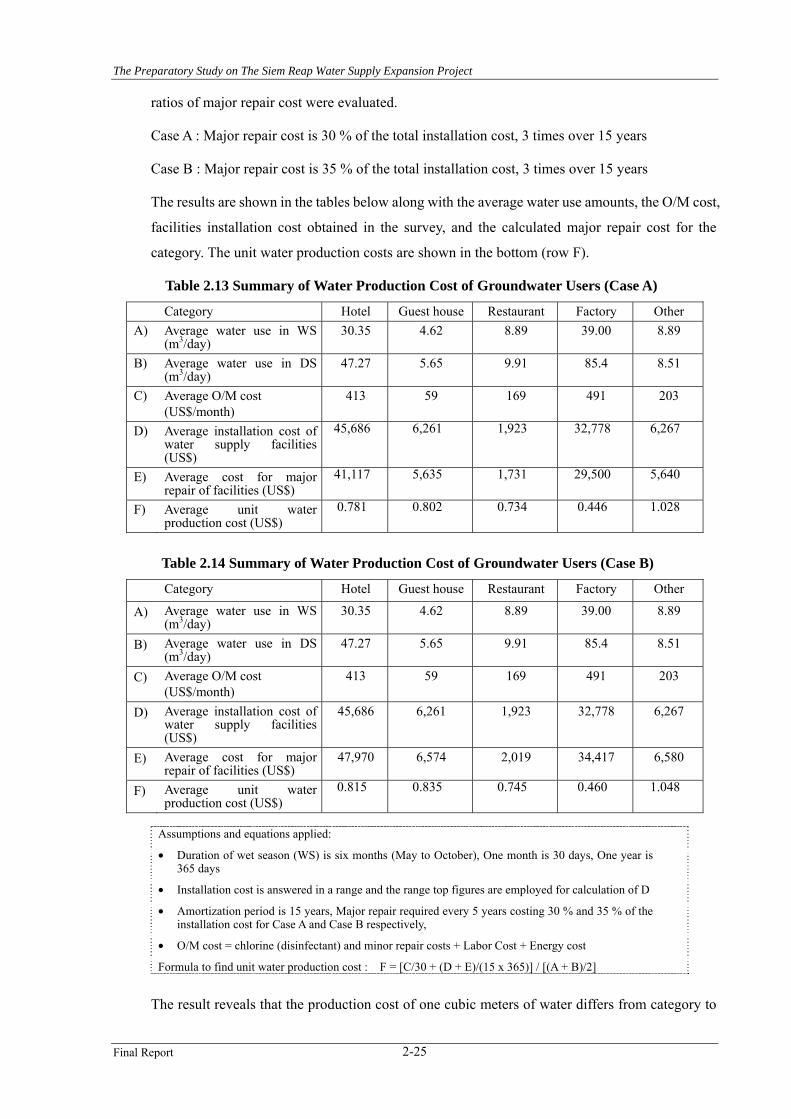
The Preparatory Study on The Siem Reap Water Supply Expansion Project
Final Report 2-25
ratios of major repair cost were evaluated.
Case A : Major repair cost is 30 % of the total installation cost, 3 times over 15 years
Case B : Major repair cost is 35 % of the total installation cost, 3 times over 15 years
The results are shown in the tables below along with the average water use amounts, the O/M cost,
facilities installation cost obtained in the survey, and the calculated major repair cost for the
category. The unit water production costs are shown in the bottom (row F).
Table 2.13 Summary of Water Production Cost of Groundwater Users (Case A)
Category Hotel Guest house Restaurant Factory Other A) Average water use in WS
(m3/day) 30.35 4.62 8.89 39.00 8.89
B) Average water use in DS (m3/day)
47.27 5.65 9.91 85.4 8.51
C) Average O/M cost (US$/month)
413 59 169 491 203
D) Average installation cost of water supply facilities (US$)
45,686 6,261 1,923 32,778 6,267
E) Average cost for major repair of facilities (US$)
41,117 5,635 1,731 29,500 5,640
F) Average unit water production cost (US$)
0.781 0.802 0.734 0.446 1.028
Table 2.14 Summary of Water Production Cost of Groundwater Users (Case B)
Category Hotel Guest house Restaurant Factory Other
A) Average water use in WS (m3/day)
30.35 4.62 8.89 39.00 8.89
B) Average water use in DS (m3/day)
47.27 5.65 9.91 85.4 8.51
C) Average O/M cost (US$/month)
413 59 169 491 203
D) Average installation cost of water supply facilities (US$)
45,686 6,261 1,923 32,778 6,267
E) Average cost for major repair of facilities (US$)
47,970 6,574 2,019 34,417 6,580
F) Average unit water production cost (US$)
0.815 0.835 0.745 0.460 1.048
Assumptions and equations applied:
• Duration of wet season (WS) is six months (May to October), One month is 30 days, One year is 365 days
• Installation cost is answered in a range and the range top figures are employed for calculation of D
• Amortization period is 15 years, Major repair required every 5 years costing 30 % and 35 % of the installation cost for Case A and Case B respectively,
• O/M cost = chlorine (disinfectant) and minor repair costs + Labor Cost + Energy cost
Formula to find unit water production cost : F = [C/30 + (D + E)/(15 x 365)] / [(A + B)/2]
The result reveals that the production cost of one cubic meters of water differs from category to

The Preparatory Study on The Siem Reap Water Supply Expansion Project
Final Report 2-26
category. Factories that generally use large scale facilities are most efficient producers and
“other” which is made up mostly of car wash stands is the least efficient producers. These figures
are also larger than the current water tariff of public water supply system.

The Preparatory Study on The Siem Reap Water Supply Expansion Project
Final Report 2-27
Table 2.15 Major Findings from Well Inventory Survey Category Findings
General ・ 280 big water consumers were surveyed based on the lists of establishments obtained.
Water supply facilities ・ All the water sources are tube wells of at least 20 m with either a ground or a submersible pump.
・ Majority (77 %) of establishments use only one borehole for water supply. ・ The average number of wells for hotels and guest houses is 1.37 for and 15 % of
them has more than 2 wells. ・ Less than 4 % of the establishments have water meters or observation pipes
installed at their wells. ・ A little over 30 % of hotels, guest houses, and restaurants use both groundwater and
public water supply. ・ The average depth of wells is around 44 m for hotels and factories, and around 30
m for the other categories. ・ Commonly used casing pipe is of 100 mm diameter for hotels and Factories and 49
mm for other categories. ・ Ground pumps are commonly used for all the categories but up to 36 % of hotels
and factories also use submersible pumps. ・ Water treatment facilities are commonly used in large hotels and factories and the
common type is sand filtration and related system. ・ Most of the systems were constructed after the year 2000 at the time of construction
of the buildings ・ The screen location varies depending on the depth of the well and average length is
9.6 m. ・ The static water levels were measured to be around 1.5 m and maximum is 2.9 m
below ground. ・ The dynamic water levels were around 6 to 7 m below ground. ・ Majority of establishments (except for Factories) responded that it is either easy or
moderate to connect to the public water supply system in terms of construction work.
・ Majority of hotels (75 %) use both commercial and generator for power supply while majority of guest houses (86 %) depends only on commercial supply.
Water use and use amount ・ Daily water use had to be estimated due to lack of water meter or reliable record. ・ Hotels and factories are the large water users with 30 to 40 m3 of daily use. ・ All establishments use 1.1 to 1.5 times more water during the dry season except for
car wash sites ・ Factories are large users of water although their number is small. ・ Large restaurants use more water ・ The water from both borehole and public supply is used mainly for general (multi)
purposes. Awareness of environmental issues
・ Large establishments are mostly satisfied with both quantity and quality of current water supply but small establishments are less satisfied, especially so about the quality.
・ Hotels, guest houses and restaurants are highly aware of the environmental issues (lowering of groundwater level and land subsidence) concerning groundwater use.
Intention to switch to piped water supply by SRWSA
・ Majority (70 to 90 %) of hotels, guest houses, and restaurants intend to switch to the public water supply system while factories intend to keep using groundwater.
・ Those that responded “depends” raised cost and usability as the conditions. ・ The reasons for switching are the environmental obligation and also usability.
Water quality ・ The water quality is similar to that of the city and surrounding area that is characterized by sporadic high iron contents and low pH.
(Note) *The items in italic are discussed in more detail in this report

The Preparatory Study on The Siem Reap Water Supply Expansion Project
Final Report 2-28
2-3 Field Water Quality Test
The quality of groundwater in the areas of possible groundwater sources for the water supply was
tested in the field. The water samples were taken mainly from tube wells with a hand pump and
tested for the following indicators. The location of sampling is shown in Figure 2.16.
Table 2.16 Items of Analysis and Method Item pH EC Fe Mn NH3-N
Method Portable pH meter Portable EC meter Pack test Pack test Pack test
Most of the wells for the water quality test are tube wells equipped with an old steel suction hand
pump and the depth of the wells ranges from 5 to 30 m. Some samples were also taken from open
hand-dug wells with concrete lining and tube wells with a ground engine pump.
The EC values are generally very low (acidic) except for some open hand-dug wells. Some wells
showed an iron concentration of as high as 8 mg/L but it seems to be limited to small areas as
shown in Figure 2.17. Nitrogen in ammonium form (NH3-N) is one of the indicators of immediate
contamination by animal/human discharges and by fertilizers. The values are generally less than
0.2 mg/L with less than drinking standards. The following table compiles the results of the water
quality test for the three areas along the southern margin of Siem Reap City: East of Siem Reap
River, West of Siem Reap River and the area around Phnon Kroam hill.
Table 2.17 Average Value of Water Quality by Area (Unit: mg/L)
Item pH EC (μS/cm) Fe Mn NH3-N
DWS* 6.5 – 8.5 1600 0.3 0.1 1.5
East 5.43 48 1.21 0 0.18
West 5.60 83 2.08 0 0.15
Phnon Kraom 4.90 518 0.45 0.17 0.15 (Note) water from hand-dug wells is not included in these calculations
* Drinking water quality standards, January 2004, Ministry of Industry, Mines, and Energy
Generally, the water quality of these areas is similar to that in the other parts of the city and its
surroundings. As it has been known, it is characterized by low pH values and sporadic high Iron
concentrations (see Figure 2.17). In every area, average values of pH and iron concentration
exceed drinking water quality standards and it may need water treatment for drinking. It should
be noted that this result is based only on field measurements and more detailed water quality
analysis should be done in the case of developing the groundwater in these areas.
2-4 Survey Result of Core Samples
Under this study, a monitoring well (shallow well) was constructed in the premise of Kravan
primary school on October 2009 and two monitoring wells (shallow and deep wells) were
constructed in Khvein primary school on October 2009 and May 2011, respectively.

The Preparatory Study on The Siem Reap Water Supply Expansion Project
Final Report 2-29
At the same time, in the same locations as the monitoring wells, a core boring of 80 m in depth
were conducted at each site on October 2009 and the observation survey for the core samples was
followed on January 2011. In addition, in the observation survey, core samples which JSA
(Japanese Government Team for Safeguarding Angkor) carried out in the yards of Angkor ruins
(Angkor Wat and Bayon shrine) in 1995 were also observed as reference samples.
The survey results were different from accepted concept on geological structures in Siem Reap
area based on the study results of “the Study on Water Supply System for Siem Reap Region in
Cambodia (2000)”, namely, geological structures that Quaternary formations of Alluvium and
Diluvium were underlain by claystone (equivalent formations of Tertiary). Claystone in the core
samples by this observation survey could not be observed.
According to the above study (2000), in Siem Reap area, geological structures are made up of 4
ones: Alluvium and Diluvium are distributed in the depth of ground surface to about 30 m to 50 m
and are underlain by Tertiary formations with layer thickness of about 40 to 50 m, and basement
rocks of sandstone, siltstone, shale, and tuffaceous breccia of Upper Jurassic, andesite, basaltic
intrusive rocks, and diorite of Late Mesozoic to Tertiary are distributed in the depth of about 70 m
to 80 m.
However, the observation results of the core samples in both sites of Khvein and Kravan led to the
following results: (1) In the depth around 40 m, change of formation facies which clearly divide
between Diluvium and Tertiary formations together with the boundary of both formations cannot
be recognized and it can be deemed to be consecutive formations. (2) Formations equivalent to
Tertiary formations does not exist in core samples as a result of core
observation. .
Outline of observation results of core samples are as follows: Observation results of core samples
(columnar sections) are shown in Supporting Report, Chapter 3, SR 3-2 (1) Survey Results of
Core Samples in Khvein and Kravan Sites, and Observation Result of Core Samples of Angkor
Ruins.
(1) Khvein Site
Clay layer is distributed in the depth of ground surface to 5 m. Under this layer, alternating layers
of sand, sandy clay, and clayey sand with layer thickness of 1 m to 4 m are distributed. In the
depth of 50 m to 63 m, these alternating layers are underlain by thick clay layer with layer
thickness of about 12 m with interbeded layers of thin clayey sand (sandy clay) in the depth of 58
m and of 61m to 63 m. In the depth of 63 m to 80 m, fine sand layers are distributed.
According to this survey, in the depth around 40 m, there was no formation boundary between
Diluvium of Quaternary and Tertiary formations and clay layer distributed in the depth of 50 m to
63 m is not consolidated stone such as claystone.

The Preparatory Study on The Siem Reap Water Supply Expansion Project
Final Report 2-30
(2) Kravan Site
In the depth of ground surface to 7 m, alternating layers of silt, sandy clay, sand, and clay are
distributed. Under the layer, up to the depth of 80 m, fine and/or medium sand layers are
distributed.
As a result of this survey, in the similar way as Khvein site, In the depth around 40 m, there was no
formation boundary between Diluvium of Quaternary and Tertiary formations and clay layer
distributed in the depth of 50 m to 63 m was not consolidated stone such as claystone.
(3) Core Sample of Angkor Ruins
JSA carried out core boring survey of 100 m and 87 m deep in the yard of Angkor Wat (Sample
No. AV-1B) and Bayon (Sample No. BY-1B) on March 1995 for ground investigation in Angkor
ruins. Those core samples were stored in JSA office in Siem Reap City and observation survey for
the core samples by this study was conducted to confirm underground geological structure in
Siem Reap area on January 2011.
The core samples have been fairly consolidated by drying with passage of time of about 16 years
since core borings were conducted. Further, there were many parts of no core samples by the
reason why sand layer could not be sampled.
Observation results of core samples were as follows, (1) Basement rocks were observed in the
depth of 74.20 m in Angkor Wat site, and in the depth of 83.50 m in Bayon site. (2) JSA Annual
Report on the Technical Survey of Angkor Monument 1996 (July 1996) reported the change of
formation facies between the upper layers and the lower layers in the depth around 40 m.
However, in observation results by this survey with passage of time of about 16 years after core
sampling, the change of formation facies between Quaternary and Tertiary formations could not
be recognized. In addition, in these core samples, in the similar way to Khvein and Kravan sites,
Formations equivalent to Tertiary formations could not be observed.
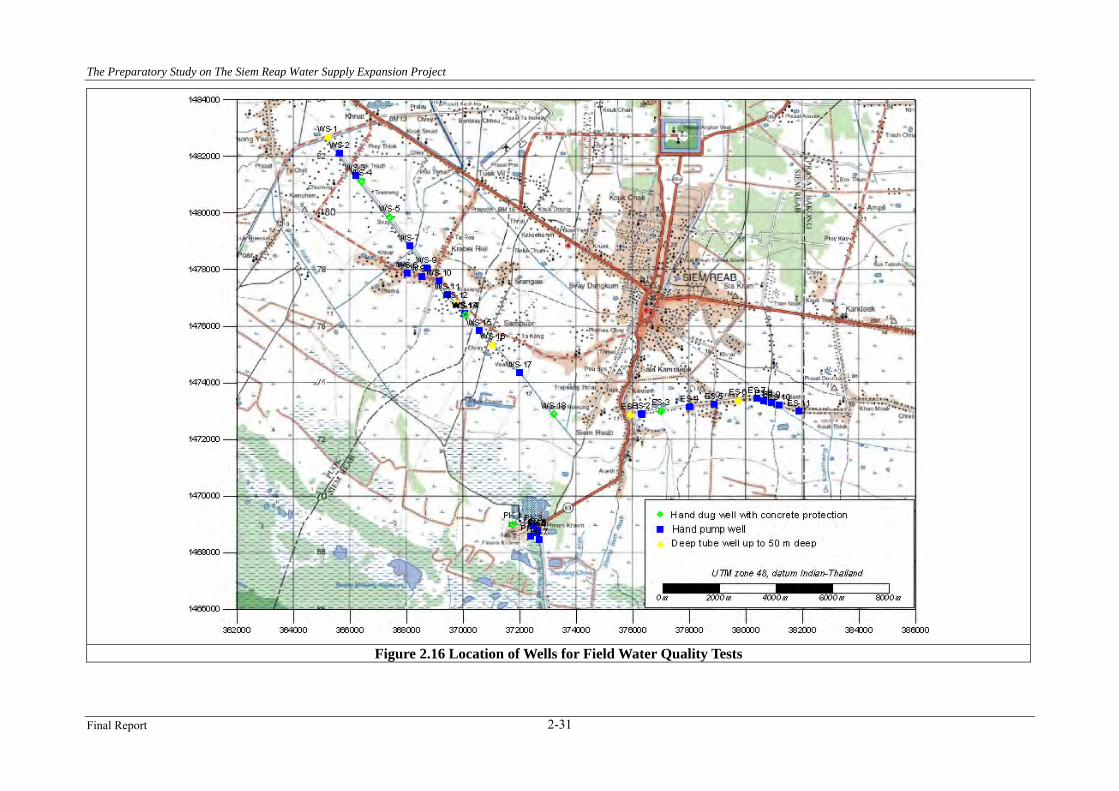
The Preparatory Study on The Siem Reap Water Supply Expansion Project
Final Report 2-31
Figure 2.16 Location of Wells for Field Water Quality Tests

The Preparatory Study on The Siem Reap Water Supply Expansion Project
Final Report 2-32
Figure 2.17 Distribution of High Iron Concentration Wells

Chapter 3. Current Status of Groundwater Use
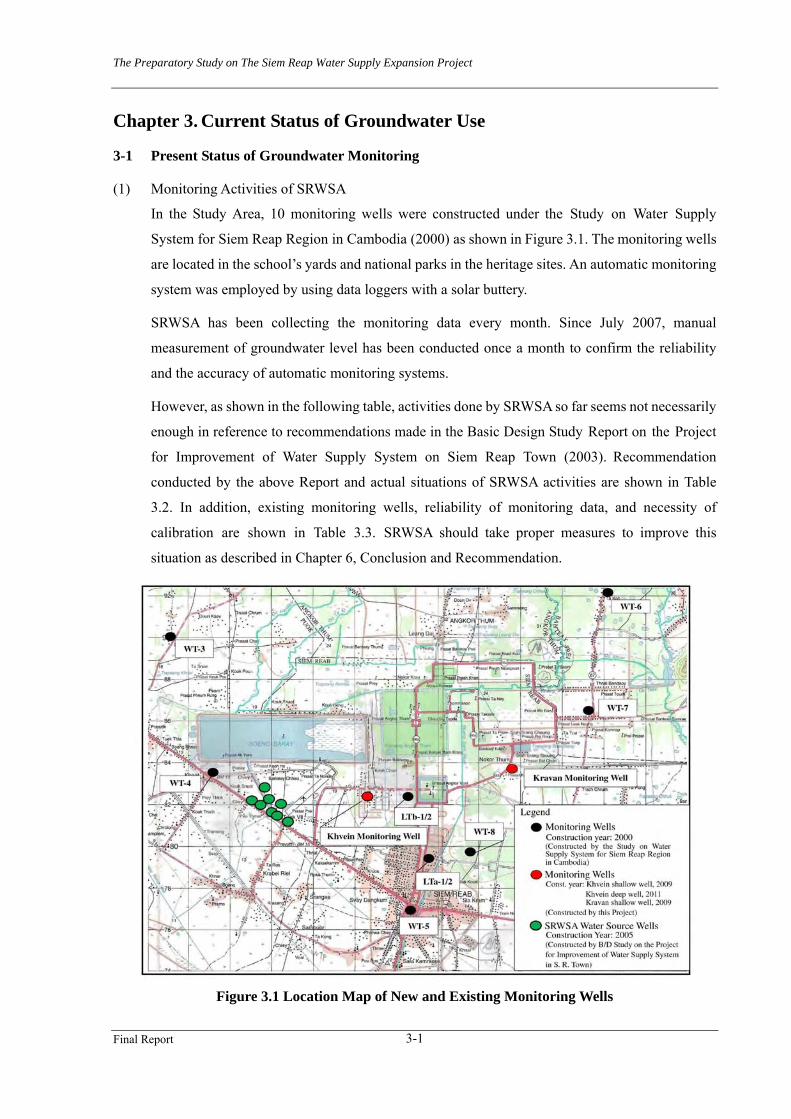
The Preparatory Study on The Siem Reap Water Supply Expansion Project
Final Report 3-1
Chapter 3. Current Status of Groundwater Use
3-1 Present Status of Groundwater Monitoring
(1) Monitoring Activities of SRWSA
In the Study Area, 10 monitoring wells were constructed under the Study on Water Supply
System for Siem Reap Region in Cambodia (2000) as shown in Figure 3.1. The monitoring wells
are located in the school’s yards and national parks in the heritage sites. An automatic monitoring
system was employed by using data loggers with a solar buttery.
SRWSA has been collecting the monitoring data every month. Since July 2007, manual
measurement of groundwater level has been conducted once a month to confirm the reliability
and the accuracy of automatic monitoring systems.
However, as shown in the following table, activities done by SRWSA so far seems not necessarily
enough in reference to recommendations made in the Basic Design Study Report on the Project
for Improvement of Water Supply System on Siem Reap Town (2003). Recommendation
conducted by the above Report and actual situations of SRWSA activities are shown in Table
3.2. In addition, existing monitoring wells, reliability of monitoring data, and necessity of
calibration are shown in Table 3.3. SRWSA should take proper measures to improve this
situation as described in Chapter 6, Conclusion and Recommendation.
Figure 3.1 Location Map of New and Existing Monitoring Wells

The Preparatory Study on The Siem Reap Water Supply Expansion Project
Final Report 3-2
The outline of monitoring wells is summarized in the following table.
Table 3.1 Outline of Monitoring Wells
No. Well No. Well Depth(m)
Casing Sizeand Materials
Screen Depth(m)
Remarks
1 WT-3 36 PVC 6" 20.38-32.202 WT-4 29 PVC 6" 13.38-25.203 WT-5 58 PVC 6" 42.38-54.204 WT-6 29 PVC 6" 13.38-25.205 WT-7 60 PVC 6" 44.38-56.20
6 WT-8 83 PVC 6" 67.38-79.20 Under the building of New APSARA building (Nowunder construction)
LTa-1 72 PVC 6" 63.62-71.90 Measurment of Groundwater Level and landLTa-2 35 PVC 6" 26.61-34.90 Measurment of Groundwater Level and landLTb-1 73 PVC 6" 64.61-72.90 Measurment of Groundwater Level and landLTb-2 40 PVC 6" 31.61-39.90 Measurment of Groundwater Level and land
7
8
Table 3.2 Monitoring Activities Done by SRWSA No. Recommendations made by 2003 B/D report* Activities Done by SRWSA 1. Proper O&M for the supplied monitoring
facilities Some damaged equipment are being left at the sites in disrepair, resulting in missing data.
2. Making good use of the monitoring data Data collection has been done; however, analysis on the collected data was not made.
3 Taking proper countermeasures when unusual monitoring data are found.
Manual measurement of groundwater level has been done since July 2007. However, detailed analysis on the collected data has not been conducted. For example, manual and automatic monitoring data were not compared even some malfunction items were found.
4 Disclosure of collected information Due to difficulties of confirmation of data reliability, SRWSA has not disclosed the data till now.
(Note) 2003 B/D report*: Basic Design Study (report) on the Project for Improvement of Water Supply System in Siem Reap Town in the Kingdom of Cambodia (2003)

The Preparatory Study on The Siem Reap Water Supply Expansion Project
Final Report 3-3
Table 3.3 Existing Monitoring Wells, Reliability of Monitoring Data, and Necessity of Calibration
No. Well No.
Well Depth
(m)
Available Monitoring Data Period
Current Operating Condition and Reliability of Monitoring Data
Necessity of Calibration of
Monitoring Equipment
• Removal of monitoring equipment excluding solar panel and lightning rod (2008/8/21)
Removal Reason As WT-6 and LTa monitoring sites were more important than WT-3 site due to locations near the city center and/or many important ruins with no monitoring function, SRWSA transferred WT-3 equipment to them. • Transfer of WT-3 cable sensor to WT-6 site. • Transfer of WT-3 data logger to LTa site
1 WT-3 36 2003/8-2008/4
Reliability of monitoring data before removal of the equipment have good reliability..
After May 2005, There is no monitoring equipment.
Operational monitoring equipment 2 WT-4 29 2007/3-Present• Monitoring data (2007/3-2008/3) have
good reliability. . • Monitoring data after the date of 2008/3
show low reliability.
Necessity of calibration
Operational monitoring equipment. 3 WT-5 58 2007/3-PresentMonitoring data have good reliability.
Not necessity of calibration
Operational monitoring equipment. 4 WT-6 29 2008/7- PresentMonitoring data show low reliability.
Necessity of calibration
Operational monitoring equipment 5 WT-7 60 2003/8- PresentMonitoring data have good reliability.
Not necessity of calibration
• Operational monitoring equipment. • ASPARA museum building is under const-
ruction. Monitoring facility is planned to be left in underground. Under the construction, the inside of monitoring facility was buried and submerged.
6 WT-8 83 2008/4-2010/9
Monitoring data show low reliability.
Necessity of calibration.
Operational monitoring equipment LTa-1 72 2008/8- Present• Reliability of monitoring data is low. • At the transfer time of WT-3 data logger,
equipment’s connection error between shallow and deep wells was happened. Thus, monitored data of both wells inverted.
Necessity of calibration.
Operational monitoring equipment.
7
LTa-2 35 2008/8- Present• Reliability of monitoring data is low. • At the transfer time of WT-3 data logger,
equipment’s connection error between shallow and deep wells was happened. Thus, monitored data of both wells inverted.
Necessity of calibration.
Operational monitoring equipment. LTb-1 73 2003/9- PresentMonitoring data have good reliability.
Not necessity of calibration
Operational monitoring equipment.
8
LTb-2 40 2003/9- PresentMonitoring data have good reliability.
Not necessity of calibration
(Note) Present condition of the above table is as of September 13, 2009. On Khvein and Kravan monitoring wells, they were constructed after September 2009. As they kept accuracy of observation, their descriptions in the above table were omitted.

The Preparatory Study on The Siem Reap Water Supply Expansion Project
Final Report 3-4
(2) Monitoring Activity by DOWRAM (Department of Water Resources and Meteorology)
The government of Cambodia enacted the “Water Resources Management Law” in June 2007 and
the monitoring works for water resources were transferred from MIME to MOWRAM. At
present, MOWRAM does not still carry out monitoring works on groundwater.
3-2 Construction of New Monitoring Wells
Under this study, a monitoring well (shallow well) was constructed in the premise of Kravan
primary school on October 2009 and two monitoring wells (shallow and deep wells) were
constructed in Khvein primary school on October 2009 and May 2011, respectively. The Khvein
primary school is located at 2.3 km west of the Angkor Wat ruins. The Kravan primary school is
located 3.2 km north east of Angkor Wat. These monitoring wells are constructed to monitor
influence of the SRWSA production wells and the private wells in the city.
Same type of the monitoring equipment used for the existing monitoring wells were installed in
the wells as detailed below:
Table 3.4 Outline of Newly Constructed Monitoring Wells in 2009 and 2011
No. Well No. Well Depth(m)
Casing Diameterand Materialas
Screen Depth(m)
Static WaterLevel (m)
Well Location ConstructionYear
1 Khvein Well-1 40 UPVC 6" 16-2024-28
0.40 October2009
2 Khvein Well-2 80 UPVC 6" June 2011
3 Kravan Well 40 UPVC 6" 20-2428-36
0.57 Kravan PrimarySchool
October2009
Khvein PrimarySchool
(Source) Construction report by Contractor (Octiber 2009 and June 2011)
In the same locations as monitoring well sites, core borings of 80 m depth and core size 66 mm were
conducted to check geological conditions prior to well drilling. Observation results of core samples are
shown in Supporting Report. The observation survey of the core boring samples showed the following
results:
• Khvein site
In Khvein site, clay formations are mainly distributed from ground surface to depth of 9 m. In
depth of 9 m to 50 m, sand and sandy clay formations are manly distributed. Clay formations with
thickness of about 13 m are distributed in depth of 50 m to 63.5 m. Under the clay formations,
sand formations are also distributed in depth of 63.5 m to 80 m. Based on their hydrogeological
conditions, it is considered that the layers in Khvein site can be divided into two aquifers of
shallow and deep ones: shallow aquifer on upper formations than clay formations distributed in
depth of 50 m to 63.5 m and deep aquifer on lower formations than the clay formations.
• Kravan site
In Kravan site, clay or sandy clay formations in depth of ground surface to 7 m are mainly
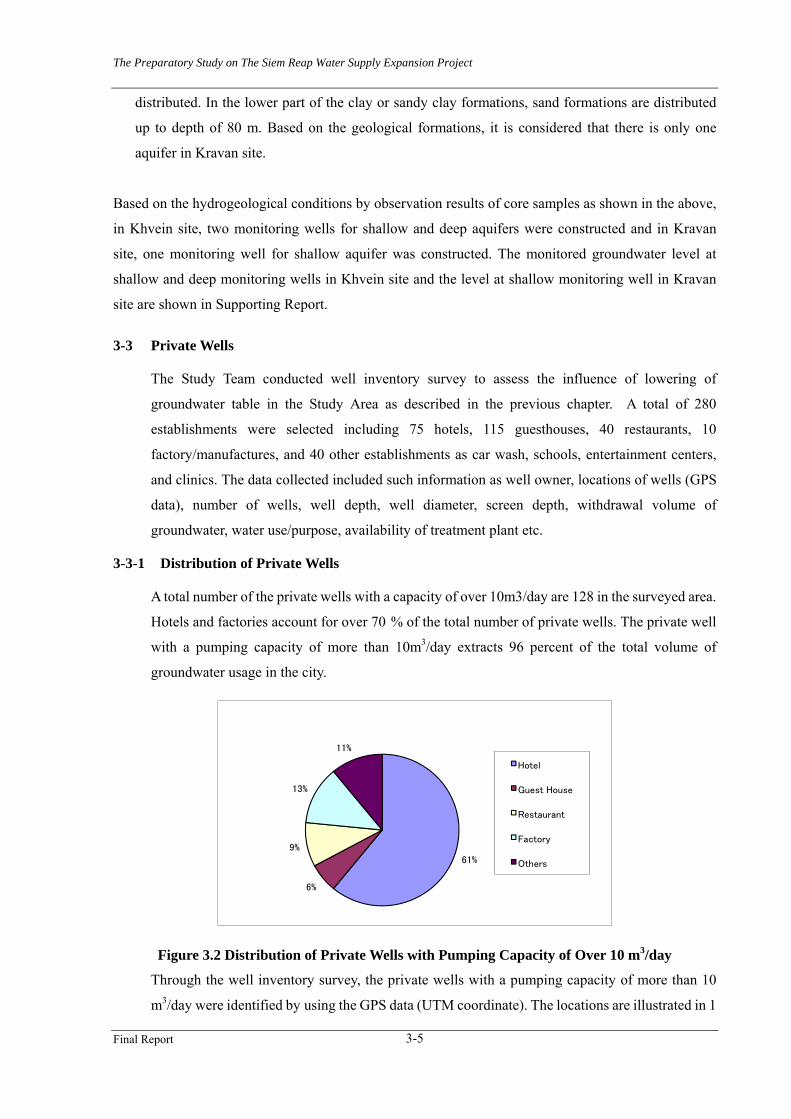
The Preparatory Study on The Siem Reap Water Supply Expansion Project
Final Report 3-5
distributed. In the lower part of the clay or sandy clay formations, sand formations are distributed
up to depth of 80 m. Based on the geological formations, it is considered that there is only one
aquifer in Kravan site.
Based on the hydrogeological conditions by observation results of core samples as shown in the above,
in Khvein site, two monitoring wells for shallow and deep aquifers were constructed and in Kravan
site, one monitoring well for shallow aquifer was constructed. The monitored groundwater level at
shallow and deep monitoring wells in Khvein site and the level at shallow monitoring well in Kravan
site are shown in Supporting Report.
3-3 Private Wells
The Study Team conducted well inventory survey to assess the influence of lowering of
groundwater table in the Study Area as described in the previous chapter. A total of 280
establishments were selected including 75 hotels, 115 guesthouses, 40 restaurants, 10
factory/manufactures, and 40 other establishments as car wash, schools, entertainment centers,
and clinics. The data collected included such information as well owner, locations of wells (GPS
data), number of wells, well depth, well diameter, screen depth, withdrawal volume of
groundwater, water use/purpose, availability of treatment plant etc.
3-3-1 Distribution of Private Wells
A total number of the private wells with a capacity of over 10m3/day are 128 in the surveyed area.
Hotels and factories account for over 70 % of the total number of private wells. The private well
with a pumping capacity of more than 10m3/day extracts 96 percent of the total volume of
groundwater usage in the city.
61%
6%
9%
13%
11%
Hotel
Guest House
Restaurant
Factory
Others
Figure 3.2 Distribution of Private Wells with Pumping Capacity of Over 10 m3/day
Through the well inventory survey, the private wells with a pumping capacity of more than 10
m3/day were identified by using the GPS data (UTM coordinate). The locations are illustrated in 1

The Preparatory Study on The Siem Reap Water Supply Expansion Project
Final Report 3-6
km x 1 km grids as shown in Figure 3.3. Figure 3.4 also shows a total extraction volume by the
private wells with a capacity of over 10m3/day in each 1 km x 1 km grid. Private wells with a
capacity of over 10m3/day are mostly distributed in the city center.
In dry season, extraction volume of groundwater by private wells reaches a total of 5,553 m3/day
or 96 % of 5,786 m3/d. The highest extraction of groundwater sources are made in the city center
and along the national road number 6 as shown in Figure 3.4 while the 10 – 50 m3/day extraction
areas as shown in light blue color are located in the surrounding areas of the city center.
Figure 3.3 Distribution of Private Wells with Pumping Capacity of Over 10 m3/day

The Preparatory Study on The Siem Reap Water Supply Expansion Project
Final Report 3-7
Figure 3.4 Distribution of Extraction Volume by Private Wells with Pumping Capacity of Over
10 m3/day
3-3-2 Analysis on Tapped Aquifers and Withdrawal Volume
Based on information gathered in the well inventory survey, tapped aquifer and withdrawal
volume of groundwater by the private wells were studied. In checking tapped aquifer, well depth
is an important parameter. Every private well had information of well depth. But, setting depth of
screens was recorded in only 26 % of a total of 383 wells. Majority of the wells have no
information on screen depths.

The Preparatory Study on The Siem Reap Water Supply Expansion Project
Final Report 3-8
0
500
1000
1500
2000
2500
0-10 10-20 20-30 30-40 40-50 50-60 60-70 70-80 80-90 90-100
Pum
pin
g R
ate
(m
3/day)
Well Depth (m)
Figure 3.5 Well Depth and Extracted Volume of Groundwater by Private Wells
The collected data show that the screens are set within a depth of 5 to 10 m from the well bottom.
Thus, tapped aquifer was identified assuming that the setting depth of screens was set at the depth
within 10 m from the well bottoms. Figure 3.5 shows the relationship between well depth and
extracted volume of groundwater of the private wells. Groundwater is mainly extracted in the
depth of 20 to 50 m and 60 to 70 m.
The private wells are mostly located in the city center. Thus, WT-5 monitoring well located in the
city center was used for this analysis. The tapped aquifer of WT-5 was identified in the Study on
Water Supply System for Siem Reap Region in Cambodia (2000) as illustrated in Figure 3.6.

The Preparatory Study on The Siem Reap Water Supply Expansion Project
Final Report 3-9
Figure 3.6 Well Structures and Geological Conditions of WT-5, LTa, and LTb
According to the Study on Water Supply System for Siem Reap Region in Cambodia (2000),
Alluvium is distributed within the depth of 10 to 20 m. Diluvium is located within the depth of 10
to 40 m. Both layers are underlain by Tertiary layers with thickness ranging from 40 to 50 m.
Under Tertiary layers, Mesozoic volcanic layers (rocks) are distributed. Alluvium layers are
formed by clayey sand/sand. Diluvium is composed of silty sand/clayey sand (stone). Tertiary
layers are made up of siltstone/clayey sandstone/clay stone.
Compared with the geological condition shown in Figure 3.6 and tapped aquifers of the private
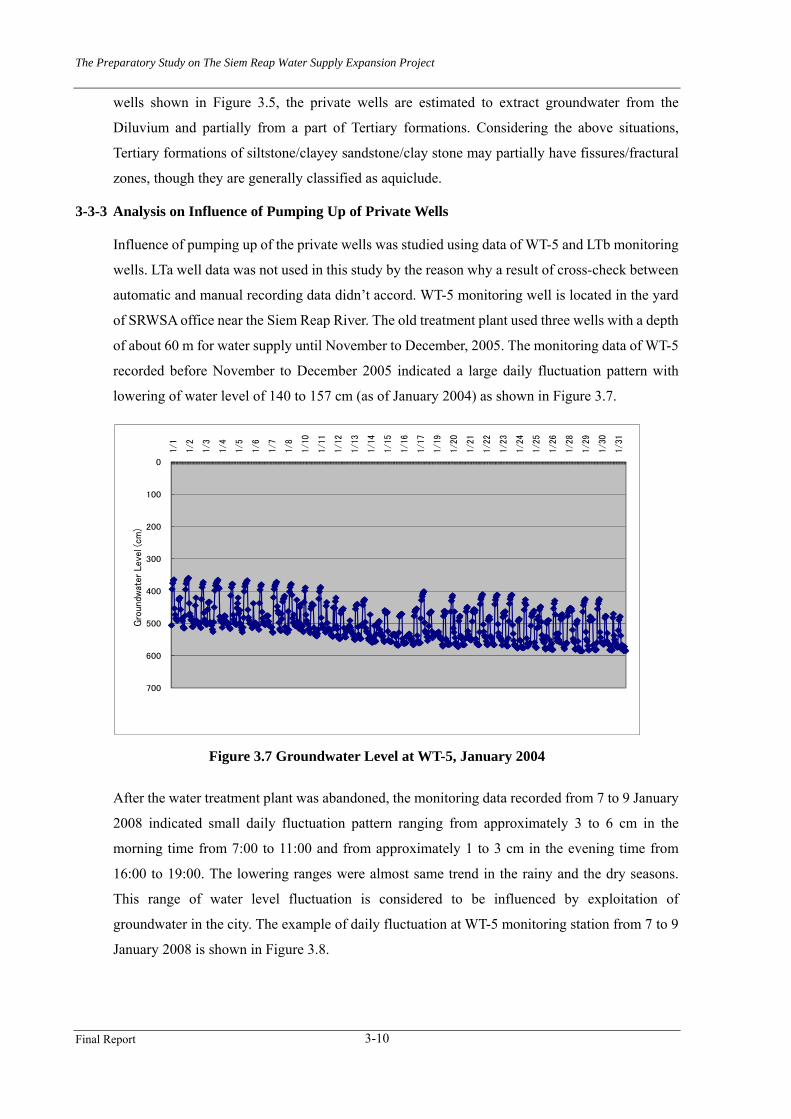
The Preparatory Study on The Siem Reap Water Supply Expansion Project
Final Report 3-10
wells shown in Figure 3.5, the private wells are estimated to extract groundwater from the
Diluvium and partially from a part of Tertiary formations. Considering the above situations,
Tertiary formations of siltstone/clayey sandstone/clay stone may partially have fissures/fractural
zones, though they are generally classified as aquiclude.
3-3-3 Analysis on Influence of Pumping Up of Private Wells
Influence of pumping up of the private wells was studied using data of WT-5 and LTb monitoring
wells. LTa well data was not used in this study by the reason why a result of cross-check between
automatic and manual recording data didn’t accord. WT-5 monitoring well is located in the yard
of SRWSA office near the Siem Reap River. The old treatment plant used three wells with a depth
of about 60 m for water supply until November to December, 2005. The monitoring data of WT-5
recorded before November to December 2005 indicated a large daily fluctuation pattern with
lowering of water level of 140 to 157 cm (as of January 2004) as shown in Figure 3.7.
0
100
200
300
400
500
600
700
1/1
1/2
1/3
1/4
1/5
1/6
1/7
1/8
1/10
1/11
1/12
1/13
1/14
1/15
1/16
1/17
1/19
1/20
1/21
1/22
1/23
1/24
1/25
1/26
1/28
1/29
1/30
1/31
Gro
undw
ater
Lev
el (cm
)
Figure 3.7 Groundwater Level at WT-5, January 2004
After the water treatment plant was abandoned, the monitoring data recorded from 7 to 9 January
2008 indicated small daily fluctuation pattern ranging from approximately 3 to 6 cm in the
morning time from 7:00 to 11:00 and from approximately 1 to 3 cm in the evening time from
16:00 to 19:00. The lowering ranges were almost same trend in the rainy and the dry seasons.
This range of water level fluctuation is considered to be influenced by exploitation of
groundwater in the city. The example of daily fluctuation at WT-5 monitoring station from 7 to 9
January 2008 is shown in Figure 3.8.

The Preparatory Study on The Siem Reap Water Supply Expansion Project
Final Report 3-11
100
120
140
160
180
200
220
240
260
280
1/7/
1:00
1/7/
5:00
1/7/
9:00
1/7/
13:0
0
1/7/
17:0
0
1/7/
21:0
0
1/8/
1:00
1/8/
5:00
1/8/
9:00
1/8/
13:0
0
1/8/
17:0
0
1/8/
21:0
0
1/9/
1:00
1/9/
5:00
1/9/
9:00
1/9/
13:0
0
1/9/
17:0
0
1/9/
21:0
0
Gro
undw
ater
Lev
el (cm
)
Figure 3.8 Groundwater Level at WT-5, 7-9 January 2008
On the same day, LTb-2 shallow monitoring well recorded fluctuations from 15 to 17 cm in water
level which was larger than that of WT-5. One interpretation is that that the WT-5 screen was set at
the Tertiary aquifer, considering the magnitude of daily groundwater level fluctuation and its
columnar section. The LTb-2 screens were set in the Diluvium layers so that the lowering of
groundwater level at LTb-2 can be larger than that of WT-5. Extraction volume of groundwater
from Diluvium layers by the private wells is more than that of Tertiary layers. Daily groundwater
fluctuation pattern at LTb-2 is shown in Figure 3.9.
100
120
140
160
180
200
220
240
260
280
300
320
340
360
380
400
420
1/7/
1:00
1/7/
4:00
1/7/
7:00
1/7/
10:0
0
1/7/
13:0
0
1/7/
16:0
0
1/7/
19:0
0
1/7/
22:0
0
1/8/
1:00
1/8/
4:00
1/8/
7:00
1/8/
10:0
0
1/8/
13:0
0
1/8/
16:0
0
1/8/
19:0
0
1/8/
22:0
0
1/9/
1:00
1/9/
4:00
1/9/
7:00
1/9/
10:0
0
1/9/
13:0
0
1/9/
16:0
0
1/9/
19:0
0
1/9/
22:0
0
Gro
undw
ater
Lev
el (cm
)
Figure 3.9 Recorded Daily Fluctuation of Groundwater Level at LTb-2, 7-9 January 2008

The Preparatory Study on The Siem Reap Water Supply Expansion Project
Final Report 3-12
15 to 17 cm of the fluctuation range of LTb-2 monitoring well is very small compared to yearly
fluctuation of groundwater level of about 2-3 m in Siem Reap area.
Monitoring data at LTb-1 deep well didn’t indicate clear daily fluctuation pattern. Thus, the
fluctuated monitoring data of WT-5 well, located in the city center, showing the lowering of
groundwater level from 3 to 5 cm, can be translated to be influence of pumping of groundwater by
private wells in Tertiary formation. The pumping by private wells did not have an impact to the
LTb-1 monitoring site which is located about 5 km from WT-5 monitoring well. Monitoring data
of LTb-1 deep well on 7-9 January 2008 is shown in Figure 3.10.
200
220
240
260
280
300
320
340
360
380
1/7/
1:00
1/7/
4:00
1/7/
7:00
1/7/
10:0
0
1/7/
13:0
0
1/7/
16:0
0
1/7/
19:0
0
1/7/
22:0
0
1/8/
1:00
1/8/
4:00
1/8/
7:00
1/8/
10:0
0
1/8/
13:0
0
1/8/
16:0
0
1/8/
19:0
0
1/8/
22:0
0
1/9/
1:00
1/9/
4:00
1/9/
7:00
1/9/
10:0
0
1/9/
13:0
0
1/9/
16:0
0
1/9/
19:0
0
1/9/
22:0
0
Gro
undw
ater
Lev
el (cm
)
Figure 3.10 Recorded Groundwater Level at LTb-1 Deep Well, 7-9 January 2008
3-4 SRWSA Production Wells
The existing eight wells were constructed at an interval of 450 m in October 2005. The wells are
situated 1.7 km south of the West Baray along the National Road No. 6. The locations of the wells
are illustrated in Figure 3.1.
3-4-1 Well Structures and Intake Aquifers
Intake layers (aquifers) of the SRWSA production wells were reviewed through geological logs
and well structures. The classification of geology is based on the results of the Study on Water
Supply System for Siem Reap Region in Cambodia (2000). Table 3.5 summarizes the
specifications of SRWSA Production wells.

The Preparatory Study on The Siem Reap Water Supply Expansion Project
Final Report 3-13
Table 3.5 Well Structures of SRWSA Production Wells No. Well Depth
(m) Well Diameter
(mm) Well Screen
(m) Static Water Level
(m) PW-1 60 m 250 mm 14.0-23.6, 26.0-38.8, 40.0-43.2 - 1.41 PW-2 60 m 250 mm 16.50-19.52, 21.72-44.00 - 1.86 PW-3 60 m 250 mm 14.02-23.45, 26.63-42.49 - 1.41 PW-4 60 m 250 mm 29.12-44.92 - 1.37 PW-5 60 m 250 mm 14.72-40.40 - 1.18 PW-6 60 m 250 mm 14.95-40.43 - 1.51 PW-7 60 m 250 mm 21.72-44.00 - 1.89 PW-8 60 m 250 mm 19.72-45.21 - 2.23
(Note: Static Water Level* Completion Report by Contractor, 2005 )
The columnar sections are classified by Alluvium, Diluvium, and Tertiary formation. Alluvium
is mainly formed by sand and sandy clay. Diluvium is formed by silty clay/sandy clay and silty
sand. Tertiary formation is formed by sandy clay/silty clay. Examination of the relationship
between the geology and the setting depth of screens indicates that the wells intakes groundwater
from aquifers distributed in the lower part of Alluvium and main portions of Diluvium. The
relationship between geology and screen portions is shown in Figure 3.11.
Figure 3.11 Intake Aquifers of SRWSA Production Wells

The Preparatory Study on The Siem Reap Water Supply Expansion Project
Final Report 3-14
3-4-2 Operation of SRWSA Production Wells
The SRWSA production wells started pumping up in November 2005. At the beginning, the
production did not reached the designed capacity of 8,000 m3/day due to the delay in the
expansion of the water supply network. As the water supply network developed, the production
capacity increased every month. In December 2007 the production capacity reached 8,000 m3/day
and exceeded 9,000 m3/day in August 2009. The pumping rate by each production well and total
volume of inflow to the existing water treatment plant has been recorded using an automatic
recording system installed at the monitoring room of the plant. However, data was not recorded
from April 2008 to March 2009 due to damage of the monitoring systems by lightning.
Rehabilitation of the monitoring systems was made under assistance of JICA expert at the
beginning of March 2009.
0.0
20.0
40.0
60.0
80.0
100.0
120.0
140.0
Oct-
05
Dec-05
Feb-06
Apr-
06
Jun-06
Aug-
06
Oct-
06
Dec-06
Feb-07
Apr-
07
Jun-07
Aug-
07
Oct-
07
Dec-07
Feb-08
Apr-
08
Jun-08
Aug-
08
Oct-
08
Dec-08
Feb-09
Apr-
09
Jun-09
Aug-
09
Oct-
09
Dec-09
Feb-10
(%) (C
rite
ria=8000m
3/day×
30days)
Figure 3.12 Monthly Data of SRWSA Production Wells, October 2005 to February 2010
3-4-3 Analysis on Influence of Pumping Up of SRWSA Production Wells
WT-4 and Khvein monitoring wells were used to study influence of pumping up of the SRWSA
production wells. WT-4 and Khvein shallow wells are situates 2.6 km and 4.1 km from the
SRWSA production wells, respectively.
(1) Well Structures and Aquifers of WT-4
The screens of WT-4 monitoring well are installed at the lower portion of Alluvium and main
portion of Diluvium. This means the screens of WT-4 monitoring well are located at the same
tapped aquifers as the SRWSA production wells. Figure 3.13 shows the geological conditions and
the setting depth of screens of the WT-4 monitoring well.
Recording Equipment was
out of order.

The Preparatory Study on The Siem Reap Water Supply Expansion Project
Final Report 3-15
(2) Analysis of WT-4 Data
Figure 3.14 shows verified WT-4 monitoring data. Only those data from Mar. 2007 through Feb.
2008 were indentified to be reliable by comparing the manual measurement data and the
automatic recorded data. The monitoring data during this period were used for this analysis.
The recorded data shows that the fluctuation of groundwater levels of WT-4 was 1.6 m in 2007 to
2008. The highest groundwater level was in October at the end of rainy season and the lowest
groundwater level was recorded at the beginning of May at the end of dry season.
Figure 3.13 Geological Conditions and Depth of Screens of WT-4

The Preparatory Study on The Siem Reap Water Supply Expansion Project
Final Report 3-16
0
20
40
60
80
100
120
140
160
180
3/1
3/14
3/27
4/9
4/22
5/5
5/19
6/1
6/14
6/27
7/10
7/23
8/6
8/19
9/1
9/14
9/27
10/1
0
10/2
4
11/6
11/1
9
12/2
12/1
5
12/2
8
1/11
1/24
2/6
2/19
Gro
undw
ater
Lev
el (c
m)
Figure 3.14 Groundwater Level at WT-4, March 2007 to February 2008
As showed in the Study on Water Supply System for Siem Reap Region in Cambodia (2000),
yearly groundwater level fluctuation pattern was influenced by the seasonal precipitation. Only
those data recorded during the dry season were selected to minimize influence of rainfall in this
study,
This analysis was conducted by comparing the data when withdrawal of groundwater from the
SRWSA production wells was stopped, and the monitored groundwater levels at WT-4.
Further, in order to minimize influence of pumping of neighboring private wells, this analysis was
conducted using data during mid-night when pumping of the private wells and the SRWSA
production wells were not in operation.
Monitoring data of two days on 8 and 9 January 2008 was then used as full pumping day on 9
January and halting day of pumping up of groundwater for about 4 hours on 8 January.
Operating condition of SRWSA production wells on 8 and 9 January 2008 is shown in Figure 3.15
and daily pattern of monitoring data in Figure 3.16 and Figure 3.17.

The Preparatory Study on The Siem Reap Water Supply Expansion Project
Final Report 3-17
0
50
100
150
200
250
300
350
400
1/8/
0:00
1/8/
2:00
1/8/
4:00
1/8/
6:00
1/8/
8:00
1/8/
10:0
0
1/8/
12:0
0
1/8/
14:0
0
1/8/
16:0
0
1/8/
18:0
0
1/8/
20:0
0
1/8/
22:0
0
1/9/
0:00
1/9/
2:00
1/9/
4:00
1/9/
6:00
1/9/
8:00
1/9/
10:0
0
1/9/
12:0
0
1/9/
14:0
0
1/9/
16:0
0
1/9/
18:0
0
1/9/
20:0
0
1/9/
22:0
0
Pro
duct
ion
Rat
e (c
m)
Figure 3.15 Operating Record of SRWSA Production Wells, 8 and 9 January 2008
0
10
20
30
40
50
60
70
80
90
100
110
1/8/
1:00
1/8/
3:00
1/8/
5:00
1/8/
7:00
1/8/
9:00
1/8/
11:0
0
1/8/
13:0
0
1/8/
15:0
0
1/8/
17:0
0
1/8/
19:0
0
1/8/
21:0
0
1/8/
23:0
0
1/9/
1:00
1/9/
3:00
1/9/
5:00
1/9/
7:00
1/9/
9:00
1/9/
11:0
0
1/9/
13:0
0
1/9/
15:0
0
1/9/
17:0
0
1/9/
19:0
0
1/9/
21:0
0
1/9/
23:0
0
Gro
undw
ater
Lev
el (cm
)
Figure 3.16 Daily Fluctuation of Groundwater Level of WT-4 on 8 and 9 January 2008
Operating Conditions of SRWSA production wells are as follows:
Day Operating/Non- operating hours Pumping rate 8 Jan. 2008 Full operating (0:00, 7:00-23:00)
Halting of pumping up (2:00 – 5:00) Decrease of pumping rate (1:00, 6:00)
369 – 373 m3/hour (Total: 7,062 m3/day)
9 Jan. 2008 24 hours: Full operating 369 – 372 m3/hour (Total: 8,901m3/day)
(Note) Full operating means operation of all production wells and halting means the halting of all production wells.
As shown in the following figure showing the fluctuation of groundwater level for two days, the
lowering in observed in the morning (5:00-10:00) and in the evening (17:00-19:00). Magnitude of
the fluctuation approximately ranges from 5 to 8 cm. The fluctuation of groundwater level is
considered to occur when neighboring private wells are operating.

The Preparatory Study on The Siem Reap Water Supply Expansion Project
Final Report 3-18
60
65
70
75
80
85
90
95
100
1 2 3 4 5 6 7 8 9 10 11 12 13 14 15 16 17 18 19 20 21 22 23 24G
roundw
ate
r Level (c
m)
Time (hour)
January 8
January 9
Figure 3.17 Comparison of Daily Fluctuation on 8 and 9 January 2008 of WT-4
Figure 3.17 shows comparison of daily fluctuation of groundwater level within 24 hours on two
days on 8 and 9 January 2008. Their daily fluctuation patterns indicate that:
• Data on 8 January 2008 shows that SRWSA stopped pumping up from 0:00. After 2:00
up to 5:00, the pumping was fully stopped. Then, from 5:00, pumping up was stated up
again. However, fluctuation tendency of groundwater level showed the same as that of 9
January when SRWSA operated the pumps for 24 hours in reference to Figure 3.17. This
phenomenon indicates that SRWSA wells do not have any impact to WT-4. Because, if the
SRWSA wells have some impact on WT-4, the water level at that time between 2:00 to 5:00
on 9 January should be lower than that of 8 January.
• Thus, interference radius of pumping of the SRWSA production wells is considered not
to have a negative influence on monitored groundwater level of WT-4.
• The same tendency was confirmed on the monitored data on 14 to 16 December 2007.
• Likewise, the correlation between the operating conditions (pumping rates) of the
SRWSA production wells and the monitored groundwater levels at WT-4 were studied
based on correlation analysis method. Results shows that the determination coefficients
were calculated to be R2=0.148547 for the case on 8 and 9 January 2008 and R2=0.12983
for case on 14 to 16 December 2007. Therefore, correlations between the pumping rates
and the monitored groundwater levels were not identified.
• As a result, in WT-4 monitoring well located about 2.6 km away from the SRWSA
production wells, the influence of pumping of SRWSA wells were not observed.

The Preparatory Study on The Siem Reap Water Supply Expansion Project
Final Report 3-19
In the similar way, the same comparison on 8 and 9 January 2008 was conducted on LTb-2 data.
Figure 3.18 shows comparison result of daily fluctuation in both days.
355
360
365
370
375
380
385
390
1:00
2:00
3:00
4:00
5:00
6:00
7:00
8:00
9:00
10:00
11:00
12:00
13:00
14:00
15:00
16:00
17:00
18:00
19:00
20:00
21:00
22:00
23:00
24:00
Gron
dwat
er Le
vel(c
m)
Time (hour)
8-Jan
9-Jan
Figure 3.18 Comparison of Daily Fluctuation on 8 and 9 January 2008 of LTb-2
Figure 3.18 shows the followings:
• Though SRWSA wells stopped to pump up groundwater on Jan. 8, from 2:00 to 5:00,
daily fluctuation pattern of groundwater levels is almost the similar to that in full pumping
mode on Jan. 9. Thus, likewise to WT-4, daily fluctuation pattern doesn’t indicate
influence of pumping of SRWSA wells.
• Difference of groundwater levels in both days is caused by seasonal drawdown in the
dry season. The daily drawdown is about 3 cm.
• Compared with WT-4, daily fluctuation is large with range of 18 to 19 cm. Its
drawdown starts from 8:00 in the morning. The lowest level happens in 17:00 in the
evening. Since LTb-2 well is located near the city center, compared with distance from
SRWSA wells, this large daily fluctuation is considered to be caused by pumping of many
private wells located in the city center.
(3) Analysis of Khvein Shallow Well Data
The Khvein monitoring shallow well was constructed in October 2009 under this study and the
monitoring equipment was installed in February 2010. Monitoring was started from February 17
2010. The well is situated about 4.1 km away and northwest of the SRWSA production wells.
The location is illustrated in Figure 3.1. It is considered that SRWSA production wells and
Khvein shallow well are tapped in the same shallow aquifers as Alluvium and Diluvium. In the
same manner as that of WT-4 monitoring well, the influence of pumping by the SRWSA
production wells was studied.
Operation of the pumps of the SRWSA production wells was temporarily halted about two hours

The Preparatory Study on The Siem Reap Water Supply Expansion Project
Final Report 3-20
in the midnight on 7 and 9 May 2010 as shown in Figure 3-19. Based on the data recorded during
the stopping of the SRWSA production wells, the influence against monitored water level at
Khvein shallow well were analyzed.
0
50
100
150
200
250
300
350
400
450
5/7/
0:00
5/7/
4:00
5/7/
8:00
5/7/
12:0
0
5/7/
16:0
0
5/7/
20:0
0
5/8/
0:00
5/8/
4:00
5/8/
8:00
5/8/
12:0
0
5/8/
16:0
0
5/8/
20:0
0
5/9/
0:00
5/9/
4:00
5/9/
8:00
5/9/
12:0
0
5/9/
16:0
0
5/9/
20:0
0
5/10
/0:0
0
5/10
/4:0
0
5/10
/8:0
0
5/10
/12:
00
5/10
/16:
00
5/10
/20:
00
Pro
uduc
tion
Rat
e (m
3/ho
ur)
Figure 3.19 Operation of SRWSA Production Wells, 7 to 10 May 2010
Operating Conditions of SRWSA production wells are summarized below:
Day Operating/Non- operating hours Pumping rate 7 May 2010 Full operating (0:00, 5:00-23:00)
Halting of pumping up (2:00 – 3:00) Decrease of pumping rate (1:00, 4:00)
387 - 389 m3/hour (Total: 8,154 m3/day)
8 May 2010 24 hours: Full operating 384 - 389 m3/hour (Total: 9,306 m3/day)
9 May 2010 Full operating (0:00, 5:00-23:00) Halting of pumping up (2:00 – 3:00) Decrease of pumping rate (1:00, 4:00)
386 - 389 m3/hour (Total: 8,106 m3/day)
10 May 2010 24 hours: Full operating 386 – 389 m3/hour (Total: 9,285 m3/day)
(Note) Full operating means operation of all production wells and halting means the halting of all production wells.
The fluctuation patterns of groundwater levels based on 24 hours full operation on 8 and 10 May
2010 and halting of pumping of the SRWSA production wells for two hours on 7 and 9 May 2010
were compared. Comparison of fluctuation patterns of groundwater levels are shown in Figure
3-20.

The Preparatory Study on The Siem Reap Water Supply Expansion Project
Final Report 3-21
-250
-245
-240
-235
-230
-225
-220
-215
-210
-205
-200
0:00
1:00
2:00
3:00
4:00
5:00
6:00
7:00
8:00
9:00
10:0
0
11:0
0
12:0
0
13:0
0
14:0
0
15:0
0
16:0
0
17:0
0
18:0
0
19:0
0
20:0
0
21:0
0
22:0
0
23:0
0
Gro
undw
ater
Lev
el (cm
)
May 7
May 8
May 9
May 10
Figure 3.20 Comparison of Daily Fluctuation of Khvein Shallow Well, 7 to 10 May 2010
Figure 3-20 indicates that:
• For this period, the recorded groundwater level generally lowers every day by 1.7 cm. It
was in dry season. Though all of the SRWSA production wells were stopped for two hours
from 2:00 to 3:00 on 7 and 9 May 2010, groundwater level did not go up. All of the
groundwater levels for these four days have shown the similar fluctuation patterns.
• If the SRWSA production wells have some impact to the Khvein monitoring well, the
data recorded from 2:00 to 3:00 on 8 and 10 May 2010 should be lower compared to those
of the data recorded from 2:00 to 3:00 on 7 and 9 May 2010. The actual data shows that
water levels recorded were not significantly different. Thus, it is considered that the
SRWSA production wells didn’t influence to the Khvein monitoring shallow well.
• This phenomenon suggests that the SRWSA production wells doesn’t influence against
the environment including around the Angkor Wat ruins which is located 6.5 km away
from the SRWSA production wells.

Chapter 4. Hydrological Conditions in Siem Reap

The Preparatory Study on The Siem Reap Water Supply Expansion Project
Final Report 4-1
Chapter 4. Hydrological Conditions in Siem Reap
In Siem Reap, both the domestic water use and a small amount of industrial water use are mainly
taking groundwater as the water supply source. More than half of domestic water use is supplied
by SRWSA using 8 production wells located in the southwest of Siem Reap Town. However,
because of rapid increase of the population, tourists and daily water use quantity per capita, the
water demand is now more than the water supply capacity of SRWSA. Therefore, a lot of private
wells have been constructed mainly in the urban area to supplement water supply.
When groundwater is developed the groundwater level drawdown and change of groundwater
flow will surely occur. Therefore, to keep the effect of groundwater drawdown within allowable
limits is an essential consideration when formulating a groundwater development plan.
4-1 River Basin Division in Water Supply Area
When a river basin is taken as the extent for hydrological analysis, the flow of surface water
between different basins can be dismissed, and in most cases groundwater flow between different
basins can also be dismissed. Therefore, the processing of hydrological analysis would become
simple to improve the precision of the analysis. To make clear the river basin divisions, a 90 m
mesh DEM (Digital Elevation Model) data SRTM (Shuttle Radar Topography Mission,
USNASA) were taken as the basic data. And GIS hydrology tools were used to delineate the river
basin boundaries.
Figure 4.1 Water Supply Service Area and Relevant River Basins

The Preparatory Study on The Siem Reap Water Supply Expansion Project
Final Report 4-2
Figure 4.1 shows the extent of the three river basins that affect the water supply service area. The
water supply area is mostly comprised of the Siem Reap river basin, with the west side comprised
of part of the Tol Kambot river basin, and the east side comprised of part of the Roluos river basin.
The Siem Reap River and the Roluos River originate in the Kulen Mountains, and the Tol Kambot
River is a small tributary of the Staeng Sangka River. All the three rivers finally discharge into the
Tonle Sap Lake.
The recharge area of the water supply service area is shown in Figure 4.2. It consists of the three
abovementioned river basins, the Siem Reap river basin in its entirety and parts of the other two.
The total recharge area of the water supply area is 1,277km2, of which 552km2 is the water supply
service area.
Figure 4.2 Recharge Area of the Water Supply Service Area
4-2 Climatic Conditions
Water resources in the water supply area can be divided into recharge from precipitation,
discharge by rivers, and consumption by evaporation or evapotranspiration, percolation into
groundwater and discharge by groundwater. All of the above components concerned with the
water resources in Siem Reap can be summarized into the groundwater balance equation as

The Preparatory Study on The Siem Reap Water Supply Expansion Project
Final Report 4-3
follows:
=ΔW R – D –E + F in – Fout
Here:
ΔW: Increase or decrease amount of groundwater
R: Amount of precipitation
D: Amount of river discharge
E: Amount of evaporation or evapotranspiration
Fin: Amount of groundwater flow in from other basins to the study area
Fout: Amount of groundwater flow (discharge) to outside area (Tonle Sap Lake)
As shown in the groundwater balance equation, groundwater recharge consists of two
components: precipitation and flow in from other basins. Because there is no flow in from other
basins to the study area when the water balance is analyzed in the unit of river basin, the
precipitation becomes the only recharge component in the equation. In plain area like Siem Reap,
the water exchange amount between rivers and groundwater is generally small because of all
hydraulic gradient and hydraulic conductivity and flow section are relatively small. The amount
of groundwater flow out to Tonle Sap Lake is also small because of the same reason of small
water exchange between river and groundwater. Therefore, the precipitation and evaporation can
be taken as the most important two components for water balance analysis in the study area.
Figure 4.3 shows monthly average amount of precipitation and evaporation. Like other Southeast
Asian countries, the precipitation in Siem Reap is characterized by its seasonal changes. A year
can be clearly distinguished into 2 seasons: rainy season and dry season. The rainy season
continues half a year from May to October; and the dry season the other half from November to
April. The total amount of precipitation in the rainy season is above 1,200 mm; accounts for 89%
of the whole precipitation in a year. In contrast, total precipitation amount in the dry season is
about 150 mm; only 11% of whole annual precipitation.
Another climatic characteristic in Siem Reap is the monthly average of evaporation amount that
changes little throughout the year, from 105 to 175 mm, compared to the large fluctuation of
monthly precipitation.

The Preparatory Study on The Siem Reap Water Supply Expansion Project
Final Report 4-4
Figure 4.3 Distribution of Monthly Precipitation and Evaporation in the Study Area The graph was created by summarizing observation result in the meteorological observation station Siem Reap City from 1988 to 2008.
4-3 Available Meteorological Data
There are 3 hills located in the water supply area, Phnum Pok in the eastern part with an elevation
of 272 m, Phnon Kraom in the southern part with an elevation of 140 m, and Phnum Bakheng
between the heritage sites, Angkor Wat and Angkor Thom, with an elevation of 99 m. Except the
three small hills, the whole water supply service area is characterized by a plain topography with
a gentle declination from 50 m in the north side to 1 m in the south side.
Generally, the amounts of precipitation and evaporation change largely in the mountainous area
and are distributed homogeneously in the plain area. However, even in the plain area the
precipitation and evaporation is not exactly the same everywhere. Therefore, collecting as much
precipitation observation data as possible would be useful for improving the precision of
hydrological analysis.
For precipitation analysis, observation results from 5 meteorological stations have been collected
from the Meteorology and Hydrology Office of Siem Reap (The Ministry of Water Resources
and Meteorology). Figure 4.4 shows locations of the 5 meteorological stations.

The Preparatory Study on The Siem Reap Water Supply Expansion Project
Final Report 4-5
Figure 4.4 Location of Meteorological Stations Within the Study Area
Table 4.1 shows the basic information of the 5 meteorological stations, including station name,
location (coordinates), methods and duration of observations, and so on.
Table 4.1 Basic Information about the Meteorological Stations for Precipitation Analysis St. Name City station Prasat Bakong Puok Angkor Thom Phnon KraomEasting 373503 390067 362714 375314 372399Northing 1479133 1475413 1485942 1491624 1469041Longitude 103° 48' 97 " 103° 24' 84 " 103° 50' 66 " 103° 45' 05 " 104° 20' 23 "latitude 13° 24' 65 " 13° 36' 15 " 13° 29' 58 " 13°13' 44 " 13° 07' 27 "Altitude 15 15 15 15 15Recorder Automatic & Manual Manual Manual Manual ManualData length 1988-2008 2001-2008 2003-2008 2001-2008 2004-2007
Average 1459.9 1470.6 1418.8 1088.4 1303.0
Max 1766(1995) 1685(2005) 1550(2005) 1334(2008) 1534(2005)
Min 1141(2002) 1039(2002) 1276(2003) 562.1(2007) 1196(2006)
• All stations except the city station are supported by Mekong River Committee (MRC) • UTM datum is Indian-Thailand" • Altitude is not accurate • The unit of maximum and minimum precipitation is mm • The occurrence years of maximum and minimum precipitation are given in parenthesis
4-4 Available Groundwater Monitoring Data
4-4-1 Existing Monitoring Wells
Eight (8) groundwater monitoring wells were drilled in the study area in a previous survey (The
Study on Water Supply System for Siem Reap Region in Cambodia, 2000). The specifications of

The Preparatory Study on The Siem Reap Water Supply Expansion Project
Final Report 4-6
these monitoring wells are shown in Table 4.2 and Table 4.3.
Table 4.2 Basic Information about Existing Automatic Observation Wells
Code Location ObservationDuration
Depth(m)
Head(cm)
WT-3 Ph Kouk Phnou Sch. Jul_03 - Apr 08 80 0.76WT-4 Ph. Khant Srok Puork Sch. Jul_03 - Now 80 0.82WT-5 Water Treatment Plant (SRWSA) Aug_03 - Now 110 0.60WT-6 Banteay Srei High Sch, Aug_03 - Now 80 0.93WT-7 Preahdak Primary Sch. Aug_03 - Now 80 0.90WT-8 APSARA Office Building Aug_03 - Jan_04 95 0.89LTa-1 72 1.77LTa-2 35 1.79LTb-1 73 1.66LTb-2 40 1.66
SOS Kindergarden
Angkor Wat (Police Station)
Aug_03 - Now
Aug_03 - Now
Table 4.3 Basic Information about Existing Automatic Observation Wells
Code Elevation(m)
Screen Depth(m) Longitude Latitude
WT-3 16.45 20.38-32.20 103。45' 5.9" 13。28' 37.3"WT-4 13.66 13.38-25.20 103。46' 3" 13。25' 8.3"WT-5 15.84 43.82-54.20 103。51' 39.2" 13。21' 41.2"WT-6 32.86 13.38-25.20 103。56' 27.9" 13。28' 58.5"WT-7 26.03 44.38-56.20 103。56' 16.7" 13。26' 45"WT-8 17.07 67.38-79.20 103。52' 49.3" 13。22' 51.8"LTa-1 63.62-71.90LTa-2 26.61-34.90LTb-1 64.61-72.90LTb-2 31.61-39.90
17.43
21.32
103。51' 51.5"
103。51' 31.4"
13。22' 58"
13。24' 40.7"
(Note) The automatic observation of WT-3 was stopped in April 2008, because the log was removed.
No automatic observation data is available for WT-8 from January 2004, because the equipment was lost.
The series of WT are groundwater level observation wells, and the series of LT are groundwater and land displacement observation wells.
Automatic observation systems were installed in the monitoring wells making it possible to
conduct continuous observation in short time intervals. However, caused by problems like the
breakdown of the observation equipment, battery power deficiencies and so on, relatively large
errors have been found in the data from almost all of the monitoring wells. If the original data was
used directly in analysis without earnestly inspection, huge mistake would occur to lead wrong
analysis result. Therefore, the manual observation was started by SRWSA from 2007 to be used
for examination and/or modification of automatic observation results.
4-4-2 Inspection of Groundwater Monitoring Result
(1) Monitoring Site WT-3
Figure 4.5 shows the original monitoring data obtained from automatic recording logs of the
groundwater monitoring well WT-3. Except some periods of missing data and obvious

The Preparatory Study on The Siem Reap Water Supply Expansion Project
Final Report 4-7
observation errors, periodic groundwater level fluctuation is clearly shown by the figure.
0
50
100
150
200
250
300
350 Jun-03
Aug-03
Oct-03
Dec-03
Feb-04
Apr-04
Jun-04
Aug-04
Oct-04
Dec-04
Feb-05
Apr-05
Jun-05
Aug-05
Oct-05
Dec-05
Feb-06
Apr-06
Jun-06
Aug-06
Oct-06
Dec-06
Feb-07
Apr-07
Jun-07
Aug-07
Oct-07
Dec-07
Feb-08
Apr-08
Gro
undw
ater
Lev
el in
WT_
3(c
m fr
om g
roun
d su
rface
)
Figure 4.5 Observation Result of Groundwater Level Fluctuation (WT-3)
The above graph shows the original data from monitoring site of WT-3. As erroneous data has been found in the original data, it is indispensible to inspect the data before using. The inspection results are given in Table 4.8.
y = 1.047x - 8.3139R2 = 0.9899
0
50
100
150
200
250
300
0 50 100 150 200 250 300
Auto Observation Result (WL:cm)
Mun
ual O
bser
vatio
n R
esul
t (
WL:
cm)
Observation databetween May 2007 and April 2008
Figure 4.6 Examination of Auto Observation Result with Manual
Observation Data (WT-3)
A high correlation can be found by comparing the auto observation result with manual
observation result as shown in Figure 4.6. Therefore, it can be considered that the auto
observation equipment at WT-3 correctly recorded the groundwater level fluctuation within the
whole monitoring duration from 2003 to 2008.
(2) Monitoring Site WT-4
Figure 4.7 shows the original monitoring data obtained from automatic recording logs of the
monitoring well WT-4. Compared to the observation results from monitoring well WT-3, the

The Preparatory Study on The Siem Reap Water Supply Expansion Project
Final Report 4-8
result from monitoring well WT-4 shows intense and abnormal fluctuation in groundwater levels.
-400
-300
-200
-100
0
100
200
300 Jun-03A
ug-03O
ct-03D
ec-03Feb-04A
pr-04Jun-04A
ug-04O
ct-04D
ec-04Feb-05A
pr-05Jun-05A
ug-05O
ct-05D
ec-05Feb-06A
pr-06Jun-06A
ug-06O
ct-06D
ec-06Feb-07A
pr-07Jun-07A
ug-07O
ct-07D
ec-07Feb-08A
pr-08Jun-08Jul-08S
ep-08N
ov-08Jan-09M
ar-09M
ay-09Jul-09
Gro
undw
ater
Lev
el in
WT_
4(c
m fr
om g
roun
d su
rface
)
Figure 4.7 Observation Result of Groundwater Level Fluctuation (WT-4)
The above graph shows the original data from monitoring site of WT-4. As erroneous data has been found in the original data, it is indispensible to inspect the data before using. The inspection results are given in Table 4.8.
0
20
40
60
80
100
120
140
160
180
200
-300 -250 -200 -150 -100 -50 0 50 100 150 200
Auto Observation Result (WL:cm)
Man
ual O
bser
vatio
n R
esul
t (W
L:cm
) Observation data between Mar. 2007 and Mar. 2008Y = 1.0444X + 7.54 R2 = 0.9972
Observation data from July, 2008
Figure 4.8 Examination of Auto Observation Result with Manual
Observation Data (WT-4)
As shown in Figure 4.8, the examination of the auto observation results using the manual
observation data shows a high correlation for period of about one year from March 2007 to March
2008. However, no significant correlation can be identified after March 2008 between the two
data sets. That is, large errors can be confirmed to have been included in the auto observation
results from March 2008, and it is impossible to correctly revise the data. The result of inspection
indicates that the reliable data duration for WT-4 is limited from March 2007 to March 2008.
(3) Monitoring Site WT-5
Figure 4.9 shows the original monitoring data obtained from automatic recording logs of the
monitoring well WT-5. Observation result in this groundwater monitoring well site shows two
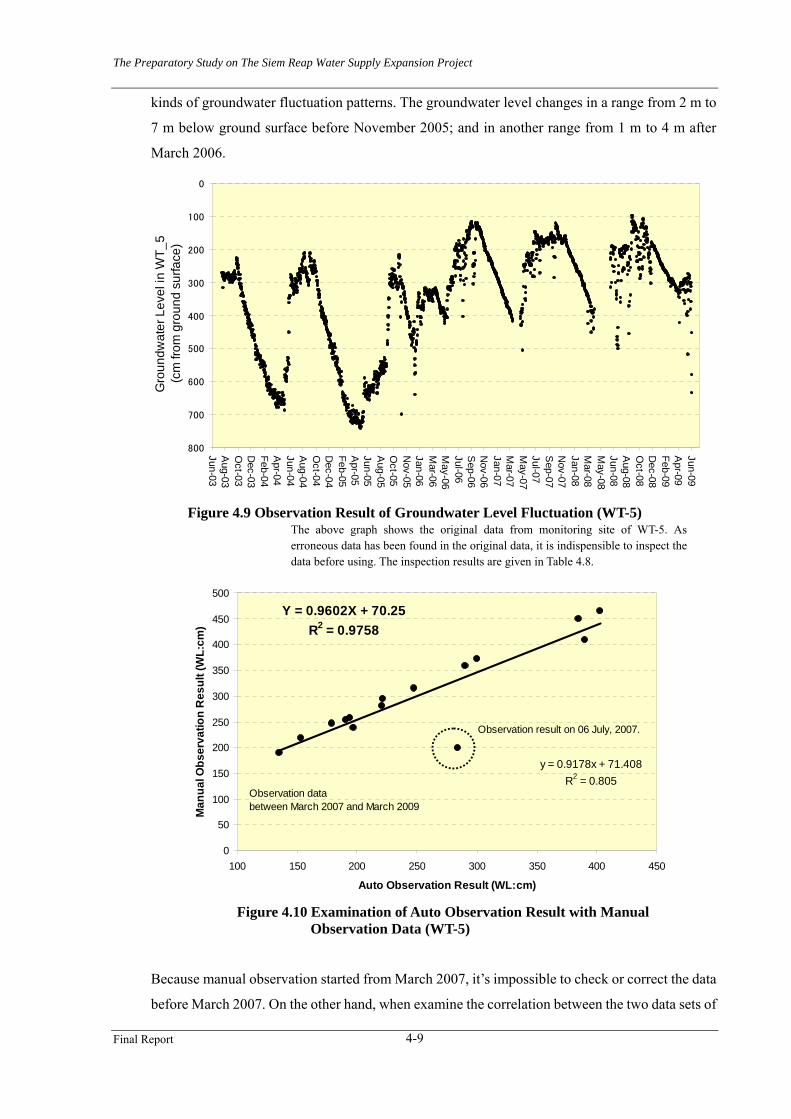
The Preparatory Study on The Siem Reap Water Supply Expansion Project
Final Report 4-9
kinds of groundwater fluctuation patterns. The groundwater level changes in a range from 2 m to
7 m below ground surface before November 2005; and in another range from 1 m to 4 m after
March 2006.
0
100
200
300
400
500
600
700
800 Jun-03A
ug-03O
ct-03D
ec-03Feb-04A
pr-04Jun-04A
ug-04O
ct-04D
ec-04Feb-05A
pr-05Jun-05A
ug-05O
ct-05N
ov-05Jan-06M
ar-06M
ay-06Jul-06S
ep-06N
ov-06Jan-07M
ar-07M
ay-07Jul-07S
ep-07N
ov-07Jan-08M
ar-08M
ay-08Jun-08A
ug-08O
ct-08D
ec-08Feb-09A
pr-09Jun-09
Gro
undw
ater
Lev
el in
WT_
5(c
m fr
om g
roun
d su
rface
)
Figure 4.9 Observation Result of Groundwater Level Fluctuation (WT-5)
The above graph shows the original data from monitoring site of WT-5. As erroneous data has been found in the original data, it is indispensible to inspect the data before using. The inspection results are given in Table 4.8.
y = 0.9178x + 71.408R2 = 0.805
0
50
100
150
200
250
300
350
400
450
500
100 150 200 250 300 350 400 450
Auto Observation Result (WL:cm)
Man
ual O
bser
vatio
n R
esul
t (W
L:cm
)
Observation result on 06 July, 2007.
Y = 0.9602X + 70.25R2 = 0.9758
Observation databetween March 2007 and March 2009
Figure 4.10 Examination of Auto Observation Result with Manual
Observation Data (WT-5)
Because manual observation started from March 2007, it’s impossible to check or correct the data
before March 2007. On the other hand, when examine the correlation between the two data sets of

The Preparatory Study on The Siem Reap Water Supply Expansion Project
Final Report 4-10
auto observation and manual observation, a relatively high correlation can be confirmed except
the few obviously erroneous data, as shown in Figure 4.10. The result of inspection indicates that
the reliable data duration for WT-5 can be considered from March 2007 to March 2009. However,
when the reliable data from WT-5 is used for analysis, attention has to be paid because some
wrong data are still included within this duration.
(4) Monitoring Site WT-6
Figure 4.11 shows the original monitoring data obtained from automatic recording logs of the
monitoring well WT-6. The figure shows the water level fluctuation from 9 m above ground
surface and 3 m below the ground surface. It is clear that the result of groundwater level of 9 m
over ground surface is not true. But if this value is changed to 1 m below ground surface by
referring groundwater level from other observation wells, the lower water level would be 13m
below the ground surface. The groundwater level cannot be as low as this value by adjustment
from the result of groundwater level simultaneous observation survey.
-1000
-800
-600
-400
-200
0
200
400 Jul-03S
ep-03N
ov-03D
ec-03Feb-04A
pr-04Jun-04A
ug-04O
ct-04D
ec-04Feb-05A
pr-05Jun-05Jul-05S
ep-05N
ov-05Jan-06M
ar-06M
ay-06Jul-06S
ep-06N
ov-06Jan-07M
ar-07A
pr-07Jun-07A
ug-07O
ct-07D
ec-07Feb-08A
pr-08Jun-08A
ug-08O
ct-08N
ov-08Jan-09M
ar-09M
ay-09Jul-09
Gro
undw
ater
Lev
el in
WT_
6(c
m fr
om g
roun
d su
rface
)
Figure 4.11 Observation Result of Groundwater Level Fluctuation (WT-6)
The above graph shows the original data from monitoring site of WT-6. As erroneous data has been found in the original data, it is indispensible to inspect the data before using. The inspection results are given in Table 4.8.
When comparing the results of the two data sets between auto observation and manual
observation, high correlation can be confirmed in the period from July 2008 to June 2009 as
shown in Figure 4.12. The figure also shows the fact that there is no significant correlation
between the two data sets before March 2008. Therefore, the result of inspection indicates that the
reliable data duration for WT-6 is limited from July 2008 to June 2009.

The Preparatory Study on The Siem Reap Water Supply Expansion Project
Final Report 4-11
0
50
100
150
200
250
300
-350 -300 -250 -200 -150 -100 -50 0 50
Auto Observation Result (WL:cm)
Man
ual O
bser
vatio
n R
esul
t (W
l:cm
)
Observation data betweenJuly 2008 and June 2009
Y = 1.022X + 176.51R2 = 0.9998
Observation databefore Mar. 2008
Figure 4.12 Examination of Auto Observation Result with Manual Observation
Data (WT-6)
(5) Monitoring Site WT-7
Figure 4.13 shows the original monitoring data obtained from automatic recording logs of the
monitoring well WT-7. Groundwater level in monitoring well site WT-7 is sometimes above
ground surface. This is generally considered as an abnormal value. However, a photo in Figure
4.14 shows that the groundwater level was about 10 cm above the ground surface of the cabin,
when the well site was checked in September 2009 during this survey. In addition, the remains of
mud in the lower part of the well pipe indicate that the groundwater level had been as high as 20
cm above ground surface. Therefore, the data might be considered to have recorded the
groundwater fluctuation of site WT-7 correctly. The figure shows a relatively regular groundwater
level fluctuation pattern, except some obviously erroneous data.

The Preparatory Study on The Siem Reap Water Supply Expansion Project
Final Report 4-12
-25
0
25
50
75
100
125 Jul-
03
Sep-
03
Nov-03
Jan-04
Mar-
04
May-04
Jul-
04
Aug-04
Oct-
04
Dec-04
Feb-
05
Apr-
05
Jun-05
Aug-05
Oct-
05
Dec-05
Feb-
06
Apr-
06
Jun-06
Aug-06
Oct-
06
Dec-06
Feb-
07
Apr-
07
Jun-07
Aug-07
Oct-
07
Dec-07
Feb-
08
Apr-
08
Jun-08
Aug-08
Oct-
08
Dec-08
Feb-
09
Apr-
09
Jun-09
Gro
undw
ater
Lev
el in
WT_
7(c
m fr
om g
roun
d su
rface
)
Figure 4.13 Observation Result of Groundwater Level Fluctuation (WT-7)
The above graph shows the original data from monitoring site of WT-7. As erroneous data has been found in the original data, it is indispensible to inspect the data before using. The inspection results are given in Table 4.8.
Figure 4.14 Photograph of the Observation Cabin of Monitoring Site WT-7
(September 11, 2009)
A high correlation can be seen in Figure 4.15 between the two data sets over whole corresponding
observation period from March 2007 to June 2009. Because Figure 4.13 showed the regular
groundwater level fluctuation in this site, all of the results of groundwater level observation in
monitoring well WT-7 can be considered as available for groundwater analysis from 2003 to
2009.

The Preparatory Study on The Siem Reap Water Supply Expansion Project
Final Report 4-13
y = 1.0203x + 11.05R2 = 0.9927
-20
0
20
40
60
80
100
120
140
-20 0 20 40 60 80 100 120
Auto Observation Result (WL:cm)
Man
ual O
bser
vatio
n R
esul
t (W
L:cm
)
Observation databetween March 2007 and June 2009
Figure 4.15 Examination of Auto Observation Result with Manual Observation
Data (WT-7)
(6) Monitoring Site WT-8
Figure 4.16 shows the original monitoring data obtained from automatic recording logs of the
monitoring well WT-8. Automatic observation equipment was installed in this site in 2003.
However, the equipment was lost within a year of installation. Therefore, only 5 months of data
for the well is available from August, 2003 to January, 2004.
0
50
100
150
200
250
300
Aug-03 Sep-03 Oct-03 Nov-03 Dec-03 Jan-04
Gro
undw
ater
Lev
el in
WT_
8,(c
m fr
om g
roun
d su
rface
)
Figure 4.16 Observation Result of Groundwater Level Fluctuation (WT-8)
The above graph shows the original data from monitoring site of WT-8. As erroneous data has been found in the original data, it is indispensible to inspect the data before using. The inspection results are given in Table 4.8.
(7) Groundwater and Land Displacement Monitoring Site LTa
Monitoring site LTa is not only for groundwater level observation, but also for observation of land
subsidence. Two observation wells were constructed in the same site, for observation of water
levels and land displacements in the shallow aquifer and the deep aquifer, respectively.
Figure 4.17 shows the original monitoring data of groundwater levels for the deep and shallow

The Preparatory Study on The Siem Reap Water Supply Expansion Project
Final Report 4-14
aquifers in the site of LTa.
-100
0
100
200
300
400
500
600
700 Jun-03A
ug-03O
ct-03D
ec-03Feb-04A
pr-04Jun-04A
ug-04O
ct-04D
ec-04Feb-05A
pr-05Jun-05A
ug-05O
ct-05D
ec-05Feb-06A
pr-06Jun-06A
ug-06O
ct-06D
ec-06Feb-07A
pr-07Jun-07A
ug-07O
ct-07D
ec-07Feb-08A
pr-08Jun-08Jul-08S
ep-08N
ov-08Jan-09M
ar-09M
ay-09Jul-09
Gro
undw
ater
Lev
el in
WT_
LTa
(cm
from
gro
und
surfa
ce)
WL1(cm) WL2(cm)
Figure 4.17 Observation Result of Groundwater Level Fluctuation (LTa)
The above graph shows the original data from monitoring site of LTa. As erroneous data has been found in the original data, it is indispensible to inspect the data before using. The inspection results are given in Table 4.8.
In the first 3 years, from August 2003 to August 2006, the result can be considered as properly
taken to clearly show the difference of groundwater fluctuation between the shallow and deep
aquifers. However, the result became confused from August 2006 to September 2008, including a
period of missing data of about 1 year. After the missing data period, the observation was restarted
from September 2008, but the fluctuation pattern of the shallow aquifer and deep aquifer becomes
exactly opposite, showing the problem of contrary connection of sensors and data logs.
100
150
200
250
300
350
400
450
500
Feb-07
Apr-07
Jun-07
Aug-07
Oct-07
Dec-07
Feb-08
Apr-08
Jun-08
Aug-08
Sep-08
Nov-08
Jan-09
Mar-09
May-09
Jul-09
Man
ual O
bser
vatio
n R
esul
t (W
T:cm
)
LTa_1D
LTa_2S
Figure 4.18 Manual Observation Result in Monitoring Site (LTa)
An attempt was made to check the automatic observation results using the manual observation
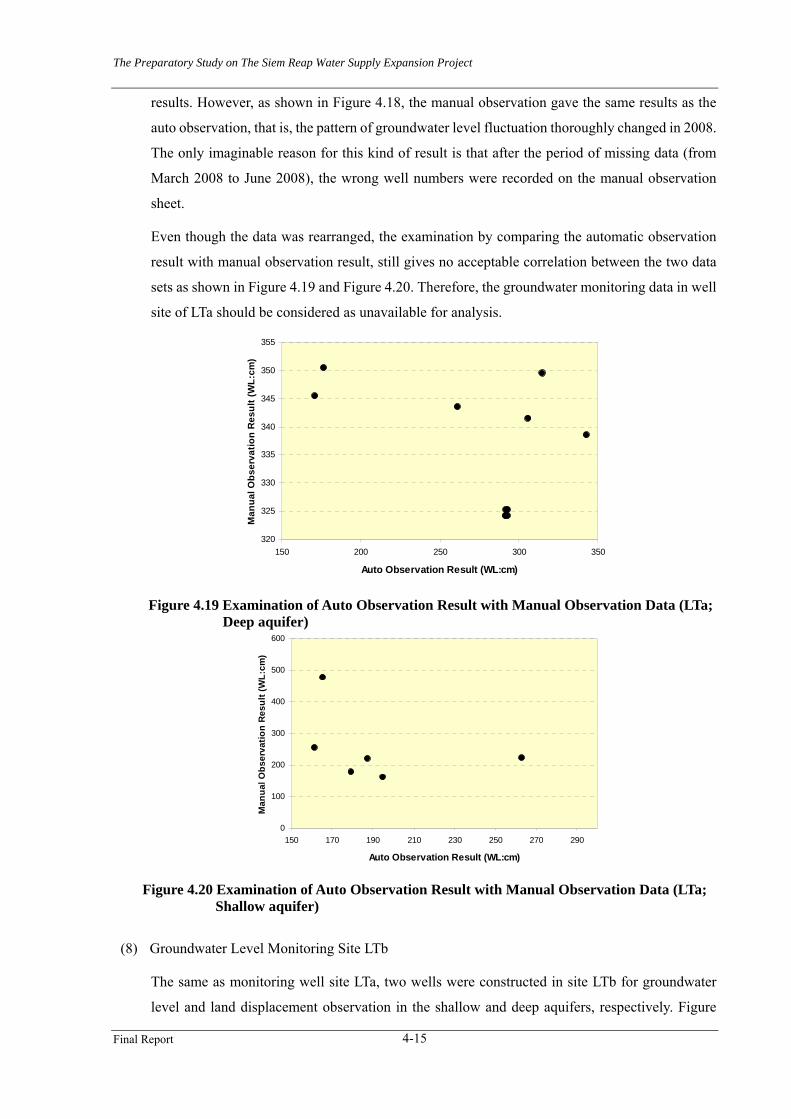
The Preparatory Study on The Siem Reap Water Supply Expansion Project
Final Report 4-15
results. However, as shown in Figure 4.18, the manual observation gave the same results as the
auto observation, that is, the pattern of groundwater level fluctuation thoroughly changed in 2008.
The only imaginable reason for this kind of result is that after the period of missing data (from
March 2008 to June 2008), the wrong well numbers were recorded on the manual observation
sheet.
Even though the data was rearranged, the examination by comparing the automatic observation
result with manual observation result, still gives no acceptable correlation between the two data
sets as shown in Figure 4.19 and Figure 4.20. Therefore, the groundwater monitoring data in well
site of LTa should be considered as unavailable for analysis.
320
325
330
335
340
345
350
355
150 200 250 300 350
Auto Observation Result (WL:cm)
Man
ual O
bser
vatio
n R
esul
t (W
L:cm
)
Figure 4.19 Examination of Auto Observation Result with Manual Observation Data (LTa; Deep aquifer)
0
100
200
300
400
500
600
150 170 190 210 230 250 270 290
Auto Observation Result (WL:cm)
Man
ual O
bser
vatio
n R
esul
t (W
L:cm
)
Figure 4.20 Examination of Auto Observation Result with Manual Observation Data (LTa; Shallow aquifer)
(8) Groundwater Level Monitoring Site LTb
The same as monitoring well site LTa, two wells were constructed in site LTb for groundwater
level and land displacement observation in the shallow and deep aquifers, respectively. Figure

The Preparatory Study on The Siem Reap Water Supply Expansion Project
Final Report 4-16
4.21 shows the original monitoring data of groundwater levels for the deep and shallow aquifers
in the site.
As mentioned above, in another land displacement observation well LTa, the groundwater level
result includes too much error that makes the water level observation result difficult for
groundwater analysis. In contrast, the groundwater level observation result in site LTb shows high
regular fluctuation patterns for both the shallow and deep aquifers.
Relatively high correlations can also be found from Figure 4.22 and Figure 4.23 for confirmation
of reliability of the groundwater level observation results in the two aquifers. Even though the
manual observation duration is from March 2007 to March 2009, all data in this site of LTb can be
considered as reliable for groundwater analysis because of the high regular fluctuation patterns in
both shallow well and deep well.
0
100
200
300
400
500
600 Jun-03A
ug-03O
ct-03D
ec-03Feb-04A
pr-04Jun-04A
ug-04O
ct-04D
ec-04Feb-05A
pr-05Jun-05A
ug-05O
ct-05D
ec-05Feb-06A
pr-06Jun-06A
ug-06O
ct-06D
ec-06Feb-07A
pr-07Jun-07A
ug-07O
ct-07D
ec-07Feb-08A
pr-08Jun-08Jul-08Sep-08N
ov-08Jan-09M
ar-09M
ay-09Jul-09
Gro
undw
ater
Lev
el in
LTb
(cm
from
gro
und
surf
ace)
WL for deep aquiferWL for shallow aquifer
Figure 4.21 Observation Result of Groundwater Level Fluctuation (LTb)
The above graph shows the original data from monitoring site of LTb. As erroneous data has been found in the original data, it is indispensible to inspect the data before using. The inspection results are given in Table 4.8.
The only reliable groundwater level observation results for both the shallow and deep aquifers in
the same site released very important information in the Siem Reap area. The following
conclusions can be reached from the examination of groundwater fluctuations results shown in
Figure 4.21.
1) Groundwater level fluctuation pattern:
Both the deep aquifer and the shallow aquifer have a similar groundwater level fluctuation
The Preparatory Study on The Siem Reap Water Supply Expansion Project
Final Report 4-17
pattern. Groundwater level goes up in the rainy season, and down in the dry season, indicating
the groundwater recharges for both aquifers are based on alternation of seasons. In the rainy
season the recharge amount is more than consumption, and vice versa.
2) The water level difference between the two aquifers
Both the shallow aquifer and the deep aquifer have similar level fluctuation pattern, as
mentioned above. However, values of groundwater level in the two aquifers are different almost
throughout the whole observation period. A very clear fact is that, compared to the deep aquifer,
the water level in the shallow aquifer is higher in the rainy season, but lower in the dry season.
It is supposed that everyone has some common sense about water flow. Water flows from a
higher to a lower place. This common sense is also the cardinal rule of groundwater flow. In a
stricter sense of groundwater flow mechanism, groundwater flows from areas of high energy to
areas of low energy. The energy here is the sum of potential energy and kinetic energy. In the
natural condition in Siem Reap, the groundwater flows at a negligibly slow speed. Therefore,
the groundwater flow can be considered as mostly controlled by potential energy, that is, by
groundwater level. Hence, if the groundwater flows between the shallow aquifer and deep
aquifer, the groundwater flow direction will change as:
• Flowing downward from the shallow aquifer to the deep aquifer in the rainy season,
and
• Flowing upward from the deep aquifer to the shallow aquifer in the dry season.
The real groundwater flow direction is not only controlled by water level, but also depends on
the aquifer structure or permeability. Even though the obvious water level difference has been
shown in Figure 4.21 between shallow aquifer and deep aquifer, the flow amount may be so
small that almost no flow happens, if the permeability between the two aquifers is small enough.
3) The water level fluctuation range:
The water level fluctuation range in a deep aquifer is much smaller than that in a shallow aquifer.
As it is well known that in a sealed container full of water, water pressure is momentarily
transmitted completely and evenly throughout the container. On the other hand, both shallow
aquifer and deep aquifer are recharged by precipitation as mentioned above. In the rainy season,
the shallow aquifer can directly get recharge from precipitation and then the water level goes up.
If the water level in deep aquifer depends on the shallow aquifer directly above it, immediately
or within very short time the ground water level in deep aquifer should equal or nearly equal to
the water level in shallow aquifer.
However, as shown in Figure 4.21, over almost the whole observation period, the water level in
the deep aquifer is different from that in the shallow aquifer. And the water level in deep aquifer
can never get to the peaks and/or dips in the shallow aquifer. This fact indicates the shallow
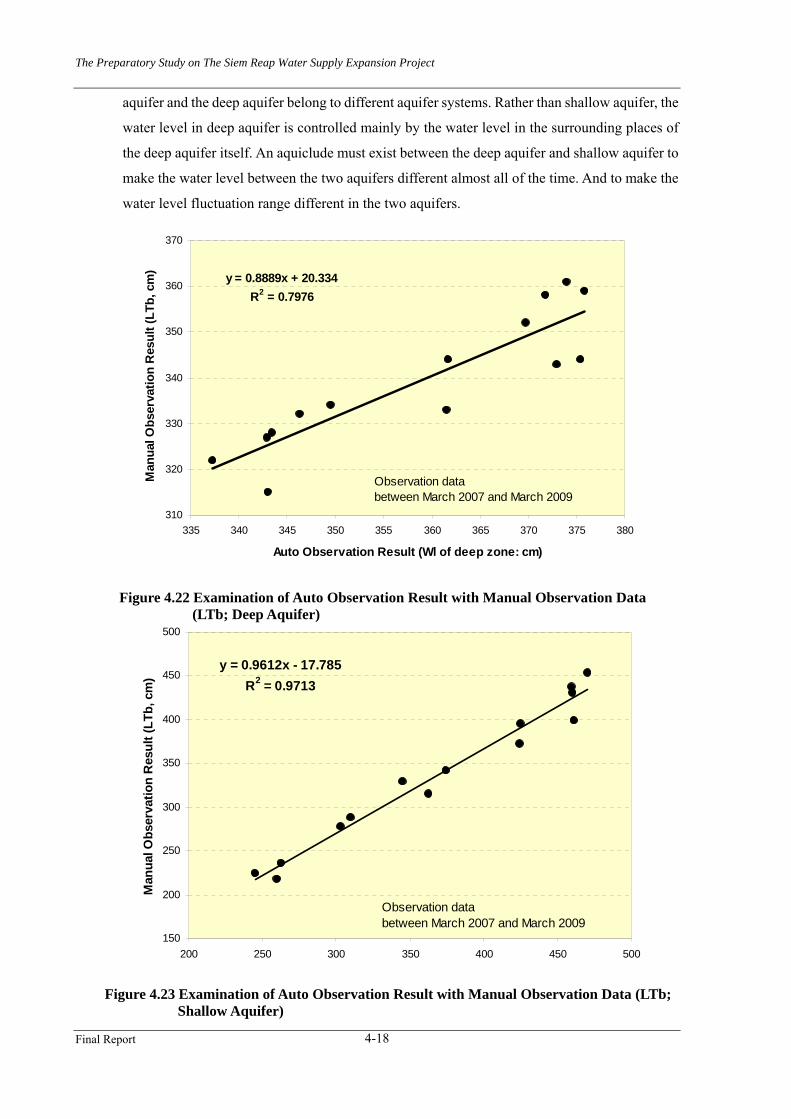
The Preparatory Study on The Siem Reap Water Supply Expansion Project
Final Report 4-18
aquifer and the deep aquifer belong to different aquifer systems. Rather than shallow aquifer, the
water level in deep aquifer is controlled mainly by the water level in the surrounding places of
the deep aquifer itself. An aquiclude must exist between the deep aquifer and shallow aquifer to
make the water level between the two aquifers different almost all of the time. And to make the
water level fluctuation range different in the two aquifers.
y = 0.8889x + 20.334R2 = 0.7976
310
320
330
340
350
360
370
335 340 345 350 355 360 365 370 375 380
Auto Observation Result (Wl of deep zone: cm)
Man
ual O
bser
vatio
n R
esul
t (LT
b, c
m)
Observation databetween March 2007 and March 2009
Figure 4.22 Examination of Auto Observation Result with Manual Observation Data (LTb; Deep Aquifer)
y = 0.9612x - 17.785R2 = 0.9713
150
200
250
300
350
400
450
500
200 250 300 350 400 450 500
Man
ual O
bser
vatio
n R
esul
t (LT
b, c
m)
Observation databetween March 2007 and March 2009
Figure 4.23 Examination of Auto Observation Result with Manual Observation Data (LTb; Shallow Aquifer)

The Preparatory Study on The Siem Reap Water Supply Expansion Project
Final Report 4-19
4-4-3 Result of Land Displacement Monitoring
(1) Result of Land Displacement Observation in Site of LTa
Figure 4.24 shows the original monitoring results of land displacement for deep and shallow
aquifers of the monitoring site LTa. Except the obvious error observation data from November
2006 to July 2008, the observation results show the following points:
1) Land displacement has been observed in both the deep aquifer and the shallow aquifer.
2) The patterns of land displacement fluctuations in both aquifers are almost the same.
3) The land displacement fluctuation coincides with groundwater level fluctuation, changes
according to the alternation of seasons.
0
10
20
30
40
50
60
Jun-03
Sep-03
Dec-03
Mar-04
Jun-04
Sep-04
Dec-04
Mar-05
Jun-05
Sep-05
Dec-05
Mar-06
Jun-06
Sep-06
Dec-06
Mar-07
Jun-07
Sep-07
Dec-07
Mar-08
Jun-08
Aug-08
Nov-08
Feb-09
May-09
Aug-09
Dis
plac
emen
t of O
bser
vatio
n Zo
ne (L
Ta)
Deep Zone (mm)Shallow Zone (mm)
Figure 4.24 Land Displacement Observation Result in LTa
To confirm the tendency of land displacement within the circulations of seasonal fluctuation, the
monthly average displacement value was calculated and shown in Table 4.4 and Table 4.5 for the
deep aquifer and the shallow aquifer, respectively.
The observation of land displacement in the deep aquifer was started from August 2003 and
continued for about 6 years up to May 2009, when the groundwater analysis began in this survey.
However, as shown in Table 4.4, total length of missing data is as long as about 23 months, about
1/3 of the whole observation period. Examination by the available data results in a maximum
displacement range of - 18.96 17.06 = 1.9 (mm) for the deep aquifer (with depth of 71.9 m from
ground surface).

The Preparatory Study on The Siem Reap Water Supply Expansion Project
Final Report 4-20
Table 4.4 Monthly Summarizing Result of Measured Values in Land Displacement Measurement Gauge in Deep Aquifer of LTa
(mm) Month 2003 2004 2005 2006 2007 2008 2009 Max. Min. Avrg,Jan. -- 18.21 18.12 18.20 -- -- 18.03 18.21 18.03 18.15Feb. -- 17.99 17.88 17.98 -- -- 17.76 17.99 17.76 17.92Mar. -- 17.76 17.64 17.80 -- -- 17.57 17.80 17.57 17.71Apr. -- 17.50 17.30 17.72 -- -- -- 17.72 17.30 17.56May -- 17.24 17.06 17.61 -- -- 17.33 17.61 17.06 17.37Jun. -- 18.07 17.09 17.59 -- -- 17.37 18.07 17.09 17.64Jul. -- 18.55 17.06 17.77 -- -- -- 18.55 17.06 17.98Aug. 18.14 18.87 17.11 18.01 -- -- -- 18.87 17.11 18.20Sep. 18.26 18.96 17.82 18.21 -- -- -- 18.96 17.82 18.44Oct. 18.49 18.91 18.59 18.67 -- 18.21 -- 18.91 18.21 18.63Nov. 18.60 18.64 18.71 18.60 -- 18.52 -- 18.71 18.52 18.63Dec. 18.42 18.38 18.47 -- -- 18.27 -- 18.47 18.27 18.40Max. 18.60 18.96 18.71 18.67 18.52 18.03 18.96Min. 18.14 17.24 17.06 17.59 18.21 17.33 17.06Avrg, 18.38 18.26 17.74 18.01 18.33 17.61 18.02
(Note) This measured value does not directly indicate land displacement value but only scale value from criteria.
For the shallow aquifer in the same site of LTa, the observation period and length of missing data
are the same as for the deep aquifer. Based on the available data, the maximum land displacement
in the shallo -w aquifer is 16.31 13.86 = 2.45(mm) as shown in Table 4.5.
Table 4.5 Monthly Summarizing Result of Measured Values in Land Displacement Measurement Gauge in Shallow Aquifer of LTa
(mm) Month 2003 2004 2005 2006 2007 2008 2009 Max. Min. Avrg,Jan. -- 15.59 15.47 15.56 -- -- 15.37 15.59 15.37 15.52Feb. -- 15.31 15.24 15.36 -- -- 15.20 15.36 15.20 15.29Mar. -- 15.00 14.85 15.22 -- -- 15.00 15.22 14.85 15.06Apr. -- 14.63 14.24 15.11 -- -- -- 15.11 14.24 14.77May -- 14.30 13.86 14.96 -- -- 14.69 14.96 13.86 14.55Jun. -- 15.37 14.07 14.93 -- -- 14.72 15.37 14.07 14.89Jul. -- 15.89 14.04 15.16 -- -- -- 15.89 14.04 15.25Aug. 15.69 16.20 14.01 15.43 -- -- -- 16.20 14.01 15.51Sep. 15.76 16.31 14.96 15.65 -- -- -- 16.31 14.96 15.80Oct. 15.96 16.26 15.89 16.09 -- 15.64 -- 16.26 15.64 16.02Nov. 15.99 16.00 16.03 16.02 -- 15.88 -- 16.03 15.88 15.99Dec. 15.78 15.72 15.78 -- -- 15.60 -- 15.78 15.60 15.73Max. 15.99 16.31 16.03 16.09 -- 15.88 15.37 16.31Min. 15.69 14.30 13.86 14.93 -- 15.60 14.69 13.86Avrg, 15.84 15.53 14.79 15.41 -- 15.76 15.00 15.33
(Note) This measured value does not directly indicate land displacement value but only scale value from criteria.
When the two Tables, Table 4.4 and Table 4.5, are compared, the result seems abnormal. In cases
where land displacement is observed in both the shallow and the deep aquifer in the same location,
the land displacement in the deep aquifer can be calculated by the following equation:
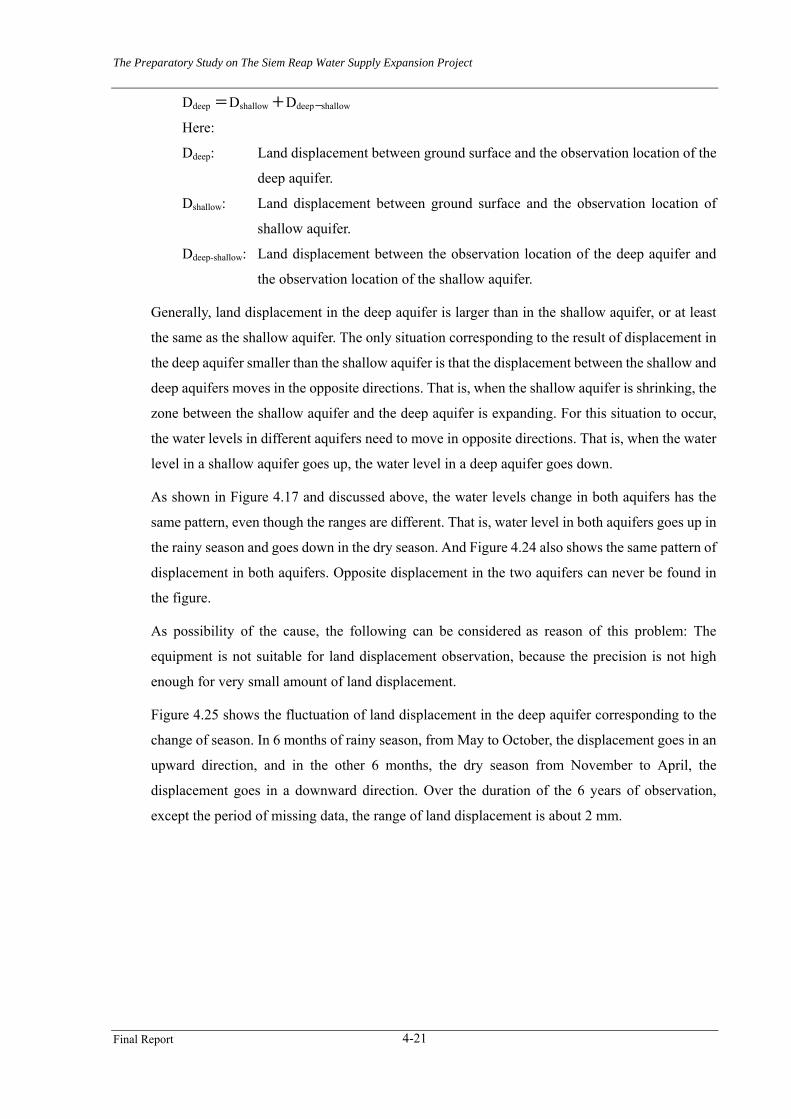
The Preparatory Study on The Siem Reap Water Supply Expansion Project
Final Report 4-21
Ddeep = Dshallow + D -deep shallow
Here:
Ddeep: Land displacement between ground surface and the observation location of the
deep aquifer.
Dshallow: Land displacement between ground surface and the observation location of
shallow aquifer.
Ddeep-shallow: Land displacement between the observation location of the deep aquifer and
the observation location of the shallow aquifer.
Generally, land displacement in the deep aquifer is larger than in the shallow aquifer, or at least
the same as the shallow aquifer. The only situation corresponding to the result of displacement in
the deep aquifer smaller than the shallow aquifer is that the displacement between the shallow and
deep aquifers moves in the opposite directions. That is, when the shallow aquifer is shrinking, the
zone between the shallow aquifer and the deep aquifer is expanding. For this situation to occur,
the water levels in different aquifers need to move in opposite directions. That is, when the water
level in a shallow aquifer goes up, the water level in a deep aquifer goes down.
As shown in Figure 4.17 and discussed above, the water levels change in both aquifers has the
same pattern, even though the ranges are different. That is, water level in both aquifers goes up in
the rainy season and goes down in the dry season. And Figure 4.24 also shows the same pattern of
displacement in both aquifers. Opposite displacement in the two aquifers can never be found in
the figure.
As possibility of the cause, the following can be considered as reason of this problem: The
equipment is not suitable for land displacement observation, because the precision is not high
enough for very small amount of land displacement.
Figure 4.25 shows the fluctuation of land displacement in the deep aquifer corresponding to the
change of season. In 6 months of rainy season, from May to October, the displacement goes in an
upward direction, and in the other 6 months, the dry season from November to April, the
displacement goes in a downward direction. Over the duration of the 6 years of observation,
except the period of missing data, the range of land displacement is about 2 mm.

The Preparatory Study on The Siem Reap Water Supply Expansion Project
Final Report 4-22
16.00
16.50
17.00
17.50
18.00
18.50
19.00
19.50
Jan. Feb. Mar. Apr. May Jun. Jul. Aug. Sep. Oct. Nov. Dec.
Land
Dis
plac
emen
t (LT
a D
eep:
mm
)
Max. Min.Avrg,
Figure 4.25 Monthly Fluctuation of Land Displacement in Deep Aquifer of LTa
Figure 4.26 shows the patterns of land displacement in the shallow aquifer. Like the deep aquifer,
land displacement in the shallow aquifer fluctuates following the alternation of seasons. Over the
duration of the 6 years of observation, except the period of missing data, the range of land
displacement is about 2.5 mm.
12.50
13.00
13.50
14.00
14.50
15.00
15.50
16.00
16.50
Jan. Feb. Mar. Apr. May Jun. Jul. Aug. Sep. Oct. Nov. Dec.
Land
Dis
plac
emen
t (LT
a Sh
allo
w: m
m)
Max. Min.Avrg,
Figure 4.26 Monthly Fluctuation of Land Displacement in Shallow Aquifer of LTa
Figure 4.27 shows high coincidences of land displacement fluctuation in the shallow aquifer of
LTa, with fluctuations of groundwater level and precipitation.
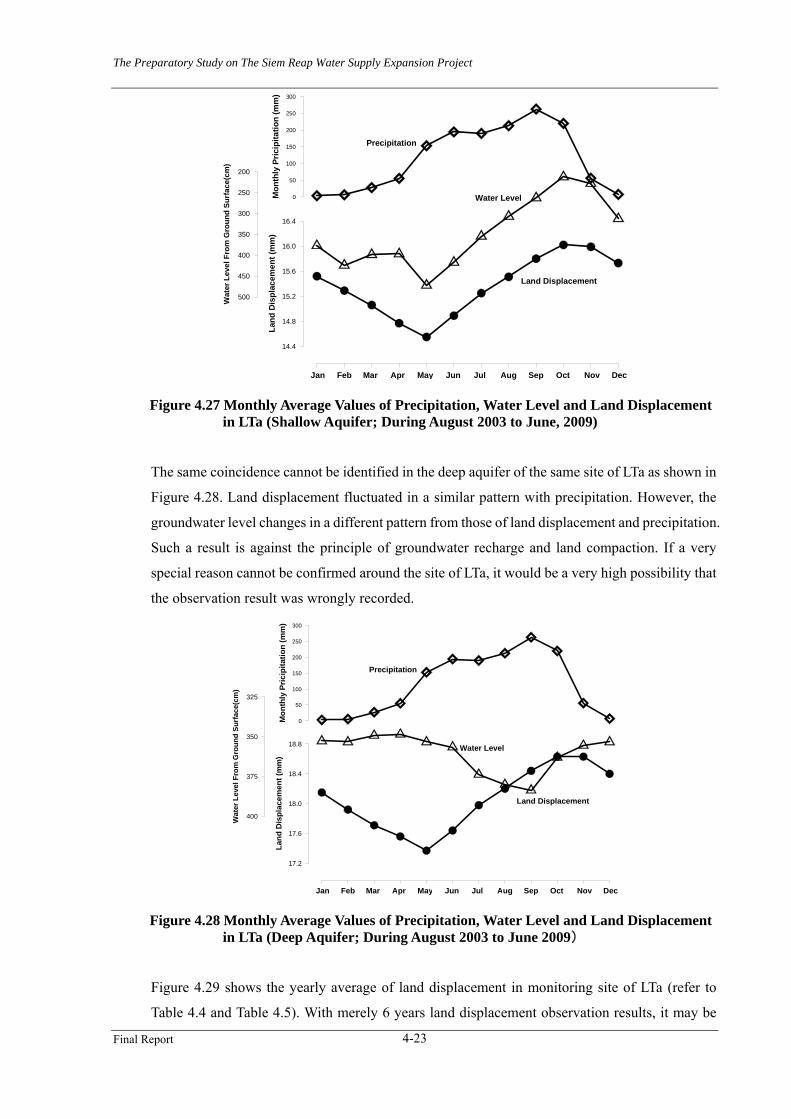
The Preparatory Study on The Siem Reap Water Supply Expansion Project
Final Report 4-23
0
50
100
150
200
250
300
Mon
thly
Pric
ipita
tion
(mm
)
500
450
400
350
300
250
200
Wat
er L
evel
Fro
m G
roun
d Su
rfac
e(cm
)
14.4
14.8
15.2
15.6
16.0
16.4
Land
Dis
plac
emen
t (m
m)
Jan Feb Mar Apr May Jun Jul Aug Sep Oct Nov Dec
Precipitation
Water Level
Land Displacement
Figure 4.27 Monthly Average Values of Precipitation, Water Level and Land Displacement in LTa (Shallow Aquifer; During August 2003 to June, 2009)
The same coincidence cannot be identified in the deep aquifer of the same site of LTa as shown in
Figure 4.28. Land displacement fluctuated in a similar pattern with precipitation. However, the
groundwater level changes in a different pattern from those of land displacement and precipitation.
Such a result is against the principle of groundwater recharge and land compaction. If a very
special reason cannot be confirmed around the site of LTa, it would be a very high possibility that
the observation result was wrongly recorded.
0
50
100
150
200
250
300
Mon
thly
Pric
ipita
tion
(mm
)
400
375
350
325
Wat
er L
evel
Fro
m G
roun
d Su
rfac
e(cm
)
17.2
17.6
18.0
18.4
18.8
Land
Dis
plac
emen
t (m
m)
Jan Feb Mar Apr May Jun Jul Aug Sep Oct Nov Dec
Precipitation
Water Level
Land Displacement
Figure 4.28 Monthly Average Values of Precipitation, Water Level and Land Displacement in LTa (Deep Aquifer; During August 200 )3 to June 2009
Figure 4.29 shows the yearly average of land displacement in monitoring site of LTa (refer to
Table 4.4 and Table 4.5). With merely 6 years land displacement observation results, it may be

The Preparatory Study on The Siem Reap Water Supply Expansion Project
Final Report 4-24
hard to conclude that land subsidence has really occurred, even though some signs of land
subsidence can be found from these figures.
-0.5
0
0.5
1
1.52002 2003 2004 2005 2006 2007 2008 2009 2010
Year
Gro
ung
disp
lace
men
t (LT
a:m
m)
Deep zone (72m)
Shallow zone (35m)
Initial point of thedisplacement observation
Figure 4.29 Yearly Average of Land Displacement in LTa and Result of Land Displacement Observation in LTb
Figure 4.30 shows the original monitoring results of land displacement for the deep and shallow
aquifers of the monitoring site LTb. The land displacement observation in LTb started from July
2003. 6 years observation data has been collected up to July 2009. As shown in the figure, the land
displacement can be considered as properly observed except some observation error and 6 months
missing data from March to September in 2008.

The Preparatory Study on The Siem Reap Water Supply Expansion Project
Final Report 4-25
25
30
35
40
45
50
May-03
Aug-03
Nov-03
Feb-04
May-04
Aug-04
Oct-04
Jan-05
Apr-05
Jul-05
Oct-05
Jan-06
Apr-06
Jul-06
Oct-06
Jan-07
Apr-07
Jul-07
Oct-07
Jan-08
Apr-08
Jul-08
Oct-08
Jan-09
Apr-09
Jul-09
Dis
plac
emen
t of O
bser
vatio
n Zo
ne (L
Tb)
Deep Zone (mm)Shallow Zone (mm)
Figure 4.30 Land Displacement Observation Result in LTb
Similar to seasonal fluctuation of groundwater level, the figure shows clearly seasonal fluctuation
of land displacement for both the shallow and deep aquifers. Land displacement goes up in the
rainy season and down in the dry season.
The same as the analysis processing of LTa, monthly average of land displacement in the deep and
shallow aquifers are calculated and shown in Table 4.6 and Table 4.7, respectively.
Maximum and minimum values of each year indicate similar seasonal fluctuation ranges for both
the shallow and deep aquifers to be as about 1 mm. Over the duration of the 6 years observation
from 2003 to 2009, yearly average values indicate that land displacement changes from 32.83 to
31.71 mm (deep aquifer) and 31.61 to 27.82 (shallow aquifer), respectively. Because the
observation result of the last year (2009) does not include the value of the rainy season, the change
of land elevation should be smaller than 1.12 mm (32.83 - 31.71) for the deep aquifer and 3.79
mm (31.61 - 27.82) for the shallow aquifer.

The Preparatory Study on The Siem Reap Water Supply Expansion Project
Final Report 4-26
Table 4.6 Monthly Summarizing Result of Measured Values in Land Displacement Measurement Gauge in Deep Aquifer of LTb
(mm) Month 2003 2004 2005 2006 2007 2008 2009 Max. Min. Avrg,Jan. -- 32.71 32.39 32.56 32.62 32.62 31.93 32.71 31.93 32.51Feb. -- 32.45 32.20 32.40 32.37 32.43 31.80 32.45 31.80 32.30Mar. -- 32.09 31.94 32.26 32.16 32.23 31.65 32.26 31.65 32.08Apr. -- 31.79 31.66 32.16 31.97 -- 31.55 32.16 31.55 31.88May -- 31.81 31.47 32.01 32.07 -- 31.62 32.07 31.47 31.84Jun. -- 32.56 31.40 32.08 32.24 -- 31.62 32.56 31.40 32.08Jul. -- 32.99 31.47 32.27 32.45 -- -- 32.99 31.47 32.43Aug. 32.44 33.36 31.69 32.41 32.59 -- -- 33.36 31.69 32.64Sep. 32.70 33.31 32.01 32.71 32.84 -- -- 33.31 32.01 32.81Oct. 33.07 33.06 32.44 33.11 32.97 32.49 -- 33.11 32.44 32.89Nov. 32.99 32.84 32.68 33.00 32.91 32.28 -- 33.00 32.28 32.81Dec. 32.97 32.59 32.66 32.83 32.80 32.09 -- 32.97 32.09 32.70Max. 33.07 33.36 32.68 33.11 32.97 32.62 31.93 33.36Min. 32.44 31.79 31.40 32.01 31.97 32.09 31.55 31.40Avrg, 32.83 32.62 32.01 32.49 32.49 32.36 31.71 32.37
(Note) This measured value does not directly indicate land displacement value but only scale value from criteria.
Table 4.7 Monthly Summarizing Result of Measured Values in Land Displacement
Measurement Gauge in Shallow Aquifer of LTb (mm)
Month 2003 2004 2005 2006 2007 2008 2009 Max. Min. Avrg,Jan. -- 31.37 30.57 30.62 30.23 29.53 28.35 31.37 28.35 30.29Feb. -- 31.10 30.32 30.39 30.09 29.31 28.02 31.10 28.02 30.05Mar. -- 30.67 30.04 30.30 29.94 29.11 27.76 30.67 27.76 29.78Apr. -- 30.30 29.77 30.20 30.01 -- 27.59 30.30 27.59 29.70May -- 30.37 29.57 29.98 29.96 -- 27.64 30.37 27.64 29.65Jun. -- 31.22 29.52 30.10 29.89 -- 27.58 31.22 27.58 29.92Jul. -- 31.56 29.71 30.32 29.85 -- -- 31.56 29.71 30.60Aug. 31.47 31.75 30.00 30.39 29.86 -- -- 31.75 29.86 30.87Sep. 31.67 31.52 30.33 30.59 29.99 -- -- 31.67 29.99 30.96Oct. 31.89 31.22 30.67 30.77 30.01 28.88 -- 31.89 28.88 30.76Nov. 31.29 30.95 30.84 30.51 29.98 28.75 -- 31.29 28.75 30.52Dec. 31.66 30.74 30.82 30.34 29.67 28.39 -- 31.66 28.39 30.47Max. 31.89 31.75 30.84 30.77 30.23 29.53 28.35 31.89Min. 31.29 30.30 29.52 29.98 29.67 28.39 27.58 27.58Avrg, 31.60 31.06 30.18 30.38 29.96 29.00 27.82 30.12
(Note) This measured value does not directly indicate land displacement value but only scale value from criteria.
Figure 4.31 and Figure 4.32 show the patterns of land displacement of monitoring site LTb in the
deep and shallow aquifers, respectively. Land displacement fluctuates following the alternation of
seasons. The lowest monthly average elevation appears in May, the end of the dry season, and the
highest elevation in October, the end of the rainy season.

The Preparatory Study on The Siem Reap Water Supply Expansion Project
Final Report 4-27
30.00
30.50
31.00
31.50
32.00
32.50
33.00
33.50
34.00
Jan. Feb. Mar. Apr. May Jun. Jul. Aug. Sep. Oct. Nov. Dec.
Land
Dis
plac
emen
t (LT
b D
eep:
mm
)
Max. Min.Avrg,
Figure 4.31 Monthly Fluctuation of Land Displacement in the Deep Aquifer of LTb
25.00
26.00
27.00
28.00
29.00
30.00
31.00
32.00
33.00
Jan. Feb. Mar. Apr. May Jun. Jul. Aug. Sep. Oct. Nov. Dec.
Land
Dis
plac
emen
t (LT
b Sh
allo
w: m
m)
Max. Min.Avrg,
Figure 4.32 Monthly Fluctuation of Land Displacement in the Shallow Aquifer of LTb
Figure 4.33 and Figure 4.34 show the patterns of land displacement together with concerned
factors of groundwater level and precipitation, for the deep and shallow aquifers, respectively.
Generally, both groundwater level and land displacement goes up according to precipitation
increasing in the rainy season, and goes down following precipitation decreasing in the dry season.
However, compared to the change of precipitation, land displacement has more coincidence with
groundwater level.
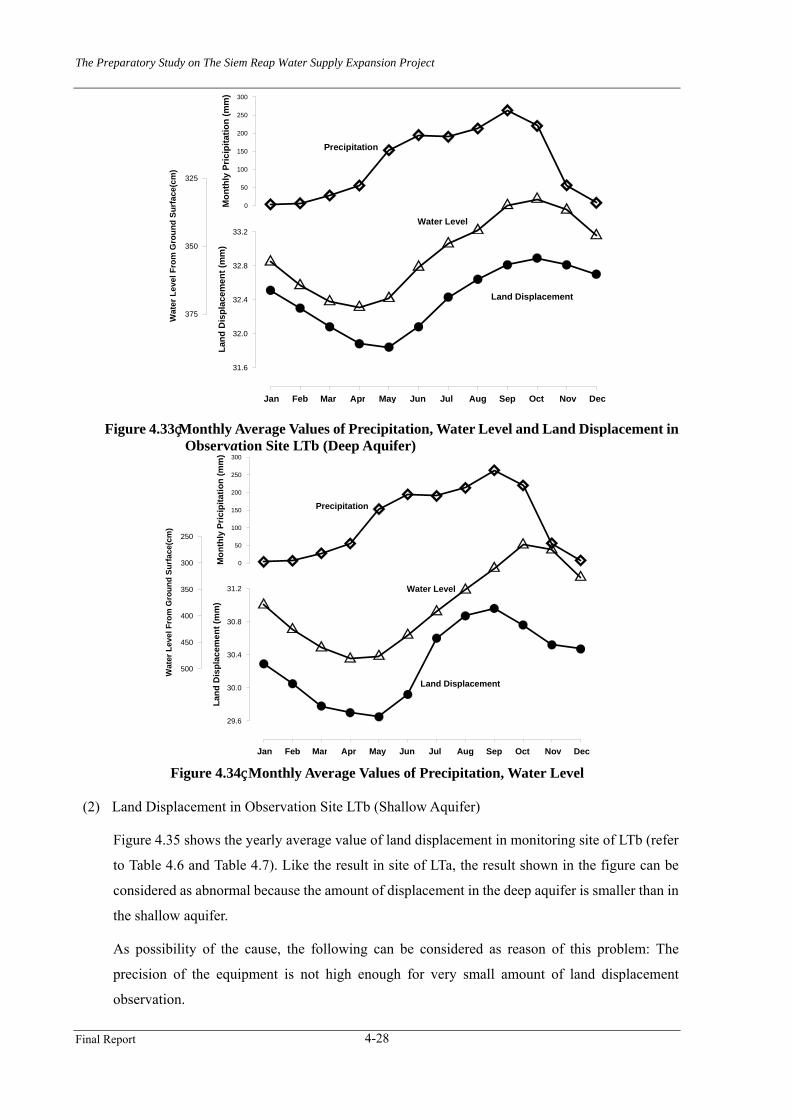
The Preparatory Study on The Siem Reap Water Supply Expansion Project
Final Report 4-28
0
50
100
150
200
250
300
Mon
thly
Pric
ipita
tion
(mm
)
375
350
325W
ater
Lev
el F
rom
Gro
und
Surf
ace(
cm)
31.6
32.0
32.4
32.8
33.2La
nd D
ispl
acem
ent (
mm
)
Jan Feb Mar Apr May Jun Jul Aug Sep Oct Nov Dec
Precipitation
Water Level
Land Displacement
Figure 4.33 Monthly Average Values of Precipitation, Water Level and Land Displacement in Observation Site LTb (Deep Aquifer)
0
50
100
150
200
250
300
Mon
thly
Pric
ipita
tion
(mm
)
500
450
400
350
300
250
Wat
er L
evel
Fro
m G
roun
d Su
rfac
e(cm
)
29.6
30.0
30.4
30.8
31.2
Land
Dis
plac
emen
t (m
m)
Jan Feb Mar Apr May Jun Jul Aug Sep Oct Nov Dec
Precipitation
Water Level
Land Displacement
Figure 4.34 Monthly Average Values of Precipitation, Water Level
(2) Land Displacement in Observation Site LTb (Shallow Aquifer)
Figure 4.35 shows the yearly average value of land displacement in monitoring site of LTb (refer
to Table 4.6 and Table 4.7). Like the result in site of LTa, the result shown in the figure can be
considered as abnormal because the amount of displacement in the deep aquifer is smaller than in
the shallow aquifer.
As possibility of the cause, the following can be considered as reason of this problem: The
precision of the equipment is not high enough for very small amount of land displacement
observation.

The Preparatory Study on The Siem Reap Water Supply Expansion Project
Final Report 4-29
By the reasons of low accuracy of measurement equipment and of no appearance of land
subsidence in artificial concrete building, it is considered that land subsidence does not
obviously occur. However, it will be necessary to continuously monitor the observation data of
land subsidence from now on.
-1
0
1
2
3
4
52002 2003 2004 2005 2006 2007 2008 2009 2010
Year
Gro
und
Dis
palc
emen
t (LT
b:m
m)
Deep Zone (73m)
Shallow zone (40m)
Initial point of thedisplacement observation
Figure 4.35 Yearly Average of Land displacement in LTb
4-5 Groundwater Recharge Analysis
4-5-1 Examination of Data Availability
Daily precipitation data from 5 meteorological observation stations and daily groundwater level
data from 7 monitoring well sites in Siem Reap have been collected. Groundwater level fluctuates
following the alternation of seasons or balance of precipitation and evaporation. Compared to
precipitation, the fluctuation of evaporation is much smaller. Therefore, fluctuation of
groundwater level can be considered as mainly following the fluctuation of precipitation.
As for the recharge of precipitation to groundwater, it is a complicated process involving several
factors. In case of a storm or heavy rain, most, or the majority of precipitation will not percolate
into groundwater, but discharge to rivers, and then drain to Tonle Sap Lake. On the other hand, in
case of low rainfall, again, precipitation cannot recharge groundwater because the rainfall would
be consumed by evaporation before getting into the groundwater table.
The relation between amounts of precipitation and groundwater recharge are controlled by factors
of topography, distance of the rainfall location to the river, geology, soil type, climate
(evaporation and humidity), land use, depth of groundwater level, and so on. To get enough values
of all these parameters in daily units is actually impossible. Therefore, based on experiments in

The Preparatory Study on The Siem Reap Water Supply Expansion Project
Final Report 4-30
different kinds of simplified conditions, a lot of empirical equations have been created and used
for groundwater recharge estimation. As most of the empirical equations are based on a special
condition, that is, to fix almost all other factors and make only one or two factors change, the
precision of the these equations’ application might be a problem, especially under conditions
whereby the factors omitted from the empirical equations actually play a relatively large role in
groundwater recharge in the study area.
Of many methods for groundwater recharge analysis, the tank model can be considered as an
excellent method that was developed by a world famous hydrologist SUGAWARA. The tank
model is a kind of black box model. Although it is almost impossible to make clear values of all
the concerned factors in the unit of day, it is absolutely true that the actual daily groundwater level
change is the comprehensive result of all concerned factors and their daily changes. That is, when
the amounts of precipitation and evaporation are directly linked to the groundwater level
fluctuation by tank model, the recharge and consumption amount of groundwater will be possibly
calculated as the result of comprehensive affection of all the relative factors. Because the relative
factors change form site to site, it is necessary to make different tank models for all available sites
for groundwater recharge and consumption calculations there.
The basic concept of the tank model is shown in Figure 4.36. A water tank is assumed as a
representative of surface water system in an analysis area. All the precipitation in the area will fall
into the tank to cause the water level in the tank to go up.
In case the daily precipitation is relatively small, e.g. less than daily evaporation amount, the
water level increase amount is also small, not over the height of outlet F1, and then no
groundwater recharge occurs. This small precipitation will store in the tank for a short time and
then being consumed by evaporation.
In case of heavy rain, the water level in the tank will go up over the outlet F1 and then the recharge
occurs from precipitation to groundwater. As a result of groundwater recharge, the groundwater
level goes up.
Based on the fact whenever there is heavy rain, there is also discharge to rivers, the outlet F2 is
specified to make the surface water discharge together with groundwater recharge. When there is
a storm, the majority of precipitation discharges to rivers and then drains to Tonle Sap Lake, so
that groundwater level increasing cannot be in proportion to the change in precipitation. This kind
of water discharge and drainage are simulated in the tank model by specification of outlet F3.
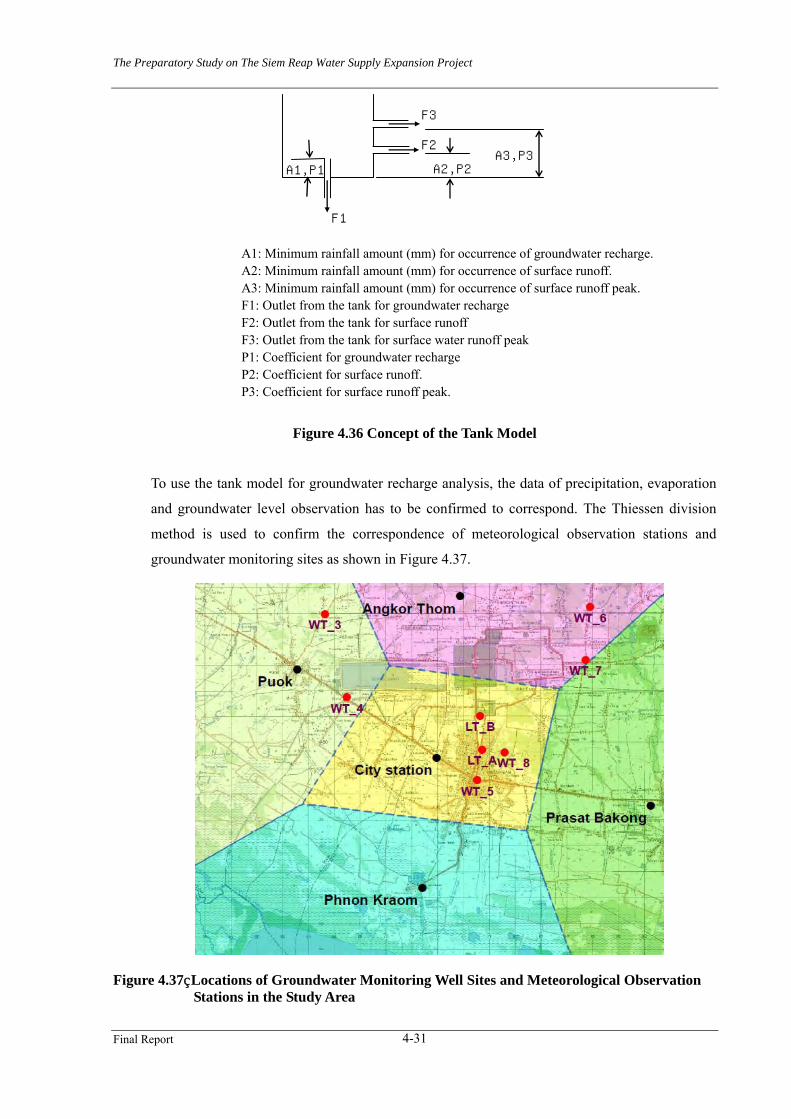
The Preparatory Study on The Siem Reap Water Supply Expansion Project
Final Report 4-31
A1,P1 A2,P2A3,P3
F1
F2
F3
A1: Minimum rainfall amount (mm) for occurrence of groundwater recharge. A2: Minimum rainfall amount (mm) for occurrence of surface runoff. A3: Minimum rainfall amount (mm) for occurrence of surface runoff peak. F1: Outlet from the tank for groundwater recharge F2: Outlet from the tank for surface runoff F3: Outlet from the tank for surface water runoff peak P1: Coefficient for groundwater recharge P2: Coefficient for surface runoff. P3: Coefficient for surface runoff peak.
Figure 4.36 Concept of the Tank Model
To use the tank model for groundwater recharge analysis, the data of precipitation, evaporation
and groundwater level observation has to be confirmed to correspond. The Thiessen division
method is used to confirm the correspondence of meteorological observation stations and
groundwater monitoring sites as shown in Figure 4.37.
Figure 4.37 Locations of Groundwater Monitoring Well Sites and Meteorological Observation Stations in the Study Area

The Preparatory Study on The Siem Reap Water Supply Expansion Project
Final Report 4-32
Not only correspondence of location between meteorological stations and groundwater
monitoring sites, but also a viable duration of data serials has to be confirmed. The data
availability confirmation result is shown in Table 4.8 based on the period of precipitation
observation for each station and analysis of groundwater monitoring result for each site.
Table 4.8 Result of Data Availability Examination for Tank Model Creation
WL_Station W_Duration Rain_Station R_Duration Cal_ DurationWT-3 Aug.03 - Apr.08 Puok Jan.04 - Apr.08WT-4 Mar.07 - Mar.08 Puok Mar.07 - Mar.08 WT-5 Mar.07 - Mar.09 City Jan.88 - Dec.08 May.07 - Dec.08WT-6 Jul.08 - Jun. 09 Angkor Thom Jul.08 - Dec. 08
WT-7 Aug.03 - Jun.09 Angkor ThomPrasat Bakong Sept.03 - Dec.08
WT-8 - City -LTa - City -LTb Sept.03 - Jun.09 City Sept.03 - Dec.08
Mar.03 - Dec.08
Jul.00 - Dec.08
Jan.88 - Dec.08
(Note) WL_Station: Groundwater level monitoring well code. W_Duration: Duration of reliable groundwater level monitoring data for each well inspected by manual
observation result. Rain_Station: Metrological observation station name. R_Duration: Duration of observation for each metrological station. Cal_Duration: Duration while both data of the groundwater monitoring and metrological observation are
available for tank model analysis.
4-5-2 Result of Groundwater Recharge Calculation for Each Monitoring Site
Figure 4.38 to Figure 4.45 show the results of groundwater level simulation by the Tank Model in
all available monitoring well sites given in Table 4.8.
12.0
12.5
13.0
13.5
14.0
14.5
15.0
15.5
16.0
16.5
Jan-03 Jan-04 Jan-05 Jan-06 Jan-07 Jan-08 Jan-09
Gro
undw
ater
Lev
el (W
T3, m
)
Observation ResultCalculation Result
Figure 4.38 Result of Groundwater Level Simulation by Tank Model in Monitoring Site WT-3

The Preparatory Study on The Siem Reap Water Supply Expansion Project
Final Report 4-33
11.6
11.8
12.0
12.2
12.4
12.6
12.8
13.0
13.2
13.4
Jan-07 Mar-07 May-07 Jul-07 Sep-07 Nov-07 Jan-08 Mar-08 May-08
Gro
undw
ater
Lev
el (W
T4: c
m)
Observation ResultCalculated Result
Figure 4.39 Result of Groundwater Level Simulation by Tank Model in Monitoring Site WT-4
8
9
10
11
12
13
14
15
Feb-07 Apr-07 Jun-07 Aug-07 Oct-07 Dec-07 Feb-08 Apr-08 Jun-08 Jul-08 Sep-08 Nov-08 Jan-09 Mar-09
Gro
undw
ater
Lev
el (W
T5: m
)
Figure 4.40 Result of Groundwater Level Simulation by Tank Model in Monitoring Site WT-5

The Preparatory Study on The Siem Reap Water Supply Expansion Project
Final Report 4-34
30.0
30.5
31.0
31.5
32.0
32.5
33.0
May-08 Jun-08 Jul-08 Aug-08 Sep-08 Oct-08 Nov-08 Dec-08 Jan-09
Gro
undw
ater
Lev
el (W
T6: m
)
Observation ResultCalculated Resule
Figure 4.41 Result of Groundwater Level Simulation by Tank Model in Monitoring Site WT-6
The precipitation data at the Meteorological observation station Angkor Thom is 964 mm
(corresponding to a dry year with probability of about 100 return years) in 2006, followed by
fewer amounts of 557 mm (corresponding to a drier year with a probability of over 10,000 return
years) in 2007. It is a very exceptional phenomenon.
Incidentally, precipitation records in 3 neighborhood meteorological observation stations were in
the range of 1,415 mm to 1,640 mm in the year 2006, and 1,356 to 1,615 mm, corresponding to an
ordinary or wet year. There is no doubt that the precipitation differs from station to station,
however, a difference such as that between Angkor Thom and the other stations is inconceivable.
Also, because the distance between the meteorological station of Angkor Thom with other
stations is less than 10 km in a plain area, it is surely impossible to be an extremely dry year while
all the other neighboring stations have wet or ordinary precipitation. Therefore, it is safe to say
that the precipitation data for 2006 and 2007 from the meteorological station of Angkor Thom is
wrong. By the way, if the data were directly used in the tank model for groundwater recharge
calculation the result can not fit the observation result as shown in Figure 4.42.

The Preparatory Study on The Siem Reap Water Supply Expansion Project
Final Report 4-35
Figure 4.42 Result of Groundwater Level Simulation in Monitoring Site WT-7 by Tank Model and Corresponding Precipitation Data of the Meteorological Station Angkor Thom
Figure 4.43 Result of Groundwater Level Simulation in Monitoring Site WT-7 by Tank Model and Corresponding Modified Precipitation of the Meteorological Station Prasat Bakong

The Preparatory Study on The Siem Reap Water Supply Expansion Project
Final Report 4-36
Figure 4.44 Result of Groundwater Level Simulation in Monitoring Site WT-7 by Tank Model and Corresponding Precipitation Data of the Meteorological Station Prasat
Figure 4.45 Result of Groundwater Level Simulation by Tank Model in Monitoring Site LTb
4-5-3 Summary of Groundwater Recharge Calculation
The groundwater recharge calculation results are summarized in Table 4.9 and Table 4.10.
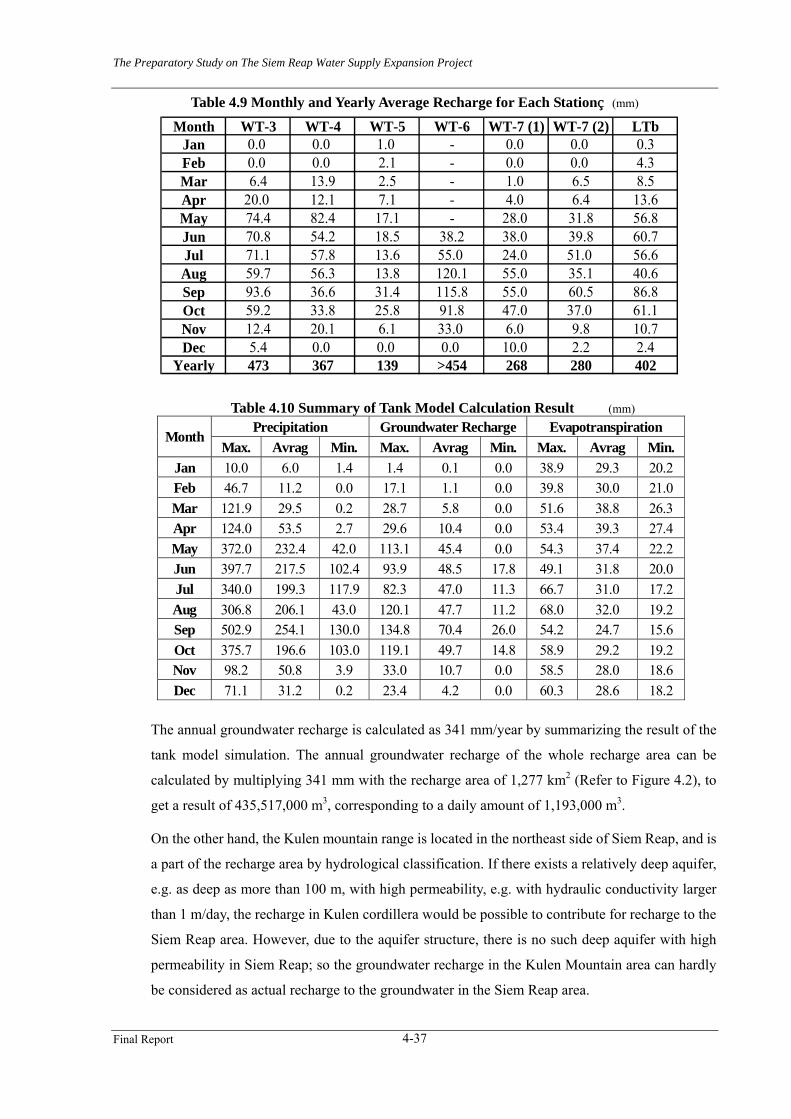
The Preparatory Study on The Siem Reap Water Supply Expansion Project
Final Report 4-37
Table 4.9 Monthly and Yearly Average Recharge for Each Station (mm)
Month WT-3 WT-4 WT-5 WT-6 WT-7 (1) WT-7 (2) LTbJan 0.0 0.0 1.0 - 0.0 0.0 0.3Feb 0.0 0.0 2.1 - 0.0 0.0 4.3Mar 6.4 13.9 2.5 - 1.0 6.5 8.5Apr 20.0 12.1 7.1 - 4.0 6.4 13.6May 74.4 82.4 17.1 - 28.0 31.8 56.8Jun 70.8 54.2 18.5 38.2 38.0 39.8 60.7Jul 71.1 57.8 13.6 55.0 24.0 51.0 56.6Aug 59.7 56.3 13.8 120.1 55.0 35.1 40.6Sep 93.6 36.6 31.4 115.8 55.0 60.5 86.8Oct 59.2 33.8 25.8 91.8 47.0 37.0 61.1Nov 12.4 20.1 6.1 33.0 6.0 9.8 10.7Dec 5.4 0.0 0.0 0.0 10.0 2.2 2.4
Yearly 473 367 139 >454 268 280 402
Table 4.10 Summary of Tank Model Calculation Result (mm) Precipitation Groundwater Recharge Evapotranspiration
Month Max. Avrag Min. Max. Avrag Min. Max. Avrag Min.
Jan 10.0 6.0 1.4 1.4 0.1 0.0 38.9 29.3 20.2 Feb 46.7 11.2 0.0 17.1 1.1 0.0 39.8 30.0 21.0 Mar 121.9 29.5 0.2 28.7 5.8 0.0 51.6 38.8 26.3 Apr 124.0 53.5 2.7 29.6 10.4 0.0 53.4 39.3 27.4 May 372.0 232.4 42.0 113.1 45.4 0.0 54.3 37.4 22.2 Jun 397.7 217.5 102.4 93.9 48.5 17.8 49.1 31.8 20.0 Jul 340.0 199.3 117.9 82.3 47.0 11.3 66.7 31.0 17.2 Aug 306.8 206.1 43.0 120.1 47.7 11.2 68.0 32.0 19.2 Sep 502.9 254.1 130.0 134.8 70.4 26.0 54.2 24.7 15.6 Oct 375.7 196.6 103.0 119.1 49.7 14.8 58.9 29.2 19.2 Nov 98.2 50.8 3.9 33.0 10.7 0.0 58.5 28.0 18.6 Dec 71.1 31.2 0.2 23.4 4.2 0.0 60.3 28.6 18.2
The annual groundwater recharge is calculated as 341 mm/year by summarizing the result of the
tank model simulation. The annual groundwater recharge of the whole recharge area can be
calculated by multiplying 341 mm with the recharge area of 1,277 km2 (Refer to Figure 4.2), to
get a result of 435,517,000 m3, corresponding to a daily amount of 1,193,000 m3.
On the other hand, the Kulen mountain range is located in the northeast side of Siem Reap, and is
a part of the recharge area by hydrological classification. If there exists a relatively deep aquifer,
e.g. as deep as more than 100 m, with high permeability, e.g. with hydraulic conductivity larger
than 1 m/day, the recharge in Kulen cordillera would be possible to contribute for recharge to the
Siem Reap area. However, due to the aquifer structure, there is no such deep aquifer with high
permeability in Siem Reap; so the groundwater recharge in the Kulen Mountain area can hardly
be considered as actual recharge to the groundwater in the Siem Reap area.

The Preparatory Study on The Siem Reap Water Supply Expansion Project
Final Report 4-38
The groundwater recharge for the water supply area can be actually obtained from its own extent.
The area of water supply service area is 552 km2, therefore, the annual groundwater recharge can
be calculated by multiplying 341 mm with 552 km2 to get the yearly average amount of
188,320,000 m3, corresponding to a daily amount of 516,000 m3.
If only comparing the amount of recharge from precipitation (516,000 m3/day) to the amount
given in water supply development plan (86,300 m3/day), it can be found that the former is about
6 times that of the latter. When groundwater is used as a source for water supply, an essential
condition is to keep the groundwater withdrawal amount less than the groundwater recharge
amount. Obviously, there is no problem for groundwater use just judging by this condition.
However, keeping the groundwater withdrawal amount less than the recharge amount is not the
only technical standard for groundwater water utilization evaluation. The groundwater level goes
up when getting recharged from precipitation and goes down when being consumed by
evaporation. When considering in a time unit of years rather than days, the groundwater level
neither goes up nor goes down. Namely, there is almost no fluctuation in yearly groundwater level.
Moreover, when considering within the hydrologic cycle, the groundwater level can be deemed as
not changing at all, even though a relative big amount precipitation recharges groundwater. That
is, under natural conditions, the amount of groundwater recharge is consumed and the main
groundwater consumption is clearly from evaporation or evapotranspiration. Hence, the
groundwater balance can be expressed by the equation as follows:
Rechargerain – ConsumptionEvaporation = 0
Or
Rechargerain = ConsumptionEvaporation
It is unavoidable to break the natural balance of groundwater when groundwater is withdrawn for
water supply. In water resources balance analysis groundwater development is also classified as
groundwater consumption. On the other hand, groundwater withdrawals have almost no effect on
the recharge amount in Siem Reap because the recharge amount is mainly decided by amount of
precipitation. Therefore, if continuous water level drawdown would not occur, that is, a new
groundwater amount balance is obtained in a hydrologic cycle; the balance equation can be
expressed as follows:
Rechargerain – ConsumptionEvaporation – ConsumptionWithdrawal = 0
Or
Rechargerain = ConsumptionEvaporation + ConsumptionWithdrawal
Because groundwater recharge does not change when considering within the hydrological cycle,
the groundwater development actually results in reducing of consumption from evaporation.
Evaporation from groundwater is not a constant amount. It depends on the evaporation amount

The Preparatory Study on The Siem Reap Water Supply Expansion Project
Final Report 4-39
from the ground surface and the depth of groundwater table. The amount of evaporation from
groundwater at a certain depth is also affected by the type of soil or aquifer. However, for general
analysis, a value of 5 m can be taken as an effective depth of evaporation from groundwater.
Therefore, the groundwater level will get to about 5 m below ground surface in case the
groundwater withdrawal amount equals to the recharge amount. In other words, if the whole
groundwater recharge amount is used for water supply, the groundwater level will become 5m
below the ground surface in the whole Siem Reap area.
The simultaneous groundwater level survey found that the groundwater level changes in different
seasons, to less than approximately 1 m below the ground surface in the rainy season and 3 m in
the dry season. Therefore, to take all groundwater recharge amount for groundwater development
would cause average groundwater drawdown from 2 m to more than 4m in different seasons in
Siem Reap. This is an unallowable situation because the degree of groundwater drawdown will
surely have a negative effect on the heritage sites and the environment. Therefore, not all recharge
of groundwater is available for groundwater development and all the groundwater development
plan have to be evaluated by checking the extent and magnitude of groundwater drawdown
caused by groundwater withdrawal.
4-6 Simultaneous Groundwater Observation
4-6-1 Groundwater Level Distribution and Change
To make clear the groundwater level distribution in Siem Reap, simultaneous groundwater
observations were conducted twice, in the rainy and dry seasons. The observation for the rainy
season was conducted at the end of September 2009, and the observation for the dry season at the
end of April, 2010.
210 wells were visited for observation well selection. When the wells were visited, basic
information was recorded such as coordinates, village name, well’s owner, type, depth, well head,
and well water utilization. From the 210 wells, 155 wells were selected for groundwater level
observation based on the following principals:
• The selected wells should be distributed in Siem Reap as homogenously as possible,
• The selected wells should be easy to access, and
• The selected wells should be permitted for water level observation.
To clearly grasp the groundwater level distribution, it is indispensable to confirm the ground
surface elevation of all of the surveyed wells. The ground surface elevation was obtained mainly
from the 1:5,000 scale topographic maps that were created by a previous JICA survey (Study of
Integrated Master Plan for Sustainable Development of Siem Reap/Angkor Town in the Kingdom
of Cambodia, 2005) with more than 140,000 control points in Siem Reap.

The Preparatory Study on The Siem Reap Water Supply Expansion Project
Final Report 4-40
Figure 4.46 and Figure 4.47 show the results of simultaneous groundwater observations in the
rainy season and dry season, respectively.
Figure 4.46 Result of Simultaneous Groundwater Observation the Rainy Season (September 2009)
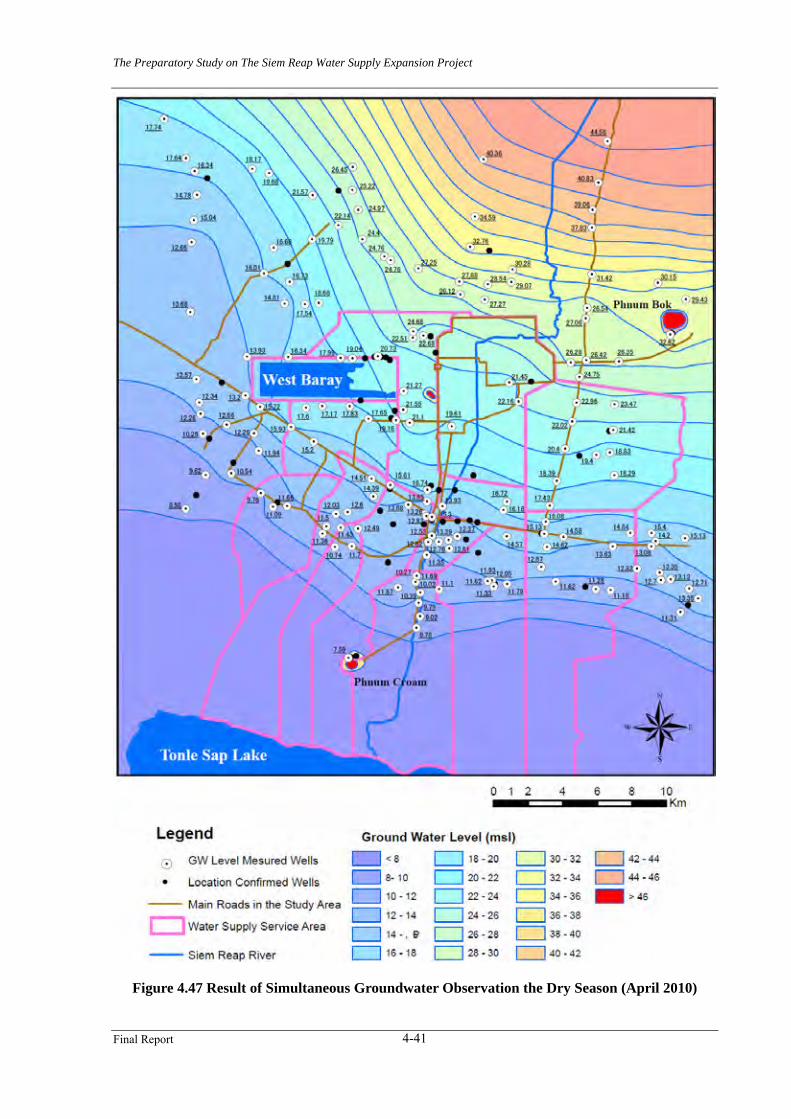
The Preparatory Study on The Siem Reap Water Supply Expansion Project
Final Report 4-41
Figure 4.47 Result of Simultaneous Groundwater Observation the Dry Season (April 2010)
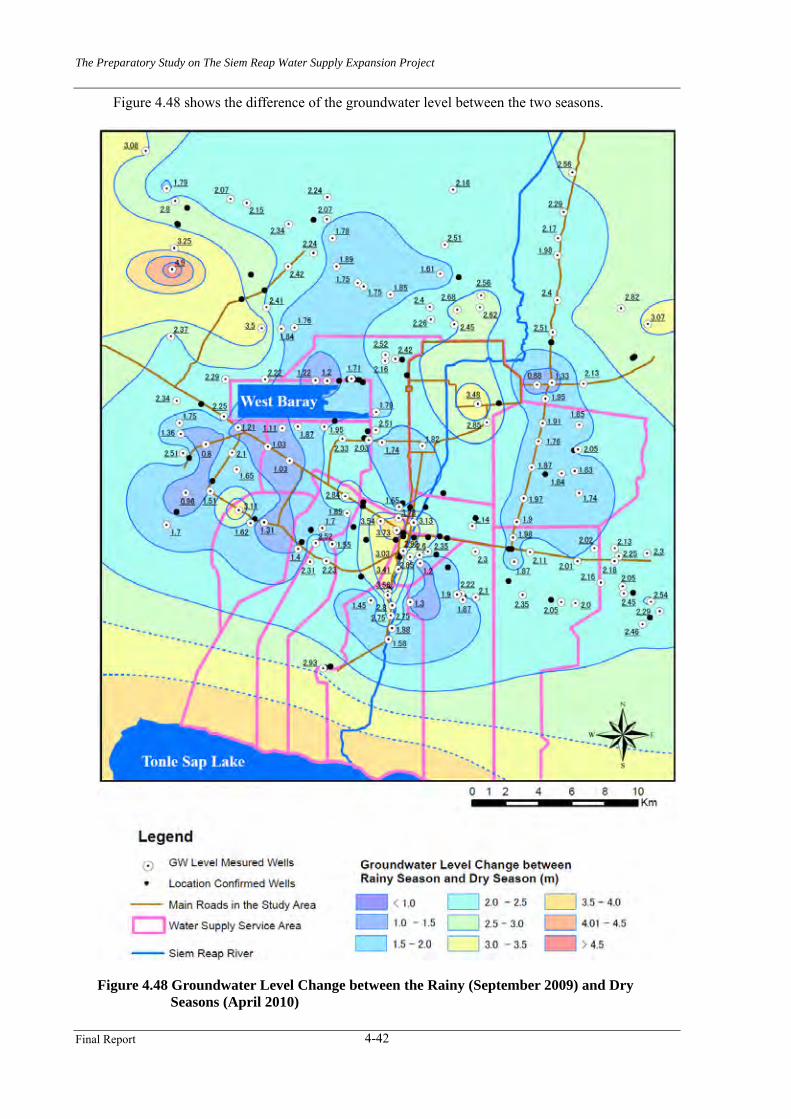
The Preparatory Study on The Siem Reap Water Supply Expansion Project
Final Report 4-42
Figure 4.48 shows the difference of the groundwater level between the two seasons.
Figure 4.48 Groundwater Level Change between the Rainy (September 2009) and Dry Seasons (April 2010)

The Preparatory Study on The Siem Reap Water Supply Expansion Project
Final Report 4-43
Table 4.11 and Table 4.12 give the summary results of groundwater level in the rainy and dry
seasons, respectively.
Table 4.11 Summary of Groundwater Level in the Rainy Season (Water Level Unit: m from ground surface)
Water Level 0-0.5 0.5-1 1-1.5 1.5-2 2-2.5 3-3.5 4.4.5 7-7.5
Numbers 51 57 28 11 5 1 1 1
Percentage 32.9 36.8 18.1 7.1 3.2 0.6 0.6 0.6
In the rainy season, groundwater level changes from 0.2 m to 7.4 m. About 95 % of surveyed
wells have a groundwater level less than 2 m, and the average value is 0.88 m in depth from the
ground surface. This result indicates a very high conformity of groundwater table distribution
with topography in Siem Reap.
It is common knowledge in hydrogeology that the distribution of groundwater level is generally
gentler than topography, because groundwater water can flow from high level place to low level
place; even though the change of groundwater recharge amount may be negligible in a small area.
However, the flow direction and amount depends on not only difference of water level but also the
aquifer structure and aquifer parameters. Considering this common knowledge and the result of
simultaneous groundwater observation survey together, the following conclusions can be
reached:
Groundwater flow in Siem Reap is slow under natural conditions. In other words, the affect of
recharge from precipitation and consumption from evaporation to groundwater level fluctuation
is much bigger than that of groundwater flow in natural condition.
Table 4.12 Summary of Groundwater Level in the Dry Season (Water Level Unit: m from ground surface)
Water Level Numbers Percentage Water Level Numbers Percentage
1 - 1.5 2 1.3 4.5 - 5 5 3.3 1.5 - 2 9 5.9 5 - 5.5 3 2 2 - 2.5 34 22.4 5.5 - 6 1 0.7 2.5 - 3 47 30.9 6 - 6.5 1 0.7 3- 3.5 23 15.1 6.5 - 7 1 0.7 3.5 - 4 17 11.2 8.5 - 9 1 0.7 4 - 4.5 7 4.6 > 13 1 0.7
Two purposes were set for the simultaneous groundwater observation in the dry season. To make
clear the groundwater level distribution in dry season and make clear the groundwater change
between the rainy and dry seasons. Therefore, all wells used for groundwater level observation in
the rainy season were taken as target wells for the observation in the dry season. However, 2 wells
available for water level observation in the rainy season have dried up in the dry season. And one
well is unavailable for water level observation because the well belongs to a hotel and was in

The Preparatory Study on The Siem Reap Water Supply Expansion Project
Final Report 4-44
pumping when twice visitations in different days. Therefore, total as 152 wells were taken for
groundwater level observation in the dry season.
In the dry season, groundwater level changes from 1.2 m to more than 13 m. One well near hill
Phnom Bok with a well depth of 13 m dried up, from which it can be ascertained that the water
level to is deeper than 13 m from ground surface, but the exact water level cannot be measured.
From the observation in the dry season, it can be found that the majority of surveyed wells have
groundwater level between 1.5 m and 5 m, and the average value is 3.1 m in depth from ground
surface.
Table 4.13 shows the statistics of the water level change between the two seasons. Nearly 90
percent of wells have a groundwater level change between 1 and 3.5 m and the average value is
2.5 m.
Table 4.13 Summary of Groundwater Level Change between Rainy and Dry Seasons (Water Level Change Unit: m)
Water Level Change 0.5-1 1-1.5 1.5-2 2-2.5 2.5-3 3-3.5 3.5-4 >4
Numbers 4 14 44 50 22 8 5 5
Percentage 2.6 9 28.4 32.3 14.2 5.2 3.2 3.2
As shown in Figure 4.46 and Figure 4.47, it can be found that even though groundwater level
changes between rainy and dry seasons, the water table distribution has the same pattern in both
seasons. That is, groundwater table distribution is basically determined by topography. From
Figure 4.48, it can be found that even though the pattern of the water table is the same in both
rainy and dry seasons, the groundwater level changes in an irregular shape. All the following
factors can be considered as affecting the groundwater level change:
• Amount of evaporation or evapotranspiration,
• Distance of wells to rivers and lakes (ponds),
• Water level change in rivers and lakes (ponds),
• Change of topography and then the change of hydraulic gradient,
• Structure and permeability of aquifers, and
• Amount of groundwater use.
To make all of the above factors clear, for example to obtain soil profiles for all of the surveyed
wells, is quite difficult in this study and for almost all similar investigations. However, the results
indicate that when the hydrological analysis and groundwater simulation is conducted, all of the
above factors need to be taken into consideration as much as possible. And all these factors are
specified in the groundwater simulation model in as much detail as possible by using all available
data and analysis results.
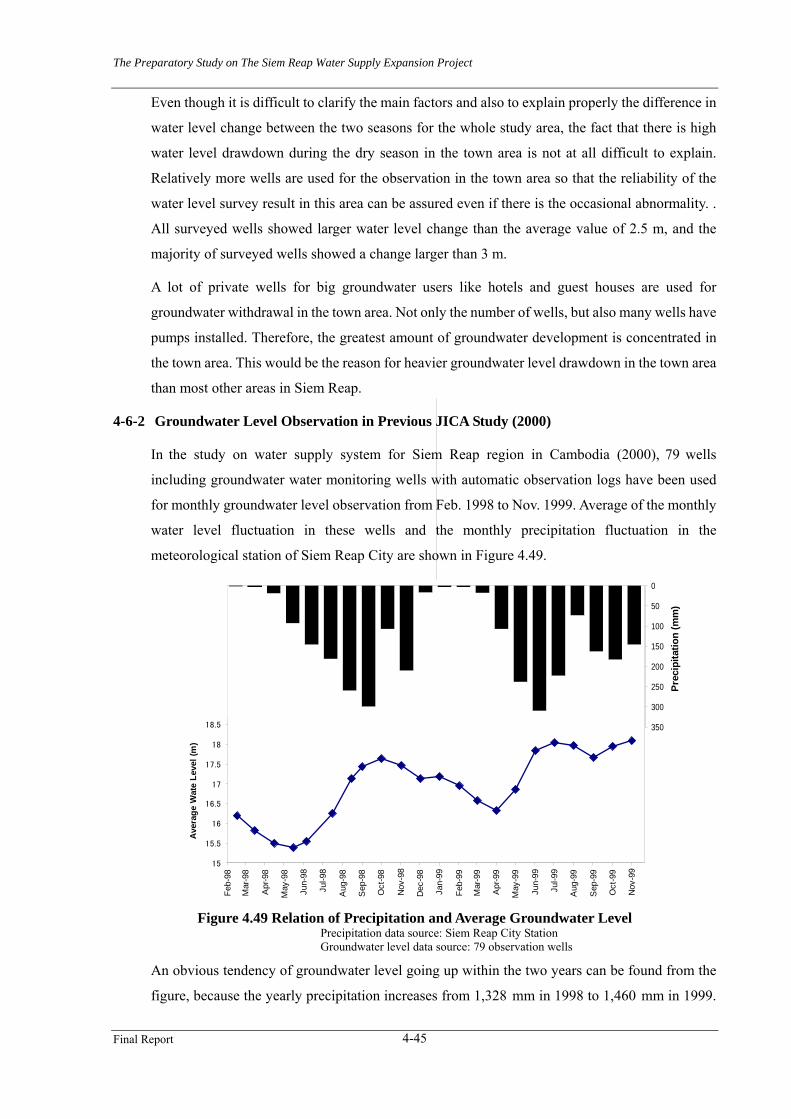
The Preparatory Study on The Siem Reap Water Supply Expansion Project
Final Report 4-45
Even though it is difficult to clarify the main factors and also to explain properly the difference in
water level change between the two seasons for the whole study area, the fact that there is high
water level drawdown during the dry season in the town area is not at all difficult to explain.
Relatively more wells are used for the observation in the town area so that the reliability of the
water level survey result in this area can be assured even if there is the occasional abnormality. .
All surveyed wells showed larger water level change than the average value of 2.5 m, and the
majority of surveyed wells showed a change larger than 3 m.
A lot of private wells for big groundwater users like hotels and guest houses are used for
groundwater withdrawal in the town area. Not only the number of wells, but also many wells have
pumps installed. Therefore, the greatest amount of groundwater development is concentrated in
the town area. This would be the reason for heavier groundwater level drawdown in the town area
than most other areas in Siem Reap.
4-6-2 Groundwater Level Observation in Previous JICA Study (2000)
In the study on water supply system for Siem Reap region in Cambodia (2000), 79 wells
including groundwater water monitoring wells with automatic observation logs have been used
for monthly groundwater level observation from Feb. 1998 to Nov. 1999. Average of the monthly
water level fluctuation in these wells and the monthly precipitation fluctuation in the
meteorological station of Siem Reap City are shown in Figure 4.49.
15
15.5
16
16.5
17
17.5
18
18.5
19
19.5
20
20.5
21
21.5
22
Feb-
98
Mar
-98
Apr
-98
May
-98
Jun-
98
Jul-9
8
Aug
-98
Sep
-98
Oct
-98
Nov
-98
Dec
-98
Jan-
99
Feb-
99
Mar
-99
Apr
-99
May
-99
Jun-
99
Jul-9
9
Aug
-99
Sep
-99
Oct
-99
Nov
-99
Aver
age
Wat
e Le
vel (
m)
350
300
250
200
150
100
50
0
Prec
ipita
tion
(mm
)
Figure 4.49 Relation of Precipitation and Average Groundwater Level
Precipitation data source: Siem Reap City Station Groundwater level data source: 79 observation wells
An obvious tendency of groundwater level going up within the two years can be found from the
figure, because the yearly precipitation increases from 1,328 mm in 1998 to 1,460 mm in 1999.

The Preparatory Study on The Siem Reap Water Supply Expansion Project
Final Report 4-46
This relation indicates the fact that groundwater level changes, not only with the alternation of
seasons, but also the total precipitation amount in each year. That is, in an extremely dry year, the
groundwater level will be drawn down much more than in an ordinary or rainy year.
The figure also shows that the lowest or the highest groundwater level may occur in different
months in a year. The water level was the lowest in May and the highest in October in 1998, and
the lowest in April and the highest in November in 1999. This fact indicates that even if the water
level were compared in the same month for different years, it is still difficult to ascertain how the
groundwater changed between those two years.
To compare the results of simultaneous groundwater level survey between this study and the
study on water supply system for Siem Reap region in Cambodia (2000), the location all wells
are plotted in the Figure 4.50.
Figure 4.50 Location of Wells Used for Simultaneous Groundwater Level Observation in
the Study on Water Supply System for Siem Reap Region in Cambodia (2000) and This Study.
Red circle marker: wells used in this study. Purple triangle marker: wells used in the previously study.
Within the nearly two years continuously groundwater level observation in monthly units, the
highest groundwater level appeared in November 1999 and the lowest in May 1998. Water level
distributions in these two months are shown in Figure 4.51 and Figure 4.52. And the water level
change between these two months is shown in Figure 4.53.
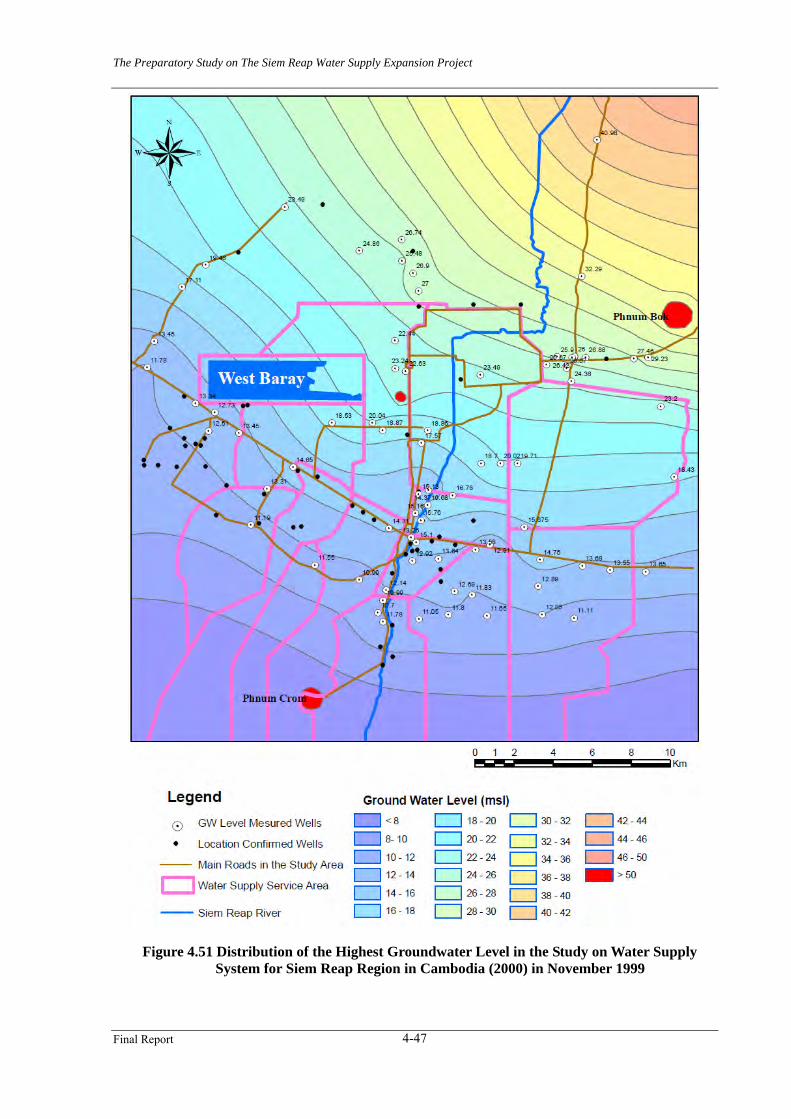
The Preparatory Study on The Siem Reap Water Supply Expansion Project
Final Report 4-47
Figure 4.51 Distribution of the Highest Groundwater Level in the Study on Water Supply
System for Siem Reap Region in Cambodia (2000) in November 1999
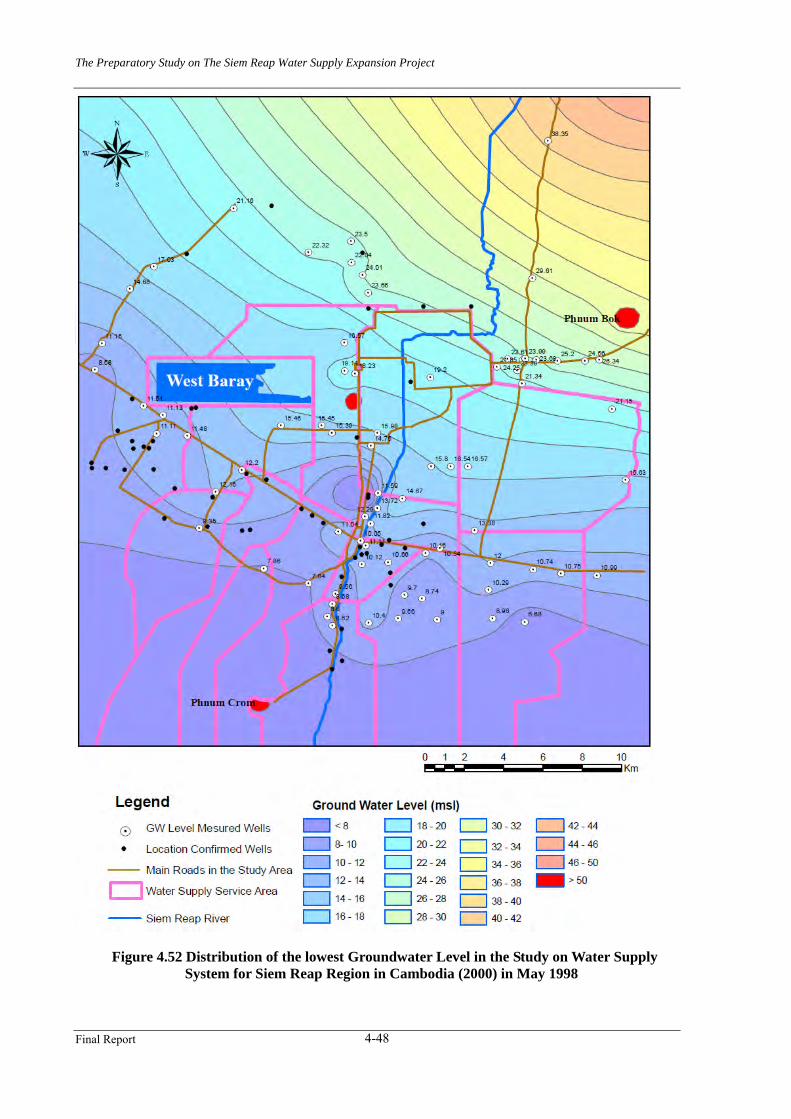
The Preparatory Study on The Siem Reap Water Supply Expansion Project
Final Report 4-48
Figure 4.52 Distribution of the lowest Groundwater Level in the Study on Water Supply
System for Siem Reap Region in Cambodia (2000) in May 1998

The Preparatory Study on The Siem Reap Water Supply Expansion Project
Final Report 4-49
Figure 4.53 Groundwater Level Change between the Highest Month (November 1999) and the
Lowest Month (May 1998) in the Study on Water Supply System for Siem Reap Region in Cambodia (2000)

The Preparatory Study on The Siem Reap Water Supply Expansion Project
Final Report 4-50
4-6-3 Comparison of Groundwater Observation Result
As mentioned above, a lot of factors can affect groundwater level change, and some occasional
factors, for example, a large and temporary groundwater withdrawal, may cause a temporarily
large change to the groundwater level in an observation well. But this kind of change should not
be taken as the general tendency of groundwater level fluctuation. Therefore, the more wells
available for analysis the higher reliability that can be ensured of the analysis results.
From Figure 4.50 it can be found that in both JICA studies, this study and the study on water
supply system for Siem Reap region in Cambodia (2000), relatively more wells along National
road No.6 and the road from heritage Angkor Wat to Tonle Sap Lake were selected for
groundwater level observation. All wells within 1km of the two main roads in Siem Reap were
extracted for water level change comparison in both studies, as shown in Figure 4.54.
Figure 4.54 Location Map of Selected Wells for Water Level Observation Result Comparison
White circles: Wells used for groundwater level survey in this study. White triangles: Wells used for groundwater level survey in previous study. Red circles: Wells selected from this study for the comparison. Pink triangles: Wells selected from the previous study for the comparison. Light blue zone: 1km zone from the two main roads in Siem Reap. Light cyan features: main heritage sites in Siem Reap. Brown zone: town area in Siem Reap.
About half of total used wells, 59 wells, from the previous study, and about 1/3, 65 wells, from
this study, were selected.
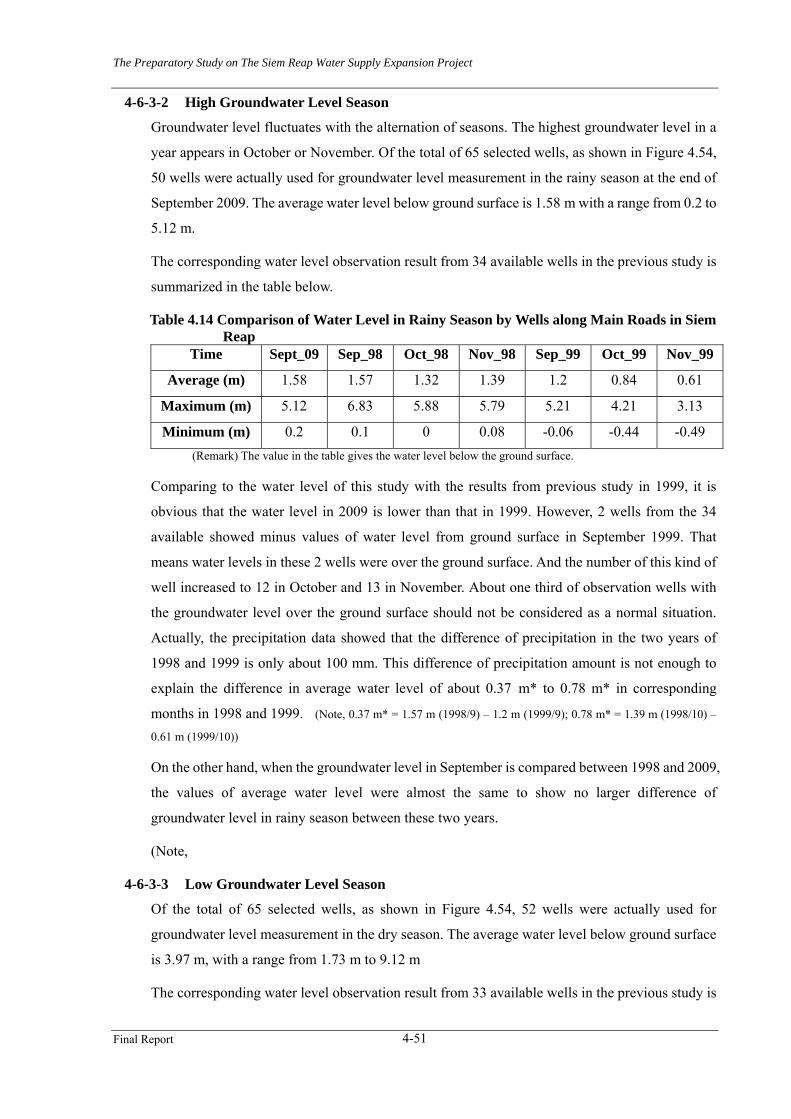
The Preparatory Study on The Siem Reap Water Supply Expansion Project
Final Report 4-51
4-6-3-2 High Groundwater Level Season
Groundwater level fluctuates with the alternation of seasons. The highest groundwater level in a
year appears in October or November. Of the total of 65 selected wells, as shown in Figure 4.54,
50 wells were actually used for groundwater level measurement in the rainy season at the end of
September 2009. The average water level below ground surface is 1.58 m with a range from 0.2 to
5.12 m.
The corresponding water level observation result from 34 available wells in the previous study is
summarized in the table below.
Table 4.14 Comparison of Water Level in Rainy Season by Wells along Main Roads in Siem Reap
Time Sept_09 Sep_98 Oct_98 Nov_98 Sep_99 Oct_99 Nov_99
Average (m) 1.58 1.57 1.32 1.39 1.2 0.84 0.61
Maximum (m) 5.12 6.83 5.88 5.79 5.21 4.21 3.13
Minimum (m) 0.2 0.1 0 0.08 -0.06 -0.44 -0.49 (Remark) The value in the table gives the water level below the ground surface.
Comparing to the water level of this study with the results from previous study in 1999, it is
obvious that the water level in 2009 is lower than that in 1999. However, 2 wells from the 34
available showed minus values of water level from ground surface in September 1999. That
means water levels in these 2 wells were over the ground surface. And the number of this kind of
well increased to 12 in October and 13 in November. About one third of observation wells with
the groundwater level over the ground surface should not be considered as a normal situation.
Actually, the precipitation data showed that the difference of precipitation in the two years of
1998 and 1999 is only about 100 mm. This difference of precipitation amount is not enough to
explain the difference in average water level of about 0.37 m* to 0.78 m* in corresponding
months in 1998 and 1999. (Note, 0.37 m* = 1.57 m (1998/9) – 1.2 m (1999/9); 0.78 m* = 1.39 m (1998/10) –
0.61 m (1999/10))
On the other hand, when the groundwater level in September is compared between 1998 and 2009,
the values of average water level were almost the same to show no larger difference of
groundwater level in rainy season between these two years.
(Note,
4-6-3-3 Low Groundwater Level Season
Of the total of 65 selected wells, as shown in Figure 4.54, 52 wells were actually used for
groundwater level measurement in the dry season. The average water level below ground surface
is 3.97 m, with a range from 1.73 m to 9.12 m
The corresponding water level observation result from 33 available wells in the previous study is
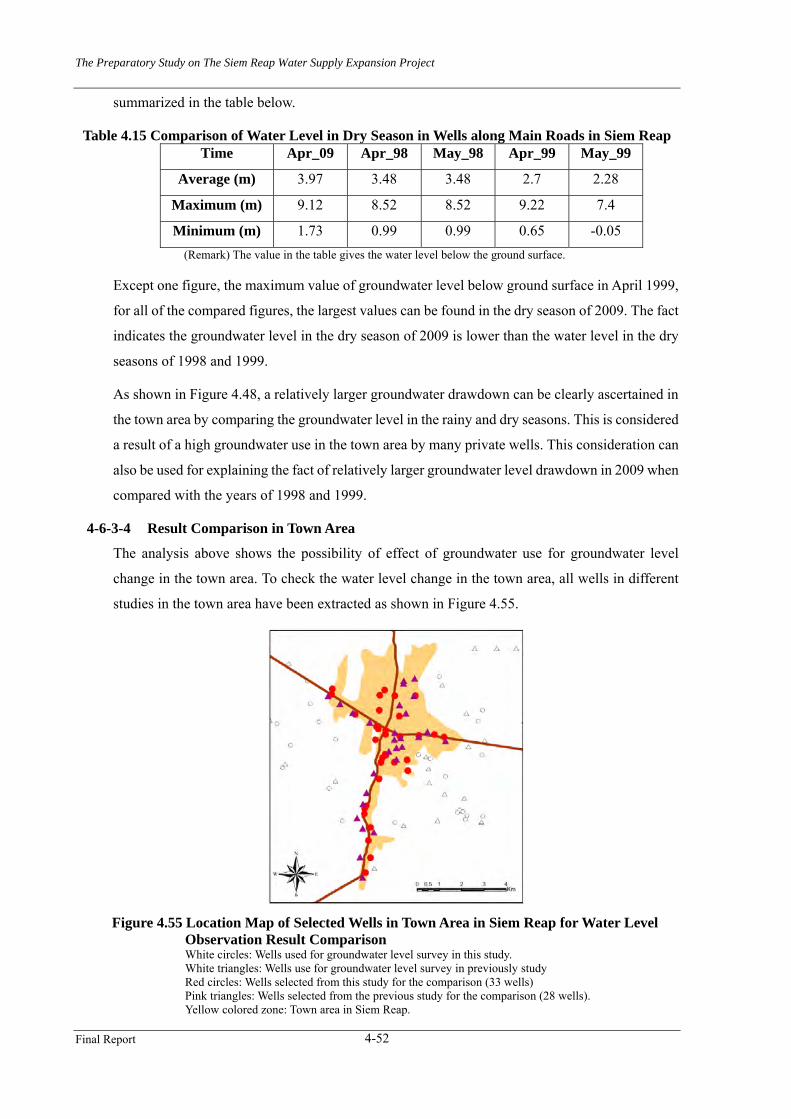
The Preparatory Study on The Siem Reap Water Supply Expansion Project
Final Report 4-52
summarized in the table below.
Table 4.15 Comparison of Water Level in Dry Season in Wells along Main Roads in Siem Reap Time Apr_09 Apr_98 May_98 Apr_99 May_99
Average (m) 3.97 3.48 3.48 2.7 2.28
Maximum (m) 9.12 8.52 8.52 9.22 7.4
Minimum (m) 1.73 0.99 0.99 0.65 -0.05 (Remark) The value in the table gives the water level below the ground surface.
Except one figure, the maximum value of groundwater level below ground surface in April 1999,
for all of the compared figures, the largest values can be found in the dry season of 2009. The fact
indicates the groundwater level in the dry season of 2009 is lower than the water level in the dry
seasons of 1998 and 1999.
As shown in Figure 4.48, a relatively larger groundwater drawdown can be clearly ascertained in
the town area by comparing the groundwater level in the rainy and dry seasons. This is considered
a result of a high groundwater use in the town area by many private wells. This consideration can
also be used for explaining the fact of relatively larger groundwater level drawdown in 2009 when
compared with the years of 1998 and 1999.
4-6-3-4 Result Comparison in Town Area
The analysis above shows the possibility of effect of groundwater use for groundwater level
change in the town area. To check the water level change in the town area, all wells in different
studies in the town area have been extracted as shown in Figure 4.55.
Figure 4.55 Location Map of Selected Wells in Town Area in Siem Reap for Water Level
Observation Result Comparison White circles: Wells used for groundwater level survey in this study. White triangles: Wells use for groundwater level survey in previously study Red circles: Wells selected from this study for the comparison (33 wells) Pink triangles: Wells selected from the previous study for the comparison (28 wells). Yellow colored zone: Town area in Siem Reap.
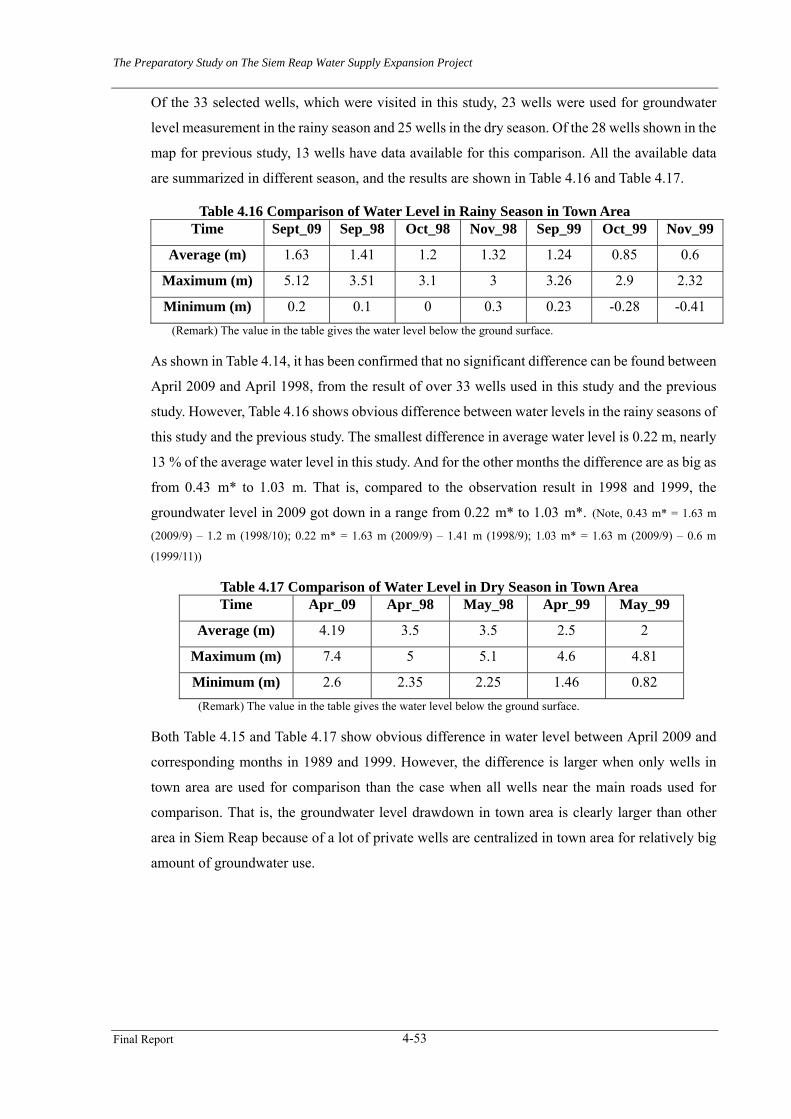
The Preparatory Study on The Siem Reap Water Supply Expansion Project
Final Report 4-53
Of the 33 selected wells, which were visited in this study, 23 wells were used for groundwater
level measurement in the rainy season and 25 wells in the dry season. Of the 28 wells shown in the
map for previous study, 13 wells have data available for this comparison. All the available data
are summarized in different season, and the results are shown in Table 4.16 and Table 4.17.
Table 4.16 Comparison of Water Level in Rainy Season in Town Area Time Sept_09 Sep_98 Oct_98 Nov_98 Sep_99 Oct_99 Nov_99
Average (m) 1.63 1.41 1.2 1.32 1.24 0.85 0.6
Maximum (m) 5.12 3.51 3.1 3 3.26 2.9 2.32
Minimum (m) 0.2 0.1 0 0.3 0.23 -0.28 -0.41 (Remark) The value in the table gives the water level below the ground surface.
As shown in Table 4.14, it has been confirmed that no significant difference can be found between
April 2009 and April 1998, from the result of over 33 wells used in this study and the previous
study. However, Table 4.16 shows obvious difference between water levels in the rainy seasons of
this study and the previous study. The smallest difference in average water level is 0.22 m, nearly
13 % of the average water level in this study. And for the other months the difference are as big as
from 0.43 m* to 1.03 m. That is, compared to the observation result in 1998 and 1999, the
groundwater level in 2009 got down in a range from 0.22 m* to 1.03 m*. (Note, 0.43 m* = 1.63 m
(2009/9) – 1.2 m (1998/10); 0.22 m* = 1.63 m (2009/9) – 1.41 m (1998/9); 1.03 m* = 1.63 m (2009/9) – 0.6 m
(1999/11))
Table 4.17 Comparison of Water Level in Dry Season in Town Area Time Apr_09 Apr_98 May_98 Apr_99 May_99
Average (m) 4.19 3.5 3.5 2.5 2
Maximum (m) 7.4 5 5.1 4.6 4.81
Minimum (m) 2.6 2.35 2.25 1.46 0.82 (Remark) The value in the table gives the water level below the ground surface.
Both Table 4.15 and Table 4.17 show obvious difference in water level between April 2009 and
corresponding months in 1989 and 1999. However, the difference is larger when only wells in
town area are used for comparison than the case when all wells near the main roads used for
comparison. That is, the groundwater level drawdown in town area is clearly larger than other
area in Siem Reap because of a lot of private wells are centralized in town area for relatively big
amount of groundwater use.