the primary copper industry - arizona
TRANSCRIPT

THE PRIMARY COPPER INDUSTRY I
OF ARIZONA
IN 1992
DEPARTMENT OF MINES AND MINERAL RESOURCES
BY N. J. Niemuth

ARIZONA DEPARTMENT OF MINES AND MINERAL RESOURCES
H. Mason C.ogg-in, Director
1502 West Washington Phoenix, Arizona 85007
(602) 255-3791 Toll Free in Arizona: 800-446-4259
Roy Miller - Phoenix Member
Richard Oldham - Quartzsite Secretary
Board of Governors
Ken C. Bennett - Phoenix Chairman
Eric A. Nordhausen - Tucson Vice Chairman
Clifford B. Altfeld - Tucson Member
Gover: Underground miner at Bisbee, Arizona, circa 1950. Photograph from H. Mason Goggin collection.

THE PRIMARY COPPER INDUSTRY
OF ARIZONA
by N.J. Niemuth
Department of Mines and Mineral Resourc~s
Special Report No. 20
State of Arizona Fife Symington, Governor
Phoenix, Arizona June, 1994

INTRODUCTION
The Arizona Department of Mines and Mineral Resources presents herein a report covering activity in Arizona's copper industry in the calendar year 1992. A brief review of operational h~ghlights reported by the major producers and developers in the State, market and price developments that affected copper production, and discussions of Arizona severance taxes on metalliferous minerals are included.
The contained statistical tables include various production, employment, inventory, import/export, prices, costs, and ore reserve numbers for 1992. Production of recoverable coppe~ is given for individual mines and by company. Figures showing the importance of copper in the mining industry are provided, as are data 'on the by-products of copper mining; gold, silver, and molybdenum. In addition, historical compilations are included for leach copper, average grade of ore produced, percent copper recovered, stripping ratios, and employment and earnings. Additional compilations indicating refined copper inventories in and out of the United States and average copper prices by month from 1982 through 1992 are provided. Also included are tables showing designed mine capacity and copper reserve base in Arizona plus cash production costs for the United States, 1983-1990.
The Department maintains an extensive reference library concerning the copper industry in Arizona. This repository includes information on individual mines and mining companies, United States Bureau of Mines and United States Geological Survey publications, other professional publications, periodicals, and earlier editions of this report. Additionally, experienced mining engineers are available for consultation, at no charge, on matters germane to the minerals industry.
The author wishes to express his sincere appreciation to the management and 'staff of Arizona's mining companies for graciously devoting time and effort to provide information for this report. Jean Dupree and Dan Edelstein of the U.S. Bureau of Mines, Dr. George Learning of the Western Economic Analysis Center of Marana, Arizona, and the American Bureau of Metal Statistics, Inc. of Secaucus, New Jersey also provided vital information. Thanks are also due to the Arizona Department of Economic Security, the Arizona Department of Revenue, and the staff of the Joint Legislative Budget Committee for providing data and statistics.
A special gratitude is felt toward the preceding authors for providing the format and sources of statistical information and to H. Mason Coggin, Director of the Department of Mines and Mineral Resources, for providing the opportunity to author this report.

COPPER PRODUCTION IN ARIZONA-1992
Arizona's copper industry produced 2.54 billion pounds of copper in 1992 (Table 1). This is an increase of 12.3 percent above 1991, and is the highest annual production ever achieved. Arizona contributed 65.4 percent of U.S. copper production, up from 63 percent in 1991 (Table 23).
The gross value of non-fuel mineral production in Arizona in 1992 was up 10.0 percent from 1991 to $3.16 billion (Table 10) reflecting increased copper production. Copper, represents 85.2 percent of this total; gold, silver and'molybdenum by-products of copper production represent an additional 3.4 percent (Table 9). The total contribution of the copper mines was therefore 88.6 percent of the gross value.
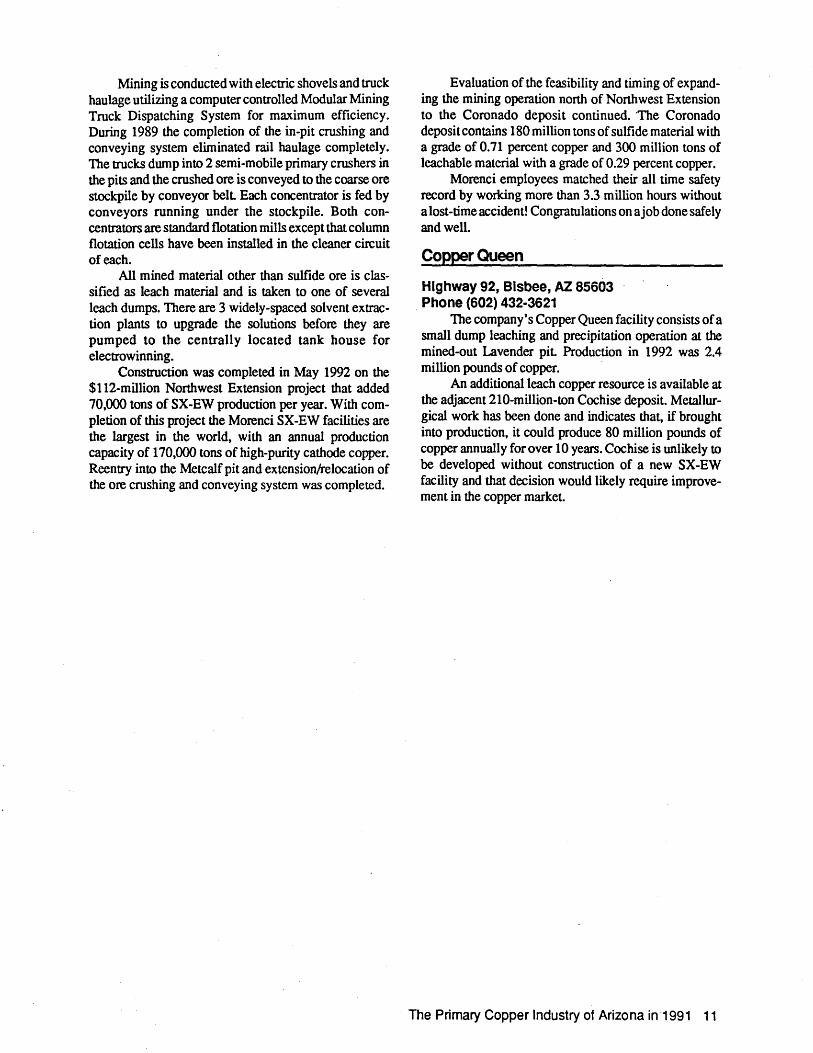
Figure 1. Producing copper properties - 1992
MOHAVE
• Bagdad
2 The Primary Copper Industry of Arizona in 1992
Copper was produced by 6 companies from 18 properties in 1992, and molybdenum was recovered as a co-product or by-product at 6 of these properties (Tables 3 and 4). Ten properties produced 98.0 percent of Arizona's copper, and 3 produced 90.0 percent of the molybdenum. The Morenci Mine of Phelps Dodge led in copper production with 30.6 percent of the total. Cyprus' Sierrita Mine produced 45.2 percent of the molybdenum.
Concentrate production increased 9.6% to 1.767 billion pounds. Copper produced by leaching increased even more, 16.2% over 1991 to' more than 775 million pounds and represents 30.5 percent of total production. (Table 1).
COCONINO NAVAJO APACHE
COCHISE
• San Xavhr N rth. Johnson • Mission
.Twin Bu tea
SANTA CRUZ Copper Queen
•

TABLE OF CONTENTS
INTRODUCTION 1
COPPER PRODUCTION IN ARIZONA - 1992 2
1992 OPERATIONS SUMMARY 3
STATUS AND PROGRESS 4 mGHLIGHTS OF COMPANY OPERATION
Arimetco 6
'Asarco 6
Cyprus Minerals Company 7
Magma Copper Company 8 Oracle Ridge Mining Partners 10
Phelps Dodge Corporation 10
SEVERENCE TAX ON METALLIFEROUS MINERALS 12
PROPERTY TAX 13
PRODUCTION Arizona
Table 1
Table 2a Table 2b Table 3 Table 4 Table 5 Table 6 Table 7 Table 8 Table 9
Table 10 Table 11
United States Table 12 Table 13 Table 14 Table 15
EMPLOYMENT
Arizona Table 16 Table 17
United States
Table 18
ECONOMICS
Table 19 Table 20
Table 21
STATISTICAL TABLES
Copper and molybdenum production in 1992, by mine and company 14
Concentrate production, by mine 16 Leach copper production, by mine 18 Company rank in 1992, by copper and molybdenum production 20 Mine rank in 1992, by copper and molybdenum production 21
Monthly and cumaltive copper mine production 22
Average copper content of ore produced 23 Percent contained copper recovered 24
Stripping ratios of open pit mines 25
Production and value of copper, molybdenum, gold, and silver recovered from copper ore 26
Nonfuel mineral production 28 Copper mine capacity in 1992 29
North American copper smelter capacity in 1992 30
United States copper production, by company 31
Copper imports of the United States, by country 32
Copper exports of the United States, by country 36
Employment and wages in Arizona copper miningand smelting 40
Arizona employment and wages in 1992, by industry 42
Employment, earnings, and hours in copper mining in the United States and Arizona 43
Refined copper inventories 46 Average monthly price of cathode copper 47
Estimated copper production costs for the United States 48

RESERVES Table 22 Table 23
ILLUSTRATIONS Figure 1 Figure 2a Fig~re 2b Figure 3 Figure 4 Figure 5
Figure 6
Figure 7 . Figure 8 Figure 9 Figure 10 Figure 11 Figure 12 Figure 13
Copper reserve base in 1992 49 Historical Arizona and U.S. Copper mine production S4
Producing copper properties 1992 2 Concentrate production 1982 - 1992 17 Leach copper production 1982 - 1992 19 Copper production by comapny 20 Molybdenum production by comapny 20 Value of copper, molybdenum, gold, and silver recovered
from copper ore 27 Direct and indirect impacts of the copper industry on the
Arizona economy - 1992 41 Average weekly wages by industry 42 Worker productivity - ore mined 44 Worker productivity 4S Refined copper inventories 46 Average annual copper prices 47 Copper price in constant 1992 dollars 48 Copper production in the U.S. and Arizona 54
* Throughout this report a '10n" means a short ton (2,000 pounds or 0.90718 metric ton). Specific statistics may vary slightly from table to table due to differences in source data.

CasaGrande
P.o. Box 15009, Casa Grande, Arizona 85230 5009 Phone (602)623-1539
Casa Grande consists of an in situ leaching operation, a small heap leach, an SX - EW plant, and a RLE plant that treats concentrates from other Cyprus properties. The potential for open pit mining and heap leaching a portion of the deposit is being evaluated.
Block-caved stopes in the oxide ore body are being leached and· devel()pment of a leaching operation in virgin ground is underway using high pressme pumps to inject sulfuric acid solution into holes drilled from the old underground workings. Pregnant solutions are collected in sumps underground and pumped to the SX-EW plant.
The roasters and acid plant of the RLE plant are treating approximately 150,000 tons per year of copper concentrates from other Cyprus operations. The pregnant solutions go to the SX -EW plant and the acid produced from the roaster gases is used for the leaching operations.
Miami
P.O. Box 4444, ClaypOol, AZ 85532 Phone (602) 473-7150
The Miami property consists of 3 open pit copper mines formerly called Bluebird, Inspiration, and Ox Hide, an SX- EW plant, a 24,000 ton-per-day concentrator that is currently on standby status, a smelter, an acid plant, an electrolytic refinery, and a 135,000 ton-peryear rod plant.
Ore is mined at the rate of 75,000 tons per day with electric shovels and hauled by truck to high grade, low grade, and waste dumps. The stripping ratio in 1992 was 0.83: 1, waste to ore. Cathodes from both the electrowinning and electro refining sections are fed to the continuous-cast rod plant to produce 5/16 inch copper rod on reels holding three and one-third miles of rod each.
A 3-yearpilot project with Arizona Ranch Management has been underway to test and evaluate the use of cattle as a tool to promote vegetative growth, to control dust, and curtail erosion on tailings at the Miami operation. Costs of reclamation were substantially reduced by the use of livestock in a reclamation process. Cattle are used on bare tailing material to prepare a base to stabilize the tailings and to promote plant growth.
A project to make Cyprus independent of outside smelting was completed in 1992. An increase in capacity from 450,000 tons to 650,000 tons of concentrate per year was completed in July, 1992 at the Miami smelter. The $106-million project increased smelting capacity by about 50 percent. The new ISASMEL T furnace began operation with production planned to gradually increase
8 The Primary Copper Industry of Arizona in 1991
until full annual capacity of 650,000 tons is reached in 1993.
Mineral Park
HC 37, Box 500, Kingman, AZ 86401 Phone (602) 565-2226
Mineral Parle consists of an open-pit copper-molybdenum mine, a 15,000 ton-per-day concentrator, and a precipitation plant Mine and mill are both on stand-by status. Production comes from conducting dump and in pit leaching with recovery via the precipitation plant.
SierritalTwin Buttes
P.o. Box 527, Green Valley, AZ 85622 Phone (602) 648-8500
Cyprus operates the Sierrita and Twin Buttes mines as one unit The Sierrita property consists of an open-pit copper-molybdenum mine, a 95,000 ton-per-day concentrator, a ferromolybdenum plant with two molybdenum rasters, a rhenium plant, a dump leaching operation, and an SX-EW plant. Mining is conducted using electric shovels and truck haulage to the crushers and dumps. The stripping ratio in 1992 was 0.92: 1, waste toore.
More than three quarters of Cyprus' molybdenum concentrate from the Thompson Creek (Idaho), Bagdad, and Sierrita operations is processed at Sierrita's roasters to produce molybdenum oxide and ferromolybdenum that are shipped to customers worldwide.
The Twin Buttes property consists of an open pit mine. 6.8 mile conveyor. agitation leach vats, and a SX-EW plant Production was restarted at the Twin Buttes Mine in 1988 using the conveyor. to provide additional sulfide feed to the Sierrita mill. The stripping ratio in 1992 was reduced significantly to .73:1. Twin Buttes contributed over 40 percent of the copper produced at the Sierrita concentrator in 1992. The SXEW plant at Twin Buttes is fed with solutions from agitation leaching of oxide ore.
MAGMA COPPER COMPANY
Corporate Headquarters - 7400 N. Oracle Road, Tucson,AZ 85704 Phone (602)575-5600
Magma's Arizona operations include the San Manuel, Pinto Valley, Miami, and Superior mines and a railroad. The railroad operation consists of 2 segments, a 29-mile line from San Manuel, and a 28-mile line from Superior, that both connect to the Santa Fe Southern Pacific system. The company also produced 19,000 ounces of gold froI:I1 the McCabe, a small underground mine located near Prescott.

contained copper per year. The addition of the refurbished Pima mill, now called the South mill, increased concentrator capacity to a total of 59,000 tons per day.
Ray P.o. Box 8, Hayden, AZ 85235 Phone (602) 356-7811
The Ray operation consists of an open-pit mine, dump leach and heap leach operations with a 40,000 ton-per-year SX-EW plant at Ray, a 31,000 ton-per-day concentrator at Hayden, and the new 30,000 ton-per-day concentrator at Ray.
Concentrate production increased over 60 percent with the start-up of the new Ray mill and made the Ray Mine the second largest producer in 1992. The new mill also allowed lowering of the cut-off grade to 0.3 percent copper. This allowed reselVes to increase by almost 100 percent to 1.1 billion tons. This puts Ray among an elite group of3 deposits in the U.S. with reselVes in excess of 1 billion tons.
Mining is conducted by electric shovels supplemented by front-end loaders utilizing truck haulage. A 60,000 ton-per-dayportable in-pit crusher and conveying system has replaced the 30,000 ton-per-day primary crusher at the pit. The stripping ratio in 1992 was 2.4:1, waste to ore, a high ratio that reflects mine development ahead of increased production.
Sulfide ore is hauled by truck to the crusher at Ray where it is crushed and transferred to trains for the 20-mile haul to the Hayden mill and is taken by conveyor to the stockpile for the Ray mill. Silicate ore is hauled and crushed, then further reduced to minus 3/4 inch by secondary and tertiary crushers. It is then transported by conveyor where it is agglomerated with sulfuric acid while in transit to the heap leach area. Final haulage and placement on the heaps is by end-dump trucks. Low grade material is hauled to prepared dump leaching areas and non-mineral muck is hauled to waste dumps by end dump trucks.
Silver Bell
25,000 W. Avra Valley Rd. Marana, AZ 85653 Phone (602)682-2420
Silver Bell consists of an open-pit copper mine and flotation mill, both presently on stand-by status, while dump leaching and operation of the precipitation plant have continued. Mining was stopped in 1984 due to high operating costs. Asarco plans to build a SX/EW plant that when completed would produce 18,000 tons of refined cathode copper per year at substantially lower cost. In late 1991 the company began the permitting process for construction of the SX-EW plant Oxide ore is expected
to come from a new area of the property known as Silver Bell North.
CYPRUS COPPER COMPANY
Corporate Headquarters-1501 W. Fountainhead Parkway, Tempe, AZ 85282 Phone (602) 929-4400
Cyprus was Arizona's second largest producer of copper in 1992 and continues to be the largest producer of molybdenum. Totals for the year were 647 million pounds of copper and 25 million pounds of molybdenum.
Cyprus Copper Company, a subsidiary of Cyprus Minerals Company, maintains its corporate headquarters in Arizona and operates 5 copper-producing mine com.;. plexes in the State: Bagdad, Casa Grande, Miami, Mineral Park, and Sierrita. In addition to its coppermolybdenum properties, Cyprus operats Arizona's largest gold mine, Copperstone, located north of Quartzsite. Quartzsite is in its last year of production.
In March, 1988, through a 15-year lease, Cyprus acquired the Twin Buttes property formerly operated by Anamax. In July, 1988 they acquired the entire Inspiration operation at Miami including the mines, concentrator (inactive), SX-EW plant, smelter, acid plant, electrolytic refinery, and rod plant.
Cyprus installed and operated the second copper SX-EW unit in the world at Bagdad and produced the first cathodes to meet the stringent specifications for trading on the London Metal Exchange and COMEX. The company currently produces 210 million pounds, or approximately 33 percent of their normal annual copper production, from SX-EW technology.
Bagdad
P.O. Box 245, Bagdad, AZ 86321 Phone (602) 633-2241
The Bagdad operation consists of an open-pit copper-molybdenum mine, a 75,000 ton-per-day concentrator, an oxide and low-grade sulfide dump leach operation, and an SX-EW plant A project to increase mill capacity by 10 percent is underway and a major expansion is being considered.
Mining is conducted by electric shovels using truck haulage to the primary crusher and dumps. The stripping ratio in 1992 was 0.80:1, waste to ore. The sulfide ore is transported from the primary crusher at the mine, a distance of 6,400 feet, to the coarse ore stockpile at the concentrator by conveyor. There it is crushed further, ground by autogenous and ball mills, and then copper and molybdenum concentrates are produced. Column cells are utilized in the molybdenum flotation circuit.
The Primary Copper Industry of Arizona in 1991 7

HIGHLIGHTS OF COMPANY OPERATIONS
Note: Company addresses and phone numbers current as of November. 1993
ARIMETCO INCORPORATED
5099 E. Grant Rd, # 120 Tucson, AZ 85712 Phone (602) 795-5725
Arimetco operates the Emerald Isle and Johnson mines in Arizona. Combined production totaled nearly 9 million pounds from the 2 properties. The company is developing the VanDyke and Zonia copper properties and also has industrial mineml interests in Arizona. At Van Dyke, which contains the company's largest copper reserve, shaft rehabilitation to allow access for in situ leach development was underway. Reserve confmnation drilling occurred at the recently acquired Zonia property.
Emerald Isle
Old Chloride Road, Chloride, AZ 86431 Phone (602)565-4554
The Ememld Isle Mine, which consists of an open pit mine, heap leach, and an 8,000 pound-per-day SXEW facility, began production in July, 1992. This small project is expected to operate for 3 years.
Johnson
Johnson Mine Road, Dragoon, AZ 85609 Phone (602) 586-2241
The Johnson Mine contributed over 45 percent of the company's production during 1992 by producing over 8 million pounds of copper. This was the flfSt full year of mining by Arimetco at Johnson and included a 4 month period during which only waste stripping occurred as part of a pushback of the Burro pit.
Exploration drilling has extended the life of the Burro pit by confmning reserves of 4 million tons with additional potential remairiing. The adjacent but undeveloped Copper Chief ore body contains 12 million tons grading 0.23 percent recoverable copper.
ASARCOINCORPORATED
Copper Division: 1150 N. 7th Ave., Tucsom, AZ 85705, P. O. Box 5747, Tucson AZ 85703, Phone (602) 798-7500
Asarco's Arizona operations consist of the Hayden copper smelter, 2 major open-pit mines, Mission and Ray, and a dump leaching/cementation facility at Silver Bell. The mines' production was 544 million pounds of copper in 1992. With the completion of expansion projects at Mission and Ray, Asarco has become self
6 The Primary Copp~r Industry of Arizona in 1991
sufficient in supplying copper concentrates to feed its smelters.
Joint venture partners Asarco and Freeport-McMoran continued the in situ leach research project at the Santa Cruz property in cooperation with the U.S. Bureau of Mines. Hydrologic data provided by the successful injection and recovery of saline solutions is being used to obtain an aquifer protection pennit for the next phase . of the project Thai phase will finally test copper recovery by operation of a pilot-scale well field and surface recovery plant
Asarco holds major copper reserves at Chilito north of Hayden, at the Copper Butte and Buckeye deposits west of Ray, at Helvetia east of Mission, and at Sacaton East near Casa Grande.
Hayden Smelter
Box 8, Hayden, AZ 85235 Phone (602) 356-7811
The Hayden smelter consists of an INCO flash furnace smelter rated at 720,000 tons of charge per year for an estimated production of 175,000 tons of blister copper. An acid plant rated at 1 ,600 tons of sulfuric acid per day keeps sulfur dioxide emissions within air quality limits. The smelter achieved a second consecutive year of record production.
Mission
Box 111, Sahuarita, AZ 85629 Phone (602) 648-2500
Mission consists of the consolidation of the Mission, Eisenhower, San Xavier, and Pima open-pit mines into one large pit referred to as the Mission complex. Also included is the small, separate San Xavier North pit The acquisition of the rest of the Eisenhower in April of 1991 and of the Mineral Hill deposit adjacent to the Pima section of the pit late in 1987 increased reserves and facilitated further efficiencies in pit design and mine planning.
Mining at Mission is conducted by electric shovels with truck haulage to the primary crusher and waste dumps. Some areas of the pit are back to final limits, allowing some waste dumping in the pit The stripping ratio in 1992 was 2.53, waste to ore; a high ratio that reflects removal of large amounts of waste related to expansion.
The expansion of the Mission Mine was completed in the fourth quarter of 1991, more than doubling production capacity from mid-1980's levels, to 124,000 tons of

economically disastrous 80's however, prompted an accelerated interest that continues today. Twelve plants operated during 1992 and 2 new leach only operations are in the planning and permitting stage. Production from the cementation process occurred at only 3 properties and has fallen to less than 2 percent of leach production.
CONCENTRATION
The majority of copper mineralization in Arizona is of the sulfide type and is generally not economically amenable to leaching. Inspiration had success with its heap leach-ferric cure process on mixed oxide-sulfide ores and Kennecott pioneered the use of bacteria to convert sulfides to oxides in low-grade dumps. However, as shown in the Operations Summary, about 69.5 percent of the copper was produced by the flotation method of concentration. In addition much of the leached copper produced is from dumps of low grade mineralization that was stripped from open pit mines to provide access to sulfide ore. Another aspect of the flotation process that makes it viable at some properties is the recovery of molybdenum by selective flotation. Molybdenum provides a significant portion of the revenues from some properties. Also, most precious metals in the ore follow the copper through the flotation and smelting steps to the electrolytic refinery where they are recovered from the anode slimes.
There are currently 12 flotation concentrators in operation in Arizona. Asarco is operating 4 - 2 at Ray and 2 at Mission, Cyprus is operating 2 - Bagdad and Sierrita, Magma is operating 3 - San Manuel, Pinto Valley. and Superior, Oracle Ridge is operating 1, and Phelps Dodge 2 at Morenci.
Although efficiency is constantly being improved. the flotation process is not cheap. It requires crushing and grinding the ore, separation of the ore minerals from the gangue minerals in the flotation cells, smelting the concentrate, and rerming the copper anodes from the smelter. The most significant recent advance in flotation is the improved recoveries resulting from the use of column flotation cells that have been installed in most concentrators.
SMELl1NG
Of the 7 smelters remaining in Ariiona in 1992 only 3 operated - Asarco's Hayden, Cyprus' Miami, and Magma's San Manuel. The smelter at Hayden that Asarco acquired from Kennecott met all significant environmental constraints when last operated in 1982. Magma's smelter at Superior and Phelps Dodge's smelters at Ajo and Morenci will require extensive retrofitting before they can be operated. Phelps Dodge ships concentrates to its Hidalgo smelter at Playas, New Mexico and to the Chino smelter at Hurley, New Mexico.
As an alternative to smelting. Cyprus Casa Grande operates the roast leach electrDwinning (RLE) plant built by Hecla. In this process a portion of the flotation concentrates from Sierrita are roasted to make them acid soluble and then leached with sulfuric acid. Salable cathode copper is extracted from the leach solution by electrowinning. Cyprus upgrades the leach solutions in the solvent extraction plant before electrowinning. Acid produced from the roaster gases is used for leaching and the process is essentially pollution free.
Upgrading and expansion of the Miami smelter was completed in July with installation of lsasmelt technology developed by Mount Isa Mining Company in Australia When operation reaches full capacity in 1993 Cyprus will be able to smelt all of their sulfide production.
The Primary Copper Industry of Arizona in 1992 5

STATUS AND PROGRESS
Although the world recession continued, copper prices declined only slightly. The average price for 1992 was 107.423 cents per pound (U.S. Producer Cathode) according to Metals Week, down less than 2 cents compared with 1991. World warehouse inventories rose by almost 25 percent during the year, while inventories in U.S. warehouses and refineries increased nearly 80 percent Production of copper on a worldwide basis continued to grow, as it did in the U.S. and Arizona. Despite the negative factors. that would· create gloom for the immediate future, prices held fum through the end of the year. The growth in the production of copper by SX~EW, along with other capital improvements, enabled Arizona producers to keep their production costs low, and therefore generally profitable, as well as competitive with producers in the rest of the world. .
Major companies continued to increase productIon by investing in their producing properties as opposed to opening new mines. The resulting expansions and efficiency improvements accounted for most of the production increases.
Smaller companies were more aggressive in their efforts to bring new copper projects on stream. Arimetco began operation in July of a new heap leach SX-EW facility at the Emerald Isle Mine. Arimetco acquired a lease on the Zonia deposit and continued development at the VanDyke Mine. AZCO continued the process of fmancing and pennitting to bring the Sanchez Mine in Graham County to production. Construction of a new S~-EW plant may begin in late 1994 if pennitting is completed. Cambior USA began mine planning and permitting after completing a drilling program at the Carlota deposit that delimited over 100 million tons of copper oxide mineralization.
OPEN PIT MINING
Open pit mining is the principal method of producing copper ore. Loading equipment ranges from frontend loaders to 50 cubic yard electric shovels. Haulage is by off-road trucks with up to 240 ton capacity, increasingly in conjunction with conveyor belts. The installation of in-pit crushing facilities along with conveyor systems to transport ore to the mills has been a major factor in the reduction of operating costs. The high capital investment required to install these systems is absorbed by the long life of the operations.
In 1992, 12 open pits were mined. Seven produced both sulfide and oxide ore, while 2 produced only sulfide ore, and 3 produced principally oxide ore.
4 The Primary Copper Industry of Arizona in 1991
UNDERGROUND MINING
The San Manuel Mine of Magma Copper is the largest underground metal mine in the nation and utilizes the block-caving method of mining. This method consists of undercutting a block of ore and allowing the ore to cave into draw points to be loaded onto trains for haulage to the shaft and hoisted to the surface. Nearly 20 million tons of sulfide ore were hoisted in 1992.
Magma's historic Superior Mine produced 250,500 tons of high grade ore utilizing the undercut and fill method of ore extraction.
Oracle Ridge Mining Partners mined nearly 200,000 tons of ore from the Oracle Ridge Mine mainly by use of the room and pillar method.
IN SITU MINING
In situ leaching of rubbleized copper bearing material remaining in previously mined underground stopes has long been practiced in Arizona. At San Manuel, Magma has developed a fonnal program of leaching mined out block caving stopes. With a production of nearly 24 million pounds, it was the largest in situ producer. During the past several years all of the pr.od~ction from the Casa Grande Mine has been from a SImIlar system developed by Noranda. Cyprus is continuing this project as well as tests of in situ leaching of non-rubbleized or virgin ground.
The U.S. Bureau of Mines continues development of technology to in situ leach virgin ground and is partially funding research at the Santa Cruz deposit near Casa Grande. The ore body, a deep seated acid soluble deposit, is owned by Asarco and Freeport-McMoran on a 50-50 basis.
SOLVENT EXTRACTION
Historically, copper produced from leach solutions had been extracted by the cementation process that precipitated copper from solution by replacement with metallic iron. This was an inexpensive method, but the cement copper produced had to be smelted and refined.
During the 1960's, Ranchers Exploration and Development Corporation pioneered the .use of SX-EW to produce copper at its Bluebird property near Miami. The obvious advantage of this method is that cathode copper of salable quality could be produced directly. fro~ leach solutions. The expense of smelting and refinmg IS avoided.
During the years afterRancher's introduction of SX-EW,' interest in the process grew gradually. The

The weighted average grade of sulfide ore mined in 1992 was 0.53 percent copper (Table 6). Stripping of waste, including some leachable material, was accomplished at the 11 operating open pit mines during 1992. The weighted average of the stripping ratios -waste to ore - was 1.26 to 1 (Table 8). Compared to the 1.49 to 1 in 1991 this decline probably indicates some reduction in stripping and possibly a change in designation of some waste to leach ore.
The estimated capacity to produce copper at each of Arizona's principal operations totals 1.383 million tons annually (Table 11). By this estimate the mines, concentrators, and leach facilitie$ operated at 91.9 percent of capacity in 1992.
The copper reserve base in Arizona is estimated to be over 14.5 billion tons containing over 71 million tons of copper (Table 22).· This represents' an 11.5 percent increase in tonnage and a 6 percent increase in contained copper compared to 1991 figures. The increases occurred largely at presently producing properties, not new· discoveries. At present mining rates, this amount, if economic, would represent 49.8 years of reserves.
1992 OPERATIONS SUMMARY
Operating properties Operating companies Operating smelters Ore mined (including some oxide) Ore milled (sulfides) Waste/overburden removed
(includes some leach material) Average stripping ratio Copper produced
From sulfide ores
Average sulfide grade From leaching BySX-EW
Molybdenum produced Silver produced Gold produced Average employment Average annual wage Productivity (production workers)
18 6 3 291,295,132 tons 192,860,212 tons
340,940,509 tons 1.26:1 (waste:ore) 1,271,466 tons - 65.4% of U.S. 883,544 tons - 69.5% of AZ 0.53% copper 387,922 tons - 30.5% of AZ
381,386 tons - 98.3% of leached 30,770,172 pounds
5,015,702 troy ounces 60,089 troy ounces 12,508 $40,012
123.9 pounds of copper per man-hour 15.9 tons of ore per man-hour
The Primary Copper Industry of Arizona in 1991 3

Poston Butte, a major copper deposit, was acquired from Conoco. Located near Florence, it contains 300 million tons of'oxide and 500 million tons of sulfide copper mineralization.
An innovative 15-year labor contract was signed in October, 1991. The contract is tailored to the needs of all parties, the company, unions, employees, and management, and is dedicated to employee involvement, raising productivity, lowering production costs, and increasing job security. Strikes and lockouts are prohibited for a 7-year period. Gain sharing plans, by division, allow employees to share the rewards of improved productivity', cost reduc~ons, and bettet: safety performance ..
San Manuel
P.O. Box M, San Manuel, AZ 85631 Phone (602) 385-3100
San Manuel consists of an underground coppermolybdenum mine, a 62,000 ton-per-day concentrator, an open-pit oxide copper mine, a heap leach, an in situ leach, an SX-EW plant, a 1,000,000 ton-per-year smelter, a 3,000 ton-per-day acid plant, a 300,000 ton-peryear electrolytic refmery, and a 180,000 ton-per -year rod plant
Mining at San Manuel uses the block-caving method. After development of the grizzly and haulage levels, caving is initiated by undercutting the ore block. The caved ore is drawn through the grizzlies to the haulage level. Haulage to the production shafts is by 23-ton trolley locomotives pulling ten 15-17 ton ASEA cars or fIfteen 12.:13 ton rotary dump cars. After hoisting to the surface the are is hauled by rail about 8 miles to the mill in lOO-ton cars in groups of 35 to 40 pulled by 125-ton diesel-electric 10comotives.Utilization of production techniques developed in the Kalamazoo ore body pilot production project have lowered mining costs at the San Manuel underground ore body to under $4.00 per ton. Nearly 20 million tons of ore were hoisted in 1992.
As the depletion of the San Manuel are body's reserves in 1998 approaches, Magma has been conducting a feasibility study to assess the viability of mining the down faulted Kalamazoo ore body. In early 1993 Magma's board of directors approved the development of Kalamazoo. Development is estimated to cost $135 million, but upon completion in 1997, it will extend the life of San Manuel's underground mine by 12 years to 2009.
Mining at the open-pit oxide mine is accomplished with front-end loaders with truck haulage at the rate of 28,000 tons of are and 65,000 tons of waste per day. Ore is placed on the polyethylene-lined leach pads and some of the waste is dumped in the subsidence area. Any sulfide ore encountered is hauled to a railroad siding and
added to the feed going to the concentrator. Copper is recovered from the leach solutions at the SX-EW plant that uses the ISA process of plating the copper on stainless steel sheets rather than on copper starter sheets.
The solutions from the in situ leaching are also fed to this plant that has a capacity of 75,000 tons of copper per year. When the open pit oxide reserves are exhausted in 1994, in situ leaching will likely increase. Cathodes from the electrolytic refmery and the SX-EW plant are melted and cast into continuous rods at the rod plant
The San Manuel smelter accounts for 25 percent of U.S. copper smelting capacity. The Outokumpu flash smelting furnace, with a design capacity of 3,000 tons of concentrate daily, is the largest single furnace smelter in the industry. During 1992 the smelter processed over'l million tons of concentrate.
Increasing copper concentrate production, combined with very large capital costs for new smelter construction and the long time required to obtain the necessary environmental permits, have resulted in a "smelter bottleneck." To take advantage of this situation, in the spring of 1992, Magma announced plans to increase its smelter capacity by 20 percent The company reports that more than one quarter of its copper throughput is derived from custom smelting and refining.
Pinto ValleylMiami
P.O. Box 100, Miami, AZ 85631 Phone (602) 473-6200
Magma's Pinto Valley Division consists of the Pinto Valley and Miami mines .. At Pinto Valley mining is accomplished with electric shovels and truck haulage to the 63,000 ton-per-day concentrator. A dump leach with 9,000 tons-per-year SX-EW plant are also in operation. During 1992 nearly 23 million tons of ore were mined and over 162 million pounds of copper were recovered.
Pinto Valley's open pit mine is scheduled to close in 1999 following depletion of reserves. A study is underway to determine if the large, unmined resource remaining can be made economic. If successful, mine life could be extended 6 years.
The Miami operation consists of an in situ leach of rubble remaining in the mined-out Miami block-cave area and hydraulic mining! leach reprocessing of the Number 2 tailings. Leach solutions from both are processed at a 14,000 ton-per-year SX-EW plant. Miami's block cave area in situ leach produced nearly 12 million pounds of copper. This is one of the more impressive production performances in the state for a deposit with "no reserves."
In 1988, following favorable metallurgical testing, feasibility study, and permitting, the company began the project for the reclamation and leaching of mill tailings
The Primary Copper Industry of Arizona in 1991 9

associated with the old Miami underground mine. The tailings are reclaimed using hydraulic monitors to produce a slurry of tailings and water. Sulfuric acid is added to slurry to dissolve the contained copper and the resulting pregnant leach solution is processed through the Miami's SX -EW planL The remaining tailings are thickened and transported for disposal through an overland pipe to an inactive Miami piL During 1992 these decades old tailings yielded approximately 7.7 million pounds of copper. Production from this project is expected to continue until 1998.
Superior.
P.o. Box 37, Superior, AZ 85273 Phone (602) 689·2444
Superior, also know as the company's namesake Magma mine, consists of an underground mine, a 3,300 ton per day flotation mill, and an inactive copper smelter. Concentrates are shipped by rail car to the San Manuel smelter f()r treabnenL This deep, hot, high-grade mine reopened in 1990. During 1992 it produced over 24 million pounds of copper from only 238,407 tons of ore. This represents a recovered grade of over 5 percent copper, approximately 10 times the state average.
ORACLE RIDGE MINING PARTNERS
Oracle Ridge Mine
P.o. Box 7, San Manuel, AZ 85631 Phone (602) 576-1412
Oracle Ridge Mining Partners consists of 2 partners. South Atlantic Ventures Ltd. of Vancouver, British Columbia, the mine's operator has a 70 percent interest, while the remaining 30 percent is owned by Continental Materials of Chicago, lliinois.
The underground Oracle Ridge mine is located 15 miles north-northwest of Tucson on the east flank of the Santa Catalina Mountain. A new column flotation mill started operation on February 28, 1991. During 1992 the mine and mill produced nearly 7 million pounds of copper in concentrates that were shipped to Asarco' s Hayden smelter.
PHELPS DODGE CORPORATION
Corporate Headquarters • 2600 North Central Avenue, Phoenix, AZ 85004- 3015 Phone (602) 234·8100
Phelps Dodge is the world's second largest and the United States' largest copper producer, accounting for about 33 percent of U.S. production from its mines in southeastern Arizona and southwestern New Mexico. Facilities in Arizona consist of 2 operating properties,
10 The Primary Copper Industry of Arizona in 1991
Morenci and Copper Queen, along with New Cornelia, a closed open-pit mine, mill, and smelter complex located at Ajo. In conjunction with its Arizona operations, it operates 2 mines, Tyrone and Chino, near Silver City, New Mexico, 2 smelters, Hidalgo and Chino, both in New Mexico, and a 420,000 ton-per-year refmery located at El Paso, Texas.
In 1992 Phelps Dodge's U.S. mines and facilities produced 621,600 tons of copper, 512,600 tons for the company and the balance for the accounts of minority interest owners. This production included a record 290,300 tons of copper from SX-EW plants making the company the larges~ SX-EW copper producer in the world. Copper produced by SX-EW accounted for 45 percent of Phelps Dodge's total production in 1992, compared with only 31 percent just 2 yearS ago. This amount is 50 percent higher than the Arizona industry average. SX-EW production, with its low unit costs, is a major factor in the company's successful effort of being a low cost copper producer.
In addition to the developed operations described above, Phelps Dodge conducted exploration on their significant holdings in the Safford distriCL Continued exploration drilling on the Dos Pobres deposit increased the estimate of leachable copper to 270 million tons with a grade of 0.46 percent copper and sulfide material to 230 million tons with a grade of 0.89 percent copper. The adjacent Lone Star deposit contains a leachable resource of 1,600 million tons with a grade of 0.38 percent copper.
Morenci
4521 State Highway 191, MorenCi, AZ 85540 Phone (602) 865·4521
Phelps Dodge's Morenci Mine is the largest copper producing mine in North America and the second largest copper producer in the world. The operation consists of 3 open pits, 2 concentrators, and an SX -EW plant. Phelps Dodge owns an 85 percent interest in the Morenci Mine; the remaining 15 percent is owned by Sumitomo Metal Mining Company, Ltd. and Sumitomo Corporation. Morenci employs nearly 2,100 people. During 1992 Morenci produced a record 389,300 tons of copper, accounting for more than 60 percent of all copper produced by Phelps Dodge.
The operation consists of the combined MorenciMetcalf-Northwest Extension open pit copper mines, the 60,000 ton-per-day Morenci concentrator with a molybdenum circuit, the 40,000 ton-per-day Metcalf concentrator,3 SX plants, and an 170,()()() ton-per-year EW tank house. The 650,000 ton-per-year smelter with a 2,400 ton- per-day acid plant remain inactive and will require extensive modifications to meet air quality restraints if ever reactivated.
Mining is conducted with electric shovels and truck haulage utilizing a computer controlled Modular Mining Truck Dispatching System for maximum efficiency. During 1989 the completion of the in-pit crushing and conveying system eliminated rail haulage completely. The trucks dump into 2 semi-mobile primary crushers in the pits and the crushed ore is conveyed to the coarse ore stockpile by conveyor belt Each concentrator is fed by conveyors running under the stockpile. Both concentrators are standard flotation mills except that column flotation cells have been installed in the cleaner circuit of each.
All mined material other than sulfide ore is classified as leach material and is taken to one of several leach dumps. There are 3 widely-spaced solvent extraction plants to upgrade the solutions before they are pumped to the centrally located tank house for electrowinning.
Construction was completed in May 1992 on the $112-million Northwest Extension project that added 70,000 tons of SX-EW production per year. With completion of this project the Morenci SX-EW facilities are the largest in the world, with an annual production capacity of 170,000 tons of high-purity cathode copper. Reentry into the Metcalf pit and extension/relocation of the ore crushing and conveying system was completed.
Evaluation of the feasibility and timiIlg of expanding the mining operation north of Northwest Extension to the Coronado deposit continued. The Coronado deposit contains 180 million tons of sulfide material with a grade of 0.71 percent copper and 300 million tons of leachable material with a grade of 0.29 percent copper.
Morenci employees matched their all time safety record by working more than 3.3 million hours without a lost-time accident! Congratulations on a job done safely and well.
Copper Queen
Highway 92, Bisbee, AZ 85603 Phone (602) 432·3621
The company's Copper Queen facility consists of a small dump leaching and precipitation operation at the mined-out Lavender pit Production in 1992 was 2.4 million pounds of copper.
An additional leach copper resource is available at the adjacent 210-million-ton Cochise deposit. Metallurgical work has been done and indicates that, if brought into production, it could produce 80 million pounds of copper annually for over 10 years. Cochise is unlikely to be developed without construction of a new SX-EW facility and that decision would likely require improvement in the copper market.
The Primary Copper Industry of Arizona in 1991 11

SEVERANCE TAX ON METALLIFEROUS MINERALS
The Severence Tax on metalliferous minerals is a tax on the production or extraction of metalliferous minerals from the earth, not on the sales of such minerals. A brief discussion of the tax is provided here; for more complete infonnation contact the Arizona Department of Revenue, 1600 W. Monroe, Phoenix, Arizona 85007, phone (602) 255-3381. Citations used below are from the Arizona Revised Statues.
Tax Base The severance tax is levied on the "net severance
base" of all metalliferous minerals produced after 1982 (42-1462). The "net severance base" is the greater of the following 2 values (42-1464, Laws of 1982, Chapter 230, Section 12):
1. The "weighted mineral value", or 2. A specified percentage of the old sales tax base
(the gross value of production less out-of-state processing costs). This value will be referred to as the" Arizona value" after June 30, 1985.
The "weighted mineral value" is essentially the cost of extracting the minerals from the earth and delivering them to the site where they will be processed.
The "weighted mineral value" is determined as follows (42- 1464): 1. Divide the mining costs by the production costs. 2. Multip~y the quotient computed in (1) above by the gross value of production.
Definitions: mining costs: represent the cost of extracting the minerals from the earth and delivering them to the site where they will be processed further (42-1461)
total production costs: include most of the major costs incurred in mining and processing minerals until the point of sale (42-1461).
grossva/ue o/production: is determined by multiplying the recoverable units of a metallic product by the price per unit of the product; the price per unit does not include the cost of manufacturing, fabricating or otherwise transforming a rermed mineral product, when these activities occur prior to sale of the product (42-1461).
Although metalliferous minerals will no longer be taxed on the old sales tax base, the value of minerals produced after 1982 may not fall below a specified percentage of the old tax value (42-1464, Laws of 1982, Chapter 230, Section 12). The old tax value included not only the cost of extracting the minerals from the earth, but most of the major in-state costs of producing the minerals. This value was determined by multiplying
12 The Primary Copper Industry of Arizona in 1992
the recoverable units of a metallic product by the price per unit and deducting the out-of-state processing costs from the result (42-1464; Laws of 1982, Chapter 230, Section 12; 41-1461).
Tax Rate 2.5% of the net severance base.
Purpose To aid in defraying the necessary and ordinary
expenses of the state, cities, and counties to reduce or eliminate the annual tax levy on property for state, city and county purposes and to reduce the levy on property for public school education (Laws of 1982, Chapter 230, Section 17).
Eighty percent of the collected taxes are distributed in the same manner as the transaction tax (i.e. 25 percent to the cities, 33.6 percent to the counties, and 41.4 percent to the State). The remaining 20 percent of the collected taxes are deposited each year in the State's general fund and are appropriated for public education purposes (42-1465; Laws of 1982, Chapter 230, Section 16).
Source: State of Arizona Tax Handbook -1992 Joint Legislative Budget Committee.
Severence tax paid to the State of Arizona on metalliferous mlnerals*
Source: Arizona Department of Revenue, Annual Reports.
PROPERTY TAX
The following has been excerpted from Appraisal Manual/or Mines and Natural Resources by Donald E. Ross of the Arizona Department of Revenue which was effective as of January I, 1988 and is revised annually.
The Natural Resource Unit of the Division of Property Valuation and Equalization is assigned the responsibility of valuing producing and nonproducing mines and oil, gas, and geothermal interests. Arizona Department of Revenue mine valuation regulations RI5-4-201 through RI5-4-206 are incorporated into ~smanual.
Arizona Revised Statutes .(ARS Section 42-201.8) states:
"Producing mine or mining claim" means any mine or mining claim from which any coal. mineral or mineral substance. other than clay. sand. gravel. building stone or any mineral substance normally processed into artificial stone. has been extracted/or commercial purposes at any time during a period 0/ one year prior to the first Monday in January 0/ the tax year. "
A producing mine includes the land utilized for mining purposes together with structures and facilities necessary to sustain mining operations. It also includes equipment used directly in the process of extracting ores or minerals from the earth for commercial purposes, including equipment required to prepare the materials for extraction and the handling, loading or transportation of such extracted material to the surface. Mining includes underground, surface and open-pit operations for the extraction of ores and minerals.
If mining operations cease, real and personal property associated with a mining operation will continue to be valued by Centrally Valued Properties for a period of three years. The nonoperating mine will be retained in the legal class 1 for the first year after mining operations are terminated. The legal class designation used for the next two years will depend on the use of the property, which could be class 4 if the property remains idle.
Three years after mining operations have ceased, the valuation of the nonproducing mining property will be transferred from the Centrally Valued Properties' jurisdiction to the Locally Valued Properties' jurisdiction. From this point on, the county assessor is responsible for classifying and valuing the subject property. Such property will be classified according to its current use. If the real and/or personal property is idle at the expiration of the three-year period, it normally will be classified legal Class Four property.
The Natural Resource Unit of the Centrally Valued Properties Section of the Arizona Department of Revenue is responsible for determining annually the value of all producing mines as of the first day of
January of the tax year. Property within the context of a producing mine excludes manufacturing operations such as a rod plant In summary, the value of taxable producing mine property for Arizona property tax purposes includes land, supplies inventories, ore reserves, construction work in progress, personal property and improvements.
Summary of Procedures Producing mines are taxed on the basis of their
assessed value multiplied by the local tax rate' which produces the tax due. The assessment ratio for 1988 is 28% of the full cash value or market value. The full cash value is determined by the mineral property appraiser after correlating the three approaches to value, namely the income, cost and market approaches.
The income approach consists of discounting two different future income streams as developed by (1) the mining company and (2) by the Department utilizing a single rate factor. The Department has developed a method in which a five-year history, expressed as a profit margin, is combined with the future production schedule to produce a future income stream. The historical data are expressed on a production basis, not on a sales basis. This five-year margin method avoids the problems of predicting the future price of copper and other metals. It is supported in the literature and has been approved by the Arizona Supreme Court. The past is only a valid indicator of the performance level of a relatively stable operation and should not be used for new or dying mines. The historical data are averaged to flatten the effects of the peaks and it is generally accepted as standard for financial reporting, and the Securities and Exchange Commission reports.
Cost approach values are determined by computing the reproduction cost new less depreciation for the physical assets. Straight line depreCation is utilized along with appreciation pr inflation factors as developed by the Department. Economic and functional obsolescence can be allowed for by the appraiser if warranted.
Comprehensive field notes are written for each mine annUally. Contacts with the mining industry are maintained in order to keep abreast of development in technology and discount rates. Technical papers and literature are collected, indexed, ~d placed in the listing of references for. each mine appraisal report. Detailed production statistics are
, maintained in order to analyze the historical performance for the mine.
The Primary Copper Industry of Arizona in .1992 13

Table 1. Copper and molybdenum production in 1992, by mine and company [Leaders (--), no production. (xx), not applicable]
Company Copper ore Copper ore Recoverable Recoverable Waste Mine mined milled copper molybdenum removed
Ore/process type (tons) (tons) (pounds) (pounds) (tons)
Arimteco International Inc. Emerald Isle (1
Heap leach/SX-EW 94,735 576,459 63,530 Johnson (2
Heap leach/SX-EW 1,905,280 8,156,435 2,209,860 Company total 2,000,015 8,732,894 2,273,390
Asarco Inc. Mission
Sulfide 18,614,900 19,859,100 206,321,800 47,119,700 Ray
Sulfide 19,298,908 19,298,908 246,772,985 57,556,318 Oxide 4,402,410
Heap leach/SX-EW 58,226,000 Dump leach/SX-EW 26,110,000
San Xavier North Sulfide 1,244,200 (3 (3 1,391,800
Silver Bell Dump leach/cement. 6,650,000
Company total 43,560,418 39,158,008 544,080,785 106,067,818
Cyprus Copper Co. Bagdad
Sulfide 28,993,636 27,851,415 209,832,000 9,998,000 18,221,867 Dump leach/SX-EW 4,986,003 19,470,000
Casa Grande In-situ/SX-EW 2,000,000
Miami (2 Oxide 28,222,000 23,337,000
Heap leach/SX-EW 124,575,000 Mineral Park
In-situ/cementation 2,000,000 Dump leach/cement. 2,000,000
Sierrita Sulfide 30,924,000 29,466,000 138,540,000 13,899,000 9,392,000 Dump leach/SX-EW 19,150,000 9,300,000
Twin Buttes Sulfide (4 6,131,000 6,054,000 99,249,000 1,392,000 5,580,000 Oxide 1,548,000
Vat/SX-EW (5 40,895,000 Company total 119,954,639 63,371,415 647,861,000 25,289,000 56,530,867
Magma Copper Co. Miami
In-situ/SX-EW 11,794,000 No.2 Tailings/SX-EW 7,710,000
Pinto Valley Sulfide 22,793,000 23,133,000 162,086,000 1,428,000 29,644~000 Dump leach/SX-EW 18,245,000
14 The Primary Copper Industry of Arizona in 1992

Table 1. Copper and molybdenum production in 1992, by mine and company - continued Company Copper ore Copper ore Recoverable Recoverable Waste
Mine mined milled copper molybdenum removed Ore/process type (tons) (tons) (pounds) (pounds) (tons)
San Manuel Underground sulfide 19,957,505 19,986,868 219,262,345 3,788,372
In-situ/SX-EW 23,832,897 Open pit-sulfide 128,125 61,264 763,703 Open pit-oxide 11,371,158 13,915,577
Heap leach/SX-EW 86,282,426 Superior
Sulfide (6 238,407 325,150 24,401,786 84,159 Company total 54,488,195 43,506,282 554,378,157 5,216,372 43,643,736
Oracle Ridge Mining Oracle Ridge
Sulfide 191,865 224,507 6,858,000 24,698 Company total 191,865 224,507 6,858,000 24,698
Phelps Dodge Corp. Copper Queen
Dump leach/cement. 2,422,000 Morenci (7
Sulfide 46,600,000 46,600,000 453,000,000 264,800 132,400,000 Oxide 24,500,000
Dump leach/SX-EW 325,600,000 Company total 71,100,000 46,600,000 781,022,000 264,800 132,400,000
Subtotals by process type
Flotation 195,115,546 192,860,212 1,767,087,619 30,770,'172 315,330,119
Leach 96,179,586 xx 775,845,217 39,525,967 Dump/SX-EW xx xx 406,435,000 xx Heap leach/SX-EW xx xx 277,816,320 xx In-situ/SX-EW xx xx 37,626,897 xx Vat agitation/SX-EW 1,548,000 xx 40,895,000 xx
SX-EW total xx xx 762,773,217 xx Dump/cementation xx xx 11,072,000 xx In-situ/cementation xx xx 2,000,000 xx
Cementation total xx xx 13,072,000 xx Arizona total 291,295,132 192,860,212 2,542,932,836 30,770,172 340,940,509
(1 Began production July 1992. (2 Although some of this production is from old dumps, it is undifferentiated and reported as heap leach. (3 Ore milled and copper recovered reported with Mission. (4 Sulfide ore is concentrated at Sierrita. (5 Includes production from ore stockpiles, reclaimed sulfide tailings, and newly mined ore. (6 Waste is mixed with ore and milled. (7 Includes Sumitomo's 15%. All waste is low-grade material that is dump leached.
The Primary Copper Industry of Arizona in 1992 15

Table 2a. Concentrate production, by mine [Copper production in thousand pounds. Leaders (--), no production]
Company/Mine 1982 1983 1984 1985 1986 1987
Asarco Inc. Mission (1 193,055 127,229 95,052 117,711 123,231 117,195 Ray (2 76,819 54,163 174,554 148,256 143,237 144,803 Sacaton 41,784 37,587 8,993 San Xavier 25,608 22,566 18,866 Silver Bell 7,647 23,613 Cyprus Copper Co. Bagdad 160,073 148,783 37 161,690 159,883 165,632 Casa Grande· (4 34,276 Johnson 2,511 9,717 Miami (5 72,320 83,256 71,431 68,944 5,318 Sierrita/Esperanza (6 104,537 130,402 174,131 215,500 163,020 150,000 Twin Buttes (7 175,347 12,666 Magma Copper Co. Pinto Valley/Miami 84,691 83,042 149,886 143,141 128,376 San Manuel UG 213,482 199,409 226,186 186,779 196,138 190,900 San Manuel OP Superior 51,265 Oracle Ridge Mining Oracle Ridge Phelps Dodge Corp. Morenci 151,472 287,210 374,800 462,065 518,388 485,320 New Cornelia 21,255 74,600 47,642 Total ',374,219 ',229,511 1,298,347 1,510,831 1,452·,356 1,382,226
Percent of primary copper produced (9 80.4 81.2 82 85 82.9 80.2
(1 Includes production from Cyprus Pima in 1 982 and ANA MAX and Asarco Eisenhower for 1982-1984.
(2 Acquired from Kennecott, November 18, 1986. (3 San Xavier production included with Mission in 1992. (4 Noranda Lakeshore through 6/31/87. Became Cyprus Casa Grande July, 1988. (5 Acquired from Inspiration, July 1, 1988 and renamed Miami. (6 Acquired Sierrita/Esperanza from Duval, April 1, 1986. (7 Operated by ANA MAX through 1983. Acquired by Cyprus March, 1988. (9 Leach copper compared to total copper produced as reported in this report, Table1.
16 The Primary Copper Industry of Arizona in 1992

Table 2a. Concentrate production, by mine - continued
Company/Mine 1988 1989 1990 1991 1992
Asarco Inc. Mission (x 130,364 117,243 133,973 172,043 206,322 Ray (3 157,141 153,879 161,855 149,453 246,773 Sacaton San Xavier 26,765 25,528 4,864 (3 Silver Bell Cyprus Copper Co. Bagdad 181,500 176,372 191,653 196,852 209,832 Casa Grande (4 Johnson Miami (5 Sierrita/Esperanza (6 166,603 151,800 155,071 134,014 138,540 Twin Buttes (7 11,784 67,322 81,925 96,774 99,249 Magma Copper Co. Pinto Valley/Miami 133,686 162,550 161,720 146,261 162,086 San Manuel UG (8 183,042 180,793 185,211 221,861 219,262 San Manuel OP (8 220 976 114 764 Superior 5,777 25,167 24,402 Oracle Ridge Mining Oracle Ridge 4,483 6,858 Phelps Dodge Corp. Morenci 485,835 471,412 470,505 445,500 453,000 New Cornelia Total 1,450,175 1,509,112 ',573,218 1,597,386 1,767.088
Percent of primary copper produced (9 76.9 75.1 72.3 70.5 69.5
Figure 2a. Concentrate production 1982 - 1992
1992
1990
.. 1988 1~~~~~~~~~~~~~~~~~~~~~~~1'767'088 1,597,386
1,573,218 1,509,112
1,450,175 co G)
> 1986 _-------------.1,382,226 _---------------1,452,356
1984 ~
1982
600,000
1,510,831 1,298,347
1,229,511 1,374,219
800,000 1,000,000 1,200,000 1,400,000 1,600,000 1,800,000
Thousand pounds copper
The Primary Copper Industry of Arizona in 1992 17

Table 2b. Leach copper production, by mine [Copper production in thousand pounds. Includes copper recovered by precipitation or SX-EW
from material dump, vat, heap, or in-situ leached. Leaders (--), no production]
Comean~/Mine 1982 1983 1984 1985 1986 1987
Arimetco Intemationallnco Emerald Isle Johnson (1 9,702 8,803 6,200 Van Dyke (2
Asarco Inco Ray (3 22,420 20,033 20,457 23,706 56,639 68,543 Silver Bell 8,687 10,374 9,152 8,800 6,814 12,800
Cyprus Copper Co. Bagdad 13,173 13,282 14 14,259 13,958 16,470 Casa Grande (4 45,611 3,244 15,401 13,514 7,100 4,145 Miami (5 50,000 78,988 79,549 85,136 98,747 105,555 Mineral Park (6 3,191 3,101 2,718 3,798 4,25'1 4,405 Ox Hide (5 1,572 Sierrita/Esperanza (6 9,354 6,367 8,500 10,000 8,770 7,943 Twin Buttes (7 60,796 50,649 50,239 19,824
Magma Copper Co. Copper Cities .2,046 Pinto Valley/Miami 26,958 24,632 25,602 23,947 22,252 22,724 San Manuel (8 21,923 51,278
Phelps Dodge Corp. Copper Queen 4,545 5,200 3,493 4,144 3,454 2,730 Morenci 75,735 69,158 60,312 53,228 56;261 45,249 New Cornelia 661 920 402
Total 334,451 285,028 285,160 266,958 300,169 341,842
Percent of primary copper produced (9 1906 18.8 18.0 15.0 17.1 19.8
(1 ACQuired from Cyprus, August, 1 989. (2 Operated by Kocide 1988-89. ACQuired by Arimetco in 1990. (3 ACQuired from Kennecott, November 18, 1986. (4 Noranda Lakeshore through 6/31/87. Became Cyprus Casa Grande July, 1 988. (5 ACQuired from Inspiration, July 1, 1988 and renamed Miami. (6 Cyprus aCQuired Sierrita/Esperanza and Mineral Park from Duval April 1, 1986. (7 Operated by ANAMAX through 1985. ACQuired by Cyprus March, 1988. (8 Open pit, heap leach, SX-EW start-up in spring of 1986. Some in-situ production. (9 Leach copper compared to total copper produced as reported in this report, Table 1 .
18 The Primary Copper Industry of Arizona in 1992

Table 2b. Leach copper production, by mine - continued
Company/Mine 1988 1989 1990 1991 1992
Arimetco International Inc. Emerald Isle 48 26 576 Johnson (2 2,852 5,898 8,156 Van Dyke (3 67 654
Asarco Inc. Ray (4 76,966 79,933 81,797 85,238 84,336 Silver Bell 8,660 10,017 8,480 8,059 6,650
Cyprus Copper Co. Bagdad . 19,100 22,262 23,419 22,391 19,470 Casa Grande (5 4,300 5,000 2,500 6,864 2,000 Miami (6 115,293 124,367 121,702 121,224 124,575 Mineral Park (7 4,500 3,338 4,000 3,800 4,000 Ox Hide (6 Sierrita/Esperanza (7 8,556 8,400 9,383 9,337 9,300 Twin Buttes (8 18,800 30,919 37,597 40,895
Magma Copper Co. Copper Cities Pinto Valley/Miami 23,413 21,013 31,955 34,535 37,749 San Manuel (9 62,956 68,855 80,400 91,562 110,115
Phelps Dodge Corp. Copper Queen 2,700 4,762 3,100 2,280 2,422 Morenci 108,426 133,221 200,823 238,900 325,600 New Cornelia
Total 434,937 500,670 601,356 667,685 775,844
Percent of primary copper produced (9 23.1 24.9 27.7 29.5 30.5
Figure 2b. Leach copper production 1982 - 1992
1992 7 75,844 667,685
1990 601,356 .500,670
... 1988 434,937 ftI CI)
> 198.6 341,842
300,169 266,958
1984 285,160 285,028
1982 334,451
o 100,000 200,000 300,000 400,000 500,000 600,000 700,000 800,000
Thousand pounds copper
The Primary Copper Industry of Arizona in ·1992 19

Rank
1 2 3 4 5 6·
Table 3. Company rank in 1992, by copper and molybdenum production Copper Mol~bdenum
Company Percent Rank Company
Phelps Dodge Corp. 30.71 1 Cyprus Copper Co. Cyprus Copper Co. 25.48 2 Magma Copper Co. Magma Copper Co. 21.80 3 Phelps Dodge Corp. Asarco Inc. 21.40 Arimetco Int. Inc. 0.34 Oracle Ridge Mining 0.27
Figure 3. Copper production by company
Asarco Inc. 22%
Phelps Dodge Corp. 30%
Magma Copper col.lilill 22% ~
Cyprus Copper Co. 28%
Figure 4. Molybdenum production by company
Phelps Dodge Corp. Magma Copper Co. 1 %
17% •• 11
Cyprus Copper Co. 82%
20 The Primary Copoer Industry of Arizona in 1992
Percent
82.19 16.95 0.86

Table 4. Mine rank in 1992, by copper and molybdenum production Rank Mine/Company
Total
Total
1 Morenci/Phelps Dodge Corp. 2 Ray/Asarco Inc. 3 San Manuel/Magma Copper Co. 4 Bagdad/Cyprus Copper Co. 5 Mission/Asarco Inc. (1 6 Pinto Valley/Magma Copper Co. 7 Sierrita/Cyprus Copper Co. 8 Twin Buttes/Cyprus Copper Co. 9 Miami/Cyprus Copper·Co.
10 Superior/Magma Copper Co. 11 Miall1i1Magma Copper Co. 12 Silver Bell/Asarco Inc.
Copper
13 Johnson/Arimetco International Inc. 14 Oracle Ridge/Oracle Ridge Mining 15 Mineral Park/Cyprus Copper Co. 1 6 Copper Queen/Phelps Dodge Corp. 17 Casa Grande/Cyprus Copper Co. 18 Emerald Isle/Arimetco International Inc.
1 Sierrita/Cyprus Copper Co. 2 Bagdad/Cyprus Copper Co.
Molybdenum
3 San Manuel/Magma Copper Co. 4 Pinto Valley/Magma Copper Co. 5 Twin Buttes/Cyprus Copper Co. 6 Morenci/Phelps Dodge Corp.
(1 Includes copper production from San Xavier North.
Production (pounds) % of total
778,600,000 331,108,985 330,141,371 229,302,000 206,321,800 180,331,000 147,840,000 140,144,000 124,575,000 24,401,786 19,504,000
6,650,000 8,156,435 6,858,000 4,000,000 2,422,000 2,000,000
576,459 2,542,932,836
13,899,000 9,998,000 3,788,372 1,428,000 1,392,000
264,800 30,770,172
30.6 13.0 13.0
9.0 8.1 7.1 5.8 5.5 4~9
. LO 0.8 0.3 0.3 0.3 0.2 0.1 0.1 0.0
100.0
45.2 32.5 12.3 4.6 4.5 0.9
100.0
The Primary Copper Industry of Arizona in 1992 21

Table S. Monthly and cumulative copper mine production [Percentage change column shows change from corresponding period in prior year]
1988 1989 1990 1991 199~ Tons % Tons % Tons % Tons % Tons %
Change Change Change Change Change
January 77,612 8.1 81,455 5.0 84,172 2.0 93,712 11.3 92,565 -1.2 February 73,465 12.2 79,227 7.8 78,045 -2.8 86,205 10.5 89,556 3.9 March 82,552 13.6 91,491 10.8 85,658 -7.4 90,468 5.6 101,677 12.4 April 76,379 12.9 79,549 4.2 88,073 9.3 86,126 -2.2 101,379 17.1 May 77,872 11.5 82,315 5.7 91,460 9.7 101,955 11.5 106,917 4.9 -,
June 75,089 8.8 78,643 4.7 92,701 16.3 95,312 2.8 108,787 14.1 July. .77,316, 13.5 '80,152 3.7 92,258 13.6 97,937 6.2 112,114 14.5 August 82,747 18.9 84,995 2.7 90,685 5.4 100,611' 10.9 , 109,491 8.8 September 77,467 11.5 80,169 3.5 89,107 9.7 93,623 5.1 111,429 19.0 October 79,386 11.1 82,790 4.3 93,941 11.7 99,787 6.2 109,781 10.0 November 76,173 1.1 77,303 1.5 93,320 18.8 94,279 1.0 109,421 16.1 December 80,906 5.2 81,502 0.7 93,037 11.8 93,590 0.6 112,236 19.9
Cumulative year to date January 77,612 8.1 81,455 5.0 84,172 2.0 93,712 11.3 92,565 -1.2 February 151,077 10.1 160,682 6.4 162,217 -0.4 179,917 10.9 182,121 1.2 March 233,629 11.3 252,173 7.9 247,875 -2.9 270,385 9.1 283,798 5.0 April 310,008 11.7 331,722 7.0 335,948 0.0 356,511 6.1 385,798 8.0 May 387,880 11.6 414,037 6.7 427,408 1.9 458,466 7.3 492,094 7.3 June 462,969 11.2 492,680 6.4 520,109 4.2 553,778 6.5 600,881 8.5 July 540,285 11.5 572,832 6.0 612,367 5.5 651,715 6.4 712,995 9.4 August 623,032 13.3 657,827 5.6 703,052 5.5 752,326 7.0 822,486 9.3 September 700,49~ 12.3 737,996 5.4 792,159 5.9 845,949 6.8 933,915 10.4 October 779,885 12.2 820,786 5.2 886,100 6.5 945,736 6.7 1,043,696 10.4 November 856,058 11.1 898,089 4.9 979,420 7.5 1,040,015 6.2 1,153,117 10.9 December 936,964 11.2 979,591 4.5 1,072,457 7.9 1,133,605 5.7 1,265,353 11.6
Average 78,080 10.6 81,633 4.5 89,371 7.9 94,467 5.7 104,482 10.5
Source: U.S. Bureau of Mines
22 The Primary Copper Industry of Arizona in 1992

Table 6. Average copper content of ore produced
[Copper content reported as percent of total copper. Percentage in parenthesis is approximate and not used to calculate weighted average. Leaders (--), no production. (UG), underground. (OP), open pit. (do.) ditto] Company 1M ine Ore type . 1983 1984 1985 1986 1987 1988 1989 1990 1991 1992
Arimetco Interna-tionallnc.
Emerald Isle Oxide 0.60 Johnson (1 Oxide 0.40 0.71 0.40 0.57
Asarco Inc. Mission Sulfide (0.75) (0.75) 0.65 0.70 0.67 0.73 0.70 0.72 0.72 0.62 Ray (2 do. 1 .. 19 1.13 "0-.99 0.99 0.89 1.00 0.97 .0 .. 88 0.84 0.76
do. Oxide 1.17 1.23 1.15 1.11 1.13 1.05 0.95 . 0.99 San Xavier Sulfide (0.51 ) (0.51 ) (4 (4 (4 (4 0.55 0.54 0.67 0.63
Cyprus Copper Co. Bagdad do. 0.50 0.45 0.44 0.45 0.48 0.45 0.49 0.53 0.44 0.42 Lakeshore Oxide (1.00) (1.00) Miami (5 Sulfide 0.53 0.55 0.60 0.54
do. Oxide 0.50 0.49 0.57 0.59 0.52 0.49 0.44 0.48 0.42 Sierrita (6 do. (0.30) 0.34 0.33 0.34 0.33 0.30 0.31 0.31 0.28 0.28
do. Oxide 0.15 0.18 Twin Buttes (7 Sulfide 0.57 3.39 1.90 0.99 0.99 0.95
Oxide 0.93 0.86 0.84 1.22 1.13 0.99 0.90 1.10
Magma Copper Co. Pinto Valley Sulfide 0.44 0.45 0.45 0.36 0.37 0.46 0.44 0.40 0.41 San Manuel UG do. 0.64 0.64 0.61 0.62 0.62 0.63 0.64 0.65 0.69 0.63 San Manuel OP do. 1.08 0.82
do. Oxide 0.58 0.64 0.61 0.56 0.55 0.59 0.63 Superior Sulfide 5.26 5.44 5.59
Oracle Ridge Mining Partners
Oracle Ridge do. 1.79 1.89
Phelps Dodge Corp. Morenci/Metcalf do. 0.73 0.81 0.86 0.84 0.82 0.88 0.79 0.74 0.78 0.67
do. Oxide 0.46 0.55 New Cornelia Sulfide 0.60 0.55
Weighted average (8 0.65 0.70 0.62 0.61 0.58 0.60 0.62 0.58 0.57 0.53
(1 Acquired from Cyprus, August, 1989. (2 Acquired from Kennecott, November 1 8, 1986. (4 Data for San Xavier included with Mission for 1985-1 988. (5 Acquired from Inspiration, July 1, 1988. (6 Acquired from Duval, April 1, 1986. (7 Ac"quired by Cyprus, March, 1 988. (8 Weighted average grade of ore based generally on assay of total copper.
The Primary Copper Industry of Arizona in 1992 23

Table 7. Percent contained copper recovered [Reported as percent of total copper. Percentage in parenthesis is an estimate.
Leaders (---), no production. (nd), no data. (do.), ditto]
Company/Mine Ore type 1983 1984 1985 1986 1987 1988 1989 1990 1991 1992
Arimetco Interna-tionallnc.
Emerald Isle Oxide 75 Johnson (1 do. 62 (62) 80 50
~-
Asarco Inc. Mission Sulfide 80 (80) 92 91 89 87 84 86 87 84 Ray (2 do. (70) 83 81 82 84 83 81 84 84 84
do. Oxide nd nd 64 59 62 61 60 -63 68 66 San Xavier Sulfide 79 (80) 83 82 84 81 79 79 81 (3
Cyprus Copper Co. Bagdad do. 83 92 91 93 90 91 84 70 87 90
do. Oxide 52 51 54 42 46 90 91 nd 93 Miami (4 Sulfide 86 80 76 66 69 93 91 48 63 Sierrita (5- do. (88) 89 92 91 89 87 86 87 87 88 Twin Buttes (6 Sulfide - 87 83 84 87 89
do. Oxide (80) 80 (80) 72 71 nd 100
Magma Copper Co. Pinto Valley Sulfide 88 80 84 82 84 82 86 84 90 San Manuel do. 86 90 90 90 85 86 82 85 89 91 do. Oxide 86 Superior Sulfide 94 97 95
Oracle Ridge Mining Partners
Oracle Ridge do. 82 76
Phelps Dodge Corp. Morenci/Metcalf do. 71 70 86 76 74 72 73 77 77 (73) New Cornelia do. 78 76
(1 Acquired from Cyprus, August, 1989. (2 Acquired from Kennecott, November 18, 1986. (3 San Xavier included with Mission for 1992. (4 Percent recovery by leaching since 1986. Acquired from Inspiration, July 1, 1988. (5 Acquired from Duval, April 1, 1987. (6 Recovery includes ANAMAX's share of Palo Verde 1983-1984. Acquired by Cyprus, March, 1989.
24 The Primary Copper Industry of Arizona in 1992

Table 8. Stripping ratios of open pit mines [Waste:ore. Leachable rock included with waste at some mines. Leaders (--), no data]
Company/Mine 1983 1984 1985 1986 1987 1988
Arimetco Interna-tionallnc.
Emerald Isle Johnson (1 0.03:1
Asarco Inc. Eisenhower (2 (3 0.57:1 1.26:1 Mission (3 2.52:1 1.32:1 0.74:1 0.84:1 1.05:1 2.02:1 Ray (4 2.72:1 . 2.11:1 2.27:1 ·2.12:1 1.99:1 2.10:1 Sacaton 0.35:1 0.10:1 San Xavier {·3 0.96:1 1.97:1 (5 (5 (5 (5 Silver Bell 1.09:1 1.17:1
Cyprus Copper Co. Bagdad 1.53:1 0.94:1 0.42:1 0.54:1 0.77:1 1.96:1 Miami (6 0.27:1 1.72:1 1.50:1 1.82:1 2.04:1 2.01 :1 Sierrita (7 0.33:1 0.76:1 0.55:1 0.19:1 0.40:1 0.67:1 Twin Buttes (8 1.14:1 34.60:1
Magma Copper Co. San Manuel 1.70:1 2.46:1 2.32:1 Pinto Valley 0.79:1 1.01 :1 1.21 :1 1.32:1 1.39:1
Phelps Dodge Corp. Morenci/Metcalf 0.64:1 0.90:1 0.68:1 0.76:1 1.10:1 1.13:1 New Cornelia 0.30:1 0.58:1
Weighted average 0.57:1 1.10:1 0.88:1 0.96:1 1.21 :1 1.49:1
(1 Acquired from Cyprus, August, 1989. (2 Mining was done by Asarco, includes ANAMAX's share of are. (3 Combined as Mission Complex in 1985. (4 Acquired from Kennecott, November 1 8, 1986. (5 Data for San Xavier included with Mission. (6 Acquired from Inspiration, July 1, 1988. (7 Sierrita and Esperanza acquired from Duval, April 1, 1 986. (8 Leased by Cyprus, March, 1988.
1989 1990 1991
1.41 :1 2.87:1 3.92:1 1.70:1 1.90:1 3.18:1
6.72:1 6.05:1 1.82:1
1.23:1 1.17:1 0.80:1 0.96:1 0.55:1 0.57:1 0.77:1 0.79:1 0.91 :1 8.37:1 4.38:1 2.15:1
2.45:1 1.80:1 1.20:1 1.53:1 1.27:1 1.46:1
1.22:1 1.81 :1 1.78:1
1.46:1 1.57:1 1.49:1
Source: "Minerals Yearbook - Area Reports: Domestic," U.S. Bureau of Mines; companies' annual reports; "E&MJ International Directory of Mining and Mineral Processing Operations;" Arizona Department of Mines and Mineral Resources; company submitted data beginning in 1985.
1992
0.67:1 1.16:1
2.53:1 2.40:1
1.12: 1
0.80:1 0.83:1 0.92:1 0.73:1
1.21: 1 1.30:1
1.86:1
1.26:1
The Primary Copper Industry of Arizona in 1992 25

Table 9. Production and value of copper, molybdenum, gold, and silver recovered from copper ore
Year Copper ore Copper (1 Copper (1 Molybdenum Gold Silver Value of copper. (tons) (lb./ton ore) (pounds) (1,000 Ibs.) (troy ounces) (troy ounces) gold. silver. and
(centsllb.) Value (2 Value Value (3 Value (4 molybdenum ($) ($1000) ($) ($ ) ($)
1972 165,914,825 10.22 1,695,858,000 27,126 102,526 6,614,957 50.617 858,392,446 46,791 5,987,518 11,143,226 922,314,190
1973 181,311,945 9.57 1,735,012,000 37,657 102,376 7,164,988 58.865 1,021,314,814 59,372 10,013,397 18,325,173 1,109,025,384
1974 178;913,296· 9.00 1,609,808,000 28,346 90,206 .6,308,721 76.649 1,233,901,735 57,067 14,488,424 29,701,332 1,335,158,491
1975 168,750,152 8.91 1,502,978,000 25,030 82,759 6,190,805 63.535 954,917,072 61,411 13,364,751 27,354,196 1,057,047,019
1976 194,136,559 9.85 1,912,430,000 31,073 97,961 7,308,395 68.824 1,316,210,823 89,148 12,276,473 31,816,805 1,449,452,101
1977 168,641,401 10.11 1,705,240,000 34,574 87,874 6,696,415 65.808 1,122,184,339 120,497 13,032,593 30,957,660 1,166,295,089
1978 178,204,491 10.20 1,817,670,000 33,029 92,508 6,611,781 65.510 1,190,755,617 150,142 17,905,108 35,709,502 1,244,520,369
1979 203,977,408 9.39 1,914,501,095 35,101 99,549 7,454,306 92.334 1,767,735,441 213,065 30,622,766 82,699,9.41 2,094,081,895
1980 169,650,401 8.97 1,521,850,812 36,299 71,533 5,640,703 101.416 1,543,400,219 324,150 43,814,606 116,376,559 2,027,741,384
1981 216,787,430 9.89 2,143,898,000 35,600 95,496 7,565,368 83.744 1,795,385,941 273,052 43,891,299 79,575,340 2,191,904,580
1982 146,124,870 11.62 1,697,500,000 22,099 61,050 6,301,000 74.31 1,261,415,000 100,673 22,949,000 50,090,000 1,435,127,000
1983 152,902,150 9.78 1,495,208,000 23,934 61,991 4,492,000 76.53 1,144,285,000 79,459 26,284,000 51,383,000 1,301,411,000
1984 145,278,431 10.89 1,582,549,000 23,184 51,548 4,093,000 66.00 1,044,483,000 78,827 18,591,200 33,320,000 1 , 1 75, 1 51 ,000
1985 159,547,970 11.14 1,778,334,456 30,428 52,053 4,885,000 65.60 1,166,571,000 98,827 16,585,000 30,007,000 1,311,990,000
1986 153,439,000 11.42 1,752,525,000 29,382 63,334 4,202,000 -.;..
66.05 1,157,543,000 75,607 23,370,000 22,987,000 1,279,507,000
1987 166,113,000 10.38 1,724,068,000 15,939 48,430 3,530,000 'v 79.52 1,370,924,000 51,802 21,694,000 24,745,000 1,469,165,000
1988 175,261,000 10.76 1,885,112,000 29,132 60,981 4,766,000 119.00 2,243,283,000 78,074 26,972,000 31,157,000 2,379,486,000
26 The Primary Copper Industry of Arizona in 1992

Table 9. Production and value of copper, molybdenum, gold, and silver recovered from copper ore - continued
Year Copper ore Copper (1 Copper (1 Molybdenum Gold Silver Value of copper, (tons) (lb./ton ore) (pounds) (1,000 Ibs.) (troy ounces) (troy ounces} gold, silver, and
(cents/lb. )(2 Value (2 Value Value (3 Value (4 molybdenum ($) ($1000) ($) ($) ($)
1989 196,684,000 10.22 2,009,782,000 29,795 44,959 5,312,000 129.01 2,592,723,000 99,545 17,283,000 29,367,000 2,738,918,000
1990 213,168,000 10.20 2,174,574,000 29,334 36,041 5,272,184 121.80 2,648,631,000 82,429 13,842,000 26,809,000 2,771,71.1,000
1991 258,646,597 8.76' 2,265,071,603. 35,051 51,248 4,735,187 (5 107.93 2,444,692,000 82,370 18,554,000 19,126,000 2,564,742,000
1992 .291,295,132 8.73 2,542,932,836 30,770 60,089 5,015,702 106.03 ' 2,696,272,000 67,017 20,655,000 19,743,000 2,803,687,000
(1 Excludes precipitate copper from dump and in-place leaching prior to 1 982. (2 E&MJ average annual price, U.S. producer cathode for 1972-88. Metals Week annual average
price, U.S. producer refiner for 1989 - 1992. (3 Handy and Harmon average annual gold price. (4 E&MJ average annual N.Y. market price for .999 fine silver for 1972-88. Metals Week's Handy
and Harmon annual average quotation for 1989-1 992. (5 1991 Silver and Total values are revised.
Source: Table 1, this publication; "State Mineral Summaries," U.S. Bureau of Mines.
Figure 5. Value of copper, molybdenum, gold, 3.00 and silver recovered from copper ore
2.50
en 2.00 c ~ B 1.50 en ~
~ "0 c 1.00
0.50
0.00
- - - -Years
The Primary Copper Industry of Arizona in 1992 27
I ,

Table 10. Nonfuel mineral production [(na), not available. (xx), not applicable]
1991 1992 Mineral Units Quantity Value Quantity Value
(thousands) (thousands)
Clays (1 short tons 251,781 $3,830 112,808 $463 Copper (2 short tons 1,128,845 2,468,255 1,271,220 2,731,152 Gem stones xx na 3,173 na 5,416 Gold (2, 3 troy ounces 199,174 72,362 213,995 73,818 Iron oxide pigments short tons 20 22 85 62 Sand and gravel (construction) (4 . short tons 22,500,000 79,400 33,842,000 123,517
Silver (2 troy ounces 4,758,304 19,212 5,304,865 20,873 Stone (crushed) (5 short tons 7,060,000 32,842 5,500,000 26,300 Combined value of cement, clays (bentonite 1992), gypsum (crude), iron ore (usable, 1991), lead (1991-92), lime, molybdenum, perlite, pumice, pyrites, salt, sand and gravel (industrial), stone (dimension), and tin (1992). xx xx 198,230 xx 184,337 Total (3 xx xx 2.877,326 xx 3,165,938
(1 Excludes certain kinds of clays for 1992; kind and value included with "Combined value" data. (2 Recoverable content of ores, etc. (3 Quantity and value for 1991 are revised. (4 Quantity and value for 1991 are estimates. (5 Quantity and value for 1 992 are estimates.
Source: "The Mineral Industry of Arizona in 1992," U.S. Bureau of Mines.
28 The Primary Copper Industry of Arizona in 1992

Table 11. Copper mine capacity in 1992
[Figures generally represent a current estimate of the production capacity of primary recoverable copper in concentrates, precipitates, and cathodes. Figures do not represent
smelter or refinery capacity. Capacities for closed operations are historic and may not be immediately available]
Mine/Company
Morenci/Phelps DodgeCorp. Ray / Asarco Inc. San Manuel/Magma Copper Co. Sierrita & Twin Buttes/Cyprus Copper Co. Mission/Asarco Inc. Bagdad/Cyprus Copper Co. Pinto Valley/Magma Copper Co. Miami/Cyprus Copper Co. New Cornelia/Phelps Dodge Corp. Superior/Magma Copper Co. Mineral Park/Cyprus Copper Co. Miami & No.2 tailings/Magma Copper Co. Christmas/Cyprus Copper Co. Oracle Ridge/Oracle Ridge Mining Johnson/Arimetco International Inc. Silver Bell/Asarco Inc. Van Dyke/Arimetco International Inc. Casa Grande/Cyprus Copper Co. Copper Queen/Phelps Dodge Corp. Total
Annual capacity Basis (tons copper)
389,000 Recent production figure 182,000 Design capacity & ore grade 164,000 Recent production figure 144,000 Recent production figure 120,000 Design capacity & ore grade 114,000 Recent production figure 90,000 Recent production figure 62,000 Recent production figure 40,000 Historic data 20,000 Company annual report and/or 10-K 17,000 Historic data 10,000 Recent production figure
8,000 Historic data 6,000 Design capacity & ore grade 5,000 Design capacity & ore grade 4,000 Leaching only 3,000 Design capacity & ore grade 3,000 Recent production figure 2,000 Leaching only
1,383,000
Source: Arizona Department of Mines & Mineral Resources' file data; companies' annual reports and form 10-Ks; professional publications.
The Primary Copper Industry of Arizona in 1992 29

Table 12. North Amercian copper smelter capacity in 1992
United States Asarco Inc.
Company Smelter
EI Paso Smelter Hayden Smelter Hayden-Ray Smelter
Chemetco Inc. Copper Range Co. Cyprus Copper Co.
Cyprus Miami Mining Corp. Kennecott Corpora"tion
Kennecott Utah Copper Magma Copper Co.
Smelting and Refining Division Phelps Dodge Corp.
Chino Mines Tyrone Branch
Total
Canada Falconbridge Ltd. Hudson Bay Mining and Smelting Co. Ltd. Inco Ltd. Noranda Mines Inc.
Gaspe Smelter Horne Smelter
Total
Mexico Campania Minera De Cananea, S.A. Industrial Minera Mexico, S.A. Mexicana De Cobre, S.A. De C. V. Total
North American total
Smelter location
EI Paso, TX Hayden,' AZ Hayden, AZ Alton, IL White Pine, MI
Claypool, AZ
Garfield, UT
San Manuel, AZ
Hurley, NM Playas, NM
Falconbridge, Ontario Flin Flon, Manitoba Copper Cliff, Ontario
Murdochville, Quebec Rouyn-Noranda, Quebec
Cananea, Sonora San Luis Potosi Nacozari, Sonora
Annual capacity (T ons of material)
450,000 720,000 360,000 150,000
70,000
408,.000
643,000
1,050,000
550,000 750,000
5.151.000
495,000 340,000
1,800,000
240,000 900,000
3.775.000
277,000 42,000
672,000 991,000
9.917.000
Source: "Non-ferrous Metal Data 1992," American Bureau of Metal Statistics Inc.
30 The Primary Copper Industry of Arizona in 1992
....

Table 13. United States copper production, by company [Copper content (tons) of mine production unless otherwise noted.
Leaders (--), no production. (na), not available]
Company 1988
Arimetco International Inc. (1 Asarco Inc. 206,000 Cominco American Inc.lDresser Minerals (2 1,671 Copper Range Co. (3 45,802 Cyprus Copper Co. 233,242 The Doe Run Company 22,936 Hecla Mining Co. (4 481
Apex'Mine Coeur Mine (5 . 47 Galena Mine (6 125 Lucky Friday Mine 309
Kennecott Corp. (7 245,000 Magma Copper Co. (8 2.00,753 Montana Resources 53,155 Oracle Ridge Mining (9 Phelps Dodge Corp. 494,500
Refiners (1 0 Asarco Inc. 484,700
(1 Data from Arimetco International Inc. annual reports. (2 Magmont mine. (3 Refined production.
1989 1990
2,254 235,700 266,400
1,489 1,586 52,061 51,104
293,451 312,102 20,220 13,261
460 250 45
50 43 129 113 281 49
244,000 251,000 214,388 232,458
39,634 37,245
500,500 548,400
492,800 482,400
(4 Includes Hecla's share of production from each mining property.
1991
4,858 279,900
1,385 59,498
313,498 10,894
423 na na .
248 175
251,000 259,493
47,421 2,241
518,100
492,800
(5 Operated by Asarco. Shows Hecla's share of 5%. Interest terminated in 1990. (6 Operated by Asarco. Shows Hecla's share of 25%. Interest terminated in 1992.
1992
8,950 338,400
1,653 68,539
322,500 8,773
239' na na
110 129
307,000 278,859
49,826 3,429
537,000
509,400
(7 Recoverable copper contained in concentrates and precipitates produced. Includes only Kennecott's share from jointly owned properties.
(8 Refined copper contained in concentrates produced and SX-EW production. (9 Data reported by company to Arizona Department of Mines and Mineral Resources. (10 The total for this concern is to a large extent a duplication of the reports of other producers.
Source: "Non-ferrous Metal Data 1992," American Bureau of Metal Statistics Inc., Arizona Department of Mines and Mineral Resources file data.
The Primary Copper Industry of Arizona in 1992 31

Table 14. Copper imports of the United States, by country [Copper content in short tons. Leaders (--), no data]
1988 1989 1990 1991 1992
Ores, Concentrates. Mattes & Cement 9,101 52,264 159,762 68,750 107,316
Canada 178 13,436 Mexico 6,822 47.581 142,236 52,926 38,286 Chile 34 3,931 924 Peru 55 66 Ireland 1 Monaco 76 Portugal 17,460 3,786 4,100 Sweden 661 United Kingdom 3 Indonesia 11,984 45,565 Philippines 4,983 Mozambique 12 Australia 2 Papua New Guinea 2,009 Other Countries 54 22
Blister & Anodes 108.505 85.117 48,806 66.537 64.161 Canada 207 2 2 21 Mexico 1,145 7,325 17,271 1,668 16,104 Chile 53,206 37,982 15,389 30,783 25,648 Peru 3,282 3.254 3,948 19,775 18,487 Germany 38 125 116 Sweden 4 Switzerland 2 Japan 32,150 24,580 3,854 13,088 127 Cote D'ivoire 5,647 Namibia 141 3,654 South Africa 9,815 Tanzania 1,088 Zaire 3,258 10,681 8,163 1,096
Refined Cathodes & Shapes 367,150 334.884 288.441 318.108 318.727 Canada 195,996 199,312 203,171 218,172 247,023 Mexico 46 181 81 2,216 Brazil 1,319 20,085 11,247 27,566 9,740 Chile 91,211 87,226 62,334 54,909 46,380 Peru 14,848 10,186 2,672 5,871 9,182 Venezuela 137 110 Austria 495 21 10 Belgium 1,396 82 Finland 441 332 Germany 5,573 310 170 301 674 Netherlands 5,567 2,680 4,043 Norway 390 61 761 Poland 714 i'
Portugal 1,091 Spain 3,530 242 1,108 Sweden 4,157 1,104 858 Switzerland 385 287 1 411 United Kingdom 21
32 The Primary Copper Industry of Arizona in 1992

Table 14. Copper imports of the United States, by country - continued [Copper content in short tons. Leaders (--), no data]
1988 1989 1990 1991 1992
Bahamas 67 152 Barbados 35 51 9 Bermuda 64 156 Cayman Islands 32 74 Costa Rica 146 168 119 227 Dominican Republic 962 1,177 1,174 1,515 1,596 Guatemala 137 346 290 319 190 Haiti 142 118 189 159 Honduras 107 68 537 570
. Jamaica 204 353 595 250 . 32'1 . Mexico 14,180 22,825 24,542 29,981 34,65"3 Netherlands Antilles 249 340 560 632 695 Nicaragua 195 709 750 Panama 739 935 735 1,060 739 St. Vincent 58 Trinidad 306 332 261 280 80 Brazil 83 6 Chile 1,992 3,690 214 42 16 Colombia 2,665 2,262 861 Guyana 18 365 480 46 Peru 144 600 631 Suriname 45 Uruguay 46 Venezuela 1,040 6,772 4,915 4,144 6,479 Belgium 1,675 1,577 Estonia 1,022 Finland 177 179 France 206 212 350 118 Germany 251 234 230 220 308 Italy 21 Netherlands 40 78 Portugal 33 31 60 Russia 328 Slovenia 378 Sweden 21 129 1,228 Switzerland 47 123 United Kingdom 290 302 138 893 2,884 China 82 150 Hong Kong 145 102 37 1,613 Indonesia 40 54 Israel 166 Japan 210 336 212 100 417 South Korea 95 Malaysia 47 267 306 366 Philippines 15 258 420 . Singapore 195 153 220 195 Taiwan 358 3,835 202 185 299 South Africa 28 82 Australia 153 136 Kiribati 41 Marshall Islands 163 15 Other Countries 813 219 854 296 498
The Primary Copper Industry of Arizona in 1992 33

Table.14. Copper imports of the United States, by country - continued [Copper content in short tons. Leaders (--), no datal
1988 1989 1990 1991 1992
Yugoslavia 2,199 China 845 71 153 Hong Kong 711 Japan 3 4,957 450 Syria 20 Niger 912 South Africa 1,985 1,193 830 165 Zaire 35,143 12,607 3,469 2,210 Zambia 689 . Australia 73 11 Other Countries 62 15 2 98
Copper Waste & Scrap 40,952 34,808 39,579 31,685 57,787 Canada 28,860 21,350 25,723 21,591 32,646 Bahamas 37 17 Barbados 72 56 80 43 71 Costa Rica 224 594 582 896 748 Dominican Republic 648 515 450 377 611 EI Salvador 106 303 16 Guatemala 205 267 491 242 629 Haiti 49 41 62 Honduras 53 38 57 203 381 Jamaica 194 207 363 621 632 Mexico 8,036 3,933 4,013 3,590 11,251 Antilles Netherlands 139 31 109 36 Nicaragua 370 Panama 977 703 655 433 902 St. Vincent 14 33 Trinidad 209 336 151 187 225 Brazil 194 Chile 79 5,296 4,024 1,111 2,763 Ecuador 52 Peru 164 Suriname 48 Venezuela 628 648 1,661 1,177 2,224 Estonia 654 Finland 64 16 France 119 Germ"any 111 325 Netherlands 304 466 85 759 Russia 580 Spain 1,249 United Kingdom 42 58 112 395 Japan 79 South Korea 48 7 Malaysia 61 69 Taiwan 27 Ghana 23 Other Countries 196 117 159 552 380
Copper Alloy Waste & Scrap (1 55,146 87,435 108,809 107,100 128,199 Canada 31,120 42,720 69,333 60,439 68,905
34 The Primary Copper Industry of Arizona in 1992

Table 14. Copper imports of the United States, by country - continued [Copper content in short tons. Leaders (--), no data]
1988 1989 1990 1991 1992
Master Alloys 889 743 1,017 742 936
Unwrought Alloys 11,547 4,487 1,506 2,785 13,302
Copper and Copper Alloy Imports Of Brass Mill Products (2
Strip, Sheet & Plate Copper 37,167 37,859 39,266 36,448 28,957 Copper Alloy 99,981 81,235 70,763 59,029 51,394
Foil Copper Copper Alloy 44,945 33,957 43,190 42,723 43,658
22,677 27,216 26,311 24,037 24,717 Wire Copper Alloy 25,028 22,143 22,353 18,661 21,460
Rod, Bar & Other Copper 31,474 29,617 31,155 25,580 33,899 Copper Alloy 74,634 75,622 61,137 44,345 44,703
Tube & Pipe Copper 91,924 72,896 46,565 28,822 24,984 Copper Alloy 59,493 66,882 57,430 51,209 55,058
(1 Copper alloy content. (2 Thousands of 'pounds.
Source:"Non-ferrous Metal Data 1992," American Bureau of Metal Statistics Inc.,
The Primary Copper Industry of Arizona in .1992 35

Table 15. Copper exports of the United States, by country [Copper content in short tons. Leaders (--), no data. (na), not available at time of publication]
1988 1989 1990 1991 1992
Ores. Concentrates, Mattes & Cement 239.438 304.288 287,597 267,161 293,469
Canada 9,367 15,212 20,604 44,126 59,113 Jamaica 197 Mexico 2,151 921 1,482 3,200 34,046 Brazil 18,335 15,675 40,372 1,705 Belgium 265 Bulgaria 5,026 6,492 5,701 C.I.S. -- 2,979 Finland 1,967 7,982 4,461 7,765 France 110 33 Germany 45,808 15,419 153 183 151 Italy 165 226 304 Spain 15 104 3,064 6,943 ' United Kingdom 555 575 372 456 Yugoslavia 6,211 China 10,316 4,028 19,539 42,287 15,265 Hong Kong 4 12,233 57 19 Indonesia 136 85 Israel 4 38 126 5 Japan 149,762 178,088 188,280 82,666 106,347 Korea, South 13,225 37,734 20,744 13,069 34,211 Malaysia 170 95 Philippines 3,511 4,117 3,089 19,676 16,847 Taiwan 3,291 9,605 64 2,977 27 Australia 251 185 43 9,233 Other Countries 40 100 78 178 117
Blister & Anodes 36,023 6,083 7,077 23,468 18,660 Canada 10,818 3,494 3,842 14,660 17,624 Mexico 584 139 218 55 25 Chile 472 Germany 5,421 42 21 109 Italy 5 52 Spain 1,164 59 87 United Kingdom 43 37 16 China 119 Hong Kong 740 627 759 607 87 Japan 18O 885 1,084 362 South Korea 16,279 30 81 2,079 42 Saudi Arabia 114 Singapore 217 122 127 2 9 Taiwan 588 606 893 4,584 250 Ghana 39 66 16 122 Australia 51 Other Countries 212 17O 74 29 72
Refined Cathodes & Shapes 64,574 147,106 232,769 298,211 208,424 Canada 4,238 5,215 2,236 2,075 9,403 Costa Rica 436 866 971 314 Dominican Republic 93 204 EI Salvador 108 129 265 12
36 The Primary Copper Industry of Arizona in 1992

Table 15. Copper exports of the United States, by country -' continued [Copper content in short tons. Leaders (--), no data. (na), not available at time of publication]
1988 1989 1990 1991 1992
Honduras 291 75 5 7 Mexico 9,409 8,097 6,214 7,939 4,927 Brazil 56 19 Chile 70 Venezuela 1,429 5,216 2,359 70 Belgium 234 21 2,442 337 175 France 1,660 760 1,567 1,316 958 Germany 1,456 1,430 1,068 2,043 1,145 Italy, 4,98.4 652 748 1,306 1,057 Netherlands 9,583 731 3,714 3,416 '1,899 Switzerland 137 249 115 81' 103 United Kingqom 2,729 1,197 1,090 1,937 500 China 3,905 15,727 3,911 15,278 49,777 Hong Kong 592 644 1,580 2,923 10,283 Indonesia 2,088 773 439 Japan 14,877 53,374 113,720 143,635 59,123 South Korea 6,755 1,374 8,668 13,326 884 Malaysia 512 880 17 Philippines 106 2 Singapore 1,410 1,328 1,580 4,070 457 Taiwan 1,776 53,729 72,930 87,425 61,319 Thailand 2,376 5,541 5,177 Egypt 168 Other Countries 155 130 268 310 174
Copper Waste & Scrap 132,025 170,789 153,907 144.749 111,531 Canada 32,159 41,956 55,651 36,363 29,612 Jamaica 44 Mexico 12,672 8,639 9,789 8,264 329 Brazil 655 892 846 400 190 Chile 140 Venezuela 337 20 Belgium 3,100 3,991 403 103 110 France 59 436 Germany 10,748 14,570 6,294 572 238 Italy 920 280 1,080 22 152 Netherlands 1,019 3,779 793 174 52 Norway 118 245 289 107 Spain 3,725 958 168 22 Switzerland 17 122 United Kingdom 2,547 1,354 969 91 39 China 470 6,666 8,592 25,213 26,312 Hong Kong 1,579 1,242 1,003 6,045 9,332 India 2,222 ' 1,203 434 652 107 Indonesia 456 39 313 35 Japan 17,780 22,411 19,622 26,149 28,055 South Korea 21,540 35,936 35,584 32,506 13,694 Malaysia 96 43 Pakistan 9() Philippines 133 44 25 Singapore 2,313 134 64 932 1,166 Taiwan 17,959 25,503 11,658 6,513 1,966
The Primary Copper Industry of Arizona in-1992 37

Table 15. Copper exports of the United States, by country - continued [Copper content in short tons. Leaders (--), no data. (na), not available at time of publication]
1988 1989 1990 1991 1992
Other Countries 145 100 149 47 99
Copper Alloy Waste & Scrap (1 220,405 234,284 203,677 193,207 159,723 Canada 26,023 33,069 11,073 16,670 19,403 Mexico 11,127 16,322 13,180 4,068 3,290 Trinidad 1,053 164 795 404 275 Brazil 649 1,964 251 1,402 720 Venezuela. 165 99 433 448 Belgium 9,607 6,466 6,820 . 3,775 3,364 Finland 2,296 France 770 837 644 241 56 Germany 23,133 44,054 15,353 2,670 1,111 Italy 2,148 5,458 12,966 1,630 1,135 Netherlands 1,229 3,347 4,821 250 488 Portugal 84 Spain 11,132 4,589 877 319 54 Sweden 1,780 2,319 3,605 860 1,733 Switzerland 59 9 United Kingdom 2,974 6,023 2,504 958 752 China 1,146 9,377 16,267 25,033 58,209 Hong Kong 227 1,581 3,693 7,579 7,919 India 14,533 28,169 36,232 14,694 15,873 Indonesia 747 541
Japan 18,988 20,558 31,667 47,175 13,044 South Korea 48,550 32,151 28,896 46,733 23,984
Pakistan 37 36 111 Philippines 92 Singapore 1,254 1,339 2,557 1,937 805 Taiwan 43,647 15,732 9,641 12,381 5,123
Thailand 118 145 516 917
South Africa 98 712 2
Australia 38 347 50
Other Countries 211 190 595 273 479
Master Alloys 1,034 631 762 747 1,335
Unwrought Alloys 8,695 6,651 9,459 9,499 8,986
Copper And Copper Alloy Exports of Brass Mill Products (2
Strip, Sheet & Plate Copper 1,903 7,504 15,550 13,477 14,218
Copper Alloy 34,526 18,526 32,193 31,802 27,852
Foil (3
Copper & Copper Alloy 5,074 3,694 6,318 6,257 12,727
Copper n.a. 1,069 1,592 4,929 8,582
Copper Alloy n.a. 2,625 4,726 1,328 4,145
Wire Copper Alloy 16,725 8,592 14,454 19,283 29,789
38 The Primary Copper Industry of Arizona in 1992

Table 15. Copper exports of the United States, by country - continued [Copper content in short tons. Leaders (--), no data. (na), not available at time of publication]
1988 1989 1990 1991 1992
Rod. Bar & Other Copper 5,183 34,603 27,846 24,130 Copper Alloy 24,480 50,430 54,171 44,416
Tube & Pipe Copper 17,078 44,702 35.270 43,053 Copper Alloy 20,618 9,436 11.163 12.431
Copper Exports of Copper Imports of the United States (4
Blister & Anodes Refined Cathodes & Shapes Copper Waste & Scrap Copper Alloy Waste & Scrap (1
(1 Copper alloy content. (2 Thousands of pounds.
10 2.261
523 609
13.291 286
2,184
2 1.714
431 1.054
692 336 806
(3 1 988 data combines copper and copper alloys as well as not backed and backed. 1989 separates copper and copper alloys and includes only not backed.
(4 Copper content.
Source:"Non-ferrous Metal Data 1992," American Bureau of Metal Statistics Inc.,
35,322 52,572
43,351 12,240
222 127 767
The Primary Copper Industry of Arizona in 1992 39

Table 16. Employment and wages in Arizona copper mining and smelting Year Employees (1 Total wages Annual wage Weekly wage Copper ore mined
(average number) (average) (average) (tons)
1948 11,493 41,318,524 3,595 69.13 39,072,204 1949 11,001 40,612,224 3,692 71.00 37,365,611 1950 10,181 41,994,321 4,125 79.33 41,757,273 1951 10,754 47,825,698 4,447 85.52 42,784,388 1952 11,365 54,950,235 4,835 93'.14 44,472,522 1953 12,068 62,742,982 5,199 99.98 45,187,838 1954 12,502 65,518,853 5,241 100.79 43,072,894 1955 12,399 71,293,263 5,750 110.58 52,189,728 1956, ' 14,008 ' 83,568,996 5,966 114.73 . 60,468,580 1957 14,652 85,125,320 5,809 111.71 ' 59,571,834 1958 14,100 74,726,972 5,300 101.93 56,255,809 1959 11,568 72,095,130 6,232 119.85 53,121,545 1960 13,764 90,312,848 6,562 126.19 66,032,439 1961 14,275 97,271,286 6,814 131.04 71,918,991 1962 14,408 101,920,108 7,074 136.04 78,868,147 1963 14,303 104,291,588 7,292 140.23 80,615,132 1964 14,720 113,792,031 7,730 148.65 86,132,039 1965 15,239 122,163,124 8,016 154.16 92,859,535 1966 17,018 137,187,611 8,061 155.02 101,558,298 1967 13,426 108,427,206 8,076 155.31 74,289,203 1968 15,734 136,089,579 8,649 166.33 101,293,963 1969 19,459 173,183,018 8,900 171.15 127,848,828 1970 21,479 201,665,064 9,389 180.56 150,241,000 1971 21,231 211,978,597 9,984 192.00 149,294,000 1972 23,233 254,717,341 10,964 210.85 165,914,825 1973 25,494 291,294,328 11,426 218.89 181,311,945 1974 27,894 340,832,096 12,219 234.98 178,913,296 1975 25,950 363,349,178 14,002 269.27 168,750,152 1976 25,631 405,289,034 15,812 304.08 194,136,559 1977 23,373 398,539,789 16,835 323.75 168,641,401 1978 21,092 397,790,419 18,860 362.69 178,204,491 1979 23,239 494,963,476 21,299 409.60 203,997,408 1980 21,602 510,168,454 23,617 454.17 169,650,401 1981 26,031 687,434,789 26,408 507.85 216,787,430 1982 17,182 487,415,292 28,368 545.53 135,768,647 1983 13,864 395,266,852 28,510 548.29 135,301,652 1984 12,556 387,028,537 30,824 592.77 145,278,431 1985 11,155 349,311,047 31,314 602.19 174,218,218 1986 10,848 326,915,975 30,136 579.54 167,808,000 1987 10,340 299,297,407 28,946 556.65 166, 113,000 1988 10,588 348,502,604 33,008 634.78 175,261,000 1989 11,111 383,199,684 34,488 663.23 196,684,000 1990 11,352 411,433,093 36,243 696.99 213, 168,000 1991 12,369 462,827,195 37,418 719.58 258,646,597 1992 12,508 511,037,850 40,012 785.71 291,295,132
1) Reported as" Covered Employment" that by law includes all employees of employers of three or more persons. Prior to 1966 only a portion of the workers rn smelting, refining, and rod fabrication were included in this table.
Source: Table 17, this publication; "Minerals Yearbook - Area Reports: Domestic," U.S. Bureau of Mines; Research and Statistics Unit, Arizona Department of Economic Security.
40 The Primary Copper Industry of Arizona in 1992

$56,457,000 Retained for
future investment
$490,735,000 Direct personal
income
Figure" 6. Direct and indirect impact of the copper industry on the Arizona economy - 1992
$2,702,062,000 VALUE OF
COPPER INDUSTRY OUTPUT
$915,692,000 $1,729,913,000
Labor, services, and products bought and taxes paid
To workers, suppliers, government, and investors outside of Arizona
$1,121,679,000 Direct business income
Ripple Effect Circulation and recirculation of the direct impact of copper industry spending creates a "ripple effect" that expands the direct economic impact to a total
that is four times greater than the direct impact.
TOTAL IMPACT:
$6,557,955,000
... -$117,499,000
Direct governmental revenues
Source: Learning, G.F., 1992, "The Copper Industry's Impact on the Arizona Economy
The Primary Copper Industry of Arizona in 1992 41

Table 17. Arizona employment and wages in 1991, by industry Industry Employees Total wages Annual wage
(average number) (average)
Copper mining 10,194 423,649,777 41,558.74 Copper smelting and refining 2,005 77,764,200 38,785.14 Copper rod fabrication 309 9,623,873 31,145.22 Total copper mining and processing 12,508 511,037,850 40,856.88
Other mining, quarrying and processing 2,477 88,545,413 35,747.04 All mining quarrying and processing 14,985 599,583,263 40,012.23
Manufacturing except copper processing 169,546 5,415,852,279 31,943.26 Construction 79,783 1,869,127,644 23,427.64-Transportation and utilities 73,822 2,185,176,649 29,600.62 Wholesale trade 76,779 2,277,401,616 29,661.78 Retail trade 300,395 4,078,541,172 13,577.26 Finance, insurance, and real estate 94,441 2,731,850,421 28,926.53 Services and miscellaneous 407,758 8,874,173,379 21,763.33 Agriculture, forestry, and fishing 35,862 481,431,862 13,424.57 Federal, state; and local government 276,455 6,926,091,993 25,053.23 Total and averages 1,529,826 35,439,230,278 23.165.53
(1 Includes all employees covered by Arizona employment security laws.
Source: Research Administration, Arizona Department of Economic Security.
Figure 7. Average weekly wages by industry
Copper mining
Copper smelting, refining
Rod fabrication
Total copper mining
598.95
Weekly wage (average)
799.21 745.87 598.95 785.71
687.44 769.47
614.29 450.53 569.24 570.42 261.10 556.28 418.53 258.16 481.79 445.49
799.21
7 745.8
7 85.71
Other mining
All mining
687.44
Manufacturing
Construction
Transportation and utilities
Wholesale trade
Retail trade
Finance, ins., real estate
Services and miscellaneous
Agriculture
Government
Average 1
I I
261.10
258.16
450.53
418.53
481.79
445.49
76 9.47
614.29
569.24
570.42
556.28
0.00 100.00 200.00 300.00 400.00 500.00 600.00 700.00 800.00
42 The Primary Copper Industry of Arizona in 1992

Table 18. Employment, earnings, and hours in copper mining in the United States and Arizona
[These statistics do not reflect workers in copper smelting, refining, and rod fabrication]
All emQlo~ees Production workers Average number Average number Weekly eamings (4 Weekly hours Hourly earnings (5
(thousands) (thousands) (average) (average) (average)
Year AZ (1 U.S. (2 AZ (3 U.S. (2 AZ U.S. AZ U.S. AZ U.S.
1970 18.8 37.0 14.9 29.5 173.01 175.67 43.8 44.7 3.95 3.93 1971 18.9 34.7 14.9 26.8 178.50 178.46 42.4 42.9 4.21 4.16 1972 20.5 38.9 16.1 30.7 194.69 192.19 41.6 41.6 4.68 4.62 1973· 21.5 42.3 17.6 33.7 206.75 206.42 41.6 42.3· 4.97 4.88 1974 24~0 42.8 19.1 33:8· 222.16 226.46 39.6 41.1- 5.61 5.51 1975 22.5 37.1 17.9 28.4 247.43 247.14 38.6 39.2 6.41 6.33 1976 21.7 35.5 17.2 27.0 286.31 280.70 40.1 40.1 7.14 7.00 1977 19.3 35.1 15.3 26.9 302.99 288.73 39.4 38.6 7.69 7.48 1978 17.2 35.2 13.7 26 .. 9 344.76 338.40 40.8 40.0 8.45 8.46 1979 19.3 31.9 15.3 24.6 404.81 405.03 42.3 42.5 9.57 9.53 1980 17.7 29.4 14.0 22.6 446.19 435.01 41.7 41.0 10.70 10.61 1981 21.9 36.2 17.4 27.9 497.28 492.54 41.2 41.6 12.07 11.84 1982 15.2 25.3 12.1 18.5 495.60 484.91 38.3 38.7 12.94 12.53 1983 11.3 18.9 9.0 13.5 519.25 522.69 39.1 39~9 13.28 13.10 1984 10.5 16.3 8.2 11.4 553.83 562.74 41.3 41.5 13.41 13.56 1985 9.4 13.1 7.5 9.4 573.80 574.76 41.4 42.2 13.86 13.62 1986 8.7 11.4 6.9 8.8 582.38 507.99 40.4 41.3 14.42 12.30 1987 8.6 13.5 6.9 10.7 556.65 492.20 40.1 43.1 13.88 11.42 1988 8.8 14.4 7.0 11.2 517.74 510.12 41.3 43.9 12.53 11.62 1989 9.5 14.1 7.5 11.2 561.26 540.44 43.4 45.8 12.94 11.80 1990 10.0 15.1 7.9 12.3 599.84 569.09 43.7 45.6 13.72 12.48 1991 (8 11.1 15.8 8.8 13.0 648.68 610.55 43.8 45.7 14.81 13.36 1992(9 10.2 16.5 8.1 13.5 653.60 616.82 43.4 44.6 15.06 13.83
(1 These figures are estimates made by the Arizona Department of Economic Security in cooperation with the U.S. Bureau of Labor Statistics.They include all full-time and part-time wage and salary workers who are employed in copper mining in any part of the pay period that included the 12th of each month of the year.
(2 Estimates made by the U.S. Bureau of Labor Statistics in cooperation with the 50 states, and based upon monthly samplings similar to those in (1 above, adjusted periodically to census bench mark.
(3 Estimates of production (non-supervisory) workers based upon samplings as in (2 above. Since 1975 figures have been calculated by the Arizona Department of Mines and Mineral Resources dividing the annual number of "All Employees in Arizona" by a factor of 1.26. This factor was derived by comparing the annual number of "All Employees-Arizona" with "Production Workers - Arizona" from 1 970 to 1 974. Last checked in 1 992.
(4 Weekly earnings figures are the product of hourly earnings and weekly hours for that year. (5 Gross payroll aggregates, exclusive of irregular bonuses and other pay not earned in a sample pay period,
are divided by gross man-hour aggregates of production and related workers for the period in order to determine hourly earnings.
(6 Weekly earnings times 52 weeks. (7 Product of the number of production workers, weekly hours, and 52 weeks. (8 Arizona production worker's average number, aggregate hours and productivity figures for 1991 are revised. (9 Quantity of copper ore mined - U.S. in 1992 is an estimate.
Source: Table 1 this publication, American Bureau of Metal Statistics Unit, Arizona Department of Economic Security, Mineral Yearbook - Metals, Minerals," U. S. Bureau of Mines. "Employment and· Earnings, " U.S. Dept. of Labor, Bureau of Labor Statistics, March issues, U.S. Dept. of Interior.
The Primary Copper Industry of Arizona in ·1992 43

Year
1970 1971 1972 1973 1974 1975 1976 1977 1978 1979 1980 1981 1982 1983 1984 1985 1986 1987 1988 1989 1990 1991 1992
-~ :::l 0
.r::. -c: 0 ~ Q) ~
0
Table 18. Employment, earnings, and hours in copper mining in the United States and Arizona - continued
Production workers Annual earnings (6 Aggregate hours (7 Copper ore mined Copper produced
(thousands) (thousand short tons (recoverable content, thousand pounds)
AZ U.S. AZ U.S. AZ U.S. AZ U.S.
8,997 9,135 33,936 68,570 150,241 257,729 1,826,734 3,368,957 9,282 9,280 32,852 59,785 149,294 242,656 1,633,568 2,986,599
10,124 9,994 34,827 66,410 165,815 266,831 1,816,118 3,264,113 1,0/751 1.0,734 ' 38,072 74,127 173,605 289,998 1,847,635 3,386,357 11,552 ' 11,776 39,331 72,237 178,821 293,443 ' 1,710,744 3,145,148 12,866 12,903 35,929 57,891 168,656 263,003 1,619,535 2,772,111 14,888 14,596 35,865 56,300 194,046 283,736 2,043,168 3,166,889 15,755 15,014 31,347 53,994 168,601 259,974 1,843,949 2,964,539 17,928 17,597 29,066 55,952 178,201 263,722 1,965,072 2,955,210 21,050 21,061 33,654 54,366 203,977 291,078 2,085,556 3,140,110 23,202 22,621 30,358 48,183 169,650 241,090 1,669,495 2,527,920
.. 25,859 25,612 37,278 60,353 216,787 306,089 2,294,437 3,354,548 25,771 25,215 24,098 37,229 146,125 200,589 1,697,500 2,507,070 27,001 27,180 18,299 28,01 ° 152,902 196,203 1,514,538 2,288,612 28,799 29,002 17,610 24,601 145,278 189,499 1,583,505 2,405,866 29,838 29,888 16,146 20,627 174,218 239,399 1,778,334 2,443,675 30,284 26,415 14,496 18,899 167,808 186,105 1,752,525 2,361,127 28,946 25,595 14,388 23,981 166,113 219,545 1,724,068 2,810,182 26,932 26,526 15,033 25,567 175,261 246,380 1,885,112 3,168,229 29,186 28,103 16,926 26,674 196,684 261,534 2,009,782 3,303,002 31,177 29,593 17,952 29,166 213,168 275,024 2,174,574 3,477,904
' 33,731 31,749 20,042 30,893 258,647 305,221 2,265,072 3,595,930 33,987 32,075 18,280 31,309 291,295 326,539 2,542,932 3,891,404
Figure 8. Worker productivity - ore mined
16.000
14.000 I 12.000
10.000
8.000
6.000
4.000
2.000 • AZ ~U.S.
0.000 o N M ~ ~ ~ ~ 00 m 0 - N M ~ ~ ~ ~ 00 m 0 N ~ ~ ~ ~ ~ ~ ~ ~ ~ ~ 00 00 00 00 00 00 00 00 00 00 m m m m m m m m m m m m m m m m m m m m m m m m m m
44 The Primary Copper Industry of Arizona in 1992

Year
1970 1971 1972 1973 1974 1975 1976 1977 1978 1979 1980 1981 1982 1983 1984 1985 1986 1987 1988 1989 1990 1991 1992
-~ :l 0
.s::. -..a -... Q) c. c. 0 u
Table 18. Employment, earnings, and hours in copper mining in the United States and Arizona - continued
Worker I!roductivirl Recovered grade Ore mined/hour Copper produced/hour (lb. Culton ore) (tons) (lb.)
AZ U.S. AZ U.S. AZ U.S.
12.16 13.07 4.427 3.759 53.829 49.132 10.94 12.31 4.544 4.059 49.725 49.996 10.95 12.23 4.761 4.017 52.161 49.151 10.64 11.68 4.872 3.912 48.530 45.683
9.57 10.72 4.547 4 .. 062 43.496 43.539 9.60 10.54 4.694 4.543 45.076 47.885
10.53 11.16 5.410 5.040 56.968 56.250 10.94 11.40 5.379 4.815 58.824 54.905 11.03 11.21 6.131 4.713 67.607 52.817 10.22 10.79 6.061 5.369 61.971 57.759
9.84 10.49 5.588 5.004 54.994 52.465 10.58 10.96 5.815 5.072 61.549 55.582 11.62 12.50 6.064 5.388 70.442 67.342
9.91 11.66 8.356 7.005 82.766 81.707 10.90 12.70 8.250 7.703 89.921 97.795 10.21 10.21 10.790 11.606 110.141 118.470 10.44 12.69 11.576 9.847 120.897 124.934 10.38 12.80 11.545 9.155 119.827 117.189 10.76 12.86 11.658 9.637 125.398 123.918 10.22 12.63 11.620 9.805 118.739 123.828 10.20 12.65 11.874 9.430 121.133 119.245
8.76 11.78 12.905 9.880 113.016 116.400 8.73 11.92 15.935 10.430 123.910 124.290
Figure 9. Worker productivity - copper
140.000
120.000
100.000
80.000
60.000
40.000
20.000 • AZ -D-- U.S.
0.000 o .- N M ~ La co '" co 0') 0 .- N M ~ La co '" co 0') 0 .- N '" '" '" '" '" '" '" '" '" '" co co co co co co co co co co 0') 0') 0') 0') 0') 0') 0') 0') 0') 0') 0') 0') 0') 0') 0') 0') 0') 0') 0') 0') 0') 0') 0') 0') 0') 0')
.- .- .- - - - - - -
The Primary Copper Industry of Arizona in 1992 45

Table 19. Reimed copper inventories [Figures are end of year in thousand short tons]
Location 1985 1986 1987 1988 1989 1990 1991 1992
U. S. refineries 150.4 145.1 63.1 42.9 56.4 52.1 41.6 29.5 Comex warehouses 120.3 93.3 18.3 13.4 16~3 20.2 33.7 105.9 Total U.S. 270.7 238.4 81.4 56.3 72.7 72.3 75.3 135.4
Refineries elsewhere 293.7 280.6 202.6 265.0 243.3 239.4 274.1 409.0 LM E warehouses 209.1 193.1 58.3 72.5 119.0 200.1 366.3 348.1 Total elsewhere 502.8 473.7 260.9 337.5 362.3 439.5 640.4 757.1
Aggr~gate Inventories 773.5 712.1 342.3 393.8 435.0 511.8 715.7 892.5
Source: "Non-ferrous Metal Data 1992," American Bureau of Metal Statistics Inc.
Figure 10. Reimed copper inventories
900.0
800.0
700.0 en c: 600.0 0 ....
"C 500.0 c: co
400.0 en :::J 0 300.0 J: t-
200.0
100.0
0.0 1985 1986 1987 1988 1989 1990 '991 1992
46 The Primary Copper Industry of Arizona in 1992

Table 20. Average monthly price of cathode copper [Prices are Metals Week U.S. producer delivered centsllb. through July 1992.
Begining August 1992 prices are U.S. producer cathode centsllb.]
1983 1984 1985 1986 1987 1988 1989 1990 1991 1992
January 80.219 68.792 64.487 69.881 64.986 132.496 152.770 108.644 114.614 100.723 February 84.024 70.748 66.446 68.253 65.525 105.025 140.211 111.260 115.012 105.028 March 82.072 75.311 65.547 70.144 68.071 109.720 148.492 128.414 113.953 106.183 April 83.493 77.388 70.318 68.801 67.129 103.641 143.486 126.936 113.127 104.738 May 85.634 72.229 69.864 67.082 70.985 104.373 127.146 124.574 105.574 104.925 June 81.836 69.849 67.094 67.471 74.346 114.275 115.901 117.346 103.877 109.102 July 82.947 64.402 66.773 63.815 80.419 104.848 113.487 126.115 104.344 118.650 August 80.542 64.535 66.284 62.374 82.183 101.451 127.430 134.960 '105.969 117.140 September 77:587 63.408 65.716 64.844 . 85.607 116.120 138.439 134.215 . 111. 1 09 112.495 October 73.392 62.039 66.680 63.464 88.253 138.048 131.659 130.182 111.336 105~1 54 . November '69.581 65.650 66.294 62.855 108.528 152.320 118.109 119.762 110.034 101.390 December 70.805 63.538 68.025 63.630 133.339 161.270 109.216 115.611 102.972 103.544
Annual 79.344 68.157 66.961 66.051 82.448 120.299 130.529 123.168 109.327 107.423 average.
Source: Metals Week.
Figure 11. Average annual copper prices
140
120
"C 100
c: ::l 80 0 ~ -en 60 .... c: Q) u
40
20
0 1983 1984 1985 1986 1987 1988 1989 1990 1991 1992
The Primary Copper Industry of Arizona in 1992 47

Table 21. Fmimated copper production costs for the United States [Cents per pound of copper. Data may not add to totals shown due to rounding. (na), not available]
Product costs 1983 1984 1985 1986 1987 1988 1989 1990 1991
Mine operating cost 22 20 23 23 19 18 Mill-float operating cost (2 24 23 20 21 28 28 Mill-leach operating cost 7 7 (3 (3 (3 (3 Smelt/refine/transportation 26 24 23 19 14 17 Taxes (4 3 2 2 2 2 1 Total cost 82 76 68 65 63 64
Byproduct credits -13 -11 -9 -9 -10 -10 Cash cost (5 69 65 59 56 53 54
Recovery of capital na na na 11 5 7 Total na na na 67 58 61
(1 Includes 18 mines, most of which were producing from 1983 to 1990. (2 Includes copper recovered by leaching in 1985 et.seq. (3 Mill-leach costs after 1984 included in mill-float operating costs. (4 Property, severance taxes, and royalties, if applicable.
17 17 27 27 (3 (3 18 18
1 1 63 63
-9 -10 54 53
6 6 60 60
(5 Includes all cash cost of production and credit for byproducts but excludes depreciation and profit. Costs are in actual dollars for each year shown.
Source: "Minerals Yearbook,. Metals & Minerals," U.S. Bureau of Mines.
Figure 12. Copper price in constant 1992 dollars
na na na na na na
na na
na na
250 -----------1 -----1992$ ---D--- Historic Price ~._. __ .m_. ___ _
-.-.......... -.-.-............... -...... -..... -............. - -·-·························-·····ft······ ...... -... -................. -.................. -....... . .. . ._.--.T._._._._ ............ _._._._ ............... _. .- ......... ._._.-._ ............ _._._.-... . ....... _.-
200
"'C C ::l 150 0 c.
~/:Y............-..........-.-.-.-.... ...... ..-. ... Q) C. en
100 ~
c Q) (J
50
Source: "Non-ferrous Metal Data 1992," American Bureau of Metal Statistics. Inc.
48 The Primary Copper Industry of Arizona in 1992
1992
na na na na na na
na na
na na

Table 22. Copper reserve base in 1992 [Reserve base is that part of an identified resource that meets specified minimum physical and chemical criteria related to current mining and production practices, including those for grade, Quality, thickness, and depth. The reserve base is the in-place demonstrated (measured plus indicated) resource from which reserves are estimated. It may encompass those parts of the resources that have a reasonable potential for becoming economically available within planning horizons beyond those that assume proven technology and current economics. The reserve base includes those resources that are currently economic (reserves), marginally economic (marginal reserves), and some· of those that are currently subeconomic (subeconomic resources). Defintion from "Mineral Facts and Problems" 1985 edition, U.S. Bureau of Mines, Bulletin 675, page 31
Deposit Company Mineral Million % Cu Source/comments Location type tons
Antler' T17N R16W S. 4
Atlas TllS R8E S. 32
Bagdad T14N R9W S. 4
Buckeye East T3S R12E S. 26
Carlota T1N R13E S. 36
Casa Grande T6S R5E S. 18
Casa Grande (Lakeshore)
Tl0S R4E S. 25
Chilito T4S Rl 5E S. 22
Christmas T4S R16E S. 30
Cochise T23S R24E S. 9
Copper Basin T13N R3W S. 20
Copper Butte T3S Rl 3E S. 30
Copper Creek T8S R18E S. 11
Standard Metals Sulfide Corp.
Asarco Inc. Sulfide
Cyprus Copper
Co.
Asarco Inc.
Acid Soluble Sulfide Acid Soluble
Sulfide
Acid Soluble
Cambior USA Inc. Acid Soluble
Asarco & Freeport Mixed McMoran JV.
Cyprus Copper Co.
Asarco Inc.
Cyprus Copper Co.
Phelps Dodge Corp.
Phelps Dodge Corp.
Asarco Inc.
Magma Copper Co.
Sulfide Sulfide Acid Soluble
Mixed
Sulfide Sulfide
Acid Soluble
Sulfide
Acid Soluble
Sulfide
5.0 1.95 Annual report & form 10-1<, .1987. With 4.13% Zn, 0.94% Pb, and 1 .. 05.Ag oz/ton. An additional 2.5 million tons reported in 1979 annual report.'
5.4 0.64 "Report on the BS&K Project" by Buchella, F. 4.9 0.4 Sulfide cutoff 0.40%. Acid Soluble cutoff 0.20%.
18.9 0.7 Asarco property adjacent to Atlas. 12.1 0.4 Asarco property adjacent to Atlas.
1231.0 0.37 Cyprus Minerals form 10-K, 1992. Includes proven and probable. With 0.022% Mo.
20.0 0.65 "Arizona Wilderness 1988", Arizona Mining Association, Report A-23. 40 million possible.
106.0 0.45 Cambior's Carlota fact sheet August, 1993. Includes Cactus and Eder deposits.
352.0 1.00 Getty Oil Co. annual report, 1980. With 0.01 % Mo. Cutoff at 0.5% Cu.
41.0 0.71 Porphyry - Noranda annuaJ report, 1984. 9.0 1.35 Tactite - Noranda annual report, 1984.
15.5 0.76 Cyprus Minerals form 10-K, 1992.
74.7 0.51 Chilito Mines Report. With 0.01 % Mo and 0.04 ozlton Ag.
7.0 0.63 Inspiration Resources form 10-K, 1983. Open pit. 20.0 1.82 Underground.
210.0 0.40 Phelps Dodge annual report, 1 992.
70.0 0.5 Phelps Dodge annual report,1992. With 0.021 % Mo.
22.0 1.1 "Arizona Wilderness 1 988," Arizona Mining Association, Report A-23.
80.0 0.55 Unpublished estimate.
The Primary Copper Industry of Arizona in 1992 49

Table 22. Copper reserve base in 1992 - continued Deposit Company Mineral Million %Cu Source/comments Location type tons
Copper Queen Phelps Dodge Mixed 1.0 5.50 Phelps Dodge prospectus, May 8, 1975. T23S R24E S. 9 Corp. Underground, contains significant gold resource.
Dos Pobres Phelps Dodge Sulfide UG 230.0 0.9 Phelps Dodge annual report,1992. T5S R26E S. 27 Corp. Mixed OP 270.0 0.5 Open pit reserves are recoverable by leaching".
Dragoon Sullivan, James Acid Soluble 25.0 0.50 Unpublished estimate. T16S R22E S. 25
" Dynamite Smith, Addison Mixed 100.0 0.53 Unpublished estimate. T17S R13E S. 30
Emerald Isle Arimetco Interna- Acid Soluble 1.8 0.72 Arimetco International annual report, 1991. T23N R18W S. 22 tionallnc.
Esperanza Cyprus Copper Sulfide 48.0 0.27 Pennzoil form 10-K, 1981. With 0.034% Mo. T18SR12ES.16 Co.
Four Metals Duerr & Prochnav Sulfide 14.0 0.7 Personal communication. T23S R16E S. 20
Gibson Lodestar Minerals Acid Soluble 10.8 0.7 Fletcher, J.B. et al report August, 1984.
T1SR14ES.21 Inc. Geologic potential.
Helvetia Asarco Inc. Sulfide 362.0 0.61 SME Preprint 92-61 by Anzalone and Brown.
T18S R15E S. 36 Acid Soluble 66.0 0.53 Sulfide includes 0.25 ~z/ton Ag and 0.016% Mo.
1-10 Sullivan, James Mixed 100.0 0.52 Unpublished estimate; with 0.02% Mo.
T15S R23E S. 31
Iron Door Unknown Sulfide 63.0 0.4 Spike-E Hills Report. Cutoff at 0.20% Cu.
T13S R25E S. 17
Johnson Arimetco Interna- Acid Soluble 4.0 0.40 Arimetco International annual report, 1 992.
T1 5S R22E S. 26 tionallnc. Acid Soluble 12.0 0.2 Burro Chief deposit. Copper Chief deposit.
Kalamazoo Magma Copper Sulfide 17.0 0.72 Magma Copper form 10-K, 1992.
T9S R16E S. 9 Co. Sulfide 143.0 0.71 Resource below 2950 level of deposit.
Kay Copper Rayrock Mines Sulfide 6.0 2.20" Northern Mines Handbook 1990-1. With 3% Zn,
T8N,R2E,S.4 Inc. 1.6 oz/ton .Ag and 0.08 oz/ton Au.
Korn Kob Keystone Minerals Acid Soluble 18.0 0.40 Reported by Keystone Minerals from 1990
T12S R17E S. 14 Inc. drilling by A. F. Budge.
Lone Star Phelps Dodge Acid Soluble 1600.0 0.38 Phelps Dodge annual report, 1 992.
T6S R27E S. 5 Corp.
Lonesome Pine Corn, Russ Mixed 20.0 0.4 Geologic potential based on partially tested
T1SR14ES.14 chalcocite/oxide zone.
50 The Primary Copper Indus~ry of Arizona in 1992

Table 22. Copper reserve base in 1992 - continued Deposit Company Mineral Million %Cu Source/comments Location type tons
Mame Hope Mining & Acid Soluble 1.4 1 .10 Unpublished estimate. Tl 9S R25E S. 20 Milling Co.
Miami Cyprus Copper Acid Soluble 320.0 0.44 Cyprus Minerals form 10-K, 1992. T1N R14E S. 25 Co. Includes proven and probable reserves.
Miami East/Miami Magma Copper Sulfide 6.0 3.14 Newmont Mining annual report, 1985.
T1N R15E S. 19 Co. Sulfide 50.0 1.95 USBM Minerals Yearbook 1973, Area Reports. Mixed Unquantified. In situ production 10MM Ib.annually
Miami Tailings Magma Copper Acid Soluble 25.2 0.4 Magma form 10-K, 1992. 54 % recovery T1N R15E S. SO Co. expected.
Mineral Butte U.S. Government Mixed 14.6 0.4 Withdrawn from mineral entry. T4S R7E S. 1
Mineral Park Cyprus Copper Acid Soluble 14.4 0.24 Cyprus Minerals form 10-K, 1 992. T23N R17W S. 19 Co.
Mission Asarco Inc. Sulfide 564.9 0.67 Asarco annual report, 1992. T16SR12ES.31 With 0.14 oz/ton silver.
Morenci Phelps Dodge Sulfide 583.0 0.76 Phelps Dodge annual report, 1992. Milling reserve T4S R29E S. 16 (85%) and Acid Soluble 861.2 0.3 Leaching reserves.
Sumitomo (15%) Sulfide 150.0 0.72 Western Copper. Sulfide 180.0 0.71 Coronado deposit. Acid Soluble 300.0 0.29 Coronado deposit.
New Cornelia Phelps Dodge Sulfide 160.0 0.56 Phelps Dodge annual report, 1992. T12S R6W S. 27 Corp.
Oracle Ridge Oracle Ridge Mixed 4.0 2.23 South Atlantic Ventures annual report, 1 990. With Tl lS R16E S. 16 Mining Partners 0.67 oz/ton Ag. Additional 4.4 million tons pOSSe
Peach Elgin Asarco Inc. Mixed 46.0 0.6 SME Preprint 92-61 by Anzalone and Brown. T18S R15E S. 15 With 0.3% cutoff. Mineralization is 60% sulfides.
Pinto Valley Magma Copper Sulfide 154.5 0.37 Magma form 10-K, 1992. Milling reserve. T1N R14E S. 2 Co. Sulfide 445.0 0.12 Dump leach reserve.
Sulfide 146.4 0.42 Magma form 10-K, 1991. Milling resource. Sulfide 48.8 0.20 Magma form 10-K, 1 991. Dump leach resource.
Poston Butte Magma Copper Sulfide 500.0 0.39 Magma "Copper Sense," August, 1992. T4S R9E S. 33 Co. Acid Soluble 300.0 0.4
Ray Asarco Inc. Sulfide 1120.0 0.63 Asarco annual report, 1992. T3S R13E S. 10
Red Mountain Kerr McGee Corp. Sulfide 100.0 0.71 Tucson Daily Citizen, Sept. 23, 1970. T22S R1 6E S. 20
The Primary Copper Industry of Arizona in-1992 51

Table 22. Copper reserve base in 1992 - continued Deposit Company Mineral Million %Cu Source/comments Location type tons
Sacaton East Asarco Inc. Sulfide 15.0 1.3 Asarco form 10-K, 1979. Underground. T5S R5E S. 26
San Juan Clardige, Alf et a/ Acid Soluble 15.5 0.5 Producers Minerals Corp. Report June, 1975. T5S R26E S. 35 At 0.35% Cu cutoff.
San Manuel OP Magma Copper Acid Soluble 22.1 0.4 Magma Copper form 10-K, 1992. TSS R1 6E S. 35 Co. Acid Soluble 2.9 0.2 Open pit marginal.
Sulfide 0.3 0.96
San Manuel UG Magma Copper Sulfide 63.0 0.7 Magma Copper form 10-K, 1992. TSS R16E S. 34 Co. Acid Soluble 196.S 0.4 In-situ. 50% recovery anticipated.
Sulfide 142.0 0.6 Magma Copper form 10-K, 1990. Additional mineralization in shaft pillar.
Sanchez AZCO Mining Inc. Acid Soluble 16S.0 0.3 AZCO report, 1992. Reseve and low grade T6S R27E S. 25 Acid Soluble 23.0 0.2 suitable for leaching.
Santa Cruz Asarco & Freeport Acid Soluble SOO.O 0.4 U.S. Bureau of Mines data, 19S5. T6S R4E S. 13 McMoran
Sheep Mtn. Orcana Resources Sulfide 39.0 1.27 "Preliminary economic evaluation ... " by Watts TSN R1W S. 15 ltd. Griffis and McOuat, 1992. Supergene only.
Sierrita Cyprus Copper Sulfide 9S0.6 0.29 With 0.032 % Mo. Cyprus Minerals form 10-K, T1SS R12E S. 7 Co. 1992. Reserve includ~s Twin Buttes deposit.
Silver Bell Asarco Inc. Sulfide 101.0 0.5 Asarco annual report, 1992. T12S R8E S. 11
Squaw Peak Squaw Peak Sulfide 20.0 0.4 Roe, Robert A., 1976 report. T13N R5E S. 29 Copper Co.
Superior Magma Copper Sulfide 1.3 4.97 Magma Copper form 1 O-K, 1992. Current reserve.
T1S R12E S. 35 Co. Sulfide 2.6 5.70 Form 1 O-K, 1991. Additional uneconomic tonnage.
Stray Elephant Heinrichs GEO Mixed 2.0 0.6 Reported by James Loughry.
T4N R20W S. 31 Exploraton Co. Additional 5M tons of 0.5% possible.
Strong & Harris AZCO Mining Inc. Mixed 60.0 0.60 Unpublished estimate with 0.70 Zn.
T1 5S R22E S. 13
Swansea Mixed 5.5 0.81 Wilkins, J., 1990, private report.
T10N R15W S. 32
Turquoise Santa Fe Pacific Acid Soluble 15.0 0.50 Santa Fe property synopsis 1992. With
T1 9S R25E S. 17 Mining Inc. Mixed 1.0 3.10 0.05 oz/ton Au. Underground.
Two Peaks Dugan Production Sulfide 32.0 0.3 U.S. Geological Survey Professional Paper
T19S R19E S. 20 1300, page' 28.
52 The Primary Copper Industry of Arizona in 1992

Deposit Location
United Verde T16N R2E S. 22
Van Dyke T1N R15E S. 30
Vekol hills T10S R3E S. 4
Ventura T23S R15E S. 1
White Mesa T38N R9E S. 29
Zonia T11 N R4 W S. 1 2
Total
Company
Table 22. Copper reserve base in 1992 - continued Company
Phelps Dodge Corp.
Arimetco Interna-tiona I Inc.
Tohono O'odham Tribe
Cyprus Copper Co.
Mesa Mining
Arimetco Interna-tional Inc.
Mineral Million %Cu Source/comments type tons
Sulfide 21.0 0.5 U.S. Geological Survey Bulletin 18570. With 6.6 0.61 ozlton Ag and 0.02 ozlton Au.
Acid Soluble 100.0 0.53 Arimetco International annual report, 1992.
Sulfide 105.0 0.6 Vekol Hills Project EIS, U.S. Interior Dept. 1988. With 0.014% Mo, 16 million tons acid soluble.
Sulfide 6.0 0.3 Iso Mines Ltd. annual report, 1965. With 0.28% MoS2, 6 million additional tons possible.
Acid Soluble 25.0 0.3 Unpublished geologic estimate. Additional tonnage likely.
Acid Soluble 30.0 0.4 Arimetco Interantional annual report, 1992.
Total copper reserve base in Arizona Sulfide 8,107.7 0.53 contains 43.034 million tons of copper Acid Soluble 5,348.6 0.39 contains 20.790 million tons of copper Mixed 1,050.8 0.68 contains 7.193 million tons of copper
14,507.1 0.49 contains 71.017 million tons of copper
Company index to copper reserve base, Deposit Company Deposit
Arimetco International Arimetco International Arimetco International Arimetco International Asarco & Freeport Asarco & Freeport Asarco Inc.
Emerald Isle Kerr McGee Corp. Johnson Keystone Minerals Van Dyke Lodestar Minerals Zonia Magma Copper Casa Grande Magma Copper Santa Cruz Magma Copper Atlas Magma Copper
Red Mountain Korn Kob Gibson Copper Creek Kalamazoo Miami East Miami Tailings Pinto Valley Poston Butte San Manuel OP San Manuel UG Superior
Asarco Inc. Asarco Inc. Asarco Inc. Asarco Inc. Asarco Inc. Asarco Inc. Asarco Inc. Asarco Inc. Asarco Inc. AZCO Mining Inc. AZCO Mining Inc. Cambior USA Inc. Challinor, John Claridge, Alf, et al Corn, Russ Cyprus Copper Cyprus Copper Cyprus Copper Cyprus Copper Cyprus Copper Cyprus Copper Cyprus Copper Cyprus Copper Duerr & Prochnav Dugan Production Heinrichs GEO Hope Mining
Buckeye East Magma Copper Chilito Magma Copper Copper Butte Magma Copper Helvetia Magma Copper Mission Magma Copper Peach Elgin Mesa Mining Ray Oracle Ridge Sacaton East Orcana Resources Silver Bell Phelps Dodge Sanchez Phelps Dodge Strong & Harris Phelps Dodge Carlota Phelps Dodge Swansea Phelps Dodge San Juan Phelps Dodge Lonesome Pine Phelps Dodge Bagdad Phelps Dodge Casa Grande Rayrock Mines Christmas Santa Fe Pacific Esperanza Smith, Addison Miami Squaw Peak Mineral Park Standard Metals Sierrita Sullivan, James Ventura Sullivan, James Four Metals Tohono O'odham Two Peaks U.S. Government Stray Elephant Unknown Mame
White Mesa Oracle Ridge Sheep Mtn. Cochise Copper Basin Copper Queen Dos Pobres Lone Star Morenci New Cornelia United Verde Kay Copper Turquoise Dynamite Squaw Peak, Antler Dragoon 1-10 Vekol hills Mineral Butte Iron Door
The Primary Copper Industry of Arizona in 1992 53

Table 23. Historic Arizona and U.S. copper mine production [Copper reported in tons]
Period Arizona Arizona U.S. U.S. AZ"s % of U.S. Production production cumulative production cumulative Period Cummulative
1874-1971(1 24,889,171 24,889,171 60,365,183 60,365,183 41.2 41.2 1972 847,929 25,737,100 1,664,840 62,030,023 50.9 41.5 1973 867,506 26,604,606 1,717,940 63,747,963 50.5 41.7 1974 804,904 27,409,510 1,597,002 65,344,965 50.4 41.9 1975 751,489 28,160,999 1,413,366 66,758,331 53.2 42.2 1976 956,215 29,117,214 1,605,586 68,363,917 60.0 42.6 1977 852,620 29,969,834 1,503,964 69,867,887 56.7 42.9 19.78 908,835 '30,878,669 1,496,482 71,364,363 60.7 43.3 1979 957,251 31,835,920 1,591,200 72,955,563 60.2 43.6 1980 760,926 32,596,846 1,301,900 74,257,463 58.4 43.9 1981 1,071,949 33,668,795 1,695,500 75,952,963 63.2 44.3 1982 848,750 34,517,545 1,264,322 77,217,285 67.1 44.7 1983 747,604 35,265,149 1,144,306 18,361,591 65.3 45.0 1984 822,815 36,087,964 1,215,400 79,576,991 67.7 45.3 1985 878,044 36,966,008 1,218,900 80,795,891 72.0 45.8 1986 878,926 37,844,934 1,180,564 81,976,455 74.4 46.2 1987 862,034 38,706,968 1,384,394 83,360,849 62.3 46.4 1988 942,556 39,649,524 1,584,115 84,944,964 59.5 46.7 1989 1,004,891 40,654,415 1,651,501 86,596,465 60.8 46.9 1990 1,087,287 41,741,702 1,738,952 88,335,417 62.5 47.3 1991 1,132,536 42,874,238 1,797,965 90,133,382 63.0 47.6 1992 1,271,466 44,006,774 1,945,602 92,078,984 65.4 47.8
1 ) For cumulative breakdown 1874-1911 and annual production 1912-1971, see Phillips, K., 1973, "The Copper Industry," Arizona Department of Mines and Mineral Resources.
Source: .. Minerals Yearbook - Area Reports: Domestic, II U.S. Bureau of Mines; Table 1, this publication.
2,000,000 1,800,000 1,600,000
(I) 1,400,000 c: B 1,200,000 Q; 1,000,000 §: 800,000 8 600,000
400,000 200,000
o
r-~
Figure 13. Copper production in the U .8. and Arizona
r-~
r-..- r- r- r-
r- r-r-
~
.-- .-- ..- r-r-r-
I I I I I I • Arizona D U.S.
.• ,. I. •.• , ••.• I
.- .-
54 The Primary Copper Industry of Arizona in 1992
r-
~

THE ARIZONA DEPARTMENT OF MINES AND MINERAL RESOURCES
The objective of the Department is to promote the development of Arizona's mineral resources. This is accomplished through technical research, field investigations, compilation of information into a mineral occurrence data base and disseminating information through publications, personal contacts and seminars.
The Department's mining engineers and geologists assist mining and exploration companies, prospectors and others interested in Arizona's minerals with mineral processing, mineral land acquisition,exploration, mine development, financing, government regulations and marketing.
The Department is a service agency and does not regulate, tax, or require any type of registration. The agency provides assistance that is tailored to meet the differing needs of the public. The following is a partial list of services which the Department offers:
8 Maintain a site specific data base of unpublished reports and maps which includes 5,000 mine files and indexes of 10,000 computerized Arizona
• Maintain an information bank and library of mineral and mining information including a mine map library (hard copy and microfilm), government publications, periodicals, and unpublished master and doctorate theses.
• Gather and disseminate information on commodities and markets.
o Suggest target areas for possible exploration activity.
o Suggest prospects and individual properties for study and acquisition.
o Assist individuals and companies in their dealings with State regulatory agencies to facilitate their mining and exploration activity.
o Produce publications in the form of mineral reports, annual directories,technical reports, annual mineral industry surveys and information circulars. These include Laws and Regulations Governing Mineral Rights in Arizona, Directory of Active Mines in Arizona, Manual for Determination of Status and Ownership of Arizona Mineral and Water Rights, and others. A current listing of the Department publications is available upon request.