the primary math and reading (primr) initiative dfid/kenya ......comparison, impacts were larger in...
TRANSCRIPT

The Primary Math and Reading (PRIMR) Initiative
DFID/Kenya Rural Expansion Programme Midterm Report Prepared for: Sandra Barton DFID/Kenya Prepared by: RTI International Contacts: Dr. Benjamin Piper, PRIMR Chief of Party; Arbogast Oyanga M&E Officer; and Dr. Abel Mugenda, Monitoring, Evaluation and Research Director Address: RTI Regional Office-Nairobi, Misha Tower, 3rd Floor, 47 Westlands Road, Nairobi, Kenya 24 February 2014 RTI International is one of the world's leading research institutes, dedicated to improving the human condition by turning knowledge into practice. Our staff of more than 3,700 provides research and technical services to governments and businesses in more than 75 countries in the areas of health and pharmaceuticals, education and training, surveys and statistics, advanced technology, international development, economic and social policy, energy and the environment, and laboratory testing and chemical analysis.
RTI International is a trade name of Research Triangle Institute.

DFID/PRIMR Rural Expansion: Midterm Report ii
Table of Contents Page
List of Tables ........................................................................................................................... iii
List of Figures ........................................................................................................................... iv
Executive Summary ............................................................................................................. ES-1
Challenges in PRIMR Implementation ....................................................................... ES-2 PRIMR Impact ............................................................................................................ ES-2 Impact of PRIMR Treatment Groups ......................................................................... ES-4 PRIMR Effect size ...................................................................................................... ES-5 Recommendations ....................................................................................................... ES-6
1. Introduction ....................................................................................................................... 1
1.1 Kenya’s Education Context ..................................................................................... 1 1.2 Background of the DFID Rural Expansion .............................................................. 2 1.3 Programme Components .......................................................................................... 3 1.4 Overall PRIMR Implementation Design ................................................................. 4 1.5 PRIMR Implementation in 2013 .............................................................................. 7
1.5.1 Challenges of PRIMR Implementation in 2013 .............................................. 8 1.6 Early Grade Reading Assessment (EGRA) ............................................................. 8 1.7 Early Grade Mathematics Assessment (EGMA) ................................................... 10
2. Research Methodology ................................................................................................... 10
2.1 Overall Design ....................................................................................................... 10 2.2 Sampling and Sample Sizes ................................................................................... 11 2.3 Data Collection ...................................................................................................... 11
3. Reliability Estimates ....................................................................................................... 12
3.1 Kiswahili EGRA Tool Analysis............................................................................. 14 3.2 Kikamba EGRA Tool Analysis ............................................................................. 15 3.3 Lubukusu EGRA Tool Analysis ............................................................................ 16 3.4 EGMA Tool Analysis ............................................................................................ 17 3.5 Equating ................................................................................................................. 19
4. Findings........................................................................................................................... 19
4.1 Impact of PRIMR ................................................................................................... 19 4.1.1 Descriptive Statistics at Midterm by Treatment and Control
Schools ....................................................................................................... 20 4.1.2 Descriptive Statistics at Midterm for EGRA Lubukusu and EGRA
Kikamba ..................................................................................................... 22 4.1.3 PRIMR Effect from Difference-in-Differences ......................................... 23 4.1.4 Language Achievement Comparisons ....................................................... 30 4.1.5 Comparing Improvements between March and October 2013 .................. 31 4.1.6 Comparing Decrease in Zero Scores between Baseline and
Midterm...................................................................................................... 35 4.1.7 Effect Size Comparisons by Treatment Group .......................................... 39 4.1.8 Impact of Other Factors ............................................................................. 40
5. Lessons Learnt ................................................................................................................ 42
6. Recommendations ........................................................................................................... 43

DFID/PRIMR Rural Expansion: Midterm Report iii
7. Conclusion ...................................................................................................................... 44
References ................................................................................................................................ 45
Annexes.................................................................................................................................... 46
Annex 1. GRA Descriptive Statistics at Midterm by Language, Treatment Group, Class and Gender ............................................................................................................................. 47
Annex 2. EGMA Descriptive Statistics at Midterm by Language, Treatment Group, Class and Gender ............................................................................................................................. 58
List of Tables Table ES-1. Impact of PRIMR on English Outcomes ......................................................... ES-2
Table ES-3. Impact of PRIMR on Mathematics Outcomes ................................................. ES-3
Table 1a. Programme Implementation Design—Bungoma County .......................................... 5
Table 1b. Programme Implementation Design—Machakos County ......................................... 6
Table 2. EGRA Subtasks Implemented in DFID/PRIMR ......................................................... 9
Table 3. EGRA Subtasks at Baseline and Midterm Evaluation ................................................. 9
Table 4. EGMA Subtasks Implemented in DFID/PRIMR ...................................................... 10
Table 5. Summary of PRIMR Implementation Programme .................................................... 11
Table 6. Midterm Sample Size by Gender and Class in Bungoma and Machakos ................. 11
Table 7. Pupils Assessed in EGRA/EGMA Baseline and Midterm Assessments by Cohort .. 12
Table 8. Pearson Correlations for EGRA Subtasks in English ................................................ 13
Table 9. Cronbach’s Alpha for EGRA Subtasks in English .................................................... 13
Table 10. Pearson Correlations for EGRA Subtasks in Kiswahili ........................................... 14
Table 11. Cronbach’s Alpha for EGRA Subtasks in Kiswahili ............................................... 15
Table 12. Pearson Correlations for EGRA Subtasks in Kikamba ........................................... 15
Table 13. Cronbach’s Alpha for EGRA Subtasks in Kikamba ................................................ 16
Table 14. Pearson Correlations for EGRA Subtasks in Lubukusu .......................................... 16
Table 15. Cronbach’s Alpha for EGRA Subtasks in Lubukusu .............................................. 17
Table 16. Pearson Correlations for EGMA Subtasks .............................................................. 18
Table 17. Cronbach’s Alpha for EGMA Subtasks................................................................... 19
Table 18. Programme Effect and Effect Sizes for English ...................................................... 20
Table 19. Programme Effect and Effect Sizes for Kiswahili ................................................... 21
Table 20. Programme Effect and Effect Sizes for Mathematics .............................................. 22
Table 21. Descriptive Statistics for Lubukusu and Kikamba in Class 2 .................................. 23
Table 22. Impact of PRIMR on English Outcomes ................................................................. 25
Table 23. Impact of PRIMR on Kiswahili Outcomes .............................................................. 27
Table 24. Impact of PRIMR on Mathematics Outcomes ......................................................... 29

DFID/PRIMR Rural Expansion: Midterm Report iv
List of Figures Figure ES-1. Causal Impact of PRIMR Treatment Groups ................................................. ES-4
Figure ES-2. Causal Impact of Treatment Groups on Zero Scores ..................................... ES-5
Figure ES-3. Effect size Comparison by Treatment Group Class 2 .................................... ES-6
Figure 1. Literacy outcomes for English, Kiswahili and Lubukusu in Class 2 in Bungoma. .. 30
Figure 2. Literacy outcomes for English, Kiswahili and Kikamba in Class 2 in Machakos. .. 31
Figure 3. Increase in mean scores for full PRIMR and Control schools for Class 2. .............. 32
Figure 4. Increase in mean scores for Books and Training and Control schools for Class 2. . 33
Figure 5. Summary in Means for Training only and Control .................................................. 34
Figure 6. Summary of Causal Impact of PRIMR Treatment Groups ...................................... 35
Figure 7. Decrease in % of Zero scores ................................................................................... 36
Figure 8. Decrease in % of Zero Scores for Books and Training ............................................ 37
Figure 9. Decrease in % of scores for Training only ............................................................... 38
Figure 10. Causal Impact of Treatment Groups on Zero Scores ............................................. 39
Figure 11. Effect Size Comparison by Treatment Group Class 2 ............................................ 40
Figure 12. Relationship with English oral reading fluency associated with key factors of interest in Kenya ............................................................................................................. 42

DFID/PRIMR Rural Expansion: Midterm Report v
Abbreviations CDE County Director of Education
clpm correct letters per minute
cnpm correct numbers per minute
cpm correct per minute
csspm correct syllable sounds per minute
cwpm correct words per minute
DFID UK Department for International Development
DID difference-in-differences
EdData II USAID Education Data for Decision Making II project
EGMA Early Grade Mathematics Assessment
EGRA Early Grade Reading Assessment
ICT information and communication technology
KCPE Kenya Certificate of Primary Education
KEMI Kenya Education Management Institute
KES Kenyan shillings
KICD Kenya Institute of Curriculum Development
KISE Kenya Institute of Special Education
KNEC Kenya National Examinations Council
MOEST Ministry of Education, Science and Technology
NCST National Council of Science and Technology
ORF oral reading fluency
PDIT Programme Development and Implementation Team
PRIMR Primary Math and Reading Initiative
RTI RTI International (trade name of Research Triangle Institute)
SD standard deviation
TAC Teachers’ Advisory Centre
TSC Teachers’ Service Commission
US United States
USAID US Agency for International Development

DFID/PRIMR Rural Expansion: Midterm Report ES-1
Executive Summary This midterm evaluation report focuses on the impact of the Primary Math and Reading Initiative (PRIMR) on pupil outcomes in Classes 1 and 2. PRIMR is a partnership between the Kenyan Ministry of Education, Science and Technology (MOEST) and the United Kingdom Department for International Development (DFID)/Kenya, with technical support from RTI International. PRIMR is supporting 834 schools in four treatment and one control groups in Machakos and Bungoma counties between 2013 and 2015. Treatment 1 is Full PRIMR, and schools in this treatment group receive teachers’ guides, pupil books and training in how to use the teachers’ guides. Treatment 2 is Books & Training, and these schools receive teacher training and pupil books. This model requires that teachers use the pupil books to create their own lesson plans. Treatment 3 is Training Only, and teachers receive general training on how to prepare lesson plans more effectively. They receive no additional teacher or pupil materials. Schools in Treatment 4, Mother Tongue, are receiving materials produced in Lubukusu and Kikamba mother tongues, PRIMR teachers’ guides and pupil books, and teachers are trained and supported. The mother-tongue treatment was not implemented in 2013, so this report only presents the baseline results rather than an impact evaluation. The control group will implement PRIMR in 2015. The PRIMR design is phased, with 251 schools starting PRIMR in 2013 and 657 implementing it in 2014.
This midterm impact evaluation report compares the impact of PRIMR in the 251 Cohort 1 schools against the control schools. Teachers and head teachers in the initial PRIMR treatment group were given training in literacy and numeracy in May and September 2013, combined with instructional materials specific to their treatment group. It analyses the causal effects of PRIMR between March 2013 and October 2013. Schools implemented PRIMR between May and September 2013 for four instructional months. Pupil performance was gauged using an Early Grade Reading Assessment (EGRA) and Early Grade Mathematics Assessment (EGMA). All tools were adapted for PRIMR.
PRIMR is designed as a cost-effective and simple intervention focused on ensuring teacher change towards a new instructional approach. The key elements of the intervention are:
Low-cost books at a 1:1 ratio. PRIMR achieves a 1:1 pupil-book ratio, compared with the current 3:1 ratio, at much lower cost, while increasing the length of the books significantly. (Given to Mother Tongue, Full PRIMR and Books & Training)
Targeted teacher’s guides. Each Full PRIMR teacher receives teacher’s guides for English, Kiswahili and mathematics. These teacher’s guides were integrated with the pupil books and help pupils progress from initial literacy skills to full reading fluency and comprehension within one year. (Given to Mother Tongue and Full PRIMR)
Focused training on lesson delivery. PRIMR provides teachers with practice in improving instruction. Brief introductions to new topics are followed by modelling and then practice. In 2013, teachers and head teachers received eight days of training for the three subjects. (All treatments received the same amount of training)
Ongoing instructional support. PRIMR Teachers’ Advisory Centre (TAC) tutors, each responsible for 11 to 27 schools, were well trained. They were trained for 12 days and observed teachers’ instruction and providing feedback. PRIMR provided transport reimbursements to TAC tutors, as their support is the key element to a sustainable instructional improvement programme.
Low-cost inputs. PRIMR’s design tested the impact of a low-cost programme. This means that the investments—from the TAC tutors’ support, to the training of all key

DFID/PRIMR Rural Expansion: Midterm Report ES-2
actors, instructional materials, 1:1 textbook ratios and ongoing instructional support—cost less than US$2.50 per subject per pupil.
Challenges in PRIMR Implementation
PRIMR faced several challenges in 2013. First, the national elections in March 2013 delayed start-up. In Term 2, there was a teachers’ strike. There is evidence from PRIMR’s internal assessments that outcomes in formal schools declined between June and October 2013, and that the most likely cause was the strike. The literature on “summer loss” shows that breaks from school impede learning. These two challenges meant that pupils were evaluated after four months of instruction, not enough to have proper PRIMR implementation.
PRIMR Impact
This report is focused on whether PRIMR increased pupil achievement. PRIMR utilized a difference-in-differences (DID) identification strategy to measure causal effect. This model accounts for any differences in outcomes at the baseline prior to the PRIMR intervention. Table ES-1 below presents the causal impact of each of the treatment groups over control. The findings show that PRIMR’s impact on English was modest, with much larger gains coming from the full PRIMR treatment group than the other two treatment groups. In comparison, impacts were larger in Class 2 than in Class 1. The average overall effect size for the three treatment groups was small in Class 1, though Full PRIMR had the largest effect size at .10 standard deviations (SD). For Class 2, the impacts of Books & Training and Training Only were still very low, with Full PRIMR achieving a moderate impact of 0.25 SD.
Table ES-1. Impact of PRIMR on English Outcomes
Class 1 Effects Class 2 Effects
Full PRIMR
Effect Size
Books &
Training
EffectSize
Train-ing
Only
EffectSize
Full PRIMR
EffectSize
Books &
Training
Effect Size
Train-ing
Only
EffectSize
Letter sound fluency (correct letters per min)
9.2 0.71 10.4 0.81 7.3 0.56 17.2 1.04 14.7 0.89 9.7 0.59
Decoding fluency (non-words per min)
0.9 0.11 -0.4 -0.05 -0.6 -0.07 3.5 0.25 -0.1 -0.01 -0.9 -0.06
Oral reading fluency (correct words per min)
0.1 0.01 -1.4 -0.17 -1.3 -0.16 2.5 0.12 -3.7 -0.17 -3.3 -0.16
Reading comprehension (% correct) -0.5 -0.14 0.5 0.14 -0.1 0.44 -3.1 -0.22 -2.6 -0.18 -2.6 -0.18
Emergent readers (%reading 30 wpm+)
-3.5 -0.22 -5.7 -0.35 -5.0 -0.31 3.0 0.08 -6.6 -0.17 0.5 0.01
Average Effect Size 0.10 0.01 -0.00 0.25 0.07 0.04
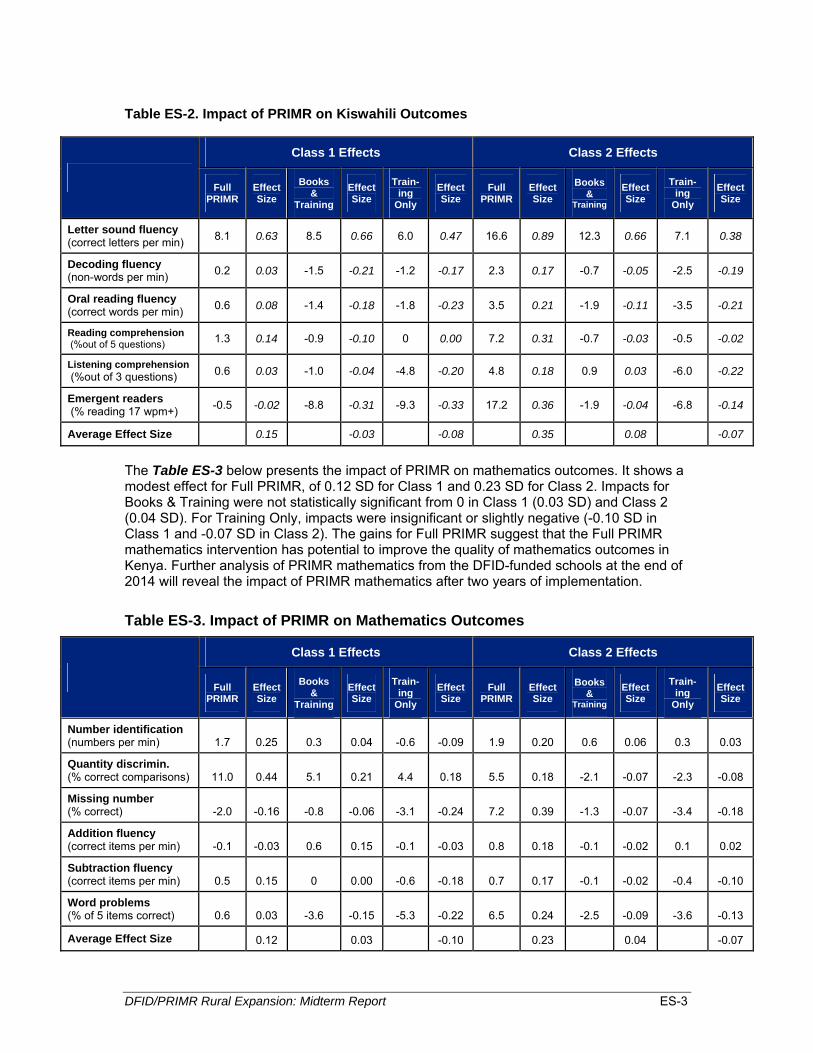
Impacts for Full PRIMR in Kiswahili were larger than those in English, and larger than those of the other two treatment groups (Table ES-2). There are many effects that are not statistically significant, and the gains for Kiswahili remain more modest than was found at the endline for the USAID PRIMR programme. This is to be expected given that DFID/PRIMR had four months of instruction and USAID PRIMR had two years. Full PRIMR had a positive effect size for Class 1 (0.15 SD), while the other two treatment groups had small negative impacts. For Class 2, the impact of Full PRIMR was an encouraging 0.35 SD, compared to 0.08 for Books & Training and -0.07 for Training Only. In summary, the impacts for Full PRIMR Kiswahili were larger than in English, and larger than the other two treatment groups.
DFID/PRIMR Rural Expansion: Midterm Report ES-3
Table ES-2. Impact of PRIMR on Kiswahili Outcomes
Class 1 Effects Class 2 Effects
Full PRIMR
Effect Size
Books &
Training
EffectSize
Train-ing
Only
EffectSize
Full PRIMR
EffectSize
Books &
Training
Effect Size
Train-ing
Only
EffectSize
Letter sound fluency (correct letters per min)
8.1 0.63 8.5 0.66 6.0 0.47 16.6 0.89 12.3 0.66 7.1 0.38
Decoding fluency (non-words per min)
0.2 0.03 -1.5 -0.21 -1.2 -0.17 2.3 0.17 -0.7 -0.05 -2.5 -0.19
Oral reading fluency (correct words per min)
0.6 0.08 -1.4 -0.18 -1.8 -0.23 3.5 0.21 -1.9 -0.11 -3.5 -0.21
Reading comprehension (%out of 5 questions) 1.3 0.14 -0.9 -0.10 0 0.00 7.2 0.31 -0.7 -0.03 -0.5 -0.02
Listening comprehension (%out of 3 questions) 0.6 0.03 -1.0 -0.04 -4.8 -0.20 4.8 0.18 0.9 0.03 -6.0 -0.22
Emergent readers (% reading 17 wpm+)
-0.5 -0.02 -8.8 -0.31 -9.3 -0.33 17.2 0.36 -1.9 -0.04 -6.8 -0.14
Average Effect Size 0.15 -0.03 -0.08 0.35 0.08 -0.07
The Table ES-3 below presents the impact of PRIMR on mathematics outcomes. It shows a modest effect for Full PRIMR, of 0.12 SD for Class 1 and 0.23 SD for Class 2. Impacts for Books & Training were not statistically significant from 0 in Class 1 (0.03 SD) and Class 2 (0.04 SD). For Training Only, impacts were insignificant or slightly negative (-0.10 SD in Class 1 and -0.07 SD in Class 2). The gains for Full PRIMR suggest that the Full PRIMR mathematics intervention has potential to improve the quality of mathematics outcomes in Kenya. Further analysis of PRIMR mathematics from the DFID-funded schools at the end of 2014 will reveal the impact of PRIMR mathematics after two years of implementation.
Table ES-3. Impact of PRIMR on Mathematics Outcomes
Class 1 Effects Class 2 Effects
Full PRIMR
Effect Size
Books &
Training
EffectSize
Train-ing
Only
EffectSize
Full PRIMR
EffectSize
Books &
Training
Effect Size
Train-ing
Only
EffectSize
Number identification (numbers per min) 1.7 0.25 0.3 0.04 -0.6 -0.09 1.9 0.20 0.6 0.06 0.3 0.03
Quantity discrimin. (% correct comparisons) 11.0 0.44 5.1 0.21 4.4 0.18 5.5 0.18 -2.1 -0.07 -2.3 -0.08
Missing number (% correct) -2.0 -0.16 -0.8 -0.06 -3.1 -0.24 7.2 0.39 -1.3 -0.07 -3.4 -0.18
Addition fluency (correct items per min) -0.1 -0.03 0.6 0.15 -0.1 -0.03 0.8 0.18 -0.1 -0.02 0.1 0.02
Subtraction fluency (correct items per min) 0.5 0.15 0 0.00 -0.6 -0.18 0.7 0.17 -0.1 -0.02 -0.4 -0.10
Word problems (% of 5 items correct) 0.6 0.03 -3.6 -0.15 -5.3 -0.22 6.5 0.24 -2.5 -0.09 -3.6 -0.13
Average Effect Size 0.12 0.03 -0.10 0.23 0.04 -0.07

DFID/PRIMR Rural Expansion: Midterm Report ES-4
‐10
‐5
0
5
10
15
20
Letter Sounds (clpm)
Decoding (cwpm)
ORF (cwpm)
Reading Comp. (%)
Reading Comp Attd.
Emergent (%
)
Letter Sounds (clpm)
Decoding (cw
pm)
ORF (cwpm)
Reading Comp. (%)
Reading Comp Attd.
Listen
ing Comp. (%)
Emergent (%
)
Number ID
(cpm)
Quantity (%)
Missing # (%)
Word Problems (%
)
Addition (cpm)
Subtraction (cpm)
Addition Level 2 (%)
Subtraction Level 2 (%)
English Kiswahili Math
Full PRIMR
Books & Training
Training Only
Impact of PRIMR Treatment Groups
In order to determine which specific tasks showed an impact, we created Figure ES-1 below. Figure ES-1 plots the changes in outcomes since the baseline for the three treatment groups. All three treatment groups had impacts on letter sound fluency, for both languages. The figure also reveals that the gains for Full PRIMR were larger on 18 of the tasks, with control having larger gains on 2 tasks, and Training Only having larger gains on 1 item. The biggest differences were evident in Kiswahili, where Full PRIMR gains were much larger than control, Books & Training, or Training Only. For Math, pupil gains were consistently larger in Full PRIMR. It appears that the full PRIMR programme is having a bigger impact.
Figure ES-1. Causal Impact of PRIMR Treatment Groups
The DFID/PRIMR baseline report noted the large percentages of pupils who were unable to read a single word of an approximately 60-word story (Piper & Mugenda, 2013). Oral reading fluency was not the only measure in which pupils were struggling to perform. Zero scores on tasks were high across all three subjects, and in both Class 1 and 2. In order to compare the relative impact of the three PRIMR treatment groups on the percentage of zero scores, we created Figure ES-2 below. Figure ES-2 shows the decline in the number of zero scores between the baseline and midterm. It appears that the declines in zero scores were largest for Full PRIMR compared to the other two treatment groups. This shows that Full PRIMR had a large effect on the bottom part of the distribution, helping those pupils who were struggling the most.

DFID/PRIMR Rural Expansion: Midterm Report ES-5
Figure ES-2. Causal Impact of Treatment Groups on Zero Scores
PRIMR Effect size
The results above simply show changes in mean scores, but to understand the magnitude of the PRIMR treatment groups impact on learning, converting those findings to effect sizes is important. The Figure ES-3 below presents the effect sizes by treatment group and subject. The effect size for Full PRIMR was largest for all three subjects and overall. The overall effect size for Full PRIMR was .28 SD. In fact, while the USAID PRIMR programme has had much longer to implement, the effect size of the DFID/PRIMR programme is only slightly smaller. Gains were small for both the Books & Training and Training Only groups, at .04 SD and -.03 SD, respectively, both of which are insignificant. It appears that, though the TAC tutors in the Training Only and Books & Training groups were just as vigilant about visiting classrooms and the PRIMR team support was similar across the programme, the effects of these two treatment groups were negligible. It might be that an integrated system of teachers’ guides and pupil books is important for improving outcomes. This is, of course, only the midterm report and instructional time between the baseline and the midterm was limited to a matter of months. This analysis will be revisited after the endline data collection in October 2014.
‐41.8
‐30
‐25
‐20
‐15
‐10
‐5
0
5
10
Letter Sounds 0s
Decoding 0s
ORF 0s
Reading Comp. 0s
Letter Sounds 0s
Decoding 0s
ORF 0s
Reading Comp. 0s
Number ID
0s
Quantity 0s
Missing # 0s
Word Problems 0s
Addition 0s
Subtraction 0s
Addition Level 2 0s
Subtraction Level 2 0s
English Kiswahili Math
Full PRIMR
Books & Training
Training Only

DFID/PRIMR Rural Expansion: Midterm Report ES-6
Figure ES-3. Effect size Comparison by Treatment Group Class 2
Recommendations
These PRIMR results suggest several recommendations for Kenya and PRIMR.
1. Improve the quality of teacher training and support. The findings indicate that teachers who have “other” qualifications, often early childhood development (ECD) credentials, are associated with 3.4 correct words per minute (cwpm) higher on oral reading fluency (ORF), compared to those who have a bachelor’s degree in education (associated with 0.9 cwpm). Teacher training to support the teacher change process is essential, at both pre- and in-service.
2. Review of the pupils books. The results show that Full PRIMR had the greatest impact of the three programs, and Full PRIMR provides each pupil with new books. Previous research shows that the current books on the Kenyan market do not focus on skills acquisition for literacy and numeracy. Ensuring a 1:1 ratio of books to pupils can improve literacy and numeracy outcomes.
3. Utilizing teacher’s guides. The findings have indicated improved performance from the use of PRIMR teacher’s guides against the other treatment groups. Development of teacher’s guides for teachers ensures the teachers teach in a structured manner.
4. Scale up the literacy and numeracy programme. The research design for PRIMR in DFID and USAID is designed to test whether the programme can be rolled out at scale. The positive results in the USAID and DFID/PRIMR studies in seven counties suggest that PRIMR has a set of interventions that can be scaled up in Kenya.
5. Training TAC tutors to support instruction. The TAC tutor support is critical in ensuring instructional support in public schools. The system for how they can be optimally supported to improve learning outcomes is of paramount importance.
6. Cost considerations. The cost effectiveness analysis in this report shows that focused instructional improvement strategies can improve the quality of education in Kenya. PRIMR’s full colour books cost 71 KES, much less than the 400 KES+ typically found in the market.
0.25
0.35
0.22
0.28
0.07 0.08
‐0.04
0.040.04
‐0.07 ‐0.07
‐0.03
‐0.10
‐0.05
0.00
0.05
0.10
0.15
0.20
0.25
0.30
0.35
0.40
English Kiswahili Maths Total
Full PRIMR Books & Training Training Only

DFID/PRIMR Rural Expansion: Midterm Report 1
1. Introduction
1.1 Kenya’s Education Context
Kenya’s Vision 2030 emphasizes literacy and numeracy as priorities, following the lead of the Kenyan Ministry of Education, Science and Technology (MOEST). The Ministry’s Sessional Paper of 2012 states in section 4.7.i that the objectives of primary education are to “acquire literacy, numeracy, creativity and communication skills.” The purpose of the curriculum (as stated in section 6.5) is to develop competencies such as “literacy, numeracy and enquiry skills.” The 2012 Sessional Paper goes further than simply wanting to meet those national standards for pupil achievement, and section 4.5.iv says that proposed reforms will “improve the quality of education and training so that Kenya’s measurable learning outcomes in literacy, numeracy, scientific and communication skills are in the upper quartile on international standardized tests by 2017.”
Unfortunately, the 2012 Uwezo findings, based on the largest survey of its kind in sub-Saharan Africa, show little progress on literacy and numeracy skills. According to Uwezo, 7 out of 10 children in Class 3 cannot read Class 2 materials. For numeracy the situation is similar. The Uwezo research has shown that children are not acquiring basic competencies in literacy and numeracy quickly enough (Uwezo Kenya, 2012).
The results of last year’s Kenya Certificate of Primary Education (KCPE) examinations (Kenya National Examinations Council [KNEC], 2014) indicated that the average scores for English, Kiswahili and mathematics were 48.9, 49.3 and 50.0 respectively. English and Kiswahili are below the expected average of 50, while mathematics barely meets the threshold. A large number of pupils (more than 10,000) obtained a total score of less than 100 out of the possible 500. Since all subjects (apart from Kiswahili) are examined in English, many Kenyans argue that it is the poor performance in English and Kiswahili, particularly in literacy, that affects the performance in other subjects. We posit that Kenyan pupils’ difficulty in basic literacy and numeracy in early primary affects KCPE results and the educational futures of Kenya’s children.
In an August 2012 KNEC meeting, attended by the MOEST, Semi-Autonomous Government Agencies (SAGAs) in education, donors and other stakeholders, literacy benchmarks for fluent readers were set as follows: 65 words per minute in English, and 45 words per minute in Kiswahili. In the baseline study (Piper & Mugenda, 2013), the means for oral reading fluency (ORF) were 6.5 words per minute for English and 6.0 words per minute for Kiswahili. This shows that the average pupil was reading at approximately 10% of the English benchmark and approximately 13% of the Kiswahili benchmark.
The MOEST has been concerned about these issues of quality and has commissioned several programmes to address them. For example, in June 2007, the Early Grade Reading Assessment (EGRA) was piloted (East African Development Consultants & RTI International, 2008) and followed up by an intervention in Malindi with the objective of improving literacy outcomes in lower primary (Crouch, Korda & Mumo, 2008). In June 2009, the United States Agency for International Development (USAID) funded the piloting of the Early Grade Mathematics Assessment (EGMA), while in 2009 and 2010, the William and Flora Hewlett Foundation funded an assessment of learning outcomes using EGRA in four languages (Gikuyu, Dholuo, Kiswahili and English), with particular emphasis on the language of instruction used in classrooms (Piper, 2010).
In response to this research, the MOEST decided to act. In order to improve the quality of literacy and numeracy instruction in Kenya, the Kenyan MOEST), USAID, and the UK

DFID/PRIMR Rural Expansion: Midterm Report 2
Department for International Development (DFID) have collaborated to design the Primary Math and Reading Initiative (PRIMR). In 2011, USAID and RTI started implementing PRIMR in five counties: Nairobi, Kiambu, Nakuru, Murang’a and Kisumu, and in 2013, DFID and RTI started implementing PRIMR in Machakos and Bungoma counties.
The USAID reports on PRIMR show that PRIMR can improve outcomes quickly, in less than a year (Piper & Mugenda, 2013), that this change can be particularly beneficial for the poor (Piper, Jepkemei & Kibukho, 2014), that the impacts can be assisted by information and communication technology (ICT) (Piper & Kwayumba, 2014), and that the gains after two years can be substantial (Piper, Mugenda & Oyanga, 2014). This report examines in particular the impact of PRIMR in rural locations, comparing different treatment groups against each other.
1.2 Background of the DFID Rural Expansion
The DFID/Kenya PRIMR Rural Expansion Programme was designed to address several research topics of interest in Kenya, some of which were spurred by the earlier PRIMR research.
Teachers’ guides and lesson planning. DFID/Kenya helps to evaluate the relative importance of structured teachers’ guides against pupil books and teacher training. The Rural Expansion Programme design allows a comparison of the pupil outcomes obtained in classrooms where teachers use the PRIMR structured teachers’ guides to those where teachers develop their own lessons. This is assessed by the impact evaluation in this report as well as a case study of teacher behaviour in schools.
Textbooks and materials. To answer the question about whether it is sufficient to simply give teachers training on the existing materials, or whether new materials are needed, RTI proposed that this argument be tested by using a design that also evaluated changes in instruction and pupil outcomes in schools where teachers receive training only rather than training combined with the new books.
Mother tongue and the language policy. A key policy issue that consistently is raised in Kenya is the mismatch between the language pupils come to school speaking and the language used for instruction in schools. Over 40 different languages are spoken in Kenya. This has created a situation in which the majority of pupils in Classes 1 and 2 are exposed to English and Kiswahili in the classroom, more often than the mother tongue that they already speak and understand. The DFID/Kenya Rural Expansion Programme therefore introduced mother-tongue literacy instruction in another set of treatment schools to estimate the effect of mother-tongue materials and instruction on pupil outcomes in Kenya. This will allow us to measure the impact of PRIMR mother-tongue materials on outcomes in mother tongue as well as in English and Kiswahili and to determine whether the impact of mother tongue is still large when compared with impact on a strong literacy programme.
Cost-effectiveness. The DFID/Kenya Rural Expansion Programme compares the effectiveness and cost-effectiveness of the variations discussed above with an eye towards responding to the MOEST’s desire for policy-relevant information that can be used to design a national literacy programme. At the heart of PRIMR is a desire to utilize the existing MOEST and Teachers’ Service Centre (TSC) system to undertake literacy and numeracy improvements in the sector.

DFID/PRIMR Rural Expansion: Midterm Report 3
1.3 Programme Components
PRIMR is organized to test a cost-effective and scalable model’s ability to improve learning outcomes in Kenya. The decisions and direction of PRIMR are determined primarily by a Programme Development and Implementation Team (PDIT) chaired by the Education Secretary, Mr. Magochi, coordinated by Mrs. Margaret Murage of the MOEST, and including key experts from the MOEST, TSC, Kenya Institute of Special Education (KISE), Kenya Institute of Curriculum Development (KICD), Kenya National Examinations Council (KNEC) and Kenya Education Management Institute (KEMI). The PRIMR design has the following elements.
Low cost books: Several decisions were made by the project team to ensure savings on book purchases. For example, all elements of the literacy programme—which for English and Kiswahili include phonics activities, illustrations and daily PRIMR stories—are embedded in one book. The books have attractive illustrations, but without colour. The decision was to test the effectiveness of black and white at a lower pupil-to-book ratio. The materials evaluated in this report, with 150 pages of text and artwork, were purchased at between 65 and 68 KES. The revised versions, printed in January 2014, cost less than 71 KES and are full colour. (Given to Full PRIMR, Books & Training, and Mother Tongue treatment groups)
Limited instructional aids: The PRIMR team made explicit decisions not to emphasize wall charts, big books, or other short-term-use but expensive materials. The aids provided to teachers are an A3-sized pocket chart with three pockets, a set of laminated letter flashcards in business-card size and a set of number flashcards laminated in business-card size. Starting in 2014 no numeral or letter cards will be issued, as teachers will use manila papers to prepare these. (Given to all treatment groups)
Self-contained teachers’ guides: While some successful programs have several resources for the teacher, PRIMR wanted to maximize the average teacher’s comfort with the programme by ensuring simplicity. Therefore, all of the teacher’s guide materials were embedded in one document. The numeracy resources, therefore, came in one volume, but for English and Kiswahili, the teacher’s guide document consisted of two volumes (in the 2013 academic year, though the 2014 teachers’ guide was one volume). Teachers were also given an assessment manual, a sheet of training tips, and a two-page document to track pupil progress; pupils were given a single B5 sheet to track reading at home. (Given to Full PRIMR treatment group)
Modest training: PRIMR decided to invest proportionally more training money in follow-up and observation than in other activities. As mentioned, intervention activities began during Term 2 of 2013, so PRIMR provided eight days of training for the entire year for the three subjects. This training was organized as five days at the beginning of Term 2 and three days at the beginning of Term 3. (Provided for all treatment groups)
Focused observations: Much of PRIMR’s attention and energy is spent in supporting TAC tutors to visit schools and observe classrooms. Project funds reimburse TAC tutors’ travel based on the proportion of teachers observed twice per month, to ensure that tutors have a reason to provide equal support, even to faraway schools. The reimbursements are based on detailed observation forms that give PRIMR the information needed to make course corrections, matched with school logs signed by the head teacher. As do District Quality Assurance and Standards Officers, PRIMR’s technical team spends time accompanying tutors on their visits. (Provided for all treatment groups)

DFID/PRIMR Rural Expansion: Midterm Report 4
Ongoing assessment: During 2013, PRIMR began supporting zones by organizing groups to design PRIMR assessments. This is critical because it allows the focus of the teacher to be on the lessons upon which the assessment is built, not on the less-than-ideal structures in the existing examinations on the market. This means that the TAC tutor visits each school each term to track performance. (Provided for all treatment groups)
The USAID/PRIMR results (Piper & Mugenda, 2013; Piper & Mugenda, 2014; Piper, Kwayumba & Mugenda, 2014) have shown that these elements can have an impact on pupil achievement. This report investigates whether the findings are consistent in the DFID-funded counties.
1.4 Overall PRIMR Implementation Design
The DFID/Kenya Rural Expansion Programme is being undertaken in 834 schools in Machakos and Bungoma counties. Interventions are being undertaken in 251 schools in 2013 and 657 in 2014, with the full 834 schools implementing PRIMR by 2015. The final cohort of 177 schools will serve as control schools through 2014 and then be provided the most effective intervention in the beginning of 2015.
Tables 1a and 1b provide a graphical summary of the DFID/Kenya Rural Expansion Programme research design in Bungoma and Machakos counties. In brief, Treatment 1 is Full PRIMR, with schools in this treatment group receiving teachers’ guides for teachers, activity books for pupils, and targeted and specific teacher training in how to implement the teachers’ guides. Treatment 2 is Books & Training, with schools in this treatment group receiving training for teachers and activity books for pupils. This treatment trains teachers in how to use the pupil activity books to create lesson plans. Teachers do not use the scripted PRIMR teacher guides, but they have been trained to develop and use their own lesson
plans. Treatment 3 is Training Only with teachers of schools in this treatment group receiving only general training in how to prepare reading and mathematics lessons and how to improve their instructional practice. The teachers receive no additional teacher or pupil materials, or greater access to existing materials. Treatment 4 adds the dimension of mother-tongue instruction to the full PRIMR programme, making it the Full PRIMR + Mother Tongue programme. The schools under Treatment 4 are receiving mother-tongue materials (Lubukusu or Kikamba, depending on county), PRIMR style teachers’ guides and, activity books for pupils, and the teachers will be trained and supported in using these materials to develop pupils’ literacy in the selected languages. The control group will implement PRIMR in 2015. Tables 1a and 1b below summarise the research design and show the zonal level random assignments to treatment. Note that each zone in the county was eligible for selection, but zones that spoke mother tongue (as identified by the County Directors) were only eligible for the mother-tongue treatment.

DFID/PRIMR Rural Expansion: Midterm Report 5
Table 1a. Programme Implementation Design—Bungoma County
Location Started 2013 Started 2014 2015
District Zone Full
PRIMR Books + Training
Training Only
Full PRIMR Books + Training
Training Only
Full PRIMR + Mother Tongue
Full Implementatio
n
Bungoma East Ndivisi
Bungoma North Ndalo
Bumula Kabula
Kimilili Kimilili East
Bungoma East Webuye
Cheptais Kapkateny
Mt. Elgon Nomorio
Bumula Bumula
Bungoma West Butonge
Cheptais Emia
Mt. Elgon Kaptama
Bungoma North Tongaren
Cheptais Chepkube
Bungoma East Bokoli
Bungoma South Mwibale
Bungoma South Sang’alo
Kimilili Kimilili Central
Bungoma Central Kabuchai
Bungoma South Municipality
Cheptais Chesikaki
Cheptais Chongeywo
Mt. Elgon Elgon
SCHOOLS 41 39 42 38 41 32 96 91

DFID/PRIMR Rural Expansion: Midterm Report 6
Table 1b. Programme Implementation Design—Machakos County
Location Started 2013 Started 2014 2015
District Zone Full
PRIMR Books + Training
Training Only
Full PRIMR Books + Training
Training Only
Full PRIMR + Mother Tongue
Full Implementation
Masinga Kithyoko Mwala Mbiuni Masinga Kivaa Yatta Matuu Kangundo Kakuyuni Yatta Kithimani Mwala Wamuyu Matungulu Kianzabe Kathiani Iveti Masinga Ekalakala Mwala Yathui Mwala Kibauni Mwala Muthetheni Kangundo Manyatta Masinga Kangondi Machakos Kalama Mwala Kathama Masinga Muthesya Yatta Katangi Kangundo Kawathei Athi River Athi River Machakos Kola
SCHOOLS 39 40 50 44 36 49 70 86

DFID/PRIMR Rural Expansion: Midterm Report 7
1.5 PRIMR Implementation in 2013
This section highlights specific aspects of programme implementation during 2013. First we present the key activities and then details about the challenges that PRIMR (and the Kenyan education system) faced in 2013.
Starting in 2012, a subject panel comprised of the MOEST, PDIT members, SAGA representatives, Kenyan PRIMR staff and consultants developed teachers’ guides for Kiswahili, English and mathematics. The documents took into account the findings from the previous scope-and-sequence workshops, the findings from PRIMR in 2012, and involved the MOEST, SAGAs and the PDIT. The teachers’ guides for English, Kiswahili and mathematics were printed and distributed to schools for the zonal trainings in May 2013. Due to the March 2013 general election and the teachers’ strike that interrupted learning in Term 2, the teachers’ guides had been implemented for less than four months when the midterm data collection teams entered schools.
TAC tutor trainings in PRIMR implementation were held in May 2013, followed by teacher trainings at the zonal level. The teacher training was held at the respective zones led by the TAC tutors and supported by the PRIMR technical support team. The zonal locations of the trainings kept costs low. During the trainings, teachers were paired up according to the classes they teach such that a Class 1 teacher had a fellow Class 1 teacher as a partner. Throughout the training sessions, teachers were given time to practice various teaching approaches with their partners for the different lesson components. Additionally, teachers were asked to model both parts of lessons and full lessons in front of everyone. Later, the TAC tutor received feedback from the other teachers on areas well modeled and those areas in which the teacher needs to do more practice. Even with teachers’ practice and modeling sessions, these trainings proved quite complex, especially since it was the first time teachers in Bungoma and Machakos were learning about new approaches to teaching literacy and numeracy. Refresher trainings for TAC tutors and teachers were held for three days in September 2013.
After the May trainings, The TAC tutors and RTI field teams continued to support the teachers at the school level, during monthly zonal meetings, and collected observation data, which was keyed in at RTI’s Nairobi office. Each TAC tutor was required to visit each teacher twice a month and observe a lesson in literacy or numeracy and be supported by RTI staff. The observation would be followed by a reflection discussion with the teacher on what went well and what could be improved. If necessary, the TAC tutors were expected to model instructional methods for the teachers in areas that they found difficult. The observation data informed the PRIMR staff and TAC tutors on issues and areas that need follow-up among the teachers, and improved the precision of quantitative analysis as the project team measured the relationships between visits and pupil outcomes. As of January 2014, the observational data will be collected via tablet and uploaded to the cloud on a consistent basis.
The PRIMR programme also undertook reading contests in all zones. These contests attracted pupils, teachers, parents and officials from the District Education Officer’s office in the respective counties. This was the first time a reading contest was being conducted in the zones, and it elicited excitement from the teachers, parents, pupils, MOEST and TSC officers. From the reading contests, it was evident a number of pupils were able to read and do math, but that more work was necessary to ensure that improved learning outcomes were achieved by all.
Based on experiences and comments received from treatment schools, a planned revision of teacher and pupil materials in all three subjects was implemented in late 2013. These

DFID/PRIMR Rural Expansion: Midterm Report 8
materials included full colour illustrations and responded to the edits from the field teams. The PDIT was heavily involved, as were teachers active in the PRIMR initiative. The revised materials were ready for use at the beginning of the 2014 academic year and will be evaluated at the endline assessment in October 2014. Recall that the midterm evaluation in this report is assessing the impact of the black and white materials used in 2013.
1.5.1 Challenges of PRIMR Implementation in 2013
In this section we highlight the key challenges to PRIMR implementation during the 2013 academic year. They include the following.
1. The national elections that took place in March 2013 led to the late start of the programme. Most of the schools were being used as polling centres and the baseline was delayed in the respective counties. This translated to the programme starting at the beginning of the second term, which created a tall task to improve literacy and numeracy by substantial amounts prior to the midterm evaluation in October 2013.
2. The teachers’ strike that occurred in June 2013 heavily affected the coverage of the PRIMR lessons, which also affected the schools’ calendars, leading to some schools doing end-of-year exams at the time assessments were being conducted. Due to the teachers’ strike, the teachers’ guides had been implemented for less than four months when the midterm data collection teams entered schools.
3. Logistical challenges for the data collection processes were varied. They included the rainy season, inaccessible roads, the unavailability of some of the Government of Kenya (GOK) staff to help with location schools and the like.
4. The third term is essentially an examinations term, when the national examinations (KCPE and KCSE) are implemented in all primary and secondary schools. The TAC tutors were assigned to support exam administration during this time, and this reduced their participation in the teacher support expected by PRIMR.
5. Teachers’ transfer during the school year affected the project implementation. During the period covered by this evaluation, PRIMR has experienced the transfer of teachers trained in PRIMR lesson delivery, either to other schools or to other classes during the school year. This translated into a gap in the continuity of PRIMR implementation.
1.6 Early Grade Reading Assessment (EGRA)
EGRA was first tested in Kenya in Malindi 2007–2008 as a tool to evaluate literacy intervention. Since then, it has been used several times in Kenya. EGRA assesses a set of skills critical to early reading acquisition. The tailored version of the tool used for the DFID/Kenya PRIMR Rural Expansion Programme built upon the versions used earlier in Kenya. Table 2 below shows the different EGRA subtasks that pupils in Classes 1 and 2 were assessed in, by language.
Letter sound fluency: ability to identify the sounds of the letters fluently.
Decoding fluency: ability to decode non-words fluently
Segmenting: ability to identify and sound out each sound present in a word
Vocabulary: ability to tell the meaning of words
Oral reading fluency: ability to read a story fluently
Reading comprehension: ability to comprehend reading passages associated with a timed reading assessment

DFID/PRIMR Rural Expansion: Midterm Report 9
Listening comprehension: ability to understand a simple story read aloud to the learner
Maze: ability to determine which of three words best fits as the missing word
Table 2. EGRA Subtasks Implemented in DFID/PRIMR
EGRA Sections
October 2013 Midterm Study
Section English Kiswahili Kikamba Lubukusu
Section 1 Letter sound fluency Letter sound fluency Letter sound fluency Letter sound fluency
Section 2 Segmenting Syllable fluency Syllable fluency Syllable fluency
Section 3 Vocabulary Decoding fluency Decoding fluency Decoding fluency
Section 4 Decoding fluency a) Oral reading fluency
b) Reading comprehension
a) Oral reading fluency
b) Reading comprehension
a) Oral reading fluency
b) Reading comprehension
Section 5 a) Oral reading fluency
b) Reading comprehension
Listening comprehension
Listening comprehension
Listening comprehension
Section 6 Pupil context interview
Maze comprehension
It is worth noting that some of the subtasks assessed at midterm were different from the baseline subtasks. Table 3 below shows the different subtasks assessed at baseline and midterm evaluations.
Table 3. EGRA Subtasks at Baseline and Midterm Evaluation
Subtask BaselineMar. 2013
MidtermOct. 2013
Letter sound fluency Done Done
Segmenting - Done
Syllable fluency - Done
Vocabulary - Done
Decoding fluency Done Done
Oral reading fluency Done Done
Reading comprehension (oral) Done Done
Silent reading rate Done -
Reading comprehension (silent) Done -
Listening comprehension Done Done
Maze comprehension - Done

DFID/PRIMR Rural Expansion: Midterm Report 10
The syllable fluency, listening comprehension and maze subtasks were administered only for Kiswahili; the segmenting and vocabulary subtasks were administered only for English. All of the remaining subtasks, except syllable fluency and listening comprehension, were assessed in English, Kiswahili and mother tongue (Lubukusu and Kikamba). In addition, the EGRA English tool contained a section (pupil context interview) measuring a variety of learner background variables assumed to be correlates of pupil performance.
1.7 Early Grade Mathematics Assessment (EGMA)
Pupils in Classes 1 and 2 were also assessed in numeracy using EGMA. EGMA focuses on measuring basic mathematical skills, the aim being that introducing these concepts in the early years helps learners to build a base for learning more complex computational skills in the years that follow. Table 4 shows the EGMA subtasks as implemented in DFID/PRIMR in the two assessment periods.
Table 4. EGMA Subtasks Implemented in DFID/PRIMR
Subtasks Baseline Midterm
1. Number identification: ability to fluently identify numbers done done
2. Number discrimination: ability to fluently determine which of two numbers is larger, testing place value and number sense
done done
3. Missing number: ability to identify missing numbers using knowledge and application of number pattern skills
done done
4. Addition level 1: ability to add simple sums fluently, at different levels of complexity
done done
5. Addition level 2: ability to add simple sums fluently, at higher levels of complexity
done done
6. Subtraction level 1: ability to subtract simple differences fluently, at different levels of complexity
done done
7. Subtraction level 2: ability to subtract simple differences fluently, at higher levels of complexity
done done
8. Word problems: ability to solve basic word problems done done
2. Research Methodology
2.1 Overall Design
The PRIMR research design is organized to provide policy relevant results to the MOEST. The design of PRIMR utilized random selection at the zonal level and then random assignment to treatment and cohort. At the initial stage, DFID/Kenya and the MOEST agreed that the interventions should be implemented in Bungoma and Machakos counties. Random selection of zones was done before random assignment to treatment. Table 5 below shows the summary of PRIMR implementation. There are three cohorts for DFID/PRIMR, differentiated by when the cohorts begin their implementation of PRIMR. PRIMR is supporting 834 schools over its lifetime. In 2013, PRIMR was implemented in 251 schools. It is the impact of PRIMR on those 251 schools in comparison to the control groups that is the topic of this report. This number will increase in 2014, while the total number of schools where PRIMR is currently being implemented is 657. The final cohort of 177 control schools

DFID/PRIMR Rural Expansion: Midterm Report 11
will serve as control schools through 2014 and then be provided the most effective intervention in the beginning of 2015.
Table 5. Summary of PRIMR Implementation Programme
2013 2014 2015
Cohort 1
251 schools Full PRIMR: 80 schools
14 zones Books & Training: 79 schools
Training Only: 92 schools
Cohort 2
406 schools Full PRIMR: 82schools
20 zones Books & Training: 77 schools
Training Only: 81 schools
Mother Tongue: 166 schools
Cohort 3 (Control) 177 schools
10 zones
2.2 Sampling and Sample Sizes
For the DFID baseline, approximately 40% of schools from each of the randomly selected zones were sampled, for a sample of 3408 pupils in 171 schools. However, because of limited resources during the midterm evaluation in October 2013, it was decided that using the same sample of zones (and therefore schools) as that utilized in the baseline evaluation would not bias the midterm evaluation results. Consequently, we randomly selected 5 schools from the schools that were originally randomly sampled at baseline in each sampled zone for a sample of 4588 pupils from 230 schools in Bungoma (115 schools) and Machakos (115 schools). Therefore, the midterm sample is a sample of the baseline sample. In each sampled school, 10 Class 1 and 10 Class 2 pupils were sampled using systematic random sampling techniques, stratifying by gender. Table 6 shows the number of pupils sampled from zones in Bungoma and Machakos counties during the midterm.
Table 6. Midterm Sample Size by Gender and Class in Bungoma and Machakos
Gender Class 1 Class 2 Totals
Girls 1,142 1,147 2,289
Boys 1,155 1,144 2,299
Total 2,297 2,291 4,588
2.3 Data Collection
As earlier noted, the midterm evaluation described in this report was a collaboration among DFID/Kenya, Research Triangle Institute (RTI) International, MOEST, TSC, KNEC, KICD, KEMI and KISE. Preparations for the PRIMR midterm evaluation started in August 2013. The PRIMR monitoring and evaluation team held a planning meeting in Nairobi from 26th to 30th August to review the EGRA and EGMA tools and identify the 70 enumerators involved in the data collection. The training of the enumerators for the midterm data collection and pretesting of tools was held from 23rd to 27th September. The enumerators were taken

DFID/PRIMR Rural Expansion: Midterm Report 12
through the EGRA and EGMA tools using the Tangerine application on tablets. They also practiced conducting the assessments in pairs. Interrater reliabilities were conducted for the three assessments and the results were all over 95%, which is much higher than basic acceptable levels. The enumerators also pre-tested the tools in non-PRIMR schools. The enumerators were deployed to the field for 19 days from 30th September to 24th October for data collection.
Table 7 below shows the pupils assessed by cohort in the baseline and midterm studies. This shows that at the baseline, PRIMR did not assess in the Cohort 2 schools because they did not change their treatment status between March 2013 and October 2013. For Cohort 2, the midterm study serves as their baseline.
Table 7. Pupils Assessed in EGRA/EGMA Baseline and Midterm Assessments by Cohort
Cohorts Assessed
Baseline Midterm Endline
Mar‐13 October October
2013 2014
Cohort 1 2,006 1,398 TBD
Cohort 2 0 2,241
Cohort 3 (control) 1,303 949
Total 3,309 4,588
An assessor carrying out EGRA/EGMA in Bungoma An assessor carrying out EGRA/EGMA in Machakos
3. Reliability Estimates Reliability analyses were conducted on the English EGRA, Kiswahili EGRA, Kikamba EGRA, Lubukusu EGRA and mathematics EGMA subtasks. Using Pearson correlations, reliability coefficients among the subtasks in each tool were computed. Cronbach’s alpha for each subtask in each tool was also computed. These statistical tests are used to determine the internal consistency of each tool by assessing the degree to which subtasks in each tool are consistently measuring the same construct.

DFID/PRIMR Rural Expansion: Midterm Report 13
Table 8 shows the computed correlations for the EGRA English subtasks. All the coefficients were statistically significant (p<.001). Oral reading fluency and decoding fluency were strongly correlated, implying that they were measuring the same construct, that is, the ability to read. Oral reading fluency was strongly correlated with reading comprehension, which implies that performance on the ability to read connected text was connected to the comprehension outcome, as one would expect. Generally, correlations that fall in the category ≤ -0.50 and ≥ +0.50 are considered strong. Moderate correlations, generally considered to fall between ±0.30 and ±0.49, were observed between vocabulary and letter sound fluency, between segmenting and decoding fluency, between vocabulary and decoding fluency, between reading comprehension and decoding fluency, between segmenting and both oral reading fluency and vocabulary and between reading comprehension and vocabulary. Other strongly correlated subtasks were between letter sound fluency and decoding fluency and between letter sound fluency and segmenting.
Correlations between 0 and ±0.29 are considered weak, and weak correlations were found between segmenting and reading comprehension and between letter sound fluency and reading comprehension.
Table 8. Pearson Correlations for EGRA Subtasks in English
Letter Sound
Fluency
Decoding Fluency
SegmentingOral
Reading Fluency
Vocabulary Reading
Comprehension
Letter sound fluency
1.00
Decoding fluency
0.61*** 1.00
Segmenting 0.59*** 0.43*** 1.00
Oral reading fluency
0.48*** 0.83*** 0.36*** 1.00
Vocabulary 0.36*** 0.45*** 0.31*** 0.45*** 1.00
Reading comprehension
0.28*** 0.44*** 0.24*** 0.55*** 0.35*** 1.00
*p < .05, **p < 0.01, ***p <.001
Table 9 shows the Cronbach’s alpha coefficients for the EGRA English tool. The highest coefficient of 0.82 was found in segmenting, vocabulary and reading comprehension. The lowest coefficient was 0.77 for both decoding fluency and oral reading fluency. These results show that the EGRA English tool was reliable for assessing the midterm group of pupils, with an overall reliability coefficient of 0.83.
Table 9. Cronbach’s Alpha for EGRA Subtasks in English
Subtask Item-test Correlation Item-rest Correlation Alpha
Letter sounds 0.75 0.62 0.80
Decoding fluency 0.85 0.77 0.77
Segmenting 0.66 0.50 0.82
Oral reading fluency 0.83 0.74 0.77
Vocabulary 0.66 0.50 0.82
Reading comprehension 0.65 0.48 0.82

DFID/PRIMR Rural Expansion: Midterm Report 14
Subtask Item-test Correlation Item-rest Correlation Alpha
Totals 0.83
3.1 Kiswahili EGRA Tool Analysis
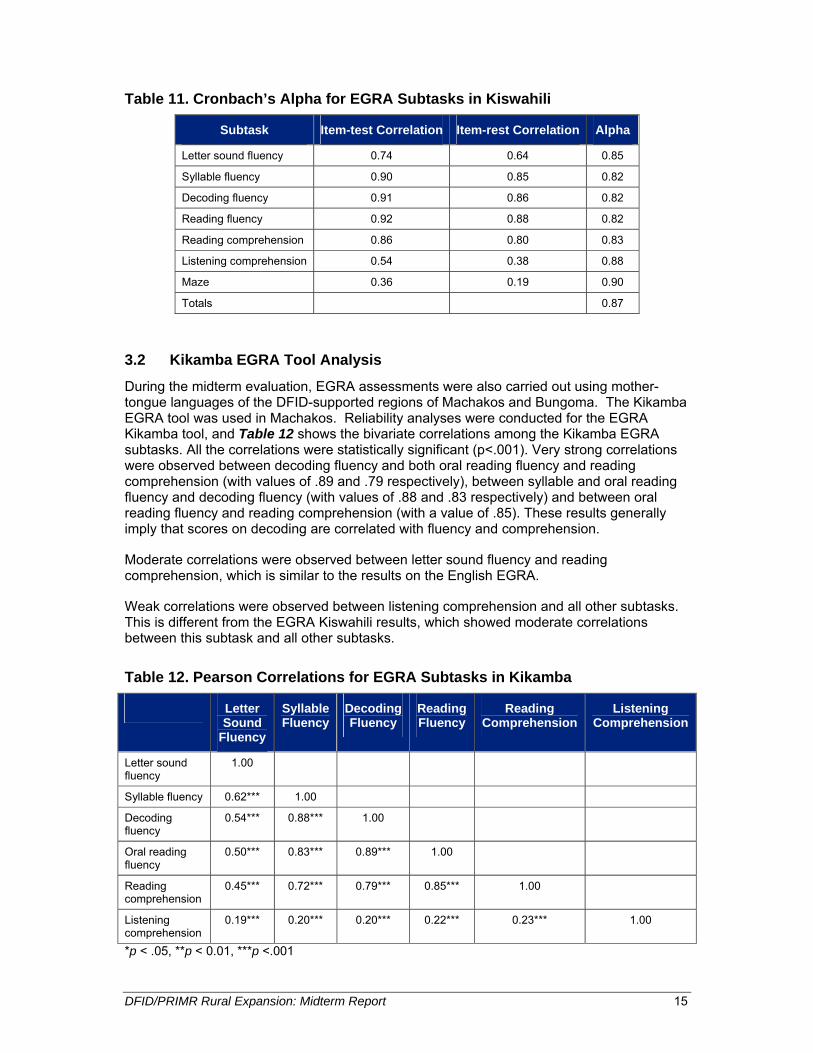
Reliability analyses were also conducted for the EGRA Kiswahili tool. Table 10 shows the bivariate correlations among the EGRA Kiswahili subtasks. All the correlations were statistically significant (p<.001) as shown. Very strong correlations (r=≤ -0.50 OR ≥ +0.50) were observed between decoding fluency and oral reading fluency, between decoding fluency and syllable, between reading fluency and syllable, between reading fluency and reading comprehension and between decoding and reading comprehension. These results generally imply that pupils who can decode can also read connected text and comprehend what they read to a reasonable degree. Moderately strong correlations were observed between syllable and reading comprehension and between letter sound fluency and all other subtasks, except listening comprehension and maze. The listening comprehension subtask was also moderately correlated with all the other subtasks, except listening comprehension.
Weak correlations were observed between listening comprehension and letter sound fluency and between the maze and all other subtasks. This implies that the maze subtask was assessing a different skill construct from the other subtasks.
Table 10. Pearson Correlations for EGRA Subtasks in Kiswahili
Letter Sound
Fluency
Syllable Fluency
Decoding Fluency
Reading Fluency
Reading Comprehension
Listening Comprehension
Maze
Letter sound fluency
1.00
Syllable fluency
0.71*** 1.00
Decoding fluency
0.62*** 0.89*** 1.00
Oral reading fluency
0.63*** 0.88*** 0.93*** 1.00
Reading comprehension
0.55*** 0.75*** 0.79*** 0.85*** 1.00
Listening comprehension
0.28*** 0.34*** 0.34*** 0.34*** 0.39*** 1.00
Maze 0.10*** 0.14*** 0.18*** 0.19*** 0.19*** 0.11*** 1.00 *p < .05, **p < 0.01, ***p <.001
Table 11 shows the Cronbach’s alpha coefficients for the EGRA Kiswahili tool. The highest coefficient of 0.90 was found in maze while the lowest coefficient was 0.82 for syllable, decoding fluency and reading fluency. These results show that the EGRA Kiswahili tool was reliable for assessing the midterm group of pupils, with an overall reliability coefficient of 0.87.
DFID/PRIMR Rural Expansion: Midterm Report 15
Table 11. Cronbach’s Alpha for EGRA Subtasks in Kiswahili
Subtask Item-test Correlation Item-rest Correlation Alpha
Letter sound fluency 0.74 0.64 0.85
Syllable fluency 0.90 0.85 0.82
Decoding fluency 0.91 0.86 0.82
Reading fluency 0.92 0.88 0.82
Reading comprehension 0.86 0.80 0.83
Listening comprehension 0.54 0.38 0.88
Maze 0.36 0.19 0.90
Totals 0.87
3.2 Kikamba EGRA Tool Analysis
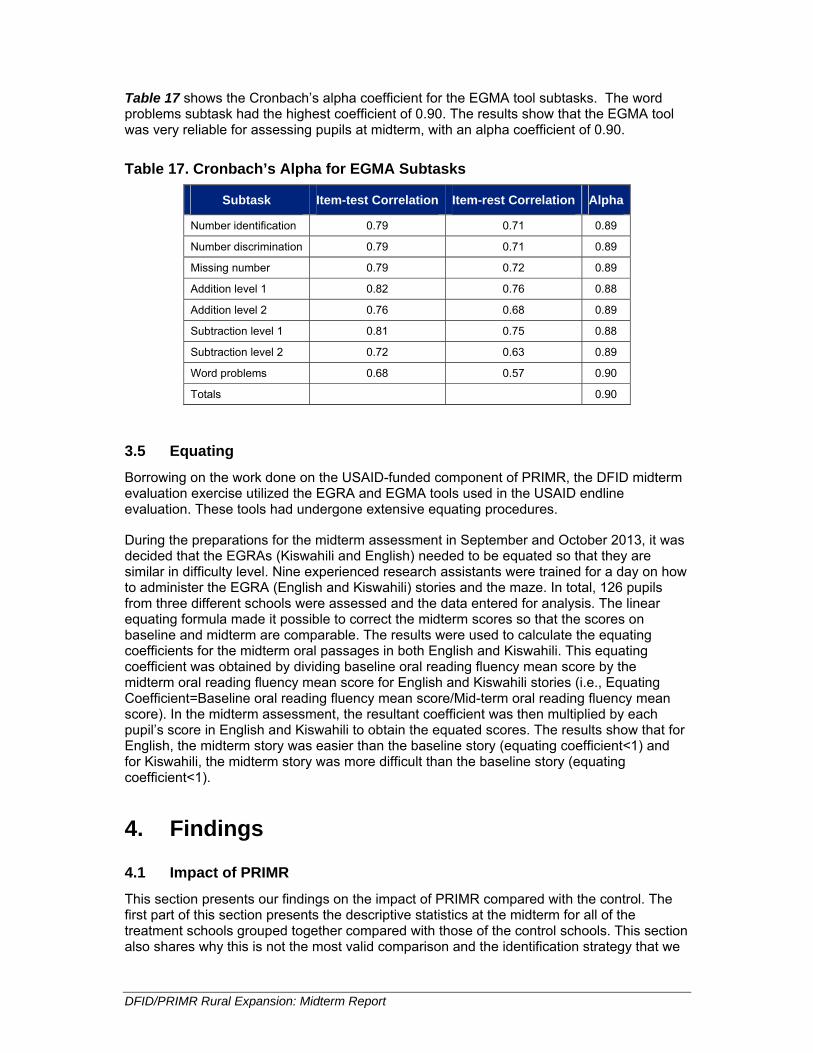
During the midterm evaluation, EGRA assessments were also carried out using mother-tongue languages of the DFID-supported regions of Machakos and Bungoma. The Kikamba EGRA tool was used in Machakos. Reliability analyses were conducted for the EGRA Kikamba tool, and Table 12 shows the bivariate correlations among the Kikamba EGRA subtasks. All the correlations were statistically significant (p<.001). Very strong correlations were observed between decoding fluency and both oral reading fluency and reading comprehension (with values of .89 and .79 respectively), between syllable and oral reading fluency and decoding fluency (with values of .88 and .83 respectively) and between oral reading fluency and reading comprehension (with a value of .85). These results generally imply that scores on decoding are correlated with fluency and comprehension.
Moderate correlations were observed between letter sound fluency and reading comprehension, which is similar to the results on the English EGRA.
Weak correlations were observed between listening comprehension and all other subtasks. This is different from the EGRA Kiswahili results, which showed moderate correlations between this subtask and all other subtasks.
Table 12. Pearson Correlations for EGRA Subtasks in Kikamba
Letter Sound
Fluency
Syllable Fluency
Decoding Fluency
Reading Fluency
Reading Comprehension
Listening Comprehension
Letter sound fluency
1.00
Syllable fluency 0.62*** 1.00
Decoding fluency
0.54*** 0.88*** 1.00
Oral reading fluency
0.50*** 0.83*** 0.89*** 1.00
Reading comprehension
0.45*** 0.72*** 0.79*** 0.85*** 1.00
Listening comprehension
0.19*** 0.20*** 0.20*** 0.22*** 0.23*** 1.00
*p < .05, **p < 0.01, ***p <.001

DFID/PRIMR Rural Expansion: Midterm Report 16
Table 13 shows the Cronbach’s alpha coefficients for the EGRA Kikamba tool. Listening comprehension had the highest coefficient of 0.92 while the lowest coefficient was 0.82 for syllable fluency, decoding fluency and reading fluency. These results show that the EGRA Kikamba tool was quite reliable for assessing the midterm group of pupils, with an overall reliability coefficient of 0.87.
Table 13. Cronbach’s Alpha for EGRA Subtasks in Kikamba
Subtask Item-test Correlation Item-rest Correlation Alpha
Letter sound fluency 0.70 0.56 0.87
Syllable fluency 0.90 0.84 0.82
Decoding fluency 0.91 0.86 0.82
Oral reading fluency 0.91 0.86 0.82
Reading comprehension 0.85 0.78 0.83
Listening comprehension 0.43 0.24 0.92
Totals 0.87
3.3 Lubukusu EGRA Tool Analysis
Reliability analyses were also conducted for the EGRA Lubukusu tool, and Table 14 shows the bivariate correlations among the Lubukusu EGRA subtasks. All the correlations were statistically significant (p<.001) as shown in Table 14 below.
Strong correlations (with a value of .79) were observed between decoding fluency and syllable fluency, between letter sound fluency and both syllable fluency and decoding fluency (with values of .59 and .54 respectively), between decoding and both reading fluency and reading comprehension (with values of .61 and .54 respectively) and between reading fluency and reading comprehension (with a value of .56). These results generally imply that pupils who are able to decode can also read connected text and comprehend what they read to a reasonable degree.
Moderate correlations were observed between letter sound fluency and oral reading fluency and between syllable fluency and both oral reading fluency and reading comprehension. Weak correlations were observed between listening comprehension and all other subtasks, implying that this task assessed a different skill construct from the other subtasks. This result is similar to that of the Kikamba EGRA, though the correlations for the Lubukusu EGRA are lower than those of the Kikamba EGRA.
Table 14. Pearson Correlations for EGRA Subtasks in Lubukusu
Letter Sound
Fluency
Syllable Fluency
Decoding Fluency
Reading Fluency
Reading Comprehension
Listening Comprehension
Letter sound fluency
1.00
Syllable fluency 0.59*** 1.00
Decoding fluency
0.54*** 0.79*** 1.00
Oral reading 0.32*** 0.49*** 0.61*** 1.00

DFID/PRIMR Rural Expansion: Midterm Report 17
Letter Sound
Fluency
Syllable Fluency
Decoding Fluency
Reading Fluency
Reading Comprehension
Listening Comprehension
fluency
Reading comprehension
0.23*** 0.38*** 0.54*** 0.56*** 1.00
Listening comprehension
0.09*** 0.07*** 0.05*** 0.06*** 0.17*** 1.00
*p < .05, **p < 0.01, ***p <.001
Table 15 shows the Cronbach’s alpha coefficients for the EGRA Lubukusu tool. Listening comprehension had the highest coefficient of 0.83, while decoding fluency had the lowest coefficient at 0.68. These results show that the EGRA Lubukusu tool was also reliable for assessing the midterm group of pupils, with an overall reliability coefficient of 0.77.
Table 15. Cronbach’s Alpha for EGRA Subtasks in Lubukusu
Subtask Item-test Correlation Item-rest Correlation Alpha
Letter sound fluency 0.67 0.50 0.75
Syllable fluency 0.80 0.69 0.70
Decoding fluency 0.85 0.77 0.68
Oral reading fluency 0.74 0.59 0.72
Reading comprehension 0.69 0.53 0.74
Listening comprehension 0.35 0.11 0.83
Totals 0.77
3.4 EGMA Tool Analysis
Table 16 shows the bivariate correlations among the subtasks in the EGMA tool. All the coefficients were statistically significant (p<.001). Subtraction and addition level 1 had the highest correlation coefficient of 0.73, which was expected because subtraction and addition are computational tasks, and those who can subtract numbers correctly also tend to add numbers correctly. This argument also applies to subtraction level 2 and addition level 2, which were strongly correlated.
All the EGMA subtasks had moderate to strong correlations with one another. Addition level 1 and subtraction level 1 had the highest correlation of 0.73 while the lowest correlation was observed between number identification and both subtraction level 2 and word problems, which implies that this subtask measured a different construct from the other subtasks.

DFID/PRIMR Rural Expansion: Midterm Report 18
Table 16. Pearson Correlations for EGMA Subtasks
Number Identification
Number Discrimination
Missing Number
Addition Level 1
Addition Level 2
Subtraction Level 1
Subtraction Level 2
Word Problems
Number identification
1.00
Number discrimination
0.67*** 1.00
Missing number 0.65*** 0.65*** 1.00
Addition level 1 0.65*** 0.60*** 0.61*** 1.00
Addition level 2 0.49*** 0.49*** 0.50*** 0.57*** 1.00
Subtraction level 1 0.58*** 0.58*** 0.57*** 0.73*** 0.54*** 1.00
Subtraction level 2 0.40*** 0.44*** 0.45*** 0.47*** 0.71*** 0.54*** 1.00
Word problems 0.40*** 0.46*** 0.46*** 0.47*** 0.45*** 0.50*** 0.46*** 1.00
*p < .05, **p < 0.01, ***p <.001
DFID/PRIMR Rural Expansion: Midterm Report
Table 17 shows the Cronbach’s alpha coefficient for the EGMA tool subtasks. The word problems subtask had the highest coefficient of 0.90. The results show that the EGMA tool was very reliable for assessing pupils at midterm, with an alpha coefficient of 0.90.
Table 17. Cronbach’s Alpha for EGMA Subtasks
Subtask Item-test Correlation Item-rest Correlation Alpha
Number identification 0.79 0.71 0.89
Number discrimination 0.79 0.71 0.89
Missing number 0.79 0.72 0.89
Addition level 1 0.82 0.76 0.88
Addition level 2 0.76 0.68 0.89
Subtraction level 1 0.81 0.75 0.88
Subtraction level 2 0.72 0.63 0.89
Word problems 0.68 0.57 0.90
Totals 0.90
3.5 Equating
Borrowing on the work done on the USAID-funded component of PRIMR, the DFID midterm evaluation exercise utilized the EGRA and EGMA tools used in the USAID endline evaluation. These tools had undergone extensive equating procedures.
During the preparations for the midterm assessment in September and October 2013, it was decided that the EGRAs (Kiswahili and English) needed to be equated so that they are similar in difficulty level. Nine experienced research assistants were trained for a day on how to administer the EGRA (English and Kiswahili) stories and the maze. In total, 126 pupils from three different schools were assessed and the data entered for analysis. The linear equating formula made it possible to correct the midterm scores so that the scores on baseline and midterm are comparable. The results were used to calculate the equating coefficients for the midterm oral passages in both English and Kiswahili. This equating coefficient was obtained by dividing baseline oral reading fluency mean score by the midterm oral reading fluency mean score for English and Kiswahili stories (i.e., Equating Coefficient=Baseline oral reading fluency mean score/Mid-term oral reading fluency mean score). In the midterm assessment, the resultant coefficient was then multiplied by each pupil’s score in English and Kiswahili to obtain the equated scores. The results show that for English, the midterm story was easier than the baseline story (equating coefficient<1) and for Kiswahili, the midterm story was more difficult than the baseline story (equating coefficient<1).
4. Findings
4.1 Impact of PRIMR
This section presents our findings on the impact of PRIMR compared with the control. The first part of this section presents the descriptive statistics at the midterm for all of the treatment schools grouped together compared with those of the control schools. This section also shares why this is not the most valid comparison and the identification strategy that we

DFID/PRIMR Rural Expansion: Midterm Report
chose to ensure we can identify the impact of PRIMR, called difference-in-differences analysis.
4.1.1 Descriptive Statistics at Midterm by Treatment and Control Schools
A key research question that this midterm evaluation report is tasked with answering is determining whether PRIMR had an effect on literacy and math outcomes. Table 18 presents the overall findings at midterm of the English subtasks disaggregated by treatment and control schools. These findings are from the svy: mean command in STATA and simply present the weighted midterm scores without any corrections.
As already mentioned, Table 18 shows the mean scores for English in treatment schools against the mean scores in control schools, for both Class 1 and 2. The standard deviation has been included in the results to aid in determining the programme effect and effect size as shown in Table 18. Note that these results combine all three treatment groups and do not account for the greater likelihood that PRIMR control schools were in urban locations.1 The results indicate that control schools performed better than treatment schools in nearly all English subtasks, except segmenting. The simple analysis at the midterm means that the PRIMR programme appears to have had a negative impact, though this is explained due to the differences at baseline advantaging control schools. The results indicate that reading comprehension in control schools (6.6%) was thrice that in treatment schools (1.8%), though both scores were abysmally low. Similar results were observed among fluent readers, where control schools (4.3%) had four times more fluent readers than treatment schools (1.1%) and in the percentage of emergent readers, where control schools (20.9%) had twice as high a percentage as treatment schools (9.9%).
Table 18. Programme Effect and Effect Sizes for English
Subtask
Treatment Control Programme Impact
Mean Std
Error Mean Std
Error Standard Deviation
Programme Effect
Effect Size
Letter sound fluency (clspm) 11.6 0.6 11.1 1.5 15.3 0.5 0.03
Decoding fluency (cwpm) 7.1 0.4 10.1 1.7 13.0 -3.0 -0.23
Segmenting (%) 10.4 0.9 6.4 0.9 19.5 4.0 0.21
Reading fluency (cwpm) 7.6 0.5 13.3 2.6 18.6 -5.7 -0.31
Vocabulary (%) 38.6 1.2 44.2 2.9 20.0 -5.6 -0.28
Reading comprehension (%) 1.8 0.2 6.6 2.1 13.2 -4.8 -0.36
Fluent (%) 1.1 0.2 4.3 1.2 15.1 -3.2 -0.21
Emergent readers(%) 9.9 0.9 20.9 5.0 34.5 -11.0 -0.32
Overall -0.18
1 The random assignment of zones to treatment groups meant that the two most urban zones selected for control; Athi River in Machakos and Bungoma Municipality in Bungoma were both assigned to control. Their outcomes at the baseline were much higher than those in other rural zones.

DFID/PRIMR Rural Expansion: Midterm Report
Similar results were observed in EGRA Kiswahili subtasks shown in Table 19 below. However, in EGRA Kiswahili, it was only in the maze subtask that treatment schools performed marginally better than control schools. The percentage of emergent and fluent readers is higher in Kiswahili than in English, even though both still represent a very low percentage compared to expected benchmarks. Emergent readers were higher in control schools (31.5%) than treatment schools (21.5%), and this group of pupils was also larger in Kiswahili than it was in English. The percentage of fluent pupils in control schools (4.9) was double that of treatment schools (2.4%). Similarly, the percentage of fluent readers in Kiswahili was also higher than that in English (4.3% in control schools and 1.1% in treatment schools).
Table 19. Programme Effect and Effect Sizes for Kiswahili
Subtask
Treatment Control Programme Impact
Mean Std
Error MeanStd
Error Standard Deviation
Programme Effect
Effect Size
Letter sound fluency (clspm) 11.3 0.7 12.2 1.7 16.7 -0.9 -0.05
Syllable fluency (cwpm) 14.8 0.9 18.3 2.0 20.5 -3.5 -0.17
Decoding fluency (cwpm) 6.4 0.4 8.7 1.2 11.8 -2.3 -0.19
Reading fluency (cwpm) 7.8 0.5 11.2 1.7 14.3 -3.4 -0.24
Reading comprehension (%) 8.7 0.6 11.7 1.5 18.9 -3.0 -0.16
Listening comprehension (%) 31.1 1.1 40.3 2.8 26.2 -9.2 -0.35
Maze percentage (%) 14.9 0.5 14.6 0.9 12.1 0.3 0.03
Fluent (%) 2.4 0.4 4.9 1.3 18.0 -2.5 -0.14
Emergent readers (%) 21.5 1.4 31.5 4.8 42.7 -10 -0.23
Overall -0.17
The results in Annex 1 represent the descriptive statistics for EGRA English and EGRA Kiswahili, disaggregated by language, treatment group, class and gender. The results indicate that the performance of pupils in control schools over treatment schools was relatively similar for boys and girls. In all the subtasks in EGRA English and EGRA Kiswahili and across all the treatment groups, girls performed better than boys. Other studies have indicated that girls perform better than boys in lower grades, and the midterm evaluation results support this fact (Piper & Mugenda, 2013; Piper & Mugenda, 2014).
Table 20 shows the results for EGMA subtasks. In mathematics, similar to EGRA English and EGRA Kiswahili, the control schools had higher scores in all the subtasks than treatment schools. Marginal differences were observed between pupils’ performance in control schools and treatment schools in addition fluency and subtraction fluency, while substantially larger differences were observed in missing number and word problems. Word problems were much better in control schools, with 34.6% correct, compared to treatment, which was at 29.8%. Addition and subtraction level 2 were higher, with 19.2% and 12.8% respectively, compared to the treatment schools, which had 15.4% and 10.8% respectively. The addition fluency subtask saw control schools outperform treatment by 0.6 items per minute, and the quantity discrimination subtask saw pupils in control schools performing 2.3% better.

DFID/PRIMR Rural Expansion: Midterm Report
Table 20. Programme Effect and Effect Sizes for Mathematics
Subtask
Treatment Control Programme Impact
Mean Std
Error MeanStd
Error Standard Deviation
Programme Effect
Effect Size
Number ID fluency (cpm) 13.1 0.4 14.7 0.9 9.6 -1.6 -0.17
Quantity discrimination (%) 41.5 1.7 43.8 3.1 31.1 -2.3 -0.07
Missing number (%) 23.8 0.7 27.8 1.6 17.7 -4.0 -0.23
Addition fluency (cpm) 6.6 0.2 7.2 0.4 4.4 -0.6 -0.14
Additional level 2 (%) 15.4 1.2 19.3 2.5 25.2 -3.9 -0.15
Subtraction fluency (cpm) 4.3 0.2 4.7 0.3 4.0 -0.4 -0.10
Subtraction level 2 (%) 10.8 1.1 12.8 2.2 20.5 -2.0 -0.10
Word problems (%) 29.8 1.4 34.6 2.7 26.9 -4.8 -0.18
Overall -0.14
Annex 2 shows the descriptive statistics for EGMA, by treatment group, class and gender, for both treatment and control schools. Similar to findings in EGRA English and EGRA Kiswahili, the findings indicate that for all the EGMA subtasks, Class 2 pupils in each treatment group, including control schools, outperformed their Class 1 counterparts. This outcome is expected and is similar to that determined by previous studies conducted by PRIMR (Piper and Mugenda, 2013).
The results further indicate that the performance of pupils in control schools over treatment schools was relatively similar for boys and girls. However, in all the EGMA subtasks across all the treatment groups, girls performed better than boys. These findings further support arguments from other studies, which have indicated that girls perform better than boys in lower grades (Piper & Mugenda, 2013; Piper & Mugenda, 2014).
In the annex, the descriptive statistics by treatment group are presented from the October 2013 assessment. These have no correction for baseline scores or urbanicity. The basic analysis of outcomes across the three subjects these two unwieldy tables in the annexes (Annex 1 and Annex 2) reveals that pupils in PRIMR treatment groups are not doing better on average than the control, and for the most part, their outcomes are lower than control, even after PRIMR intervention since May 2013.
4.1.2 Descriptive Statistics at Midterm for EGRA Lubukusu and EGRA Kikamba
The baseline mother-tongue assessments were carried out during the October 2013 data collection. Listening comprehension had higher scores than the other subtasks, measuring percentages correct, with 45.7% and 72.5% of Class 2 pupils comprehending the material that was read to them in Lubukusu and Kikamba respectively. Reading comprehension had a dismal mean score of 2.5% and 13.3% correct, implying that only a very small proportion of the assessed pupils can understand even the basic text that they read in Lubukusu and Kikamba respectively. This is logical given that the oral reading fluency scores were only 5.7 cwpm in Lubukusu and 13.1 cwpm in Kikamba.

DFID/PRIMR Rural Expansion: Midterm Report
Table 21 below shows that pupils had higher scores on the Kikamba assessment subtasks than on the Lubukusu assessment subtasks. Given that the people groups are very different, it is difficult to say which language they did better on. It is notable that the listening comprehension scores are so much higher for Kikamba compared to for Lubukusu and causes us to wonder whether Lubukusu is as widely spoken in these parts of Bungoma county as the county officials assume. For both languages, however, results are very low, and seem to actually be lower than either English or Kiswahili, though those languages are not the mother tongue.
Table 21. Descriptive Statistics for Lubukusu and Kikamba in Class 2
Subtask Lubukusu Kikamba
Mean Std Error Mean Std Error
Letter sound fluency (clspm) 11.7 0.9 17.4 0.9
Syllable fluency (cwpm) 14.5 1.2 23.6 0.9
Decoding fluency (cwpm) 5.4 0.6 11.1 0.6
Reading fluency (cwpm) 5.7 0.9 13.1 0.7
Reading comprehension (%) 2.5 0.7 13.3 0.8
Listening comprehension (%) 45.7 1.9 72.5 0.9
4.1.3 PRIMR Effect from Difference-in-Differences
Measuring the impact of a programme is difficult when one only examines the outcomes at one point in time. For this DFID report, this is particularly true, since the baseline results showed that the randomly selected control groups had a larger population of urban schools and that urbanicity had an impact on outcomes (Piper & Mugenda, 2013). The research design of PRIMR is able to utilize the structure of the selection process to estimate the impact of PRIMR using the difference-in-differences model.
In this section of the report, we present the causal gain associated with the various PRIMR treatment groups from the difference-in-differences (DID) models. The columns for Full PRIMR, Books & Training and Training Only present the DID estimate for the causal impact of that particular PRIMR treatment group compared with control. The column for Effect Size measures the causal effect against the standard deviation (SD) for each measure at a particular grade.
For the PRIMR English programme, it is worth noting that the materials are designed to support the pupils in their ability to understand how English and Kiswahili relate, such that pupils are introduced to letters and sounds first in Kiswahili and subsequently in English. This allows the programme to follow established research findings and to have an efficient manner of learning to read and comprehend English. In Class 1, the first seven weeks of English lessons were oral, and it is only in Week 8 that pupils are expected to know the sounds of English. The English programme systematically teaches pupils the basics of literacy, including listening, speaking, reading and writing.
Table 22 shows the causal effect for all three treatment groups for Class 1 and Class 2. For letter sound fluency, we see that all three treatment groups and both classes had a large impact on pupil achievement. In Class 1, the Books & Training group had the largest causal impact (10.4 clpm) and effect size (0.81 SD). For Class 2, the Full PRIMR group had the largest impact (17.2 clpm) and effect size (1.04 SD). For decoding fluency, the impact of Full PRIMR was highest for Class 1 (0.11 SD) and for Class 2 (0.25 SD). For oral reading

DFID/PRIMR Rural Expansion: Midterm Report
fluency, the effect size of Full PRIMR was highest for Class 1 (0.01 SD) and Class 2 (0.12 SD), though this was the case because the other two treatment groups had a negative impact on oral reading fluency. For comprehension, only Books & Training had a positive effect in Class 1 (0.14 SD). The other effects were negative, if they were statistically significant at all.
While in the USAID PRIMR study we focused heavily on the impact of PRIMR on the proportion of pupils able to read at the fluent benchmark for literacy (from KNEC), in this report we primarily focus on those who could reach the emergent benchmark for literacy. We made this distinction because the achievement levels for the DFID counties were lower than for the USAID counties, and because very few if any pupils reached the fluent benchmark in the DFID study. For the emergent measure, results were poor in Class 1, with negative impacts shown (though Full PRIMR did best of the treatment groups). In Class 2, Full PRIMR had a small positive impact.
The average overall effect size for the three treatment groups was small in Class 1, though PRIMR had the largest effect size at .10 SD. The short duration between May and September 2013 limited the ability of PRIMR to dramatically improve achievement in Class 1. For Class 2, the impacts of Books & Training and Training Only were still very low, with Full PRIMR achieving a moderate impact of 0.25 SD.
In summary, the PRIMR impact on English was modest, with much larger gains coming from the Full PRIMR treatment group than from the other two treatment groups. Notably, impacts were larger in Class 2 than in Class 1.

DFID/PRIMR Rural Expansion: Midterm Report 25
Table 22. Impact of PRIMR on English Outcomes
Class 1 Effects Class 2 Effects
Full PRIMR
Effect Size
Books & Training
EffectSize
Training Only
Effect Size
Full PRIMR
EffectSize
Books & Training
EffectSize
Training Only
EffectSize
Letter sound fluency (correct letters per min)
9.2 0.71 10.4 0.81 7.3 0.56 17.2 1.04 14.7 0.89 9.7 0.59
Decoding fluency (correct non-words per min)
0.9 0.11 -0.4 -0.05 -0.6 -0.07 3.5 0.25 -0.1 -0.01 -0.9 -0.06
Oral reading fluency (correct words per min)
0.1 0.01 -1.4 -0.17 -1.3 -0.16 2.5 0.12 -3.7 -0.17 -3.3 -0.16
Reading comprehension (# correct out of 5 questions)
-0.5 -0.14 0.5 0.14 -0.1 0.44 -3.1 -0.22 -2.6 -0.18 -2.6 -0.18
Emergent readers (% of pupils reading 30 wpm+)
-3.5 -0.22 -5.7 -0.35 -5.0 -0.31 3.0 0.08 -6.6 -0.17 0.5 0.01
Average Effect Size 0.10 0.01 -0.00 0.25 0.07 0.04

DFID/PRIMR Rural Expansion: Midterm Report 26
The PRIMR approach is organized to support a pupil’s acquisition of Kiswahili as a primary language of literacy engagement. Pupils are systematically taught two letters per week from the beginning of Class 1 and by the end of Class 1 are able to read any sound and decode the key words in Kiswahili. The Kiswahili programme emphasizes vocabulary development and comprehension strategies and engages the learner across the spectrum of learning outcomes expected by the KICD syllabus.
This section and Table 23 below present a comparison between the causal impact of PRIMR in the three treatment groups for Kiswahili. The results for Kiswahili letter sound fluency show that the PRIMR effect was 8.1 clpm for Full PRIMR, 8.5 clpm for Books & Training, and 6.0 for Training Only in Class 1. The gains were remarkably similar. For Class 2, the causal gains were highest in Full PRIMR (16.6 clpm), but still large for Books & Training (12.3 clpm) and Training Only (7.1 clpm). Impacts on decoding fluency were small, with only Full PRIMR having a positive impact (0.2 cwpm) in Class 1 and in Class 2 (2.3 cwpm). Similarly, Books & Training and Training Only had negative effects for oral reading fluency, with small positive effects for Full PRIMR (0.6 cwpm in Class 1 and 3.5 cwpm in Class 2). Positive reading comprehension impacts were only identified for Full PRIMR, at 1.3% in Class 1 and 7.2% in Class 2. Listening comprehension results were only positive for Full PRIMR in Class 1 (0.6%) and Full PRIMR (4.8%) and Books & Training (0.9%) in Class 2.
For Kiswahili emergent readers, none of the treatment groups had a positive impact, though the Full PRIMR effect was largest in Class 1. For Class 2, Full PRIMR increased the percentage of pupils reaching 17 cwpm or more by 17.2%. The other two treatment groups had negative effects. Overall, Full PRIMR had a positive effect size for Class 1 (0.15 SD), while the other two treatment groups had small negative impacts. For Class 2, the impact of Full PRIMR was an encouraging 0.35 SD, compared to 0.08 for Books & Training and -0.07 for Training Only.
In summary, the impacts for Full PRIMR in Kiswahili were larger than those in English, and larger than those of the other two treatment groups. There are many impacts that are not statistically significant, and the gains for Kiswahili remain more modest than were found at the endline for the USAID PRIMR programme. This is to be expected, of course, given that DFID/PRIMR had four months of instruction and USAID PRIMR had two years.

DFID/PRIMR Rural Expansion: Midterm Report 27
Table 23. Impact of PRIMR on Kiswahili Outcomes
Class 1 Effects Class 2 Effects
Full PRIMR
EffectSize
Books & Training
EffectSize
Training Only
Effect Size
Full PRIMR
EffectSize
Books & Training
EffectSize
Training Only
EffectSize
Letter sound fluency (correct letters per min) 8.1 0.63 8.5 0.66 6.0 0.47 16.6 0.89 12.3 0.66 7.1 0.38
Decoding fluency (correct non-words per min) 0.2 0.03 -1.5 -0.21 -1.2 -0.17 2.3 0.17 -0.7 -0.05 -2.5 -0.19
Oral reading fluency (correct words per min) 0.6 0.08 -1.4 -0.18 -1.8 -0.23 3.5 0.21 -1.9 -0.11 -3.5 -0.21
Reading comprehension (# correct out of 5 questions) 1.3 0.14 -0.9 -0.10 0 0.00 7.2 0.31 -0.7 -0.03 -0.5 -0.02
Listening comprehension (% correct out of 3 questions) 0.6 0.03 -1.0 -0.04 -4.8 -0.20 4.8 0.18 0.9 0.03 -6.0 -0.22
Emergent readers (% of pupils reading 17 wpm+) -0.5 -0.02 -8.8 -0.31 -9.3 -0.33 17.2 0.36 -1.9 -0.04 -6.8 -0.14
Average Effect Size 0.15 -0.03 -0.08 0.35 0.08 -0.07

DFID/PRIMR Rural Expansion: Midterm Report 28
The Table 24 below presents the impact of PRIMR on mathematics outcomes at the October 2013 endline. It shows a modest effect of PRIMR on maths for Full PRIMR, of 0.12 SD for Class 1 and 0.23 SD for Class 2. Interestingly, these effects are very similar to those identified in the USAID PRIMR study, particularly in Class 2. Impacts for Books & Training were not statistically significant from 0 in Class 1 (0.03 SD) and Class 2 (0.04 SD). For Training Only, impacts were insignificant or slightly negative (-0.10 SD in Class 1 and -0.07 SD in Class 2).
For number identification, effects were largest in Full PRIMR (1.7 cnpm) in Class 1 and Full PRIMR (1.9 cnpm) in Class 2. Quantity discrimination effects were relatively large for all treatment groups in Class 1, with the largest effect in Full PRIMR (11.0%). In Class 2, the other two treatment groups were negative, but full PRIMR had a positive 5.5% effect. For missing number, all three had a negative impact in Class 1, with Books & Training showing the smallest negative impact (-0.8%). In Class 2, the largest impact was in Full PRIMR (7.2%). For addition fluency, the largest gain in Class 1 was in Books & Training (0.6 cpm), and in Class 2 the largest gain was in Full PRIMR (0.8 cpm). Subtraction fluency impacts were largest in Full PRIMR in Class 1 (0.5 cpm) and Class 2 (0.7 cpm). Full PRIMR had the biggest impact on word problems in Class 1 (0.6%) and in Class 2 (6.5%).
Recall that the 2012 year saw very little time for PRIMR mathematics to be implemented prior to the midterm analysis for USAID. The 2013 academic year is, for all intents and purposes, the first year that PRIMR mathematics was fully implemented. The gains that are indicated in the Table 24 below suggest that full PRIMR mathematics has real promise in improving the quality of mathematics outcomes in Kenya. Further analysis of PRIMR mathematics from the DFID-funded schools at the end of 2014 will reveal the impact of PRIMR mathematics after two years of implementation.
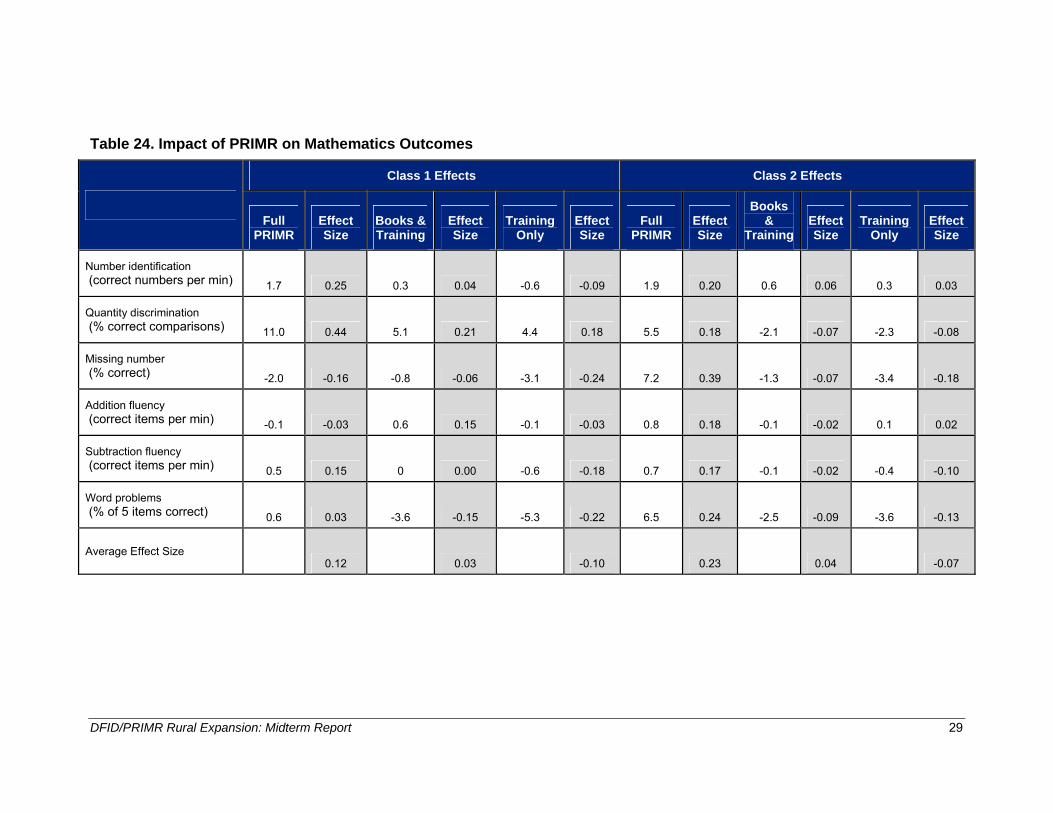
DFID/PRIMR Rural Expansion: Midterm Report 29
Table 24. Impact of PRIMR on Mathematics Outcomes
Class 1 Effects Class 2 Effects
Full PRIMR
Effect Size
Books & Training
Effect Size
Training Only
Effect Size
Full PRIMR
EffectSize
Books &
TrainingEffectSize
Training Only
EffectSize
Number identification (correct numbers per min) 1.7 0.25 0.3 0.04 -0.6 -0.09 1.9 0.20 0.6 0.06 0.3 0.03
Quantity discrimination (% correct comparisons) 11.0 0.44 5.1 0.21 4.4 0.18 5.5 0.18 -2.1 -0.07 -2.3 -0.08
Missing number (% correct) -2.0 -0.16 -0.8 -0.06 -3.1 -0.24 7.2 0.39 -1.3 -0.07 -3.4 -0.18
Addition fluency (correct items per min) -0.1 -0.03 0.6 0.15 -0.1 -0.03 0.8 0.18 -0.1 -0.02 0.1 0.02
Subtraction fluency (correct items per min) 0.5 0.15 0 0.00 -0.6 -0.18 0.7 0.17 -0.1 -0.02 -0.4 -0.10
Word problems (% of 5 items correct) 0.6 0.03 -3.6 -0.15 -5.3 -0.22 6.5 0.24 -2.5 -0.09 -3.6 -0.13
Average Effect Size 0.12 0.03 -0.10 0.23 0.04 -0.07

DFID/PRIMR Rural Expansion: Midterm Report 30
4.1.4 Language Achievement Comparisons
In this section we examine outcomes for pupils across languages. The 2010 EGRA report (Piper, 2010) examined how pupils achieved in three languages (English, Kiswahili and mother tongue) and found that in Central and Nyanza, pupils struggled to read their mother tongue fluently (largely because they were not taught in mother tongue very frequently) but could understand the few words of mother tongue that they read. Figure 1 below examines the interaction between decoding and comprehension in Lubukusu in Bungoma county. The analysis is limited to pupils who took the assessment in all three languages. For the four tasks on the decoding portion of the figure, the results are quite similar across the three languages. Notably, for syllables, decoding fluency and oral reading fluency, outcomes are somewhat lower in mother tongue than in Kiswahili or English. The differences in outcomes are relatively small, however.
The right side of Figure 1 presents the comparison between languages on reading comprehension (total), reading comprehension (on items attempted) and listening comprehension. The results show that pupils are doing slightly better on reading comprehension in Kiswahili than in either English or Lubukusu. This is contrary to the results from the 2010 report as well as for Kikamba (see below). Listening comprehension rates are similar between Kiswahili and Lubukusu.
Possible explanations for the relatively low performance in Lubukusu relative to Kiswahili are the diversity of language speakers in Bungoma, though this assessment was only given in zones which were said to be language homogenous by the Bungoma County County Director of Education (CDE) and TSC leadership. The final assessment in October 2014 will examine these questions more in depth.
Figure 1. Literacy Outcomes for English, Kiswahili and Lubukusu in Class 2 in Bungoma
05
101520253035404550
English Kiswahili Lubukusu
Decoding Comprehension

DFID/PRIMR Rural Expansion: Midterm Report 31
The interesting part of the DFID/PRIMR midterm analysis is the ability to compare the mother-tongue relationships in both counties of interest. Figure 2 below presents a comparison between language outcomes in Machakos County, across English, Kiswahili and Kikamba. Similar to the results in Bungoma, Machakos pupils achieve nearly the same level on the decoding tasks of letter sound fluency, syllable fluency, decoding fluency and oral reading fluency. Pupils do the best on letters in Kikamba and worst on syllables, decoding and oral reading fluency in Kikamba, though the relative differences are modest.
For the three comprehension tasks, results are highest in Kiswahili reading comprehension (total), and Kikamba reading comprehension (on attempted) and Kikamba listening comprehension. The differences in reading comprehension are modest, while the achievement in listening comprehension is more than twice as high in Kikamba as in Kiswahili.
Figure 2. Literacy Outcomes for English, Kiswahili and Kikamba in Class 2 in Machakos
One potential explanation for the different outcomes is the general language homogeneity in Machakos, in comparison to Bungoma. Further research is necessary to better understand these comparisons.
4.1.5 Comparing Improvements between March and October 2013
Full PRIMR and Control The relatively complex research design in PRIMR requires that the analysis of impact of PRIMR be done precisely, differentiating the three treatment groups. We fit DID models that remove the baseline differences between Full PRIMR and control and the gains in control schools between March and October 2013. The results of this are regression coefficients on the gains in control schools and the additional gains in PRIMR schools. Figure 3 below presents the increase in mean scores for both Full PRIMR and control schools. The results
72.3
0
5
10
15
20
25
30
35
40
English Kiswahili Kikamba
Decoding Comprehension

DFID/PRIMR Rural Expansion: Midterm Report 32
show that gains are higher for English in 4 out of 6 measures. For Kiswahili results are higher in 7 measures. For maths, results are higher in PRIMR in 6 out of 7 measures. Note that some of these differences are not statistically significant. The magnitude of the increases is somewhat higher in Kiswahili than it is in English. Most notably, Full PRIMR impacts are higher in the emergent measure that is essential for measuring programme success, particularly in Kiswahili. Full PRIMR seemed to have a significant impact on learning outcomes in the zones where it was operating, in comparison to the control schools.
Figure 3. Increase in Mean Scores for Full PRIMR and Control Schools for Class 2
Books & Training Compared with Control The models we created to measure the impact of Books & Training on learning outcomes were similar to Figure 3 above. In Figure 4 below, we present the impact of PRIMR on outcomes since March 2013. The results show that PRIMR Books & Training had a larger gain on English since March 2013 in 1 of the 6 measures. Letter sounds showed a large impact in PRIMR Books & Training, but the gains in control were higher on all of the other measures. For Kiswahili, Books & Training showed a larger increase on 3 of 7 measures. The largest difference was also in letter sound fluency. The other differences were modest and not statistically significant. For maths, only 1 of 8 measures were higher for Books & Training than control, but none of the comparisons were statistically significant. PRIMR Books & Training seems to improve letter sound fluency, but the short duration between the baseline and midterm assessments does not reveal any other gains, if they existed.
0
5
10
15
20
25
30
35
Letter Sounds (clpm)
Decoding (cwpm)
ORF (cwpm)
Reading Comp. (%)
Reading Comp Attd.
Emergent (%
)
Letter Sounds (clpm)
Decoding (cw
pm)
ORF (cwpm)
Reading Comp. (%)
Reading Comp Attd.
Listen
ing Comp. (%)
Emergent (%
)
Number ID
(cpm)
Quantity (%)
Missing # (%)
Word Problems (%
)
Addition (cpm)
Subtraction (cpm)
Addition Level 2 (%)
Subtraction Level 2 (%)
English Kiswahili Math
Class 2 PRIMR
Class 2 Control

DFID/PRIMR Rural Expansion: Midterm Report 33
Figure 4. Increase in Mean Scores for Books & Training and Control Schools for Class 2
Training Only and Control The DID model examined the impact of the Training Only programme compared to the control. For English, Training Only had higher scores on 2 of the 6 measures, but only letter sound fluency was statistically significantly higher. For Kiswahili, the Training Only treatment group outperformed the control on 1 of 8 measures, once again in Kiswahili letter sound fluency. In maths, outcomes were higher on 3 of the 8 measures. These differences were statistically insignificant, for the most part. The measures that were statistically significant favored the control group over the Training Only treatment group.
‐5
0
5
10
15
20
25
Letter Sounds (clpm)
Decoding (cwpm)
ORF (cwpm)
Reading Comp. (%)
Reading Comp Attd.
Emergent (%
)
Letter Sounds (clpm)
Decoding (cw
pm)
ORF (cwpm)
Reading Comp. (%)
Reading Comp Attd.
Listen
ing Comp. (%)
Emergent (%
)
Number ID
(cpm)
Quantity (%)
Missing # (%)
Word Problems (%
)
Addition (cpm)
Subtraction (cpm)
Addition Level 2 (%)
Subtraction Level 2 (%)
English Kiswahili Math
Class 2 PRIMR
Class 2 Control

DFID/PRIMR Rural Expansion: Midterm Report 34
Figure 5. Summary of Mean Scores for Training Only and Control
The implication of this analysis, comparing the three treatment groups, is that it appears that there were many more positive gains for Full PRIMR on the key analysis items than there were for the other two treatment groups, with Training Only having fewer positive outcomes compared with control. In order to determine whether that is empirically true, we created Figure 6 below. Figure 6 puts the changes in outcomes since the baseline for the three treatment groups on the same scale. We can therefore compare the relative direction of the three treatment groups to determine which treatment group had the largest impact on outcomes. This figure shows clearly that all three treatment groups had large impacts on letter sound fluency, for both English and Kiswahili. For both languages, the gains were largest in Full PRIMR. The figure also reveals that the gains for Full PRIMR were larger on 18 of the items, with control having larger gains on 2 items, and Training Only having larger gains on 1 item. The biggest differences were evident in Kiswahili, where Full PRIMR gains were much larger than control, Books & Training, or Training Only. It appears that in these two counties, having a teacher’s guide is essential to improving outcomes. On maths, as well, pupil outcome gains were consistently larger in Full PRIMR than in the other treatment groups or control.
‐5
0
5
10
15
20
Letter Sounds (clpm)
Decoding (cwpm)
ORF (cwpm)
Reading Comp. (%)
Reading Comp Attd.
Emergent (%
)
Letter Sounds (clpm)
Decoding (cw
pm)
ORF (cwpm)
Reading Comp. (%)
Reading Comp Attd.
Listen
ing Comp. (%)
Emergent (%
)
Number ID
(cpm)
Quantity (%)
Missing # (%)
Word Problems (%
)
Addition (cpm)
Subtraction (cpm)
Addition Level 2 (%)
Subtraction Level 2 (%)
English Kiswahili Math
Class 2 PRIMR
Class 2 Control

DFID/PRIMR Rural Expansion: Midterm Report 35
Figure 6. Summary of Causal Impact of PRIMR Treatment Groups
4.1.6 Comparing Decrease in Zero Scores between Baseline and Midterm
The DFID/PRIMR baseline report noted the large percentages of pupils who were unable to read a single word of an approximately 60-word story (Piper & Mugenda, 2013). Oral reading fluency was not the only measure by which pupils were struggling. Zero scores on subtasks were high across all three subjects, and in both Class 1 and 2. In this section we present the declines in zero scores for all three treatment groups, in comparison to the control group. These results were derived from fitted DID regressions and present declines for each treatment group compared to the control. Figure 7 shows that for 3 of the 4 English measures, Full PRIMR pupils declined in zero scores more than control pupils, with reading comprehension showing no difference. For Kiswahili, Full PRIMR zero scores declined more in Full PRIMR than in control on all 4 measures. For maths, Full PRIMR zero scores declined more than control on 6 of 8 measures. The other 2 measures were not statistically significantly different. In fact, this analysis shows that several items were statistically significantly in favour of PRIMR, but none of them was in favour of control.
‐10
‐5
0
5
10
15
20
Letter Sounds (clpm)
Decoding (cwpm)
ORF (cwpm)
Reading Comp. (%)
Reading Comp Attd.
Emergen
t (%
)
Letter Sounds (clpm)
Decoding (cw
pm)
ORF (cwpm)
Reading Comp. (%)
Reading Comp Attd.
Listen
ing Comp. (%)
Emergen
t (%
)
Number ID
(cpm)
Quantity (%)
Missing # (%)
Word Problems (%
)
Addition (cpm)
Subtraction (cpm)
Addition Level 2 (%)
Subtraction Level 2 (%)
English Kiswahili Math
Causal Impact of PRIMR Treatment Groups
Full PRIMR
Books & Training
Training Only

DFID/PRIMR Rural Expansion: Midterm Report 36
Figure 7. Decrease in % of Zero Scores
Figure 8 shows a comparison of the zero scores for the Books & Training treatment and the control group. For the Books & Training treatment group, the decrease in the percentage of zero scores is lower than in control schools. In both English and Kiswahili letter sound fluency, the decrease in zero scores was larger than in control. The other comparisons between Books & Training and control show very few differences in the percentage of zero scores.
‐60
‐50
‐40
‐30
‐20
‐10
0
10
Letter Sounds 0s
Decoding 0s
ORF 0s
Reading Comp. 0s
Letter Sounds 0s
Decoding 0s
ORF 0s
Reading Comp. 0s
Number ID
0s
Quantity 0s
Missing # 0s
Word Problems 0s
Addition 0s
Subtraction 0s
Addition Level 2 0s
Subtraction Level 2 0s
English Kiswahili Math
Class 2 PRIMR
Class 2 Control

DFID/PRIMR Rural Expansion: Midterm Report 37
Figure 8. Decrease in % of Zero Scores for Books & Training
For the Training Only treatment group, shown in Figure 9, the item for which there was a greater decrease in zero scores was Kiswahili letter sound fluency. Decreases were quite similar for Training Only and control for the rest of the items.
‐70‐60‐50‐40‐30‐20‐1001020
Letter Sounds 0s
Decoding 0s
ORF 0s
Reading Comp. 0s
Letter Sounds 0s
Decoding 0s
ORF 0s
Reading Comp. 0s
Number ID
0s
Quantity 0s
Missing # 0s
Word Problems 0s
Addition 0s
Subtraction 0s
Addition Level 2 0s
Subtraction Level 2 0s
English Kiswahili Math
Decrease in % of Zero Scores for Books & Training
Class 2 PRIMR
Class 2 Control

DFID/PRIMR Rural Expansion: Midterm Report 38
Figure 9. Decrease in % of Zero Scores for Training Only
In order to compare the relative impact of the three PRIMR treatment groups on the percentage of zero scores, we created Figure 10 below. This figure plots the decrease in zero scores compared with the control group on one figure. It shows that the decrease in zero scores was largest for Full PRIMR on 10 items, for Books & Training on 3 items, for Training Only on 0 items, and for control on 2 items. It appears that, once again, the declines in zero scores were largest for Full PRIMR compared to the other two treatment groups.
‐30
‐25
‐20
‐15
‐10
‐5
0
5
10
Letter Sounds 0s
Decoding 0s
ORF 0s
Reading Comp. 0s
Letter Sounds 0s
Decoding 0s
ORF 0s
Reading Comp. 0s
Number ID
0s
Quantity 0s
Missing # 0s
Word Problems 0s
Addition 0s
Subtraction 0s
Addition Level 2 0s
Subtraction Level 2 0s
English Kiswahili Math
PRIMR

DFID/PRIMR Rural Expansion: Midterm Report 39
Figure 10. Causal Impact of Treatment Groups on Zero Scores
4.1.7 Effect Size Comparisons by Treatment Group
In order to provide some measure of the relative size of the three treatment groups’ impact on learning, we created Figure 11, which shows the effect size of the treatment groups for each of the treatment groups in the three subjects and overall. This is derived from the data for Class 2 from Table 24, which shows the individual effect sizes of each of the items. The effect size for full PRIMR was largest for all three subjects and overall. The overall effect size for Full PRIMR was .28 SD, relatively large for programme designs of this sort. In fact, while the USAID PRIMR programme has had much longer to implement, the effect size of the DFID/PRIMR programme is only slightly smaller.
The effect size for the Books & Training group is modest. There is a positive effect size for English and Kiswahili, but a negative one for maths. Overall, the effect size is .04 SD, which is statistically insignificant. Similarly, the effect size for the Training Only group is similarly modest, with negative effects for both Kiswahili and maths. The overall effect size is -.03 SD, which is also insignificant. It appears that, though the TAC tutors in the Training Only and Books & Training groups were just as vigilant about visiting classrooms and the PRIMR team support was similar across the programme, the effects of these two treatment groups were negligible. This is, of course, only the midterm, and instructional time was limited to a matter of months. This analysis should therefore be revisited after the endline data collection in October 2014.
‐41.8
‐30
‐25
‐20
‐15
‐10
‐5
0
5
10
Letter Sounds 0s
Decoding 0s
ORF 0s
Reading Comp. 0s
Letter Sounds 0s
Decoding 0s
ORF 0s
Reading Comp. 0s
Number ID
0s
Quantity 0s
Missing # 0s
Word Problems 0s
Addition 0s
Subtraction 0s
Addition Level 2 0s
Subtraction Level 2 0s
English Kiswahili Math
Full PRIMR
Books & Training
Training Only

DFID/PRIMR Rural Expansion: Midterm Report 40
Figure 11. Effect Size Comparison by Treatment Group Class 2
4.1.8 Impact of Other Factors
The main focus of this report has been on whether PRIMR was successful and which treatment groups had the biggest impact. In this section, we investigate what other factors make it more or less likely for pupils to improve in literacy and numeracy in Kenya. Methodologically this means that we are presenting the coefficients on regression variables included in the models that control for the DID estimates of the impact of PRIMR. In other words, these factors still mattered for achievement after PRIMR’s impact was accounted for. Figure 12 presents the relationship with English oral reading fluency associated with key factors of interest in Kenya.
Our findings show that pupils in peri-urban schools achieve 19.9 cwpm more than those that are rural schools. This variable is important to account for in all analyses, and we do so in the DID models. Unlike the USAID analysis of the impact of PRIMR, the DFID analysis shows how important instructional characteristics are. Those pupils who have teachers who check exercise books 5 days a week read 11.3 cwpm more fluently than those whose teachers don’t check at all, and those whose teachers have pupils sound out words 5 days a week read 10.2 cwpm more than those whose teachers do not. Notably, those pupils in classrooms where the teacher makes them copy from the blackboard only 1 time or fewer per week read 8.6 cwpm more fluently than those who copy from the blackboard more frequently. Teachers checking homework 5 days a week is associated with 6.4 more cwpm. A textbook distribution ratio of 2:1 is associated with 2.6 cwpm better, while a textbook distribution ratio of 5:1 or less is associated with 5.7 cwpm less. Instruction and reading materials really matter in Kenya.
There are other variables associated with urbanicity and wealth that matter, including having electricity in the house (9.4 cwpm), having a television (9.0 cwpm) and having a vehicle at the house (7.4 cwpm). Given that these variables are proxies for urbanicity, there does not seem to be an obvious policy implication of this finding. Having the English textbook at home is associated with 5.3 cwpm per minute, and the Kiswahili book is associated with 4.4 cwpm.
0.25
0.35
0.22
0.28
0.07 0.08
‐0.04
0.040.04
‐0.07 ‐0.07
‐0.03
‐0.10
‐0.05
0.00
0.05
0.10
0.15
0.20
0.25
0.30
0.35
0.40
English Kiswahili Maths Total
Full PRIMR Books & Training Training only

DFID/PRIMR Rural Expansion: Midterm Report 41
Somewhat controversially, teachers that have “other” qualifications, often early childhood development credentials, are associated with 3.4 cwpm higher in oral reading fluency, compared with those who have a bachelor’s degree in education, which is only associated with 0.9 cwpm. Class size matters, but only a very small amount. Having an additional 10 classmates is associated with a fewer than 1.0 cwpm less compared to having the average number of classmates. School closures are negatively correlated with outcomes (3.9 cwpm), as is pupil repetition (5.7 cwpm). Most harmful to outcomes are teachers who only expect pupils to write their name in Class 3 (6.2 cwpm), teachers who expect pupils to sound out words in Class 4 (7.1 cwpm), and teachers who only use the textbook 2 days a week or less (8.7 cwpm). This shows that bad instruction and poor attitude of teachers can adversely affect learning outcomes.
The implication of this chart is that while there are many areas out of the control of the system (pupil background, wealth of the community) that affect learning outcomes, there are also several key areas that the Kenyan school system can immediately affect, such as access to materials, attitudes of teachers and, most importantly, the instructional behaviour of teachers.

DFID/PRIMR Rural Expansion: Midterm Report 42
Figure 12. Relationship with English Oral Reading Fluency Associated with Key Factors of Interest in Kenya
5. Lessons Learnt 1. The provision of pupils’ books has led to ownership of the learning materials by the
pupils. The 1:1 ratio has seen improvement in reading patterns in pupils whose treatment group allows them access to PRIMR books. The lessons are more coordinated, and fidelity to PRIMR is evident in those zones with books. This is in
‐15.0 ‐10.0 ‐5.0 0.0 5.0 10.0 15.0 20.0
Teacher uses the book 2 days a week
Teacher expects pupils to sound out words in Class 4
Teacher expects pupils to write name in Class 3
Repeated this year
Pupil Book Ratio is 5 to 1 or worse
Teacher expects pupils to know letters in Class 3
School was closed during the year
Difference for each year older
Teacher checks homework 1 day a week
Has a bicycle at the house
Lesson plan is not well prepared
Scheme of work is not well prepared
Teacher refuses to show lesson plan
Class size is 10 pupils higher
Absent more than a week
Teacher does oral evaluations 1 day a week
Mother can read and write
Went to pre‐unit, KG or preschool
Teacher has B.Ed. Degree
Has a refrigerator at the house
Has other reading materials at home
Pupil Book Ratio is 2:1 or better
Teacher uses the book 5 days a week
School has girls' washroom
Teacher has "other" qualification
Has a mobile phone at the house
Has Kiswahili textbook at home
Head teacher provides support on literacy
Head teacher reviews lesson plans
Teacher does oral evaluations 5 days a week
School has library
Teacher's lesson plan is well‐prepared
Has English textbook at home
Has a toilet inside the house
Head teacher is satisfied with performance in school
School has clean water
Teacher checks homework 5 days a week
School has electricity
Has a vehicle at the house
Teacher copies from blackboard only 1 time per week
Has a television at the house
Has electricity at the house
Teacher has pupils sound out words 5 days a week
Teacher checks exercise books 5 days a week
School is Urban

DFID/PRIMR Rural Expansion: Midterm Report 43
contrast to Training Only and control schools, where the book to pupil ratio ranges from 1:3 to a staggering 1:10 in some classes, where ownership of a book is a dream to many and a preserve of pupils from relatively high-income families.
2. More pupils are joining the PRIMR schools due to the provision of books and the methodology in teaching. Many schools with PRIMR books have had pupils requesting to come back in the afternoon to read the books, and teachers are now more willing to assist pupils. These effects were noted during the qualitative study conducted in August 2013 from the two respective counties (Bungoma and Machakos).
3. Homework books are being trialed in the 2014 version of PRIMR. These books have provided pupils more time to practice on their own while at home and have engaged the parents more in supporting them. PRIMR allows pupils to write in the homework books to save the time pupils take to copy the work from other books. This is clearly shown from the several assignments pupils brought to teachers for checking and even from comments received from parents during their routine follow-ups.
4. The training of the head teachers has proven to be beneficial in implementing PRIMR. The head teachers are involved in supporting the teachers and teaching Class 1 and 2, and can teach classes when a teacher is out of school.
5. Ensuring that the research design chosen can account for the variations in zonal achievement and still measure causal impact is essential. If PRIMR did not have the option of utilizing the DID model, the gains accruing to the programme would have been missed.
6. Recommendations The findings indicate that Full PRIMR has early indications of having an impact on literacy and numeracy and suggest several recommendations related to improved literacy and maths in Machakos and Bungoma.
1. Improve the quality of teacher training and support. The findings indicate that teachers who have “other” qualifications, often credentials in early childhood development, are associated with 3.4 cwpm higher gains in oral reading fluency. This is much more than those teachers with bachelor’s degree in education, which is associated with 0.9 cwpm more in oral reading fluency. The content and quality of courses provided to teachers should be improved, as well as consideration made for the teacher decision-making processes that determine whether teachers utilize the content they were trained in.
2. Review of the pupils’ books. The results show that Full PRIMR had the greatest impact of the three programs, and Full PRIMR provides each pupil with books. Previous research shows that the current books on the Kenyan market do not focus on skills acquisition for literacy and numeracy. We recommend that ensuring a 1:1 ratio of books to pupils can improve literacy and numeracy outcomes.
3. Development of teachers’ guides. The findings have indicated improved performance from the use of PRIMR teachers’ guides against the other treatment groups. Development of teachers’ guides for the teachers ensures that teachers teach in a sequential manner.
4. Scale up the literacy and numeracy programme. The research design for PRIMR in DFID and USAID is designed to test whether the programme can be rolled out successfully at scale. The positive results in the USAID and DFID/PRIMR studies in

DFID/PRIMR Rural Expansion: Midterm Report 44
seven counties suggest that there are the key elements needed for the scale-up of the programme in Kenya.
5. Further analysis on Lubukusu and Kikamba. Further study is required to explain the differences in literacy performance in Lubukusu and Kikamba, though this assessment was only given in zones that were said to be language homogenous by the Bungoma County CDE and TSC leadership. The results show that pupils are doing slightly better in reading comprehension in Kiswahili than in either English or Lubukusu. This is contrary to the results from the 2010 report in Dholuo and Gikuyu as well as for Kikamba. Low performance in Lubukusu is possibly due to varying dialects in Lubukusu dialect compared with the relative language homogeneity in Kikamba.
6. Training of TAC tutors. The TAC tutors are critical in providing teacher support within public schools. Programmes should be designed to utilize them but to do so in cost effective and efficient manners that can be scaled up to similar programmes in the sector.
7. Conclusion The DFID/PRIMR midterm report shows encouraging and promising findings from the Full PRIMR group, but little to no impact from the Books & Training or Training Only treatment groups. The duration of time between the baseline and the midterm assessments was a matter of months, and certainly not enough time to validly capture changes in outcomes. The October 2014 assessment will allow us enough time to assess the impact of the four treatment groups on achievement. That study will reveal the impact of the mother tongue program and the relative impact of training, books and teachers’ guides. There seems to be a great deal of promise from the Full PRIMR results, though much more work is necessary to get pupils ready for higher levels of primary school in Kenya.
DFID/PRIMR Rural Expansion: Midterm Report 45
References Crouch, L., Korda, M., & Mumo, D. (2009). Improvements in Reading Skills in Kenya: An
Experiment in the Malindi District. Research Triangle Park, NC: RTI International and the Aga Khan Foundation. Available from: https://www.eddataglobal.org/documents/index.cfm?fuseaction=pubDetail&ID=154 (Accessed 18 February 2014).
Kenya National Examination Council. (2014). Kenya Certificate of Primary Examination Release Statistics. Nairobi: KNEC.
Piper, B. (2010). Kenya Early Grade Reading Assessment findings report. Prepared for the
William and Flora Hewlett Foundation, under the Monitoring of Learning Outcomes in Sub-Saharan Africa project, Contract No. 2008-3367. Research Triangle Park, North Carolina, USA: RTI International. https://www.eddataglobal.org/countries/index.cfm?fuseaction=pubDetail&ID=275
Piper, B., & Kwayumba, D. (2014). The Primary Math and Reading (PRIMR) Initiative: USAID ICT Kisumu endline report. Prepared for USAID under the Education Data for Decision Making (EdData II) project, Task Order No. AID-623-M-11-00001. Research Triangle Park, NC, USA: RTI International.
Piper, B., & Mugenda, A. (2014). The Primary Math and Reading (PRIMR) Initiative: USAID PRIMR endline report. Prepared for USAID under the Education Data for Decision Making (EdData II) project, Task Order No. AID-623-M-11-00001. Research Triangle Park, NC, USA: RTI International.
Piper, B., & Mugenda, A. (2013). The Primary Math and Reading (PRIMR) Initiative: Midterm impact evaluation. Prepared for USAID under the Education Data for Decision Making (EdData II) project, Task Order No. AID-623-M-11-00001. Research Triangle Park, NC, USA: RTI International. https://www.eddataglobal.org/countries/index.cfm?fuseaction=pubDetail&ID=486
Piper, B. & Mugenda, A. (2013). The Primary Math and Reading (PRIMR) Initiative: DFID/Kenya Rural Expansion Programme. Bungoma and Machakos Baseline Study. Research Triangle Park, NC: RTI International.
Piper, B., & Mugenda, A. (2012). The Primary Math and Reading Initiative: Baseline report. Prepared for USAID/Kenya under the Education Data for Decision Making (EdData II) project, Task Order No. AID-623-M-11-00001. Research Triangle Park, North Carolina, USA: RTI International. https://www.eddataglobal.org/countries/index.cfm?fuseaction=pubDetail&ID=480
Uwezo. (2012). Are our children learning? Annual learning assessment report: Kenya, 2012. Nairobi: Uwezo.

DFID/PRIMR Rural Expansion: Midterm Report 46
Annexes

DFID/PRIMR Rural Expansion: Midterm Report 47
Annex 1. EGRA Descriptive Statistics at Midterm by Language, Treatment Group, Class and Gender
Subtask Language Treatment
Group Gender Class
Treatment Control Programme Impact
Mean Std. Error Mean Std. Error Std.
Deviation Programme
Effect Effect Size
Letter Sound Fluency (clpm)
English
Full PRIMR
Male 1 5.7 0.7 8.7 1.2 11.0 -3 -0.27
2 9.6 1 11.5 1.5 13.6 -1.9 -0.14
Female 1 7.5 0.9 11 2.4 14.3 -3.5 -0.25
2 14.3 1.4 13.4 1.8 16.3 0.9 0.06
Books + Training
Male 1 8.3 1.3 8.7 1.2 13.0 -0.4 -0.03
2 14.9 1.6 11.5 1.5 15.6 3.4 0.22
Female 1 11.1 1.7 11 2.4 15.8 0.1 0.01
2 15.4 1.5 13.4 1.8 17.3 2 0.12
Training Only
Male 1 8.7 1.1 8.7 1.2 12.7 0 0.00
2 14.3 1.3 11.5 1.5 15.9 2.8 0.18
Female 1 12.8 1.4 11 2.4 17.2 1.8 0.11
2 19.1 2.3 13.4 1.8 18.6 5.7 0.31
Kiswahili
Full PRIMR
Male 1 5.3 0.8 8.5 1.5 12.0 -3.2 -0.27
2 9.7 1 13.1 1.7 15.0 -3.4 -0.23
Female 1 6.8 1 10.2 2.2 13.6 -3.4 -0.25
2 13.5 1.2 16.9 2.3 19.1 -3.4 -0.18
Books + Training
Male 1 7.5 1.3 8.5 1.5 13.5 -1 -0.07
2 15.6 3 13.1 1.7 17.1 2.5 0.15

DFID/PRIMR Rural Expansion: Midterm Report 48
Subtask Language Treatment
Group Gender Class
Treatment Control Programme Impact
Mean Std. Error Mean Std. Error Std.
Deviation Programme
Effect Effect Size
Female 1 10.5 2.3 10.2 2.2 15.7 0.3 0.02
2 17 2.1 16.9 2.3 20.6 0.1 0.01
Training Only
Male 1 8 1 8.5 1.5 13.2 -0.5 -0.04
2 13.8 1.4 13.1 1.7 17.2 0.7 0.04
Female 1 11.3 1.4 10.2 2.2 16.1 1.1 0.07
2 19.2 2.3 16.9 2.3 21.5 2.3 0.11
Syllable (csspm) Kiswahili
Full PRIMR
Male 1 4.5 0.8 10.7 2.1 12.7 -6.2 -0.49
2 16.8 2.2 20.4 2 20.1 -3.6 -0.18
Female 1 7.6 1.2 13.4 2.2 15.9 -5.8 -0.37
2 20.4 2.3 28.4 3 22.7 -8 -0.35
Books + Training
Male 1 6 1.3 10.7 2.1 14.3 -4.7 -0.33
2 18.7 3.2 20.4 2 21.0 -1.7 -0.08
Female 1 9.5 2.5 13.4 2.2 17.4 -3.9 -0.23
2 24 2.6 28.4 3 24.2 -4.4 -0.18
Training Only
Male 1 8 1.1 10.7 2.1 14.4 -2.7 -0.19
2 23 1.7 20.4 2 21.9 2.6 0.12
Female 1 12.9 1.3 13.4 2.2 18.0 -0.5 -0.03
2 29.1 2.7 28.4 3 25.0 0.7 0.03
Decoding Fluency (cwpm)
English Full PRIMR
Male 1 1.8 0.4 4.9 1.2 7.2 -3.1 -0.43
2 7.2 1 12.5 2 12.6 -5.3 -0.42
Female 1 3.2 0.6 6.7 1.7 9.7 -3.5 -0.36
2 10.9 1.3 16.2 2.4 14.9 -5.3 -0.36

DFID/PRIMR Rural Expansion: Midterm Report 49
Subtask Language Treatment
Group Gender Class
Treatment Control Programme Impact
Mean Std. Error Mean Std. Error Std.
Deviation Programme
Effect Effect Size
Books + Training
Male 1 2.4 0.6 4.9 1.2 8.0 -2.5 -0.31
2 8.2 1.1 12.5 2 12.9 -4.3 -0.33
Female 1 3.8 1.2 6.7 1.7 10.2 -2.9 -0.28
2 12.4 1.7 16.2 2.4 15.8 -3.8 -0.24
Training Only
Male 1 2.7 0.4 4.9 1.2 7.8 -2.2 -0.28
2 12.6 1.1 12.5 2 15.4 0.1 0.01
Female 1 6.1 0.9 6.7 1.7 11.3 -0.6 -0.05
2 16.5 1.8 16.2 2.4 16.8 0.3 0.02
Kiswahili
Full PRIMR
Male 1 1.6 0.4 4.2 1 6.4 -2.6 -0.41
2 6.8 1.2 11.2 1.3 11.2 -4.4 -0.39
Female 1 2.3 0.5 4.7 1 7.8 -2.4 -0.31
2 10 1.2 14.4 2.1 14.0 -4.4 -0.31
Books + Training
Male 1 1.8 0.6 4.2 1 7.0 -2.4 -0.34
2 7.7 1.3 11.2 1.3 11.8 -3.5 -0.30
Female 1 3.2 1 4.7 1 8.4 -1.5 -0.18
2 11 1.7 14.4 2.1 15.2 -3.4 -0.22
Training Only
Male 1 2.6 0.5 4.2 1 7.2 -1.6 -0.22
2 11.4 1 11.2 1.3 13.2 0.2 0.02
Female 1 4.8 0.7 4.7 1 9.0 0.1 0.01
2 15.4 1.7 14.4 2.1 15.9 1 0.06
Segmenting (%) English Full PRIMR Male 1 6 1.4 4.5 0.9 14.0 1.5 0.11
2 11 2 5.9 1.2 18.0 5.1 0.28

DFID/PRIMR Rural Expansion: Midterm Report 50
Subtask Language Treatment
Group Gender Class
Treatment Control Programme Impact
Mean Std. Error Mean Std. Error Std.
Deviation Programme
Effect Effect Size
Female 1 9.1 2 8.4 1.8 19.7 0.7 0.04
2 15.1 2.1 7 1.6 21.8 8.1 0.37
Books + Training
Male 1 6.8 1.8 4.5 0.9 15.3 2.3 0.15
2 11.8 2.4 5.9 1.2 18.5 5.9 0.32
Female 1 7.9 1.8 8.4 1.8 20.5 -0.5 -0.02
2 14.1 1.9 7 1.6 21.8 7.1 0.33
Training Only
Male 1 7.9 2 4.5 0.9 17.1 3.4 0.20
2 12.2 2.1 5.9 1.2 19.5 6.3 0.32
Female 1 9.1 1.7 8.4 1.8 22.0 0.7 0.03
2 15.4 2.9 7 1.6 23.4 8.4 0.36
Kiswahili
Full PRIMR
Male 1
2
Female 1
2
Books + Training
Male 1
2
Female 1
2
Training Only
Male 1
2
Female 1
2

DFID/PRIMR Rural Expansion: Midterm Report 51
Subtask Language Treatment
Group Gender Class
Treatment Control Programme Impact
Mean Std. Error Mean Std. Error Std.
Deviation Programme
Effect Effect Size
Oral Reading Fluency (cwpm)
English
Full PRIMR
Male 1 1.2 0.3 5.2 1.3 7.2 -4 -0.56
2 8.9 1.5 17.8 3.4 19.7 -8.9 -0.45
Female 1 2.7 0.7 5.5 1.7 10.1 -2.8 -0.28
2 12.8 2.1 24.5 4.4 15.4 -11.7 -0.76
Books + Training
Male 1 1.5 0.5 5.2 1.3 8.6 -3.7 -0.43
2 8.9 1.8 17.8 3.4 19.6 -8.9 -0.46
Female 1 2.6 0.9 5.5 1.7 9.5 -2.9 -0.31
2 13.6 2.2 24.5 4.4 23.8 -10.9 -0.46
Training Only
Male 1 1.7 0.3 5.2 1.3 8.0 -3.5 -0.44
2 15.7 1.6 17.8 3.4 23.2 -2.1 -0.09
Female 1 4.4 0.7 5.5 1.7 11.0 -1.1 -0.10
2 19.6 2.4 24.5 4.4 25.8 -4.9 -0.19
Kiswahili
Full PRIMR
Male 1 1.8 0.4 4.6 1 6.7 -2.8 -0.42
2 8 1.4 15 1.9 14.3 -7 -0.49
Female 1 2.8 0.6 6 1.5 8.9 -3.2 -0.36
2 12.5 1.5 18.6 2.7 16.8 -6.1 -0.36
Books + Training
Male 1 2.1 0.6 4.6 1 7.4 -2.5 -0.34
2 9.6 1.9 15 1.9 15.3 -5.4 -0.35
Female 1 3.6 1.3 6 1.5 9.4 -2.4 -0.26
2 13.6 2.1 18.6 2.7 17.8 -5 -0.28
Training Only Male 1 2.6 0.4 4.6 1 7.2 -2 -0.28
2 14.2 1.3 15 1.9 17.3 -0.8 -0.05

DFID/PRIMR Rural Expansion: Midterm Report 52
Subtask Language Treatment
Group Gender Class
Treatment Control Programme Impact
Mean Std. Error Mean Std. Error Std.
Deviation Programme
Effect Effect Size
Female 1 5.3 0.7 6 1.5 10.2 -0.7 -0.07
2 18.7 2 18.6 2.7 18.6 0.1 0.01
Vocabulary (%)
English
Full PRIMR
Male 1 31.4 2.4 37.3 2.9 17.4 -5.9 -0.34
2 43.1 2.8 49.4 3.4 20.2 -6.3 -0.31
Female 1 34.8 2.2 39.2 2.8 17.6 -4.4 -0.25
2 44.2 2.3 50.5 3.2 19.4 -6.3 -0.33
Books + Training
Male 1 33.5 3 37.3 2.9 19.0 -3.8 -0.20
2 44 2.3 49.4 3.4 19.6 -5.4 -0.28
Female 1 30.1 2.2 39.2 2.8 18.4 -9.1 -0. 50
2 43.4 2.6 50.5 3.2 20.8 -7.1 -0.34
Training Only
Male 1 32.9 1.9 37.3 2.9 17.7 -4.4 -0.25
2 45.9 2.1 49.4 3.4 20.4 -3.5 -0.17
Female 1 35.5 1.9 39.2 2.8 18.8 -3.7 -0.20
2 45.9 2 50.5 3.2 20.7 -4.6 -0.22
Kiswahili
Full PRIMR
Male 1
2
Female 1
2
Books + Training
Male 1
2
Female 1
2

DFID/PRIMR Rural Expansion: Midterm Report 53
Subtask Language Treatment
Group Gender Class
Treatment Control Programme Impact
Mean Std. Error Mean Std. Error Std.
Deviation Programme
Effect Effect Size
Training Only
Male 1
2
Female 1
2
Reading Comprehension (%)
English
Full PRIMR
Male 1 0.2 0.2 0.9 0.4 3.0 -0.7 -0.23
2 2.7 0.8 11.4 3.2 16.1 -8.7 -0.54
Female 1 0.3 0.1 1.4 0.9 4.6 -1.1 -0.24
2 1.6 0.5 12.4 4.1 15.6 -10.8 -0.69
Books + Training
Male 1 0.5 0.4 0.9 0.4 2.4 -0.4 -0.17
2 2.3 0.5 11.4 3.2 15.0 -9.1 -0.61
Female 1 0.3 0.2 1.4 0.9 4.7 -1.1 -0.24
2 3.8 0.9 12.4 4.1 18.2 -8.6 -0.47
Training Only
Male 1 0.1 0.1 0.9 0.4 2.9 -0.8 -0.28
2 4.3 0.9 11.4 3.2 17.2 -7.1 -0.41
Female 1 0.4 0.2 1.4 0.9 5.4 -1 -0.19
2 6.1 1.9 12.4 4.1 20.6 -6.3 -0.31
Kiswahili
Full PRIMR
Male 1 2.1 0.6 4.1 1.4 8.7 -2 -0.23
2 9.8 1.7 17 2 20.0 -7.2 -0.36
Female 1 2.8 0.7 3.7 1 9.6 -0.9 -0.09
2 13.6 1.9 21.5 3.2 22.7 -7.9 -0.35
Books + Training
Male 1 2.3 0.8 4.1 1.4 10.4 -1.8 -0.17
2 10.2 1.9 17 2 20.1 -6.8 -0.34

DFID/PRIMR Rural Expansion: Midterm Report 54
Subtask Language Treatment
Group Gender Class
Treatment Control Programme Impact
Mean Std. Error Mean Std. Error Std.
Deviation Programme
Effect Effect Size
Female 1 2.8 1.3 3.7 1 9.3 -0.9 -0.10
2 14.2 2.6 21.5 3.2 24.1 -7.3 -0.30
Training Only
Male 1 2.5 0.5 4.1 1.4 8.9 -1.6 -0.18
2 18.2 2.1 17 2 24.5 1.2 0.05
Female 1 5.7 0.9 3.7 1 11.2 2 0.18
2 21.5 2.8 21.5 3.2 25.5 0 0.00
Listening Comprehension (%)
Kiswahili
Full PRIMR
Male 1 21.9 2.1 35 3.9 23.6 -13.1 -0.56
2 27.6 2.6 45 3.1 24.3 -17.4 -0.72
Female 1 22 1.7 31.2 2.2 22.9 -9.2 -0.40
2 34.9 2.4 49.3 3.3 24.5 -14.4 -0.59
Books + Training
Male 1 21.8 2.5 35 3.9 25.0 -13.2 -0.53
2 34.9 2.5 45 3.1 24.8 -10.1 -0.41
Female 1 26.3 3 31.2 2.2 25.4 -4.9 -0.19
2 38.9 2.7 49.3 3.3 26.0 -10.4 -0.40
Training Only
Male 1 27.3 2 35 3.9 25.2 -7.7 -0.31
2 42.5 2.4 45 3.1 26.2 -2.5 -0.10
Female 1 31.7 2 31.2 2.2 25.7 0.5 0.02
2 46.7 2.9 49.3 3.3 28.4 -2.6 -0.09
Maze (%) Kiswahili Full PRIMR
Male 1 13.8 1 11.8 1.2 10.8 2 0.19
2 18.8 1.1 16.8 1.1 11.4 2 0.18
Female 1 14.4 1.3 11.1 1 10.7 3.3 0.31
2 18.6 1.3 18.3 1.5 13.4 0.3 0.02

DFID/PRIMR Rural Expansion: Midterm Report 55
Subtask Language Treatment
Group Gender Class
Treatment Control Programme Impact
Mean Std. Error Mean Std. Error Std.
Deviation Programme
Effect Effect Size
Books + Training
Male 1 13.4 1.2 11.8 1.2 11.7 1.6 0.14
2 15.3 1.3 16.8 1.1 11.8 -1.5 -0.13
Female 1 12.2 1.3 11.1 1 10.9 1.1 0.10
2 16.3 1.6 18.3 1.5 13.8 -2 -0.15
Training Only
Male 1 12.3 1.1 11.8 1.2 10.8 0.5 0.05
2 15.4 1 16.8 1.1 11.8 -1.4 -0.12
Female 1 11.1 0.9 11.1 1 10.0 0 0.00
2 16.8 1.1 18.3 1.5 13.9 -1.5 -0.11
Fluent (%)
English
Full PRIMR
Male 1 0 - 0 0 0.0 0 0.00
2 1.6 0.9 6.1 2.1 17.0 -4.5 -0.27
Female 1 0 - 0 0 0.0 0 0.00
2 2.8 1.5 10.9 3.7 23.5 -8.1 -0.35
Books + Training
Male 1 0 - 0 0 0.0 0 0.00
2 0 - 6.1 2.1 11.5 -6.1 -0.53
Female 1 0 - 0 0 0.0 0 0.00
2 0.8 0.6 10.9 3.7 20.2 -10.1 -0.50
Training Only
Male 1 0 - 0 0 0.0 0 0.00
2 3.2 1.2 6.1 2.1 20.4 -2.9 -0.14
Female 1 0 - 0 0 0.0 0 0.00
2 4.9 1.5 10.9 3.7 26.8 -6 -0.22
Kiswahili Full PRIMR Male 1 0 - 0.1 0.04 1.2 -0.1 -0.08
2 1.1 0.8 7.1 2.2 16.8 -6 -0.36

DFID/PRIMR Rural Expansion: Midterm Report 56
Subtask Language Treatment
Group Gender Class
Treatment Control Programme Impact
Mean Std. Error Mean Std. Error Std.
Deviation Programme
Effect Effect Size
Female 1 0 - 0.4 0.3 3.3 -0.4 -0.12
2 3.6 1.5 11.7 4.1 25.0 -8.1 -0.33
Books + Training
Male 1 0 - 0.1 0.04 1.2 -0.1 -0.08
2 3.2 1.9 7.1 2.2 20.7 -3.9 -0.19
Female 1 0 - 0.4 0.3 3.3 -0.4 -0.12
2 5.4 2.4 11.7 4.1 27.5 -6.3 -0.23
Training Only
Male 1 0 - 0.1 0.04 1.2 -0.1 -0.08
2 7.2 2 7.1 2.2 25.4 0.1 0.004
Female 1 0.4 0.3 0.4 0.3 6.3 0 0.00
2 8.5 1.7 11.7 4.1 30.5 -3.2 -0.11
Emergent (%) English
Full PRIMR
Male 1 0.5 0.3 7.9 3.2 16.6 -7.4 -0.45
2 9 2.9 22.9 5.5 33.0 -13.9 -0.42
Female 1 3.2 1.2 9.4 4.2 22.8 -6.2 -0.27
2 13.6 2.4 26.1 4.7 38.1 -12.5 -0.33
Books + Training
Male 1 2 1.1 7.9 3.2 20.1 -5.9 -0.29
2 10.3 3.1 22.9 5.5 34.6 -12.6 -0.36
Female 1 1.7 1.4 9.4 4.2 21.3 -7.7 -0.36
2 18.6 4.4 26.1 4.7 41.4 -7.5 -0.18
Training Only
Male 1 0.5 0.4 7.9 3.2 16.9 -7.4 -0.44
2 21.6 2.9 22.9 5.5 41.1 -1.3 -0.03
Female 1 2.4 0.8 9.4 4.2 22.7 -7 -0.31
2 25.6 4.3 26.1 4.7 44.4 -0.5 -0.01

DFID/PRIMR Rural Expansion: Midterm Report 57
Subtask Language Treatment
Group Gender Class
Treatment Control Programme Impact
Mean Std. Error Mean Std. Error Std.
Deviation Programme
Effect Effect Size
Kiswahili
Full PRIMR
Male 1 4.6 1.4 13.4 3.5 26.2 -8.8 -0.34
2 23.1 4.2 37 5.2 42.0 -13.9 -0.33
Female 1 6.7 1.7 18.5 5.1 31.0 -11.8 -0.38
2 35.5 3.7 36.5 4.7 46.5 -1 -0.02
Books + Training
Male 1 4.7 1.9 13.4 3.5 27.4 -8.7 -0.32
2 23.2 4.3 37 5.2 43.2 -13.8 -0.32
Female 1 8.9 3 18.5 5.1 33.9 -9.6 -0.28
2 33 4.9 36.5 4.7 47.5 -3.5 -0.07
Training Only
Male 1 5 1.4 13.4 3.5 27.5 -8.4 -0.31
2 29.6 3.3 37 5.2 46.3 -7.4 -0.16
Female 1 14.3 2.6 18.5 5.1 37.5 -4.2 -0.11
2 44 4.9 36.5 4.7 48.6 7.5 0.15

DFID/PRIMR Rural Expansion: Midterm Report 58
Annex 2. EGMA Descriptive Statistics at Midterm by Language, Treatment Group, Class and Gender
Subtask Treatment
Group Gender Class
Treatment Control Programme Impact
Mean Std. Error Mean Std. Error Std.
Deviation Programme
Effect Effect Size
Number ID Fluency (cpm)
Full PRIMR
Male 1 8.1 0.6 9.8 0.9 6.6 -1.7 -0.26
2 15.4 1 17.6 1 9.2 -2.2 -0.24
Female 1 8.2 0.7 10.8 0.8 6.7 -2.6 -0.39
2 17.3 1 20.2 1.7 9.7 -2.9 -0.30
Books + Training
Male 1 6.6 0.6 9.8 0.9 6.5 -3.2 -0.49
2 16.4 1.6 17.6 1 10.1 -1.2 -0.12
Female 1 7.7 0.7 10.8 0.8 7.3 -3.1 -0.43
2 17.6 0.9 20.2 1.7 9.9 -2.6 -0.26
Training Only
Male 1 9.9 0.5 9.8 0.9 7.0 0.1 0.01
2 19 0.9 17.6 1 9.9 1.4 0.14
Female 1 11.1 0.8 10.8 0.8 7.6 0.3 0.04
2 21.4 1.2 20.2 1.7 10.6 1.2 0.11
Quantity Discrimination (%)
Full PRIMR
Male 1 28.8 4 28.2 2.9 24.1 0.6 0.03
2 49.8 3.1 57.6 4 30.0 -7.8 -0.26
Female 1 26.8 3.2 28.4 2.7 22.9 -1.6 -0.07
2 56.7 3.6 60.1 4.6 28.7 -3.4 -0.12
Books + Training
Male 1 24.8 3.2 28.2 2.9 23.4 -3.4 -0.15
2 48.6 4.2 57.6 4 30.2 -9 -0.30
Female 1 22 2.9 28.4 2.7 23.8 -6.4 -0.27

DFID/PRIMR Rural Expansion: Midterm Report 59
Subtask Treatment
Group Gender Class
Treatment Control Programme Impact
Mean Std. Error Mean Std. Error Std.
Deviation Programme
Effect Effect Size
2 50.4 3.4 60.1 4.6 29.8 -9.7 -0.33
Training Only
Male 1 32.9 2.5 28.2 2.9 25.3 4.7 0.19
2 60.8 3 57.6 4 32.2 3.2 0.10
Female 1 36.1 2.9 28.4 2.7 25.9 7.7 0.30
2 64.4 3.9 60.1 4.6 31.7 4.3 0.14
Missing Number (%)
Full PRIMR
Male 1 15.6 1 19 1.9 11.9 -3.4 -0.29
2 28.8 1.7 34.9 2.3 19.0 -6.1 -0.32
Female 1 17.1 1.2 21 1.6 12.3 -3.9 -0.32
2 30.6 1.4 35.7 2.1 17.6 -5.1 -0.29
Books + Training
Male 1 15.1 1 19 1.9 12.7 -3.9 -0.31
2 27.6 2.4 34.9 2.3 19.5 -7.3 -0.37
Female 1 13.4 1 21 1.6 12.4 -7.6 -0.62
2 28.4 1.8 35.7 2.1 17.4 -7.3 -0.42
Training Only
Male 1 19.7 1.2 19 1.9 13.2 0.7 0.05
2 34.5 1.9 34.9 2.3 20.8 -0.4 -0.02
Female 1 21 1.3 21 1.6 13.9 0 0.00
2 36.1 2.1 35.7 2.1 19.1 0.4 0.02
Addition Fluency (cpm)
Full PRIMR
Male 1 4.1 0.3 5.5 0.5 3.6 -1.4 -0.39
2 7.9 0.4 8.7 0.6 4.3 -0.8 -0.19
Female 1 3.8 0.4 5.4 0.4 3.4 -1.6 -0.48
2 8.5 0.4 9.1 0.5 4.1 -0.6 -0.15
Books + Training
Male 1 3.9 0.4 5.5 0.5 3.7 -1.6 -0.44
2 7.6 0.4 8.7 0.6 4.4 -1.1 -0.25

DFID/PRIMR Rural Expansion: Midterm Report 60
Subtask Treatment
Group Gender Class
Treatment Control Programme Impact
Mean Std. Error Mean Std. Error Std.
Deviation Programme
Effect Effect Size
Female 1 3.5 0.4 5.4 0.4 3.7 -1.9 -0.52
2 8.3 0.5 9.1 0.5 4.1 -0.8 -0.20
Training Only
Male 1 6.3 0.4 5.5 0.5 4.0 0.8 0.20
2 9.8 0.4 8.7 0.6 4.3 1.1 0.26
Female 1 6.1 0.4 5.4 0.4 3.7 0.7 0.19
2 10 0.4 9.1 0.5 3.9 0.9 0.23
Addition Level 2 (%)
Full PRIMR
Male 1 4.9 1.1 13 2.8 15.4 -8.1 -0.53
2 18.6 2.3 26.5 3.3 26.6 -7.9 -0.30
Female 1 4.1 1 9.7 2 13.6 -5.6 -0.41
2 17.7 2.7 27.4 4.7 26.5 -9.7 -0.37
Books + Training
Male 1 3.9 0.9 13 2.8 15.0 -9.1 -0.61
2 19.1 3.9 26.5 3.3 28.9 -7.4 -0.26
Female 1 1.9 0.8 9.7 2 13.2 -7.8 -0.59
2 20.7 3.4 27.4 4.7 28.9 -6.7 -0.23
Training Only
Male 1 13.7 2.4 13 2.8 20.6 0.7 0.03
2 37.9 4.3 26.5 3.3 32.1 11.4 0.36
Female 1 12.4 2 9.7 2 18.1 2.7 0.15
2 32.7 3.5 27.4 4.7 31.4 5.3 0.17
Subtraction Fluency (cpm)
Full PRIMR
Male 1 2.7 0.3 3.1 0.4 3.2 -0.4 -0.13
2 5.3 0.5 6.2 0.5 4.2 -0.9 -0.22
Female 1 2.2 0.3 3.4 0.3 3.0 -1.2 -0.41
2 6 0.3 6 0.4 3.8 0 0.00
Books + Male 1 1.7 0.3 3.1 0.4 2.9 -1.4 -0.48

DFID/PRIMR Rural Expansion: Midterm Report 61
Subtask Treatment
Group Gender Class
Treatment Control Programme Impact
Mean Std. Error Mean Std. Error Std.
Deviation Programme
Effect Effect Size
Training 2 4.7 4.9 6.2 0.5 4.1 -1.5 -0.37
Female 1 1.9 0.3 3.4 0.3 3.1 -1.5 -0.49
2 5.7 0.4 6 0.4 3.7 -0.3 -0.08
Training Only
Male 1 3.5 0.4 3.1 0.4 3.3 0.4 0.12
2 7.5 0.4 6.2 0.5 4.3 1.3 0.31
Female 1 4.1 0.4 3.4 0.3 3.7 0.7 0.19
2 6.8 0.5 6 0.4 4.0 0.8 0.20
Subtraction Level 2 (%)
Full PRIMR
Male 1 3.7 1 6.7 1.8 11.5 -3 -0.26
2 10.8 1.7 19.1 3.5 21.8 -8.3 -0.38
Female 1 3.3 1 6.6 1.6 11.1 -3.3 -0.30
2 13.2 2.3 18.3 2.9 20.7 -5.1 -0.25
Books + Training
Male 1 1.8 0.7 6.7 1.8 10.6 -4.9 -0.46
2 12.8 3.1 19.1 3.5 25.2 -6.3 -0.25
Female 1 0.9 0.5 6.6 1.6 9.9 -5.7 -0.58
2 13.6 2.9 18.3 2.9 22.2 -4.7 -0.21
Training Only
Male 1 10.4 2.2 6.7 1.8 16.0 3.7 0.23
2 27.7 4.7 19.1 3.5 29.7 8.6 0.29
Female 1 8.9 1.7 6.6 1.6 15.3 2.3 0.15
2 23.9 3.5 18.3 2.9 25.3 5.6 0.22
Word Problems (%)
Full PRIMR
Male 1 23.7 2.4 27.8 3.6 23.9 -4.1 -0.17
2 37.5 2.8 43.1 3.2 25.8 -5.6 -0.22
Female 1 24.2 2.7 25.9 3.1 24.7 -1.7 -0.07
2 40 3 40.8 3.1 26.7 -0.8 -0.03

DFID/PRIMR Rural Expansion: Midterm Report 62
Subtask Treatment
Group Gender Class
Treatment Control Programme Impact
Mean Std. Error Mean Std. Error Std.
Deviation Programme
Effect Effect Size
Books + Training
Male 1 15 2.6 27.8 3.6 23.0 -12.8 -0.56
2 30.2 3.6 43.1 3.2 26.0 -12.9 -0.50
Female 1 12.7 1.9 25.9 3.1 22.7 -13.2 -0.58
2 31.2 3.1 40.8 3.1 25.4 -9.6 -0.38
Training Only
Male 1 26.7 2.5 27.8 3.6 25.2 -1.1 -0.04
2 44.4 3.1 43.1 3.2 28.3 1.3 0.05
Female 1 28.5 2.6 25.9 3.1 26.8 2.6 0.10
2 41.2 2.8 40.8 3.1 27.5 0.4 0.02