the production and trophic ecology of shallow-water fish.pdf
TRANSCRIPT
8/10/2019 The production and trophic ecology of shallow-water fish.pdf
http://slidepdf.com/reader/full/the-production-and-trophic-ecology-of-shallow-water-fishpdf 1/29
JOURN L OF
EXPERIMENT L
M RINE BIOLOGY
Journal of Experimental Marine Biology and Ecology
NDECOLOGY
ELSEVIER
194 (1995) 53-81
The production and trophic ecology of shallow-water fish
assemblages in southern Australia
I. Species richness, size-structure and production of
fishes in Western Port, Victoria
Graham J. Edgar”‘*, Craig Shawb
“Zool ogy Department, Uni versit y of M elbourne, Parkv i ll e, Vi ctori a 3052, Austr ali a
?Ji ctori an Insti tut e of M ari ne Sciences, 23 St Andrew Pl , East Mel bourne, Vi ctori a 3002, Austral i a
Received 25 September 1994; revision received 4 May 1995; accepted 19 May 1995
bstract
Fishes were sampled by seine and gillnet in three different habitat types (seagrass,
unvegetated sediment and channel) within Western Port, Victoria, between 1989 and 1990.
Approximately twice as many fish species were collected per seine haul from seagrass
habitat (X = 8.7) compared with intertidal unvegetated habitat (2 = 4.7) while relatively
few fish species were collected per haul from deeper unvegetated-channel habitat (2 = 2.3).
Most fishes associated with seagrass beds were widely distributed within the embayment,
with the notable exception of a number of coastal species that occurred in low numbers at a
single site (Cowes Bank seagrass) near the entrance to the bay and had presumably drifted
as pelagic larvae from reefs outside. Small fishes (<lo g weight) were more abundant in
seagrass than in unvegetated habitats; however, relatively few of these animals were
juveniles of commercially fished species. Seagrass beds in Western Port were not found to
provide a significantly more important nursery habitat for commercial species than
unvegetated habitat.
The production of small fishes at different sites was highly correlated with the production
of epifauna, particularly crustaceans. We postulate that these factors are causally linked.
This hypothesis is supported by seasonal data, which indicate that when the production of
crustaceans was at its lowest during May, populations of small fishes were rapidly declining
in Western Port, either by dying or emigrating. Seagrass beds supported over twice the
production of small fishes as unvegetated habitat (3.82 g. mm’. yr-’ cf. 1.58 g. me2 . yrr ’ in
unvegetated habitat). Because an estimated 178 km2 of seagrass habitat has been lost from
Western Port since 1973, the reduced production of fishes in unvegetated habitat translates
to a decline in small fish production of
~630 tonnes AFDW per year. However, falling
* Corresponding author. Present address: Zoology Department, University of Tasmania, GPO Box
252C, Hobart, Tasmania 7001, Australia.
0022-0981/95/$09.50 0 1995 Elsevier Science B.V. All rights reserved
SSDI
0022.0981(95)00083-6
8/10/2019 The production and trophic ecology of shallow-water fish.pdf
http://slidepdf.com/reader/full/the-production-and-trophic-ecology-of-shallow-water-fishpdf 2/29
54
G.J. Edgar and C. Shaw I J. Exp. M ar. Bi ol . Ecol . 194 (1995) .5_3-81
catches of only two commercial fishes, six-spined leatherjackets (Meuschenia freycineti) and
blue rock whiting (Hulettu setnifusciutu), were clearly associated with seagrass loss, with
most of the loss of fish production occurring amongst small non-commercial species,
particularly syngnathids, clinids and scorpaenids.
Differences in production of small fishes between habitats were not reflected higher in
the food chain. Although greater numbers of fishes were collected using small-mesh (64
mm) gillnets from seagrass than unvegetated habitats, these differences were due to
variation in the catch of the omnivorous mullet Aldrichettu forsteri, the most abundant
species, rather than variation in the abundances of piscivorous fish species. No differences
were found between catches of fish using large-mesh (108 mm) gillnets placed in different
habitats.
Keyw ords:
Australia; Fish; Production; Seagrass; Species richness; Temperate
1. Introduction
The composition and abundance of fish assemblages in shallow coastal waters
has been known since the work of Petersen (1918) to be strongly affected by the
presence of macrophytes, and relationships between fishes and seagrasses have
now been studied at a variety of sites worldwide (Bell & Pollard, 1989). While fish
densities in seagrass beds are not always higher than in bare substrata immedi-
ately adjacent to the beds (Ferrell & Bell, 1991) seagrasses have been found in
most studies to increase species richness of fish assemblages and enhance
abundance (Heck & Orth, 1980). Seagrasses thus appear to have a similar positive
effect on the species richness and production of fish communities as they have on
invertebrate communities (Howard et al., 1989; Edgar et al., 1994) despite the
structure of seagrasses having a less obvious benefit to fish than to invertebrates.
The structural complexity of seagrass habitats should partly aid fishes by providing
concealment from larger predators, but may also be detrimental because it will
conceal prey from the majority of fishes which are visual carnivores.
Extensive loss of seagrass beds has occurred in southern Australia this century,
with particularly severe declines occurring in Western Port, Victoria, a large
embayment 60 km south-east of Melbourne. A total of 70% of the area of
seagrass (178 km*) in the bay disappeared between 1973 and 1984 (Shepherd et
al., 1989). The present study was initiated to determine the consequences of this
loss to the marine fauna, particularly with respect to local fishery production.
Seagrass loss was predicted to affect fish catches in three ways: (1) the catch of
fishes should be directly affected by habitat transformation because abundance
and composition of adult fishes differs between seagrass and unvegetated habitats,
(2) seagrass beds are widely considered prime nursery habitat (Pollard, 1984)
hence a reduction in the area of seagrass may reduce habitat available for juvenile
fish, and (3) detached seagrass contributes to detrital input into the base of the
food chain (Klumpp et al., 1989) so the loss of seagrass production may result in
a general baywide decline in production of fishes feeding on detritivorous
invertebrates and their predators.
8/10/2019 The production and trophic ecology of shallow-water fish.pdf
http://slidepdf.com/reader/full/the-production-and-trophic-ecology-of-shallow-water-fishpdf 3/29
G.J. Edgar and C. Shaw I J. Exp. Mar. Biol. Ecol. 194 (1995) 53-81
5s
The present study was designed primarily to address the first, and to a lesser
extent the second of the above predictions, while the third prediction has not been
investigated here. In contrast to previous studies, which have concentrated on the
composition and abundance of fishes in seagrass relative to unvegetated habitats
(e.g. Sogard et al., 1987; Thayer & Chester, 1989) this study attempted to quantify
differences in the production of fish assemblages between habitats, and to identify
any general production relationships between invertebrates and fishes. Related
work on the diets of fishes and trophic relationships between fish and benthos are
described in an associated paper (Edgar & Shaw, 1995).
The secondary aim of the study was to investigate whether seagrass beds are
important as nursery grounds for commercially-important fish species in the area.
A widely-quoted paradigm suggests that seagrass beds are important nursery
areas for fishes (see Bell & Pollard, 1989). This hypothesis has, however, little
predictive value because virtually all other marine and estuarine habitats are also
nursery grounds for particular commercial fishes; for example, most mud- and
sand-flats are utilized by juvenile flatfishes as are many reefs by juvenile sparids
and labrids. The paradigm can be interpreted in a more useful form as a
prediction that seagrass beds support a greater abundance, and number of species,
of juveniles of commercially-important species than unvegetated habitats in their
vicinity. Surprisingly, there are virtually no published studies in which this
prediction has been empirically tested at several sites (but see Heck & Thoman,
1984).
2. Methods
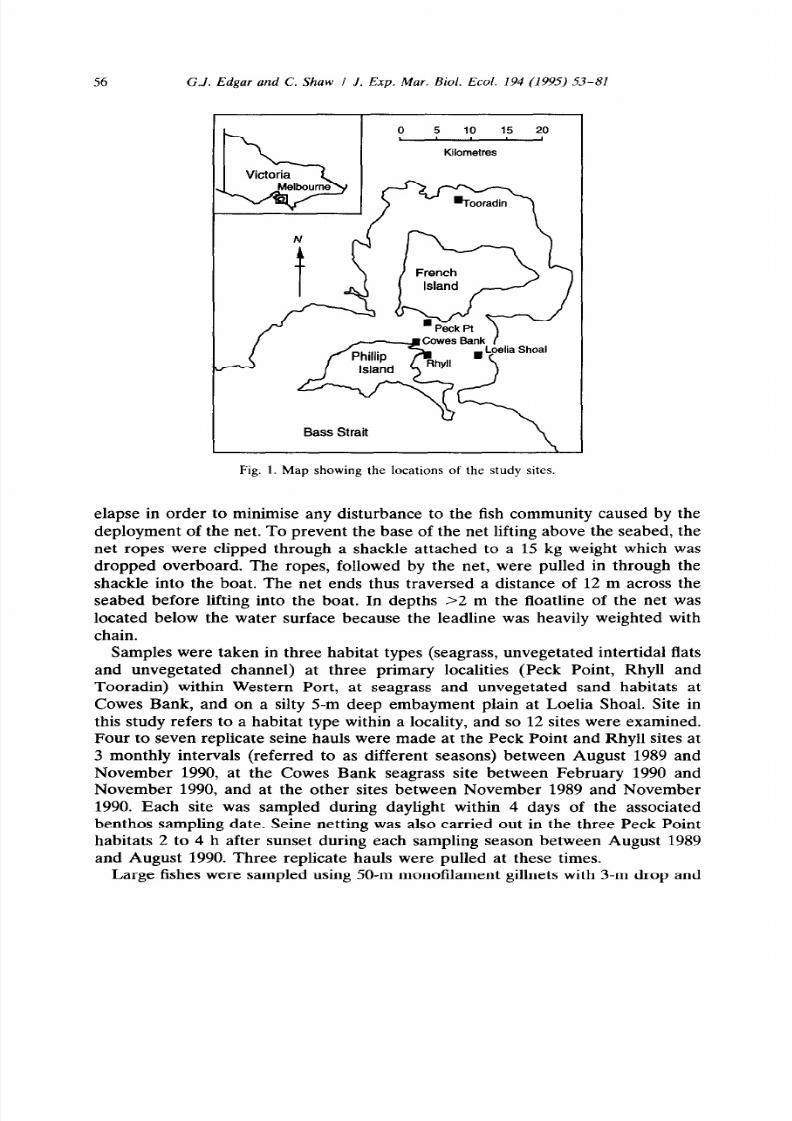
Western Port is a 30-km wide coastal embayment in central Victoria, with a
large island (French Island) in the central section and another (Phillip Island)
forming the southern boundary of the bay (Fig. 1). Surface water temperatures
recorded in a channel at Rhyll during the study ranged from 10 to 22°C annually,
with salinities close to fully marine (>32’&). Intertidal mudflat, colonised in places
by the seagrasses Heterozostera tasmanica (Martens ex Aschers.) den Hartog and
Zostera muelleri
Irmisch ex Aschers, occupies -40% of the total area of Western
Port, with extensive dendritic channels (4-10 m deep) draining the mudflats. Flat
embayment plains at 5-10 m depth occupy considerable areas in the southern
section of the bay (Marsden et al., 1979).
Small fishes and epibenthic invertebrates were sampled at the same times and
sites as a study of benthos described in Edgar et al. (1994) using a 15 m seine net
with 3-m drop and 1 x 1 mm mesh. Netting was carried out from a small dingy by
first anchoring the boat at the end of a long (40 m) anchor line and then setting
the net over the side of the boat along the circumference of a circle of 40 m
radius. The boat was then pulled by hand up the anchor line without dragging the
net while 12-m long ropes attached to the two ends of the net were let out. The
boat was next retied to the anchor line so that the drag force as the net was pulled
would be counterbalanced by the anchor, and a period of at least 2 min allowed to
8/10/2019 The production and trophic ecology of shallow-water fish.pdf
http://slidepdf.com/reader/full/the-production-and-trophic-ecology-of-shallow-water-fishpdf 4/29
G.J. Edgar and C. Shaw I J. Exp. Mar. Bio l. Eco l. 194 1995) 53-81
Bass Strait
Fig. 1. Map showing the locations of the study sites
elapse in order to minimise any disturbance to the fish community caused by the
deployment of the net. To prevent the base of the net lifting above the seabed, the
net ropes were clipped through a shackle attached to a 15 kg weight which was
dropped overboard. The ropes, followed by the net, were pulled in through the
shackle into the boat. The net ends thus traversed a distance of 12 m across the
seabed before lifting into the boat. In depths >2 m the floatline of the net was
located below the water surface because the leadline was heavily weighted with
chain.
Samples were taken in three habitat types (seagrass, unvegetated intertidal flats
and unvegetated channel) at three primary localities (Peck Point, Rhyll and
Tooradin) within Western Port, at seagrass and unvegetated sand habitats at
Cowes Bank, and on a silty 5-m deep embayment plain at Loelia Shoal. Site in
this study refers to a habitat type within a locality, and so 12 sites were examined.
Four to seven replicate seine hauls were made at the Peck Point and Rhyll sites at
3 monthly intervals (referred to as different seasons) between August 1989 and
November 1990, at the Cowes Bank seagrass site between February 1990 and
November 1990, and at the other sites between November 1989 and November
1990. Each site was sampled during daylight within 4 days of the associated
benthos sampling date. Seine netting was also carried out in the three Peck Point
habitats 2 to 4 h after sunset during each sampling season between August 1989
and August 1990. Three replicate hauls were pulled at these times.
Large fishes were sampled using 50-m monofilament gillnets with 3-m drop and
8/10/2019 The production and trophic ecology of shallow-water fish.pdf
http://slidepdf.com/reader/full/the-production-and-trophic-ecology-of-shallow-water-fishpdf 5/29
8/10/2019 The production and trophic ecology of shallow-water fish.pdf
http://slidepdf.com/reader/full/the-production-and-trophic-ecology-of-shallow-water-fishpdf 6/29
58
G.J. Edgar and C. Shaw I J. Exp. Mar. Bio l. Eco l. 194 199.5) 53-81
Length mm)
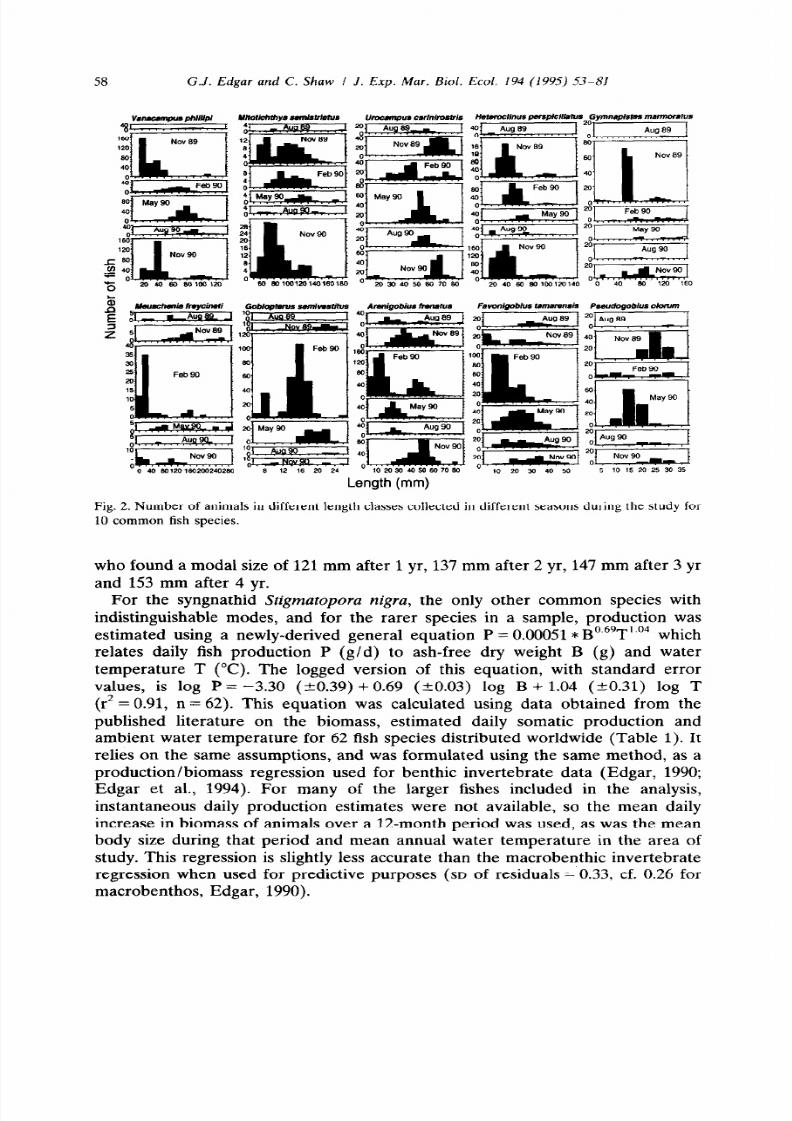
Fig. 2. Number of animals in different length classes collected in different seasons during the study for
10 common fish species.
who found a modal size of 121 mm after 1 yr, 137 mm after 2 yr, 147 mm after 3 yr
and 153 mm after 4 yr.
For the syngnathid
Stigmatoporu nigra,
the only other common species with
indistinguishable modes, and for the rarer species in a sample, production was
estimated using a newly-derived general equation P = 0.00051* B0.69T’.04 which
relates daily fish production P (g/d) to ash-free dry weight B (g) and water
temperature T (“C). The logged version of this equation, with standard error
values, is log P = -3.30 (20.39) + 0.69 (kO.03) log B + 1.04 (20.31) log T
(8 = 0.91, n = 62). This equation was calculated using data obtained from the
published literature on the biomass, estimated daily somatic production and
ambient water temperature for 62 fish species distributed worldwide (Table 1). It
relies on the same assumptions, and was formulated using the same method, as a
production/biomass regression used for benthic invertebrate data (Edgar, 1990;
Edgar et al., 1994). For many of the larger fishes included in the analysis,
instantaneous daily production estimates were not available, so the mean daily
increase in biomass of animals over a 12-month period was used, as was the mean
body size during that period and mean annual water temperature in the area of
study. This regression is slightly less accurate than the macrobenthic invertebrate
regression when used for predictive purposes SD of residuals = 0.33, cf. 0.26 for
macrobenthos, Edgar, 1990).
8/10/2019 The production and trophic ecology of shallow-water fish.pdf
http://slidepdf.com/reader/full/the-production-and-trophic-ecology-of-shallow-water-fishpdf 7/29
Table 1
G.J. Edgar and C. Shaw J. Exp. Mar. Bi ol . Ecol . 194 (1995) 53-81
59
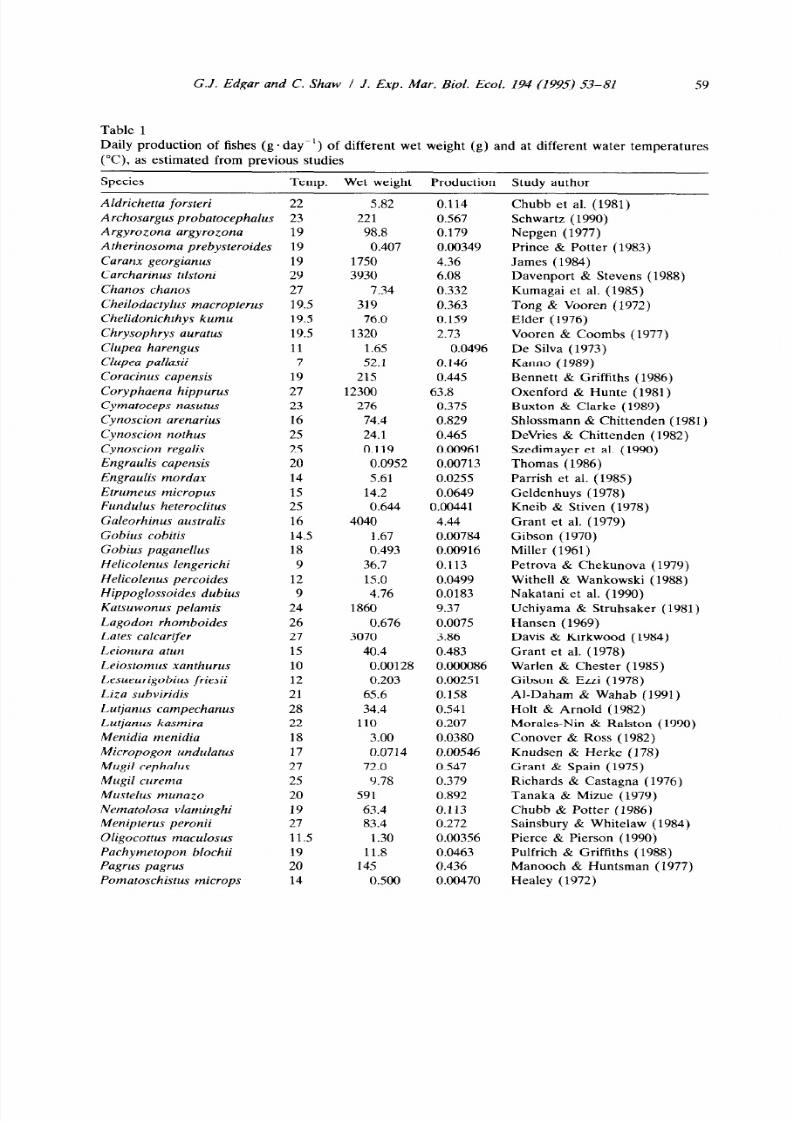
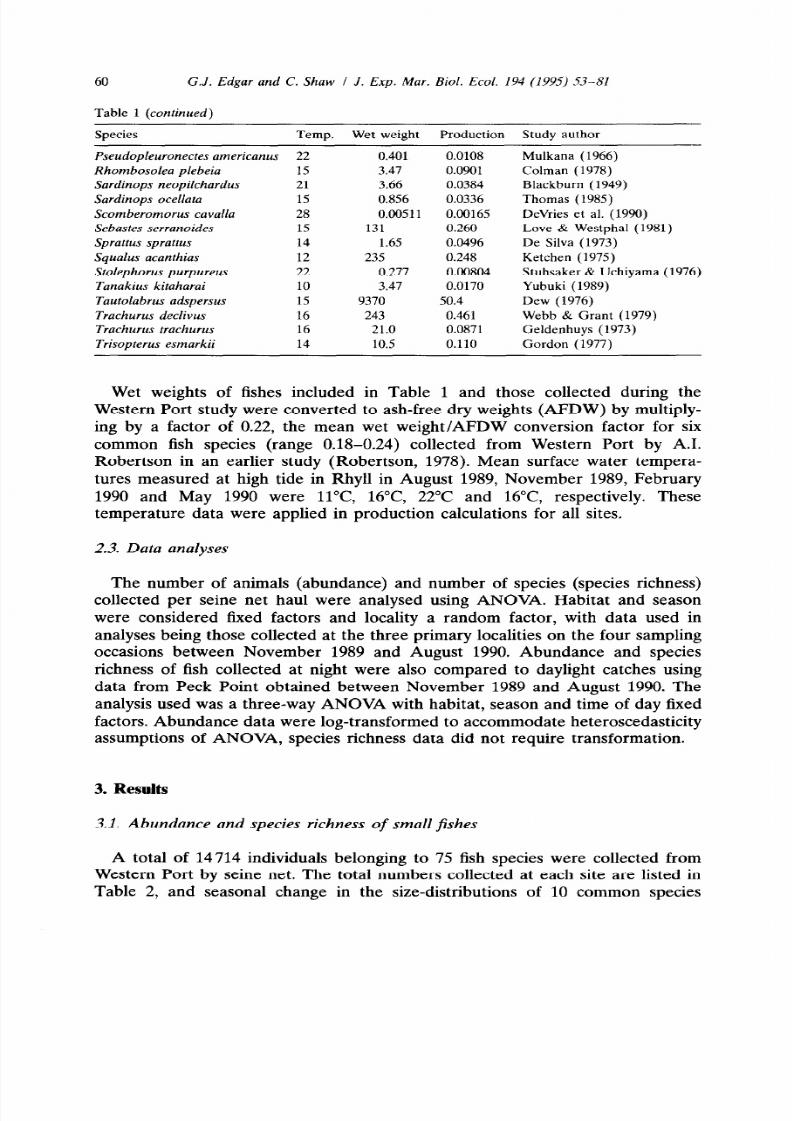
Daily production of fishes (g. day-‘) of different wet weight (g) and at different water temperatures
(“0, as estimated from previous studies
Species
Temp. Wet weight Production Study author
Aldrichetta forsteri
22
Ar chosargus probat ocephalw 23
Argyrorona argyrozona
19
Atherinosoma prebysteroides
19
Caranx georgianus
19
Carcharinus tilstoni
29
Chanos chanos
27
Cheilodactylus macropterus
19.5
Chelidonichthys kumu
19.5
Chrysophrys auratus 19.5
Clupea harengus
11
Clupea pallasii
7
Coracinus capensis
19
Coryphaena hippurus
27
Cymatoceps nasutus
23
Cynoscion arenarius
16
Cynoscion nothus
25
Cynoscion regalis
25
Engraulis capensis
20
Engraulis mordax
14
Etrumeus micropus
15
Fundulus heteroclitus
25
Galeorhinus australis
16
Gobius cobit is
14.5
Gobius paganellus 18
Helicolenus lengerichi
9
Helicolenus percoides
12
Hippoglossoides dubius 9
Kat suwonus pel ami s
24
Lagodon rhomboides
26
Lat es calcarif er
27
Leionura atun
15
Leiostomus xanthurus 10
Lesueurigobius friesii
12
Lira subvir id is
21
Lutjanus campechanus
28
Lutjanus kasmira
22
M enidia menidi a
18
M icropogon undulat us
17
M ugil cephalus
27
M ugil curema 25
M ustelus munazo
20
Nematofosa vlaminghi 19
M enipt erus peroni i
27
Oligocottus maculosus 11.5
Pachymetopon blochii
19
Pagrus pagrus
20
Pomatoschistus microps
14
5.82
0.114
Chubb et al. (1981)
221
0.567 Schwartz (1990)
98.8 0.179
Nepgen (1977)
0.407 0.00349
Prince & Potter (1983)
1750
4.36
James (1984)
3930
6.08
Davenport & Stevens (1988)
7.34
0.332 Kumagai et al. (1985)
319
0.363 Tong & Vooren (1972)
76.0 0.159
Elder (1976)
1320 2.73 Vooren & Coombs (1977)
1.65 0.0496
De Silva (1973)
52.1
0.146 Kanno ( 1989)
215
0.445
Bennett & Griffiths (1986)
12300
63.8
Oxenford & Hunte (1981)
276 0.375 Buxton & Clarke (1989)
74.4
0.829
Shlossmann & Chittenden (1981)
24.1
0.465
DeVries & Chittenden (1982)
0.119
0.00961 Szedimayer et al. (1990)
0.0952 0.00713 Thomas (1986)
5.61 0.0255 Parrish et al. (1985)
14.2 0.0649 Geldenhuys (1978)
0.644 0.00441 Kneib & Stiven (1978)
4040
4.44 Grant et al. (1979)
I 67
0.00784 Gibson (1970)
0.493
0.00916
Miller (1961)
36.7 0.113 Petrova & Chekunova (1979)
15.0 0.0499 Withell & Wankowski (1988)
4.76 0.0183 Nakatani et al. (1990)
1860
9.37 Uchiyama & Struhsaker (1981)
0.676
0.0075 Hansen (1969)
3070
3.86 Davis & Kirkwood (1984)
40.4 0.483 Grant et al. (1978)
0.00128 0.000086 Warlen & Chester (1985)
0.203 0.00251 Gibson & Ezzi (1978)
65.6 0.158 Al-Daham & Wahab (1991)
34.4
0.541 Holt & Arnold (1982)
110 0.207
Morales-Nin & Ralston (1990)
3.00 0.0380 Conover & Ross (1982)
0.0714
0.00546 Knudsen & Herke (178)
72.0 0.547 Grant & Spain (1975)
Y.78 0.379 Richards & Castagna (1976)
591 0.892 Tanaka & Mizue (1979)
63.4 0.113 Chubb & Potter (1986)
83.4 0.272 Sainsbury & Whitelaw (1984)
I
.30 0.00356 Pierce & Pierson (1990)
11.8 0.0463 Pulfrich & Griftiths (1988)
145 0.436 Manooch & Huntsman (1977)
0.500 0.00470
Healey (1972)
8/10/2019 The production and trophic ecology of shallow-water fish.pdf
http://slidepdf.com/reader/full/the-production-and-trophic-ecology-of-shallow-water-fishpdf 8/29
60 G.J. Edgar and C. Shaw I J. Exp. Mar. Biol . Ecol. I 94 (1995) 53-81
Table 1 (continued)
Species
Temp. Wet weight Production Study author
Pseudopleuronectes americanus 22
Rhombosolea plebeia 15
Sardinops neopilchardus
21
Sardinops ocellata
15
Scomberomorus cavalla
28
Sebastes serranoides
15
Sprattus sprat s
14
Squalus acanthias
12
Stolephorus purpureus
22
Tanakius kitaharai
10
Tautolabrus adspersus
15
Trachurus declivus
16
Trachurus trachurus
16
Trisopterus esmarkii 14
0.401 0.0108 Mulkana (1966)
3.41
0.0901 Colman (1978)
3.66 0.0384 Blackburn (1949)
0.856 0.0336 Thomas (1985)
0.00511 0.00165 DeVries et al. (1990)
131 0.260 Love & Westphal (1981)
1.65
0.0496 De Silva (1973)
235 0.248 Ketchen (1975)
0.277 0.00804 Stuhsaker & Uchiyama (1976)
3.47 0.0170 Yubuki (1989)
9370
50.4
Dew (1976)
243
0.461 Webb & Grant (1979)
21.0 0.0871 Geldenhuys (1973)
10.5 0.110 Gordon (1977)
Wet weights of fishes included in Table 1 and those collected during the
Western Port study were converted to ash-free dry weights (AFDW) by multiply-
ing by a factor of 0.22, the mean wet weight/AFDW conversion factor for six
common fish species (range 0.18-0.24) collected from Western Port by A.I.
Robertson in an earlier study (Robertson, 1978). Mean surface water tempera-
tures measured at high tide in Rhyll in August 1989, November 1989, February
1990 and May 1990 were 11°C 16°C 22°C and 16°C respectively. These
temperature data were applied in production calculations for all sites.
2.3. Dat a anal yses
The number of animals (abundance) and number of species (species richness)
collected per seine net haul were analysed using ANOVA. Habitat and season
were considered fixed factors and locality a random factor, with data used in
analyses being those collected at the three primary localities on the four sampling
occasions between November 1989 and August 1990. Abundance and species
richness of fish collected at night were also compared to daylight catches using
data from Peck Point obtained between November 1989 and August 1990. The
analysis used was a three-way ANOVA with habitat, season and time of day fixed
factors. Abundance data were log-transformed to accommodate heteroscedasticity
assumptions of ANOVA, species richness data did not require transformation.
3. Results
3.1. Abundance and species ri chness of smal l fi shes
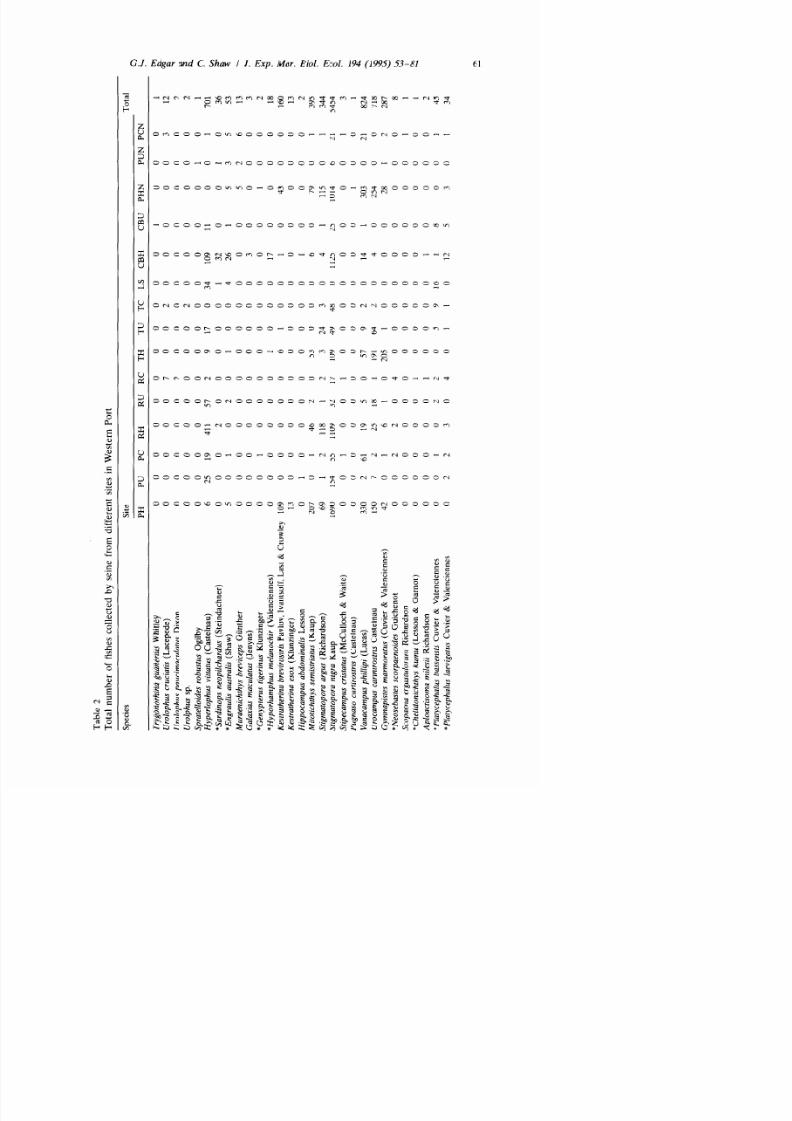
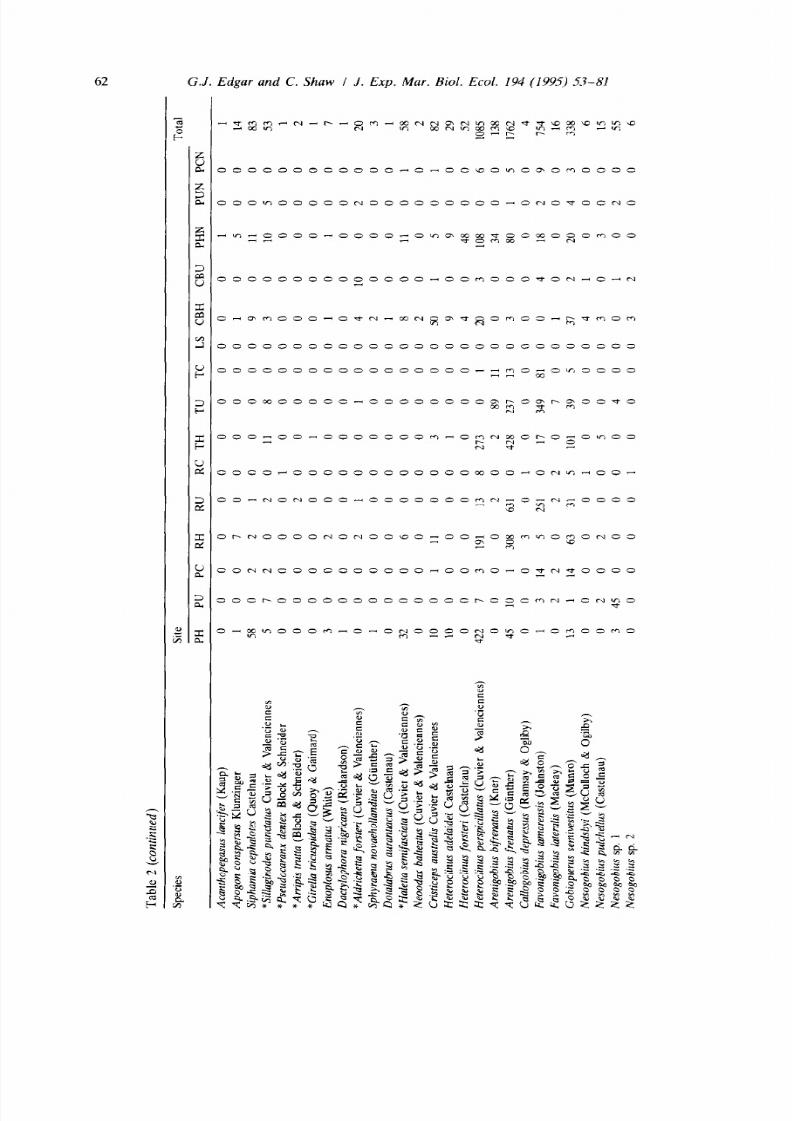
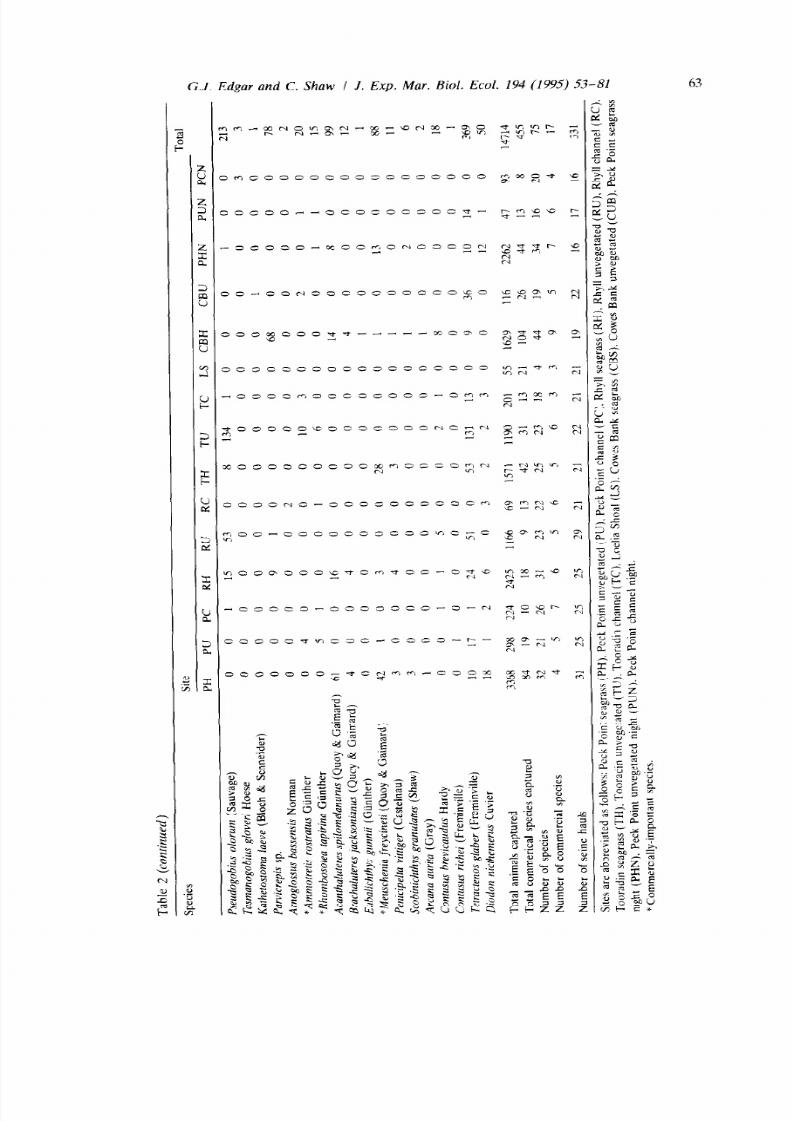
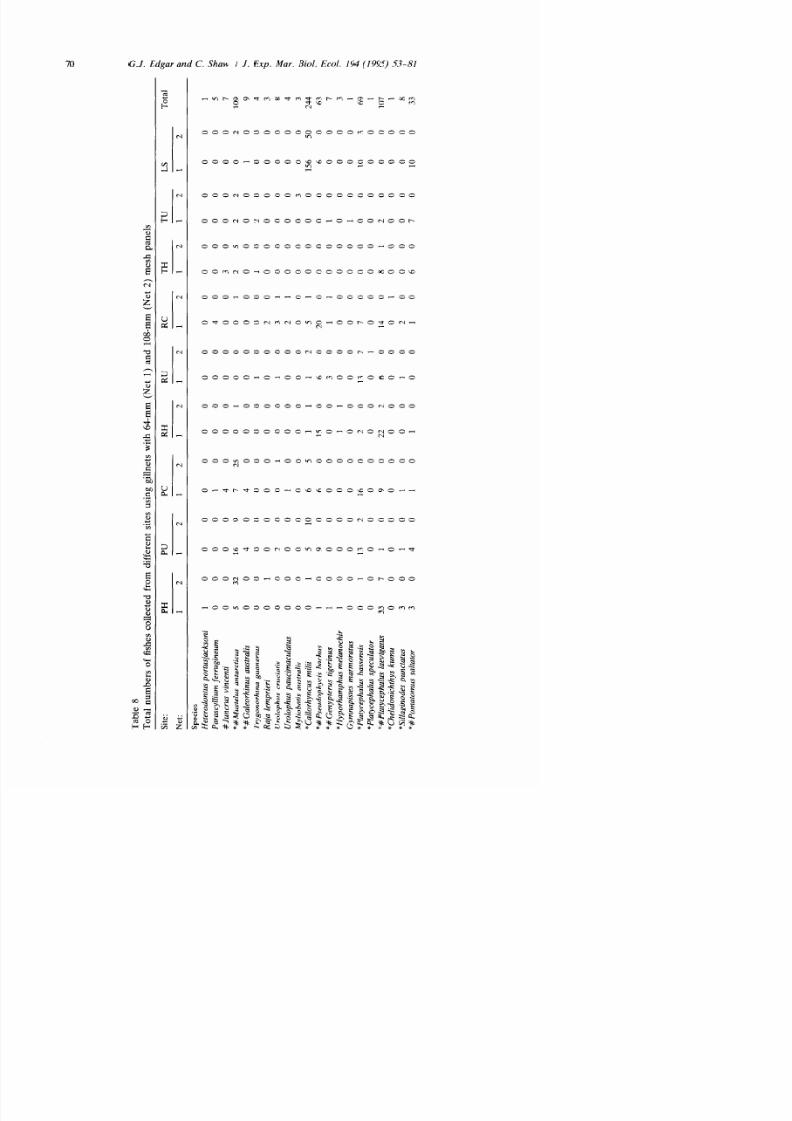
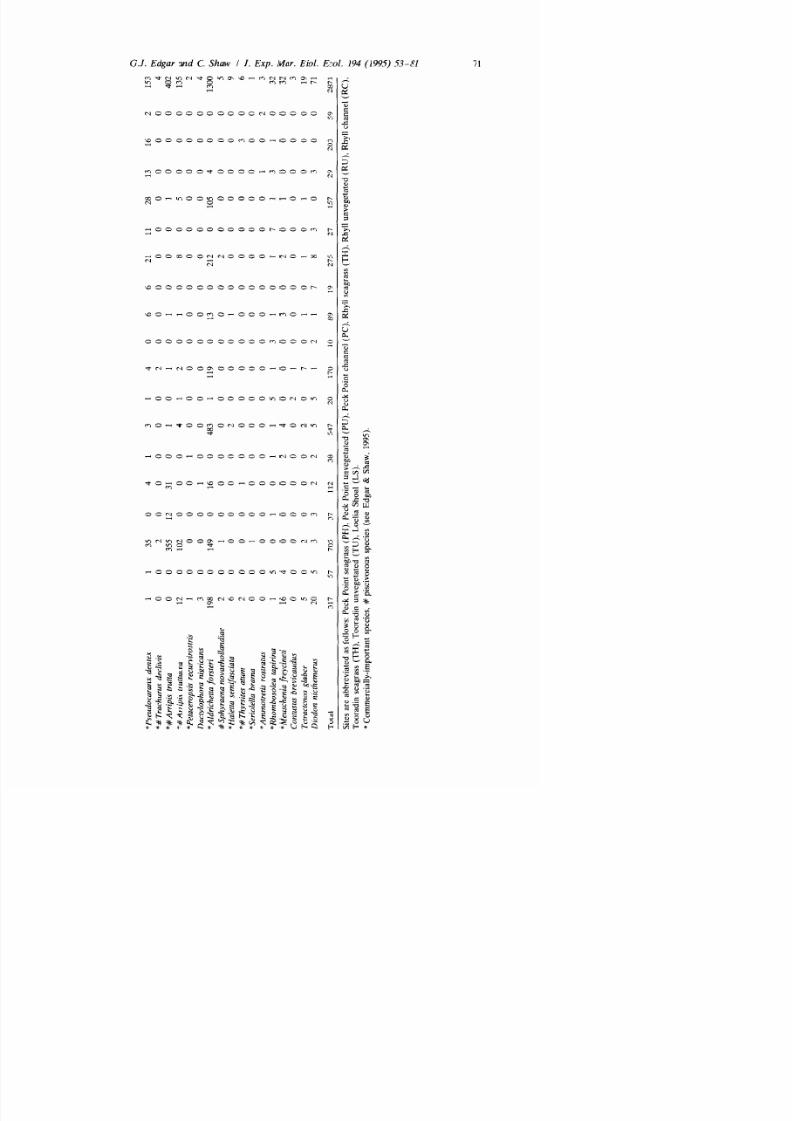
A total of 14714 individuals belonging to 75 fish species were collected from
Western Port by seine net. The total numbers collected at each site are listed in
Table 2, and seasonal change in the size-distributions of 10 common species
8/10/2019 The production and trophic ecology of shallow-water fish.pdf
http://slidepdf.com/reader/full/the-production-and-trophic-ecology-of-shallow-water-fishpdf 9/29
T
e
2
T
a
n
m
o
s
h
c
e
e
b
s
n
m
d
e
s
n
W
e
n
P
S
e
S
T
a
Q
P
H
P
U
P
R
R
R
T
H
T
U
T
L
C
C
PH
P
U
P
i
T
y
h
n
g
u
W
h
e
0
U
o
o
u
a
s
L
0
U
o
o
m
a
u
D
x
0
U
o
p
0
S
a
e
o
d
o
u
O
b
0
H
o
w
v
a
u
C
n
6
2
*
S
d
n
c
d
(
S
n
h
0
0
*
E
a
s
a
s
S
w
5
0
M
u
a
c
h
e
c
G
h
0
0
G
a
a
m
a
e
J
0
0
*
G
e
u
t
g
n
K
u
n
0
0
‘
H
h
m
m
a
(
V
e
e
0
0
K
a
h
n
e
o
s
P
o
I
v
L
&
C
w
e
1
0
K
a
h
n
K
u
n
1
0
H
p
m
a
m
n
s
L
0
1
M
i
o
c
b
m
s
a
u
K
2
0
S
g
m
o
a
g
R
c
h
d
6
1
S
g
m
o
a
g
a
K
1
1
S
p
m
s
a
u
M
C
o
h
&
W
a
0
0
P
c
o
s
C
n
0
0
V
m
p
L
3
2
U
o
m
n
o
s
C
n
1
7
G
m
s
e
m
m
n
u
C
e
&
V
e
e
4
0
*
N
e
p
d
G
c
h
0
0
S
g
u
o
u
m
R
c
h
d
0
0
*
C
d
c
h
k
m
L
&
G
n
0
0
A
o
s
m
m
e
R
c
h
d
0
0
*
P
a
y
u
s
C
e
&
V
e
e
0
0
*
P
a
y
u
a
g
u
C
e
&
V
e
0
2
1
1
7
2
3
1
2
0
0
2
0
2
0
2
0
0
1
0
1
1
4
5
2
9
1
0
3
1
I
1
0
1
7
0
2
0
0
0
0
0
I
3
0
1
0
3
1
0
2
0
1
0
0
4
2
1
5
3
5
5
0
0
0
0
0
0
0
0
0
0
5
2
6
1
0
0
0
0
0
0
0
0
3
0
0
0
0
3
1
0
0
0
0
0
0
0
0
0
1
0
0
2
0
0
0
0
1
0
0
0
1
0
0
0
0
1
0
0
0
0
6
1
0
0
1
0
4
0
0
1
0
0
0
0
0
0
0
0
0
0
0
0
0
1
0
0
0
0
0
0
0
0
1
0
0
0
0
2
I
4
2
0
5
0
0
0
6
0
7
0
1
3
2
I
1
1
2
3
2
3
0
4
1
1
0
1
3
5
1
3
1
1
4
4
0
1
2
1
6
2
5
1
0
0
1
0
0
0
0
0
0
0
0
1
3
0
0
0
0
0
0
0
0
0
0
I
0
0
I
6
1
5
0
5
9
2
0
1
1
3
0
2
8
2
2
1
1
1
6
2
0
4
0
2
0
0
7
1
6
I
0
2
I
0
0
0
0
2
1
2
2
2
2
0
4
0
0
0
0
0
0
0
0
0
8
0
0
0
0
0
0
0
0
0
0
0
0
I
1
0
0
0
1
0
0
0
0
0
0
0
0
0
1
0
0
0
1
0
0
0
0
I
0
0
0
0
2
1
0
2
2
0
5
9
1
1
8
0
0
1
4
2
3
0
4
0
I
I
0
1
5
3
0
I
3
8/10/2019 The production and trophic ecology of shallow-water fish.pdf
http://slidepdf.com/reader/full/the-production-and-trophic-ecology-of-shallow-water-fishpdf 10/29
62
G.J. Edgar and C. Shaw
I
J. Exp. M ar. Bi ol . Ecol . 194 (199S) _5.?-81
8/10/2019 The production and trophic ecology of shallow-water fish.pdf
http://slidepdf.com/reader/full/the-production-and-trophic-ecology-of-shallow-water-fishpdf 11/29
G.J. Edgar and C. Shaw I J. Exp. Mar. Biol. Ecol. 194 (1995) 53-81
63
8/10/2019 The production and trophic ecology of shallow-water fish.pdf
http://slidepdf.com/reader/full/the-production-and-trophic-ecology-of-shallow-water-fishpdf 12/29
64
G.J. Edgar and C. Shaw I J. Exp. Mar. Bio l. Ecol. 194 199.5) 53-81
shown in Fig. 2. Most species were small, non-commercially important species of
gobies (Gobiidae), pipefish (Syngnathidae) and weedfish (Clinidae). Total num-
bers of commercially-important fishes were consistently higher in seagrass than
unvegetated habitats at all locations (Table 2) due to the relatively large numbers
of leatherjackets (M euscheni a freyci net i ), gartish (Hyporhamphus melanochir) and
clupeoids (Engraulis australis and Sardinops neopilchardus) collected amongst
seagrass. The significance of this relationship could not be tested because of the
patchy distribution of these species,
and consequent high heterogeneity of
variances. Juveniles of the commercially-important species appeared to be equally
distributed between unvegetated and seagrass habitats, with only the rock flathead
(Platycephalus laevigatus), which lived on sand as juveniles and amongst seagrass
beds as adults (Edgar & Shaw, unpubl. data), showing a clear change in habitat
with increasing age. The number of commercially-important species collected
from different sites varied from three to nine, with approximately equal numbers
of species collected from each habitat type (Table 2).
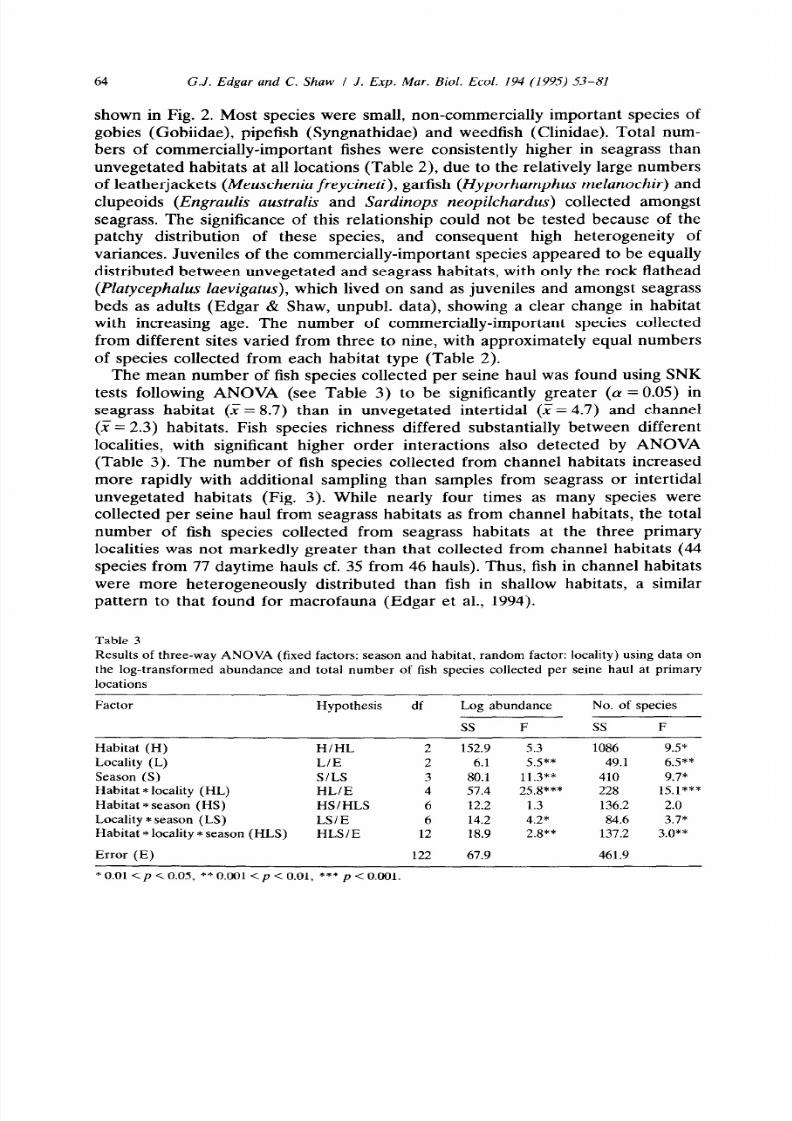
The mean number of fish species collected per seine haul was found using SNK
tests following ANOVA (see Table 3) to be significantly greater ((Y= 0.05) in
seagrass habitat (.i = 8.7) than in unvegetated intertidal (X= 4.7) and channel
(F = 2.3) habitats. Fish species richness differed substantially between different
localities, with significant higher order interactions also detected by ANOVA
(Table 3). The number of fish species collected from channel habitats increased
more rapidly with additional sampling than samples from seagrass or intertidal
unvegetated habitats (Fig. 3). While nearly four times as many species were
collected per seine haul from seagrass habitats as from channel habitats, the total
number of fish species collected from seagrass habitats at the three primary
localities was not markedly greater than that collected from channel habitats (44
species from 77 daytime hauls cf. 35 from 46 hauls). Thus, fish in channel habitats
were more heterogeneously distributed than fish in shallow habitats, a similar
pattern to that found for macrofauna (Edgar et al., 1994).
Table 3
Results of three-way ANOVA (fixed factors: season and habitat, random factor: locality) using data on
the log-transformed abundance and total number of fish species collected per seine haul at primary
locations
Habitat (H)
Locality (L)
Season (S)
Habitat * locality (HL)
Habitat *season (HS)
Locality * season (LS)
Habitat * locality * season (HLS)
Factor
Hypothesis df
H/HL 2
LIE 2
SILS 3
HL/E 4
HSlHLS 6
LSIE 6
HLS/E 12
Log abundance
SS F
152.9
6.1
80.1
57.4
12.2
14.2
18.9
5.3 1086 9.5*
5.5** 49.1 6.5**
11.3** 410 9.7*
25.8*** 228 15.1***
1.3 136.2 2.0
4.2* 84.6 3.7*
2.s** 137.2 3.0**
No. of species
ss
F
Error (E)
122 67.9
461.9
* 0.01
<p <
0.05, ** 0.001 <p < 0.01, *** p < 0.001.
8/10/2019 The production and trophic ecology of shallow-water fish.pdf
http://slidepdf.com/reader/full/the-production-and-trophic-ecology-of-shallow-water-fishpdf 13/29
G.J. Edgar and C. Shaw I J. Exp. Mar. Biol. Ecol. 194 (1995) 53-81
65
40
30
.-
8
5:
6 20
z
2
z’
10
0
Seagrass
Unvegetated
Channel
Loelia Shoal
Cowes Bank seagrass
Cowes Bank unvegetated
10
20 30
Number of hauls
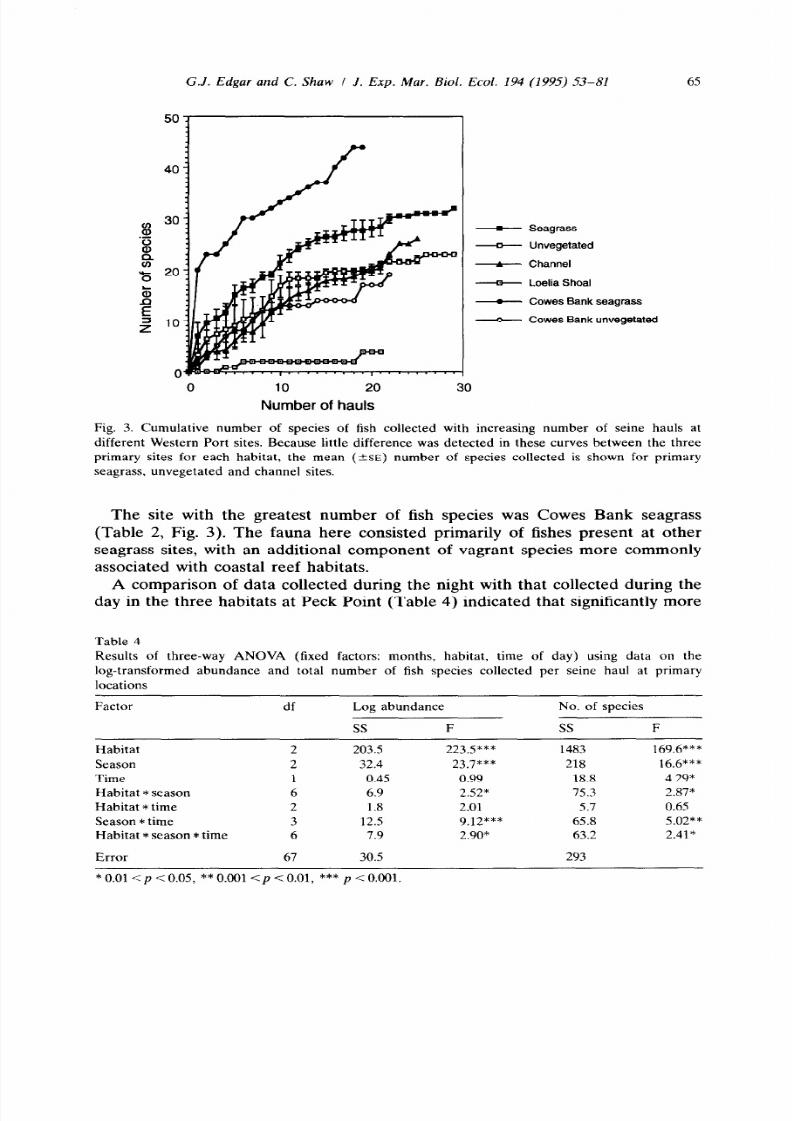
Fig. 3. Cumulative number of species of fish collected with increasing number of seine hauls at
different Western Port sites. Because little difference was detected in these curves between the three
primary sites for each habitat, the mean
3~)
number of species collected is shown for primary
seagrass, unvegetated and channel sites.
The site with the greatest number of fish species was Cowes Bank seagrass
(Table 2, Fig. 3). The fauna here consisted primarily of fishes present at other
seagrass sites, with an additional component of vagrant species more commonly
associated with coastal reef habitats.
A comparison of data collected during the night with that collected during the
day in the three habitats at Peck Point (Table 4) indicated that significantly more
Table 4
Results of three-way ANOVA (fixed factors: months, habitat, time of day) using data on the
log-transformed abundance and total number of fish species collected per seine haul at primary
locations
Factor df Log abundance
SS
F
No. of species
ss
F
Habitat 2 203.5
Season 2 32.4
Time 1 0.45
Habitat * season 6 6.9
Habitat * time 2 1.8
Season *time 3 12.5
Habitat * season * time 6 7.9
Error 67 30.5
223.5*** 1483 169.6***
23.7*** 218 16.6***
0.99 18.8 4.29*
2.52* 75.3 2.87*
2.01 5.7 0.65
9.12*** 65.8 5.02**
2.90* 63.2 2.41*
293
* 0.01
<p <
0.05, ** 0.001 <p < 0.01, ***
p <
0.001.
8/10/2019 The production and trophic ecology of shallow-water fish.pdf
http://slidepdf.com/reader/full/the-production-and-trophic-ecology-of-shallow-water-fishpdf 14/29
66
G.J. Edgar and C. Shaw I J. Exp. M ar. Bi ol . Ecol . 194 (1995) 53-81
fish species were collected during the night (F = 6.0) than during the day (_i = 5.4)
although time of day had only a minor influence on species richness when
compared to differences between habitats (seagrass: X = 11.0; unvegetated; X= 2.1,
channel: X= 2.5). No species were found that moved on a die1 basis between
habitats (see Table 2).
Total abundance of fish collected per seine haul at primary locations varied
significantly between locality and season, and a very high habitat X locality
interaction was found which obscured overall differences between habitats (Table
3). Whether seines were hauled at night or during the day had no significant effect
on overall numbers collected (Table 4). Interaction effects were, however,
detected that involved time of day (Table 4). These interaction effects together
contributed only a small proportion (7%) of the total variation in numbers of fish
collected by seine.
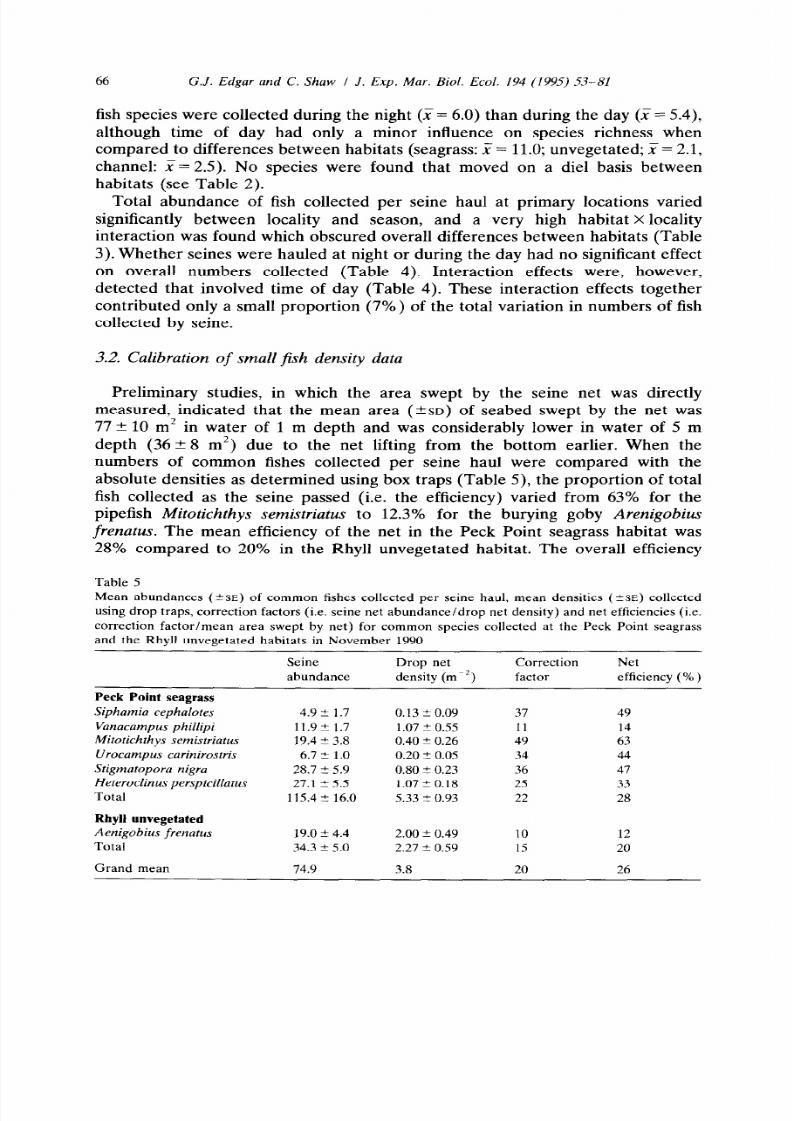
3.2. Calibrat ion of small fish densit y data
Preliminary studies, in which the area swept by the seine net was directly
measured, indicated that the mean area (+-SD) of seabed swept by the net was
77 ? 10 m2 in water of 1 m depth and was considerably lower in water of 5 m
depth (36 + 8 m*) due to the net lifting from the bottom earlier. When the
numbers of common fishes collected per seine haul were compared with the
absolute densities as determined using box traps (Table 5) the proportion of total
fish collected as the seine passed (i.e. the efficiency) varied from 63% for the
pipefish M it oti chthys semistri atus to 12.3% for the burying goby Arenigobius
frenatus. The mean efficiency of the net in the Peck Point seagrass habitat was
28% compared to 20% in the Rhyll unvegetated habitat. The overall efficiency
Table 5
Mean abundances (*SE) of common fishes collected per seine haul, mean densities
2SE)
collected
using drop traps, correction factors (i.e. seine net abundance/drop net density) and net efficiencies (i.e.
correction factor/mean area swept by net) for common species collected at the Peck Point seagrass
and the Rhvll unvegetated habitats in November 1990
Seine
abundance
Drop net
density (me’)
Correction
factor
Net
efficiency ( % )
Peck Point seagrass
Siphamia cephalotes
Vanacampus phill ipi
Mitotichthys semistriatus
Urocampus carinirostris
Stigmatopora nigra
Heteroclinus perspicillatus
Total
Rhyll unvegetated
Aenigobius frenatus
Total
Grand mean
4.9 t 1.7
11.9 2 1.7
19.4 -c 3.8
6.7 + 1.0
28.7 -c 5.9
27.1 -+ 5.5
115.4 -c 16.0
19.0 5 4.4
34.3 f 5.0
74.9
0.13 -+ 0.09 37 49
1.07 + 0.55
11
14
0.40 2 0.26
49
63
0.20 2 0.05 34 44
0.80 -t 0.23 36
47
1.07 -t 0.18 25
33
5.33 i- 0.93 22 28
2.00 2 0.49 10 12
2.27 -c 0.59
15 20
3.8 20 26

8/10/2019 The production and trophic ecology of shallow-water fish.pdf
http://slidepdf.com/reader/full/the-production-and-trophic-ecology-of-shallow-water-fishpdf 15/29
G.J. Edgar and C. Shaw I .I. Exp. M ar. Biol . Ecol. 194 (1995) 53-81
61
when numbers in both habitats were combined was 25.6%, which is equivalent to
dividing the total numbers of fish collected by seine by 20 (=77 X 0.256) to
produce estimates per m2. Numbers of fish collected per seine haul therefore have
been converted to numbers per m2 by dividing by 20 for fish species not listed in
Table 5 collected from seagrass and unvegetated habitats, and by dividing by 9
(=36X0.256) f
or s co ec e in the deeper channel habitat where the net swept
i h 11 t d
a smaller area.
3.3. Producti on and size-structur e of smal l ish assembl ages
The total estimated production of small fish at different sites varied over a
5-fold range, from 0.67 g AFDW. rne2. yr-’
g.m-*.yrp’
at Peck Point unvegetated to 3.96
at Tooradin seagrass (Table 6). The levels of fish production differed
little between the three primary vegetated sites. Mean fish production at the
primary sites was 3.82 g. me2 . yr-’ in seagrass, 1.58 g *rn-* . yr-’ in unvegetated
and 1.93 g.m-2*yrr’
in channel habitat. By comparison, mean densities of fish
varied over a 50-fold range at different sites (Table 6) and the variation in
densities within a habitat was much greater than the corresponding values for
production.
The highest fish densities were recorded in all habitats during the February
sampling period, and numbers consistently declined during the autumn and winter
months to reach minimum levels in August (Table 7; Fig. 2). The decline was
most acute in the seagrass habitat, where densities in August were less than 10%
of the numbers in February. Annual change in estimated production in different
habitats was much less pronounced than the change in fish densities. Within the
primary seagrass habitats estimated production varied over a 5-fold annual range,
whereas in the unvegetated and channel habitats only a 2-fold range in annual
production was found. The relatively large annual variation in fish density and
Table 6
Estimated densities, biomass, annual somatic production and P/B ratios of small-fish assemblages at
different sites in Western Port
Site
Density
(mm’)
Biomass
(g.rn-‘)
Production
(g.m-‘.yr-‘)
P/B
Peck Point seagrass
6.08 1.99
3.80
1.91
Peck Point unvegetated
0.84 0.37 0.67
1.82
Peck Point channel
0.83 1.39
1.71
I
.23
Rhyll seagrass
6.07 2.58 3.70
1.43
Rhyll unvegetated
2.65 0.94 1.77
1.88
Rhyll channel
0.36
2.46
2.58
I .05
Tooradin seagrass
3.03
1.67
3.96
2.37
Tooradin unvegetated
2.96
2.15
2.30
1.07
Tooradin channel
1.23 1.01
1 so
1.49
Cowes Bank seagrass 4.94
2.37
3.39
I
43
Cowes Bank unvegetated
0.28
0.70
0.85
1.21
Loelia Shoal
0.11
0.44
0.70
1.59
8/10/2019 The production and trophic ecology of shallow-water fish.pdf
http://slidepdf.com/reader/full/the-production-and-trophic-ecology-of-shallow-water-fishpdf 16/29
68
G.J. Edgar and C. Shaw I J. Exp. M ar. B iol. Ecol. 194 (1995) 53-81
Table 7
Mean abundance and estimated daily production of small-fish assemblages in different seasons and
habitats at primary locations. Mean seagrass leaf biomass is also shown
Habitat November 1989 February 1990 May 1990 August 1990
Seagrass
Unvegetated
Channel
Seagrass
Unvegetated
Channel
Seagrass
Fish density m-“)
4.14 (1.17) 12.03 (7.46) 2.95 (2.52)
1.56 (1.48) 4.22 (1.72) 2.11 (1.49)
0.89 (1.030 1.50 (0.84) 0.50 (0.19)
Fish production mg
FDW
rn-*. day-‘)
12.71 (6.92) 17.3 (7.54) 7.81 (1.19)
4.84 (2.04) 2.83 (1.32) 4.47 (2.87)
3.61 2.9 (1.38) 1.64 (0.6)
Seagrass biomass g DW. m-*)
412 (120) 388 (296) 138 (56)
1.12 (0.85)
0.70 (0.89)
0.34 (0.28)
3.02 (1.41)
4.85 (7.75)
1.42 (0.94)
125 (87)
Values in parentheses indicate standard deviation of the mean for three primary locations.
production in seagrass habitat corresponded with changes in the habitat; seagrass
biomass was also relatively high during the summer period (Table 7; also Edgar et
al., 1994).
Annual fish production was not significantly correlated (df = 11, r* = 0.17,
p <
0.05) with annual macrofaunal production (as shown in Table 5 of Edgar et
al., 1994). However, fish production (F) was significantly related to both macro-
epifaunal production (E) (F = 1.73 + 0.21
X
E, r2 =
0.52, 0.01
<p <
0.05) and
macrocrustacean production (C) (F = 0.08 + 0.68
X
C, r2 = 0.56, 0.01 <p < 0.05)
the two major components of macrofaunal production eaten by fishes (see Edgar
& Shaw, 1995).
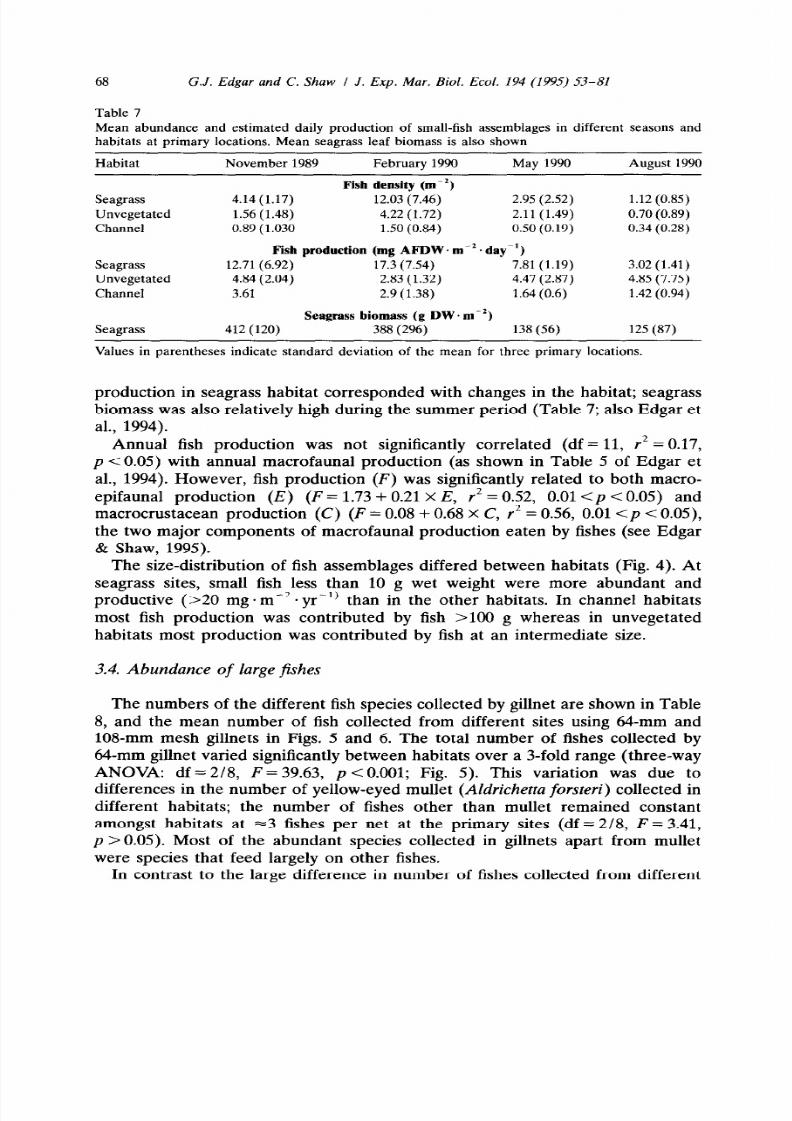
The size-distribution of fish assemblages differed between habitats (Fig. 4). At
seagrass sites, small fish less than 10 g wet weight were more abundant and
productive (~20 mg
*
me2
-
yr-‘)
than in the other habitats. In channel habitats
most fish production was contributed by fish >lOO g whereas in unvegetated
habitats most production was contributed by fish at an intermediate size.
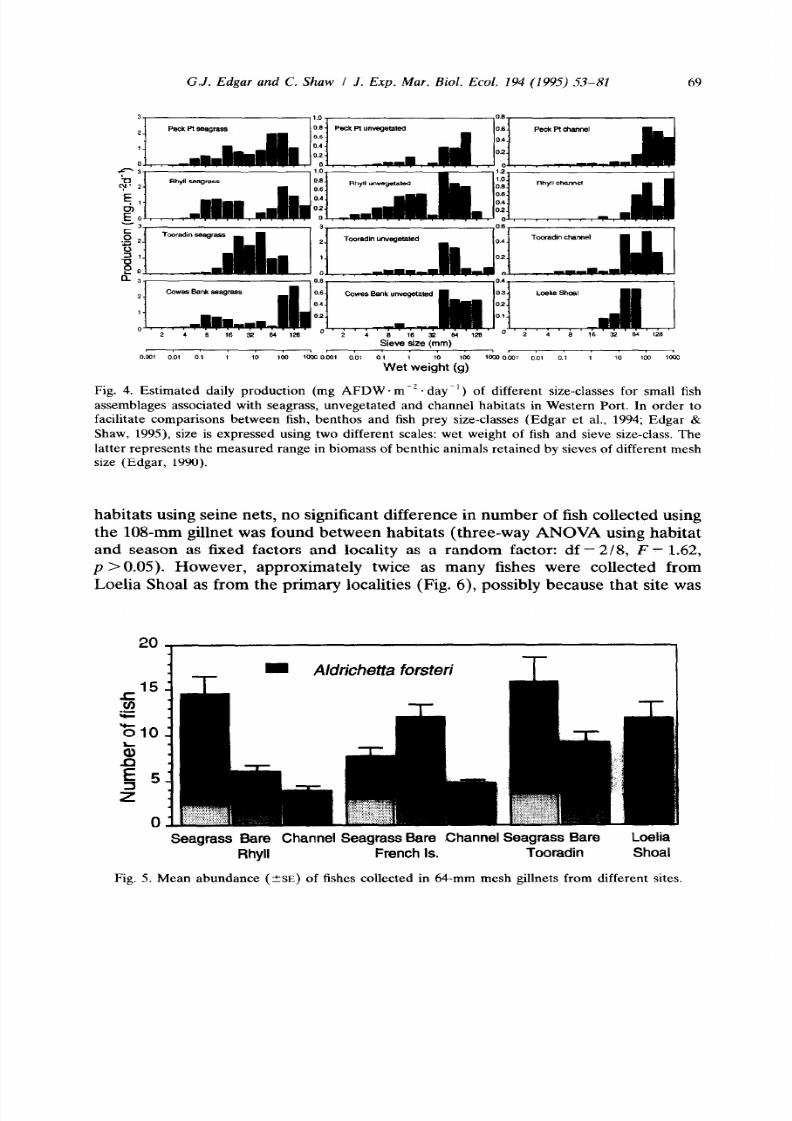
3.4.
Abundance of l arge fi shes
The numbers of the different fish species collected by gillnet are shown in Table
8, and the mean number of fish collected from different sites using 64-mm and
10%mm mesh gillnets in Figs. 5 and 6. The total number of fishes collected by
64-mm gillnet varied significantly between habitats over a 3-fold range (three-way
ANOVA: df = 218, F = 39.63, p < 0.001; Fig. 5). This variation was due to
differences in the number of yellow-eyed mullet (Aldrichetta forsteri) collected in
different habitats; the number of fishes other than mullet remained constant
amongst habitats at =3 fishes per net at the primary sites (df = 2/8, F = 3.41,
p >
0.05). Most of the abundant species collected in gillnets apart from mullet
were species that feed largely on other fishes.
In contrast to the large difference in number of fishes collected from different
8/10/2019 The production and trophic ecology of shallow-water fish.pdf
http://slidepdf.com/reader/full/the-production-and-trophic-ecology-of-shallow-water-fishpdf 17/29
8/10/2019 The production and trophic ecology of shallow-water fish.pdf
http://slidepdf.com/reader/full/the-production-and-trophic-ecology-of-shallow-water-fishpdf 18/29
T
e
8
T
a
n
m
o
s
h
c
e
e
f
o
m
d
e
e
s
e
u
n
g
n
s
w
h
6
m
(N
1
a
1
m
(
N
2
m
h
p
s
S
e
N
Q i
P
H
P
U
P
R
R
R
T
H
T
U
L
T
a
&
~
~
-
-
e
1
2
1
2
1
2
1
2
1
2
1
2
1
2
1
2
1
2
9 Q
S
e
H
u
p
u
a
P
a
u
m
e
u
n
m
u
u
v
n
n
*
M
&
a
a
u
*
G
h
n
a
a
T
h
n
g
u
R
a
m
U
o
c
u
a
U
o
p
m
u
a
u
M
o
a
a
*
C
o
h
u
m
W
u
b
h
*
G
n
u
g
n
*
H
h
m
m
a
h
G
m
m
m
a
u
*
P
a
y
p
u
s
b
n
*
P
a
y
p
u
s
s
p
u
a
o
W
a
y
p
u
a
g
u
*
C
d
h
h
k
m
*
S
a
n
p
a
u
“
m
o
m
s
a
a
o
1
0
0
0
0
0
5
3
0
0
0
0
0
1
0
0
0
0
0
0
0
1
I
0
1
0
1
0
0
0
0
1
0
0
3
7
0
0
3
0
3
0
1
9
4
0
0
0
0
0
2
0
0
0
0
0
5
1
9
0
0
0
0
0
0
0
1
2
0
0
1
0
0
0
1
0
4
0
1
4
0
7
2
4
0
0
0
0
0
0
1
1
0
0
0
6
5
6
0
0
0
0
0
0
0
1
0
0
0
9
0
0
0
1
0
I
0
I
1
0
1
0
0
1
1
1
1
0
6
0
0
3
1
1
0
0
0
0
2
0
1
0
0
0
2
2
6
0
0
0
0
0
1
1
0
0
2 0
0
0 0 2
1
0
0
0 0
4 0
0
0 0 2 3 2
0
5
2
1
0 0 7 0
1
0
2
1
1
1
1
0
1
0
1
0
0 0
0
0
1
0
0
3 2 0
1
0 0 0 0 0 0 0 0 0 0 0 8 0 0
6
5 0 0 0 0 0 0 0 0 0 0 0 0
0
1
0 0 0
2 0 2 0 0 0 0 0 0
1
0
1
0 0 2 0
0
7
2
2
0
1
0
0
0
0
0
0
0
0
0
0
0
0
0
3
0
0
0
1
5
0
6
0
0
0
0
0
0
0
0
0
0
0
1
3
0
0
0
0
0
0
0
0
0
0
0
0
0
1
0
8/10/2019 The production and trophic ecology of shallow-water fish.pdf
http://slidepdf.com/reader/full/the-production-and-trophic-ecology-of-shallow-water-fishpdf 19/29
*
P
d
e
6
2
1
2
1
1
*
T
a
u
v
s
0
0
0
0
0
0
*
p
s
t
u
a
0
0
0
1
0
0
*
p
s
t
u
a
0
8
0
5
0
0
*
P
a
o
s
e
w
o
s
0
0
0
0
0
0
D
y
o
a
n
g
c
0
0
0
0
0
0
*
A
d
c
a
o
s
e
0
2
0
1
4
0
a
n
a
a
0
2
0
0
0
0
*
H
e
a
m
a
a
a
0
0
0
0
0
0
*
e
u
m
0
0
0
0
0
3
*
S
o
e
a
a
m
0
0
0
0
0
0
*
A
m
e
s
o
a
u
0
0
0
0
1
0
*
R
m
e
t
a
n
0
1
7
1
3
1
*
M
e
a
e
n
0
2
0
1
0
0
C
u
e
c
0
0
0
0
0
0
T
a
e
a
0
1
0
1
0
0
D
o
c
h
m
u
7
x
3
0
3
0
T
a
3
5
7
3
1
3
1
2
2
1
2
2
2
$
S
a
a
a
a
o
o
w
P
k
P
n
s
P
H
P
k
P
n
u
a
P
U
P
k
P
n
c
h
P
R
s
T
H
R
u
a
R
R
c
h
R
i
T
n
s
T
H
T
n
u
a
T
U
L
a
S
L
P
*
C
m
a
y
m
a
s
e
p
s
v
s
e
s
E
&
S
w
1
z
3
t
1
0
0
1
1
3
1
2
6
2 0
0
1
1
0
5
2
1
3
0
2
0
3
0
1
0
0
0
0
0
1
0
1
0
0
0
0
0
1
0
0
5
0
4
0
0
0
0
2
5
3
1
0 0
0
0
0
0 0
0
0
1
0 0 0
3
4
0
3
0
0
1
1
0 0
1
0
0
0 0
0
0
2
1
0
0
0
1
0 0
0
0 0 0 0
1
2 0 0 2
3 0
1
4 0 0
4
0
2 0 0 0
1
4 0 2
5
5
1
1
1
0 0
0
0 0 5 0 2 0
5
2
4
2
1
2
0
0
1
0 0 0 0 0
1
0
1
7
1
1
3 0 0 0 2
1
6 0
1
1
0
0
1
0
1
0
0
0
1
3 0
1
1
8
2 0
0
0 0 0 0
0
0 0 0 2 0 0 0 0 0
5
2
1
.
4
2
4
2
1
9
2
h
4
0
1
0
5
z
9
F
6
1
<
3
3
.
3
t
3
?
1
5
7
e
8/10/2019 The production and trophic ecology of shallow-water fish.pdf
http://slidepdf.com/reader/full/the-production-and-trophic-ecology-of-shallow-water-fishpdf 20/29
G.J. Edgar and C. Shaw I J. Exp. Mar. Bi ol. Ecol. 194 (1995) 53-81
57
-I-
T
” Seagrass Bare Channel Seagrass Bare Channel Seagrass Bare
Loelia
Rhyll
French Is.
Tooradin Shoal
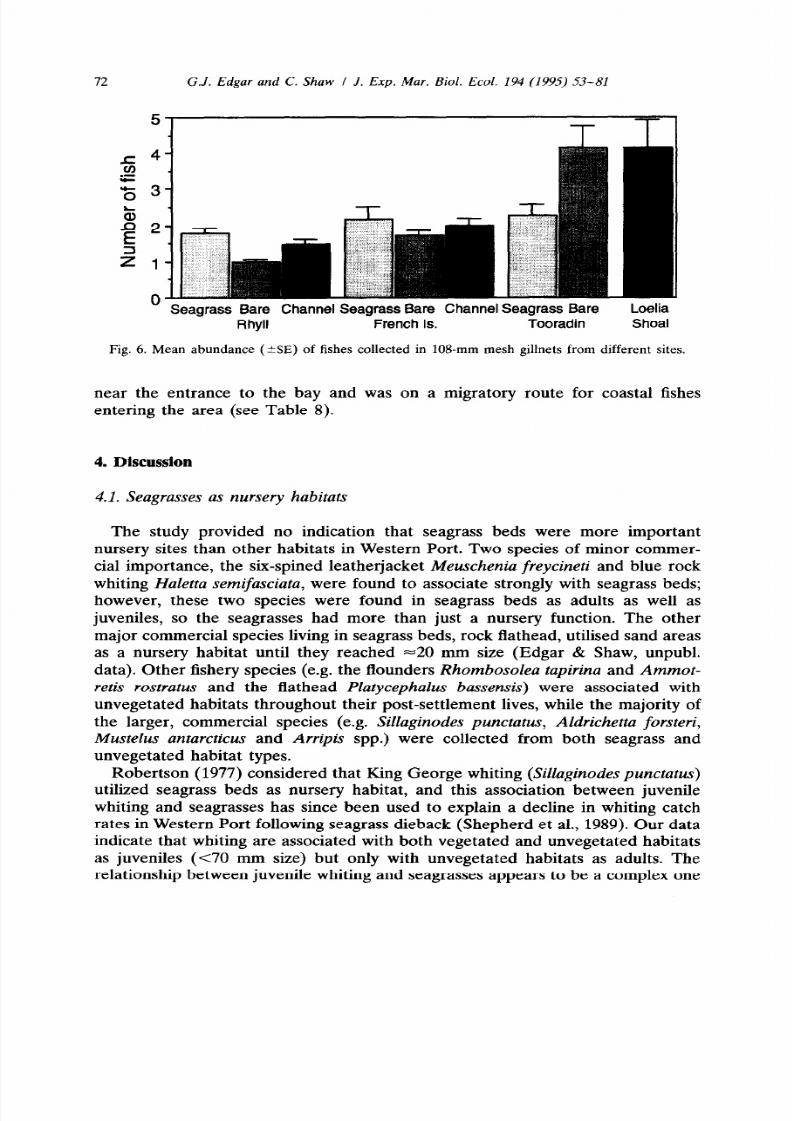
Fig. 6. Mean abundance (tSE) of fishes collected in 10%mm mesh gillnets from different sites.
near the entrance to the bay and was on a migratory route for coastal fishes
entering the area (see Table 8).
4. Discussion
4.1.
Seagrasses as nursery habitats
The study provided no indication that seagrass beds were more important
nursery sites than other habitats in Western Port. Two species of minor commer-
cial importance, the six-spined leatherjacket
A4euschenia reycineti
and blue rock
whiting
Haletta semi fasciata,
were found to associate strongly with seagrass beds;
however, these two species were found in seagrass beds as adults as well as
juveniles, so the seagrasses had more than just a nursery function. The other
major commercial species living in seagrass beds, rock flathead, utilised sand areas
as a nursery habitat until they reached -20 mm size (Edgar & Shaw, unpubl.
data). Other fishery species (e.g. the flounders
Rhombosolea tapirina
and
Ammot-
retis rostratus
and the flathead
Platycephalus bassensis)
were associated with
unvegetated habitats throughout their post-settlement lives, while the majority of
the larger, commercial species (e.g. Sillaginodes punctatus, Aldrichetta forsteri,
Mustelus antarcticus
and
Arripis
spp.) were collected from both seagrass and
unvegetated habitat types.
Robertson (1977) considered that King George whiting
(Sil laginodes punctatus)
utilized seagrass beds as nursery habitat, and this association between juvenile
whiting and seagrasses has since been used to explain a decline in whiting catch
rates in Western Port following seagrass dieback (Shepherd et al., 1989). Our data
indicate that whiting are associated with both vegetated and unvegetated habitats
as juveniles (~70 mm size) but only with unvegetated habitats as adults. The
relationship between juvenile whiting and seagrasses appears to be a complex one
8/10/2019 The production and trophic ecology of shallow-water fish.pdf
http://slidepdf.com/reader/full/the-production-and-trophic-ecology-of-shallow-water-fishpdf 21/29
G.J. Edgar and C. Shaw I J. Exp. M ar. Bi ol . Ecol . 194 1995) 53-81
73
(Connolly, 1994) and observations while diving (by G. Edgar) indicated that
juvenile whiting live on sandy patches adjacent to seagrass. While this relationship
needs to be confirmed, both sand and seagrass habitats appear to be important for
juvenile whiting.
The abundance and production of the smallest-sized fishes (<lo g weight) was
greater in seagrass habitat than in either shallow unvegetated or channel habitats
(see Fig. 4). Seagrass beds thus have the potential to hold large numbers of
juvenile fishes. However, in Western Port the small fishes were almost exclusively
non-commercial species of gobies, pipefishes and weedfishes which also mature at
a small size. In other areas, this small fish component may include a much greater
proportion of commercially-valuable species.
4.2. Rel i abil it y of densi t y and product i on est imat es
The present study is only the second to provide estimates of densities and
production of fish communities at a variety of sites (following Moller et al., 1985).
The cost of investigating numerous sites rather than concentrating effort at a
single location is a reduction in the accuracy of production estimates due to
increased sampling error and the use of analytical approximations. The major
source of error in density estimates probably resulted from the difficulty in
calibrating fish numbers per net haul with absolute fish densities. The drop trap
densities used to calibrate seine numbers were presumably themselves subject to
error, although for small, relatively immobile species this error should not be
great (Kushlan, 1981; Pihl & Rosenberg, 1982; Sogard et al., 1987). Of more
concern is bias introduced if large or pelagic species were captured with
substantially-different efficiency using seines than small demersal species. Such
bias may well occur given the measured level of variation in capture efficiency for
different species (Table 5). Pierce et al. (1990) found that open-water fishes were
captured with an overall
-20% greater efficiency than demersal fishes in trials
conducted in freshwater habitats. However, even if such bias does occur, the small
open-water species contributed relatively little of the total production in most
habitats in our study, with Hyperlophus vittatus the only open-water species that
was common.
A systematic error would also have been introduced into calculations if the
capture efficiency of seine nets differed substantially between habitats. The
difference detected in overall net efficiency between seagrass (28%) and unvege-
tated (20%) habitats was ignored because it was relatively small and these
efficiency values were based on a limited sampling program carried out at a single
pair of sites over a short time period. Further work is needed to adequately
determine whether the use of a single mean efficiency value for different habitats
is justified, or whether the capture efficiency in vegetated habitats systematically
differs from that in bare habitats. High macrophyte biomass was found by Pierce
et al. (1990) to increase seine capture efficiency in freshwater habitats.
Other potential sources of error in density estimates were disturbance to the
fish community during the setting and hauling of the seine net, and the lack of
8/10/2019 The production and trophic ecology of shallow-water fish.pdf
http://slidepdf.com/reader/full/the-production-and-trophic-ecology-of-shallow-water-fishpdf 22/29
74
G.J. Edgar and C. Shaw I J. Exp. M ar. Bi ol . Ecol . 194 (1995) 53-81
information on the densities of fishes at night. These errors were probably minor
because of the period allowed to elapse after setting the net before it was pulled
(>2 min), and because no species clearly switched between habitats on a die1 basis
(see Table 2). The results of the ANOVA (Table 4) indicate that the total number
of animals collected during the day at the Peck Point sites examined did not differ
significantly from the number collected at night (see Sogard et al., 1987) and that
little of the total variance in abundance estimates was contributed by the time of
day factor.
Most of the error in estimates of production at different sites was probably
caused by error in the calculation of fish densities, rather than in the conversion of
density data to production data. At the primary seagrass and unvegetated sites
most of the fish production was calculated directly using modal frequency analysis.
The modes used in this analysis were generally clear (see Fig. 2) so annual
estimates should be reliable. Seasonal estimates would be considerably less
accurate than annual estimates because few size-classes were used for many
species (Fig. 2). Although underestimated production may occur in one season by
reading a mode at the lower rather than upper end of a size-class, these errors
should be compensated by a corresponding overestimate in the following season.
The errors that may arise when estimating annual production using regression
equations that relate production to biomass and water temperature have been
discussed previously in relation to invertebrate data (Edgar, 1990). Such errors
would be most substantial in channel habitats where only a relatively small
proportion of fish production was calculated directly using size-frequency analy-
ses.
Although the novel method used here to calculate small fish production
incorporates a number of errors and approximations as described above, it
produces estimates of annual production at Western Port that are comparable
with the few published estimates for temperate and subtropical fish communities
elsewhere. Production in Western Port seagrass beds (23.8 g. m-’ -yr-‘) was
slightly lower than the estimate of Adams (1976) for fish production in an eelgrass
bed in North Carolina (-4.6 g *m-* *yrr’), slightly higher than the production of
the four dominant fish in the Laguna Madre of Texas (~3.1 g. me2 . yr-‘; Hellier,
1962) and approximately the same as the production of the six dominant fish
species in Chesapeake Bay (4.1 g. mp2 . yr-‘; Lubbers et al., 1990). Production at
unvegetated Western Port sites (0.7 to 2.6 g - rn-‘. yr~‘) were within the range of
estimates for sites along the Swedish coast (0.2 to 5 g* mm’. yr-‘; Moller et al.,
1985) and marginally lower than in Chesapeake Bay (2.8 g. rnp2. yr- ‘; Lubbers et
al., 1990).
The usefulness of the production approach used here will ultimately depend on
whether a strong biological signal remains at the end of calculations, or whether
the noise generated by accumulating errors swamps the information content
contained in the original data set. Examination of Tables VI and VII indicates that
production calculations yield a much more stable signal than density calculations.
Despite an order of magnitude fluctuation in fish densities in different seasons and
at different sites, the estimated production of fish communities varied over only a

8/10/2019 The production and trophic ecology of shallow-water fish.pdf
http://slidepdf.com/reader/full/the-production-and-trophic-ecology-of-shallow-water-fishpdf 23/29
G.J. Edgar and C. Shaw I J. Exp. M ar. Bi ol . Ecol . 194 (1995) 53-81
7s
twofold range between seasons at the unvegetated and channel sites, and over a
similar range at different primary sites within a habitat type. The estimated
production of fish assemblages associated with seagrass habitat seasonally varied
over a fivefold range; however, this fluctuation corresponded with changes in
seagrass biomass, and levels of production were similar in unvegetated habitat and
seagrass habitat during the season of low plant biomass. We consider that these
results, and the concurrence of community production estimates here with those
produced using different methods overseas, indicate that production estimates
provide better insight into the biological properties of communities than estimates
of density; densities can differ greatly between sites due to considerable variation
in the abundances of small animals that have little ecological importance.
Furthermore, production estimates are not only of interest in their own right but
are proportional to several other important properties of communities, most
notably total consumption and respiration (see Edgar, 1993).
4.3. Effect of seagrass l oss on fi sh product i on
Small fish assemblages at the primary seagrass sites were over twice as
productive as at unvegetated sites (3.82 g
*
m-*
*
yr-’ in seagrass cf. 1.58 g
*
mm2
*
yr-’ in unvegetated habitat). Given that 178 km2 of former seagrass habitat is
now unvegetated and that most of the seagrass loss has occurred on the shallow
tidal flats studied at the primary sites (Edgar et al., 1994), the difference in small
fish production between habitats (2.24 g. mm2
*
yr-‘) translates to a total reduc-
tion of small-fish production throughout Western Port of -630 tonnes AFDW.
yr-’ since 1970. This estimate should, however, be treated with caution as it
assumes that fish communities present on seagrass habitat prior to seagrass
dieback were similar to those found in the present study. The dominant species in
our study differed from those collected by Robertson (1980) at Crib Point on the
western shore of Western Port in 1974/1975, with three of the 10 common species
listed by Robertson (1980) being rare in our seine samples. (A further species
Arenigobius bifrenatus was also disproportionately abundant in 1974 but was
presumably misidentified Arenigobius frenatus, a species that had not been
recognized from Victorian waters in 1980.) This difference between studies was,
however, probably related to differences in sampling techniques rather than long
term changes in the fauna. The species disproportionately abundant in Rober-
tson’s study (Atherinosoma presbyteroides, Atherinosoma microstoma and
juvenile
Aldrichetta forsteri)
tend to remain in shallow water following the tide
and are therefore concentrated near the waters edge (Edgar & Shaw, unpubl.
obs.). Robertson’s technique of pulling the net into shore would therefore result in
disproportionately high numbers of these species being collected relative to
numbers obtained by pulling the seine into a boat.
A study by Howard & Koehn (1985) nevertheless provides clear evidence that
the pipefish fauna has changed during the past 15 yr. Howard & Koehn (1985)
sampled Rhyll seagrass beds for pipefish by beam trawl in 1978 and collected only
two specimens of Stigmatopora nigra and no Stigmatopora argus, whereas other
8/10/2019 The production and trophic ecology of shallow-water fish.pdf
http://slidepdf.com/reader/full/the-production-and-trophic-ecology-of-shallow-water-fishpdf 24/29
76
G.J. Edgar and C. Shaw I J. Exp. Mar. Biol. Ecol. 194 (1995) 53-81
syngnathid species were abundant. Stigrnatopora nigra was by far the most
common fish collected from this site during our study, with Stigmatopora argus
also common.
Direct estimates of the effect of seagrass loss on larger fishes cannot be made
from this study because gillnets are highly selective samplers; however, the
elevated small fish production in seagrass habitats does not seem to flow
substantially up the food chain to the larger carnivorous fishes. Only the presence
of yellow-eyed mullet elevates total catches of fish from seagrass beds using the
64-mm mesh gillnet to higher levels than catches from unvegetated habitats.
Moreover, no differences in the mean abundance of fish collected with the
108~mm mesh gillnet were found between seagrass and unvegetated habitat types.
One reason for the differences in small fish production between seagrass and
unvegetated habitats not translating into major differences in the production of
larger fishes may be that many of the larger species fed on pelagic resources that
are distributed independently of benthic habitat type. The fishery species Arripis
t rut t a, Ar ri pis t rut t acea, Trachurus decli vi s, Thyrsit es atun and Pomatomus saltator
were all commonly collected in our gillnets and fed primarily on clupeoid fishes
(see Edgar & Shaw, 1995) which in turn fed on planktonic copepods. The
presence of much greater numbers of these fishes compared with demersal species
in gillnet catches may have obscured habitat differences.
Because the number of yellow-eye mullet collected by small mesh gillnet
differed between habitats with =70% more collected from seagrass than unvege-
tated habitat, the loss of seagrass habitat from the Bay may have resulted in a
overall decline in the population size of this species. This prediction is not,
however, supported by fishery catch statistics from Western Port, which show that
the total catch of mullet increased following the period of seagrass dieback
(Shepherd et al., 1989). As expected, fishery catch data indicate that populations
of the two major species directly associated with seagrass beds, Haletta semifas-
ciata and M euscheni a f reyci net i , declined rapidly following the loss of seagrass
cover (Shepherd et al., 1989).
Catch statistics for the two other commercially-important demersal species
commonly collected in our study, gummy shark (M ust & s ant arct icus) and
elephant shark
(Callorhyncus mili i),
are not available for Western Port. However,
catches of these species would not be expected to have declined significantly
following the loss of large areas of seagrass because neither species was positively
associated with seagrass habitat, with only three elephant shark collected from
this habitat type.
While our study indicated that seagrass habitat in Western Port did not support
substantially higher densities of large fishes than unvegetated habitat, nor did it
provide a major habitat for juveniles of economically-important fish species, we
cannot fully assess the value of seagrass habitat to the local commercial fishery
because the large scale environmental effects of seagrass beds remain unknown.
Relationships between seagrass production and fish production were only investi-
gated on the scale of hundreds of metres, whereas most seagrass production is not
utilised
in si tu
but is exported from seagrass beds (see Whitfield, 1988). The
8/10/2019 The production and trophic ecology of shallow-water fish.pdf
http://slidepdf.com/reader/full/the-production-and-trophic-ecology-of-shallow-water-fishpdf 25/29
G.J. Edgar and C. Shaw I J. Exp. M ar. Bi ol . Ecol . 194 (1995) 53-81
17
long-term effects of the loss of seagrass beds on a bay-wide scale should therefore
include greatly reduced production of detritus, much of which is bound into the
sediment. Turbidity within the bay has also increased during the past two decades
(Shepherd et al., 1989) probably largely because seagrass beds formerly present
in shallow water precipitated and trapped suspended particulate material. These
changes are likely to affect fish production in unvegetated as well as vegetated
habitats throughout the bay.
Acknowledgements
The project was funded by a grant from the Fishing Industry Research and
Development Corporation. Comments on the manuscript provided by G.F.
Watson and G.P. Jenkins were much appreciated, as was access to unpublished
data of A.I. Robertson.
References
Adams, S.M., 1976. The ecology of eelgrass
Zostera muelleri
(L.) fish communities. II. Functional
analysis.
J. Exp. M ar. Bi ol . Ecol .,
Vol. 22, pp. 293-311.
Al-Daham, N.K. & N.K. Wahab, 1991. Age, growth and reproduction of the greenback mullet, Liza
subviridis (Valenciennes), in an estuary in southern Iraq. J. Fish Biol., Vol. 38, pp. 81-88.
Bell, J.D. & D.A. Pollard, 1989. Ecology of fish assemblages and fisheries associated with seagrasses.In,
Bi ol ogy of seagrasses: a t reati se on t he bi ol ogy of seagrasses w i t h special reference t o th e Aust ral i an
region,
edited by A.W.D. Larkum, A.J. McComb & S.A. Shepherd, Elsevier, Amsterdam, pp.
565-609
Bennett, B.A. & C.L. Griffiths, 1986. Aspects of the biology of galjoen Coracinus capensis (Cuvier) off
the South-Western Cape, South Africa. S. A fr. J. M ar. Sci.,Vol. 4, pp. 153-162.
Blackbum, B., 1949. Age, rate of growth. and general life-history of the Australian pilchard
(Sardinops
neopilchardus)
in New South Wales.
CSIRO Bull.,
Vol. 242, pp. l-86.
Bradford, R.W., 1991. An investigation into the life history and ecology of the smooth toadfish,
Tetractenos glaber, from Northwest Bay, Tasmania. Honours thesis, Zoology Department, Universi-
ty of Tasmania, 79 pp.
Buxton, C.D. & J.R. Clarke, 1989. The growth of
Cymatoceps nasutus
(Teleostei: Sparidae), with
comments on diet and reproduction. S. Af r. J. M ar. Sci.,Vol. 8, pp. 57-65.
Chubb, C.F. & I.C. Potter, 1986. Age, growth and condition of the Perth herring, Nematolosa
vlaminghi (Munro) (Dorosomatinae), in the Swan Estuary, south-western Australia. Aust . J. Mar.
Freshw at er Res., Vol. 37, pp. 105-12.
Chubb, C.F., I.C. Potter, C.J. Grant, R.C.J. Lenanton & J. Wallace, 1981. Age structure, growth rates
and movements of sea mullet, M ugil cephalus L.,
and yellow-eye mullet, Aldrichetta forsteri
(Valenciennes), in the Swan-Avon River system, Western Australia.
Aust. J. M ar. Freshw at er Res.,
Vol. 32, pp. 605-628.
Colman, J.A., 1978. Tagging experiments on the sand flounder, Rhombosolea plebia (Richardson), in
Canterbury, New Zealand, 1%4 to 1966. Fish. Res. Bull., Fish. Res. Div. N.Z.,Vol. 18, pp. l-42.
Connolly, R.M., 1994. Removal of seagrass canopy: effects on small fish and their prey. J. Exp. M ar.
Biol. Ecol.,
Vol. 184, pp. 99-110.
Conover, D.O. & M.R. Ross, 1982. Patterns in seasonal abundance, growth and biomass of the
Atlantic silverside, M enidi a menidi a, in a New England estuary. Estuaries, Vol. 5, pp. 275-286.
8/10/2019 The production and trophic ecology of shallow-water fish.pdf
http://slidepdf.com/reader/full/the-production-and-trophic-ecology-of-shallow-water-fishpdf 26/29
78 G.J. Edgar and C. Shaw I J. Exp. M ar. Bi ol . Ecol . 194 (199.5) 53-6’1
Davenport, S. & J.D. Stevens, 1988. Age and growth of two commercially important sharks
(Carcharinus tilstoni
and C.
sorrah)
from northern Australia.
Ausr. J. M ar. Freshwat er Res.,
Vol. 39,
pp. 413-433.
Davis, T.L.O. & G.P. Kirkwood, 1984. Age and growth studies on barramundi,
Laces cal cari fer
(Bloch),
in northern Australia. Aust. J. M ar. Freshwat er Res., Vol. 35, pp. 673-689.
De Silva, S.S., 1973. Abundance, structure, growth and origin of inshore clupeid populations of the
west coast of Scotland.
J. Exp. M ar. Biol . Ecol.,
Vol. 12, pp. 119-144.
DeVries, D.A. & M.E. Chittenden, Jr., 1982. Spawning, age determination, longevity, and mortality of
the silver seatrout,
Cynoscion nothus,
in the Gulf of Mexico.
Fish. Bull.,
Vol. 80, pp.
487-W.
De Vries, D.A., C.B. Grimes, K.L. Lang & D.B. White, 1990. Age and growth of king and Spanish
mackerel larvae and juveniles from the Gulf of Mexico and U.S. South Atlantic Bight. Environ. Biol.
Fish.
Vol. 29, pp. 135-143.
Dew, C.B., 1976. A contribution to the life history of the cunner, Tautogolabrus adspersus, in Fishers
Island Sound, Connecticut. Chesapeake Sci., Vol. 17, pp. 101-l 13.
Edgar, G.J., 1990. The use of the size-structure of benthic macrofaunal communities to estimate fauna1
biomass and secondary production. J. Exp. M ar. Biol . Ecol., Vol. 137, pp. 195-214.
Edgar, G.J., 1993. Measurement of the carrying capacity of benthic habitats using a metabolic-rate
based index.
Oecologia (Berlin),
Vol. 95, pp. 115-121.
Edgar, G.J., G. Watson, L.S. Hammond & C. Shaw, 1994. Comparisons of species richness, size-
structure and production of benthos in vegetated and unvegetated habitats in Western Port,Victoria.
J. Exp. M ar. Bi ol . Ecol., Vol. 176, pp. 201-226.
Edgar, G.J. & C. Shaw, 1995. The production and trophic ecology of shallow-water fish assemblages in
southern Australia. II. Diets of fishes and trophic relationships between fishes and benthos at
Western Port, Victoria. J. Exp. M ar. Biol . Ecol., this issue, pp. 83-106.
Elder. R.D., 1976. Studies on age and growth, reproduction and population dynamics of red gurnard,
Chelidonichthys kumu (Lesson and Garnot), in the Hauraki Gulf, New Zealand. Fish. Res. Bull.
Fish. Res. Div. N.Z., Vol. 12, pp. l-77.
Ferrell, D.J. & J.D. Bell, 1991. Differences among assemblages of fish associated with Zosfera
capricorni and bare sand over a large spatial scale. Mar. Ecol. Pr og. Ser., Vol. 72, pp. 15-24.
Geldenhuys, N.D., 1973. Growth of the South African maasbanker Trachurus trachurus Linnaeus and
age composition of the catches, 1950-1971. Sea Fish. Br . I nvesr. Rep. S.A. Dept . Industr i es, Vol. 101,
pp. l-24.
Geldenhuys, N.D., 1978. Age determination of the South African round herring Etrumeus micropus
and length and age composition of the commercial catches, 1965-1973. Sea Fish. Br. Invest. Rep.
S.A. Dept . I ndustr i es,Vol . 115, pp. 1-16.
Gibson, R.N., 1970. Observations on the biology of the giant goby Gobius cobit is Pallas. J. Fish Bioj.,
Vol. 2, pp. 281-288.
Gibson, R.N. & I.A. Ezzi, 1978. The biology of a Scottish population of Fries’ goby,
Lesueurigobius
friesii. J. Fish Biol., Vol. 12, pp. 371-389.
Gordon, J.D.M., 1977. The fish populations in inshore waters of the west of Scotland. The biology of
the Norway pout (Tri sopterus esmark i i ). J. Fish Bi ol ., Vol. 10, pp. 417-430.
Grant, C.J. & A.V. Spain, 1975. Reproduction, growth and size allometry of
M ugil cephalus
Linnaeus
(Pisces: Mugilidae) from North Queensland inshore waters. Aust. J. Zool., Vol. 23, pp. 181-201.
Grant, C.J., T.R. Cowper & D.D. Reid, 1978. Age and growth of snoek, Leionura afun (Euphrasen), in
south-eastern Australian waters. Aust. J. M ar. Freshwat er Res., Vol. 29, pp. 435-44.
Grant, C.J., R.L. Sandland & A.M. Olsen, 1979. Estimation of growth, mortality and yield per recruit
of the Australian school shark,
Galeorhinus australis
(Macleay), from tag recoveries.
Aust. J. M ar.
Freshw at er Res.,
Vol. 30, pp. 625-637.
Hansen, D.J., 1969. Food, growth, migration, reproduction, and abundance of pinfish, Lagodon
rhomboides, and Atlantic croaker, M icropogon undulat us, near Pensacola, Florida, 1963-65. Fish.
Bull., Vol. 68, pp. 135-146.
Healey, M.C., 1972. On the population ecology of the common goby in the Ythan estuary. J. Nat. H ist.,
Vol. 6, pp. 133-145.
8/10/2019 The production and trophic ecology of shallow-water fish.pdf
http://slidepdf.com/reader/full/the-production-and-trophic-ecology-of-shallow-water-fishpdf 27/29
G.J. Edgar and C. Shaw I J. Exp. M ar. Bi ol . Ecol . 194 (1995) 53-81 79
Heck, K.L. & R.J. Orth, 1980. Seagrass habitats: the roles of structural complexity, competition and
predation in structuring associated fish and macroinvertebrate assemblages. In, Estuarine perspec-
tives, edited by VS. Kennedy, Academic Press, New York, pp. 449-464
Heck, K.L. & T.A. Thoman, 1984. The nursery role of seagrass meadows in the upper and lower
reaches of the Chesapeake Bay. Estuaries, Vol. 7, pp. 70-92.
Hellier, T.R., 1962. Fish production and biomass studies in relation to photosynthesis in the Laguna
Madre of Texas. Publ . Inst. M ar. Sci. Uni v. Texas, Vol. 8, pp. l-22.
Holmquist, J.G., G.V.N. Powell & SM. Sogard, 1989. Decapod and stomatopod assemblages on a
system of seagrass-covered mud banks in Florida Bay.
M ar. Biol.,
Vol. 100, pp. 473-483.
Holt, S.A. & C.R. Arnold, 1982. Growth of juvenile red snapper L& anus campechanus, in the
northwestern Gulf of Mexico. Fish. Bull., Vol. 80, pp. 644-648.
Howard, R.K., G.J. Edgar & P.A. Hutchings, 1989. Fauna1 assemblages of seagrass beds. In, Biology of
seagrasses: a t reati se on t he bi ol ogy of seagrasses w i t h special reference t o t he Aust ral i an regi on,
edited by A.W.D. Larkum, A.J. McComb & S.A. Shepherd, Elsevier, Amsterdam, pp. 5366564.
Howard, R.K. & J.D. Koehn, 1985. Population dynamics and feeding ecology of pipefish
(Syngnathidae) associated with eelgrass of Western Port, Victoria. Aust . J. M ar. Freshwat er Res., Vol.
36, pp. 361-370.
Huh, S.H., 1984. Seasonal variations in populations of small fishes concentrated in shoalgrass and
turtlegrass meadows. J. Oceanol. Sot. Korea, Vol. 19, pp. 4455.
James, G.D., 1984. Trevally, Caranx georgianus Cuvier: Age determination, population biology, and
the fishery. Fish. Res. Bull. Fish. Res. Div. N.Z.,Vol. 25, pp. 1-51.
Kanno, Y., 1989. Comparison of age composition, sex ratio and growth rate among populations of
herring Clupea pallasii in the Far Eastern waters. Nippon Suisan Gakkaishi, Vol. 55, pp. 583-589.
Ketchen, K.S., 1975. Age and growth of dogfish Squalus acanthias in British Columbian waters. J. Fish.
Res. Board Can., Vol. 32, pp. 43-59.
Klumpp, D.W., R.K. Howard & D.A. Pollard, 1989. Trophodynamics and nutritional ecology of
seagrass communities. In, Bi ol ogy of seagrasses: a t reati se on t he bi ol ogy of seagrasses w i t h special
reference to t he Austra l i an regi on, edited by A.W.D. Larkum, A.J. McComb & S.A. Shepherd,
Elsevier, Amsterdam, pp. 394-457.
Kneib, R.T. & A.E. Stiven, 1978. Growth, reproduction, and feeding of Fundulus heteroclitus (L.) on a
North Carolina saltmarsh. J. Exp. Mar. Biol . Ecol., Vol. 31, pp. 121-140.
Knudsen, E.E. & W.H. Herke, 1978. Growth rate of marked juvenile Atlantic croakers, M icropogon
undulatus, and length of stay in a coastal marsh nursery in southwest Louisiana. Trans. Am. Fish.
sot., Vol. 107, pp. 12-20.
Kumagai, S., T. Bagarinao & A. Unggui, 1985. Growth of juvenile milkfish
Chanos chanos
in a natural
habitat.
M ar. Ecol . Prog. Ser.,
Vol. 22, pp. l-6.
Kushlan, J.A., 1981. Sampling characteristics of enclosure throw traps. Trans. Am. Fish. Soc.,Vol. 110.
557-562.
Love, M.S. & WV Westphal, 1981. Growth, reproduction, and food habits of olive rockfish,
Sebast es
serranoides, off central California. Fish. Bull., Vol. 79, pp. 533-545.
Lubbers, L., W.R. Boynton & W.M. Kemp, 1990. Variations in structure of estuarine fish communities
in relation to abundance of submersed vascular plants.
M ar. Ecol. Prog.
Ser.,Vol. 65, pp. 1-14.
Manooch, C.S. & G.R. Huntsman, 1977. Age, growth, and mortality of the red porgy,
Pagrus pagrus.
Trans. Am. Fish. Soc.,Vol. 106, pp. 26-33.
Marsden, M.A.H., C.W. Mallett & A.K. Donaldsen, 1979. Geological and physical setting, sediments
and environments, Western Port, Victoria. M ar. Geol., Vol. 30, pp. 11-46.
Miller, P.J., 1961. Age, growth and reproduction of the Gobius paganellus L., in the Isle of Man. J.
M ar. Biol . Assoc. lJ.K.,Vol. 41, pp. 737-769.
Moller, P., L. Pihl & R. Rosenberg, 1985. Benthic fauna1 energy flow and biological interaction in some
shallow marine soft bottom habitats. M ar. Ecol . Prog. Ser., Vol. 27, pp. 109-121.
Morales-Nin, B. & S. Ralston, 1990. Age and growth of Lurjanus kasmira (Forskal) in Hawaiian
waters. J. Fish Biol., Vol. 36, pp. 191-203.
Mulkana, M.S., 1966. The growth and feeding habits of juvenile fishes in two Rhode Island estuaries.
Gulf Res. Rep., Vol. 2. pp. 97-167.
8/10/2019 The production and trophic ecology of shallow-water fish.pdf
http://slidepdf.com/reader/full/the-production-and-trophic-ecology-of-shallow-water-fishpdf 28/29
8
G.J. Edgar and C. Shaw I J. Exp. M ar. Bi ol . Ecol. 194 (1995) X -81
Nakatani, T., H. Koizumi, S. Yokoyama, T. Maeda, T. Takahashi & H. Matsushima, 1990. Age and
growth of pleuronectid flounder Hippoglossoides dubius in Funka Bay, Hokkaido. Nippon Suisan
Gakkaishi, Vol. 56, pp. 893-901.
Nepgen, C.S.de V., 1977. The biology of the hottentot Pachymetopon blochii (Val.) and the silverfish
Argyrozona argyrozona (Val.) along the Cape south-west coast. Sea Fish. Br. Invest. Rep. S.A. Dept.
Industries,
Vol. 10.5, pp. l-35.
Oxenford, H.A. & W. Hunte, 1981. Age and growth of dolphin, Coryphaena hippurus, as determined
by growth rings in otoliths. Fish. Bull., Vol. 81, pp. 9066909.
Parrish, R.H., D.L. Mallicoate & K.F. Mais, 1985. Regional variations in the growth and age
composition of northern anchovy, Engraul is mordax. Fish. Bull ., Vol. 83, pp. 483-496.
Petersen, C.G.J., 1918. The sea bottom and its production of fish-food. Danish Biological Sfation,
Copenhagen, Report t o M ini str y., Vol. 2.5, pp. l-62.
Petrova, Y.G. & VI. Chekunova, 1979. Growth of the Chilean perch. Hydrobiol. J., Vol. 15, pp. 41-46.
Pierce, B.E. & K.B. Pierson, 1990. Growth and reproduction of the tidepool sculpin Oligocottus
macul osus. Jpn. .I . I chthy ol ., Vol. 36, pp. 410-418.
Pierce, CL., J.B. Rasmussen & WC. Leggett, 1989. Sampling littoral fish with seine: corrections for
variable capture efficiency. Can. J. Fish. Aquat. Sci., Vol. 47, pp. 1004-1010.
Pihl, L. & R. Rosenberg, 1982. Production, abundance, and biomass of mobile epibenthic marine fauna
in shallow waters, western Sweden. J. Exp. M ar. Biol . Ecol., Vol. 57, pp. 273-301.
Pollard, D.A., 1984. A review of ecological studies on seagrass-fish communities, with particular
reference to recent studies in Australia. Aquat. Bot., Vol. 18, pp. 3-42.
Prince, J.D. & I.C. Potter, 1983. Life-cycle duration, growth and spawning times of five species of
Atherinidae (Teleostei) found in a Western Australian estuary. Aust . J. M ar. Freshw at er Res., Vol.
34, pp. 287-301.
Pulfrich, A. & C.L. Griffiths, 1988. Growth, sexual maturity and reproduction in the hottentot
Pachymetopon blochii (Val.). S. Af r. J. M ar. Sci ., Vol. 7, pp. 25-36.
Richards, C.E. & M. Castagna, 1976. Distribution, growth, and predation of juvenile white mullet
(M ugil curema) in oceanside waters of Virginia’s eastern shore. Chesapeake Science, Vol. 17, pp.
308-309.
Robertson, A.l., 1977. The ecology of King George whiting Sillaginodes punctatus (Cuvier and
Valenciennes) (Pisces: Perciformes) in Western Port, Victoria. Aust . J. M ar. Freshwat er Res., Vol. 28,
pp. 35-43.
Robertson, A.I., 1978. Trophic interactions among the macrofauna of an eelgrass community. Ph.D.
Thesis, University of Melbourne, Melbourne, Australia, 182 pp.
Robertson, A.I., 1980. The structure and organisation of an eelgrass fish fauna. Oecologia (Berlin),Vol.
47, pp. 76-82.
Sainsbury, K.J. & A.W. Whitelaw, 1984. Biology of Peron’s threadfin bream, Nemipterus peroni
(Valenciennes), from the North West Shelf of Australia. Aust . J. M ar. Freshwat er Res., Vol. 35, pp.
167-185.
Schwartz, F.J., 1990. Length-weight, age and growth, and landings observations for sheepshead
Archosargus probatocephalus from North Carolina. Fish. Bull., Vol. 88, pp. 829-832.
Shepherd, S.A., A.J. McComb, D.A. Bulthuis, V Neverauskas, D.A. Steffensen & R. West, 1989.
Decline of seagrasses. In,
Bi ol ogy of seagrasses: a t reati se on t he bi ol ogy of seagrasses w i t h special
reference to t he Austra l i an regi on,
edited by A.W.D. Larkum, A.J. McComb & S.A. Shepherd,
Elsevier, Amsterdam, pp. 346-393.
Shlossman, P.A. & M.E. Chittenden, Jr., 1981. Reproduction, movements, and population dynamics of
the sand seatrout, Cynoscion arenarius. Fish. Bull., Vol. 79, pp. 649-669.
Sogard, SM., G.V.N. Powell & J.G. Holmquist, 1987. Epibenthic fish communities on Florida Bay
banks: relations with physical parameters and seagrass cover. M ar. Ecol. Prog. Ser., Vol. 40, pp.
25-39.
Sogard, S.M., G.V.N. Powell & J.G. Holmquist, 1989. Utilization by fishes of shallow, seagrass-covered
banks in Florida Bay. 1. Species composition and spatial heterogeneity.
Envi ron. Bi ol . Fishes,
Vol.
24, pp. 53-65.
8/10/2019 The production and trophic ecology of shallow-water fish.pdf
http://slidepdf.com/reader/full/the-production-and-trophic-ecology-of-shallow-water-fishpdf 29/29
G.J. Edgar and C. Shaw I J. Exp. M ar. Bi ol . Ecol . 194 (1995) 53-81
81
Struhsaker, P. & J.H. Uchiyama, 1976. Age and growth of the nehu,
Stolephorus purpureus
(Pisces:
Engraulidae), from the Hawaiian Islands as indicated by daily growth increments of sagittae. Fish.
Bull., Vol. 74, pp. 9-17.
Szedimayer, S.T., M.P. Weinstein & J.A. Musick, 1990. Differential growth among cohorts of Age-O
weakfish Cynoscion regalis in Chesapeake Bay. Fish. Bull., Vol. 88, pp. 745-752.
Tanaka, S. & K. Mizue, 1979. Studies on sharks-XV Age and growth of the Japanese dogfish M ustelus
manazo Bleeker in the East China Sea. Bull. Jpn. Sot. Sci. Fish., Vol. 45, pp. 43-50.
Thayer, G.W. & A.J. Chester, 1989. Distribution and abundance of fishes among basin and channel
habitats in Florida Bay.
Bul l. M ar. Sci.,
Vol. 44, pp. 200-219.
Thomas, R.M., 1985. Growth rate of the pilchard off south west Africa, 1971-1983. Sea Fi sh. Res. Inst .
I nvest . Rep. S.A. Dept. Envi ron. A ffai rs,Vol. 128, pp. 1-41.
Thomas, R.M., 1986. Growth of larval pelagic fish in the south-east Atlantic from daily otolith rings in
1982/83 and 1983/84. S. Af r. J. M ar. Sci., Vol. 4, pp. 61-77.
Tong, L.J. & CM. Vooren, 1972. The biology of the New Zealand Tarakihi,
Cheilodactylus
macropterus (Bloch and Schneider). Fish. Res. Bull. Fish. Res. Div. N.Z., Vol. 6, pp. l-60.
Uchiyama, J.H. & P. Struhsaker, 1981. Age and growth of skipjack tuna, Kat suwonus pelam is, and
yellowfin tuna, Thunnus albacares, as indicated by daily growth increments of sagittae. Fish. Bull.,
Vol. 79, pp. 151-162.
Vooren, C.M. & R.F. Coombs, 1977. Variations in growth, mortality, and population density of
snapper, Chrysophrys auratus (Forster), in the Hauraki Gulf, New Zealand. Fish. Res. Bull. Fish.
Res. Div. N.Z.,Vol. 14, pp. l-32.
Warlen, S.M & A.J. Chester, 1985. Age, growth, and distribution of larval spot, Leiostomus xanthurus,
off North Carolina.
Fish.
Bull.,Vol. 83, pp. 587-600.
Webb, B.F. & C.J. Grant, 1979. Age and growth of jack mackerel, Trachurus declivis (Jenyns), from
south-eastern Australian waters. Aust. /. Mar . Freshw at er Res., Vol. 30, pp. l-9.
Whitfield, A.K., 1988. The fish community of the Swartvlei estuary and the influence of food
availability on resource utilization. Estuaries, Vol. 11, pp. 160-170.
Withell, A.F. & J.W. Wankowski, 1988. Estimates of age and growth of ocean perch, Helicolenus
percoides Richardson, in south-eastern Australian waters. Aust. /. Mar . Freshw at er Res., Vol. 39, pp.
441-457.
Yabuki, K., 1989. Age determination of yanagimushigarei Tanakius kitaharai (Pleuronectidae) from
otoliths in the Sea of Japan off Kyoto Prefecture. Ni ppon Suisan Gakk aishi,Vol . 55, pp. 1331-1338.