the project of valuing viet nam dairy products joint …
TRANSCRIPT

THE PROJECT OF VALUING VIET NAM DAIRY PRODUCTS JOINT STOCK CO.
USING SELECTED VALUING MODELS
BC NGAN HA DOAN
Master thesis 2018

TBU in Zlín, Faculty of Management and Economics 2
*** scanned submission page 1***

TBU in Zlín, Faculty of Management and Economics 3
*** scanned submission page 2***
TBU in Zlín, Faculty of Management and Economics 4
THESIS AUTHOR’S STATEMENT
I hereby acknowledge that:
Upon final submission of my Master’s Thesis, I agree with its publishing in
accordance with Act No. 111/1998 Coll., on Higher Education Institutions and on
Amendment and Supplements to Some Other Acts, (The Higher Education Act),
without regard to the defence result;
My Bachelor’s/Master’s Thesis will be released in electronic form in the university
information system, accessible for reading only; and one printed copy of the
Bachelor’s/Master’s Thesis will be stored on electronic media in the Reference
Library of the Faculty of Management and Economics of Tomas Bata University in
Zlín;
To my Bachelor’s/Master’s Thesis fully applies Act No. 121/2000 Coll., on
Copyright, Rights Related to Copyright and on the Amendment of Certain Laws
(Copyright Act) as subsequently amended, esp. Section 35 Para 3;
In accordance with Section 60 Para 1 of the Copyright Act, TBU in Zlín is entitled
to enter into a licence agreement about the use of the Thesis to the extent defined in
Section 12 Para 4 of the Copyright Act;
In accordance with Section 60 Para 2 and 3, I can use my Bachelor/Master’s Thesis,
or render the licence to its use, only with the prior expressed written agreement of
TBU in Zlín, which is in such case entitled to require from me appropriate financial
compensation to cover the cost of creating the Bachelor/Master’s Thesis (up to the
total sum);
If the software provided by TBU or other entities was used only for study and
research purposes (i.e. for non-commercial use) in the development of the
Bachelor/Master’s Thesis, it is not possible to use the Bachelor/Master’s Thesis
commercially;
In the event that the Bachelor/Master’s Thesis output encompasses any software
product, source codes and/or files of which the project consists of are considered part
of the Thesis. Failure to submit this part of the Thesis may result in an unsuccessful
defence of the Thesis.
I herewith declare that:
I have created this Bachelor/Master’s Thesis on my own and cited all used sources.
In case the results are published, I shall be cited as author.
The contents of the Bachelor/Master’s Thesis handed over are identical with the
electronic version entered in the IS/STAG.
Zlín, April 17, 2018 ........................................................
date signature
Name and surname: DOAN NGAN HA
TBU in Zlín, Faculty of Management and Economics 5
ABSTRAKT
Cílem předložené diplomové práce je ocenit kótovanou společnost na vietnamském
akciovém trhu- akciovou společnost Vietnam Dairy Product Stock (Vinamilk), poté, co
státní akcionář zažádal o cenovou nabídku za uvolnění státních akcií ve firmě Vinamilk. K
ocenění firmy existují různé metody, které však mohou generovat odlišné výsledky.
Diplomová práce poskytuje stručný přehled literatury o běžných metodách oceňování, které
jsou používány akademiky i v praxi, předně se pak zaměřuje na metodu diskontovaných cash
flow, jenž mimo jiné vyžaduje tvorbu předpokladů z pohledu firemní výkonnosti či
makroekonomických podmínek. V praktické části diplomové práce jsou nejprve před
samotným oceněním firmy analyzovány ekonomické podmínky a mlékárenský průmysl ve
Vietnamu. Na závěr je provedeno srovnání mezi použitými metodami ocenění a na základě
zjištěných výsledků jsou vyvozena doporučení.
Klíčová slova: Ocenění, vietnamské mléčné výrobky, diskontovaný peněžní tok, volné
peněžní toky
ABSTRACT
The thesis aims to determine a value of a listed corporation on the Vietnamese stock market-
Vietnam Dairy Product Joint Stock Company (Vinamilk), after the state shareholder asked
a price for the offer of release the state shares in Vinamilk. To determine a value of a firm,
several valuation methods can be used while each method can generate different results. The
thesis provides a brief literature review to common valuation methods used by academics
and in the practice, in particular, is mainly oriented on the discounted cash flow method
which, inter alia, requires to make one assumptions on firm's performances as well as the
macro economic conditions. In the practical part before the valuation, the economic
conditions and the dairy industry in Vietnam before valuation Vinamilk is analysed. Finally,
a comparison among different valuations is applied and recommendations are given based
on the findings.
Keywords: Valuation, Vietnamese Dairy Products, Discounted Cash Flow, Free cash flow.

TBU in Zlín, Faculty of Management and Economics 6
"We are in danger of valuing most highly
those things we can measure most accurately,
which means that we are often precisely
wrong rather than approximately right"
Sir John Banham,
Director General of the Confederation
of British Industry from 1987-2005
ACKNOWLEDGEMENTS
To complete this thesis and the master program, I have received many supports from
my professors and colleagues. First at all, I would like to express the deepest appreciation to
my advisors- Ing. Jana Vychytilová, PhD for her experts, sincere and valuable guidance
extended to me.
I also would like to express my attitude to thank Prof. Dr. Ing. Drahomíra Pavelková
and Doc. Ing. David Tuček, Ph.D, they have approved my postpone of studying for one year.
I am also thankful to the members of the international student office for providing
me all support for preparing my trip to Czech Republic as well as during my time here.
Specially, I am grateful to Ms. Pavla Bartošová- who has provided all supports for me to
come to Czech.
Finally, I would express a deep sense of gratitude to my family, especially to my
parents, who have always encouraged me during the hard time of studying. Special thank to
my husband and my lovely daughter, who are beside me and are sources of energies for me
to finish the program.
TBU in Zlín, Faculty of Management and Economics 7
Content
INTRODUCTION ............................................................................................................ 8
1. Privatized firms and the financial market in Vietnam ......................................... 10
2. Research questions ................................................................................................... 12
I. THEORY ................................................................................................................... 14
1 Background on valuation ......................................................................................... 15
2 Valuation methods in the academic literature ....................................................... 17
2.1 Balance sheet-based methods .................................................................................. 17
2.2 Income statement – based methods ........................................................................ 19
2.3 Goodwill based-methods .......................................................................................... 19
2.4 Cash flow discounting-based methods .................................................................... 20
3 The discounted cash flow models (DCF models) ................................................... 22
3.1 The free cash flow ..................................................................................................... 22
3.2 The equity cash flow ................................................................................................. 27
3.3 The capital cash flow ................................................................................................ 28
4 Some selected income- based methods .................................................................... 29
II. PRACTICAL PART ................................................................................................ 31
5 Overview about the financial market and the dairy sector in Vietnam .............. 32
5.1 The development of vietnamese financial market ................................................. 32
5.2 Dairy industry ........................................................................................................... 34
6 Vietnam dairy products joint stock company profile ........................................... 39
6.1 The position of Vinamilk in the dairy market ....................................................... 39
6.2 Overall performance of Vinamilk ........................................................................... 40
6.3 Ownership and orgranization ................................................................................. 41
6.4 Facts of Vinamilk from 2015-2017F ....................................................................... 42
6.5 The business strategy of Vinamilk .......................................................................... 45
7 The valuation of Vinamilk ....................................................................................... 47
7.1 Estimation of the financial statements for the fiscal year 2017 ............................ 47
7.2 Forecast of the Free Cash Flow To Firm (FCFF) .................................................. 47
7.3 Weighted Average Cost of Capital (WACC) ......................................................... 59
7.4 Value of the target corporation-Vinamilk .............................................................. 62
CONCLUSION ............................................................................................................... 67
BIBLIOGRAPHY ........................................................................................................... 69
LIST OF ABBREVIATIONS ........................................................................................ 71
LIST OF FIGURES ........................................................................................................ 73
LIST OF TABLES .......................................................................................................... 74
APPENDICES ................................................................................................................. 75

TBU in Zlín, Faculty of Management and Economics 8
INTRODUCTION
Recognized as an emerging market, Vietnam has recent attracts more foreign
investors into the financial market, that encourages the dramatically growth of the stock
market with large international funds recently. As the consequence of the transformation
from the centrally oriented regime to market oriented regime, Vietnam has many state-
owned enterprises which need to leave out of the State umbrella and the government should
release their shares to the other investors. In 2017, the government planned to sell the state-
owned shares to the public for the 10 listed corporations with $7 billion as the market value
and holds $3 billion approximately (source: SCIC, 2017), the Vietnamese stock market pays
more attention to foreign investors due to many institutional investors planning to be the
strategic investors or major shareholders in those state-owned corporations, but there were
some failed calls because of the over ask price for the state shares and the government's plan
has not finished as designed.
The objectives of the government plan are to increase the budget resulting from the
selling shares as well as to make a fair competition in the market; corporations have less
support and compete to others without taking any advantage from the policy as before. Some
listed corporations are selected to perform the government's plan that focused on banking
sector and some líted corporations such Vietnam Dairy Product Joint Stock Company, Petro
Vietnam Oil Corporation, Saigon Beer Alcohol-Beverage corporation etc. Those listed
corporations are profitable and key players in their industry. The Vietnam Dairy Product
Joint Stock Company is known as the most profitable and has achieved amazing results
previous years.
Vietnam Dairy Products Joint Stock Company (Vinamilk or the company) was
recognized as the biggest listed company on the Vietnamese stock market with the market
value up to 182,299 billion Vietnamdong (more than $9 billion approximately) and the
government held 60.47% of shares of the company after privatization at the end 2003
(Vinamilk, 2006). The proportion of state owned shares reduced to 45% of the company
shares after that. In 2016, the government planned to reduce the proportion to 36%, but it
was not success -the government still had 39.34% of the company shares at the end of 2016
and has another plan to hold only 36% of shares at the end of 2017. Indeed, in 2016, the plan
has been failed due to a fall of market price (offer price was 144,000 dong per share while
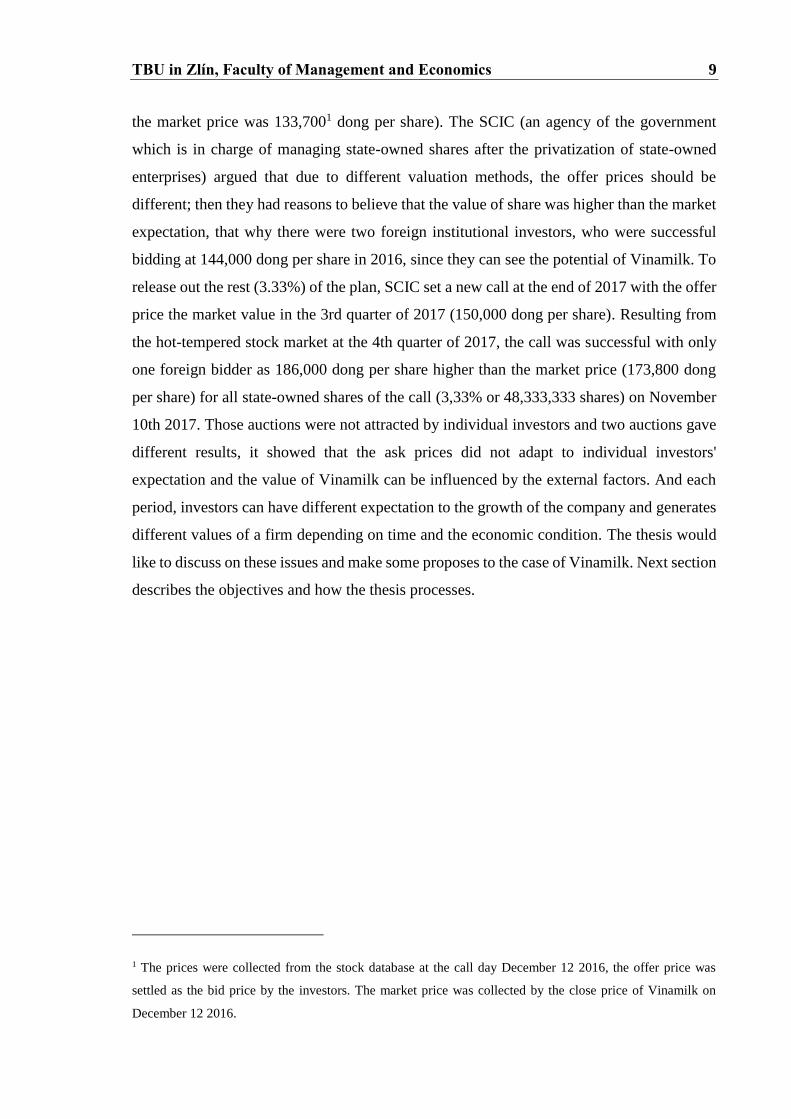
TBU in Zlín, Faculty of Management and Economics 9
the market price was 133,7001 dong per share). The SCIC (an agency of the government
which is in charge of managing state-owned shares after the privatization of state-owned
enterprises) argued that due to different valuation methods, the offer prices should be
different; then they had reasons to believe that the value of share was higher than the market
expectation, that why there were two foreign institutional investors, who were successful
bidding at 144,000 dong per share in 2016, since they can see the potential of Vinamilk. To
release out the rest (3.33%) of the plan, SCIC set a new call at the end of 2017 with the offer
price the market value in the 3rd quarter of 2017 (150,000 dong per share). Resulting from
the hot-tempered stock market at the 4th quarter of 2017, the call was successful with only
one foreign bidder as 186,000 dong per share higher than the market price (173,800 dong
per share) for all state-owned shares of the call (3,33% or 48,333,333 shares) on November
10th 2017. Those auctions were not attracted by individual investors and two auctions gave
different results, it showed that the ask prices did not adapt to individual investors'
expectation and the value of Vinamilk can be influenced by the external factors. And each
period, investors can have different expectation to the growth of the company and generates
different values of a firm depending on time and the economic condition. The thesis would
like to discuss on these issues and make some proposes to the case of Vinamilk. Next section
describes the objectives and how the thesis processes.
1 The prices were collected from the stock database at the call day December 12 2016, the offer price was
settled as the bid price by the investors. The market price was collected by the close price of Vinamilk on
December 12 2016.
TBU in Zlín, Faculty of Management and Economics 10
OBJECTIVES AND METHODS OF MASTER THESIS
PROCESSING
This research would like to apply different valuation methods to compare the firm
value i.e. Discounted Cash Flow or the quickly valuation methods by using the forward price
to earnings ratio (Forward P/E method) and forward enterprise value (EV) to Earnings
before interest, taxes, depreciation and amortization (EBITDA) (Forward EV/EBITDA
method). Based on those different valuation methods, the research would like to compare
and propose suitable value of Vinamilk's share.
1. Privatized firms and the financial market in Vietnam
Vietnam was recognized as a transitional economy, which was transformed
successful from the centrally oriented to the market oriented regime from 1986. The whole
economy was suffered by the inefficiency of the centrally economic regime as well as the
state-owned enterprises were a heavy burden to the government's budget. Resulting from the
changed regime, Vietnam was accepted the ownership structures of enterprises or firms can
be diversified instead of the state-owned enterprises (SOEs) in the economy; and then a
privatization program was established to reduce the inefficient SOEs in 1992. At the first
stage, the privatization program was performed slowly and a few firms would like to be
privatized till 2000s. There were many reasons but the most important reason was how to
determine the firm value and the financial market had not developed yet- the stock market
established in 2000. The government would like to withdrawn the state shares from state-
owned firms can reach some objectives, it does not only reduce the burden on the
government budget due to inefficient firms, but also provides financial sources to the
government, financial instruments to the financial market (shares on the stock market) and
support the financial market to develop. Consequently, the government set a target to release
all their shares in the listed companies over the period 2010-2017 (see in the table 1).

TBU in Zlín, Faculty of Management and Economics 11
Table 1: Number of firms privatized from 1992 to 2016
Period Content Number of firms
privatized
1992-1996 Pilot program 5
1996-1998 Extension of pilot program (1996-1998) 25
1999-2011 Official privatization program (According to the Circulation
44/1998/ND-CP, 64/2002/ND-CP, 109/2007/ND-CP)
3,946
From 1999-2002 909
From 2003-2006 2,649
From 2007-2010 376
In 2011 12
2012-2016 Privatization program for restructure state-owned enterprises
(According to Circulation 59/2011/ND-CP and
189/2013/ND-CP)
507
In 2012 13
In 2013 74
In 2014 143
In 2015 222
In 2016 55
Source: doimoidoanhnghiep.chinhphu.vn
In the pilot period, the number of privatized firms was 30 over 6,000 state-owned
firms approximately due to a problem of valuation processes; many firms could not
determine the value of their assets or calculated only land use right certificates as firms'
assets to privatize. The valuation processes were defined by the guidelines of the government
(such as Circulations no. 28/CP and 44/1998/ND-CP in 1998 and 64/2002/ND-CP in 2002),
which were evaluated on the book values of firms instead of the future cash flows of firms
and firms’ potential. The firm valuation was focused on the fixed assets such real estates,
machines, location of firms .etc. which could be generated with different values due to no
available information or different point of views on the accounting records (Tran, 2015).
This method also was a weakness to attract foreign investors to buy if firms having not
disclosed much information and the asymmetric information existed. It required a reform for
the financial market and released to other types of financial firms to provide valuation
services such as the investment banking of foreign banks, some securities corporations and
other financial institutions instead of only the Vietnam valuation center2 playing as a
monopolistic service provider.
2 a subsidy of the Ministry of Finance

TBU in Zlín, Faculty of Management and Economics 12
Although firms were privatized, the government or local government/ government
agencies still hold a large proportion of firm shares as the major shareholders, it means that
firms, in somehow, are under control of the state. The executives can have their own interest
instead of increasing firm values or of serving as a representative of the state-ownership, it
forced the government to reduce their stakes in privatized firms and less involving to firms,
it also sends a signal to the public that every firm is the same and there is no umbrella to a
specific firm to get advance in competition with other firms.
2. Research questions
The research aims to answer the following questions:
1. What are the commonly used valuation methods employing to value a company?
2. What are the most concerns of Vietnamese financial market?
3. What are the trend and situation of Vietnamese dairy market?
4. Can be the firm value calculated by the DCF suitable in compared to the market
value of Vinamilk?
5. Whether the DCF method is different with the quick valuation methods.
The thesis will review the available literature sources to provide a brief overview of
the valuation methods commonly used in the books, articles and in practice from the official
resources. The Vietnamese financial market and the stock market is discussed, based on
sources from the secondary data and reports. The trend and situation of Vietnamese dairy is
analyzed by using market reports of the market research corporation such Stoxplus,
Euromonitor International, Hochiminh Securities Corporation etc. The valuation of
Vinamilk is applyed in the practical part, it employs the data collecting from the annual
reports, financial reports of Vinamilk as well as the industry reports published by securities
corporations in Vietnam or by market research corporations.
Limitation:
The thesis aims to provide the literature and valuation of a specified corporation listed
on the Vietnamese stock market. The calculation and any assumption are according to the
point of view of the author. So the author tries to make a projection based on the available
information.
The thesis contains the following contents: Chapter 1- Introduction- reviews
briefly the situation of the withdrawn program of the government to release the state-owned
shares to other investors in the stock market. Chapter 2- Theoretical part- describes the
commonly valuation methods used in literature as well as the practical methods. The review

TBU in Zlín, Faculty of Management and Economics 13
is going through each method to obtain the value of a firm. The next chapter- chapter 3:
Practical part- aims to apply a valuation method (DCF) to the chosen corporation, in which
the valuation process will be assessed based on the assumptions and the available
information. The last chapter- Chapter 4: Conclusion- makes some remarks and the
conclusion after comparing the main valuation method with other methods as well as giving
some recommendations on the finding.

TBU in Zlín, Faculty of Management and Economics 14
I. THEORY

TBU in Zlín, Faculty of Management and Economics 15
1 BACKGROUND ON VALUATION
Damodaran (2012) shows that every asset (financial or real) has its own value; in
some cases, an asset can be determined by different valuation methods and then its value can
vary due to the different valuation methods.
Due to the valuation process is based on the information that serves for the valuation
process, then the value can be biased and it can be driven by the opinion of the person who
is underwriting the process and determines the value of assets (Imam et al., 2008).
Damodaran (2012) concludes that "valuation model are quantitative and valuation is
objective" and "in many valuations, the price gets set first and the valuation follows". It
explains that the final value of valuation process is affected by many things and since the
valuation is an objective then it can be representative for the person or the institution
provides services of the valuation; then assets can be over or under value. Because of the
pressure to make more attractive investors or the portfolio management, the analysts intend
to look for the under-valued firms to recommend instead of over-valued firms (Imam et al.,
2008). Otherwise, the valuation process can be biased from the missed information or the
asymmetric information; then the target firm can have different value. So that the updated
information is the important factor to the valuation process and it depends on the market
situation and the specified firms as well as the experience of the person who is in charge of
the valuation process. Moreover, the valuation process needs to predict the potential and
assume the future growth of the firm based on current trends or the position of the firm in
the industry or the uncertainty of the economy; and the forecast of firm performance in the
future can be uncertainty, then it can be reflected that the valuation being changeable from
time to time. Although the valuation processes can vary but the final result needs to be more
reliable based on the source of information of firms.
The valuation is defined as a key role in the finance and serves to the corporate
finance, merger and acquisitions or portfolio management. While the first objective is to
provide to shareholders, executives or creditors to have a view of firm value- especially for
the shareholders to know whether the executives maximize the firm value, it can be a
fundamental factor to decide the firm restructure or make any decision for the firm such the
capital structure, dividend policy, investment decision etc. In the second objective, it serves
to the acquisition analysis; the bidding side has to know the fair value of the target firm
before making a bid as well as the target firm needs to propose a reasonable value before

TBU in Zlín, Faculty of Management and Economics 16
making any decision relevant to the offer. So it is very important to the both parties and
convince their shareholders that the offer is reliable and reasonable, that is a highly pressure
to valuation process if both parties can generate different values. The last objective is for the
portfolio management, it seems be a simple requirement for the investors in the financial
market. On the one hand, the valuation plays different role in the financial market (or the
stock market), it could be having a minimal role for the passive investors. But on the other
hand, it has a important role for the active investors.
To sum up, the valuation is a wide purpose in the finance and is necessary to support
investors, shareholders to know the fair value before making any decision related to their
investment, takeover or operating decision in a corporation. Since there are different
valuation methods and the results are based on the projection of firm future performance as
well as the market situation, then the outcome can be different. The next section will discuss
the valuation methods in literature.
TBU in Zlín, Faculty of Management and Economics 17
2 VALUATION METHODS IN THE ACADEMIC LITERATURE
In the modern life, firms would like to develop overtime and increase their values
even that their forms of activities can be different, firms need to maximize their profitable
performance to generate higher value for the firm-owners (Ross et al. 2012, chapter 1).
Actually, the valuation can be differently depending on the purposes of users and this task
plays a crucial role for firms to know their potential or to provide information to owners,
lenders or the public. There are some firm (or company) valuation methods which can be
known as balance based methods, income statement-based methods, mixed methods or cash
flow discounting-based methods (Fernandez, 2007).
The firm value definitely is different to the price of firm shares, it can be easy to see
that each investors will have different point of views on the firm value as well as they can
have different prices to buy firm shares. For example, if an investor predicts that a firm is
potential and can grow in the near future, then the valuation process can convince him to set
the highest price he could pay. In contradiction, other investors discusses that firm will be
slow the growth rate and they would like to sell in which the firm valuation should be
considered as the lowest value they want to sell. Indeed, the firm valuation is not only helpful
to buyers or sellers of firm shares, it also serves to firm executives to decide the firm capital
structure (Brealy et al. 2010), or even that they can decide to attract strategic investors to
show that the firm value is a goodwill to them. It also serves for acquisitions and mergers
(M&A) when executives need to know how each division or firm worth to negotiate with
the buyers. The necessary of firm valuation irritates that the valuation methods need to be
considering carefully fulfilling the requirements of each purpose. The research will present
some methods that are commonly used in academic literature in which the research will,
inter alia, concentrate to discuss in more detail the definitions, contents and the how to
calculate the firm value, based on different valuation methods.
2.1 Balance sheet-based methods
The main approach of these methods is to use company assets to estimate company
values, in other word; it employs the items in balance sheets for firm valuation. This method
does not take into account the future of firms or the time value of the money. It illustrates
that firms can be same if their total assets are the same levels, and forget to see the potential
development or the future of firms; some other important factors such as market shares,
TBU in Zlín, Faculty of Management and Economics 18
human resources or the good relationship with customers are not mentioned to evaluate the
firm values.
Fernandez (2007) shows that the balance sheet-based methods also refer to
shareholders’ equity that contains different valuation methods such as book value, adjusted
book value, liquidation value and substantial value.
As mentioned above, the balance sheet based methods are namely as shareholders’
equity- so in the book value method- it takes value of shareholders’ equity in the balance
sheet as the firm’s book value. Or in other words, this criterion can be picked from the
difference of total asset and liabilities; this implies that the book value only pays attention to
shortcoming criteria (at the period of the balance sheet mentioned). It can be seen that the
book value of a firm does not match the market value and the potential of the firm.
The adjusted book value seems be better than the book value by considering the
market value of each item in the balance sheet and makes them to close the real values. It
also takes into account the detail of each item to isolate the fluctuation and the bad items can
affect to the market value of each item in the balance sheet. For example, instead of using
the book value of fixed asset, this item needs to be recalculated to obtain the real value based
on the market value or the account receivable can contain some bad debts and need to be
dropped out to valuation.etc
The liquidation value is a firm value if it is liquidated. It means that all assets of the
firm are sold out and debs are paid off. It is represent a minimum value of a firm which is
operating and having a value greater than its liquidation value. The last method of the balance
sheet-based methods is the substantial value (or replacement cost method), this method
applied to calculate the investment value which ought to apply for maintaining the firms’
operations. In details, it only counts the operating investments and excludes assets which are
not used for the firms’ operations such as unused real estates, machines.etc. or the assets are
being held by other firms.
To sum up, the balance-sheet based methods focus on the items in the balance sheets
or some specified items which are adjusted with the market values, they still miss some
potential or the positions of firms in the industry sectors. Obviously, these methods are not
TBU in Zlín, Faculty of Management and Economics 19
possible to provide a good valuation to the public or company, and then it is not applied
widely in the academic researches or practice.
2.2 Income statement – based methods
In contradiction to the balance-sheet based methods, these methods are using the
income statements at the main items for firm valuation. These methods also consider the
future expectations as well as the market performances; these employ some items such as
the size of earnings, sales or other indicators for firm valuation. To do so, some practical
ratios or multiples are multiplied with the main items. There are 4 different methods defined
in these methods:
+ Value of earnings: it shows that the equity’s value is from a formula, which is
multiplied the annual net income with a ratio of a price earnings ratio (P/E), this method
employs both the market item (prices of shares) and an accounting item (earnings).
Moreover, it is flexible to apply for a specific time or period.
+ Value of dividends: Ross et al. (2012) and Brealey et al. (2010) show that the value
of dividends is complex since we cannot be surely the dividends paid in the future, then it
needs to assume a form of dividends in order to firm valuation. To ease the regime for
dividends, it needs to assume that the dividends are fixed forever in the perpetuity case or
Gordon Growth Model or mixed growth rate. These methods are argued that dividends are
paid too much will have a reversed effect on the growth rate of firms, since firms try to pay
more dividends, it illustrates that firms will have less money to re-invest into firms’
performance.
Besides that, there are several methods relevant to the income based methods i.e. sale
growth which is broken down by the P/E ratio and the return on sales (earnings/sales) or the
ratio of firm value to earnings before interest and taxes (EBIT) or to earnings before interest,
taxes, depreciation and amortization (EBITDA) etc.
2.3 Goodwill based-methods
These methods are generally related to the above mentioned methods, they state that
the goodwill based-methods are setting the firm value above the book or adjusted book
values due to a represent of the intangible assets which are not recorded in the balance sheets.
These methods argue that the intangible assets are playing a critical role for the firm
TBU in Zlín, Faculty of Management and Economics 20
operating since these assets can contribute to the future development of firms such the market
(or industry) position, quality of human resources, quality of customer base.etc.
To determine the value of firms by these methods, there can be problems to estimate
the value of intangible assets because of unclear calculating methods and criteria. But these
methods have strengths while considering the future earnings based on some “coefficients”
or ratios. These methods can be better practice if there is available information of firms in
the same industry/sector, the available information is referred to estimate the potential
growth or determine a certain coefficient to estimate the future unpredictable intangible
assets. These methods are usually applied in the European Continent, for example Union of
European Accounting Experts (UEC) methods or Anglo-Saxon Methods. Since they are not
suitable to developing countries due to asymmetric information and low levels of
regulations; this research introduce briefly and does not study deeply these methods.
2.4 Cash flow discounting-based methods
The aim of these methods is to estimate the cash flows of a firm in the future then
discounting them at a discount rate (which is including risks of firm operations) to determine
the firm value. These methods are different with above mentioned methods that focus on the
past information or unclear items as goodwill based methods, the cash flow discounting-
based methods are concentrating to estimate the future cash flows of firms based on some
criteria relevant to past performance of firms. Indeed, firms are recognized as the cash flow
generators and those cash flows are discounted to present by employing a suitable discounted
rate which can cover firms’ risks and other expectations. The DCF model is chosen as a
better valuation model by Kaplan and Ruback (1995); it also employs to be a popular method
in firm valuation and capital decisions in Graham and Harvey (2001) or Imam et al. (2008).
Generally speaking, the cash flow discounting-based methods intend to employ the
possible cash flows which are generated for the firms’ operations, these flows conceptually
are similar to the cash budget in the future of the firms. All of these flows are discounted as
the present to see whether the future value of those operations cash flows is profitable to the
investors or shareholders at the present, the most important factor which needs to be verified
is the discounted rate. Basically, the discounted rate could be covered all expectation of firms
and/or shareholders and is adjusted by the uncertainty conditions (or cash flows’ risks).
According to different approaches, the appropriate discounted rates should be considered to
TBU in Zlín, Faculty of Management and Economics 21
serve different cash flows: the free cash flow, the equity cash flow and the capital cash flow.
The cash flows are collecting from the balance sheets or the economic balance sheet. In the
next section, the discounted cash flow models are discussed more detail for each method of
cash flows.

TBU in Zlín, Faculty of Management and Economics 22
3 THE DISCOUNTED CASH FLOW MODELS (DCF MODELS)
As mentioned above, the discounted cash flow models are composed into 3 different
approaches. In this section, each approach will be discussed clearly to provide a background
of the DCF models. The general form of cash flow models are expressed as follow equation:
𝑽𝑨𝑳𝑼𝑬 =𝑪𝑭𝟏
𝟏+𝑹+
𝑪𝑭𝟐
(𝟏+𝑹)𝟐+
𝑪𝑭𝟐
(𝟏+𝑹)𝟐+⋯+
𝑪𝑭𝒏
(𝟏+𝑹)𝒏 (1)
in which:
+ VALUE: value of a firm.
+ CFi: Cash flow generated by the firm at the time i.
+ R: an appropriate discounted rate of the firm.
+ n: number of periods that the firm operates.
The n years show that we need to know the certain period of firms operation, assume
that the firm will have an indefinite duration. The problem is that how to find a suitable
growth models of the future cash flows for firms. Brealey et al. (2010) show that it needs to
assume some “specified growth rate” for the cash flow (or dividends as the book states) i.e.
“constant growth rate” or “varying growth rates”. Indeed, the “varying growth rates” need
to be simple by assuming that the rate is stable at a certain year to infinite that makes the
forecast future cash flows of firms easier and the present values decrease dramatically with
the further time horizon. Additionally, the competitive of firms will change overtime, and
the uncertainty can make firms to have disadvantage in their sectors, so it needs to decide a
finite time horizon to estimate the cash flows.
3.1 The free cash flow
The definition of the free cash flow (FCF) is defined by employed the operating cash
flow of a firm to valuate. The main flow is generated by the firm operations after tax, without
taking into account the debts. The FCF takes into account all money that is available in the
firm, including investments into fixed assets and working capital requirements, in an
assumption that, there is no debt; or in the other word, the financial expenses are not existed
for the firm.

TBU in Zlín, Faculty of Management and Economics 23
The free cash flow calculation can be an extension of cash budgeting. While the cash
budgeting should be predicted in short whereas the free cash flow needs to be forecasted
further. This assignment cannot be done with the basically accounting method. Since for
each future time period, it needs to predict by using the accrual approach, however, if the
accounting approach can be adjusted to recognize all items such as revenues, costs and
expenses under the "cash" point of view (it means the cash from payment and collection), so
the cash free flow can be selected by this calculation.
In this method, working capital requirements can be affected by the cash flow, this
item is collected from the balance sheet indirectly via the following function:
Working Capital Requirements= Cash+ Account Receivable+ Inventories - Account
payables
In short, the figure 1 and 2 compare the balance sheets with or without working
capital as the economic balance sheet and the accounting balance sheet.
Figure 1: The balance sheet
Assets
Working Capital
Requirements
Liabilities
Cash
Accounts receivables
Account Payables
Short-term financial debt
Inventories
Long- term financial debt
Shareholders' equity
Net fixed assets
Source: Fernándo (2007)
If the balance sheet is transformed to the economic balance sheet, it could be present as:

TBU in Zlín, Faculty of Management and Economics 24
Figure 2: The economic balance sheet
Assets Liabilities
Working Capital Requirements
Debt
Sharehoders' equity
Net Fixed Asset
Source: Fernándo (2007)
In the economic balance sheet, we need to focus on the what (available assets) and
how those assets can be more profitable in the future (growth of assets). The most important
in the free cash flow is how to determine the future activities to verify the sum of actual
received and paid money in each period. To do so, there are some questions need to be
answered such which assets the firm currently has? How much their values are? And there
is any risk for those assets and if the risks exist, which levels they are. Additionally, the firm
also needs to clarify which assets are able to grow and their risks.
To identify the components of a free cash flow, the information is given in the firm
income statement in which the free cash flow is obtained from earnings before interest and
tax (EBIT) and excluded the payment to fund providers (dividend and interest expenses
should not be present in the free cash flow). The procedure can be explained as:
TBU in Zlín, Faculty of Management and Economics 25
Figure 3: Procedure from the income statement to free cash flow
Year 2xxx
Sales
- Cost of goods sold
- General expenses
- Depreciation
Earnings before interest and tax (EBIT)
- Interest expenses
XXX
Earnings before tax
- Tax
Net income
- Dividend
Retained earnings
Year 2xxx
Earnings before interest and tax (EBIT)
- Tax on EBIT
XXX
Net income without debt
+ Depreciation
- Increase in fixed asset
- Increase in working capital requirements
Free cash flow
Source: Fernándo (2007)
from the earnings before interest and tax (EBIT) in the income statement, net income
without debt is subtracted by the tax on EBIT which is called tax payable on EBIT and must
be defined directly by the tax rate with the EBIT. Then the net income without debt must be
added by depreciation since this amount is actually not a payment of the year, the

TBU in Zlín, Faculty of Management and Economics 26
accounting perspective record it for a payment in the past. In the last step, a reduction from
the sum of new investment into fixed asset and new working capital requirements of the
year should be performed to obtain the free cash flow.
As the equation (1), to calculate the value of a firm, the free cash flow will be
discounted to the present value by a weighted average cost of debt and equity or weighted
average cost of capital (WACC). The WACC can be obtained via the following equation:
𝑾𝑨𝑪𝑪 = 𝑾𝑫𝒌𝑫(𝟏 − 𝑻) +𝑾𝑬𝒌𝑬 (2)
whereas:
+ 𝑊𝐷 =𝐷
𝐷+𝐸 the proportion of debt in the firm capital.
+ 𝑊𝐸 =𝐸
𝐷+𝐸 the proportion of equity in the firm capital.
+ E: the amount of equity and D: the amount of debt.
+ T: Corporate tax rate.
+ kD: cost of debt before tax (or required return on debt), kE: cost of equity (required return
on equity).
As the equation (2), the WACC is obtained by weighting the cost of debt (kD) and
the cost of equity (kE) depending on the firm capital structure, we need to consider the
required return on debt and equity that can be appropriate calculated by capital asset pricing
model (CAPM) (Ross et al., 2012):
E(R)= Rf+β(Rm-Rf) (3)
E(R): expected return of an asset.
β: the beta of the asset.
Rf: risk free rate (it can be employed by the rate of a government bond).
Rm: expected return on the market.
=> (Rm-Rf): risk premium.
To obtain the WACC, the cost of equity is rarely existed since the
investors/shareholders can have a volatile required return rate, so the CAPM can be an
appropriate method to get the cost of equity.

TBU in Zlín, Faculty of Management and Economics 27
In order to analyze more detail the capital structure, the valuation process using the
free cash flow approach can be discussed on the case that the firm has no debt, the required
return on assets is exactly the same the required return on equity- since if having debt, the
investors can see more risks on their invested capital, hence they require high required risk
premium on equity.
On the contradiction, if a firm has debt in the capital structure, it needs to turn on the
firm's advantages: the tax shield should be mentioned each year; the free cash flow needs to
adjust from the present value of tax shield of the interest paid off. The cost of debt can be
selected by the debt's market rate instead of interest rates at the borrowing contracts. This
also defines as the adjusted present value (APV). Then the value of firms can be shown as:
Firm value= PV(FCF|WACC)+ value of the debt's tax shield (4)
PV(FCF|WACC): present value of the free cash flow discounted by the WACC.
In this section, the free cash flow forecasts the further time ahead and assumes that
the businesses continued operating next years.
3.2 The equity cash flow
The equity cash flow, sometime namely free cash flow at the shareholders' point of
views. In this method, the equity cash flow is subtracted by the interest and principal
payment (after tax), then added by the new debts, the following equation expresses the
calculation:
ECF= FCF - [interest payment*(1-T)] - principal payment + new debt (5)
ECF: Equity Cash flow.
FCF: Free cash flow.
T: Tax rate.
The ECF derives the financial structure in each period, the interest payment is
corresponding to the existence of debts, installments of principal are paid at the maturity.
Any fund from new debts is received. The rest will belong to the shareholders for further
decision that they pay as dividends or to buy back shares. This method illustrates that the
cash flow is focused on the firm's equity; meanwhile, the discount rate can be taken by the
TBU in Zlín, Faculty of Management and Economics 28
required return on equity (kE). Then the firm's total value needs to add the market value of
the existing debt to the value of equity (or D+E).
The required return on equity is estimated by using the Gordon model, whereas a
constant growth rate of dividends is assumed or by employing the CAPM as mentioned
above.
The Gordon constant growth model (Brealey et al., 2010; Ross et al., 2012):
𝑷𝟎 =𝑫𝟏
𝑹−𝒈 (6)
P0: Share's current price
D1: the dividend can be received in the next period. (D1=D0x(1+g))
R: expected return on equity.
g: constant dividend growth rate.
=> the expected required return on equity: 𝑅 = [𝐷1
𝑃0] + 𝑔
In addition, the equation (6) can be estimated by other different dividend growth rate
which does not discuss in the thesis.
3.3 The capital cash flow
The term capital cash flow defines as the sum of equity cash flow and the debt cash
flow, in which the debt cash flow is decomposed by the sum of interest payment and
principal repayment. Then the capital cash flow is:
Capital cash flow (CCF) = Equity cash flow (ECF) + Debt cash flow (DCF)
= ECF+I-deltaD (7)
I: interest payment => I= D*kD (D: debt and kD: cost of debt) .
The expression in (7) can be equations as:
Market value of a firm = E+D = present value[CCF|WACCBT]
E: equity; D: Debt and WACCBT: Weighted Average Cost of Capital before Tax.
𝑾𝑨𝑪𝑪𝑩𝑻 = 𝑾𝑫𝒌𝑫 +𝑾𝑬𝒌𝑬

TBU in Zlín, Faculty of Management and Economics 29
4 SOME SELECTED INCOME- BASED METHODS
In this section, the thesis would like to discuss some selected income- based methods
to recalculate the value of a firm. The forward P/E and EV/EBITDA will be chosen to
compare the value which obtains from the DCF method mentioned above. Those methods
are quick and commonly employed by securities corporations. The "forward" states that the
components are focused on the forecast of items in the projection instead of using the historic
values. The base methods are using the market value as a reference point to compare the
accuracy of a model, it is recommended to use by Penman (2012) and Hoover (2006). Baker
and Ruback (1999), Imam et al. (2008) and Titman and Martin (2008). They argue that the
multiples method is used widely in practice that could yield valuation closely to the DCF
value, that makes the thesis would like to apply this to measure the accuracy of the DCF
model in the case of Vinamilk.
Forward P/E (forward price to earnings) is a measure of the price to earnings ratio
using the future earnings for the P/E calculation. The main idea of this method is the
projection of EPS at the end of current fiscal year by comparing the P/E of other corporations
in a sector/industry or cross-countries (Damoradan, 2012). While the current price to
earnings ratio is used to calculate a relative value based on the corporation's level of earnings;
the forward price to earnings ratio determines what the relative value of the corporation will
be at a future level of earnings. If the forward P/E ratio is lower than the current P/E ratio, it
means that the earning is increasing and vice versa.
The latter method is discussed on the forward EV/EBITDA (a corporation's current
enterprise value- EV divided by its forecast of earnings before interest, taxes, depreciation
and amortization- EBITDA- for the current fiscal year), in which the EV is calculated as the
corporation's total market capitalization and preferred shares and debts; and then minus total
cash. This method is used for investors to compare the value of a corporation (including
debts) to the cash earnings less noncash expenses. The value of forward EV/EBITDA is
served for comparing the corporation value within the same industry or other valuation
methods. The method is meaning as showing how many unit currency of enterprise value a
corporation is worth per unit currency of estimated EBITDA at the end of the current fiscal
year.
TBU in Zlín, Faculty of Management and Economics 30
The formulas:
Forward P/E= Pshare /EPSF (8)
Pshare : Current Share Price
EPSF : Estimated Future Earnings Per Share- calculated based on the forecast of EPS.
Forward EV/EBITDA= EV/EBITDAF (9)
EV: Current enterprise's value
EBITDAF: The Projected earnings before interest, taxes, depreciation and
amortization for the current fiscal year.
Summary
In the thesis, the theory of valuation is introduced briefly to provide different
valuation methods of a firm. There are different definitions of valuation methods, the thesis
focuses on the free cash flow methods and each method can be suitable to each kind of firms.
In this chapter, some assumptions of the growth rates, adjustments of expenses/costs or the
disadvantages of each method are not discussed; those will be employed during the
projection of the firm valuation. The next chapter will discuss the practical valuation.

TBU in Zlín, Faculty of Management and Economics 31
II. PRACTICAL PART
TBU in Zlín, Faculty of Management and Economics 32
5 OVERVIEW ABOUT THE FINANCIAL MARKET AND THE
DAIRY SECTOR IN VIETNAM
The section 5 serves to provide the background of the development of the financial
market and the stock market in Vietnam after the transform of the economy, and the potential
growth of the stock market at the present, which can be an information to see whether the
ask prices are suitable to the trend of the market. Besides that, a discussion on the dairy
industry in which the target corporation (Vinamilk) is operating, the industry information is
argued the potential of dairy market in Vietnam and the competition of the market that
Vinamilk will face on.
5.1 The development of Vietnamese financial market
Vietnam was a centrally oriented economy before 1986 as other communist countries
and faced on different difficulties due to the inefficiency of the economic regime. The state
ownership was the only regime in the economy and the individual was not applied for, the
enterprises were belonged to the state. Then the investment or saving did not exist for
individuals or households. After 1986, Vietnam had a lot of difficulties (low productivity,
hyperinflation, high deficit and inefficiency of monetary policy); it required Vietnam to
reform the financial sector and to reduce the State’s investments in state-owned enterprises
and it forced the state to recognize the right for individuals and households to own assets.
And the privatization was launched to "equitize" the state-owned enterprises (SOEs). From
1989, the financial sector got a first trouble for financial institutions. There had been
thousands of newly founded credit cooperatives (around 7,180) but they had been shut down
rapidly resulting from their risky capital structure, their weak professionalism, and the
inappropriate monitoring from the authorities (Vuong, 2010). Then in 1993, the number of
credit cooperatives fell to around 750. Some credit cooperatives have been restructured and
became private and joint-stock commercial banks (JSCB). However, most of them were
unprofitable and accumulated non-performing loans granted to SOEs resulting from
inefficient investments (Pham and Vuong, 2009; Vuong, 2010).
In 2000, the stock exchange was established with two listed companies (the market
capitalization was VND 986 billion or 0.28%/GDP in 2000), and developed dramatically
during 2005-2007. But the stock market was dominated by the "equitized SOEs" on the
listing corporations due to a small number and small size of other types of corporations. In

TBU in Zlín, Faculty of Management and Economics 33
2017, the capitalization of Vietnamese stock exchanges are VND 2,765 thousand billion ($
120 billion- 60%/GDP). The figure 4 shows the capitalization of Vietnam's stock market
from 2010-2016 (in %GDP).
Figure 4: Capitalization of the stock market in Vietnam (%GDP)
Source: Author's calculation
After a decade of privatization, listed SOEs show that they are improving governance
capacity and financial transparency, more investors pay attention to listed firms on the stock
market. Besides that, the Vietnam's stock market forecasts to continue growing thanks to the
government's plans to expand the equitized program to other state-owned enterprises and
withdraw state capital from listed companies. Moreover, the foreign indirect investment (FII)
in 10 months of 2017 was surged 70% against 2016. Then Vietnam's financial markets will
enjoy more favorable conditions to attract investment in the future due to Vietnam's stable
economic growth and other contributions of other sectors can be improved and the
regulations for the financial markets can improve to be more transparency.
The figure 5 shows the stock market turnover ratio from 2010 to 2016, this illustrates
the total values of shares traded during the period on the average capitalization of the stock
market on the period (end of current period and previous period), it also presents the liquidity
of the whole stock market, it can be an opportunity to the state if the liquidity of shares is
39%
26% 26%
31% 31,50%34,50%
68,70%
0%
10%
20%
30%
40%
50%
60%
70%
80%
%GDP
2010
2011
2012
2013
2014
2015
2016

TBU in Zlín, Faculty of Management and Economics 34
high and the offer can attract more investors if the target corporation is having a great
potential growth.
Figure 5: Stock market turnover ratio on Vietnamese Stock market over
period 2010-2016
Source: Thegobaleconomy.com and Worldbank.org
In conclusion, the state can offer high ask prices for the withdrawn state capital plans
from the equitized SOEs in such the financial market conditions. Then the ask prices of
Vinamilk should be higher than the offer prices.
5.2 Dairy industry
With 60 million in 1986, Vietnam's population was about 94 million at the end 2016
(Worldbank, 2017) and is continued growing at a rate of 1.2% per annum. There is 70% of
the population under 35 year of age. The middle class is around 10% of the population and
expected to reach 26% by 2026 (Worldbank, 2017). It replies that the growth of Vietnam's
economy is steady and can have more opportunities to corporations thank to the high
proportion of the middle class. Besides that, the young population is an advantage for the
dairy industry since they are potential customers as well as the new born increasing due to
the new couples increasing. Moreover, the increase of middle class, the expose of the
quantity and disposal income, the consumption for quality food as well as for the children is
expected to continue to show high growth rate to year 2020. Changing the customers' habits

TBU in Zlín, Faculty of Management and Economics 35
Farm zone of Vinamilk
is expected to push up the demand of dairy products in Vietnam, especial for new product
categories such as yogurt and cheese.
The dairy industry in Vietnam has a dramatically compounded annual growth rate
(CAGR) at 16.6% and is valued at $4.1 billion of powdered and liquid milk - the two
products hold a large proportion of sold dairy products in Vietnam (EVB, 2016). While the
foreign producers provide 60-65% for the demand of powdered milk which imports a half
of sold products approximately.
The following table illustrates some key indicators of Vietnam from 2014 to 2020
(forecasted by Worldbank, 2017)
Table 2: Some indicators of Vietnam economy from 2014-2020F
Indicators 2015 2016 2017F 2018F 2019F 2020F
Real GDP (% change) 6.7 6.2 6.3 6.4 6.4 6.5
Unemployment rate (% of total labor force) 2.3 2/3 2.4 2.4 2.4 2.4
Consumer price index (% change, annual
average)
0.6 2.7 4.0 4.0 4.0 4.0
Export of good (% change) 7.9 9.0 9.0 9.5 9.9 10.1
Import of good (% change) 12.0 5.2 9.6 10.2 10.5 10.8
GDP (nominal, trillion dong) 4,193 4,503 4,987 5,517 6,095 6,747
Source: Worldbank (2017)
Although the dairy industry is recognized as a potential growth,
but there is about 30% of raw materials for dairy production that are
produced domestically. Consequently, it makes a high production cost
for drinking milk and other products (the prices are from VND25-
30,000/liter fresh milk or $1.3/liter approximately). The map shows the
dairy farm zones in Vietnam (source: Vietnam Dairy Association, 2016).
The farm zones are mostly established near the 2 hub of economics in
Vietnam (Hanoi and Hochiminh city). The increase of raw materials for
dairy production recently causes a reduce of the import of raw milk and
material for dairy production from New Zealand and other countries,

TBU in Zlín, Faculty of Management and Economics 36
more than 50% of Vietnam's import of dairy products come from New Zealand, USA and
Singapore, whereas European countries (Germany, France, Ireland, Netherland and Poland)
hold only 20-30%.
Table 3: Forecast growth rates of industry sales for milk products
Product 2018F 2019F 2020F
Condensed milk 4.0% 4.0% 3.0%
Liquid milk 10.0% 11.0% 10.0%
Powdered milk 10.0% 10.0% 9.0%
Drinking yoghurt 15.0% 12.0% 11.0%
Yoghurt (Spoonable) 12.0% 10.0% 10.0%
Whole industry 10.0% 10.1% 9.3%
Source: Hochiminh Securities Corporation (2016), Euromonitor International (2016) and
Vietnam Competition Authority (2016)
Based on the growth rates of industry sales, the sales for the whole industry are
estimated as:
Table 4: Sales of dairy products of the whole industry from 2018 to 2020
Product (million VND) 2018F 2019F 2020F
Condensed milk 5,453,058 5,562,119 5,673,362
Liquid milk 37,414,004 41,529,544 45,682,499
Powdered milk 22,794,636 25,074,100 27,330,769
Drinking yoghurt 5,434,654 6,086,813 6,756,362
Yoghurt (Spoon) 9,200,240 10,120,264 11,132,290
Total 80,296,594 88,372,842 96,575,283
Vietnam population
96,629,041
97,885,219
99,157,727
Per capita dairy consumption
(VND)
830,978
902,821
973,956
Per capita dairy consumption
(USD)
39.57
42.99
46.38
Source: Hochiminh Securities Corporation (2016)
According to the forecast of Hochiminh Securities Corporation (2016) on the sales
for the whole industry, assume that the market shares of Vinamilk are remained as previously
for 3 products: condensed, liquid milk and Yoghurt while the powdered milk and drinking
yoghurt will have a slight increase due to the past 3 year growth rates: the market share of
powdered milk changes from 40.60% in 2016, 41.50% in 2017, 41.70% in 2018 and 42% in
2019; the drinking yoghurt share is from 33.90% in 2016 to 38.70% in 2017, then the change
is slow down to 40% in 2020.
TBU in Zlín, Faculty of Management and Economics 37
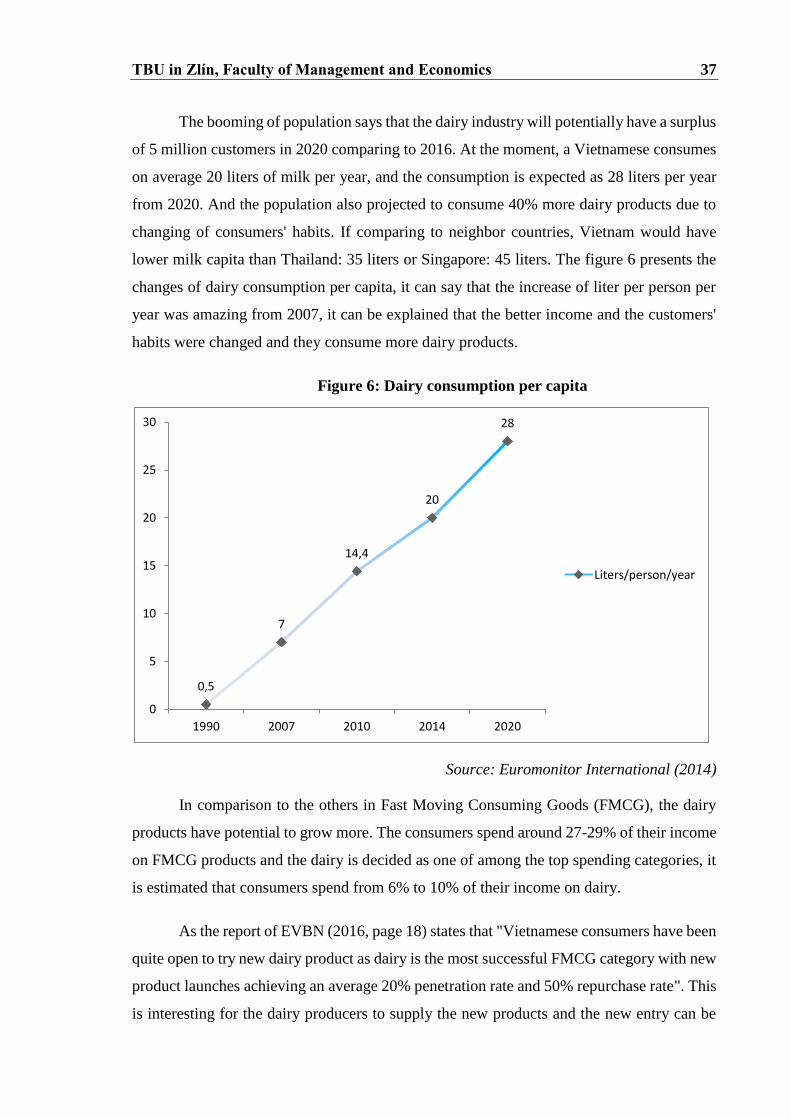
The booming of population says that the dairy industry will potentially have a surplus
of 5 million customers in 2020 comparing to 2016. At the moment, a Vietnamese consumes
on average 20 liters of milk per year, and the consumption is expected as 28 liters per year
from 2020. And the population also projected to consume 40% more dairy products due to
changing of consumers' habits. If comparing to neighbor countries, Vietnam would have
lower milk capita than Thailand: 35 liters or Singapore: 45 liters. The figure 6 presents the
changes of dairy consumption per capita, it can say that the increase of liter per person per
year was amazing from 2007, it can be explained that the better income and the customers'
habits were changed and they consume more dairy products.
Figure 6: Dairy consumption per capita
Source: Euromonitor International (2014)
In comparison to the others in Fast Moving Consuming Goods (FMCG), the dairy
products have potential to grow more. The consumers spend around 27-29% of their income
on FMCG products and the dairy is decided as one of among the top spending categories, it
is estimated that consumers spend from 6% to 10% of their income on dairy.
As the report of EVBN (2016, page 18) states that "Vietnamese consumers have been
quite open to try new dairy product as dairy is the most successful FMCG category with new
product launches achieving an average 20% penetration rate and 50% repurchase rate". This
is interesting for the dairy producers to supply the new products and the new entry can be
0,5
7
14,4
20
28
0
5
10
15
20
25
30
1990 2007 2010 2014 2020
Liters/person/year
TBU in Zlín, Faculty of Management and Economics 38
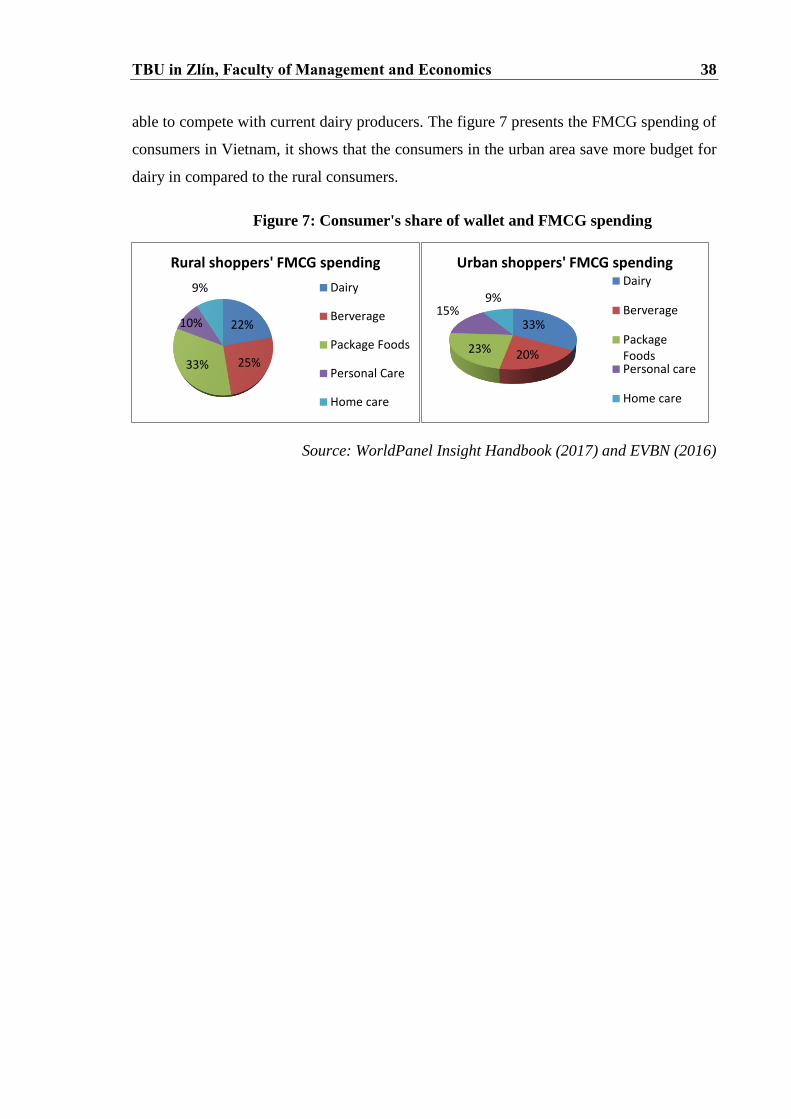
able to compete with current dairy producers. The figure 7 presents the FMCG spending of
consumers in Vietnam, it shows that the consumers in the urban area save more budget for
dairy in compared to the rural consumers.
Figure 7: Consumer's share of wallet and FMCG spending
Source: WorldPanel Insight Handbook (2017) and EVBN (2016)
22%
25%33%
10%
9%
Rural shoppers' FMCG spending
Dairy
Berverage
Package Foods
Personal Care
Home care
33%
20%23%
15%9%
Urban shoppers' FMCG spendingDairy
Berverage
PackageFoodsPersonal care
Home care
TBU in Zlín, Faculty of Management and Economics 39
6 VIETNAM DAIRY PRODUCTS JOINT STOCK COMPANY
PROFILE
Vinamilk was established on August 20 1976 on three dairy factories from the old
regime:
+ Thong Nhat Dairy Factory (formerly known as Foremost factory).
+ Truong Tho Dairy Factory (formerly known as Cosuvina factory).
+ Dielac Powdered Milk Factory (formerly known as Nestlé factory- Swiss).
After 1990s, Vinamilk was inaugurated some dairy factories and farms around
Vietnam. Then Vinamilk has made its investment in a company in New Zealand
manufacturing whole milk powder with a capacity of 32,000 tons per year in 2010.
Additionally, Vinamilk also invested in the United States and opened more factories in
several countries. At that time, the export revenue accounted for 15% of total revenue of
Vinamilk and increased overtime. With the capacities and the penetration into foreign
markets, Vinamilk reformed the company and applied modern production lines, established
Public Health Consultant Centers in the country and launched over 30 new products in the
same year to boost the sales.
In 2015, Vinamilk raised its stake in Miraka Limited Company in New Zealand from
19.3% to 22.8% and one year after, it officially launched its brand in Myanmar, Thailand
and expanded operations in ASEAN.
6.1 The position of Vinamilk in the dairy market
As mentioned in chapter I, the Vinamilk is a top 30 biggest corporations on the
Vietnamese stock market and the government still holds a large shares of the company.
Vinamilk is recognized as a potential company to be listed on the Singaporean Stock
Exchange where is believed to pay more attention of foreign investors. The government
wants to release their proportion of share but it was not successful due to a mispricing.
Vinamilk was attracted much foreign investors due to its dramatically growth. The
Vinamilk was listed on the Hochiminh Stock Exchange on January 19th 2006, the company
information was recognized as a rapid growth rate and there are foreign institutional
TBU in Zlín, Faculty of Management and Economics 40
investors at the listed day with 28.73% and the state-ownership was 50.01%, Although the
company was privatized and listed on the stock exchange, it still is under the government's
umbrella, it has more advantage than other competitors, Vinamilk had had more than 30%
of market share of the milk production over the period 2005-2010, and increased over 40%
from 2011 (Euromonitor, 2014, and Vinamilk annual reports from 2005 to 2016). Vinamilk
was recognized as a leading state-owned company to dominate the domestic milk production
market and it established subsidies through regions of the country, even-though there are
some competitors for different milk products (see table 5:
Table 5: Competitors of Vinamilk for main product lines in 2016
No. Product Competitors Country origin
1
Powdered Milk
Abbott United State
2 Mead Johnson United State
3 Fireslan Campina Netherland
4
Liquid milk
Fireslan Campina Netherland
5 IDP Love in Farm Vietnam
6 Fresh milk TH true Milk Vietnam
7 Condensed milk Fireslan Campina Netherland
8
Drinking Yaourt
IDP Love in Farm Vietnam
9 TH true Milk Vietnam
Source: http://cafef.vn3
6.2 Overall performance of Vinamilk
Vinamilk was succesful achieved an impressive revenue and profit growth in 2016:
the total revenue was VND 46,965 billion ($2.06 billion approximately) and the net profit
after tax was VND 9,364 billion ($412 million approximately). In comparison to the 2006,
one year after listed on Hochiminh Stock Exchange, there is a strong compound annual
growth rate of 22.3% - the total revenue in 2016 is seven-fold leap from the total revenue in
3 http://cafef.vn/vi-mo-dau-tu/ai-la-doi-thu-cua-vinamilk-p33r2016082102483895.chn

TBU in Zlín, Faculty of Management and Economics 41
2006. This illustrates that the Vinamilk achieves a good shape and maintains a high growth
rate in the industry. After 10 years listed, Vinamilk is diversified its products from two
product categories to 10 product categories to meet the market's diversified demand and
improves the quality to the international high-end quality to penetrate into developed
countries (United States and Europe). The company is also awarded a series of prestigious
prizes such as Vienam's Top 50 Best Listed Company by Forbes, Vietnam-ASEAN Best
Corporate Governance Award, Top 10 Sustainable Businesses in Vietnam 2016. Vinamilk
shows a high achievement after 13 years of equitization, the market capitalization of the
company grows from VND 1,500 billion in 2003 up to VND 182,303 billion at the end of
2016 ($8 billion approximately) or the change is 78.6 folds jump from the time of the
equitization in 2003. In the annual report 2016, Vinamilk shows that its cummulative average
growth rate (CAGR) for the period of 2012-2016 was 14.7% higher than 9% of the average
growth rate of the industry; the net profit after tax CAGR was 12.6%.
6.3 Ownership and organization
In the 2016 annual report, foreign investors are the main shareholders in which the
foreign shareholders are 53.9% of shares and the local shareholders are 46.91% (where the
State holds 39.33% of local shareholders). This says that the company is more attractive to
foreign investors thank to the potential and good corporate governance in comparison to
other listed corporations. Moreover, the company is one of pioneer companies to remove the
foreign ownership limit from July 2016 based on the circulation number 60/2015/ND-CP on
June 25th 2015 of the government to increase the foreign ownership from 49% to 100%
while others are remained the limit of foreign ownership to 49%. The remove of foreign
ownership send a strong commitment of the company to investors and that is a good signal
to the market value of the company on the stock market. The following diagram shows the
corporate model of Vinamilk

TBU in Zlín, Faculty of Management and Economics 42
Figure 8: Organization structure of Vinamilk
Source: Annual report (2016) and Vinamilk (2006)
parentheses: the proportion of ownership of Vinamilk in the subsidiaries and associates
6.4 Facts of Vinamilk from 2015-2017F
According to the financial statements, Vinamilk has a good growth rate for the
domestic sales that generates a good result for the company in 2016 and the table 6 shows
VIETNAM DAIRY PRODUCT JSC
PRODUCTION AND LOGISTIC
13 factories in the North, Central and South of Vietnam
3 sales offices in Hanoi, Danang and
Can Tho city
2 logistics enterprises in Hochiminh city and
Hanoi
1 representative office in Thailand
DOMESTIC SUBSIDIARIES AND
ASSOCIATES
Vietnam Dairay Cow One Member Co., Ltd.
(100%)
Lam Son Dairy One Member Co., Ltd
(100%)
Thong Nhat Thanh Hoa Dairy Cow One
Member Co., Ltd (96.11%)
Asia Saigon Food Ingredients JSC (15%)
APIS JSC (18%)
OVERSEAS SUBSIDIARIES AND
ASSOCIATES
Driftwood Dairy Holdings Corporation
(100%)
Vinamilk Europe Spostka z Ograniczona Odpowiedzialnoscia
(100%)
Angkor Dairy Products Co., Ltd (100%)
Mirake Limited (22.81%)
TBU in Zlín, Faculty of Management and Economics 43
the sales growth rates of Vinamilk for each production line in both domestic market and
export.
Table 6: Growth rates of Vinamilk over the period 2015-2017F
Sales growth 2015 2016 2017F4
Domestic 9.79% 18.46% 13.29%
Condensed milk 1.87% 11.38% -8.01%
Liquid milk 19.87% 17.11% 15.34%
Powdered milk 7.21% 13.36% 13.46%
Drinking yoghurt 27.95% 30.14%
Yoghurt (spoon yoghurt) 12.97% 0.95% 21.56%
Other products (soy milk, ice
cream, cheese, soft drinks) 7.00%
Export 78.22% 9.03% -10.00%
Powdered milk 78.20% 9.03% -10.00%
Condensed milk 78.20% 9.03% -10.00%
Yoghurt (spoon yoghurt) 78.20% 9.03% -10.00%
Domestic +export sales growth 16.06% 17.13% 10.24%
Oversea subsidiaries sales
growth -2.83% 11.34% 7.47%
Total sales growth 16.75% 10.07%
Price growth 4.65% -5.59% 3.00%
4 As above information, Vinamilk discloses its information in the annual report clearly and
the accounting statements (balance sheet, income and statement of cash flows) are available
from 2005. Moreover, the industry has available information in English about the
competitors and consumers that can support to the projection of the Vinamilk's cash flows.
Then the thesis employs all the yearly audited data from 2005 to June 2017 to make a forecast
for the whole 2017 since the information is available for the 3rd quarter in the stock market
(the official audit reports).

TBU in Zlín, Faculty of Management and Economics 44
Volume growth 10.91% 23.66% 6.86%
Source: Author's calculation
Even though the sales growth rates of each production line are slower than previous
years, but they are recognized higher than the average growth rates of the whole industry.
The dramatically growth of Vinamilk brings the company to become a leading company in
the sector i.e. market share of liquid milk reaches to 54.5%, drinking yogurt holds 33.9% of
market shares and the yogurt production takes 84.7% of the market shares. The figure 9 will
provide market shares for each product of the company.
Figure 9: Market shares of Vinamilk (by product)
Source: Annual reports (2015,2015) and the Hochiminh Securities Corporation, 2016
The above table illustrates that Vinamilk is playing as a key leader for the milk
productions in Vietnam in which the liquid milk, condensed milk and yoghurt are the leading
sales in the industry; consequently, the oversall market share of Vinamilk changes from 46%
in 2005 to over 55% in 2016 and 56% in 2017. The two lower market shares of Vinamilk
are the powdered milk and the drinking yoghurt due to a historic situation in this market
(especially for the baby under 6 years old). The foreign brand names were playing leading
roles in the market: the Friesland Campina, Abbott and Mead Johnson were recognized as
0,0%
10,0%
20,0%
30,0%
40,0%
50,0%
60,0%
70,0%
80,0%
90,0%
2015 2016 2017F
Condensed milk
Liquid milk
Powdered milk
Drinking yoghurt
Yoghurt (spoonble yoghurt)
Overall market share
TBU in Zlín, Faculty of Management and Economics 45
the strong competitors to Vinamilk and hold a large market share of those two products in
compared to Vinamilk.
6.5 The business strategy of Vinamilk
+ Continue to focus on the corporation's principal business activities such as
producing dairy products and expanded to new production category in healthy beverages.
+ Continue to strengthen and expand the distribution system by establishing
additional retail outlets and increasing coverage of distribution in Vietnam and oversea.
+ Invest in the expansion of factories in order to increase production capacity to meet
market needs for long-term development. The company will maximize the production
capacity of existing factories by investing and optimize in the construction of new factories
with the world’s most advanced technologies in order to maintain product quality in
accordance with international standards.
+ Invest in development of dairy material zones through the investing in increases of
cows on existing dairy farms and searching for and developing new domestic and overseas
dairy farms.
Based on the information of the whole dairy industry, the economic condition and
the Vinamilk background- it needs to find out some threats, opportunities, strengths and the
weaknesses of the corporation. The following diagram will illustrate the SWOT analysis
(Strength- Weaknesses- Opportunities- Threats) of Vinamilk. The SWOT analysis is focused
on analyzing some internal and external factors for the corporation's business, whereas the
Strengths are internal and positive elements of the corporation, the Weaknesses are the
internal and negative factors that the corporation is faced on. The external terms are threats
and opportunities. The corporation can analyze their strategy based on the combination of
each pair of SWOT to improve the corporation's business and position in the market.

TBU in Zlín, Faculty of Management and Economics 46
Figure 10: SWOT analysis
Source: Author's design
According to SWOT, the company can have some strategies as following:
+ Strength- Opportunity strategy: As a key player in the dairy market, Vinamilk can take in
advantage on its brand name explore the partners/factories covering the whole country and
increase the market shares by diversified products as well as the distribution channels.
+ Strength- Threat strategy: Continue sustainable development the trade mark and the
financial strength as well as focusing on the main products, which can help the corporation
compete to foreign and local competitors.
+ Weakness- Opportunity strategy: need to stabilize the raw materials resources by
increasing the cow farm as well as the loyalty of the suppliers.
+ Weakness- Threat strategy: reduce the imported raw materials and increase the high quality
products for the potential market that can save the cost of goods sales and improve
competitive in the market.
STRENGTHS
+ Good management with focus strategy.
+ Huge product range covers all base.
+ Loyality with local dairy farmers.
+ Reasonable prices
+ Strong brand name supported by proper attension to marketing and financial strength
WEAKNESSES
+ High dependence on imported raw meterials
+ Volatile raw materials prices.
OPPORTUNITIES
+ Vietnam dairy market still has promising outlook.
+ Per capita consumption of dairy products in Vietnam is very low compared to other Asian countries, rising incomes of Vietnames will lead to higher consumption.
THREATS
+ Tougher competition from both domestic rivals and multinationals.
TBU in Zlín, Faculty of Management and Economics 47
7 THE VALUATION OF VINAMILK
In this section, the thesis illustrates the process to collect the data and makes some
assumptions for the valuation and the valuation of Vinamilk is performed.
7.1 Estimation of the financial statements for the fiscal year 2017
In the first step, the industry information will be collected from the Euromonitor data
(access via the Hochiminh Securities Corporation)-HSC- at the access period, the thesis
cannot obtain the information about the milk industry report in 2017, then a forecast of the
market share is picked up from the Euromonitor drinking milk report in April 2014,
September 2016 and the quarterly report of Vietnam Competition Authority.
The data will be analyzed for the 1st and 2nd quarters and unaudited financial report
in the 3rd quarter then the fiscal year 2017 is predicted based on available information. Based
on the projection of Vinamilk for two subsidies in Cambodia (Angkor Dairy was acquired
all by Vinamilk in March 2017) and Driftwood in United States (Driftwood was a 100%
owned by Vinamilk in May 2016), the revenues of those two subsidies are collected by the
HSC reports on the acquisition plan of Vinamilk from 2016 to 2020 (in USD and convert to
Vietnamese dong-VND).
According to the Euromonitor International (2016), the forecast of the industry sales
and Vinamilk will be obtained as mentioned above. Then a projection for all income
statements from 2017-2020 will make. Then the projection will have a constant growth rate
after 2020. Thus calculations will be employed to obtain the needed information for the DCF
model and for valuation as mentioned in Chapter I.
7.2 Forecast of the Free Cash Flow to Firm (FCFF)
As mentioned in Chapter I, the thesis will employ the Adjusted model to the firm
valuation in which the DCF model forecasts future free cash flow to firm (FCFF) by looking
into each forecast fiscal year to find the WACC and discounting back to the present time
(period 0, or at the moment of this thesis- the year 2017). The reason to apply this method is
that the sales are expected differently year to year and there are some components might be
changing so if we only employ the historic growth rate as the theory is simplistic and can be
inaccurate, since FCFF is affected by many components as mentioned above.

TBU in Zlín, Faculty of Management and Economics 48
To estimate the financial statements from 2018-2020, the thesis employs the
calculation of Euromonitor International (2016) and Vietnam Competition Authority (VCA),
in which the estimated consumption for a Vietnamese is from 18 litter in 2015 to 28 litter
per year in 2020. From the estimations of Hochiminh city Securities Corporation (HSC), the
forecast of Euromonitor International (2016) and VCA, the growth rates of the milk industry
are shown as following table:
Table 7: Market shares of Vinamilk over 2018-2020
Product 2018F 2019F 2020F
Condensed milk 78.10% 78.10% 78.10%
Liquid milk 59.00% 58.70% 59.00%
Powdered milk 41.70% 42.00% 42.00%
Drinking yoghurt 39.50% 39.80% 40.00%
Yoghurt (spoon yoghurt) 83.50% 83.50% 83.50%
Overall market share 56.87% 56.72% 56.81%
Source: Author’s calculation
To calculate the sales/revenues of Vinamilk from 2018 to 2020, the following
formula will be applied:
Vinamilk's Domestic Sales= market share of each product x sales of the whole
industry for each product (10)
whereas: market share of each product is from the table 7 and sales of the whole
industry is come from the table 4.
From the table 7, we can see that the export holds a small proportion of the sales of
Vinamilk. Based on the disclosure and annual report in 2016, the Vinamilk expects that the
growth rates of export will be at 3% for each product till 2020. Then the Vinamilk's total
sales are the sum of domestic sales and export.
From the sales, assume that the price of raw fresh milk is similarly to the price in
2016 for the 4th quarter of 2017 and 2018F-2020F since the prices were unchangeable from
2015-2016. The prices of raw milk powdered are collected by a prediction of VCA (2017)
and the projection of Driftwood plans of Vinamilk. The sugar prices are collected from the
Vietnamese Sugar Association. Other prices such as packaging, favors and material prices
are assumed to be unchangeable.

TBU in Zlín, Faculty of Management and Economics 49
According to the Vinamilk profile and its disclosure, the thesis employs the
calculation of material costs which were calculated by HSC, this calculation is shown the
raw materials which Vinamilk developed via its own farms and the local farms.
The raw materials are calculated for the production cost (which is excluding the
Driftwood, since the Driftwood production cost was calculated by the Vinamilk) and the
thesis will combine two different production costs of the parent corporation and Driftwood
(see in the Appendix 2 - the raw material cost from 2015-2020F). Assume that all other costs
will be the same proportion as the proportion of sales in the fiscal year 2016 to predict from
2017 except the depreciation cost which is increased 5% in 2017 compared to 2016, so, the
thesis applies this growth rate to the changes of depreciation from 2018F-2020F, then the
percentage of depreciation to sales will be slightly reduced in 2019-2020 (see in the table 8).
The ratios of production cost are shown as:
Table 8: Cost of goods sold (parent company -excluding Driftwood)
Item 2015 2016 2017F 2018F 2019F 2020F
Raw materials/Sales 48.5% 42.3% 43.4% 42.9% 43.6% 45.3%
Labor cost/sales 1.70% 1.62% 1.70% 1.70% 1.70% 1.70%
Depreciation/sales 2.6% 1.8% 1.7% 1.7% 1.6% 1.6%
Outsourcing cost/sales 1.46% 1.58% 1.58% 1.58% 1.58% 1.58%
Other cost/sales 0.30% 0.14% 0.14% 0.14% 0.14% 0.14%
Source: Author’s calculation
The sales and general administration expenses are calculated as same as the cost of
goods sold. Based on the ratios of each item, assume that the growth rates of each item over
the cost of goods sold and the sales are remained as same as before, then the estimated item
can be obtained. According to the costs and expenses are estimated as above, the investment
and the depreciation need to obtain via the 5 year plan of the corporation, the author cannot
find any new investment for the cow farm or factory next to 5 years. For two subsidies-
Driftwood and Angkor Dairy- all information is collected from the disclosure of Vinamilk
sent to the shareholders to obtain their approval.
TBU in Zlín, Faculty of Management and Economics 50
The last item in the table 8, Gross margin, is the result based on the following
formula:
Gross margin= 100%-(cost of goods sold/sales) (11)
where the cost of goods sold/sakes= COGS/sales in the table 8
The table 9 shows the ratios of each item of the sales and general administration
expenses.
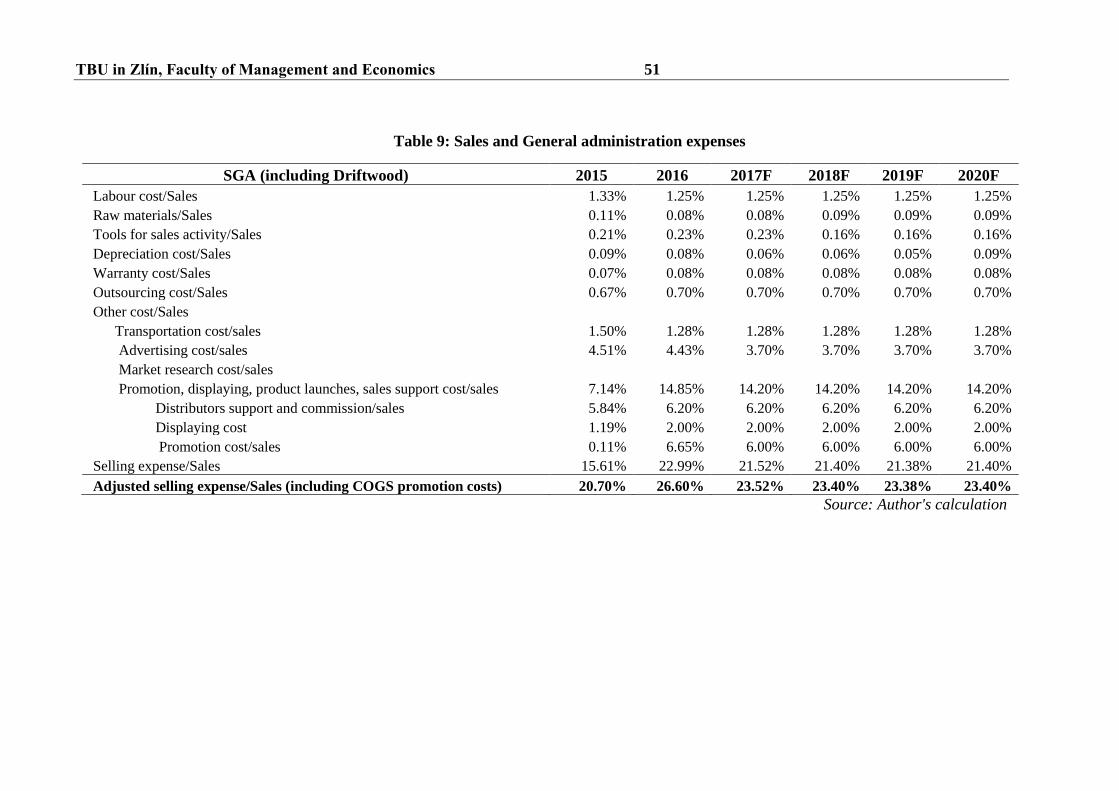
TBU in Zlín, Faculty of Management and Economics 51
Table 9: Sales and General administration expenses
SGA (including Driftwood) 2015 2016 2017F 2018F 2019F 2020F
Labour cost/Sales 1.33% 1.25% 1.25% 1.25% 1.25% 1.25%
Raw materials/Sales 0.11% 0.08% 0.08% 0.09% 0.09% 0.09%
Tools for sales activity/Sales 0.21% 0.23% 0.23% 0.16% 0.16% 0.16%
Depreciation cost/Sales 0.09% 0.08% 0.06% 0.06% 0.05% 0.09%
Warranty cost/Sales 0.07% 0.08% 0.08% 0.08% 0.08% 0.08%
Outsourcing cost/Sales 0.67% 0.70% 0.70% 0.70% 0.70% 0.70%
Other cost/Sales
Transportation cost/sales 1.50% 1.28% 1.28% 1.28% 1.28% 1.28%
Advertising cost/sales 4.51% 4.43% 3.70% 3.70% 3.70% 3.70%
Market research cost/sales
Promotion, displaying, product launches, sales support cost/sales 7.14% 14.85% 14.20% 14.20% 14.20% 14.20%
Distributors support and commission/sales 5.84% 6.20% 6.20% 6.20% 6.20% 6.20%
Displaying cost 1.19% 2.00% 2.00% 2.00% 2.00% 2.00%
Promotion cost/sales 0.11% 6.65% 6.00% 6.00% 6.00% 6.00%
Selling expense/Sales 15.61% 22.99% 21.52% 21.40% 21.38% 21.40%
Adjusted selling expense/Sales (including COGS promotion costs) 20.70% 26.60% 23.52% 23.40% 23.38% 23.40%
Source: Author's calculation

TBU in Zlín, Faculty of Management and Economics 52
From the item of the gross margin in the table 8, the thesis assumes that gross margins
of each items will be the same rates with the rate in 2016 except the condensed milk since
we do not have much information about the producing process and the costs for this product.
Then the gross margin for the condensed milk will be formula as:
Gross margin of condensed milk= Gross margin overall- gross margin (liquid,
powdered milk, Yoghurt and other products) (12)
whereas the Gross margin overall= gross margin in the table 8.
gross margin (liquid, powdered milk, Yoghurt and other products): the similar margin
as in the FY2016.
Then we have the table 10 for the gross margin which is breakdown by product
categories.
Table 10: Gross margin of Vinamilk from 205-2020F- breakdown by product
categories
Gross margin 2015 2016 2017 2018 2019 2020
Domestic 34.0% 35.2% 35.7% 36.2% 36.8% 37.5%
Condensed milk 25.5% 30.4% 36.3% 43.3% 51.6% 61.6%
Liquid milk 34.0% 34.7% 34.7% 34.7% 34.7% 34.7%
Powdered milk 38.4% 39.1% 39.1% 39.1% 39.1% 39.1%
Yoghurt 41.8% 42.5% 42.5% 42.5% 42.5% 42.5%
Other products 38.7% 39.3% 39.3% 39.3% 39.3% 39.3%
Export 20.2% 20.2% 20.2% 20.2% 20.2% 20.2%
Overall gross margin 40.7% 48.6% 49.4% 49.9% 49.2% 47.6%
Source: Author's calculation
Resulting from the margins stated in the table 10, the next step is to take the sales
which are calculated from the table 7 with the total sales of the whole industry (see in the
Appendix 1 for the sales of Vinamilk based on the market shares) to calculate the "Gross
Profit" for the firms. From above proportions of costs/expenses to sales, we have a financial
statement as following:
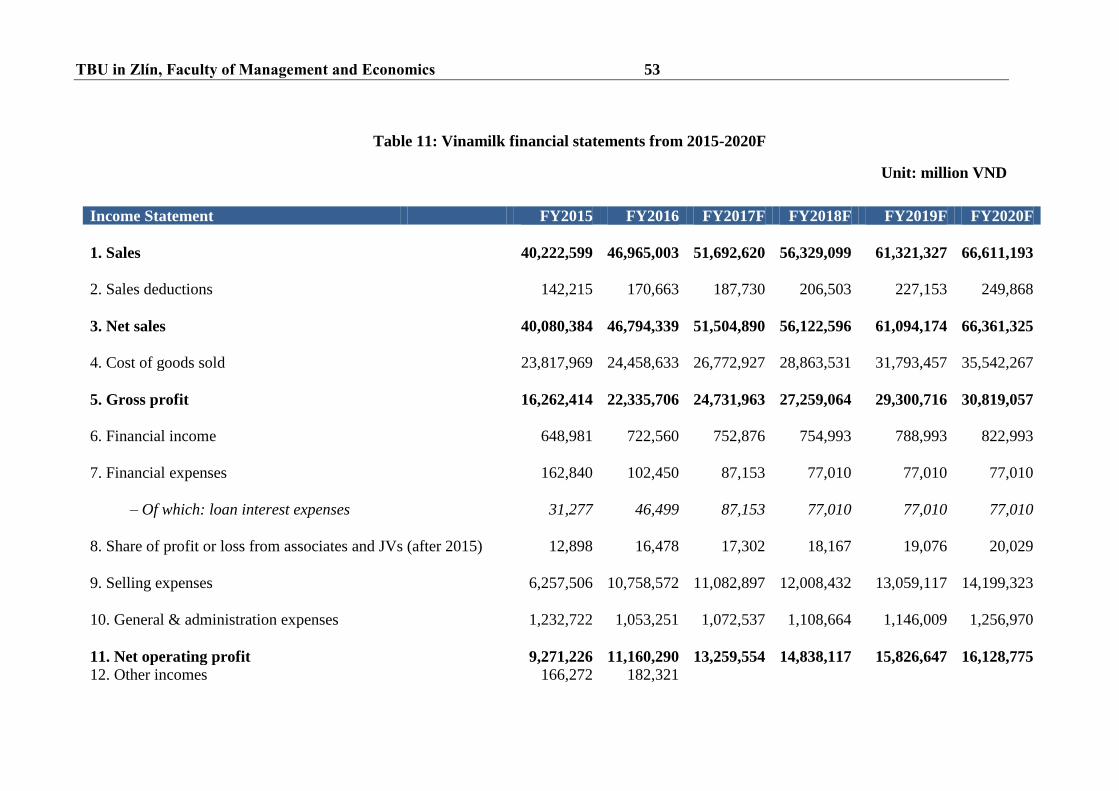
TBU in Zlín, Faculty of Management and Economics 53
Table 11: Vinamilk financial statements from 2015-2020F
Unit: million VND
Income Statement FY2015 FY2016 FY2017F FY2018F FY2019F FY2020F
1. Sales
40,222,599
46,965,003
51,692,620
56,329,099
61,321,327
66,611,193
2. Sales deductions
142,215
170,663
187,730
206,503
227,153
249,868
3. Net sales
40,080,384
46,794,339
51,504,890
56,122,596
61,094,174
66,361,325
4. Cost of goods sold
23,817,969
24,458,633
26,772,927
28,863,531
31,793,457
35,542,267
5. Gross profit
16,262,414
22,335,706
24,731,963
27,259,064
29,300,716
30,819,057
6. Financial income
648,981
722,560
752,876
754,993
788,993
822,993
7. Financial expenses
162,840
102,450
87,153
77,010
77,010
77,010
– Of which: loan interest expenses
31,277
46,499
87,153
77,010
77,010
77,010
8. Share of profit or loss from associates and JVs (after 2015)
12,898
16,478
17,302
18,167
19,076
20,029
9. Selling expenses
6,257,506
10,758,572
11,082,897
12,008,432
13,059,117
14,199,323
10. General & administration expenses
1,232,722
1,053,251
1,072,537
1,108,664
1,146,009
1,256,970
11. Net operating profit
9,271,226
11,160,290
13,259,554
14,838,117
15,826,647
16,128,775
12. Other incomes 166,272 182,321
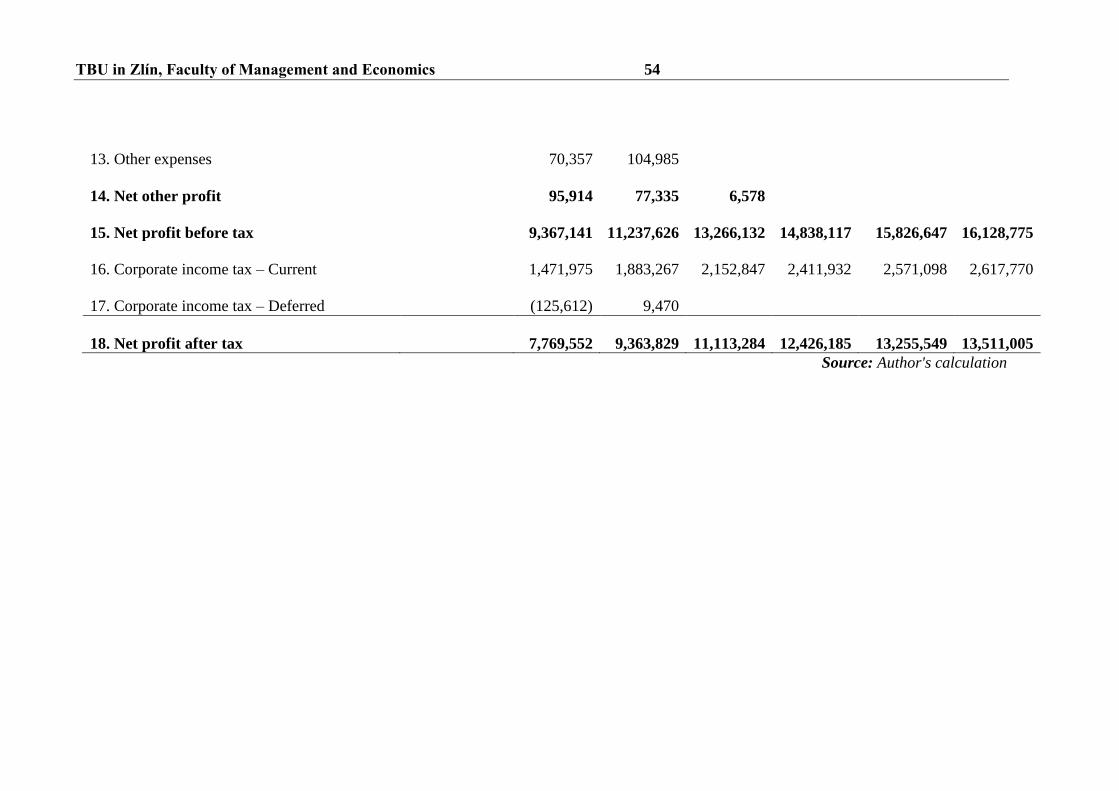
TBU in Zlín, Faculty of Management and Economics 54
13. Other expenses
70,357
104,985
14. Net other profit
95,914
77,335
6,578
15. Net profit before tax
9,367,141
11,237,626
13,266,132
14,838,117
15,826,647
16,128,775
16. Corporate income tax – Current
1,471,975
1,883,267
2,152,847
2,411,932
2,571,098
2,617,770
17. Corporate income tax – Deferred
(125,612)
9,470
18. Net profit after tax
7,769,552
9,363,829
11,113,284
12,426,185
13,255,549
13,511,005
Source: Author's calculation
TBU in Zlín, Faculty of Management and Economics 55
Because of the missing information on the other income and expenses, so the thesis
omits the items during2017F-2020F.
The financial income is not available in the plans of Driftwood and Angkor Dairy,
this item is picked up from the deposit interest income and lending interest income, plus the
income from bond investment. Those investments are provided by the HSC (2016) based on
the Vinamilk information. Similarly to the financial income, the financial expenses are from
the interest expenses, commission fee for stock brokers, losses on realized forex different,
or losses on equity investment or provision for short/long term investment, other financial.
Vinamilk depends mostly on the imported raw materials, so the fluctuation of foreign
exchange rates can be a risk to the performance of corporation, so on the imported raw
materials is estimated as $270 thousand, the State Bank of Vietnam has adjusted the
exchange rate to 2% in 2017 and it happens to the half year, so the thesis assumes that the
need of imported values is the same from year to year over 2018F-202F, then Vinamilk will
lose from the fluctuate of exchange rates 50% with the proportion at 2%, the exchange rate
at the end October 2017 is VND/USA= 23,025. From this estimation, the financial income
and expense will be added as financial items for Vinamilk. Some deposit, interest rates or
dividend etc. are remained the same as the FY2017 (see in the Appendix 3).
Next stage is to prepare to calculate the Free Cash Flow to Firm. As mentioned in
Chapter I, the thesis will employ the Adjusted model to the firm valuation in which the DCF
model forecasts future free cash flow to firm (FCFF) by looking into each forecast fiscal
year to find the WACC and discounting back to the present time (period 0, or at the moment
of this thesis- the year 2017). The reason to apply this method is that the sales are expected
differently year to year and there are some components might be changing so if we only
employ the historic growth rate as the theory is simplistic and can be inaccurate, since FCFF
is affected by many components as mentioned above.
The process to obtain FCFF, the thesis will employ the the EBIT as mentioned in
Chapter I, then the basic FCFF can be get by the following equation (Damodaran, 1994) and
the figure 3 in Chapter I.
FCFF= EBIT x (1-Tax rate)+ Depreciation- Change in Net Working Capital -
Capital Expenditures
TBU in Zlín, Faculty of Management and Economics 56
* EBIT: Since the calculation of FCFF begins from the EBIT, it needs to look back
into the profit and loss statements to forecast the EBIT for the each year ahead, it is basically
to start in sales and other items in P&L statements, since it needs to calculate the consolidate
income statement, then it needs to come from the net income (net profit after tax) to reverse
back to the EBIT by adding the interest rates after tax, then we have the EBIT after tax.
FCFF=Net income+[interest expense*(1-tax)]+ depreciation- Change in Net
Working Capital - Capital Expenditures (13)
whereas the EBIT*(1-tax)= Net income+[interest expense*(1-tax)]
To fulfill the formula (13), all estimations are explained as:
+ Net income (or net profit after interest and taxes) is from the table 11, then adds
the after tax expenses.
+ Other items in the Profit and loss (P&L) statement such as cost of goods sold,
financial income and expense are predicted by the contribution of subsidies such labor
costs, capacities of production; investments (see more detail in the appendices 3 and 4).
Other income and other expense are not present in 2017, so the thesis will exclude them from
2017 to 2020. Net other profit was recorded in the 2nd quarter, there is no clue to assume a
growth rate since this item was decreased year to year, then it will be omitted from 2018. All
the items in the Profit and loss statements are illustrated in the table 11.
* Tax: The effective tax rate assumes that will not change then the corporate income
tax rate is applied from 2016 (16%- with the support from the government for agricultural
productions). There is no information about corporate income tax deferred in 2017 so this
item also is dropped off from 2017.
* Depreciation and amortization: the depreciation is employed from the annual
report in 2016 without changing since to the end of September 2017, there is no new
informed investment.
* Change in Net Working Capital (∆NWC): Since the average growth rate of sales
is over 9% approximately, so it assumes that the Net Working Capital has a growth rate at
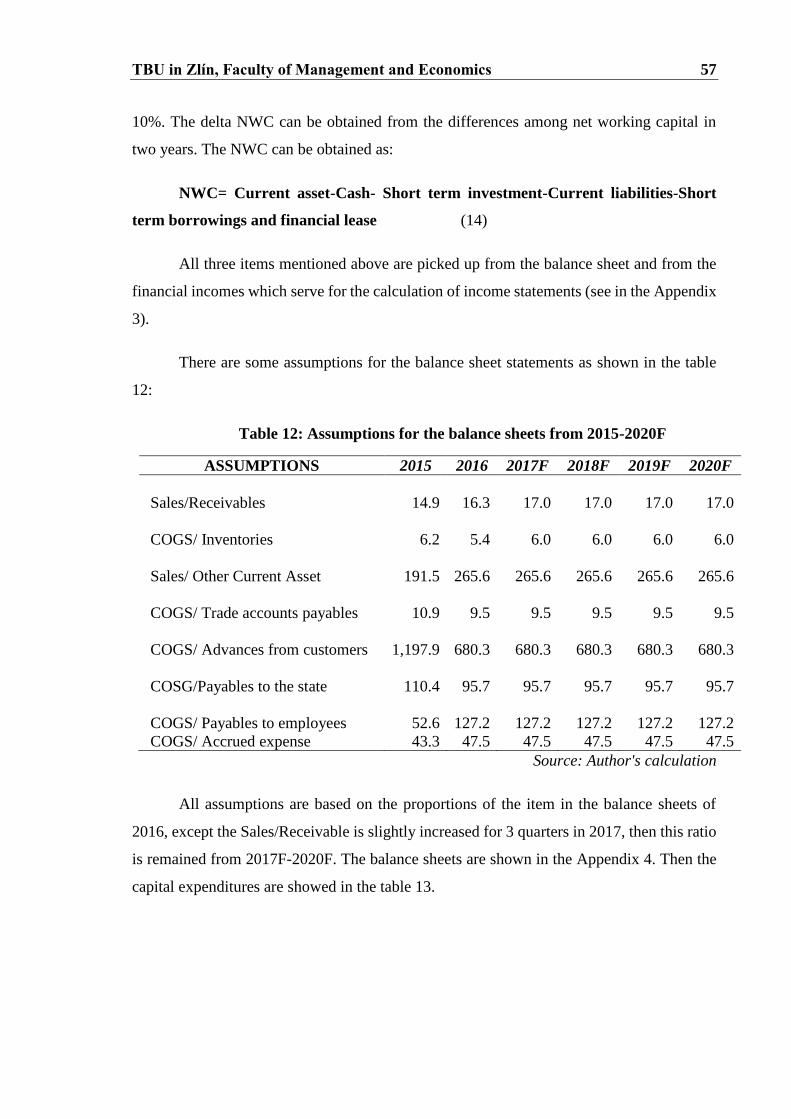
TBU in Zlín, Faculty of Management and Economics 57
10%. The delta NWC can be obtained from the differences among net working capital in
two years. The NWC can be obtained as:
NWC= Current asset-Cash- Short term investment-Current liabilities-Short
term borrowings and financial lease (14)
All three items mentioned above are picked up from the balance sheet and from the
financial incomes which serve for the calculation of income statements (see in the Appendix
3).
There are some assumptions for the balance sheet statements as shown in the table
12:
Table 12: Assumptions for the balance sheets from 2015-2020F
ASSUMPTIONS 2015 2016 2017F 2018F 2019F 2020F
Sales/Receivables
14.9
16.3
17.0
17.0
17.0
17.0
COGS/ Inventories
6.2
5.4
6.0
6.0
6.0
6.0
Sales/ Other Current Asset
191.5
265.6
265.6
265.6
265.6
265.6
COGS/ Trade accounts payables
10.9
9.5
9.5
9.5
9.5
9.5
COGS/ Advances from customers
1,197.9
680.3
680.3
680.3
680.3
680.3
COSG/Payables to the state
110.4
95.7
95.7
95.7
95.7
95.7
COGS/ Payables to employees
52.6
127.2
127.2
127.2
127.2
127.2
COGS/ Accrued expense 43.3 47.5 47.5 47.5 47.5 47.5
Source: Author's calculation
All assumptions are based on the proportions of the item in the balance sheets of
2016, except the Sales/Receivable is slightly increased for 3 quarters in 2017, then this ratio
is remained from 2017F-2020F. The balance sheets are shown in the Appendix 4. Then the
capital expenditures are showed in the table 13.

TBU in Zlín, Faculty of Management and Economics 58
Table 13: Assumptions for the balance sheets from 2015-2020F
Unit: million VND
2015 2016 2017F 2018F 2019F 2020F
Working capital
(774,860)
(225,508)
(287,577)
(23,702)
273,365
600,407
Change in working
capital ((∆NWC)
(568,543)
549,351
(62,068)
263,875
297,067
327,042
Source: Author's calculation
* Net Capital Expenditures (capex): This is calculating from changes of the costs
on fixed assets and the long-term asset in progress. Under the corporation's announcements,
from 2017-2020, there are expenditures need to provides for material supply (cow and
farms). The net capital expenditures are the different the investment between two years for:
the cost of the tangible assets, cost of intangible assets, the construction cost of long-term
assets in progress and the investment in joint-ventures and associates. All items are listed in
the table 14.
Table 14: Net Capital Expenditures from 2015-2020F
Unit: Million VND
2015 2016 2017F 2018F 2019F 2020F Cost of the
tangible assets
13,059,721
14,257,738
15,250,850
18,250,850
21,250,850
24,050,850
Cost of the
intangible assets
553,684
557,891
557,891
557,891
557,891
557,891
Construction cost
of long-term
assets in progress
(after 2015)
761,285
865,440
3,000,000
3,000,000
2,800,000
2,800,000
Investments in
joint ventures and
associates
397,130
419,909
428,560
437,644
447,182
457,197
Net Capital
Expenditures
(1,329,158)
(3,136,323)
(3,009,084)
(2,809,538)
(2,810,015)
Source: Author's calculation
From the information obtained in the previous parts, the FCFF is built, since the FCFF is
from 2017F-2020F, we need to choose the terminal period to estimate the potential development
of the corporation. Since the thesis constructs to the fiscal year 2020, then it is necessary to have
a value of FCFF after that.
Damoradan (2012) shows that a firm valuation needs to have a termination and the
terminal value can be depending on the potential of firms. In the valuation of Vinamilk, there

TBU in Zlín, Faculty of Management and Economics 59
are assumptions that the dairy market will be more competitive since customers are easy to
go for new products and potential due to an increasing customer base.
The young population and the improving wealthy of the middle class are motivated
to new entries to penetrate into the market, especially for foreign investors- they can take in
advance for some modern categories in Vietnam such cheese, yoghurt etc. Moreover, from
2018, there is a release for the taxation barrier to zero in ASEAN and the ASEAN Australia
New Zealand Free Trade Area (AANFTA) for the agricultural productions, the competition
is intense and the growth rate is forecast at over 9% for the industry but the Vinamilk is a
leading in the industry and always has higher growth rate in the past (around 14%-
Euromonitor International, 2016). Additionally, there are more imported dairy products
penetrated into Vietnam's market. Consequently, Vinamilk can be influenced then the
growth rate of Vinamilk reduces. The thesis assumes that the growth rate of FCFF after 2020
will be 7%- since the average growth rate of FCFF over the period 2015-2020F is 6.6%, but
the Vinamilk is playing as a key player in the dairy market and it is continuing expanding
the domestic and international market, it can benefit from their investments after that then
the thesis adjusts the rate to 7% of average growth per year after 2020 instead of the forecast
of 9% for the whole industry or the average of 6.6% over the period 2015-2017F.
Based on the Gordon Growth Model, the value of the cash flow with a constant
growth rate is
𝑃2020𝐹 =𝐹𝐶𝐹𝐹2021𝐹
𝑅−𝑔 (15)
whereas: 𝑃2020𝐹: value of the terminal of the FCFF in 2020F.
FCFF2021F: the forecast of FCFF in 2012 which FCFF2012F= FCFF2012F*(1+0.07)
R: is WACC of the corporation.; g: growth rate of FCFF after 2020 (7%).
7.3 Weighted Average Cost of Capital (WACC)
The WACC is formulated at the equation (2), in which the thesis has some
assumptions such as:
* Debt: the debts are collected from the short-term payables, short-term borrowing and
financial lease plus other long term payables. In the fiscal year 2017, the debt is collected

TBU in Zlín, Faculty of Management and Economics 60
from the provision to semi-annual report of Vinamilk and adjusted with the ratio that is
explained for the fiscal year 2018. From 2018, the thesis assume that the ratio of Cost of
goods sold to Other short term payables and to Long-term trade payables are the same to the
ratio in 2016 and 2017.
* Equity: this item is assumed that does not change over next three years.
* Cost of debt: since the company is a state-owned company and working in the agricultural
sector, it can access attractive loans from the government and the Vietnam Development
Bank with low interest rate at 5.1% per year. The interest rate is the same in 2015, 2016 and
2017 (to the semi-annual report), then we assume that it will not change from 2018-2020.
* Cost of equity: from the equation (3), the CAPM can capture the investors' expectation on
required return rate, in which the risk free rate is collected from the 10 years treasury bond
in Hanoi Stock Exchange, the beta is not available, but it can obtain from some securities
corporations or estimate by using the historic stock price, where the market required returns
are the index of VN30 (the 30 blue-chip stocks in Vietnam Stock Market). The obtained beta
is 0.75 for Vinamilk. While the expected return of VN30 in the fiscal year 2017 is 15%.
Then the cost of equity is calculated from the capital asset pricing model (CAPM) as:
Cost of equity= risk free rate+ Beta*(market rate of return - risk free rate)
+ The risk free rate here is employed by the rate that the government provides to the
agricultural sector instead of the Treasury bond rate. It is as mentioned above: 5.1% per year.
+ From previous projection for debts and the equity, we assume the market value will be the
same for the period 2018F-2020F. From the balance sheets (Appendix 4), the market value
of debts and market value of equity are assumed being the same with the projection. Then
we can the following table (see in the table 15).
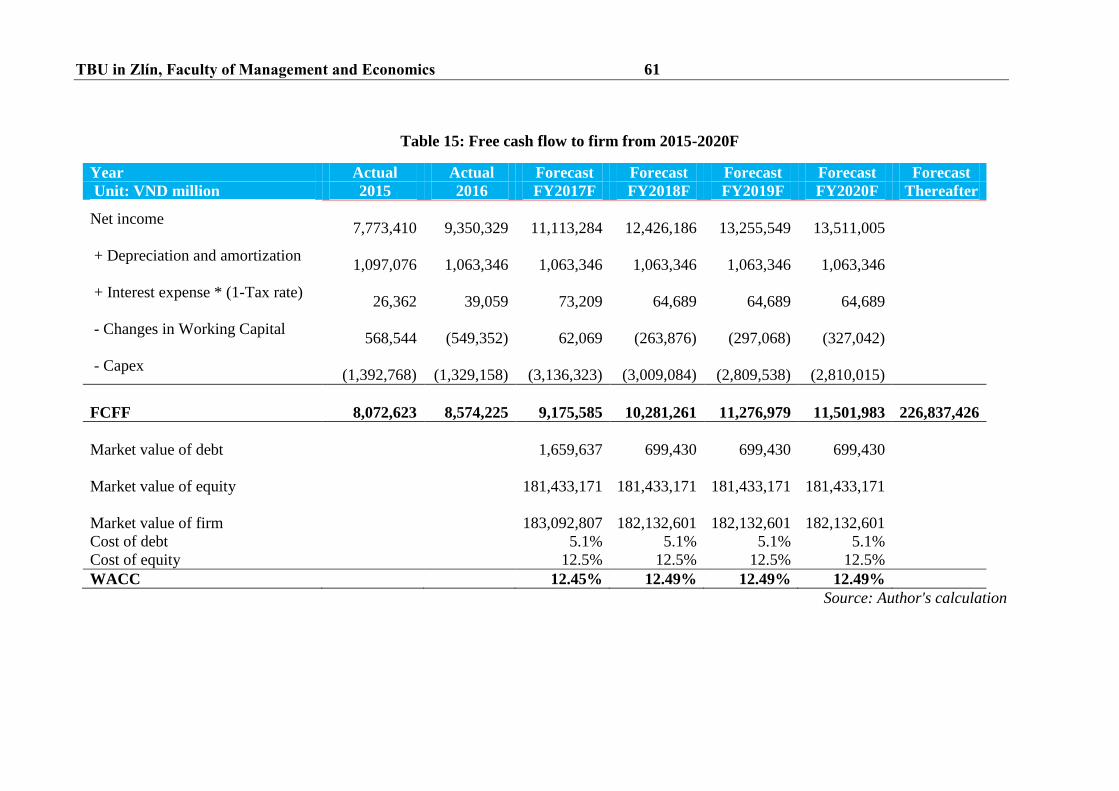
TBU in Zlín, Faculty of Management and Economics 61
Table 15: Free cash flow to firm from 2015-2020F
Year Actual Actual Forecast Forecast Forecast Forecast Forecast
Unit: VND million 2015 2016 FY2017F FY2018F FY2019F FY2020F Thereafter
Net income
7,773,410
9,350,329
11,113,284
12,426,186
13,255,549
13,511,005
+ Depreciation and amortization
1,097,076
1,063,346
1,063,346
1,063,346
1,063,346
1,063,346
+ Interest expense * (1-Tax rate)
26,362
39,059
73,209
64,689
64,689
64,689
- Changes in Working Capital
568,544
(549,352)
62,069
(263,876)
(297,068)
(327,042)
- Capex
(1,392,768)
(1,329,158)
(3,136,323)
(3,009,084)
(2,809,538)
(2,810,015)
FCFF
8,072,623
8,574,225
9,175,585
10,281,261
11,276,979
11,501,983
226,837,426
Market value of debt
1,659,637
699,430
699,430
699,430
Market value of equity
181,433,171
181,433,171
181,433,171
181,433,171
Market value of firm
183,092,807
182,132,601
182,132,601
182,132,601
Cost of debt 5.1% 5.1% 5.1% 5.1%
Cost of equity 12.5% 12.5% 12.5% 12.5%
WACC 12.45% 12.49% 12.49% 12.49%
Source: Author's calculation
TBU in Zlín, Faculty of Management and Economics 62
The market value of debts is picked up from the Appendix 4, due to a reduce of debts
in 2018 as the corporation's schedule. The forecast of FCFF after 2020 follows the argument
in section 7.2 by using the Gordon Growth model. The WACC in 2017F is 12.45% due to a
reduction of the proportion of debts in the capital structure. The next section will show the
valuation and the comparison of the value of DCF method and the forward P/E and the
forward EV/EBITDA as mentioned in the chapter I.
7.4 Value of the target corporation- Vinamilk
As the DCF model description, the FCFF will be employed to valuation a firm, in
which the process is using the WACC to discount the FCFF to the end of the fiscal year
2017. Since the WACC is different between 2017F and 2018F-2020F and after that, then the
thesis assumes the fiscal year 2017F is year 0 (since the valuation process in Octorber 2010),
then the discounted rate is WACC from 2018F-2020F. Then the present value of FCFF is:
𝑃𝐹𝐶𝐹𝐹 = 𝐹𝐶𝐹𝐹2017 +𝐹𝐶𝐹𝐹2018𝐹
(1+𝑊𝐴𝐶𝐶2018−2020)+
𝐹𝐶𝐹𝐹2019𝐹
(1+𝑊𝐴𝐶𝐶2018−2020)2+
𝐹𝐶𝐹𝐹2020𝐹+𝑃2020𝐹
(1+𝑊𝐴𝐶𝐶2018−2020)3
(16)
whereas: FCFF2017: the free cash flow to firm in 2017.
FCFF2018F...2020F: the free cash flow to firm in each forescast fiscal year from 2018F-2020F.
P2020F: the value of terminal value in 2020 as mentioned in the section 7.2 (equation 10).
Based on the equation (16) and the table 15, the value of the free cash flow to firm is
PFCFF= 176,953,648 million VND
To calculate the ECF (Equity cash flow), it needs to employ the equation (5). then in
the table 15, we have the market value of debt in FY2017, it assumes that this will need to
pay back and takes the cash 2017 and the cash and bank deposit in the balance sheets- it re.
So, according to the equation (5), the equation can be rewritten as:
ECF2017= FCFF-Debt2017+Cash and Bank deposit2017 (17)
Then the equity value of Vinamilk:
ECF2017= 185,755,850 million VND
According to Vinamilk, the number of outstanding shares is 1,451,465,364 shares. Then the
value of each share is:
TBU in Zlín, Faculty of Management and Economics 63
Pshare2017F=ECF2017/Number of outstanding shares2017 (18)
=> Pshare2017F=127,978 dong/share
or it can be expressed that the value of each share at the end of 2017 is 127,978 dong (or
VND) per share. This price of a share of Vinamilk is calculated based on the projection
above. In compared to the ask price for the offer which is based on the plan of the
government, the value of a share is 127,978 dong based on the available information on the
stock market, there is a large gap among the valuation based on the market information and
the ask price. While the market price is 151.000 dong per share (at the end of October 31th
2017) seems to close to the ask price of the offer. It can explain that the market price of
Vinamilk is affected by the hot trend on the stock market since the stock market is estimated
to grow 30% in 2017 and Vinamilk is recognized as a blue-chip on the stock market then
investors expect to have higher value in the near future.
As in the chapter I mentioned, each valuation method can generate different value of
the firm. Moreover, the available information to the valuation process also can make a
different. The thesis also would like to employ the forward P/E and forward EV/EBITDA to
calculate the value of Vinamilk's shares and then comparing to the DCF method.
Valuation based on the Forward P/E and Forward EV/EBITDA:
In the chapter I, the Forward P/E and Forward EV/EBITDA are preferred to compare
in the industry/sector and will employ the equation (8) and (9). To do so, the thesis focuses
on some dairy corporations in the ASEAN region. Vinamilk is recognized as a leading dairy
company in Vietnam and it has a large capital in compared to other dairy corporations in the
region as the rating of Forbes, so the thesis chooses 6 corporations which have a large capital
(around $1 billion or larger), there is a dairy corporation in Indonesia having the capital less
than $1 billion, but it has a good achievement with the high rate of growth with two digits.
It could be a combination to compare to Vinamilk. The following table illustrates the
calculation of forward P/E and forward EV/EDITDA (The Appendix 4 shows the multiples
of the compared corporations and Vinamilk).
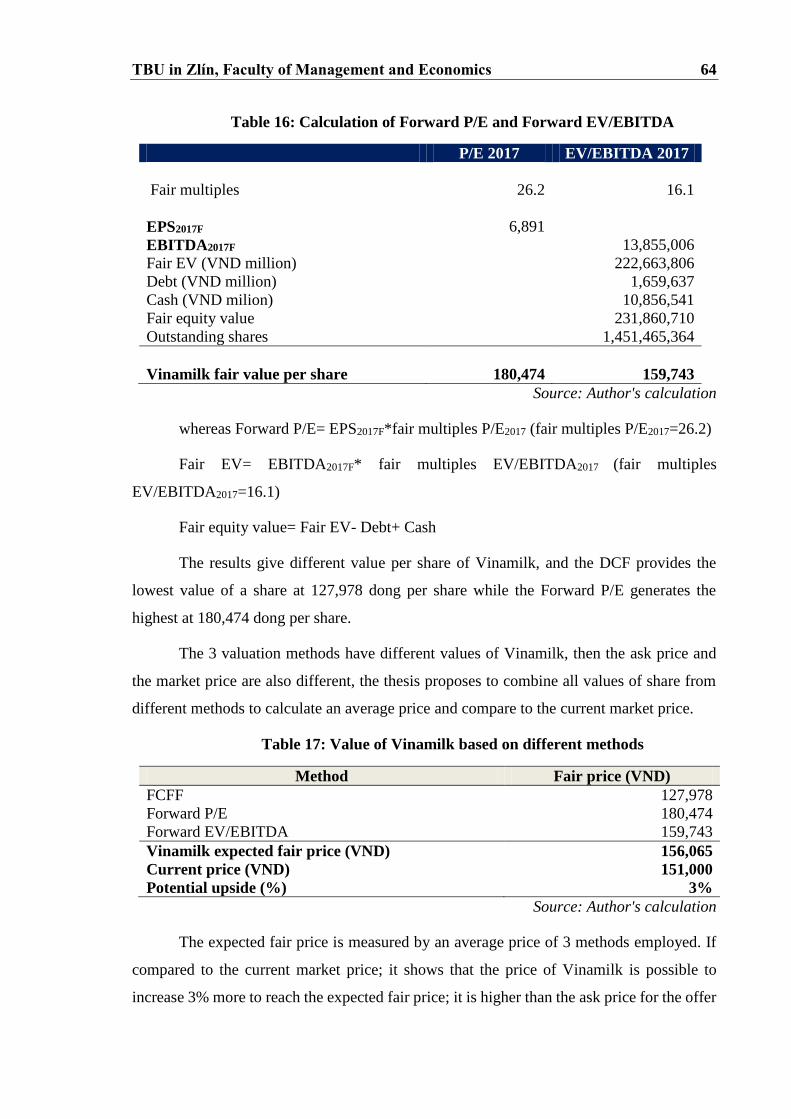
TBU in Zlín, Faculty of Management and Economics 64
Table 16: Calculation of Forward P/E and Forward EV/EBITDA
P/E 2017 EV/EBITDA 2017
Fair multiples
26.2
16.1
EPS2017F
6,891
EBITDA2017F 13,855,006
Fair EV (VND million) 222,663,806
Debt (VND million) 1,659,637
Cash (VND milion) 10,856,541
Fair equity value 231,860,710
Outstanding shares 1,451,465,364
Vinamilk fair value per share
180,474 159,743
Source: Author's calculation
whereas Forward P/E= EPS2017F*fair multiples P/E2017 (fair multiples P/E2017=26.2)
Fair EV= EBITDA2017F* fair multiples EV/EBITDA2017 (fair multiples
EV/EBITDA2017=16.1)
Fair equity value= Fair EV- Debt+ Cash
The results give different value per share of Vinamilk, and the DCF provides the
lowest value of a share at 127,978 dong per share while the Forward P/E generates the
highest at 180,474 dong per share.
The 3 valuation methods have different values of Vinamilk, then the ask price and
the market price are also different, the thesis proposes to combine all values of share from
different methods to calculate an average price and compare to the current market price.
Table 17: Value of Vinamilk based on different methods
Method Fair price (VND)
FCFF 127,978
Forward P/E 180,474
Forward EV/EBITDA 159,743
Vinamilk expected fair price (VND) 156,065
Current price (VND) 151,000
Potential upside (%) 3%
Source: Author's calculation
The expected fair price is measured by an average price of 3 methods employed. If
compared to the current market price; it shows that the price of Vinamilk is possible to
increase 3% more to reach the expected fair price; it is higher than the ask price for the offer

TBU in Zlín, Faculty of Management and Economics 65
of the government5. It replies that the ask price of the offer can increase due to the positive
expectation of investors to the growth of Vinamilk.
As the result of DCF valuation method, the market price is higher and this implies
that the public is underwriting the share of Vinamilk can be a potential asset, especially in
compared to other corporations in the same industry in the ASEAN countries.
According to the results of each method, it can iterate that the DCF method based on
the available information is undervalue in compared to the ask price and the current price on
the stock market, and the comparison to other dairy corporations in ASEAN countries. The
thesis finds that this situation is usually for the smaller, younger companies with high cost
of capital, and even or uncertain earnings or cash flow. But it also happens to the large,
successful companies with astronomical P/E ratios. In this case, we can see that there are
two possible making the value of Vinamilk lower than the market value.
+ The first reason is the investment of the corporation too high recently to the cow
farm and the distribution centers as well as the factories in the North and the South of
Vietnam, since it pours much money to the long-term investments while the prediction for
the cash flow in the terminal value does not have any support information to motivate a
prediction of high growth rate, even that the Euromonitor International (2014) forecast the
growth of the dairy sector can be at 9-10%, but the highly competitive market can cause a
slow rate to Vinamilk due to many uncertainty conditions.
+ The second reason is the valuation process cannot analyze the expectation of the
stock market, the market prices can be driven by many factors and investors can have
different expectation to target shares then they can forecast the value of the company
differently. Then the DCF method is just a technique to serve the basic information if smart
investors can see other indicators instead of DCF, such as the inability to sustain cash flow
rates in the future to confirm the value of the company.
In conclusion, each method can be used wisely in the practice and the DCF method
is a better method to see the potential of the target firm to know its potential value in the
future. The method contains many weaknesses due to having some assumptions about the
5 In the thesis, the comparison of current price of Vinamilk is compared to the expected fair price without
seeing the sensitive of the change of growth rates in the assumptions.

TBU in Zlín, Faculty of Management and Economics 66
firm performance in the future. If the information is unavailable, it can cause a different
value of the target firm. Then it can be varying among the investors' point of views.

TBU in Zlín, Faculty of Management and Economics 67
CONCLUSION
The thesis emphasis to determine the value of a firm, before that a review of the
common methods is performed to discuss the valuation in the academics and practices. Each
method can generate different value of firms and even for a method but if the available
information is difference among persons conducted, the valuation can generate different
results.
In the practical part, the thesis chooses a target corporation that is a potential and high
growth rate on the stock market: Vietnam Dairy Product Joint Stock Company (Vinamilk).
To do so, the thesis provides a brief introduction of the Vietnamese economy, the condition
of the financial market and the stock market that can influence on the value of firms. Indeed,
the thesis introduces some external conditions such as the growth of GDP, population etc. to
analyze the potential of the company. Besides that, the expectation of the investors in the
financial market and the development of the stock market are discussed as necessary factors
for investors to see whether the offer from the withdrawn state shares is suitable.
The thesis calculates the value of Vinamilk based on the Discounted Cash Flow
method and finds that the ask price of the government for their shares is higher than the DCF
valuation method, the value of DCF method is derived by the available information from the
Vinamilk and some assumption from the Euromonitor International (2014,2016) and VCA
(2017).
To compare the accuracy of the employed DCF method with other methods, the
thesis applies the quick multiplies methods which are calculated in compared to the similar
competitors of the dairy sector in the ASEAN countries. The results show that there is a gap
between the value of Vinamilk based on DCF method and the quick multiflies methods. This
gap shows that the DCF was undervalue in compared to quick multiplies methods, it
probably explains that the stock market is growing and investors expect to have high returns
on the market and they are believed that the hot-tempered stock exchange recently can yield
the high rates in the near future then they are willing to pay a higher value of Vinamilk’s
shares than the value based on the available information.
According to the review of some valuation methods and the case of Vinamilk, the
thesis would like to make some recommendations to investors and the authorities.

TBU in Zlín, Faculty of Management and Economics 68
+ Each valuation method can generate differently results, then the available
information and disclosures of firms need to be accuracy and reliable.
+ The market efficiency is the most important since it can transfer the current
information to the value of shares. It can support investors to avoid of any under or over
underwriting the values of firms.
+ The DCF method is suitable to firms which are generally stable, positive and
predictable free cash flow then the accuracy of the forecast free cash flow can be more and
the value of firms can be more effectively.
+ The estimation process to the terminal value is depending on the macro-conditions,
so for any fluctuation of interest rate, inflation, GDP or politics can be interfered this
estimation then the stable economic environment is a priority to the financial market.
TBU in Zlín, Faculty of Management and Economics 69
BIBLIOGRAPHY
ANNUAL REPORTS, 2005-1016. Vietnam Dairy Products Joint Stock Company. Accessed
on August 28th, 2017. https://www.vinamilk.com.vn/en/bao-cao-thuong-nien
BAKER, M., RUBACK, R.S (1999). Estimating Industry Multiples. Working paper,
Harvard University, 1-31. Accessed on August 17th, 2017.
http://www.people.hbs.edu/mbaker/cv/papers/estimatingindustry.pdf
BREALEY, R. A., MYERS, S. C., ALLEN, F. 2010. Principles of corporate finance. 10 th
ed. New York: McGraw Hill-Irwin, 875. The McGraw-Hill/Irwin series in finance,
insurance, and real estate. ISBN 978-0-07-740489-5.
DAMODARAN, A. 1994. Damodaran on Valuation: Security Analysis for Investment and
Corporate Finance. New York: John Wiley and Sons, Inc., 1796.
DAMODARAN, A. 2012. Investment Valuation: Tools and techniques for determining the
value of any asset. Third edition. Hoboken: John Wiley and Sons, Inc., 874. ISBN: 978-1-
118-01152-2
EUROMONITOR INTERNATIONAL, March 2014. Market Opportunity report: Vietnam.
Report for Bristish Columbia Ministry of Agriculture. Soft copy from HSC analyst staff.
EUROMONITOR INTERNATIONAL, September 2016. Passport Drinking Milk Products
in Vietnam. Soft copy from HSC analyst staff.
EU-VIETNAM BUSINESS NETWORK REPORT. 2016, Vietnam Dairy Edition 2016.
Accessed on September 10th 2017.
https://www.flandersinvestmentandtrade.com/export/sites/trade/files/attachments/EVBN-
DAIRY-REPORT-2016.pdf
FERNANDEZ, P. (2007). Company valuation methods. The most common errors in
valuations. Barcelone, IESE Business School. Accessed on July 10th 2017.
http://www.iese.edu/research/pdfs/di-0449-e.pdf
GRAHAM, J., HARVEY, C.R (2001). The theory and practice of corporate finance:
Evidence from the field. Journal of Financial Economics, 60, 187-243.
HOCHIMINH CITY SECURITIES CORPORATION. Company reports in March 2017 for
Vinamilk. Accessed on August 30th 2017. https://www.hsc.com.vn/en/research-
center/logon?returnURL=%2Fen%2Fresearch-center
HOCHIMINH CITY SECURITIES CORPORATION. Company reports in September 2017
for Vinamilk. Accessed on October 20th 2017. https://www.hsc.com.vn/en/research-
center/logon?returnURL=%2Fen%2Fresearch-center.
HOOVER, Scott. Stock Valuation, An essential guide to wall street's most popular valuation
models. New York: McGraw-Hill Education, 2006, 400. McGraw-Hill Library of
Investment and Finance. ISBN 978-0-071-45224-3.
IMAM, S., BARKER, R. CKUBB, C. (2008). The use of valuation models by UK investment
analysts. European Accounting Review, 17(3), 503-535.
KAPLAN, S.N. AND RUBACK, R.S. (1995). The valuation with track record ratios and
rates of change. The European Journal ò Finance, 16(1), 57-78.
PENMAN, S. H. Financial statement analysis and securities valuation. Fifth edition. New
York: McGraw-Hill Education, 2012, 768. ISBN 978-0-078-02531-0.
TBU in Zlín, Faculty of Management and Economics 70
PHAM, M. C. AND Q. H. VUONG (2009). Viet Nam – ups and downs and development.
Hanoi, Vietnam, National Political Publishing house.
ROSS, S., WESTERFIELD, R., JAFFE, J. 2012. Corporate Finance. New York, McGraw-
Hill/Irwin. ISBN 978-0077511388
TRAN, C. T. 2015. Privatization State-owned enterprises in Vietnam- Process, results,
issues and recommendations. Hanoi, VNU University of Economics and Business.
VIETNAM COMPETITION AUTHORITY, 2017. Quarterly and Annually reports.
(http://www.vca.gov.vn/Newsletter.aspx?CateID=213)
VIETNAM SUGARCANE AND SUGAR ASSOCIATION, 2017. Assessed on October
28th. 2017. http://www.vinasugar.vn/tin-tuc-trong-nuoc/
VINAMILK, 2006. The prospectus report. Accessed on November 15th 2017.
http://static2.vietstock.vn/data/HOSE/2007/BAN%20CAO%20BACH/VN/VNM_BCB.pdf
VUONG, Q. H. (2010). Financial Markets in Vietnam's Transition Economy: Facts,
Insights, Implications, VDM Verlag Dr. Müller
WORLDBANK (2017) Country partnership framework for the Socialist Republic of
Vietnam for the period Fiscal year 2018- fiscal year 2022. No. 111771-VN. Accessed on
August 30th 2017.
WORLDPANEL INSIGHT HANDBOOK, 2017. FMCG monitor October 2017. Accessed
on October 30th 2017. http://www.brandcamp.asia/doc/2838-FMCG-Monitor-102017.
TBU in Zlín, Faculty of Management and Economics 71
LIST OF ABBREVIATIONS
ASEAN Association of South East Asian Nations
CAGR Compounded Annual Growth rate
CAPM Capital Asset Pricing Model
Co. Ltd Limited Company
COGS Cost of goods sold
CP The Government
DCF Discounted Cash Flow
EBIT Earnings before interest and taxes
EBITDA Earnings before interest, taxes and depreciation and amortization.
EV Enterprise Value
EVBN Euro-Vietnam Business Network
FCFF Free Cash Flow to Firm
FMCG Fast moving Consuming Growth
FY Fiscal Year
HSC Hochiminh city Securities Corporation
JSC Joint Stock Company
JV Joint-Venture
ND-CP The Government Circulation
NWC Net Working Capital
P/E Price to Earnings
P&L Profit and loss
SCIC State Capital Investment Corporation
SOEs State Owned Enterprises
TBU in Zlín, Faculty of Management and Economics 72
SWOT Strength- Weakness- Opportunity- Threat
USA United States of America
VCA Vietnam Competition Associate
Vinamilk Vietnam Dairy Product Joint Stock Company
WACC Weight Average Cost of Capital
TBU in Zlín, Faculty of Management and Economics 73
LIST OF FIGURES
Figure 1: The balance sheet ..................................................................................... 23
Figure 2: The economic balance sheet .................................................................... 24
Figure 3: Procedure from the income statement to free cash flow ...................... 25
Figure 4: Capitalization of the stock market in Vietnam (%GDP) ..................... 33
Figure 5: Stock market turnover ratio on Vietnamese Stock market period 2010-
2016 ................................................................................................................... 34
Figure 6: Dairy consumption per capita ................................................................. 37
Figure 7: Consumer's share of wallet and FMCG spending ................................ 38
Figure 8: Organization structure of Vinamilk ....................................................... 42
Figure 9: Market shares of Vinamilk (by product) ............................................... 44
Figure 10: SWOT analysis ....................................................................................... 46

TBU in Zlín, Faculty of Management and Economics 74
LIST OF TABLES
Table 1: Number of firms privatized from 1992 to 2016 ....................................... 11
Table 2: Some indicators of Vietnam economy from 2014-2020F ........................ 35
Table 3: Forecast growth rates of industry sales for milk products .................... 36
Table 4: Sales of dairy products of the whole industry from 2018 to 2020 ......... 36
Table 5: Competitors of Vinamilk for main product lines in 2016 ...................... 40
Table 6: Growth rates of Vinamilk over the period 2015-2017F ........................ 43
Table 7: Market shares of Vinamilk over 2018-2020 ............................................ 48
Table 8: Cost of goods sold (parent company -excluding Driftwood) .................. 49
Table 9: Sales and General administration expenses ............................................ 51
Table 10: Gross margin of Vinamilk from 205-2020F- breakdown by product
categories .......................................................................................................... 52
Table 11: Vinamilk financial statements from 2015-2020F .................................. 53
Table 12: Assumptions for the balance sheets from 2015-2020F ......................... 57
Table 13: Assumptions for the balance sheets from 2015-2020F ......................... 58
Table 14: Net Capital Expenditures from 2015-2020F .......................................... 58
Table 15: Free cash flow to firm from 2015-2020F ................................................ 61
Table 16: Calculation of Forward P/E and Forward EV/EBITDA ..................... 64
Table 17: A combination of all methods ................................................................. 64

TBU in Zlín, Faculty of Management and Economics 75
APPENDICES
APPENDIX 1: : SALES OF VINAMILK............................................................... 76
APPENDIX 2: THE RAW MATERIALS FROM 2015-2020F ............................ 77
APPENDIX 3: FINANCIAL INCOMES FROM 2015-2020F .............................. 78
APPENDIX 4: BALANCE SHEETS FROM 2015-2020F .................................... 81
APPENDIX 5: COMPARATIVE REGIONAL VALUATION TABLES FOR
VINAMILK .............................................................................................................. 89
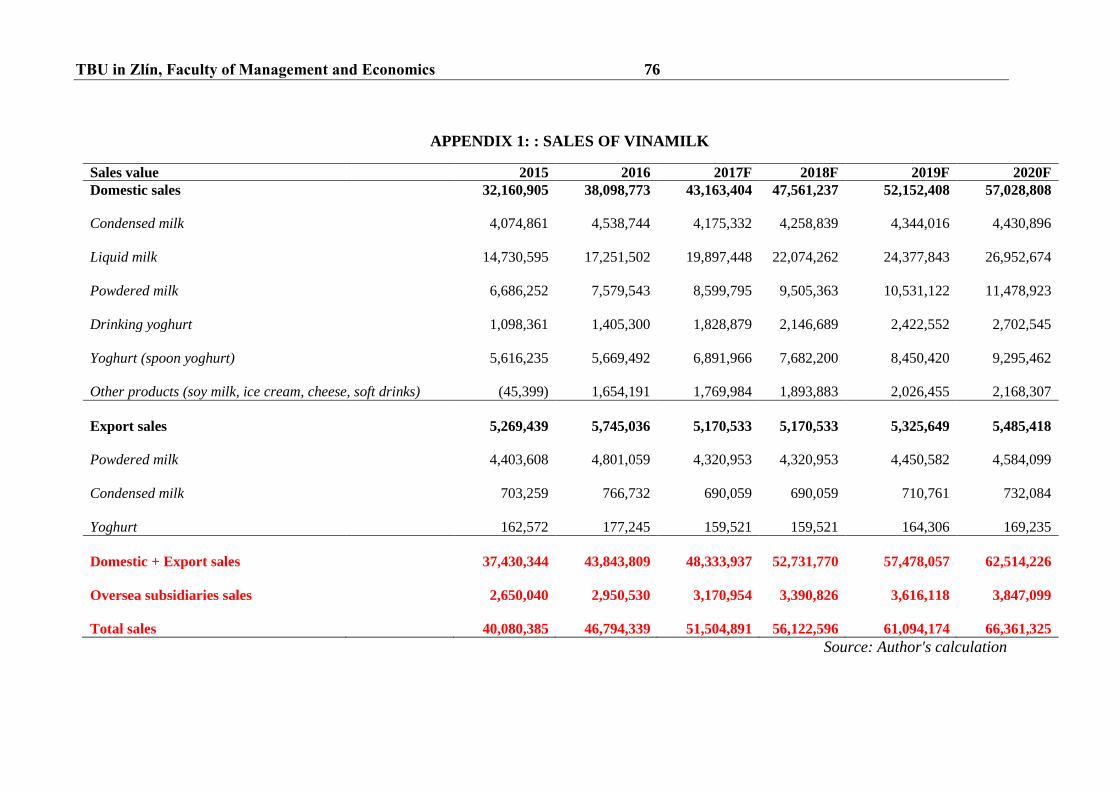
TBU in Zlín, Faculty of Management and Economics 76
APPENDIX 1: : SALES OF VINAMILK
Sales value 2015 2016 2017F 2018F 2019F 2020F
Domestic sales 32,160,905 38,098,773 43,163,404 47,561,237 52,152,408 57,028,808
Condensed milk
4,074,861
4,538,744
4,175,332
4,258,839
4,344,016
4,430,896
Liquid milk
14,730,595
17,251,502
19,897,448
22,074,262
24,377,843
26,952,674
Powdered milk
6,686,252
7,579,543
8,599,795
9,505,363
10,531,122
11,478,923
Drinking yoghurt
1,098,361
1,405,300
1,828,879
2,146,689
2,422,552
2,702,545
Yoghurt (spoon yoghurt)
5,616,235
5,669,492
6,891,966
7,682,200
8,450,420
9,295,462
Other products (soy milk, ice cream, cheese, soft drinks)
(45,399)
1,654,191
1,769,984
1,893,883
2,026,455
2,168,307
Export sales
5,269,439
5,745,036
5,170,533
5,170,533
5,325,649
5,485,418
Powdered milk
4,403,608
4,801,059
4,320,953
4,320,953
4,450,582
4,584,099
Condensed milk
703,259
766,732
690,059
690,059
710,761
732,084
Yoghurt
162,572
177,245
159,521
159,521
164,306
169,235
Domestic + Export sales
37,430,344
43,843,809
48,333,937
52,731,770
57,478,057
62,514,226
Oversea subsidiaries sales
2,650,040
2,950,530
3,170,954
3,390,826
3,616,118
3,847,099
Total sales
40,080,385
46,794,339
51,504,891
56,122,596
61,094,174
66,361,325
Source: Author's calculation

TBU in Zlín, Faculty of Management and Economics 77
APPENDIX 2: THE RAW MATERIALS FROM 2015-2020F
Year FY2015 FY2016F FY2017F FY2018F FY2019F FY2020F
VNM's owned farms
Cow heads 15,000 17,018 21,318 24,818 26,818 28,818
Pregnant cow heads/total heads 35% 35% 35% 35% 35% 35%
Pregnant cow heads 5,250 5,956 7,461 8,686 9,386 10,086
Yield (tonnes per head per annum) 7.2 7.2 7.2 7.2 7.2 7.2
Yield (litres per head per day) 22.2 22.2 22.2 22.2 22.2 22.2
Raw fresh milk production volume (tonnes) 37,596 42,654 53,431 62,204 67,217 72,229
Local farmers
Cow heads 95,000 104,500 114,950 126,445 139,090 152,998
Pregnant cow heads/total heads 40% 40% 40% 40% 40% 40%
Pregnant cow heads 38,000 41,800 45,980 50,578 55,636 61,199
Yield (tonnes per head per annum) 4.71 4.71 4.71 4.71 4.71 4.71
Yield (litres per head per day) 14.6 14.6 14.6 14.6 14.6 14.6
Raw fresh milk production volume (tonnes) 178,890 196,779 216,457 238,103 261,913 288,104
VNM's owned farms + local farmers
Cow heads 110,000 121,518 136,268 151,263 165,908 181,816
Pregnant cow heads/total heads 39% 39% 39% 39% 39% 39%
Pregnant cow heads 43,250 47,756 53,441 59,264 65,022 71,286
Yield (tonnes per head per annum) 5.0 5.0 5.1 5.1 5.1 5.1
Yield (litres per head per day) 15.5 15.5 15.7 15.7 15.7 15.7
Raw fresh milk production volume (tonnes) 216,486 239,433 269,888 300,306 329,129 360,334
VNM liquid milk production volume (tonnes) 521,735 611,021 684,210 759,064 838,277 926,817
% supplied by local raw fresh milk 41% 39% 39% 40% 39% 39%
Source: Vinamilk report and the HSC reports
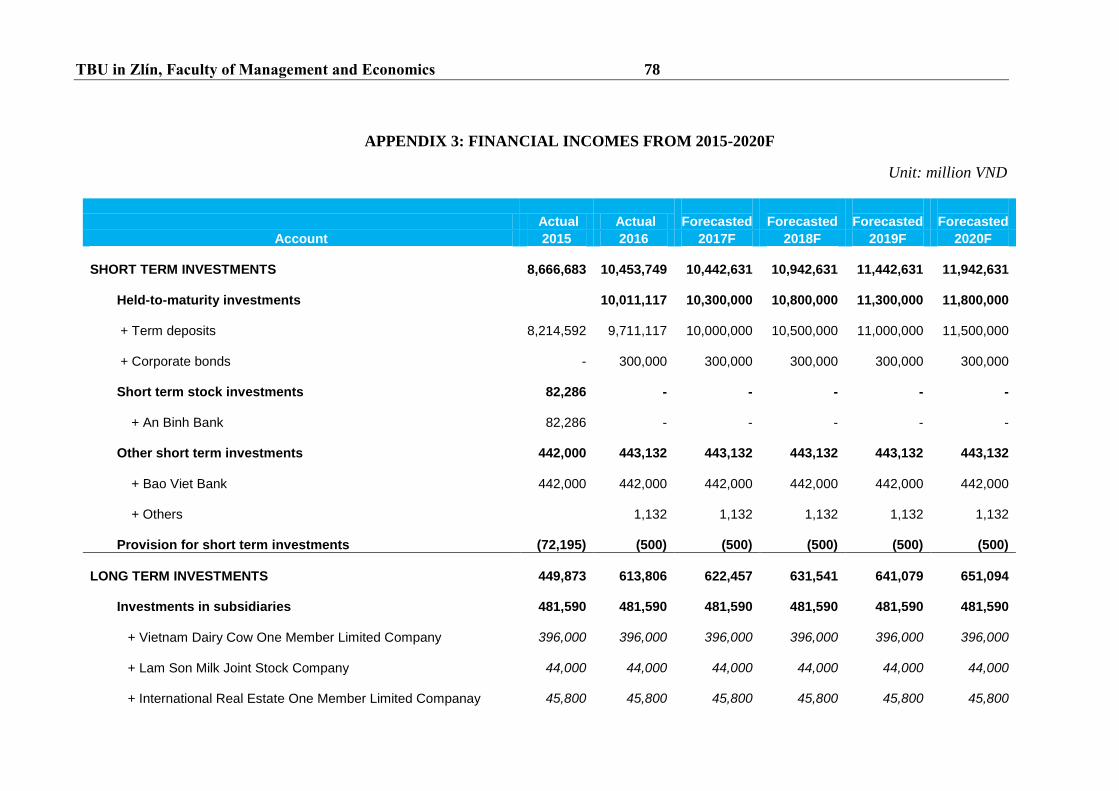
TBU in Zlín, Faculty of Management and Economics 78
APPENDIX 3: FINANCIAL INCOMES FROM 2015-2020F
Unit: million VND
Actual Actual
Forecasted
Forecasted
Forecasted
Forecasted
Account 2015 2016 2017F 2018F 2019F 2020F
SHORT TERM INVESTMENTS
8,666,683
10,453,749
10,442,631
10,942,631
11,442,631
11,942,631
Held-to-maturity investments
10,011,117
10,300,000
10,800,000
11,300,000
11,800,000
+ Term deposits
8,214,592
9,711,117
10,000,000
10,500,000
11,000,000
11,500,000
+ Corporate bonds
-
300,000 300,000 300,000 300,000 300,000
Short term stock investments
82,286
-
-
-
-
-
+ An Binh Bank
82,286
-
-
-
-
-
Other short term investments
442,000
443,132 443,132 443,132 443,132 443,132
+ Bao Viet Bank
442,000
442,000 442,000 442,000 442,000 442,000
+ Others
1,132 1,132 1,132 1,132 1,132
Provision for short term investments
(72,195)
(500)
(500)
(500)
(500)
(500)
LONG TERM INVESTMENTS
449,873
613,806 622,457 631,541 641,079 651,094
Investments in subsidiaries
481,590
481,590 481,590 481,590 481,590 481,590
+ Vietnam Dairy Cow One Member Limited Company
396,000
396,000 396,000 396,000 396,000 396,000
+ Lam Son Milk Joint Stock Company
44,000
44,000 44,000 44,000 44,000 44,000
+ International Real Estate One Member Limited Companay
45,800
45,800 45,800 45,800 45,800 45,800
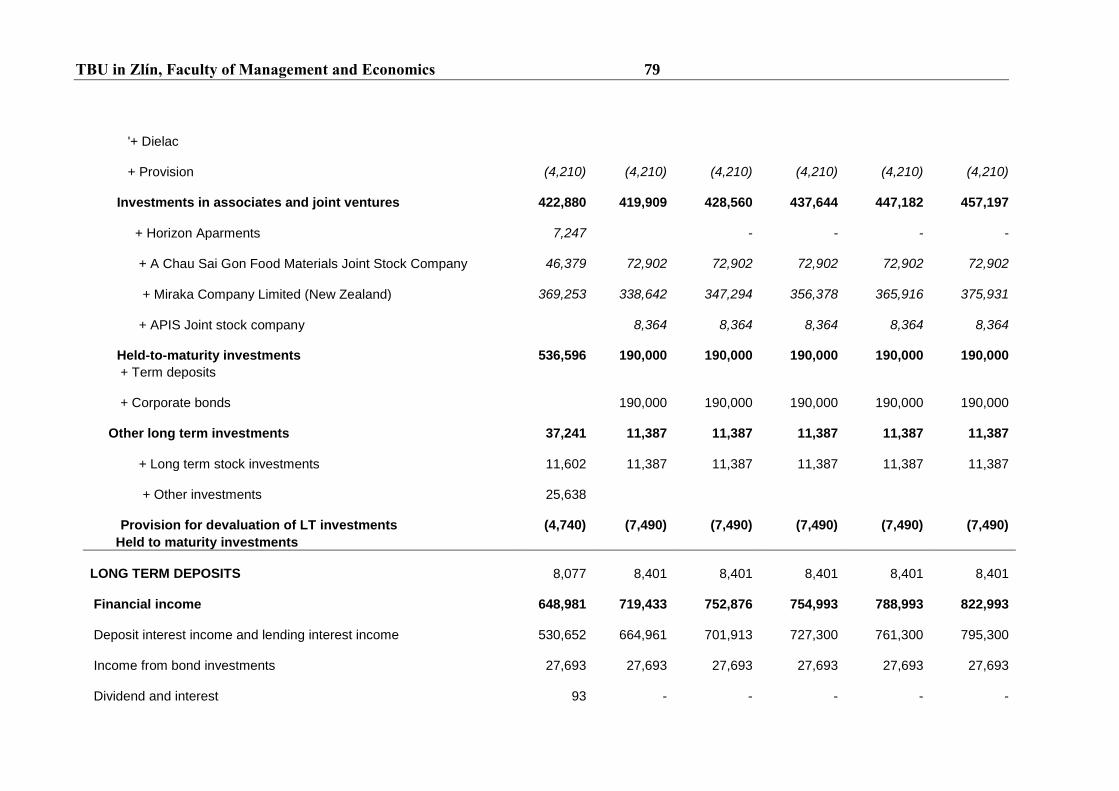
TBU in Zlín, Faculty of Management and Economics 79
'+ Dielac
+ Provision
(4,210)
(4,210)
(4,210)
(4,210)
(4,210)
(4,210)
Investments in associates and joint ventures
422,880
419,909 428,560 437,644 447,182 457,197
+ Horizon Aparments
7,247
-
-
-
-
+ A Chau Sai Gon Food Materials Joint Stock Company
46,379
72,902 72,902 72,902 72,902 72,902
+ Miraka Company Limited (New Zealand)
369,253
338,642 347,294 356,378 365,916 375,931
+ APIS Joint stock company
8,364 8,364 8,364 8,364 8,364
Held-to-maturity investments
536,596
190,000 190,000 190,000 190,000 190,000
+ Term deposits
+ Corporate bonds
190,000 190,000 190,000 190,000 190,000
Other long term investments
37,241
11,387 11,387 11,387 11,387 11,387
+ Long term stock investments
11,602
11,387 11,387 11,387 11,387 11,387
+ Other investments
25,638
Provision for devaluation of LT investments
(4,740)
(7,490)
(7,490)
(7,490)
(7,490)
(7,490)
Held to maturity investments
LONG TERM DEPOSITS
8,077
8,401 8,401 8,401 8,401 8,401
Financial income
648,981
719,433 752,876 754,993 788,993 822,993
Deposit interest income and lending interest income
530,652
664,961 701,913 727,300 761,300 795,300
Income from bond investments
27,693
27,693 27,693 27,693 27,693 27,693
Dividend and interest
93
-
-
-
-
-

TBU in Zlín, Faculty of Management and Economics 80
Gains from liquidating equity investments
77
-
-
-
-
-
Gains on realized forex diff
90,139
26,778 23,269
Other financial income
326
Financial income excluding provision reversal
648,981
719,433 752,876 754,993 788,993 822,993
Financial expenses
163,113
65,680 72,795 62,653 62,653 62,653
Interest expenses
31,277
33,500 33,500
-
-
-
Interest for advanced deposit
2,263
1,050 1,659
Commission fees for stock brokers
248
Losses on realized forex diff
141,526
28,374 37,617 62,653 62,653 62,653
Provision for short term investments
(12,278) 2,728
Provision for long term investments
16
Other financial expense
60
26 18
Financial expense excluding interest expense
131,835
32,180 39,295 62,653 62,653 62,653
Net financial income
485,868
653,752 680,080 692,339 726,339 760,33
Assumptions 2015 2016 2017F 2018F 2019F 2020F
Demand deposit rate 1.0% 1.0% 1.0% 1.0% 1.0% 1.0%
Short-term deposit rate 7.0% 7.0% 6.8% 6.8% 6.8% 6.8%
Long-term deposit rate 7.0% 7.0% 7.0% 7.0% 7.0% 7.0%
Bond coupon 11% 11% 11% 11% 11% 11%
Dividend yield 3.0% 3.0% 3.0% 3.0% 3.0% 3.0%
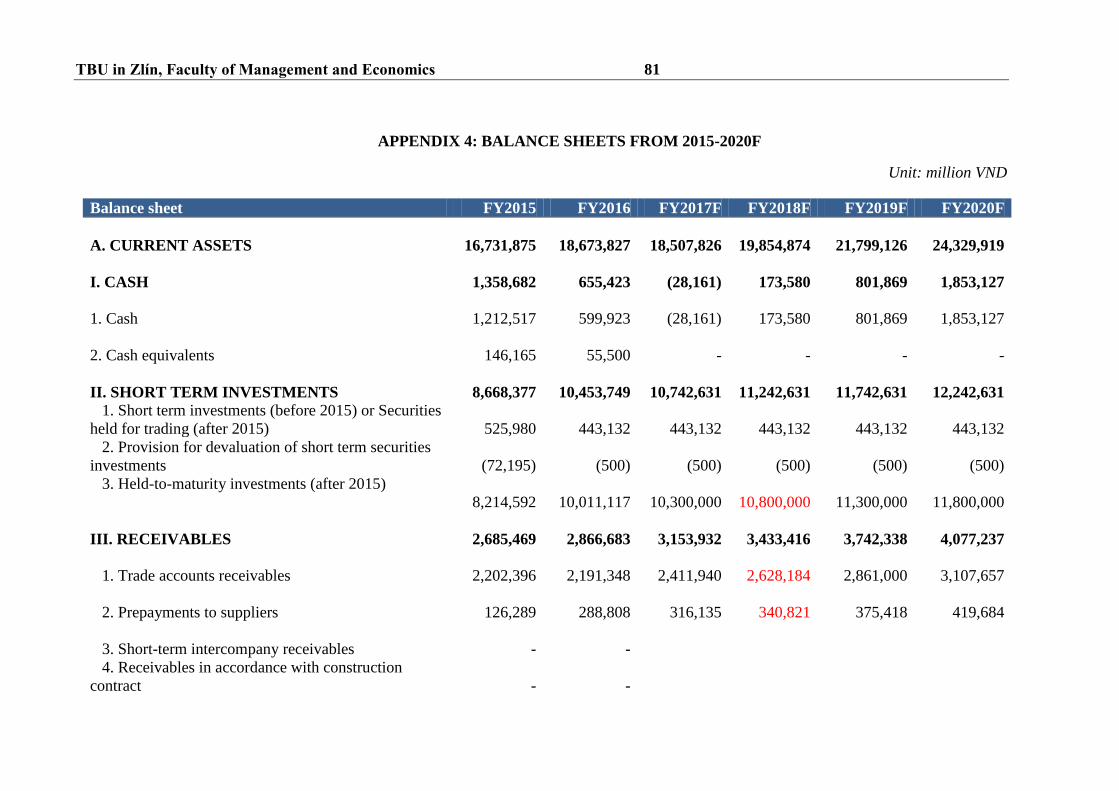
TBU in Zlín, Faculty of Management and Economics 81
APPENDIX 4: BALANCE SHEETS FROM 2015-2020F
Unit: million VND
Balance sheet FY2015 FY2016 FY2017F FY2018F FY2019F FY2020F
A. CURRENT ASSETS
16,731,875
18,673,827
18,507,826
19,854,874
21,799,126
24,329,919
I. CASH
1,358,682
655,423
(28,161)
173,580
801,869
1,853,127
1. Cash
1,212,517
599,923
(28,161)
173,580
801,869
1,853,127
2. Cash equivalents
146,165
55,500
-
-
-
-
II. SHORT TERM INVESTMENTS
8,668,377
10,453,749
10,742,631
11,242,631
11,742,631
12,242,631
1. Short term investments (before 2015) or Securities
held for trading (after 2015)
525,980
443,132
443,132
443,132
443,132
443,132
2. Provision for devaluation of short term securities
investments
(72,195)
(500)
(500)
(500)
(500)
(500)
3. Held-to-maturity investments (after 2015)
8,214,592
10,011,117
10,300,000
10,800,000
11,300,000
11,800,000
III. RECEIVABLES
2,685,469
2,866,683
3,153,932
3,433,416
3,742,338
4,077,237
1. Trade accounts receivables
2,202,396
2,191,348
2,411,940
2,628,184
2,861,000
3,107,657
2. Prepayments to suppliers
126,289
288,808
316,135
340,821
375,418
419,684
3. Short-term intercompany receivables
-
-
4. Receivables in accordance with construction
contract
-
-

TBU in Zlín, Faculty of Management and Economics 82
5. Short-term loan receivables (after 2015)
-
-
6. Other short term receivables
359,995
390,619
429,940
468,487
509,988
553,956
7. Provision for short-term doubtful receivables
(3,211)
(4,168)
(4,168)
(4,168)
(4,168)
(4,168)
8. Pending assets (before 2015)
-
76
84
91
99
108
IV. INVENTORIES
3,810,095
4,521,766
4,445,481
4,793,915
5,282,236
5,907,037
1. Inventories
3,827,369
4,538,439
4,462,154
4,810,588
5,298,909
5,923,711
2. Provision for inventory devaluation
(17,274)
(16,673)
(16,673)
(16,673)
(16,673)
(16,673)
V. OTHER CURRENT ASSETS
209,250
176,204
193,942
211,330
230,051
249,884
1. Short-term pre-paid expenses
156,056
59,288
65,256
71,107
77,406
84,079
2. VAT deductibles
53,192
116,835
128,596
140,126
152,539
165,690
3. Taxes and other receivables from state
1
81
89
97
105
114
4. Government bonds repo
-
-
5. Other current assets
-
-
-
-
-
-
B. LONG-TERM ASSETS
10,746,300
10,704,828
12,453,687
13,962,844
15,032,957
15,880,036
I. LONG-TERM RECEIVABLES
20,898
21,855
23,237
24,486
26,236
28,475

TBU in Zlín, Faculty of Management and Economics 83
1. Long-term accounts receivables
-
-
2. Long-term prepayment to suppliers
-
-
3. Capital in directly controlled units
-
-
4. Long-term inter-company receivables
-
-
5. Long-term loan receivables
5,573
7,245
7,245
7,245
7,245
7,245
6. Other long-term receivables
15,324
14,609
15,991
17,240
18,990
21,229
7. Provision for long-term doubtful receivables
-
-
II. FIXED ASSETS
8,214,134
8,321,053
8,075,830
9,597,496
10,879,162
11,736,828
1. Tangible fixed assets
7,795,345
7,916,322
7,689,366
9,229,298
10,529,230
11,405,162
Cost
13,059,721
14,257,738
15,250,850
18,250,850
21,250,850
24,050,850
Accumulated depreciation
(5,264,375)
(6,341,415)
(7,561,483)
(9,021,551)
(10,721,619)
(12,645,687)
2. Financial leasing fixed assets
-
-
-
-
-
-
Cost
-
-
-
-
-
-
Accumulated depreciation
-
-
-
-
-
-
3. Intangible fixed assets
418,789
404,730
386,464
368,198
349,932
331,666

TBU in Zlín, Faculty of Management and Economics 84
Cost
553,684
557,891
557,891
557,891
557,891
557,891
Accumulated amortization
(134,894)
(153,160)
(171,426)
(189,692)
(207,958)
(226,224)
4. Construction in progress (before 2015)
-
-
III. INVESTMENT PROPERTY
142,368
136,973
131,578
126,183
120,788
115,394
Cost
179,678
179,678
179,678
179,678
179,678
179,678
Accumulated depreciation
(37,309)
(42,704)
(48,099)
(53,494)
(58,889)
(64,283)
IV. Long-term assets in progress (after 2015)
843,679
993,111
3,000,000
3,000,000
2,800,000
2,800,000
1. Operation cost of long-term assets in progress
(after 2015)
82,393
127,671
2. Construction cost of long-term assets in progress
(after 2015)
761,285
865,440
3,000,000
3,000,000
2,800,000
2,800,000
III. LONG-TERM INVESTMENTS
940,365,
613,806
622,457
631,541
641,079
651,094
1. Investment in subsidiaries
-
-
-
-
-
-
2. Investments in joint ventures and associates
397,130
419,909
428,560
437,644
447,182
457,197
3. Other Long-term investments
11,378
11,387
11,387
11,387
11,387
11,387
4. Held to maturity investments
536,596
190,000
190,000
190,000
190,000
190,000
5. Provision for devaluation of long term investments
(4,740)
(7,490)
(7,490)
(7,490)
(7,490)
(7,490)
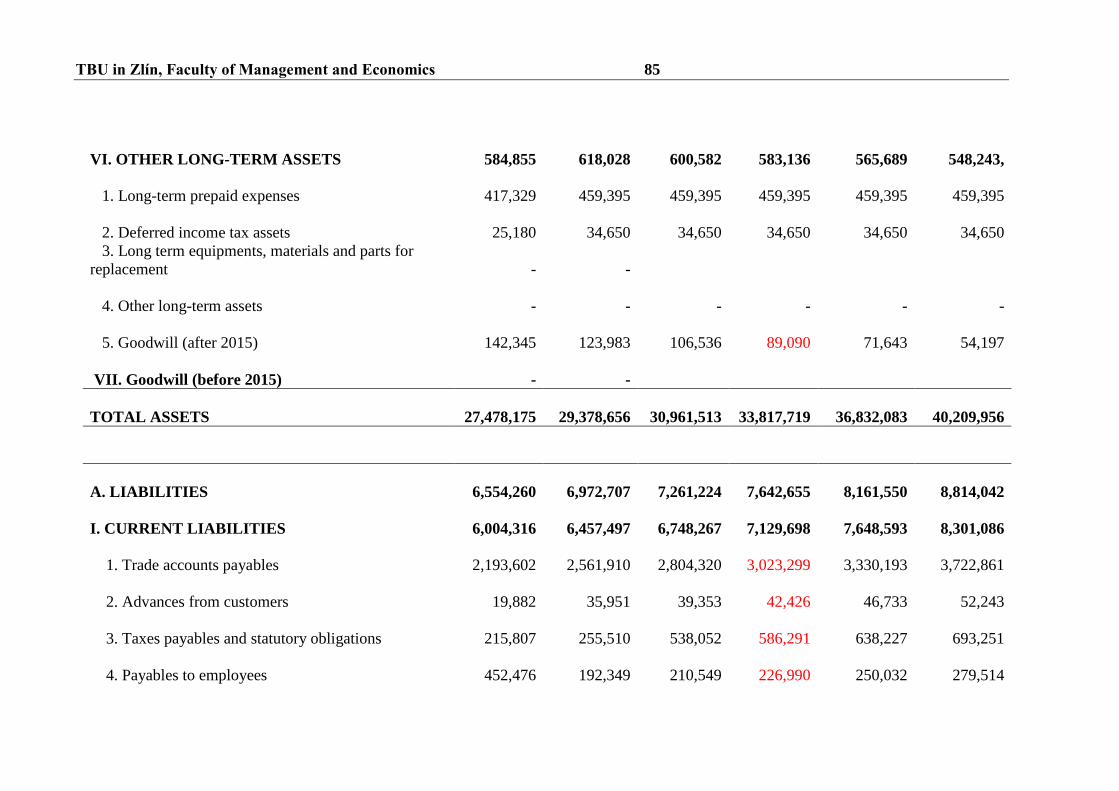
TBU in Zlín, Faculty of Management and Economics 85
VI. OTHER LONG-TERM ASSETS
584,855
618,028
600,582
583,136
565,689
548,243,
1. Long-term prepaid expenses
417,329
459,395
459,395
459,395
459,395
459,395
2. Deferred income tax assets
25,180
34,650
34,650
34,650
34,650
34,650
3. Long term equipments, materials and parts for
replacement
-
-
4. Other long-term assets
-
-
-
-
-
-
5. Goodwill (after 2015)
142,345
123,983
106,536
89,090
71,643
54,197
VII. Goodwill (before 2015)
-
-
TOTAL ASSETS
27,478,175
29,378,656
30,961,513
33,817,719
36,832,083
40,209,956
A. LIABILITIES
6,554,260
6,972,707
7,261,224
7,642,655
8,161,550
8,814,042
I. CURRENT LIABILITIES
6,004,316
6,457,497
6,748,267
7,129,698
7,648,593
8,301,086
1. Trade accounts payables
2,193,602
2,561,910
2,804,320
3,023,299
3,330,193
3,722,861
2. Advances from customers
19,882
35,951
39,353
42,426
46,733
52,243
3. Taxes payables and statutory obligations
215,807
255,510
538,052
586,291
638,227
693,251
4. Payables to employees
452,476
192,349
210,549
226,990
250,032
279,514

TBU in Zlín, Faculty of Management and Economics 86
5. Short-term accrued expenses
593,485
1,025,974
563,958
607,996
669,713
748,680
6. Short-term inter-company payables
-
-
-
-
8. Short-term unrealized revenue
1,350
3,360
9. Other short-term payables
644,468
592,099
648,769
699,430
770,428
861,271
10. Short-term borrowings and financial lease
1,475,358
1,332,666
1,332,666
1,332,666
1,332,666
1,332,666
11. Provision for short-term payables
2,420
889
12. Bonus and welfare funds
405,464
456,785
610,597
610,597
610,597
610,597
13. Price stablizing fund
-
-
14. Government bonds reverse repo
-
-
II. LONG TERM LIABILITIES
549,943
515,209
512,956
512,956
512,956
512,956
1. Long-term trade account payables
-
-
2. Long-term advance from customers
-
-
3. Long-term accrued expenses
-
-
4. Internal payables on capital
-
-

TBU in Zlín, Faculty of Management and Economics 87
5. Long-term internal payables
-
-
6. Long-term unrealized revenue
2,598
1,663
7. Other long-term payables
2,814
589
-
-
-
-
8. Long-term borrowings and financial lease
368,170
326,970
326,970
326,970
326,970
326,970
9. Convertible bonds
-
-
10. Preferred stocks
-
-
11. Deferred income tax payables
89,034
90,025
90,025
90,025
90,025
90,025
12. Provision for unemployment allowances
87,325
-
-
-
-
-
13. Provision for long-term payables
95,960
95,960
95,960
95,960
95,960
B. OWNERS' EQUITY
20,923,915
22,405,949
23,700,289
26,175,064
28,670,533
31,395,913
I. OWNERS' EQUITY
20,923,915
22,405,949
23,700,289
26,175,064
28,670,533
31,395,913
1. Paid in capital
12,006,621
14,514,534
14,514,534
14,514,534
14,514,534
14,514,534
– Common stocks
12,006,621
14,514,534
14,514,534
14,514,534
14,514,534
14,514,534
– Prefrerred stocks
-
-
2. Share premium
-
260,699
260,699
260,699
260,699
260,699
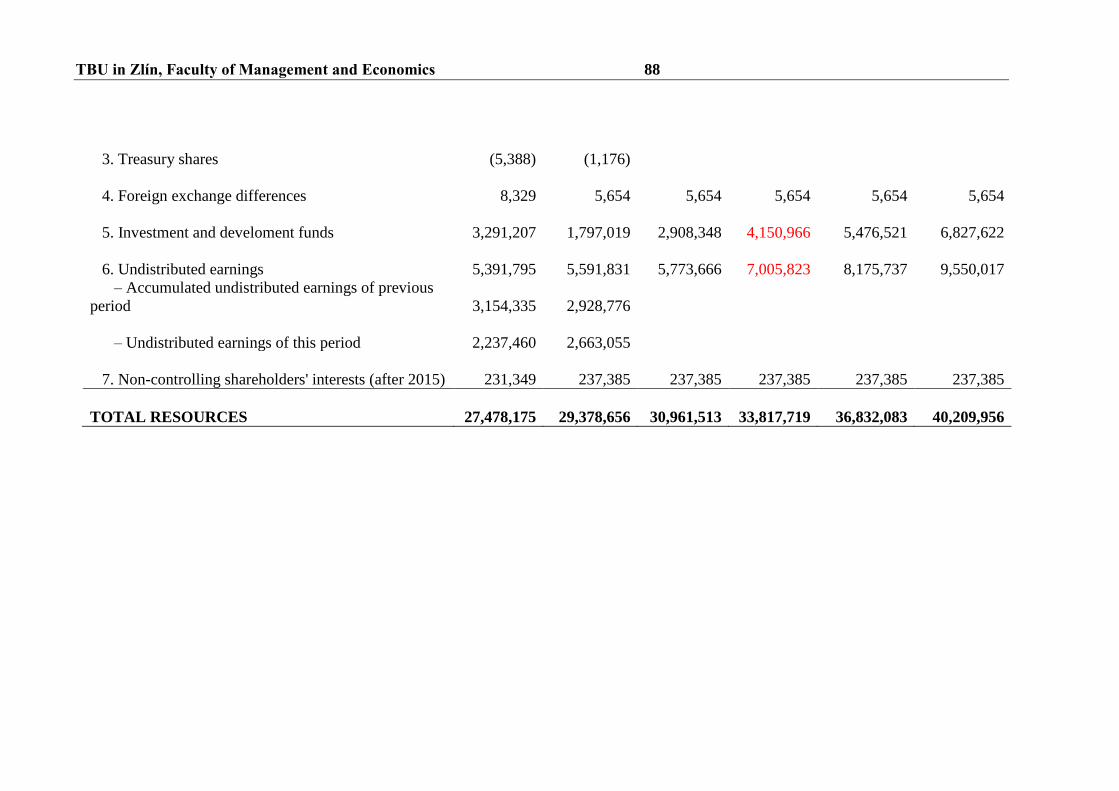
TBU in Zlín, Faculty of Management and Economics 88
3. Treasury shares
(5,388)
(1,176)
4. Foreign exchange differences
8,329
5,654
5,654
5,654
5,654
5,654
5. Investment and develoment funds
3,291,207
1,797,019
2,908,348
4,150,966
5,476,521
6,827,622
6. Undistributed earnings
5,391,795
5,591,831
5,773,666
7,005,823
8,175,737
9,550,017
– Accumulated undistributed earnings of previous
period
3,154,335
2,928,776
– Undistributed earnings of this period
2,237,460
2,663,055
7. Non-controlling shareholders' interests (after 2015)
231,349
237,385
237,385
237,385
237,385
237,385
TOTAL RESOURCES
27,478,175
29,378,656
30,961,513
33,817,719
36,832,083
40,209,956

TBU in Zlín, Faculty of Management and Economics 89
APPENDIX 5: COMPARATIVE REGIONAL VALUATION TABLES FOR VINAMILK
Company name
Market
capitalisation
(US$m)
EBITDA
margin
(FY2015)
2-year
sales
CAGR
2 years net
profit
CAGR P/E 2017
EV/EBITDA
2017
(1) (2) (3) (4) (5) (6)
Bright Dairy & Food Co., Ltd (SHSE:600597)
2,364.20 6.4% 7.9% 1.7% 27.6 10.3
China Huishan Dairy Holdings Company Limited
(SEHK:6863)
5,056.70 34.7% 11.8% -31.7% 31.3 18.5
Yakult Honsha Co. Ltd. (TSE:2267)
7,322.90 16.5% -3.5% 4.8% 32.4 16.2
Nestlé (Malaysia) Berhad (KLSE:NESTLE)
4,028.70 18.3% -9.5% 3798.7% 24.8 17.0
Ultrajaya milk Indonesisa
972.50 19.6% -0.8% 11.2% 18.3 10.9
Fraser and Neave Holdings (Malaysia)
1,906.90 12.3% -7.6% 7.8% 18.9 13.1
Weighted average 19.7% -0.1% 702.4%
28.4
15.7
Median 17.4% -2.2% 6.3% 26.2 14.6
Premium/discount 10% 10%
Vinamilk fair multiples 28.8 16.1
Vinamilk current multiples
9,453.6 25.1% 15.7% 24.1%
21.6
14.8
Weighted average=sum of [market capitalization * by the category from (2) to (6)]/ market capitalization
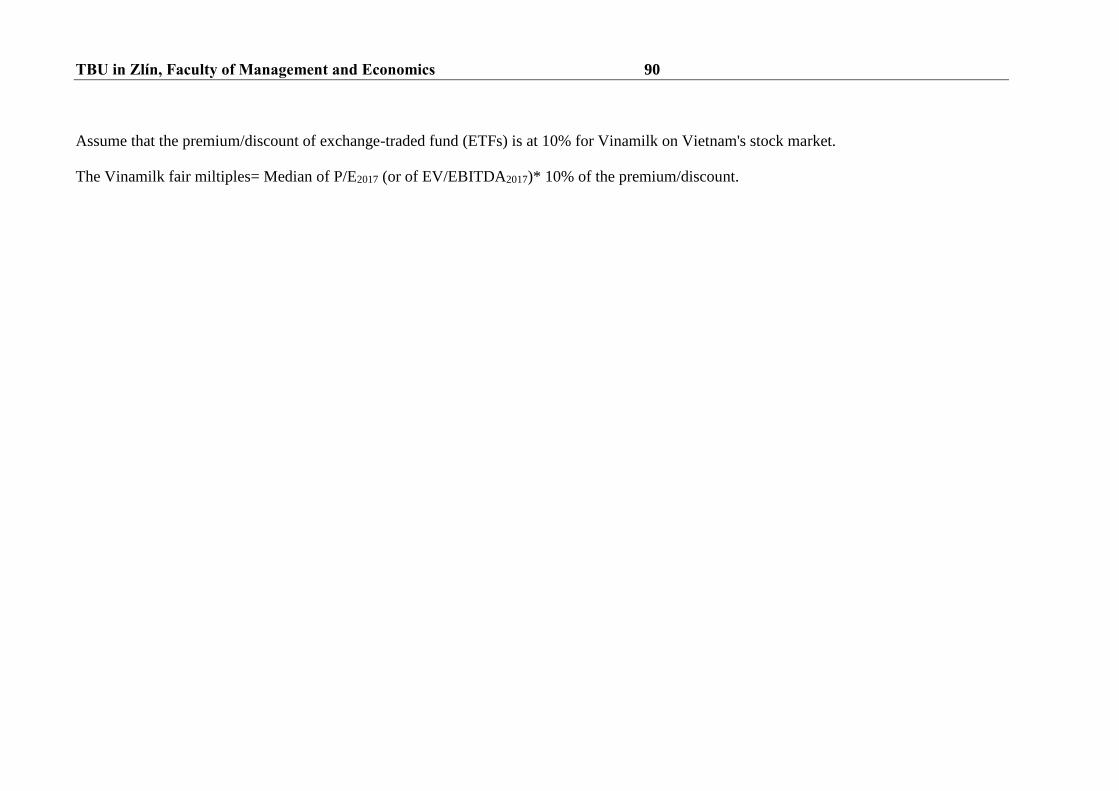
TBU in Zlín, Faculty of Management and Economics 90
Assume that the premium/discount of exchange-traded fund (ETFs) is at 10% for Vinamilk on Vietnam's stock market.
The Vinamilk fair miltiples= Median of P/E2017 (or of EV/EBITDA2017)* 10% of the premium/discount.