the purposeful company - big innovation...
TRANSCRIPT

1 Executive Remuneration Report
February 2017
The Purposeful Company
Executive Remuneration Report

2 Executive Remuneration Report
Contents
The Purposeful Company .............................................................................. 3
Introduction .................................................................................................... 4
Executive Summary ....................................................................................... 6
1. Reform Pay Design ............................................................................... 13
2. Strengthen Board Accountability for Pay Fairness ................................ 26
3. Enhance Executive Pay Disclosure ....................................................... 42
4. Toughen Shareholder Voting Powers .................................................... 49
Appendix: Implementation of Design Recommendations via Amendment of the UK Corporate Governance Code ........................................................... 60
Reference List .............................................................................................. 62
Big Innovation Centre ................................................................................... 66
Contact Details ............................................................................................. 67

3 Executive Remuneration Report
The Purposeful Company
The Big Innovation Centre convened The Purposeful Company Task Force in 2015. The
Task Force is a consortium of leading FTSE companies, investment houses, business
schools and business consultancy firmsand policy makers. It has been examining how the
governance and capital markets environment in the UK could be enhanced to support the
development of value generating companies, acting with purpose to the long-term benefit of
all stakeholders.
The Steering Group, co-chaired by Clare Chapman and Will Hutton, oversees the work of
The Purposeful Company Task Force. The views expressed in this paper are those of the
authors, having taken input from the Task Force members and Contributors. While all Task
Force and Steering Group members subscribe to the Introduction and the Statement of
Overarching Aims set out in Sections 1 and 2 of the Policy Report, membership of the Task
Force cannot be taken to represent an endorsement of every specific policy
recommendation. Authors are acting in their personal capacity and the views expressed here
may not be taken to represent the views of their organisation.
A wide-ranging set of policy recommendations have been set out in The Purposeful
Company Policy Report published on 27 February 2017, where more information on Task
Force members may be found. This paper supplements the Executive Remuneration
subsection in the Policy Report, and provides further discussion and data on the issues
summarised there.
Steering Group
Authors
Clare Chapman, Non-Executive Director
Alex Edmans, London Business School
Tom Gosling, PwC
Will Hutton, Big Innovation Centre*
Colin Mayer, Saïd Business School, Oxford University
Advisors
Birgitte Andersen, Big Innovation Centre
Philippe Schneider, Independent Consultant

4 Executive Remuneration Report – Introduction
Introduction
Executive pay has become a signature issue for the lack of trust in business in the UK. Critics of the
status quo voice three primary concerns:
That executive pay is not linked to performance and encourages short-term behaviour that is
to the detriment of the long-term growth of the British economy;
That executive pay has become disconnected from the pay of ordinary working people to an
extent that is damaging social cohesion; and
That shareholders do not have adequate control over executive pay practices, enabling
companies to continue with practices against shareholder wishes.
Great companies need to attract great leaders, motivated to act with purpose. The commentary on
executive pay is so relentlessly negative it is easy to forget this important fact. Good CEOs remain
good value. Some of the commonly held views about executive pay are not borne out by the
evidence. However, in this Policy Report we find that reform is required to ensure that incentives are
aligned to long-term contribution, and that pay is better seen as deserved by all stakeholders.
First, pay structures need to be reformed to support purpose. CEOs should act purposefully because
of and not in spite of their incentives. Executive pay needs to have less emphasis on performance-
based incentive plans and more on high and long term shareholding. Bonus targets need to be
focused on dimensions of purpose not short-term financial returns.
Second, companies need to take a much more active stance on pay fairness. The increase in pay
ratios over the last thirty years is more capable of rational explanation than often assumed. However,
public trust in pay fairness has been seriously eroded and must be rebuilt. Also, aspects of the CEO
pay market and associated regulation make it inherently prone to inflation. There should be clear
board accountability for ensuring pay fairness is considered and communicated, supported by
appropriate transparency and employee engagement.
Third, despite significant advances over the last 15 years, executive pay disclosures still need
improvement to ensure investors have the clear information they need to judge maximum pay
opportunity and the link between pay and performance.
Fourth, the consequences may need to be strengthened for companies that lose remuneration votes
or persistently achieve significant opposition. This will enable shareholders to take robust action
against outliers, who can significantly influence the overall executive pay market.
This Executive Remuneration Policy Report sets out detailed evidence and policy recommendations
in relation to each of these four areas.

5 Executive Remuneration Report – Introduction
Figure 1: Summary of Recommendations
Our approach is to base recommendations on the highest quality academic evidence and practitioner
experience. The importance of evidential rigour in the executive pay area cannot be overstated.
Executive pay is, unfortunately, complicated. The data is inherently volatile, and apparently clear
relationships can, on closer scrutiny, simply be a result of underlying factors such as company size
and sector as opposed to saying anything inherent about pay design or levels.
As a result there are many studies on executive pay that can be highly misleading, based on
insufficiently rigorous analysis of complex datasets. By contrast, academic studies that have been
published in top quality journals have a number of safeguards. First, journals will demand that such
studies use robust techniques of analysis and control that have been developed over decades.
Second, papers will go through several rounds of stringent and challenging review and iteration
before publication, a process that can take several years. Studies that have been through this
process should therefore be accorded greater weight.
Practitioner insight can, of course, be extremely valuable in interpreting data. Rigorous analysis will
always face limitations in the conclusions it can draw. But particular weight should be accorded to
practitioner insight when it can also be shown to be consistent with robust academic analysis.
The best results arise when academic and practitioner insights are brought together in a
complementary way. This is the approach that we have taken with The Purposeful Company Task
Force, bringing together the best of theory and practice to develop policy recommendations that a
strongly grounded in evidence, yet practical, implementable, and with the highest likelihood of
bringing about desired change.
In the process we have developed what we believe to be the most comprehensive review yet of
evidence as it relates to executive pay policy in the UK.
Promoting Purpose
Fairness
Disclosure
Say on pay
Pay design
Section 1
• Increase shareholding requirements
• Reduce emphasis on target-based incentives
• Lengthen deferral and holding periods
Section 2
• Extend RemCo remit to include pay fairness
• Disclose CEO and employee pay over time
• Require meaningful engagement
Section 3
• Clarify maximum limits in policy
• Disclose change in value of shares held
• Disclose average term of equity holdings
Section 4
• Introduce escalation mechanism
• For companies <75% vote two years in a row
• Policy to be approved with super-majority
6 Executive Remuneration Report – Executive Summary
Executive Summary
Recommendation 1: Reform Pay Design
Shareholder guidelines and the UK Corporate Governance Code* should enable and encourage
companies to adopt simpler pay structures for CEOs based on long-term equity and debt
holdings to encourage long-term behaviour and to avoid the unintended consequences of
excessive focus on performance-based incentives†.
Packages should be structured so that exposure to the long-term value of the company out-weighs
the potential gains from performance-based incentives vesting in any year. This means CEOs
should rapidly (e.g. within two years of appointment) build up shareholdings of at least 2x the value
of a year’s performance-based incentives, with a target to increase this to 2x total compensation
over time.
This should be achieved through appropriate combination of: reducing performance-based incentive
plans in favour of long-term awards of equity; paying bonuses in shares; and making joining awards
of equity to CEOs, vesting over long periods.
Pay should be long-term, with shares released on a phased basis over periods of up to at least 5 to
7 years depending on industry with at least half of the shareholding requirement applying for at
least two, and preferably three, years after leaving the company. Release of equity for sale should
be phased and block-release should not be triggered on any defined event (e.g. retirement).
Performance-based incentives should balance unleveraged financial measures of growth and return
and should include non-financial and strategic measures based on fulfilment of the company’s
purpose, to ensure that targets are aligned with how companies will deliver value over the long-term
in line with that purpose.
Bonuses based on financial targets should be paid in shares, with board discretion to vary the
bonus up or down based on holistic judgement.
Particularly in highly leveraged or volatile companies, boards should consider paying CEOs in
unsecured debt (e.g. via deferred compensation plans) as well as equity.
* A suggested redraft of the UK Corporate Governance Code to reflect Recommendation 1 is provided in the
Appendix. † We use the term “performance-based incentive” to refer to a cash or equity award with performance targets
attached (typically over short-term periods of one to three years). This contrasts with simple equity awards, which while they are linked to performance by virtue of the share price, do not have performance targets attached and are not, for our purposes, included in the use of the term ‘performance-based incentive’.

7 Executive Remuneration Report – Executive Summary
Summary rationale for Recommendation 1
Evidence shows that incentive plans based on performance targets over short periods of
1 to 3 years can cause short term behaviour to the detriment of purpose and long-term
value.
Evidence also shows that high levels of shareholding and greater long-term orientation
of incentive pay have a positive impact on long term value, innovation, and long-term
orientation of companies, consistent with greater purpose.
Accordingly, packages should ensure that the primary incentive is to deliver long-term
value through the share price, outweighing any incentives driven by target-based plans
over the short to medium term.
De-emphasising annual bonuses and target-based long-term incentives, making long-
term stock awards, and requiring large shareholdings helps align executives with truly
long-term decision making and purposeful behaviour.
Simpler packages, with less reliance on performance conditions, would also avoid the
extreme difficulties that Remuneration Committees face in setting robust targets. These
changes would also help with stakeholder acceptance of pay-outs.
Share awards increase transparency as they can be easily valued at the grant date,
whereas incentives based on potentially multiple performance criteria cannot be. This
makes it clear to stakeholders how much the CEO is being paid. In addition, it is clear
under what conditions the CEO will be paid well – if the long-term stock price is high.
This reduces the problem of a CEO being well-paid despite underperforming on
performance measures given little weight in the bonus.

8 Executive Remuneration Report – Executive Summary
Recommendation 2: Strengthen board accountability for pay fairness
The UK Corporate Governance Code should be amended to broaden the role of the
Remuneration Committee to oversee that business purpose is being translated into
behaviour and decisions around reward, including in relation to pay fairness. The
Remuneration Report should include a Fair Pay Report explaining the company’s
approach to pay fairness, and including specified metrics including relative
movements in CEO and employee pay over time. The company should establish a
meaningful process for engaging with employees on the Fair Pay Report.
The Fair Pay Report should replace existing remuneration report disclosures relating to
the wider workforce and should cover, supported by data where appropriate:
The company's philosophy and principles on pay fairness across the population
(including how fairness is defined, see Figure 8 on page 38), the approach taken to
internal and external comparisons, covering the structure and level of pay, and the
approach taken to linking pay with performance, including the principal characteristics
of incentive plans used.
Explanation of how the policy on pay for the wider UK workforce differs from that for
the CEO and other executives in terms of the elements of pay offered, the quantum of
opportunity under those pay elements, and the target positioning of pay against the
market together with justification for such differences.
Explanation of the extent to which it is the company's policy and practice to pay living
wages in the territories in which it operates and how these are established, statutory
disclosures on gender pay, and broader approach to equal pay issues.
Explanation of the approach by which the company engages with employees on the
Fair Pay Report and a summary of any themes emerging from the feedback on the
prior-year's report.
Tabular disclosure over the last five years (building to ten over time) of the maximum
annual pay opportunity for the CEO; the actual amount paid (on a statutory single
figure basis) and average pay for all other employees, or an appropriate subset
representative of at least the general UK workforce.
Graphical representation of the above tabular disclosures formed by rebasing each
pay element to 100 at the start of the period, and a narrative explanation of the
comparative trend over time (see Figure 9 on page 39).

9 Executive Remuneration Report – Executive Summary
Summary rationale for Recommendation 2
The evidence suggests that levels of executive pay and the growth in pay differentials
across large companies are more rationally explicable than commonly thought, although
the executive pay market has features that make it prone to inflation.
Nonetheless, there is significant public disquiet about inequality and listed company
CEO pay is a visible symbol of that inequality in the minds of many. There is an urgent
need to rebuild trust in the rigour of the process by which pay is set.
A purposeful company should have a strong understanding of how its stance on pay
relates to the broader societal debate about fairness, as this will build trust and also
employee engagement, and is consistent with operating with purpose.
A mandated disclosure and employee engagement requirement will elevate the priority
of this discussion within boards, “nudging” behaviour towards greater restraint and
fairness.
The disclosure should meet public demands for transparency, and explanation, of the
disparity between CEO pay and worker pay, but this should focus on relative trends in
actual pay and pay opportunity over time rather than on a snapshot ratio.
Pay ratios do not lend themselves to valid comparisons between companies, even within
the same industry, and would likely add to misunderstanding over executive pay as well
as potentially creating perverse incentives.
The evidence that lower ratios are always better is not borne out by the evidence which
in fact tends to show a positive relationship between pay differentials and performance in
the UK and US.
Any statistic about pay relativity must be set in the broader context of a company’s
approach to fairness, which may be defined by external as well as internal relativities, as
well as by contribution, and so the Fair Pay Report should be broader than statistics.

10 Executive Remuneration Report – Executive Summary
Recommendation 3: Enhance executive pay disclosure
The Directors’ Remuneration Reporting regulations should be updated to enable
greater stakeholder understanding of a company’s maximum pay and relationship
between pay and performance.
The single figure table should disclose how much of the single figure arises from growth
in share price on share incentives between the date of grant and measurement of
performance and should show a separate total single figure excluding this amount.
The single figure table should include the wealth impact on CEOs of the pre-tax change in
value over the year of previously granted equity over the year. This item should also be
shown in the ten year history together with the absolute total shareholder return achieved
by the company over each year.
Disclosure of share interests should include weighted mean period to release for each of
shares beneficially held, subject to service, and subject to performance.
Within the remuneration policy a clear monetary maximum should be stated and justified
for each element of remuneration other than those linked to the value of shares, in which
case the limit should be based on the initial value of shares awarded.
Summary rationale for Recommendation 3 Current disclosures comparing pay and performance are extremely misleading and lead
to widespread misunderstanding of whether executive pay is actually linked to
performance, as they focus only on a single year’s pay-outs and not the incentive effect
of holdings of previously granted equity.
Changes in value of equity holdings are a major contributor to executive incentives and
should be shown, compared against the aggregate value created over the period, to
enable a much better and more complete analysis of executive pay.
Potential upside due to increase in share price flowing through into share awards should
not be capped – however, this should be separately disclosed to enable stakeholders to
assess where the single figure pay outcomes sits against the maximum disclosed in the
policy, and to see the contribution to the single figure from share price growth.
Boards should have to explain why they have chosen the level of maximum pay for the
CEO, and that maximum should be clearly defined – in particular the practice of allowing
certain elements, such as final salary pensions, to be in effect uncapped should end,
with a clear monetary limit on these.
Disclosure of term of share awards reflects importance of lengthening holding periods.

11 Executive Remuneration Report – Executive Summary
Recommendation 4: Toughen shareholder voting powers
A binding vote regime should be triggered when companies lose, or repeatedly fail
to achieve a threshold level of support on, the advisory remuneration vote.
This could be implemented through legislation or through changes to the UK Corporate
Governance Code. If a company loses the advisory remuneration vote in any year or
receives 25% or more vote against the advisory vote two years in a row then:
The company should bring forward their remuneration policy for approval at the next
AGM of the company as a Special Resolution requiring a 75% majority to pass.
If implementation is via regulation rather than the Code, then at the same AGM a
motion would be brought forward enabling shareholders to dis-apply, by simple
majority, the requirement to pass the remuneration policy by a super-majority.
Where issuing recommendations based on benchmark policies, proxy voting agencies
should:
Give clear guidance during engagement with companies if proposals are likely to
attract a negative voting recommendation and take into account the views, if made
public, of major shareholders in a company when making voting recommendations on
proposals where strategic fit is a strong element of the rationale.
Summary rationale for Recommendation 4:
Evidence shows that the current UK voting regime, combining triennial binding
policy vote and annual advisory vote on implementation of policy, is effective
overall, but a small proportion of companies (c. 2%-3%) either lose the advisory
vote or repeatedly secure only lower than normal levels of majority support on the
advisory vote.
There is a case for allowing practice to develop, given recently announced
intentions from investors to vote against the Chair of Remuneration Committee in
the case of persistently low levels of shareholder support. However, we do accept
the imperative to give the public confidence that shareholders have all necessary
powers.
Introducing a binding vote for all companies every year is a disproportionate
response to the problem, and would likely have many unintended consequences.
Therefore, it would be better to design an escalation approach such that only those
companies showing an inability to sustain high levels of shareholder support would

12 Executive Remuneration Report – Executive Summary
trigger a binding regime. This would enable shareholders to have impact on
outliers, who can have a disproportionate impact on market pay levels.
The requirement to bring back the policy to a vote with a super-majority imposes a
higher bar for approval for companies that have not maintained high shareholder
support in the past. This provides a disincentive against companies either having
their report voted down or consistently getting opposition above 25%, and a
sanction if they do.
Having the vote on policy rather than outcome enables shareholders to bring
pressure to bear in relation to any problematic area of policy.
The parallel motion enabling disapplication of the super-majority ensures that, in
the rare cases where a disruptive minority group of shareholders exists, they
cannot hold a company to ransom on a binding basis against the wishes of the
majority. This is only necessary if the policy is implemented via regulation rather
than via the Code.
The existence of a 25% threshold condition will give greater influence to proxy
voting agencies. It is therefore important that they engage fully with companies,
provide clear guidance, and take into account the views of the company’s major
shareholders, to avoid unintended consequences of the escalation mechanism.
13 Executive Remuneration Report – Reform Pay Design
1. Reform Pay Design
The Case for Change
Our analysis and recommendations in this Report primarily focus on CEO and Executive
Director pay. The CEO holds a distinctive position as the most senior executive. This gives
them a particular accountability for balancing the performance and long-term health of the
business. CEOs also do not suffer from the information asymmetry faced by boards, and so
may be in a better position to govern performance-based incentives for their executive
teams. While companies may well wish to have a degree of alignment in pay design across
those executive teams, the recommendations here particularly have the CEO in mind.
The main accusation made against CEO pay is that it is not linked to performance and is
therefore unjustified. This apparently simple claim can in fact take three different forms,
which are frequently confused or conflated, but which it is important to assess separately.
The first is that growth in executive pay levels over the last couple of decades is not
justified given that the performance of companies in general has not improved over
that period, whether measured by market capitalisation or returns1. The
Government’s Green Paper on Corporate Governance Reform presents this
argument with reference to a chart showing a quadrupling of CEO pay since 1998
plotted against a broadly flat FTSE-100 Index.
The second is that pay is not linked to performance in that bonuses can still pay out
even if performance is poor, and there is no obvious correlation between the highest
pay figures and the best performing companies2. This is apparently supported by the
fact that bonuses consistently pay-out at 75% of the maximum on average.
The third is that pay is linked to the wrong sort of performance – i.e. to short term
performance measures that encourage executives to act in a short term manner,
thereby harming the long-term performance of companies and the UK economy3.
In many ways the third of these accusations is the most serious. If true, it implies that
executive pay practices may be harming economic growth and could be contributing to the
current plateau in productivity growth. Therefore, this is where we start in this Section. We
return in Section 2 to the question of the growth in CEO pay levels in recent decades, and in
Section 3 to the link between pay outcomes and company performance.
In summary, we find strong evidence that pay structures can encourage short-term
behaviour. This is a serious issue that demands reform of executive pay.
14 Executive Remuneration Report – Reform Pay Design
Problems with current CEO incentives
Current incentive plan designs, in particular performance-based vesting over relatively short
timeframes of 1 to 3 years, act to undermine long-term and purposeful leadership of
companies. There are several strands of evidence for this, a number of which were
discussed in detail in The Purposeful Company Interim Report4. In summary:
Executive behaviour (for example in relation to cutting R&D expenditure, cutting
capital expenditure, managing positive news releases, and other short-term
controllable executive action) can be distorted by upcoming incentive vesting events
and by equity vesting patterns, with the effect being most extreme when
performance conditions are close to being triggered5-9
. This suggests that so-called
“long term” incentives with performance-based vesting actually encourage short-
term behaviour as vesting dates and triggers approach.
Executives discount complex performance-based long-term incentive plans to an
excessive degree, thereby reducing their effectiveness10,11
.
Short-term or poorly designed financial incentives can crowd out creativity and
intrinsic motivation and thereby act to inhibit purposeful behaviour, can be ineffective
in incentivising performance in relation to complex multidimensional jobs, and can
lead to excessive risk-taking and even unethical behaviour12-17
.
Research and experience shows that CEOs can have significant influence over
target setting and partly as a result of information asymmetry, Remuneration
Committees struggle to set consistently challenging targets as shown by the fact that
incentive pay-outs are consistently biased towards “above-target” levels18,19
.
This evidence suggests that some elements of the “performance pay model” promoted over
the last 20 years by investor and governance guidelines are faulty. This model, which is
based on bonuses and “long-term” incentive plans with performance targets over relatively
short periods of 1 to 3 years, gives rise to a range of unintended consequences including:
Increased complexity and lack of transparency
Incentives for short-term behaviour
Enormous target calibration challenges for Remuneration Committees
Pay outcomes which are not clearly understood by stakeholders on many occasions
In summary, the ability for executives to earn sums in a few years that are life changing for
them and their descendants, largely based on performance metrics that Remuneration
Committees find very difficult to select or calibrate19
, has obvious weaknesses.

15 Executive Remuneration Report – Reform Pay Design
However, evidence also suggests that a high level of equity ownership, and longer term pay
orientation, do lead to improved company returns, innovation, and CSR over the long-
term20,21
. At the same time higher levels of debt-like pay (deferred compensation and
unfunded pension plans for example) are associated with lower corporate bond yields, lower
bankruptcy risk, lower stock return volatility, lower financial leverage, and higher asset
liquidity22-26
.
So the idea that incentives do not influence CEO behaviour is not borne out by the evidence.
They do, just not always in the manner intended. Indeed, with CEOs now subject to such
high powered incentives, it is particularly important to ensure that packages are structured to
support purposeful, long-term behaviour. It is precisely because incentives do work that they
should be reformed. This is the focus of Recommendation 1.
Policy Recommendation
A model based on long-term equity and debt
The cumulative evidence suggests that the over-use of performance-based vesting (where
bonus and share awards are triggered according to performance against pre-defined targets
over 1 to 3 years) gives rise to many of the problems with the current pay model. At the heart
of our proposal is to reduce the emphasis on this feature of incentives, with all the
unintended consequences that arise. Instead packages should rebalance towards awards of
long-term equity and debt11, 21, 27-29
, released over at least five years and in many cases
longer periods, such as seven years. Awards should vest and be available for sale on a
progressive basis to avoid major cliff-vesting events that could skew behaviour9, 17, 29, 30
. This
will result in higher equity holdings persisting significantly beyond an executive’s tenure.
The recommendation to de-emphasise performance conditions will be controversial, given
the emphasis that this feature of pay design has had in shareholder guidelines and
governance codes. We do accept that there are circumstances where performance
conditions can work. Performance-based incentives that form a smaller portion of the
package, may continue to offer a useful signalling and incentive purpose, and would place
less strain on the target setting process that is a source of such difficulty for Remuneration
Committees. Smaller incentives could be more truly variable, so restoring public confidence.
Moreover, particularly in distressed businesses, transformation or turnaround situations20
or
where there is a strong controlling owner or blockholder able to oversee target setting31
then
greater emphasis on performance-based vesting may be appropriate. In these situations
there is clarity of objective, of measurement, and of oversight. However, in many
circumstances the necessary conditions do not exist for large-scale performance-based
vesting to operate effectively and without unintended consequences.
So we are not proposing a “one-size-fits-all” model, but rather a change in centre of gravity
of market practice. While recognising the importance of pay structures and incentive plans
16 Executive Remuneration Report – Reform Pay Design
that are tailored to a company’s strategy, market practice should shift in general towards less
emphasis on performance-based vesting, and more emphasis on high levels of long-term
shareholding to create the right incentives for long-term purposeful behaviour.
Recommendation 1
Shareholder guidelines and the UK Corporate Governance Code should enable and
encourage companies to adopt simpler pay structures for CEOs based on long-
term equity and debt holdings to encourage long-term behaviour and to avoid the
unintended consequences of excessive focus on performance-based incentives‡.
Packages should be structured so that exposure to the long-term value of the
company out-weighs the potential gains from performance-based incentives vesting in
any year. This means CEOs should rapidly (e.g. within two years of appointment)
build up shareholdings of at least 2x the value of a year’s performance-based
incentives, with a target to increase this to 2x total compensation over time.
This should be achieved through appropriate combination of: reducing performance-
based incentive plans in favour of long-term awards of equity; paying bonuses in
shares; and making joining awards of equity to CEOs, vesting over long periods.
Pay should be long-term, with shares released on a phased basis over periods of up
to at least 5 to 7 years depending on industry with at least half of the shareholding
requirement applying for at least two, and preferably three, years after leaving the
company. Release of equity for sale should be phased and block-release should not
be triggered on any defined event (e.g. retirement).
Performance-based incentives should balance unleveraged financial measures of
growth and return and should include non-financial and strategic measures based on
fulfilment of the company’s purpose, to ensure that targets are aligned with how
companies will deliver value over the long-term in line with that purpose.
Bonuses based on financial targets should be paid in shares, with board discretion to
vary the bonus up or down based on holistic judgement.
Particularly in highly leveraged or volatile companies, boards should consider paying
CEOs in unsecured debt (e.g. via deferred compensation plans) as well as equity.
‡ We use the term “performance-based incentive” to refer to a cash or equity award with performance targets
attached (typically over short-term periods of one to three years). This contrasts with simple equity awards, which while they are linked to performance by virtue of the share price, do not have performance targets attached and are not, for our purposes, included in the use of the term “performance-based incentive”.
17 Executive Remuneration Report – Reform Pay Design
Detailed Policy Discussion and Rationale
Equity released over 5 to 7 years
The timeframe of equity awards should be higher than currently. Research shows that the
market may take five years fully to incorporate information about intangible investments into
the stock price32, 33
. This suggests at least a comparable timeframe for the release profile of
equity awards. Indeed a range of investor guidelines, financial services regulations,
practitioner experience, and academic research27-29,34-39
, suggests timeframes extending out
to between 5 and 7 years for the vesting and holding of equity awards. Sale restrictions
should lift on a phased basis rather than linked to any fixed date or event (such as
retirement) to avoid perverse consequences, and also to mitigate against short-term
behaviour that may arise, particularly towards the end of the executive’s tenure17, 30, 40
. The
precise timeframe of release would depend on particular business circumstances34
and we
might expect to see sector differences between shorter and longer-term industries (for
example recruitment consultants versus mining companies). However, the presumption is of
longer timeframes than the current norm of 3 to 5 years. As required by the current UK
Corporate Governance Code, malus and clawback would apply as appropriate.
Proposals for long-term vesting of equity awards often come up against two arguments. The
first argument is that the time period for the awards exceeds the average tenure of a CEO
(for the world’s largest 2,500 companies a recent study41
found this to be 4.2 years or 5.6
years depending on whether they took office after a forced or planned succession).
However, timeframes of tenure should not be confused with timeframes of accountability for
actions taken while CEO. At the most senior levels, and certainly for CEOs, it is reasonable
for vesting and holding periods to apply on a phased basis for a number of years after they
leave the company. This creates appropriate incentives for CEOs to ensure that their actions
are sustainable over the long term. An important aspect of sustainability is succession
planning. Requiring CEOs to hold stock for a period after they leave the company should
provide a powerful incentive to focus on a critical, but often underemphasised, component of
their role.
The second argument is that executives will heavily discount awards that are deferred for a
long period of time10, 11, 29
. It is important to note that our main objective is to ensure greater
long-term exposure to the share price. This can be achieved both through awards that are
deferred, and so subject to malus and forfeiture on resignation, and through awards that
must be held, and so are fully vested but subject to changes in the share price. Experience
suggests that once awards cease to be forfeitable, the level of discount applied by
executives reduces substantially
Overall, in light of the behavioural risks associated with the potential for rapid build-up of
wealth given current market levels of pay for CEOs, it is surely more important to get the
structure of pay right to create the right incentives, even if that results in pay that is higher
than it might otherwise have been. It has been noted that executives should accept a

18 Executive Remuneration Report – Reform Pay Design
reduced level of award for replacing long-term incentive plans by restricted stock10, 11, 28, 29, 35
.
In some cases a discount of up to 50% has been argued for by investor groups35, 38, 42
.
However, executives will legitimately discount awards where deferral periods are longer29
. It
would be better to accept lower discounts (say, of one quarter or one third) in order to
achieve longer deferral or holding periods, given the reduced saving in executive pay is
dwarfed by the increased value arising from more purposeful behaviour, which can add 2%-
3% a year to shareholder returns32, 33
.
Increased stock ownership requirements
A rigorous study has down that firms with high CEO stock ownership outperform those with
low stock ownership by a very significant margin of 4-10% a year21
. This research shows
that the relationship is very likely causal – that is, stock ownership drives the CEO to perform
better, rather than CEOs knowing that their firm will perform better and therefore buying
more stock. In principle excessive stock ownership may also lead to CEO entrenchment and
risk-averse behaviour43
. More research is needed to establish exactly where the trade-off
resides. However, given that UK levels of CEO stock ownership are generally significantly
less than the US levels, where research shows that the higher levels of shareholding are
beneficial, it is reasonable to assume UK practice is not yet at counterproductive levels.
Amongst FTSE-100 CEOs the median level of after-tax equity exposure from all vested and
unvested equity (including long-term incentive plans, discounted by 50% for the impact of
performance conditions) is approximately £6.5m or 850% of salary44
. Of this around £4.5m
or 550% of salary is stock that is already vested, and beneficially owned by the executive. At
the upper quartile, total equity exposure is around £20m or 2200% of salary. This suggests
that current typical stock ownership guidelines for FTSE-100 CEOs of around 250% to 300%
of salary are purely notional, and should be increased.
We develop our approach to appropriate levels of shareholding based on two principles:
1. CEOs should rapidly (ideally within two years) build a shareholding so that the
incentive provided by their shareholding dominates the incentive provided by a
single year’s opportunity under performance-based plans.
2. Over time, the shareholding should build so that lower quartile performance creates
a penalty for the CEO through their shareholding equivalent to a year’s
compensation.
Coupled with lengthened release periods, these levels of exposure would create strong long-
term alignment with sustainable performance.
The justification for the first principle is that an executive should be more concerned about
whether the share price will be, say 25%, higher or lower in several years’ time than by
whether they hit short-term vesting triggers. Why 25%? Analysis across multiple sectors

19 Executive Remuneration Report – Reform Pay Design
suggests that out-performance of 5% to 7% pa represents approximately one quartile of
performance over 3 to 5 years. So for example the difference between median and upper
quartile or between lower quartile and median within a sector over 3 to 5 years will typically
be around 25% in share price terms. The aim is that this level of difference in medium term
share price performance should offset an entire year’s performance-based incentives.
Incentives are paid pre-tax and shareholding requirements are defined based on shares held
after tax. This means that for a 25% share price movement to have more significant impact
than a given incentive opportunity, the CEO would need to hold shares worth approximately
2x that incentive opportunity (a 25% change in share price would then change the value of
shares held by 0.5x the incentive opportunity, which given that the shares are held after tax
is approximately 1x the pre-tax opportunity, given UK total tax rate of close to 50%).
Therefore, a shareholding of 2x the incentive opportunity that can vest in any given year
ensures that the difference of one quartile of performance over the medium term is
equivalent to a year’s incentives. Any executive who pursues short term actions to trigger a
single year’s incentive plan performance conditions at the expense of medium-term share
price, will, over time, have the benefit of that year’s incentives offset by the negative share
price impact on their share portfolio. This creates a natural counterweight to the short-
termism that performance-based incentives plans can create.
In a typical FTSE-100 company, a CEO might might have incentives of up to 500% of salary
vesting in any given year based on performance targets. Therefore, the CEO’s holding would
need to be 10x salary in order for the shareholding to dominate the incentive opportunity on
the basis defined. Note that there is no reason why this exposure should be restricted to fully
vested equity – unvested equity should be included.
For a new joiner, a holding of 10x salary would take at least five years to establish. This is
too long – it is important that the incentive effect of the high shareholding is achieved early in
the CEO’s tenure to ensure a long-term mind-set. To meet this goal within a rapid timeframe
would therefore require some combination of:
Rebalancing packages away from performance-based incentives to stock awards;
Payment of bonuses in shares;
Initial stock awards or buy-in requirements for an executive on joining; and / or
A phased approach so that performance-based incentives are increased in
importance in the package over time as the shareholding builds up.
The goal of building to 2x total compensation over time ensures that a quartile's difference in
performance creates an incentive impact equivalent to a year's total compensation. This
ensures a strong focus on long-term share price. With median total compensation in the

20 Executive Remuneration Report – Reform Pay Design
FTSE-100 being around £4m, a requirement of 2x total compensation would equate to a
target total after tax equity exposure equivalent to around £8m or, again, around 10x salary.
Although this sounds very high relative to current minimum guidelines, this level of holding is
only around a quarter more than current median exposure in the FTSE-10044
if unvested
equity is included. This level of exposure over the medium term therefore appears eminently
achievable over a period of 5 years or so, if the package is appropriately structured.
Payment in debt
The case for payment in debt has been considered by a number of authors22-26
. This is
because of the significant evidence that the level of leverage in incentive packages does
influence risk-taking behaviour45
. Particularly in highly geared companies or volatile
industries, equity can create an incentive for excessive risk. This is because the value of
equity rises if a risky project pays off, but it is protected by limited liability if things go wrong –
thus, equity gives them a one-way bet. Similarly if a firm is teetering towards liquidation,
rather than optimally accepting a mild bankruptcy, the executive may ‘gamble for
resurrection’. In such cases, use of long-dated unsecured debt can help create a
counterbalance.
In the past, unfunded defined benefit pension plans were a form of debt compensation.
Deferred compensation plans, of the type common in North America, can have similar
impact. Research shows that executives with such plans led companies that were
associated with lower bond yields and higher bond prices23,24
suggesting that debtholders
are indeed reassured by the CEO’s lower incentives to pass risk onto them. Higher levels of
debt-like compensation were also associated with lower bankruptcy risk, lower stock return
volatility, lower financial leverage, and higher asset liquidity25,26
. A return to the days of
defined benefit pension plans for executives is unlikely to secure public or shareholder
support. But there are other ways to pay executives in unsecured debt.
The simplest would be simply to convert the current practice of cash “pension contributions”
into unfunded deferred compensation payments. These would accumulate in a fund and be
payable, say, over the five years following retirement. The value of these on payment would
only be reduced in case of default – either they would pay or, in case of default would reduce
in line with other unsecured debtors.
Alternatively, banks have used debt instruments and Contingent Convertibles (“CoCos”)
which align executives on a more continuously variable basis with the creditworthiness of the
firm, via the change in market price of these instruments as creditworthiness varies. Indeed
regulators have encouraged use of such instruments39
. There are, however, formidable
practical difficulties with using traded debt in compensation plans. Companies may not have
sufficient tranches of traded unsecured debt to provide compensation vehicles of appropriate
duration. Moreover, consumer-protection regulation often requires such bonds to be in high
denominations only, so as to discourage retail investors – as such they may not be
sufficiently fungible for compensation purposes.
21 Executive Remuneration Report – Reform Pay Design
Widespread adoption of debt-based compensation is therefore more likely to take the form of
deferred compensation arrangements as described above or phantom arrangements based
on credit default swaps – the value of a phantom award, initially 100, say, could move up or
down in line with the movement in credit spreads.
Given the market trend towards less leveraged pay arrangements (shares rather than
options) the focus for exploring debt-based compensation could initially be on those
industries that are most volatile or leveraged, such as banking and commodity companies.
Incentives measures linked to long-term value and the company’s purpose
Incentive plan measures in UK companies are dominated by measures such as Profit Before
Tax, Earnings per Share, Relative TSR. These measures have a common feature in that
they are enhanced by leverage. Although Relative TSR should take into account risk and
return, in practice experience suggests that in a market upswing the measure creates an
incentive to adopt leverage at least as great as other companies in the peer group. This was
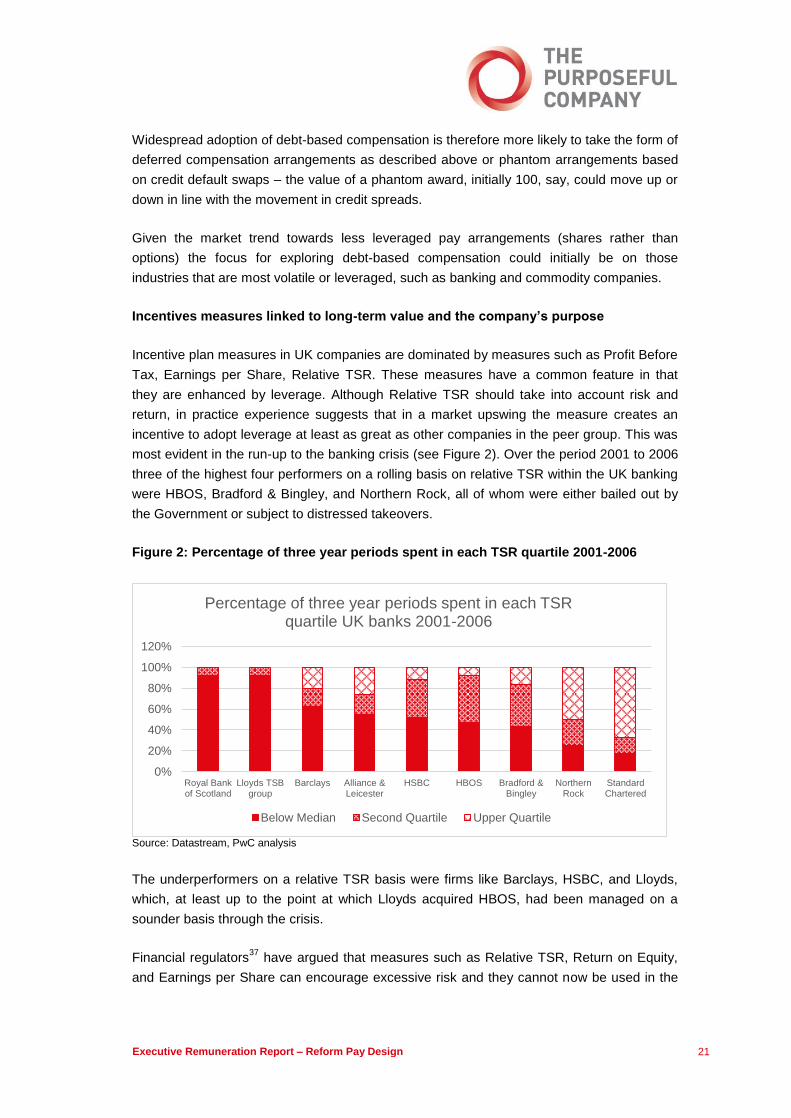
most evident in the run-up to the banking crisis (see Figure 2). Over the period 2001 to 2006
three of the highest four performers on a rolling basis on relative TSR within the UK banking
were HBOS, Bradford & Bingley, and Northern Rock, all of whom were either bailed out by
the Government or subject to distressed takeovers.
Figure 2: Percentage of three year periods spent in each TSR quartile 2001-2006
Source: Datastream, PwC analysis
The underperformers on a relative TSR basis were firms like Barclays, HSBC, and Lloyds,
which, at least up to the point at which Lloyds acquired HBOS, had been managed on a
sounder basis through the crisis.
Financial regulators37
have argued that measures such as Relative TSR, Return on Equity,
and Earnings per Share can encourage excessive risk and they cannot now be used in the
0%
20%
40%
60%
80%
100%
120%
Royal Bankof Scotland
Lloyds TSBgroup
Barclays Alliance &Leicester
HSBC HBOS Bradford &Bingley
NorthernRock
StandardChartered
Percentage of three year periods spent in each TSR quartile UK banks 2001-2006
Below Median Second Quartile Upper Quartile

22 Executive Remuneration Report – Reform Pay Design
banking sector other than as part of a balanced scorecard including non-financial and risk-
adjusted measures. Cedar Rock, a long-term value investor, has similar concerns about
leveraged measures46
arguing that they provide an incentive for excessive leverage,
underinvestment in value enhancing revenue expenditure items (such as marketing and
brand, training and development) and preference for share buybacks over dividends. They
argue that performance should be based on unleveraged measures of growth and return,
with a particular focus on unleveraged return on capital. We would support the view that
returns-based measures have been underemphasised in UK companies, despite the
Investment Association Guidelines for some time stating that measures should balance
growth, returns, and risk38
. We support the view that where financial measures are used for
target-based incentives, measures of growth and return should be balanced within financial
measures, and should be based on unleveraged definitions.
Given the evidence that the market can undervalue intangibles32, 33
, there is a case for
retaining an element of shorter term incentive for executives to build intangibles, recognising
that the benefits may not flow through into share price for some years. As we recommend in
The Purposeful Company Policy Report, it is vital for companies to express their purpose in
terms of tangible financial, non-financial, and strategic goals. The measures used will
depend upon the company’s purpose but could include, for example: strategic goals,
customer satisfaction; employee engagement, diversity, and social mobility; health & safety;
or progress towards sustainable business goals (as in, for example, the Unilever Sustainable
Living Plan). Well-defined, such metrics are not “soft” metrics, but rather a clear and
quantifiable articulation of the company’s purpose and route to long-term value creation.
These could be linked to incentives.
Although over the very long term equity should reflect intangibles and purpose, there is a
motivational benefit of linking progress towards achieving the company’s purpose to reward
in the shorter term. This is not without problems given the difficulties of setting non-financial
goals19, 47
. However, risks can be mitigated by ensuring that cash bonuses when used in this
way are relatively small compared with long-term equity grants, and by ensuring that targets
are structured with a high degree of “in the round” discretion for Boards, to avoid perverse
consequences arising from mis-specified targets or metrics.
Evidence suggests that pay-outs from annual bonuses are both higher and less variable
than from long-term incentives44
. This suggests that the calibration challenges faced by
Remuneration Committees for bonuses are particularly acute. At the same time, bonuses
are even more prone than long-term incentives to create unintended consequences of short-
termism. We therefore suggest that bonuses based on financial metrics should be paid in
shares subject to a deferral or holding period to ensure a counterbalance to any short-
termism that could arise from pursuit of short-term financial metrics.

23 Executive Remuneration Report – Reform Pay Design
Use of discretion
Where performance-based incentives are used, it is essential that in-the-round discretion is
available to Remuneration Committees to avoid the unintended consequences that may
arise. Of course the smaller the role performance-based incentives play in the package, the
less requirement there is likely to be for discretion, as the potential unintended
consequences are of lower magnitude, and there will be greater acceptance from executives
for “taking the rough with the smooth”.
However, for discretion to have credibility with executives, there should be a clear
understanding with shareholders that such discretion may act upwards as well as
downwards. While the investor expectation for downwards discretion has become well-
established, upwards discretion is less well accepted.
A practical proposal
The above prospectus sets out a radical agenda for change. However, the resulting
remuneration packages are neither unrealistic nor unrecognisable.
We would not encourage a one-size fits all model. Pay packages should be tailored to
individual company circumstances and strategies. There may be circumstances where
traditional performance-based incentives may continue to be appropriate. This may
particularly the case in transformation or turnaround situations or distressed companies19,31
.
Package designs that meet the principles we suggest are likely to have features that go
against many current corporate governance norms, for example:
Pro-rating for time: reducing the value of long-term equity awards for good leavers
simply means the timeframe of pay becomes shorter as CEOs approach retirement.
Making buy-outs in the form of performance-based awards: in fact, making buy-outs
in the form of shares provides the perfect opportunity to accelerate stock-holding as
a balance to future performance-based incentives.
Heavy weighting to target based incentives: packages should be rebalanced towards
long-term stock awards to avoid short-term behaviour.
However, we believe these norms should be set aside, as they militate against development
of packages that support long-term, purposeful behaviour. We set out in Appendix A
suggested redrafting of the relevant sections of the UK Corporate Governance Code to
achieve the objectives set out in this Section. Noting that current median FTSE-100 CEO
total compensation comprises roughly £1m of fixed pay (base plus pension) and £4m pa
total compensation, the following packages would deliver broadly a market competitive level
of value, while meeting the principles set out above.

24 Executive Remuneration Report – Reform Pay Design
Figure 3: Example package delivering competitive median FTSE-100 CEO total pay
Component Design and level
Fixed Pay £1m pa
Bonus £0.75m pa, in cash, based on building intangibles, £1m max
Stock award £2.25m pa, vesting 20% a year over 3 to 7 years
Total Pay £4m pa, in line with median FTSE-100 total pay
Shareholding target 200% of fixed pay in vested stock
Depending on the risk and leverage of the company, the stock award could be partly delivered as long-dated
debt. The stock awards (after tax) build to the target level of 2x the bonus opportunity within two years. Over time
the stock awards would build up to a natural ongoing net of tax stock exposure of £6m through unvested stock.
This is why a shareholding target on vested stock is added, to ensure that the total stock exposure is £8m, or
200% of total compensation.
Annual package illustration
Note that fixed pay has been consolidated into a single figure. We do not see the rationale
for high levels of pension contribution or other benefit allowances for senior executives, and
support, for simplicity and transparency, use of a simple cash-based fixed pay amount.
There are various different ways in which the goal may be achieved of focusing packages on
higher and longer-term shareholding. Figure 4 shows how target-based incentives could be
retained for part of the package, balanced by an upfront stock award.
Year 0 Year 1 Year 2 Year 3 Year 4 Year 5 Year 6 Year 7
Base £1m
Bonus
£0.75m
Stock
award
£2.25m
Vests over 3 to 7 years

25 Executive Remuneration Report – Reform Pay Design
Figure 4: Example package delivering competitive median FTSE-100 CEO total pay
Component Design and level
Fixed Pay £1m pa
5 year stock award £7.5m awarded on joining vesting 20% a year over 5 years with each
tranche subject to a subsequent four year holding period (so shares are
released over 5 to 10 years) – equates to £1.5m pa
Annual bonus £0.5m pa paid in cash based on strategic and non-financial goals
Long-term incentive £1m pa based on operating profit growth and return on capital employed
over three years, paid in shares
Total Pay £4m, in line with median FTSE-100 total pay
Shareholding target Not applicable, as share exposure is achieved through stock award
The package would be renewed with a further five year stock award on the fifth anniversary of joining. Making
block share awards ensures that high levels of shareholding are maintained throughout the period, balancing the
shorter-term incentives provided by target-based awards.
5 year package illustration
The purpose of these example packages is to show that a reformed model is perfectly
achievable. As well as achieving better incentives for purposeful, long-term behaviour, the
proposal also simplifies pay, reduces maximum levels of total compensation, and avoids the
potential for outsized, and apparently random, rewards.
Year 0 Year 1 Year 2 Year 3 Year 4 Year 5 Year 6 Year 7
Base £1m
Bonus£0.5m
Stock
award
£7.5m
vesting
£1.5m pa
LTI £1m
4 year holding period on stock

26 Executive Remuneration Report – Strengthen Board Accountability for Pay Fairness
2. Strengthen Board Accountability for Pay Fairness
The Case for Change
In this Section we address the challenge that recent growth in executive pay seems
disconnected both from performance and from the increase in pay of the ordinary worker.
We will find that trends in levels of CEO pay are more capable of rational economic
explanation than is generally believed. However, the economically rational outcome is ever
less acceptable to the public. Therefore, action must be taken to restore trust in the fairness
of pay.
The concerning growth in CEO pay
This growth in CEO wages, and wage disparities, has become a visible symptom of the
perceived disconnect between ‘elites’ and ordinary people in the UK. The Government’s
Green Paper on Corporate Governance Reform highlights the perceived issue. Comparing a
quadrupling of average executive pay since 1998 against a broadly flat FTSE-100 over that
period (see Figure 5) they note that “A number of shareholders and other stakeholders have
queried whether this very significant increase in FTSE 100 CEOs’ pay has been matched by
increases in the long term value of the companies they manage.”
The chart overleaf from Manifest is commonly cited as showing the disconnect between
CEO pay and company performance. Manifest note that this chart is based on average pay,
which is significantly distorted by outliers. Median pay is consistently around 20% lower.
However, the fact that CEO pay has multiplied in value since 1998 cannot be denied.

27 Executive Remuneration Report – Strengthen Board Accountability for Pay Fairness
Figure 5: FTSE-100 average CEO pay over time§
This time period is often chosen for CEO pay comparisons as 1998 is the first year for which
complete executive pay and pension data is available. However, when pay is analysed over
longer periods a different picture emerges. An analysis of executive pay by PwC48
starts in
the early 1980s, which reflects the point at which developed western economies took a
marked turn towards more free market policies. They analyse the development of executive
pay into three main time periods since the FTSE-100 came into being in 1984:
The period 1984 to 1998 reflecting rapid globalisation of business, and the start of
more market oriented approaches to executive pay, including the practice of granting
stock options to senior executives.
The period 1998 to 2007 which was a period of global convergence of pay, and also
the growth of the ‘pay governance era’ commencing with the Greenbury report in the
UK and enhanced disclosure rules, leading to more use of complex long-term
incentive plans and increased use of benchmarking.
The period 2007 to date, reflecting post-crisis stagnation and toughening of pay
rules.
§ From Manifest (2016), ‘The Executive Director Total Remuneration Survey’, July 2016 edition. Data for 2015
includes year ends up to 31 December 2015. Pay definition is Total Remuneration Awarded, comprising salary and benefits, actual bonus, expected value of actual LTI. Pay amount shown is average not median pay.

28 Executive Remuneration Report – Strengthen Board Accountability for Pay Fairness
The growth in CEO pay over this period is shown in Figure 6, alongside growth in company
size, GDP and wages.
Figure 6: Growth in CEO pay, company size, GDP and wages 1984-2015**
Period analysed in Green
Paper (Figure 5)
Real growth (% pa) 1984-1998 1998-2007 2007-2015 1984-2015
Globalisation of Business
Globalisation of Pay
Post-crisis Stagnation
Whole Period
Med FTSE-100 CEO pay 6.2 9.1 (0.4) 6.7
Med FTSE-100 Market Cap 13.1 0.8 0.0 6.1
GDP 3.3 2.2 0.0 2.5
Wages 2.7 1.8 (0.4) 1.8
Over this period, median CEO pay of companies in FTSE-100 Index increased around 7.5x
in real terms. Over the same period, the declining share of wages in GDP means that wage
growth has fallen behind economic growth by around 20%. In combination these factors
mean that the ratio of FTSE-100 CEO pay to UK median earnings has increased from
approximately 33x when the FTSE-100 Index was launched in 1984 to over 140x in 2015.
The development of executive pay and company size was not even over the whole period.
Growth in company size vastly outpaced the growth in pay over the period 1984 to 1998.
Executive pay caught up over the period since 1998, during which the median company size
has grown very little.
It is the period from 1998 that is focused on by many commentators, as 1998 marks the start
** There is less ready availability of pay data for 1984, given disclosure rules operating at the time. PwC have
estimated median CEO pay in the FTSE-100 at approximately £200,000 pa in 1984 based on a range of academic and data sources
48.
0
200
400
600
800
1000
1984 1998 2007 2015
Ind
exe
d v
alu
e r
eal
term
s (
198
4 =
100
)
Real growth in FTSE-100 CEO Pay and other metrics(1984 to 2015, 1984=100)
CEO pay
Median FTSE-100 Market Cap
GDP
Median Wages

29 Executive Remuneration Report – Strengthen Board Accountability for Pay Fairness
of improved pay disclosure rules in the UK, meaning data is easier to come by. Over this
period, and in particular 1998 to 2007, the growth in pay indeed outstripped the growth in
company size by a wide margin. However, it is arguably misleading to look at this period in
isolation, ignoring the decade and a half that went before.
It should not be a surprise that the growth in pay lagged the growth in company size.
Significant changes in CEO pay levels only happen every few years at a company and are
particularly triggered by CEO recruitment. At the same time, introduction of enhanced
disclosure rules in 1998 would have given a clearer view as to market levels of pay,
triggering a clearing of the market price in the subsequent years.
This analysis suggests that over three decades, executive pay growth has not been so
detached from the growth in size of companies, although from 1998 it has been.
Nonetheless, the reasons for the increase in executive pay are hotly contested34
. Factors
that may reasonably be seen as justifying an increase in the pay ratio include the following:
As noted above, the constituents of the FTSE-100 have changed enormously since
1984. In particular the median value of a FTSE-100 company has grown 6.3x in real
terms, whereas the economy has broadly doubled in size48
. FTSE-100 companies
have, therefore, become over 3x more valuable relative to the size of the economy
over the last three decades. Research suggests we can expect a strong positive
relationship between company size and pay levels, so a significant proportion of the
increase in executive pay may be explicable in terms of increased size and
complexity of the largest companies49
.
CEO pay has become more risky, through the decline of final salary pensions and
the growth in performance based pay. This has led to performance-based pay
increasing from perhaps 25% of the package 30 years ago to more like 75% now. At
the same time contractual protection and CEO tenure have reduced, so part of the
increase in pay can be explained by compensation for extra risk.
Finally, the CEO skills required to lead large companies have shifted from firm
specific skills to more general managerial and leadership skills. This has opened up
a more competitive market for executive talent with greater external and international
hiring, leading to stronger market mechanisms in pay determination.
However, other less acceptable factors may also have contributed to the increase:
Executive pay disclosure rules may have led to a ratcheting effect in executive pay
through chasing of benchmarks – while this may partly have led simply to
acceleration of trends already underway, there is evidence that this has also had a
causal impact50
.
30 Executive Remuneration Report – Strengthen Board Accountability for Pay Fairness
Research and theory suggests that executive pay is subject to contagion effects51
,
where overpayment by a few companies or in a particular segment of the economy
can result in an increase in levels of pay across the market. The financial services
sector, where there was a well-documented pay bubble in the run up to the financial
crisis52
, may have had a significant contagion effect in the UK and US.
The spread of target-driven performance pay, combined with the relatively low cost
of CEOs relative to the value of companies they lead, may have led to a culture in
which almost any payment can be justified: if upper quartile performance by a typical
FTSE-100 company adds £10bn over three years, then even £100m can be
articulated as a “small price to pay” for that success. Equally, performance-based
pay plans can inhibit understanding of the true value of pay being awarded to CEOs.
Pay regulation (disclosure, tax, deferral rules etc) may have had unintended
consequences, leading to pay increasing53,54
.
Excess managerial power and weak governance may have led to excessive growth
in CEO pay55
.
There is further evidence pay at listed companies has increased no faster than pay across a
number of high skill occupations (private companies, private equity, professional services,
medicine, media, sports, and so on). Furthermore, there is evidence that increases in pay
simply reflect the growing complexity of the world’s largest companies, higher returns to
scarce talent, and growing convergence in international executive pay markets49,56-57
. When
hedge funds and private equity take control of companies they make many changes to the
operation of the company, including potentially firing the CEO, but they do not tend to cut
pay, and indeed frequently increase it31,59
If pay in listed companies were so out of line, we
would expect to see changes when the listed company governance environment is replaced
by close private supervision.
Overall, across all the evidence it would appear that the majority (but by no means all) of the
increase in executive pay over the last three decades is due to rational factors (increased
size and complexity of companies, increased importance of managerial talent, increased
risk-profile of CEO roles and pay) as opposed to factors that might be regarded as market
weakness or ‘failure’.
The evidence suggests that the growth in listed company CEO pay is part of a broader
economic phenomenon relating to returns to talent where there is scarcity, as opposed to a
market failure. This makes the political problems created no less difficult – if anything more
so. But it does suggest that an excessive focus on CEO pay levels at listed companies as
opposed to broader drivers of inequality may not yield the desired results. Indeed there is
evidence that public concerns about inequality relate as much to their own insecurity about
future employment prospects as to the level of inequality in society of itself60
.

31 Executive Remuneration Report – Strengthen Board Accountability for Pay Fairness
A widening pay gap
The increase in CEO pay relative to average earnings has caused a significant increase in
pay ratios. The ratio of median FTSE-100 CEO pay to national average earnings has
increased from around 33x in 1984 to around 140x today48
. As noted above, part of this
increase can be attributed to the fact that the median FTSE-100 company has become
around 3x more valuable relative to the economy than in 1984. PwC note that if the pay ratio
had simply increased in proportion to the relative size of FTSE-100 companies since 1984,
the ratio today would be 97x. The difference between this ‘theoretical’ ratio expansion due to
company size and the actual outcome of 140x is due in broadly equal parts to CEO pay
increasing faster than company size (“excess CEO pay growth”) and to wages growing
slower than GDP (“median wage suppression”). This is shown in Figure 7.
Figure 7: Growth in CEO pay ratio, 1984 to 201548
Source: PwC
As companies become bigger and more complex, the role of the CEO becomes more
valuable to shareholders, whereas the role of the typical employee does not. The CEO of a
retailer with 7,000 stores can add ten times the value to shareholders than one with 700
stores. Yet the role of the store manager, and their pay, is similar in both companies.
CEO actions can scale in a way that those of the typical employee cannot. If the CEO of a
typical FTSE-100 company takes action to enhance its value by just 1%, this is worth around
£100m to shareholders, a vast multiple of the value a typical employee can add. So to the
extent that the size of large firms grows faster than the economy, it should not be surprising
to see CEO pay at those firms increase relative to average earnings. This is indeed what has
happened.
0
20
40
60
80
100
120
140
160
1984 2015
CE
O p
ay
ratio
Sources of CEO ratio expansion
Excess CEO pay growth
Median wage suppression
Theoretical ratio expansion
1984 baseline
32 Executive Remuneration Report – Strengthen Board Accountability for Pay Fairness
A damaging disparity?
It is often assumed that the widening pay gap must be harmful to company performance and
productivity. In fact, the evidence on this is mixed, and indeed is overall suggestive of a
positive relationship between higher pay differentials and performance. There is a significant
body of large-scale research (i.e. studies across many companies) in highly respected peer-
reviewed journals that would suggest high pay differentials are associated with higher
performance. See for example the empirical analysis of Kale, Reis, and Venkateswaran in
the Journal of Finance61
and of Faleye, Reis, and Venkateswaran in the Journal of Banking
and Finance62
. The abstract of the latter paper summarises its conclusions as follows: ‘We
do not find a negative relation between relative pay and employee productivity...We also find
that firm value and operating performance both increase with relative pay.’
These studies were based on US data. A comprehensive study by Mueller, Ouimet, and
Simintzi63
, soon to be published in the Review of Financial Studies, has replicated this result
also for UK data. These authors find that ‘...firms with higher pay inequality...have higher
valuations and stronger operating performance.’ These studies, in some of the most
respected journals, support the concept that paying more for better top talent leads to
companies attracting better managers, who then deliver better performance.
The evidence is not all one-way however64
. Connelly et al65
find on a US dataset that
impacts are different over the short and long term, and state that: ‘...although pay dispersion
may initially result in positive short-term firm performance gains, those gains are fleeting and
are soon replaced by negative long-term performance over time.’ However, their measure of
long-term performance is future profitability growth, and so the higher growth of low-ratio
companies is somewhat mechanical given their starting point is low profitability (which may
explain why the current pay ratio is low). They also do not control for size, industry, or other
potentially important factors. In addition, we are not aware of a secondary confirmation of
this finding. There is also survey-based evidence that high CEO pay creates negative
employee attitudes. For example a CIPD66
survey of employees found 59% agreed that CEO
pay levels in the UK demotivate employees. However, such survey-based approaches suffer
from the serious weakness that they simply record how people feel, not what the actual
result on motivation firm performance is in practice.
The research overall points to a tendency for higher differentials to be associated with higher
performance, reflecting the concept that paying more enables firms to attract better
management talent. But it is far from a perfect correlation and is likely to be situational. In
some companies, restrained executive pay can be part of a strong sense of fairness that
beneficially reinforces a company’s purpose and culture. Employee owned or mutual
organisations might fit in this category. But equally, there will be companies where low pay
differentials reflect lack of competitiveness, which inhibits the ability to attract and retain
talented managers, leading to a negative spiral of declining performance. Conversely, high
pay differentials can be part of a culture of excellence, which does not conflict with
performance or purpose at all. A number of technology companies might fit this mould.
33 Executive Remuneration Report – Strengthen Board Accountability for Pay Fairness
Conversely there are companies where high pay differentials can reflect a culture of weak
governance and self-interested management, detached from the needs of stakeholders.
Overall we should be very cautious about assuming that high pay differentials per se are
either good or bad. It depends on the circumstances. The balance of evidence does not
suggest that systematically lower pay differentials in the UK will be beneficial for the
performance of companies. If anything the balance of evidence points in the opposite
direction. Therefore a policy that actively pushes for lower differentials in all cases could be
economically damaging. At the same time, pay differentials that are unjustified are likely to
be corrosive to the corporate social fabric.
This discussion has an important implication for policy. It suggests that there is unlikely to be
a cost-free solution to the perceived problem of CEO pay levels and relativities. If there were
a significant market failure in executive pay, then a technical solution could be sought to
address that failure, in terms of enhanced shareholder powers for example, which could be
expected both to reduce pay and increase market efficiency. However, the evidence does
not suggest the existence of such an easily resolvable market failure. Therefore, we may
face a difficult trade-off between economic effectiveness of policy and public acceptability.
Pay ratios
It is our view that societal concerns on pay fairness cannot be ignored. Moreover, given the
tendency towards inflation in the CEO pay market, disclosure requirements that ‘nudge’
boards to pay more active attention to pay inflation and relativities are desirable. However,
we believe that a disclosure that focusses on pay relativities over time, rather than within a
single company at a point in time, is likely to be the better way to meet the policy objective,
as opposed to snapshot pay ratios.
Pay ratios have been suggested as a disclosure by the Investment Association38
and Legal
& General42
, as well as Chris Philp MP67
and the High Pay Centre68
. It is worth noting that
pay ratios were withdrawn from the draft text of the EU Shareholder Rights Directive and
look increasingly likely to be withdrawn in the US, as part of the announced review of Dodd-
Frank, before the disclosure requirement is due to come into force at the end of this year.
Although well-intentioned, snap-shot pay ratios by themselves have the potential to create
misleading comparisons and perverse incentives. For example, retailers will inevitably
appear to do worse on the ratio than, for example, specialist financial services firms. Yet this
does not suggest that retailers are less fair. A hotel company with a franchise model will
inevitably have a lower ratio than one that owns and manages its own hotels. How to
calculate the ratio for international companies is complex - should it be the UK workforce
only, or the global workforce? Each has pros and cons and difficulties of comparison. The
cost of calculating the ratio for an international company is non-trivial; the SEC estimates a
first-year implementation cost of $1.3bn and ongoing annual costs exceeding $520m
resulting from the US requirement to disclose pay ratios. Pay ratios can also penalise

34 Executive Remuneration Report – Strengthen Board Accountability for Pay Fairness
companies that offer higher non-monetary benefits, favour companies that outsource low
paid work rather than keep it in-house, and act against troubled or start-up companies where
the employee proposition may involve aspects other than pay. These issues show that the
ratio could be reduced in ways that are quite counterproductive.
Furthermore, the public concern relates to inequality within society. This is a matter of public
policy in relation to taxation, redistribution, regional development, education, and training. It
is not clear that a focus on inequality within companies is the valid starting point for
addressing inequality within society. Indeed as noted above it should also be noted that the
evidence that inequality is bad for companies is at best mixed.
All this suggests that pay ratio disclosure is misguided. There are several criticisms of such
disclosure. Many of these relate to lack of comparability. A pay ratio calls out to be
compared across companies when really it cannot be, even within sectors. Comparisons
between companies are almost certain to be misleading and to create more heat than light.
But the discussion above highlights another problem with pay ratios: such a disclosure
inevitably creates an expectation that lower is better, when the evidence does not support
that contention.
Policy Recommendation
Overall, our view is that there are some very legitimate reasons that can justify a significant
proportion of the increase in executive pay, without recourse to accusations of market failure
or weak governance. However, at the very least, the CEO pay market has particular
characteristics that make it prone to bursts of inflation, namely: the relatively low cost of
CEOs relative to company value; the high degree of transparency around executive pay
levels, which can cause contagion effects; and asymmetric incentives for boards, given the
potential costs of losing or not hiring the right CEO compared with the value they can add.
The result of these characteristics is that the market is producing an answer that is ever less
acceptable to the public. The evidence from moral philosophy and behavioural science is
that fairness should be defined as a due rewards, proportionate to the contribution made.
Accordingly, fairness should not be understood as simply being about equality of outcome.
An individual’s efforts and actions affect their due deserts, and human beings strongly
distinguish between deserved and undeserved gains, between luck that is genuinely chance
and good fortune that arises from application of skill through hard work and contribution69
.
Recent polling evidence consistently shows majority opinion that executive pay is
undeserved, too high, or symptomatic of self-interested managerial elites60,66,67
. Studies
across the world show executive pay to be around a factor ten higher than the public thinks it
should be70
. Some views on executive pay are doubtless due to misunderstanding of the
scale, demands, and potential impact of the job, which has been transformed in large
companies in the last few decades. However, this chasm in expectations cannot be ignored,
and much of the concern about executive pay in the public’s mind is that rises are seen as

35 Executive Remuneration Report – Strengthen Board Accountability for Pay Fairness
disproportionate, undeserved, and therefore unfair.
However, we do need to be realistic about the impact reducing CEO pay would have on
public opinion. Research shows that public concerns about inequality across countries are
not correlated with actual levels of inequality in each country, but are strongly correlated with
concerns about employment prospects60
. Indeed concerns about executive pay were less in
the decade preceding the financial crisis, when the pay ratio grew from around 50x to 140x,
than in the decade since, when it has reduced slightly in real terms. Some polling evidence
suggests that people are less concerned about what the CEO is paid provided all employees
are paid fairly60
.
All of this leads to five key conclusions:
Public concern about executive pay and inequality cannot be addressed just through
focus on pay at the top, but also require a focus on pay growth for ordinary workers.
Given the characteristics of the modern executive pay markets, robust frameworks
are required to control pay and prevent re-emergence of unjustified pay inflation.
A focus by boards on pay fairness is essential to rebuild trust in executive pay.
Employee engagement is necessary to create accountability, build understanding,
and rebuild confidence in pay processes within organisations.
Pay transparency needs to be improved to provide better information on both the link
between pay and performance and on the comparative movements in CEO and
employee pay over time.
What is required is a change in attitude, and greater rigour, in boards relating to pay
fairness. We believe that this change in behaviour is best achieved through a combination of
expanded oversight accountability for Remuneration Committees, disclosure requirements
through a Fair Pay Report within the Remuneration Report, and meaningful engagement
with employees.
Under recommendations 3 and 4 we address the questions of improved pay-performance
disclosure, and enhanced shareholder voting powers. The current recommendation seeks to
address understanding of, and trust in, pay fairness through a three-pronged approach of
enhanced board accountability, increased transparency, and employee engagement.

36 Executive Remuneration Report – Strengthen Board Accountability for Pay Fairness
Recommendation 2: Strengthen board accountability for pay fairness
The UK Corporate Governance Code should be amended to broaden the role of the
Remuneration Committee to oversee that business purpose is being translated into
behaviour and decisions around reward, including in relation to pay fairness. The
Remuneration Report should include a Fair Pay Report explaining the company’s
approach to pay fairness, and including specified metrics including relative
movements in CEO and employee pay over time. The company should establish a
meaningful process for engaging with employees on the Fair Pay Report.
The Fair Pay Report should replace existing remuneration report disclosures relating to
the wider workforce and should cover, supported by data where appropriate:
The company's philosophy and principles on pay fairness across the population
(including how fairness is defined, see Figure 8, page 38), the approach taken to
internal and external comparisons, covering the structure and level of pay, and the
approach taken to linking pay with performance, including the principal characteristics
of incentive plans used.
Explanation of how the policy on pay for the wider UK workforce differs from that for
the CEO and other executives in terms of the elements of pay offered, the quantum of
opportunity under those pay elements, and the target positioning of pay against the
market together with justification for such differences.
Explanation of the extent to which it is the company's policy and practice to pay living
wages in the territories in which it operates and how these are established, statutory
disclosures on Gender Pay, and broader approach to equal pay issues.
Explanation of the approach by which the company engages with employees on the
Fair Pay Report and a summary of any themes emerging from the feedback on the
prior-year's Report.
Tabular disclosure over the last five years (building to ten over time) of the maximum
annual pay opportunity for the CEO; the actual amount paid (on a statutory single
figure basis) and average pay for all other employees, or an appropriate subset
representative of at least the general UK workforce.
Graphical representation of the above tabular disclosures formed by rebasing each
pay element to 100 at the start of the period, and a narrative explanation of the
comparative trend over time (see Figure 9, page 39).

37 Executive Remuneration Report – Strengthen Board Accountability for Pay Fairness
Detailed Policy Discussion and Rationale
The rationale behind the Fair Pay Report is to respond to the significant and legitimate public
disquiet about inequality, and to encourage Boards to discuss the issue of fairness in relation
to pay, which is relevant to creating an engaged workforce and purposeful company. The
experience from the banking industry71
has been that greater Board involvement in
overseeing, monitoring, and reporting on company-wide pay outcomes has enhanced the
level of rigour and scrutiny of pay decisions within the company. This would be reinforced by
the requirement to engage with employees on the Fair Pay Report.
Contents of the Fair Pay Report
The current reporting regulations require a directors’ remuneration report to include
disclosure of: the percentage change in pay for the CEO compared with an appropriate
employee group; an explanation of any differences in remuneration policy between executive
directors and the general employee population; a statement of how pay and conditions for
employees were taken into account in setting director remuneration; a statement of whether
and how employees were consulted when drawing up the policy; and description of any
comparative data used to inform decisions made. The resulting disclosures made by
companies have generally been compliance-based and disappointing72
.
We therefore recommend that these requirements should be replaced by the requirement to
publish, and engage with employees on, a Fair Pay Report, which would be the
responsibility of the Remuneration Committee and would form part of the Remuneration
Report.
In drawing up the Fair Pay Report, Remuneration Committees could usefully consider the
different dimensions of fairness that may be relevant (see Figure 8).

38 Executive Remuneration Report – Strengthen Board Accountability for Pay Fairness
Figure 8: Dimensions of pay fairness
All dimensions of fairness are likely to have a role to play in most organisations. However,
the emphasis may be different. For example, co-operative societies place a high value on
internal proportionality. Technology companies, where wages are in any cases generally
high, may operate a highly market-based approach while being consistent with their
purpose. Global companies may be particularly concerned about ensuring human dignity is
reflected in pay practices, and minimum wages, particularly in developing world operations
and supply chains. What is most important is for the board, through the Remuneration
Committee, to hold management accountable for developing a clear philosophy on fairness
that supports the company’s purpose and can be explained to stakeholders, particularly
employees.
Pay comparisons over time, in the context of a holistic view of fairness
However, it cannot be denied that the differential between high pay and ordinary worker pay
is a significant political issue. Pay ratios between CEOs and the average worker currently
exceed what the public deem to be acceptable by a wide margin60.70
across the world.
Therefore we do believe that there is a compelling case for requiring companies to disclose
information on their approach to pay fairness. Fairness can be defined in a number of ways
and the onus should be on the board to articulate their position on the issue. Importantly
“more fair” is not the same as “more equal”. But comparison of pay trends between CEO and
workers is part of the equation.
Dimensions
of Fairness
Market worth An individual should be paid fairly according to the value
ascribed by the market to their skills and experience.
Contribution An individual should be paid
fairly according to the contribution they make through their performance in their role.
Like pay for like work An individual should be paid in
a non-discriminatory way regardless of, for example, gender, ethnicity, sexual orientation, and disability.
Internal proportionality Pay levels for roles internally bear a fair and proportionate relationship based on their
contribution to the organisation.
Human dignity Pay levels enable at least the living of a dignified life through enabling the earning of a living wage with appropriate security.

39 Executive Remuneration Report – Strengthen Board Accountability for Pay Fairness
However, for the reasons outlined above, we prefer comparisons between CEO pay and
worker pay that focus on trends in actual and maximum pay over time, through disclosure of
a relative pay index, rather than on the snapshot ratio at a given point in time. Hence our
recommendation focusses on comparing indexed pay for CEO, and the average employee
over 5 years or more, building to ten over time, and rebased to 100 at the start of the period.
We propose disclosing CEO pay both as maximum opportunity and actual paid. See Figure
9.
Figure 9: Example tabular and graphical disclosure
£000s 2007 2008 2009 2010 2011 2012 2013 2014 2015 2016
Maximum CEO pay
3325 3749 3823 3900 3978 4057 4927 5025 5126 5229
Actual CEO pay 3263 3749 1237 4719 2927 3842 4272 2539 3266 7843
Median employee pay
40 40.8 41.6 42.4 43.3 44.2 45 45.9 46.9 47.8
The Fair Pay Report therefore combines defined quantitative disclosures and meaningful
narrative disclosures to require companies to give a full account of their approach to pay
fairness. Note that the link between pay and performance for the CEO is already covered in
the Remuneration Report and would not be duplicated in the Fair Pay Report, although
companies may wish to cross reference in the explanatory narrative.
The focus of the quantitative pay disclosures in the Fair Pay Report is on relative pay trends
over time. This would identify whether the Remuneration Committee is structurally increasing
the CEO’s pay opportunity relative to employees, as well as showing any divergence in pay-
outs that would need to be justified by performance. This disclosure meets the intent of
increasing scrutiny on pay inflation, but also on pay fairness, and would provide an effective
trigger for board discussions and external challenge. We believe this is a more effective
0
50
100
150
200
250
300
2007 2008 2009 2010 2011 2012 2013 2014 2015 2016
Relative pay comparisons over time(2007 = 100)
CEO maximum pay CEO actual pay Average employee pay
40 Executive Remuneration Report – Strengthen Board Accountability for Pay Fairness
implementation of the policy intent than annual spot pay ratios. The latter would place focus
on potentially highly misleading comparisons between companies as opposed to within a
company over time. Moreover, the implication that lower ratios are always better is not
supported by the best recent evidence from the UK and the US which suggests that, on
average, higher ratios are in fact associated with higher performance, consistent with the
idea that paying more to secure higher quality management can be beneficial61-63
. The Fair
Pay Report would give anyone wishing to calculate a pay ratio easy access to the relevant
information. However, we believe the statutory disclosure should focus on relative trends as
above.
Enhancing engagement
The Remuneration Committee should be required to report that it is satisfied that there has
been effective engagement with employees on pay arrangements at all levels. The
Remuneration Committee is responsible for only a sub-set of pay decisions so employee
engagement should be undertaken by the executive team in the same way that the Board
should expect customer insight to be undertaken via market research led by management.
The exception to this is that there should be an opportunity for appropriate engagement with
the Chair of the Committee to hear an explanation of decision making relating to Executive
Director pay.
Engagement would have two benefits. First, increased understanding of the company’s
approach to pay fairness can help increase employee engagement. But also, the
accountability created by engagement would itself influence the nature of debate and
decision making in the board, and ensure fairness considerations were given appropriate
weight.
We do not recommend that the mechanisms for employee engagement should be legislated.
It suggests that partnering with employees on such an important issue of well-being is bad
for firm value so we need to pass a law to achieve it. This is not true, many companies
already voluntarily engage directly with their employees and employee representatives on
issues impacting well-being. Robust evidence also shows that focusing on employee
wellbeing (which involves consultation) improves firm value by 2-3% pa33
.
At the same time, models for employee engagement will vary by the circumstances of each
firm, including its geographic reach and the nature of its workforce, as argued by David
Macleod and Nita Clarke in the government sponsored report into employee engagement73
.
To satisfy themselves that employee consultation around Pay practices has been done
effectively Remuneration Committees should look to assure themselves that that the
consultation undertaken by the executive team passes the five tests of effective
engagement, see Figure 10.

41 Executive Remuneration Report – Strengthen Board Accountability for Pay Fairness
Where there is existing machinery for staff insight either via management teams the use of
external research capability or with trade unions then this can be used. In recent years there
has been a steady increase in the systematic consultation of employee in response to
statutory rights for employees to be informed and consulted in an increasing range of areas,
which has led to development of consultation mechanisms. As part of the Government’s
wider review into enhancing stakeholder voice, we are likely to see board sustainability
committees taking a greater role in ensuring mechanisms exist for taking on board
stakeholder views. These mechanisms could be used for consultation on the Fair Pay
Report.
Figure 10: Tests for effective engagement
This process may not be easy for the executive team - particularly if there are trade-offs to
be made. Employees may, for instance, have an interest in protecting their rights or
preserving the status quo regardless of customers' needs, or maximising their compensation
as possible, against the interests of shareholders. But, as with listening and acting on
customer feedback, the value that can be created is significant. Moreover, in order to rebuild
trust in pay, to the benefit of all UK business, decisive action is required. Despite the
undoubted practical difficulties of engaging on the Fair Pay Report, we believe such
engagement would strongly reinforce Remuneration Committee accountability in this area.
Therefore there should be a determination to overcome these difficulties.
Change comes when company buys into value of employee welfare, engagement, fairness.
Consultation undertaken in spirit of commitment rather than compliance.
Requires CEO leadership and Remuneration Committee scrutiny.
1. Intentional
Effective engagement to create actionable insight is an ongoing process.
Remuneration Committee needs to satisfy themselves that the method used is systematic.
Companies should draw on existing engagement mechanisms where appropriate.
For employees to engage constructively they need assurance their views will be heard.
There should be the same commitment to identify genuine views of staff as customers.
Honest search for the truth is required.
Insight from engagement should be turned into action.
Remuneration Committee oversight should challenge whether real insight has been sought and acted on.
This requires bravery from management.
Holistic view of reward is required across financial and non-financial dimensions.
This may include training and development and non-monetary benefits e.g. flexible working.
2. Systematic
3. Authentic
4. Impactful
5. Comprehensive

42 Executive Remuneration Report – Enhance Executive Pay Disclosure
3. Enhance Executive Pay Disclosure
The Case for Change
In previous sections we have addressed the questions of whether executive pay is
incentivising the right behaviour (it is not) and whether the increase in executive pay in
recent decades can be justified (to a significant degree it can be, although this is not
accepted by the public and trust needs to be rebuilt). We now turn to the question of whether
pay outcomes across companies are aligned with performance. In simple terms, do the
strongest performing CEOs get paid the most?
Pay for performance comparisons
This question has been given prominence by an MSCI study that claimed to find, if anything,
a negative correlation between pay levels and performance in the US2. This is an important
claim. CEO pay is a lightning rod for the public’s distrust in big business. If CEOs are making
huge sums regardless of performance, then this can be highly damaging to efforts to rebuild
trust. However, given the complexity of executive pay, it is worth scrutinising such claims
carefully.
The current UK disclosure regulations74
attempted to improve the disclosure of pay versus
performance through two disclosures:
Definition of a “single figure” of pay showing the total amount crystallising for an
executive by virtue of satisfaction of performance conditions in the year, including
the impact of any share price growth since the grant of share awards.
A requirement to disclose over up to ten years this single figure of pay, the rate of
vesting of short and long-term incentives as a percentage of maximum, and the TSR
of the company.
The ‘single figure’ disclosure of executive pay looks at pay elements crystallising based on
performance in the reporting year. As such it ignores the impact on the CEO of changes in
value of previously granted equity. This is like analysing investment returns based on
dividends but disregarding capital gains. High quality academic research always looks at the
combined sensitivity of pay and wealth to performance, including previously granted equity.
Given that the median FTSE-100 CEO has an after tax equity exposure of around £6.5m, a
20% share price fall is equivalent to a pre-tax pay cut of around £2.3m. This cannot be
ignored.

43 Executive Remuneration Report – Enhance Executive Pay Disclosure
Figure 11 overleaf demonstrates the importance of including the impact of previously
granted equity. It compares the single figure of pay for CEOs in the FTSE-100 for their most
recent reporting year. This comprises base salary and benefits, bonus for the year, and long-
term incentive pay-outs. The companies are split between those that delivered a positive
Total Shareholder Return (TSR) over the year and those where TSR was negative (just over
1/3rd
of the companies). The left-hand bars show the reported single pay figure. The right-
hand bars show the reported single figure plus or minus the pre-tax change in value of
previously granted equity (vested shares still held by the executive and unvested deferred
awards).
Figure 11: FTSE-100 CEO pay for positive and negative TSR companies, before and
after adjustment for previously granted equity
Source: PwC
Companies delivering positive TSR over the year had a slightly higher median single figure
of pay: £4.1m as opposed to just over £3m for those companies that delivered negative
TSR. This is a difference of one-third at the median, however, there is significant overlap
between the quartiles of pay for the positive and negative TSR companies. While this
analysis has not been subject to detailed controls, note that the median market capitalisation
for both the negative and positive TSR groups was almost identical, so there is no obvious
size affect distorting the results.
The right-hand set of bars adds the change in value of previously granted equity. The impact
of declining share price on the negative TSR companies reduced the pay of the CEOs of
these companies by nearly one-half at the median, or about £1.5m. Indeed for nearly one-
third of the companies delivering negative TSR, the fall in value of shares more than offset
-2,500
0
2,500
5,000
7,500
10,000
12,500
Negative TSR Positive TSR Negative TSR Positive TSR
Single figure Adjusted Single Figure
Tota
l pay
(£000s)
Lower Quartile to Median Median to Upper quartile

44 Executive Remuneration Report – Enhance Executive Pay Disclosure
the single figure of pay received in the year, meaning that those CEOs in effect received
negative pay.
Using the adjusted figures the difference between the pay of the negative and positive TSR
companies increases to nearly a factor five and there is no overlap in the quartiles. This
analysis demonstrates the importance of ensuring CEOs are significant shareholders in their
business, but also shows the importance of developing a pay disclosure that includes
changes in the value of previously granted equity.
Correcting pay for performance analysis
The shortcomings of the MSCI analysis are well-recognised in academic circles75
. In
summary the analysis suffers from three key shortfalls.
First, the analysis is based on target pay rather than realised pay, so it does not
allow for the impact of share price movement on stock option awards.
Second, the analysis does not adjust for size. Yet one of the most robustly verified
findings in executive pay is that if a company has twice the value of another than on
average its CEO’s pay will be around 25% higher. Therefore, the analysis quite likely
just reflects the fact that over the period of the study small caps (who pay less)
outperformance large caps (who pay more). Any pay for performance analysis that
fails to adjust for size will almost certainly lead to misleading results.
Thirdly, the analysis does not adjust for previously granted equity, which as shown
above has a very significant impact on the pay-performance relationship.
More detailed analysis shows that making these adjustments significantly increases the
observed correlation between pay and performance in the FTSE-100. This analysis shows
that the measured correlation between pay and performance increases from broadly zero
when no adjustments are made (in line with the MSCI study) to nearly 80% when
appropriate adjustments are made for size and previously granted equity76
.
Figure 12: Correlation between pay and three year TSR with and without adjustment
for size and previously granted equity
Pay definition R-Squared*
Target pay 9%**
Single figure 19%
Single figure adjusted for size 48%
Single figure adjusted for size and previously granted equity 77%
Source PwC
*Correlation between pay rank and three-year TSR rank
**The correlation with target pay is in fact negative

45 Executive Remuneration Report – Enhance Executive Pay Disclosure
Note that this analysis does not mean that executive pay design is without problems. This
analysis was only carried out over a relative short-term three year period. Moreover, the
correlation is only as high as it is because awards are denominated in shares and because
CEOs have significant shareholdings. The alignment with performance happens in spite of,
rather than because of, the high usage of target-driven plans. The behavioural risks
associated with these plans are significant, as outlined in Section 1, and so pay should be
reformed.
Nonetheless, the analysis above shows that, properly analysed, the misalignment between
pay and performance under current constructs is much less severe than commonly
assumed. Also, the analysis demonstrates the importance of high levels of shareholding in
creating a long-term link between pay and performance.
Disclosure regulations should, therefore, be reformed, better to show the link between pay
and performance, taking account of previously granted equity. To effect this, as well as
disclosing the single figure of pay, the company should show the wealth impact: the pre-tax
change in value over the reporting year of previously granted vested and unvested††
equity
awards. The absolute £ value of the total shareholder return over the year should also be
disclosed. These items should be disclosed for the last ten years alongside the current
requirement to disclose the single figure and vesting history.
Explaining the maximum pay level in the policy
The current UK reporting regulations for directors’ remuneration require the maximum for
each element of remuneration to be defined in the directors’ remuneration policy, and the
regulations then require a shareholder vote to pay above that maximum. The maximum
potential payable under the policy must be illustrated in a scenario chart at the time the
policy is approved.
There is currently no requirement to explain why the Remuneration Committee chose this
maximum amount as appropriate. It would create good discipline on Remuneration
Committee thinking for them to have to justify this decision, including any market reference
points used. This would also help stakeholders understand why the maximum pay is
reasonable.
Beyond rebuilding trust in the policy regime, there is a further reason why clarity on the
maximum pay level is justified. There is some evidence that very high CEO pay relative to
norms or relative to other executives within the company can be correlated with lower firm
value77, 78
. These findings may be reflective of situations of entrenched CEOs or hubris,
††
Note that changes in the value of unvested awards would only be included once those awards had counted towards the single figure in a prior year – for example a deferred bonus. This ensures no double counting of the share price impact on award values over time.

46 Executive Remuneration Report – Enhance Executive Pay Disclosure
which create knock-on problems. Furthermore, the potential for high pay levels to cause
contagion across the market is another reason for significant focus on outliers51
. This
evidence suggests that it is reasonable for shareholders to receive a full explanation of why
the maximum within the policy is deemed appropriate by the Remuneration Committee.
Clarifying the maximum pay level in the policy
The regulations allow the maximum to be expressed “in monetary terms or otherwise”. In
practice this has led to the maximum being defined in different ways for different
components. For example salary has frequently not had a formal maximum; final salary
pensions have been defined in terms of the benefit rather than the maximum value; for long-
term incentives the maximum is typically defined in terms of the initial face value of the
shares awarded rather than the value of shares when they pay out.
Although there is a good rationale behind these variations, in aggregate they have resulted
in shareholders not actually voting on a clear pay maximum within the policy, and have
arguably led to loss of public faith in the effectiveness of policy to restrain payments. Cases
where the disclosed annual pay has exceeded the maximum set out in the policy scenario
charts have been cited as an example of the policy regime being ineffective or
cicumvented66
.
In practice there are “good” and “bad” reasons why the maximum may have been exceeded:
The typical “good” reason is that the maximum in the scenario chart normally
excludes share price growth. Given that long-term incentive awards are
denominated in shares, a strongly increasing share price combined with good levels
of achievement against performance conditions can result in pay-outs ahead of the
initial maximum face value of awards. Shareholders are generally supportive of pay-
outs in such cases as they reflect performance – unless the grant was made at a
temporarily suppressed price.
“Bad” reasons may include a significant contribution to the single figure from a final
salary pension when an executive receives an unusual pensionable salary increase,
or a large salary increase that is beyond what was envisaged in the modelled policy.
In some cases this has led to disclosed pension values in many millions of pounds
when the scenario chart in the policy suggested a value of hundreds of thousands.
In some cases this can lead to the stated maximum being exceeded in a way that
would not realistically have been foreseen by shareholders.
We believe that changes are required to give shareholders clear control over maximum
payments under the policy, and to enable full transparency of the extent to which it is share
price growth that has caused the maximum pay in the scenario chart to be exceeded.

47 Executive Remuneration Report – Enhance Executive Pay Disclosure
Policy Recommendation
We believe that changes are required to the remuneration reporting regulations in order to:
Allow a more complete view of the relationship between pay and performance
Give clarity over the maximum pay allowed under the policy
Recommendation 3: The Directors’ Remuneration Reporting regulations should be
updated to enable greater stakeholder understanding of a company’s maximum pay
and relationship between pay and performance.
The single figure table should disclose how much of the single figure arises from
growth in share price on share incentives between the date of grant and measurement
of performance and should show a separate total single figure excluding this amount.
The single figure table should include the wealth impact on CEOs of the pre-tax
change in value over the year of previously granted equity over the year. This item
should also be shown in the ten year history together with the absolute total
shareholder return achieved by the company over each year.
Disclosure of share interests should include weighted mean period to release for each
of shares beneficially held, shares subject to service, and shares subject to
performance.
Within the remuneration policy a clear monetary maximum should be stated and
justified for each element of remuneration other than those linked to the value of
shares, in which case the limit should be based on the initial value of shares awarded.
Detailed Policy Discussion and Rationale
For any remuneration element where the value in the single figure does not depend on share
price growth, there should be a clear monetary maximum under the policy. This should also
be true, for example, for defined benefit pension plans. Where the value of a benefit is
unpredictable (as with a final salary plan) the company will be forced to make a realistic
assessment of the maximum amount, and would then be required to obtain shareholder
approval for any excess payment over that amount.
The exception would be awards based on shares. It would be counterproductive to impose
a limit on value that arises purely from share price growth, as this is directly aligned with
shareholder returns. Therefore, the maximum value of share awards would, as now, be
defined by reference to their face value at date of grant.

48 Executive Remuneration Report – Enhance Executive Pay Disclosure
Although the maximum pay-out from share-based plans should be based on the face value
at grant, we believe that it would be helpful for shareholders and other observers to
understand the component of the single figure of pay that arose from share price growth as
opposed to fixed pay or achievement against performance conditions. Therefore we suggest
the addition of two columns to the single-figure table to show:
i. The single figure with share awards valued based on the share price at date of grant
of those awards.
ii. The additional amount within the actual single figure disclosure that arises because
of share price growth.
The amounts under (i) and (ii) above would by definition add up to the total single figure.
This would help readers of the report to understand any cases where the single figure has
exceeded the maximum in the scenario chart at the time the policy was approved. This
disclosure is already included on a voluntary basis by some companies, and can help reduce
misunderstandings about the drivers of pay and how it compares with the policy limits.
To help give full understanding of the link between pay and performance it is important to
have an additional disclosure to show the net (£ sterling) change in company wealth of the
CEO over the year comprising both remuneration crystallising and the change in value of
outstanding equity. This should then be compared to the (£ sterling) change in value of the
company over the same period. While current focus is only on the cost of the CEO (their
pay), fairness depends on the comparison of costs and benefits. This disclosure aims to
present a more balanced picture. While the entire increase in company value is clearly not
solely due to the CEO, stakeholders could multiply it by their perceived assessment of the
CEO’s contribution and compare this number against the CEO’s pay to assess fairness.
Companies would be permitted to show other measures of value in addition.
The time series disclosure would enable a user of the report to aggregate and analyse the
wealth impact over any period. Summing the single figure and wealth impact over every year
of a CEO’s career would yield the total change in wealth they had experienced as a result of
being CEO. This could then be compared easily to the aggregate value created.
Finally, given the importance of lengthening the term of equity exposure, we recommend
requiring the weighted mean term of share awards and shares held to be disclosed. Where
there is a shareholding requirement, then the term of any holding under this requirement
should be calculated assuming the CEO gave notice at the financial year end and that any
post-retirement share-holding requirements apply from the end of that notice period.
49 Executive Remuneration Report – Toughen Shareholder Voting Powers
4. Toughen Shareholder Voting Powers
The Case for Change
There is substantial evidence that “say on pay” regimes have been effective in improving
alignment between executive pay and shareholder interests77
. In the UK.I Introduction of say
on pay in 2003 has been followed by a range of features sought by shareholders including:
reduction in notice periods; removal of retesting of performance conditions; generally
tougher performance conditions; less generous leaver and change of control treatment on
LTIPs. This experience has been backed up by comprehensive analysis of say on pay
regimes globally78
. This analysis shows that say on pay regimes have been associated with
reduced rate of increase in CEO pay, and improvement in the sensitivity of CEO pay to
performance, and introduction of shareholder-friendly pay features, with the changes
particularly concentrated on those firms with the weakest governance and most problematic
pay policies.
As noted by a number of authors, the market for executive pay is not perfect. Non-executive
directors face asymmetric incentives in relation to CEO pay packages: CEO packages are
trivial relative to the finances of the company in most cases, and the desire to avoid creating
disgruntlement amongst management teams is clear. Say on pay has undoubtedly created a
potential for reputational risk that has added steel to Remuneration Committee decision
making, and created a counterweight to the fear of executive dissatisfaction that can affect
Remuneration Committee behaviour.
It is too early fully to analyse the overall impact of introducing a binding vote in the UK as
most companies have only had one policy approval so far. However, even the initial round of
binding votes brought about clear limits on recruitment remuneration that had not previously
existed and which would appear to have had a dampening impact on joining packages for
CEOs compared with some of the more extreme practices of the past. Moreover, anecdotally
it seems clear that the binding nature of the policy has brought with it a harder constraint on
what can be offered to executives when they leave in certain circumstances. The
international evidence78
suggests that, if anything, non-binding regimes have been more
successful than binding regimes in influencing pay outcomes. However, the researchers
caveat this conclusion by noting the wide degree of variety between different regimes (for
example binding votes on policy, as in the UK, versus binding votes on quantum of
payments, as in Switzerland).
Associated with the binding policy vote there has been more active use of the advisory vote
by shareholders over the last few years which has brought about a number of further
advantageous changes including: widespread disclosure of annual bonus targets (now
adopted by two-thirds of the FTSE-100); introduction of malus and clawback; and
50 Executive Remuneration Report – Toughen Shareholder Voting Powers
introduction of post-vesting holding periods (by over half of the FTSE-100) to increase total
LTIP terms to 5 years.
It should be noted that some of these changes have arisen from changes to the UK
Corporate Governance Code, whereas others have arisen from shareholders using their
voting powers under the advisory regime as they have been able to do since 2003.
Therefore, while particular market developments cannot always be directly associated with a
single regulatory development, overall the current system appears to produce a well
calibrated set of powers for shareholders that create a feedback loop. This in turn leads to
evolution in practices in the market over successive AGM seasons. There was strong
support for the new system in a qualitative research exercise carried out in 2014 following
the first round of reporting and AGMs under the new system72
.
Binding votes
The evidence suggests that the existing voting regime has been broadly successful.
However, there have been concerns in some quarters that while the vote on policy is
binding, the vote on how that policy is implemented is non-binding. This means that there is
felt by some to be no direct consequence of losing the advisory vote, and in particular losing
the vote does not stop the contentious payments being made to executives.
In response, some commentators have indicated that there should be binding votes on
executive pay. This has been interpreted by some as annual binding votes on pay outcomes,
and policy proposals have been prepared by at least one Member of Parliament on this
basis67
.
Discussion with shareholders in the UK reveals split views on binding votes28
. Some
shareholders favour binding votes on outcomes, reflecting the frustration they feel that
advisory votes against do not change the decisions made by the company that caused the
negative vote. However, many shareholders are concerned about the unintended
consequences of a binding vote on outcomes, a number of which were responsible for both
Australia and the UK rejecting binding votes on pay outcomes in reviews of say on pay
legislation since 201180
:
Exactly on what is the binding vote to be held? The whole report or elements
thereof? In practice the binding vote would need to be held on specific pay outcomes
(for example annual bonus). However, shareholder dissent with Remuneration
Committee decisions has often been in different areas, such as treatment of leavers
for example.
A binding vote results in a level of direct intervention by shareholders on a specific
company decision that absolves directors of their responsibility to shareholders, and
undermines their role, as a matter of principle.

51 Executive Remuneration Report – Toughen Shareholder Voting Powers
A binding vote undermines the reliability of contract between the company and
executives, which could significantly affect the ability to of UK listed companies to
attract and retain talent compared with overseas or private companies.
Precisely what are the consequences and remediation required on losing a binding
vote?
There is a risk that shareholders will be less willing to cast a negative binding as
opposed to advisory vote (e.g. would the BP report have been voted down if it was
binding?) because of the potential destabilising consequences for CEO motivation
and retention – this would weaken the feedback loop provided by the current non-
binding regime.
There is a concern about excessive consultation by companies seeking to ensure
that they would not lose a binding vote.
There could be issues with binding votes and contract law coming into conflict.
A binding vote on executive pay arguably elevates pay to an unjustified level
compared with other critical aspects of corporate action, and creates a level of
forensic intervention by investors that is misaligned with their input in more important
areas such as major investments, acquisitions, strategy and so on.
Taking all of the above into account, and given that the detailed international evidence does
not suggest binding votes are more effective, we do not see a clear case for universal
annual binding votes on pay outcomes at this time. However, as referenced above, a voting
system that keeps the pressure on Remuneration Committees to act in shareholders’
interests and to take tough decisions can have benefits in ensuring appropriate restraint is
exercised.
Significant opposition short of losing the vote
There has been some shareholder frustration that a small number of companies appear to
have largely ignored substantial non-binding votes against remuneration. Experience
suggests that companies that actually lose a remuneration vote generally respond to
shareholder concerns in the following year. However, some shareholders are concerned
about the implications of companies that consistently tolerate higher levels of opposition,
short of losing the vote. The fact that substantial minority shareholder opposition should lead
to some Board accountability led to the following provision in the remuneration reporting
regulations74
.
Where there was a significant percentage of votes against either resolution, where
known to the directors, the reasons for those votes and any actions taken by the
directors in response to investors’ concerns [should be disclosed].

52 Executive Remuneration Report – Toughen Shareholder Voting Powers
This is also reflected in the broader guidance in the UK Corporate Governance Code that
when, in the opinion of the board, a significant proportion of votes have been cast against a
resolution at any general meeting, the company should explain when announcing the results
of voting what actions it intends to take to understand the reasons behind the vote result.
The GC100 group has indicated81
that 20% vote against should be deemed “significant” in
the context of the regulations. Legal & General have also defined 20% as representing “large
voting opposition”, requiring the board to state what it is doing to address concerns42
.
Approximately one in ten FTSE-350 companies have received votes in favour of 80% or
fewer (abstentions excluded) over the last three years82
, suggesting that 20% opposition
represents broadly a lower decile level of support. These companies received an average
vote in favour of 71%. The average vote for the remuneration reports for the same
companies one year later was 88%, suggesting that they had achieved significant
improvement and that they had responded to shareholder concerns (see Figure 12).
Figure 12: Shareholder votes for companies receiving “low” levels of support
Source: PwC, Proxy Insight
However, this aggregate data conceals a split population. Between a fifth and one-quarter of
the companies receiving a vote in favour below 80% also received less than 80% in the
following year, with their average vote even falling slightly from 69% to 66%. The remaining
three quarters or so of companies improved their vote from an average of 71% to 94%, well
into the levels suggesting substantially full support.
While this does not suggest an endemic problem of lack of responsiveness to shareholder
71%
88%
66%
94%
40%
60%
80%
100%
All companies Bottom quarter The rest
Average vote inyear when below
80%
Average vote one year later
Rem
unera
tion r
eport
vote
in f
avour

53 Executive Remuneration Report – Toughen Shareholder Voting Powers
votes, it does suggest that around 2% of companies are prone to persistently low levels of
support, in addition to the 1% of companies or fewer who actually have their remuneration
reports voted down. Moreover, detailed evidence suggests that outliers can have a
significant impact on pay levels across the market, given the sensitivity of CEO pay market
dynamics51
. Ensuring there are robust sanctions to deter excessive behaviour could improve
the operation of the executive pay market, and would leave the public in no doubt that
shareholders have requisite powers.
54 Executive Remuneration Report – Toughen Shareholder Voting Powers
Policy Proposal
The scale of this problem does not appear to us to warrant a wholesale change in the voting
regime applying to all companies. Given the lack of evidence in favour of binding vote
regimes, and the problems with a binding vote on pay outcomes outlined above, we do not
support introduction of an annual binding vote on pay outcomes for all companies at this
time. It appears to us to be a disproportionate response to the problem at hand, and in any
case there is no evidence that it would have the desired impact. However, some
development of the existing regime, with impact focused on this small number of companies,
may be appropriate. Given the recent willingness of shareholders to use their own escalation
mechanisms (for example voting against the Chair of the Remuneration Committee where
remuneration votes are consistently low, it may be that any formal change to the voting
regime could be deferred for a further period of two to three years, as practice develops.
A binding vote regime should be triggered when companies lose, or repeatedly fail
to achieve a threshold level of support on, the advisory remuneration vote.
This could be implemented through legislation or through changes to the UK Corporate
Governance Code. If a company loses the advisory remuneration vote in any year or
receives 25% or more vote against the advisory vote two years in a row then:
The company should bring forward their remuneration policy for approval at the next
AGM of the company as a Special Resolution requiring a 75% majority to pass.
At the same AGM a motion would be brought forward enabling shareholders to dis-
apply, by simple majority, the requirement to pass the remuneration policy by a super-
majority.
Where issuing recommendations based on benchmark policies, proxy voting agencies
should:
Give clear guidance during engagement with companies if proposals are likely to
attract a negative voting recommendation and take into account the views, if made
public, of major shareholders in a company when making voting recommendations on
proposals where strategic fit is a strong element of the rationale.

55 Executive Remuneration Report – Toughen Shareholder Voting Powers
Detailed Policy Discussion and Rationale
A proportionate response based on an escalation mechanism
Public trust in business is at a low point and perception of executive pay practices is a
significant contributor to that. Polling evidence suggests that the public is supportive of
greater shareholder powers to address the issue60, 67
. Given that distrust on pay is creating a
damaging negative externality across business as a whole, there is a case for taking active
steps to demonstrate to the public that the issue is being taken seriously, while strongly
encouraging business and shareholders to drive reform. However, any further regulation
should be sensitive to the risk of potential unintended consequences.
We accept that further voting powers for shareholders are politically necessary and that this
is likely to include binding votes. Our policy recommendation, however, is to create an
escalation mechanism that focusses binding votes on those cases that warrant greater
attention.
Our proposal is that a binding vote regime should only be triggered for a company if they lost
an advisory remuneration vote or if they faced a vote against by shareholders above 25%
two years in a row. We have chosen a threshold different from the 20% identified by GC-100
and Legal & General. We cannot see a case for any mandatory action on remuneration
being triggered by a level of opposition that would be insufficient to defeat a Special
Resolution. Note that the difference in impact between 20% and 25% as a threshold is not
great, with 20% capturing around 1 company in 10 in a given year, and 25% capturing 1 in
1282
. This appears to us to be an appropriate proportion of companies to capture –
representing approximately lower decile support levels. A threshold of 25% of the register
could also be considered (representing around a 33% vote against given typical rates of
participation in AGM votes). However, in our view this is too lenient a threshold especially for
a “two strikes” approach.
Given that only around 3% of companies achieve this level of opposition two years in a row
or lose their remuneration report advisory vote, this escalation mechanism would focus
additional attention on a proportionate number of companies, where the pay policies are
viewed as most problematic by shareholders. Note that this approach is similar to the
Australian “two strikes” approach79
.
Any approach that involves “special measures” being triggered by a 25% threshold could be
argued to give undue influence to proxy voting agencies: for example a “vote against”
recommendation from ISS is typically associated with a vote against of c. 30% in the UK. We
believe this fear may be overstated. Proxy voting agency recommendations typically reflect
concerns of major shareholders, with whom they regularly consult on their voting guidelines.
Proxy agencies can be a helpful agent for marshalling coherence in investor views on key
issues, and for enabling stewardship activities to be carried out at reasonable cost.
Moreover, it could be argued that any concerns about the use of proxy agency
56 Executive Remuneration Report – Toughen Shareholder Voting Powers
recommendations should be laid at the door of shareholders rather than the agencies
themselves: proxy agencies only advise, investors decide. It is important that this separation
of responsibilities is kept clear.
However, we do think that it would be good practice for some proxy agencies to have a more
open approach to engagement on company-specific issues, particularly where they issue
recommendations based on benchmark rather than tailored policies. There is evidence from
the US that ISS recommendations do have a material causal impact on investor voting
decisions83
. In particular, we believe it would be good practice for proxy agencies issuing
recommendations against benchmark policies to:
Be open to engagement with companies and in particular to provide clear guidance,
when proposals are likely to attract a negative recommendation;
Take into account the views of a company’s major shareholders, if public, when
making voting recommendations, particularly, for example, when those shareholders
are supportive of an unconventional approach taken by the company in the context
of its strategy.
Equally, shareholders themselves should review whether, in their use of proxy voting
agencies, they are taking their stewardship responsibilities sufficiently seriously.
We considered three possible remedies for companies triggering the binding vote regime.
Option (D) (i) – binding vote on incentive payments
A company triggering the binding regime could be required to bring forward their bonus and
LTIP payments for binding shareholder approval for, say, each of the next three years.
The logic is that a company that had shown it was unable to operate its approved policy in
manner securing the highest levels of shareholder support, would need to get binding
shareholder approval for the key decisions made within that policy.
The proposal to require a binding vote on pay outcomes suffers from all of the
disadvantages of binding votes outlined above. However, it would have the advantage that
the costs of a binding vote would only apply to a small number of companies that had not
been able to sustain high levels of shareholder support for how they implemented their
remuneration policies. It is therefore a more proportionate approach than applying binding
votes to all.
A further unsatisfactory feature of this approach is that the reasons for the shareholder
opposition to the remuneration report may be quite different from the items subject to
subsequent binding vote. For example, if a company has had its remuneration report voted
down for over generous treatment of a departing executive (quite a common cause) it seems

57 Executive Remuneration Report – Toughen Shareholder Voting Powers
bizarre for the remedy to relate to bonus payments for the continuing CEO.
Option (D) (ii) – requirement to reapprove policy with a super-majority
A company triggering the binding regime could be required to bring their policy back for
approval, at the next AGM requiring a super-majority of 75% to have it approved.
The logic here is that binding approval of a policy gives a company a licence to operate
within that policy. A company that has shown an inability to maintain high levels of
shareholder support for how they are operating the policy is required to come back to have
that licence renewed.
The logic behind requiring a 75% majority on the policy vote when triggered in these
circumstances is to create a clear deterrent for companies and Remuneration Committees. If
the policy vote requires 75% vote to pass, this is likely to lead to a policy that is less flexible
and written less in favour of executives. Therefore, when deciding whether to risk losing an
advisory vote, or risk repeat opposition above the trigger level, Remuneration Committees
would be clear that the downside would not just be the reputational consequences of the
advisory vote itself, but potential practical reduction in future flexibility in the policy.
The main disadvantage of this approach is that it may be considered disproportionate ever to
require a supermajority on a binding remuneration matter, given that much larger decisions
relating to corporate activity, for example, can be taken on a simple majority. There is also a
risk of giving undue influence to activist investors or proxy voting agencies.
To guard against this, the requirements could be implemented on a comply or explain basis
through the UK Corporate Governance Code. If a company declined to bring forward a
special resolution when a majority of shareholders wished them to do so, then shareholders
could vote against re-election of Directors. Alternatively, if the proposal is implemented
through legislation, then at the same AGM at which the policy is brought for re-approval, a
parallel resolution could be tabled authorising the requirement of a super-majority. If this
resolution were defeated, then a simple majority would apply to the policy vote. Therefore, if
there were reason to believe that the vote could be subject to unintended consequences due
to, for example, a large activist shareholder, it would be possible for a majority of
shareholders to avoid being ‘held to ransom’ by a minority investor. This adds complexity,
but is a necessary safeguard in extreme cases.
Option (D) (iii) – require a company to bring a binding vote of confidence in the work
of the Remuneration Committee
A company that receives a vote in against of 25% or more on the advisory remuneration
resolution is at risk of triggering our proposed binding regime at their next AGM. At that
subsequent AGM a motion of confidence in the work of the Remuneration Committee would
be tabled. If, at that subsequent AGM, the vote against the advisory resolution is again more
58 Executive Remuneration Report – Toughen Shareholder Voting Powers
than 25%, then the result of the vote of confidence becomes active and must be made
public. If the vote of confidence is lost, then the Board must, within three months of the AGM
make a statement as to the action they are going to take to rebuild confidence in the
Remuneration Committee’s work, which must, at least, include replacement of the Chair of
the Remuneration Committee (although that does not imply the individual’s removal as a
Director).
Note that this approach bears some comparison to the Australian “two strikes” rule. Under
that rule, following one vote of 25% against, the next AGM has a “spill resolution” such that if
the remuneration report again receives votes of 25% or more against, shareholders can
require an AGM at which the directors stand for re-election80
.
We are not recommending the Australian approach here for two reasons. First, the UK
(unlike Australia) has annual re-election of directors in any case. Therefore shareholders
can hold directors accountable if they wish at the next AGM (and indeed some shareholders
have a policy of escalating to vote against the chair of the Remuneration Committee if they
have to vote twice against the remuneration report). Second, the low incidence of votes
against Directors (and the tiny number of cases there have been in Australia of the spill
meeting being triggered) suggests that shareholders do not see this as a proportionate
response to a remuneration matter.
The purpose of the trigger mechanism is to provide a deterrent against a Remuneration
Committee tolerating repeated high levels of shareholder opposition. But the remedy should
not be so great as to destabilise the company. This is why the approach suggested within
this option in effect allows shareholders to bring about a change in the Remuneration
Committee chair if the binding regime is triggered, without having to vote a director off the
board. It could be argued that the reputational incentive to avoid this possibility will be
sufficient to make companies more reluctant to drop below the 25% threshold, and thus to
avoid being “repeat offenders”.
Summary
The complexity of the approaches outlined above, and the potential unintended
consequences show that it is not easy to improve on the UK’s current regime. Indeed a case
could be made that any further regulatory intervention in this area is unwarranted, given that
shareholders already have escalation mechanisms available to them. However, the political
context is such that a workable proposal for further binding votes is required, and on balance
our preference is option D (ii), requiring companies subject to the escalation mechanism to
bring their policy back for approval with a super-majority.
Although the current voting system works well, we believe that, at the cost of some
complexity, our proposed policy could helpfully increase the impact of the existing non-
binding vote, while focussing on the 3% or so of companies with the most problematic pay
practices. The approach would not create additional cost or disruption for the c. 97% of

59 Executive Remuneration Report – Toughen Shareholder Voting Powers
companies who neither lose their advisory votes nor receive 25% or more vote two years in
a row. Given the requirement to build public confidence in the shareholder voting system, we
believe an escalation option is worthy of further consideration. The proposed approach
works with the grain of, and strengthens, the current system.

60 Executive Remuneration Report – Appendix
Appendix: Implementation of Design Recommendations via Amendment of the UK Corporate Governance Code
We do not believe that the Government should be legislating for pay design. Ideally new pay
guidelines would emerge through market mechanisms and update to investor guidelines.
Indeed some progress has been made this year, with the work of the Investment Association
Executive Remuneration Working Group28
. However, the implementation of this group’s work
into the Investment Association guidelines38
somewhat suggests that simplified plans based
on long-term shareholding should be the exception rather than the rule. Our view is that
encouragement could be given to the market through review of the UK Corporate
Governance Code.
For example, the Main Principle D.1 of the Code could be amended as follows:
Executive directors’ remuneration should be designed to promote the long-term success of
the company. Packages should be structured so that exposure to the long-term value of the
company counterbalances any shorter-term incentives created by performance-related
elements. Performance-related elements should be transparent, stretching, and rigorously
applied.
Schedule A of the Code could also be amended as follows.
Schedule A: The design of performance-related remuneration for executive directors
Balance
The Remuneration Committee should determine an appropriate balance between fixed and
performance-related, immediate and deferred remuneration. Performance conditions, including non-
financial metrics where appropriate, should be relevant, stretching and designed to promote the long-
term success of the company and fulfilment of its purpose. Remuneration incentives should be
compatible with risk policies and systems. Upper limits should be set and disclosed.
The Remuneration Committee should be aware of the potential for target-based plans, even long-term
incentive plans, to encourage short-term behaviour to the detriment of long-term value creation.
Particular consideration should therefore be given to the balance of incentives arising from target-
driven plans and from exposure to the long-term value of the company through holding shares. The
Remuneration Committee should consider whether the leverage or volatility of the company means
that executives should be partly paid in the form of long-term deferred cash compensation, in effect

61 Executive Remuneration Report – Appendix
unsecured debt.
The Remuneration Committee should consider whether the directors should be eligible for annuls
bonuses and / or benefits under long-term incentive schemes.
Share-based remuneration
Traditional share option schemes should be weighted against other kinds of long-term incentive
scheme. Executive share options should not be offered at a discount save as permitted by the relevant
provisions of the Listing Rules.
Any new long-term incentive schemes which are proposed should be approved by shareholders and
should have regard to the principle that remuneration should be simple and transparent preferably
replace any existing schemes or, at least, form part of a well-considered overall plan incorporating
existing schemes. The total rewards potentially available should not be excessive.
The Remuneration Committee should consider the appropriate level of target-based performance
incentives, having regard to the potential risks of short-termism that can arise. Mitigation of these risks
can be achieved through ensuring that packages result in executives being exposed to high and long-
term levels of shareholding. For share based remuneration, the Remuneration Committee should
consider as a counterbalance to target-based incentives: appropriate levels of vested and unvested
stock awards, requiring directors to hold a minimum number of shares and to hold shares for a further
period after vesting or exercise, including for a period after leaving the company, subject to the need to
finance any costs of acquisition and associate tax liabilities. In normal circumstances, packages should
be structured to ensure exposure to the long-term share price over five to seven years depending on
sector, and for two to three years after leaving the company. Shares should be released for sale on a
phased basis rather than triggered for block-release, for example on retirement. shares granted or
other forms of deferred remuneration should not vest or be paid, and options should not be
exerciseable, in less than three years. Longer periods may be appropriate. Grants under executive
share option and other long-term incentive schemes should normally be phased rather than awarded in
one large block.
Pensions
The Remuneration Committee should consider the level of pension that is appropriate for executives in
light of benefits offered to the wider workforce, and in light of the fact that pension benefits for high
earners now have limited tax effectiveness. The Remuneration Committee should consider whether
the principles of simplicity and transparency are better served by moving the value of pension into
other elements of the package such as fixed pay, share awards, or long-term deferred cash
compensation. Where pensions are offered, In general, only basic salary should be pensionable. The
Remuneration Committee should consider the pension consequences and associated costs to the
company of basic salary increases and any other changes in pensionable remuneration, especially for
directors close to retirement.

62 Executive Remuneration Report – Reference List
Reference List
1. Li, W. and Young, S. (2016), ‘An Analysis of CEO Pay Arrangements and Value
Creation for FTSE-350 Companies’, Report Commissioned and Funded by CFA
Society of the United Kingdom
2. Marsall, R. and Lee, L.-E. (2016), ‘Are CEOs paid for performance? Evaluating the
effectiveness of equity incentives’, MSCI Research Paper
3. Smithers, A., (2013), ‘The Road to Recovery: How and Why Economic Policy Must
Change’, John Wiley & Sons
4. The Purposeful Company (2016), ‘Interim Report’, Big Innovation Centre
5. Edmans, A., Fang, V., and Lewellen, K. (2016), ‘Equity Vesting and Investment’,
Review of Financial Studies, forthcoming, SSRN: http://ssrn.com/abstract=2270027
6. Edmans, A., Goncalves-Pinto, L., Groen-Xu, M. and Wang, Y. (2016), ‘Strategic
News Releases in Equity Vesting Months’, ECGI – Finance Working Paper no.
440/2014, SSRN: http://ssrn.com/abstract=2489152
7. Bennett, B., Bettis, C., Gopalan, R. and Milbourn, T. (2016), ‘Compensation Goals
and Firm Performance’, Journal of Financial Economics, forthcoming
http://tinyurl.com/hvjhrbh
8. Bizjak, J., Hayes, R. and Kalpathy, S. (2015), ‘Performance-Contingent Executive
Compensation and Managerial Behaviour’, SSRN: http://ssrn.com/abstract=2519246
9. Laux, V. (2012), ‘Stock Option Vesting Conditions, CEO Turnover, and Myopic
Investment’, Journal of Financial Economics 106, 513-526
10. Pepper, A. (2015), ‘The Economic Psychology of Incentives: New Design Principles
for Executive Pay’, Palgrave-MacMillan
11. PwC (2012), ‘Making Executive Pay Work’, PwC Research Paper
12. Deci, E., Koestner, R. and Ryan, R. (1999), ‘A Meta-analytic Review of Experiments
Examining the Effects of Extrinsic Rewards on Intrinsic Motivation’, Psychological
Bulletin 125, 627-668
13. Ariely, D., Gneezy, U., Lowenstein, G., and Mazar, N. (2009), ‘Large Stakes and Big
Mistakes’, Review of Economic Studies, 76, 451-469
14. Ordenez, L., Schweitzer, M., Galinsky, A. and Bazeman, M. (2009), ‘Goals Gone
Wild: The Systematic Side Effects of Over-Prescribing Goal Setting’, Academy of
Management Perspectives 23, 6-16.
15. Grant, A. and Singh, J. (2001), ‘The Problem with Financial Incentives – and What to
do About It’, Knoweldge@Wharton
16. Holmstrom, B. and Milgrom, P. (1991), ‘Multitask Principal-Agent Analyses: Incentive
Contracts, Asset Ownership, and Job Design’, Journal of Law, Economics, and
Organisation 7, 24-52
17. Johnson, S., Ryan, Jr., H., and Tian, Y. (2009), ‘Managerial Incentives and
Corporate Fraud: The Sources of Incentives Matter’, Review of Finance 13: 115-145

63 Executive Remuneration Report – Reference List
18. PwC (2015), ‘Taking Stock – Review of 2015 AGM Season – FTSE 100’, PwC
Research Paper
19. Morse, A., Nanda, V., and Seru, A. (2011), ‘Are Incentives Contracts Rigged by
Powerful CEOs?’, Journal of Finance 66, 1779-1821
20. Flammer, C. and Bansal, P. (2016), ‘Does Long-Term Orientation Create Value?
Evidence from a Regression Discontinuity’, Strategic Management Journal,
forthcoming, SSRN: http://ssrn.com/abstract=2511507
21. Von Lilienfeld-Toal, U. and Ruenzi, S. (2014), ‘CEO Ownership, Stock Market
Performance, and Managerial Discretion’, Journal of Finance 69, 1013-1050
22. Edmans, A. and Liu, Q. (2011), ‘Inside Debt’, Review of Finance 15, 75-102
23. Anantharaman, D. Fang, V. and Gong, G. (2014), ‘Inside Debt and the Design of
Corporate Debt Contracts’, Management Science 60, 1260-1280
24. Wei, C. and Yermack, D. (2011), ‘Investor Reactions to CEOs’ Inside Debt
Incentives’, Review of Financial Studies 24, 3813-3840
25. Sundaram, R. and Yermack, D. (2007), ‘Pay Me Later: Inside Debt and its Role in
Managerial Compensation’, Journal of Finance 62, 1551-1588
26. Cassell, C., Huang, S., Sanches, J. and Stuart M. (2012), ‘Seeking Safety: The
Relation between CEO Inside Debt Holdings and the Riskiness of Firm Investment
and Financial Policies;, Journal of Financial Economics 103, 588-610
27. Edmans, A., Gabaix, X., Sadzik, T. and Sannikov, Y. (2012), ‘Dynamic CEO
Compensation’, Journal of Finance 67, 1603-1647
28. Investment Association Executive Remuneration Working Group (2016), ‘Final
Report’
29. PwC (2013), ‘Sense at Last’, PwC Research Paper
30. Bebchuk, L. and Fried, J. (2010), ‘Paying for Long-term Performance’, University of
Pennsylvania Law Review, 158, 1915-1959
31. Cronqvist, H., and Fahlenbrach, R. (2013), ‘CEO Contract Design: How Do Strong
Principals Do It?’, Journal of Financial Economics 108, 659-674
32. Edmans, A. (2011), ‘Does the Stock Market Fully Value Intangibles? Employee
Satisfaction and Equity Prices’, Journal of Financial Economics 101, 621-640
33. Edmans, A. (2012), ‘The Link between Job Satisfaction and Firm Value, With
Implications for Corporate Social Responsibility’, Academy of Management
Perspectives 26, 1-19
34. Edmans, A. and Gabaix, X. (2015), ‘Executive Compensation: A Modern Primer’,
Journal of Economic Literature, Forthcoming
35. Emerton, Paul (2015), ‘Executive Pay in the UK’, Old Mutual Global Investors
position paper
36. Fidelity International Proxy Voting Guidelines
37. Prudential Regulatory Authority Handbook, SYSC19A
38. The Investment Association Principles of Remuneration (2016)
39. European Banking Authority Guidelines on Sound Remuneration Policies (2015)
40. Cziraki, P. and Groen-Xu, M. (2014), ‘CEO Job Security and Risk-Taking’, LSE FMG
Discussions Papers, DP 279

64 Executive Remuneration Report – Reference List
41. Strategy& / PwC (2015), ‘2014 Study of CEOs, Governance and Success: The
Value of Getting Succession Right’, Research Paper
42. Legal & General Investment Management Principles on Executive Remuneration
(2016)
43. E. Han Kim and Yao Lu (2011), ‘CEO Ownership, External Governance, and Risk
Taking’, Journal of Financial Economics 102, 272-292
44. Data taken from PwC Executive Remuneration Survey database as at 1.09.16
45. Shue, K., and Townsend, R. (2014), ‘Swinging for the Fences’, Chicago Booth
Research Paper no. 13-03
46. Cedar Rock, (2015), Annual Circular to Investors
47. Ittner, C. and Larcker, D. (2003), ‘Coming up Short with Nonfinancial Performance’,
Harvard Business Review 81, 88-95
48. PwC (2016), ‘Demystifying Executive Pay: Market or Racket?’, PwC Research
Paper
49. Gabaix, X. and Landier, A. (2008), ‘Why has CEO Pay Increased So Much?’,
Quarterly Journal of Economics 123, 49-100
50. Faulkender M. and Yang, J. (2010), ‘Inside the Black Box: The Role and
Composition of Peer Groups’, Journal of Financial Economics, 96, 257-270
51. Bereskin, F. and Cicero, D. (2013), ‘CEO Compensation Contagion: Evidence from
an Exogenous Shock’, Journal of Financial Economics 107, 477-493
52. Philippon, T. and Reshef, A. (2009), ‘Wages and Human Capital in the US Financial
Industry 1909-2006’, National Bureau of Economic Research, Working Paper Series,
55
53. Murphy, K. (2011), ‘The Politics of Pay: A Legislative History of Executive
Compensation’, Marshal Research Paper Series Working Paper FBE 01.11, SSRN:
http://ssrn.com/abstract=1916358
54. Edmans, A. (2016), ‘How Virtually Every Pay Regulation has Backfired’, available at
www.alexedmans.com
55. Bebchuk, L. and Fried, J. (2003), ‘Executive Compensation as an Agency Problem’,
Journal of Economic Perspectives 17, 71-92
56. Kaplan, S. and Rauh, J. (2014), ‘It’s the Market: The Broad-Based Rise in the Return
to Top Talent’, Journal of Economic Perspectives 27, 3, 35-56
57. Conyon, M. (2014), ‘Executive Pay and Income Inequality’, Working Paper for PwC
58. PwC (2014), ‘What Goes Up Must Come Down’, PwC Research Paper
59. Keusch, T. (2016), ‘Shareholder Power and Managerial Incentives’, SSRN:
http://ssrn.com/abstract=2746135
60. PwC (2016), ‘Time to Listen’, PwC Research Paper
61. Kale, J., Reis, E., and Venkateswaran, A. (2009), ‘Rank-Order Tournaments and
Incentive Alignment: The Effect on Firm Performance’, Journal of Finance, 64(30),
1479-1512
62. Faleye, O., Reis, E. and Venkateswaran, A. (2013), ‘The Determinants and Effects
of CEO-Employee Pay Ratios’, Journal of Banking and Finance, 37, 3258-3272
63. Mueller, H., Ouimet, P. and Simintzi, E. (2017), ‘Within-Firm Pay Inequality’, Review
of Financial Studies, forthcoming, SSRN: http://ssrn.com/abstract=2716315
65 Executive Remuneration Report – Reference List
64. Bevan, S. (2013), ‘Compensation Culture: Is executive pay excessive? Does it
matter?’, The Work Foundation
65. Connelly, B., Haynes, K., Tihanyi, L., Gamache, D. and Devers, C. (2016), ‘Minding
the Gap: Antecedents and Consequences of Top Management-To-Worker Pay
Dispersion’, Journal of Management , 42, 862-885
66. CIPD (2015), ‘The View from Below: What Employees Really Think of Their CEO’s
Pay Packet’
67. Philp, C. MP (2016), ‘Restoring Responsible Ownership – Ending the Ownerless
Corporation and Controlling Executive Pay’
68. High Pay Centre (2016), ‘Pay Ratios: Just Do It’, Research Report
69. Hutton, W. (2011), ‘Hutton Review of Fair Pay in the Public Sector’
70. Kiatpongsan, S. and Norton, M. (2014), ‘How Much (More) Should CEOs Make? A
Universal Desire for More Equal Pay’, Perspectives on Psychological Science, 9,
587-593
71. Gosling, T. (2014), ‘The Impact of Regulation on Remuneration’, Investing in
Change: a Book of Essays on Financial Reform in Europe, Chapter 4, Association of
Financial Markets in Europe
72. PwC (2014), ‘Remuneration Reporting a Year on – Consideration for 2014/15
Remuneration Reports’, PwC Research Paper
73. MacLeod, D. and Clarke, N. (2009), ‘Engaging for Success: Enhancing Performance
Through Employee Engagement: A Report for Government’
74. The Large and Medium-sized Companies and Groups (Accounts and Reports)
(Amendment) Regulations 2013, 2013 SI No. 1981
75. Edmans, A. (2016), ‘Why the MSCI Study Does NOT Show That Equity Incentives
Backfire’, available at www.alexedmans.com
76. PwC (2017), ‘Demystifying Executive Pay: Paying for Performance’, PwC Research
Paper
77. Ferri, F. and Maber, D. (2013), ‘Say on Pay Votes and CEO Compensation:
Evidence from the UK’, Review of Finance, 17, 527-563
78. Correa, R. and Lel, U. (2017), ‘Say on Pay Laws, Executive Compensation, Pay
Slice, and Firm Valuation around the World’, Journal of Financial Economics,
forthcoming SSRN: http://ssrn.com/abstract=2328678
79. Bebchuk, L., Cremers, K. and Peyer, U. (2011), ‘The CEO pay slice’, Journal of
Financial Economics 102, 199-221
80. Thomas, R. and Van der Elst, C. (2014), ‘Say on Pay around the World’, Vanderbilt
Law and Economics Research Paper, SSRN: http://ssrn.com/abstract=2401761
81. GC100 and Investor Group (2016), ‘Directors’ Remuneration Reporting Guidance
2016’
82. Proxy Insight database, licensed to PwC, PwC analysis
83. Malenko, N. and Shen, Y. (2016), ‘The Role of Proxy Advisory Firms: Evidence from
a Regression Discontinuity Design’, The Review of Financial Studies, 29, 3394-3427

66 Executive Remuneration Report
Big Innovation Centre
This Policy Report is a publication from the Big Innovation Centre. The content of this paper
reflects the opinions of its authors and not necessarily the views of the Big Innovation Centre
or its supporters. The Big Innovation Centre is supported by the following companies, public
bodies, universities and private trusts.

67 Executive Remuneration Report
Contact Details
Big Innovation Centre
Ergon House
Horseferry Rd
London SW1P 2AL
www.biginnovationcentre.com
Launched in September 2011, Big Innovation Centre is a hub of innovative companies and
organisations, thought leaders, universities and 'what works' open innovators. Together we test
and realise our commercial and public-purpose ideas to promote company and national innovative
capabilities in a non-competitive and neutral environment. We act as catalysts in co-shaping
innovation and business model strategies that are both practical and intellectually grounded. Our
vision is to help make the UK a Global Open Innovation and Investment Hub by 2025, and to build
similar initiatives internationally. For further details, please visit www.biginnovationcentre.com
All rights reserved © Big Innovation Centre. No part of this publication may be reproduced, stored
in a retrieval system or transmitted, in any form without prior written permission of the publishers.
For more information contact [email protected]. Big Innovation Centre Ltd
registered as a company limited by shares No. 8613849. Registered address: Ergon House,
Horseferry Road, London SW1P 2AL, UK.

68 Executive Remuneration Report