the puzzle of the ‘agriculture boom’ in japan meiji gakuin university yoshihisa godo...
TRANSCRIPT

The puzzle of the ‘agriculture
boom’ in Japan
Meiji Gakuin University
Yoshihisa [email protected]
November 30 th , 2012
Singapore Management University

Topics
1. Poor performance of Japanese agriculture
2. Why so poor?
3. In contrast, ‘agricultural boom’ since around 2008
4. Why such a boom?

Topics
1. Poor performance of Japanese agriculture
2. Why so poor?
3. In contrast, ‘agricultural boom’ since around 2008
4. Why such a boom?

Poor performance of Japanese agriculture(1/3)
Agriculture makes ‘negative’ contribution to national income
Agricultural Protection,
4 trillion yen
(measured by PSE)
> Agricultural Income,
3 trillion yen
(measured by net value added)
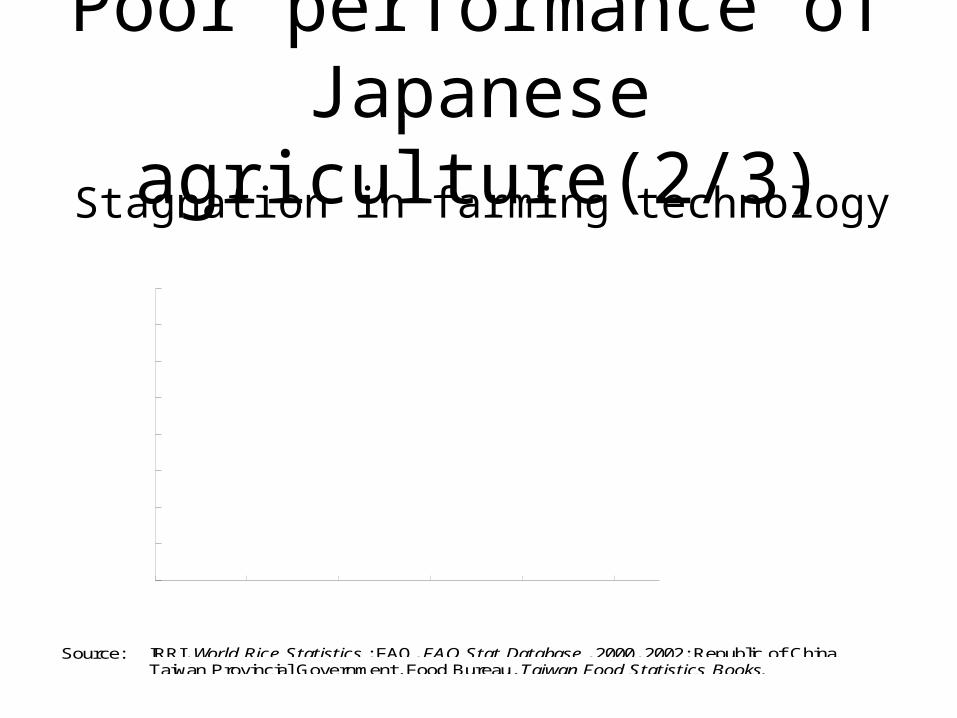
Poor performance of Japanese agriculture(2/3)Stagnation in farming technology
Source: IRRI, World Rice Statistics ; FAO, FAO Stat Database, 2000, 2002; Republic of ChinaTaiwan Provincial Government, Food Bureau, Taiwan Food Statistics Books.
0
1
2
3
4
5
6
7
8
1950 1960 1970 1980 1990 2000
J apan
KoreaTaiwan
Indonesia
Bangladesh
PhilippinesIndia
Avera
ge y
ield
(tonnes/ha)
7
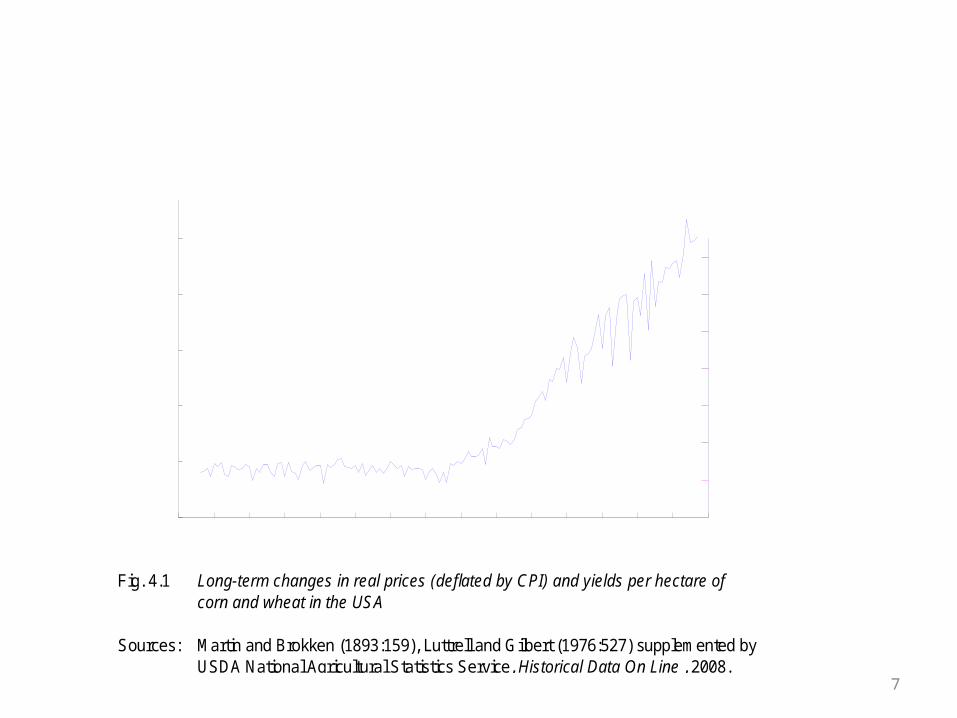
Fig. 4.1 Long-term changes in real prices (deflated by CPI) and yields per hectare ofcorn and wheat in the USA
Sources: Martin and Brokken (1893:159), Luttrell and Gilbert (1976:527) supplemented byUSDA National Agricultural Statistics Service, Historical Data On Line , 2008.
0
10
20
30
40
50
60
1860 1870 1880 1890 1900 1910 1920 1930 1940 1950 1960 1970 1980 1990 2000 2010
140
120
100
80
60
40
20
Yie
ld p
er a
cre
(bus
hels
)
Yie
ld p
er a
cre
(bus
hels
)
Corn yield (right scale)
Wheat yield (left scale)
Developed countries other than Japan continue to improve their agricultural productivity

Poor performance of Japanese agriculture(3/3)
Deterioration in nutrition value
Vitamin C in Spinach 100g
1982: 65mg 2010: 35mg

Topics
1. Poor performance of Japanese agriculture
2. Why so poor?3. In contrast, ‘agricultural
boom’ since around 20084. Why such a boom?
Why so poor?= Loss of farming skill
decreasing ‘skill-intensive farming’ increasing ‘by-the-book-style farming
• Characteristics of Japan's farming skill– Scientific knowledge + Learning by doing – ‘Skill intensive’ means ‘knowledge intensive’ and
‘labor intensive’– Skill intensive farming is good for the protection of
natural environment and improve the taste of the farm products and the capacity to resist abnormal weather
– Self-supply of intermediaries (such as manure)
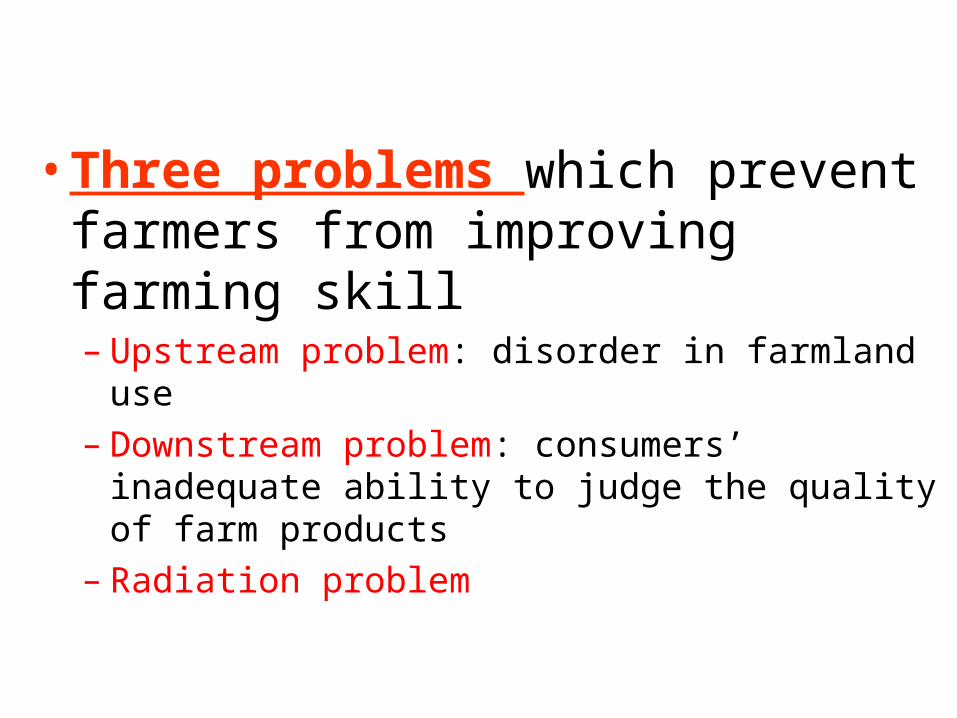
• Three problems which prevent farmers from improving farming skill– Upstream problem: disorder in farmland use– Downstream problem: consumers’ inadequate
ability to judge the quality of farm products– Radiation problem

Farmland use problem in Japan
• Limited Flat Area• High Population Density• Short Rivers• Necessity of Close Communication among all the Farmers in
the Community (e.g., for water use)• Environmental Externality
Urban Land Use vs. Agricultural Land Use(Good for Non-agri. Use = Good for Farming )
Both Competition & Order are necessary

0 20 40 60 80
Earning Capacity Value of Farmland
For Agricultural Purpose
Million yen per 10 a
Farmland Prices
Farmland Conversionfor Non-agricultural Use
For Agricultural Purpose
For Agricultural Purpose
Farmland Conversionfor Non-agricultural Use
Farmland Conversionfor Non-agricultural Use
0.55
1.8
16.8
8.4
30.1
46.2
78.7
MorePopulated Area
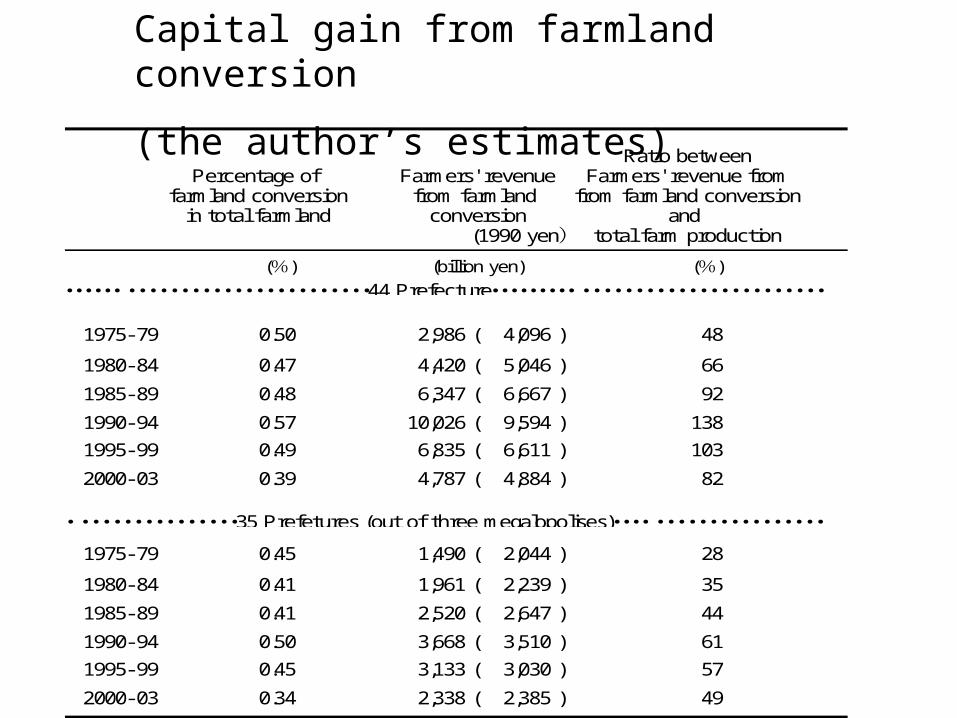
Ratio betweenPercentage of Farmers' revenue Farmers' revenue from
farmland conversion from farmland from farmland conversionin total farmland conversion and
(1990 yen) total farm production
( )% (billion yen) ( )%44 Prefecture・・・・・・・・・・・・・・・・・・・・・・・・・・・・・・・・ ・・・・・・・・・・・・・・・・・・・・・・・・・・・・・・・・
1975-79 0.50 2,986 ( 4,096 ) 48
1980-84 0.47 4,420 ( 5,046 ) 66
1985-89 0.48 6,347 ( 6,667 ) 92
1990-94 0.57 10,026 ( 9,594 ) 138
1995-99 0.49 6,835 ( 6,611 ) 103
2000-03 0.39 4,787 ( 4,884 ) 82
35 Prefetures (out of three megalopolises)・・・・・・・・・・・・・・・・・・・ ・・・・・・・・・・・・・・・・・・・・1975-79 0.45 1,490 ( 2,044 ) 28
1980-84 0.41 1,961 ( 2,239 ) 35
1985-89 0.41 2,520 ( 2,647 ) 44
1990-94 0.50 3,668 ( 3,510 ) 61
1995-99 0.45 3,133 ( 3,030 ) 57
2000-03 0.34 2,338 ( 2,385 ) 49
Capital gain from farmland conversion
(the author’s estimates)

Allocation of agricultural budget(%)
Expenditure for Expenditure forPrice Support Programs Rural Public Construction WorksTotal Agricultural Expenditure Total Agricultural Expenditure
1960 23 281965 37 261970 44 201975 43 201980 25 281985 21 311990 12 391995 8 501999 12 47
MAFF's Expenditure forPublic Construction WorksMAFF's Total Expenditure
2000 512004 452008 422011 23

Japan’s farmland use regulations
☆Officially, strict regulations on farmland use.
☆ Actually, those regulations are ineffective.
☆ Popular misunderstanding among Japanese citizens (farmers as well as urban dwellers): a landowner can use his farmland as he likes
☆ MAFF is unwilling to enforce farmland use regulations while MAFF pretends to apply the laws rigidly

Traditional Political Dynamics in Agriculture
Politician
(member of the Diet)
Promote the interdependency between farmers and politicians
Farmers
Ministry of Agriculture
Vote Inducement of special benefits
JA (agricultural cooperative)

Downstream problem
• Bad eating habits
• Consumers' excess reliance on the Authorities
• Racism?

Topics
1. Poor performance of Japanese agriculture
2. Why so poor?
3. In contrast, ‘agricultural boom’ since around 2008
4. Why such a boom?

Agricultural Boom Since around 2008 (1/4)
High Expectations from Commercial-Industrial Sector:
☆New Entry of Stock Firms☆Large-size Farming☆High-tech Farming☆Nou Shoukou Renkei (agri-
commercial- manufacturing collaboration)
☆ 6th Industry
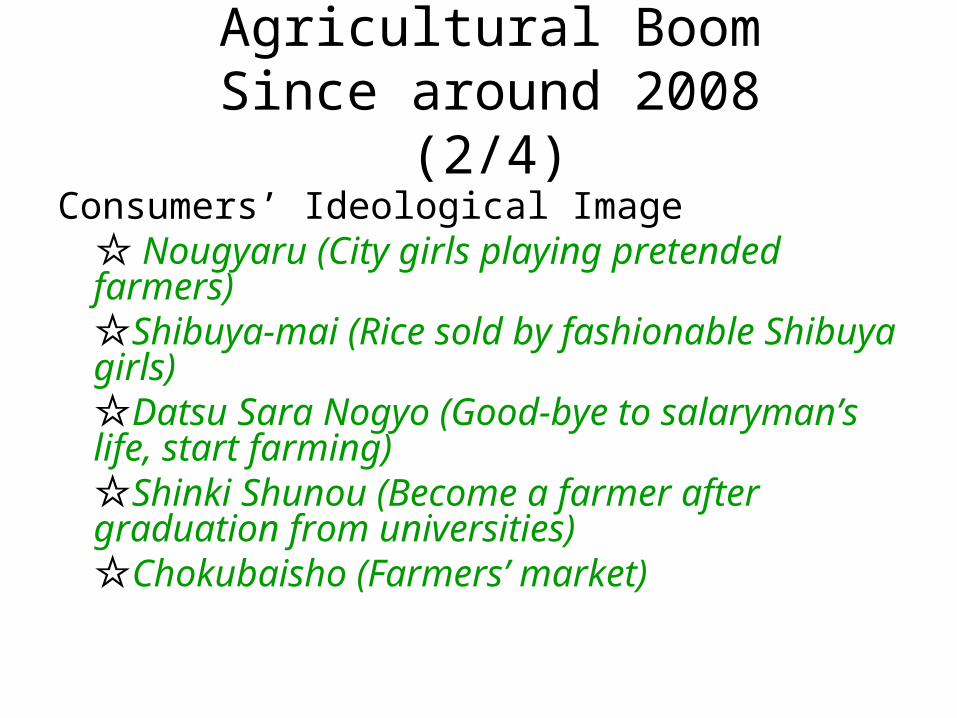
Agricultural Boom Since around 2008 (2/4)
Consumers’ Ideological Image ☆ Nougyaru (City girls playing pretended
farmers)☆Shibuya-mai (Rice sold by fashionable Shibuya girls)☆Datsu Sara Nogyo (Good-bye to salaryman’s life, start farming)☆Shinki Shunou (Become a farmer after graduation from universities)☆Chokubaisho (Farmers’ market)

Agricultural Boom Since around 2008 (3/4)
A wave of books and other publicationsFull of dreams in agriculture
☆ Yell for farmers! ☆ Peaceful and humble life of farmers! ☆ Miracles in agriculture! ☆ Let’s start farming! ☆ Japan’s great farm products! ☆ Punish JA and/or MAFF!

Agricultural Boom Since around 2008 (4/4)
• Aso, Hatoyama, Kan, Noda : Agriculture as a growing industry
• Winning favor among urban dwellers (and business leaders) by declaring “I support agriculture”
• JA’s loss of political power• Commercial-industrial sector as a major
stumbling block against trade liberalization
New Political Dynamics

Topics
1. Poor performance of Japanese agriculture
2. Why so poor?3. In contrast, ‘agricultural
boom’ since around 2008
4. Why such a boom?

Once It was Manchuria, Now It Is Agriculture
• Victories in Wars against Russia and WWI→Pride of a ‘First Class Power’
• 1920Great Reactionary Depression
• 1928 Election System Reform (single-sheet election system)
• 1929Jun’s Reform• 1930Climax of Jun’s Reform:
Lifting the Gold Embargo• 1931Manchuria Boom
• Miraculous Growth →Pride of ‘Japan as Number One’
• 1990Burst of the Bubble• 1996 Election System Reform
(single-sheet election system) • 2001Jun’s Reform• 2007Climax of Jun’s Reform:
Dissolution of the Diet calling for Revitalization of the Postal Services
• 2009Agriculture Boom
Escapism of Japanese Society
Jun=Jun-nosuke Inoue Jun=Jun-ichiro Koizumi
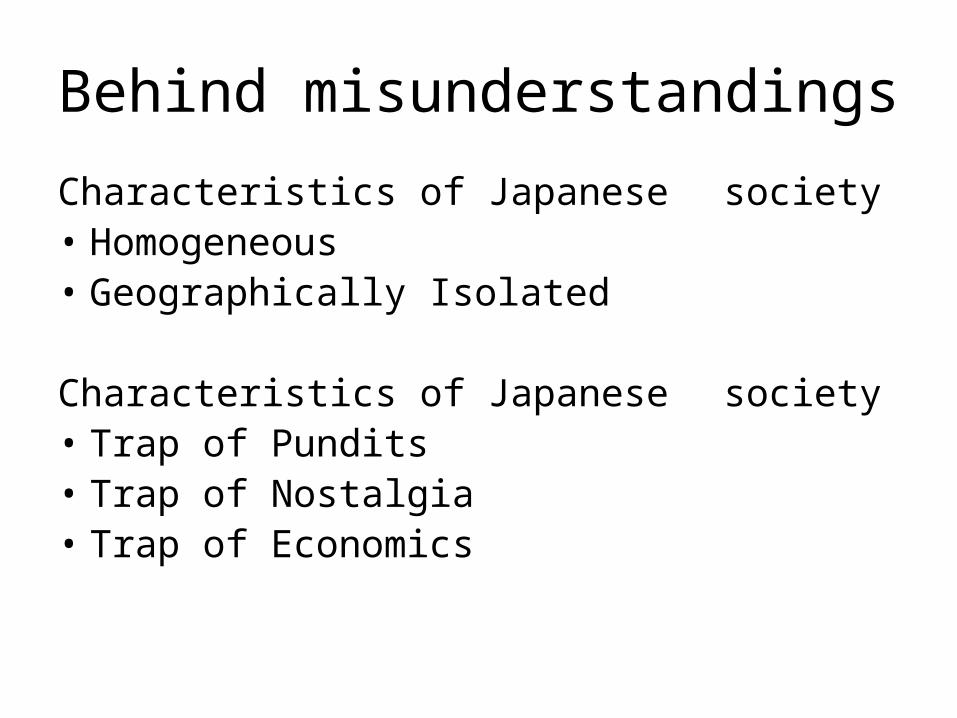
Behind misunderstandings
Characteristics of Japanese society • Homogeneous• Geographically Isolated
Characteristics of Japanese society • Trap of Pundits• Trap of Nostalgia• Trap of Economics
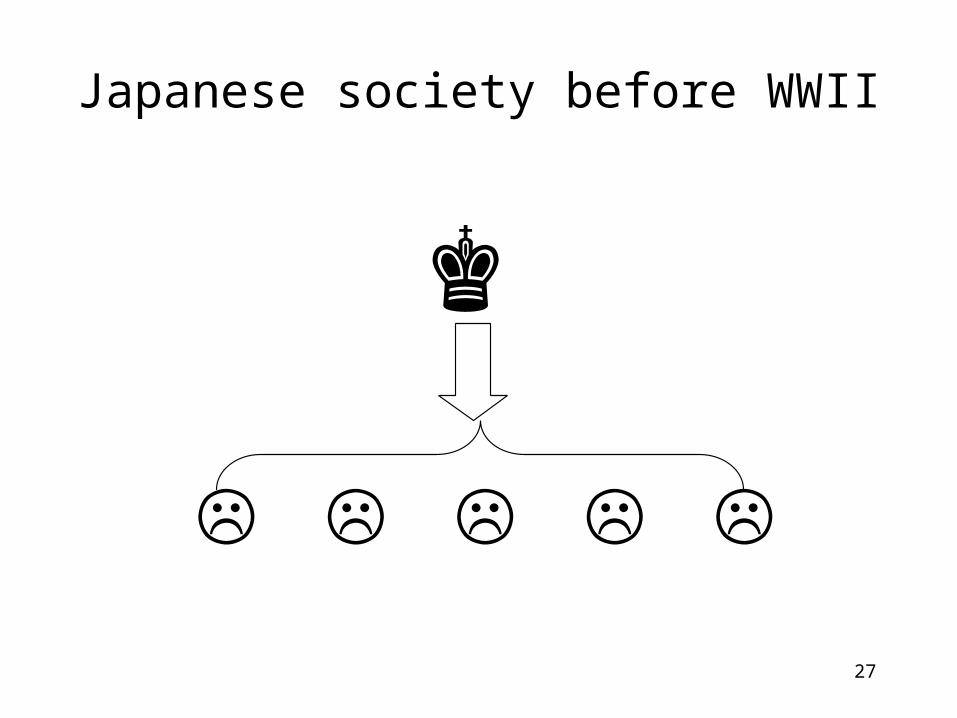
27
Japanese society before WWII
♚
☹ ☹ ☹ ☹ ☹

28
Japanese society after WWII
♚
☹ ☹ ☹ ☹ ☹
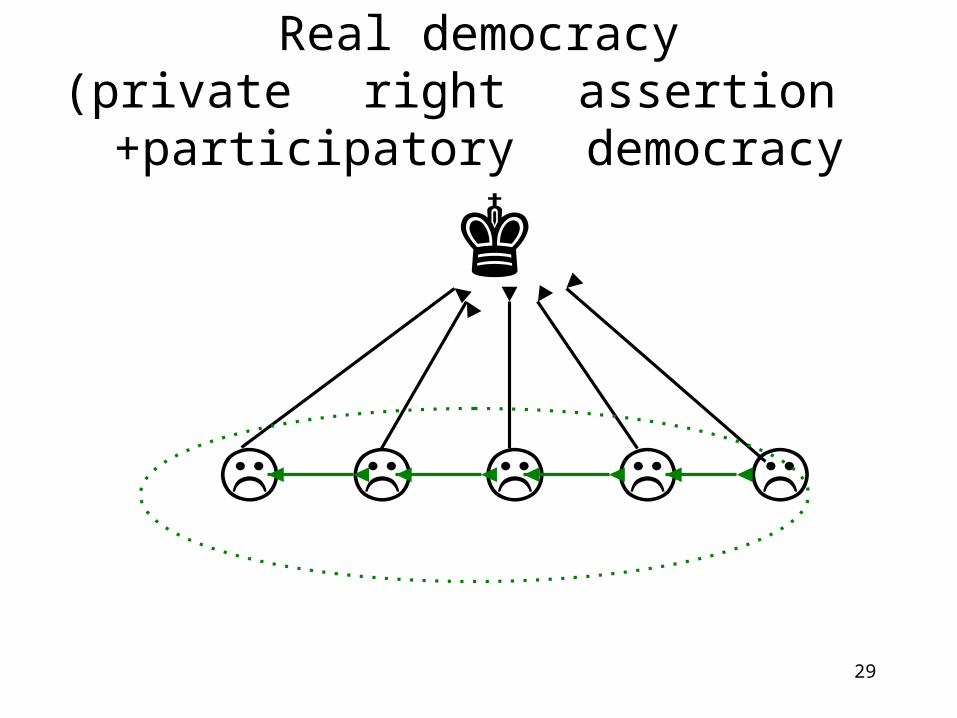
29
Real democracy(private right assertion
+participatory democracy
♚
☹ ☹ ☹ ☹ ☹