the quality of service standards and related factors in tourist hotels in arusha, tanzania
TRANSCRIPT

THE QUALITY OF SERVICE STANDARDS AND RELATED FACTORS IN
TOURIST HOTELS IN ARUSHA, TANZANIA
BY
NAIMAN, N. MBISE (BSc.)
REGISTRATION NUMBER: T129/12744/2009
A RESEARCH THESIS SUBMITTED IN PARTIAL FULFILLMENT OF THE
REQUIREMENTS FOR THE AWARD OF THE DEGREE OF MASTER OF
SCIENCE IN HOSPITALITY AND TOURISM MANAGEMENT, IN THE
SCHOOL OF HOSPITALITY AND TOURISM OF KENYATTA UNIVERSITY
NOVEMBER 2012

ii
DECLARATION
This Thesis is my original work and has not been presented for a degree or other award in
any other University.
Sign______________________________ Date________________________________
Name: Naiman, N. Mbise Registration Number T129/12744/2009
Supervisors: This Thesis has been submitted for review with our approval as University
Supervisors:
Sign ________________________________ Date______________________________
Dr. Dorcus Mbithe D-Kigaru (PhD)
Department of Food, Nutrition and Dietetics
Kenyatta University
Sign ________________________________ Date______________________________
Mr Moses Miricho
Department of Hospitality and Tourism
Kenyatta University

iii
DEDICATION
It is true that this studying opportunity was like a miracle to my life and happened in the
name of the Almighty Father GOD; „You took me through rough and rout and brought me
to this point. You gave me health, courage, and unimaginable determination, Thank you
Father‟. “You are Ebenezer.”
iv
ACKNOWLEDGEMENT
It is my sincere gratitude to express my utmost acknowledgement and special
appreciations to the following people for their support, encouragement and blessing
towards completion of this thesis. Thanks to my wife Joyce, my daughters Naomi and
Ailanga for your effort to encourage and support me during preparation of this thesis. To
my mother and relatives, thank you mother for your enduring love, preparing and making
me ready for this noble task.
To my Supervisors Dr. Dorcus Mbithe and Mr. Moses Miricho of Kenyatta University for
technical and psychological support during conceptualization, proposal writing, data
collection and analysis and thesis write up. Your support cannot be forgotten. My
lecturers at the Kenyatta University ; Dr. Khahiya, Dr. Mutungi, Dr. Bichage, Ms Rolex
Messers Murungi and Mayaka, “Thank you all”. Thank you Mr. Emanuel Haule and
Mrs. Ester Mgimba for your immerse support during data collection, entry and analysis.
Without you there would be no thesis.
To The Chief Executive Officer of the National College of Tourism, Dar-es-Salaam,
Tanzania Ms Agnes Mziray. Your immeasurable and unweighable financial and moral
support was a door to the achievement of this work. Lastly to my colleagues at the
National College of Tourism Tanzania thank you for carrying my teaching workload while
I was busy, I know that was a heavy one.
v
TABLE OF CONTENTS
TITLE PAGE ………………………………………………………………………. i
DECLARATION…………………………………………………………………… ii
DEDICATION……………………………………………………………................ iii
ACKNOWLEDGEMENT……………………………………………………......... iv
TABLE OF CONTENTS...……………………………………………………….. v
LIST OF TABLES ……………………………………………………………….. x
LIST OF FIGURES………………………………………………………………. xii
ACRONYMS AND ABBREVIATIONS …………………………………………. xiii
ABSTRACT ……………………………………..………..................................... xiv
CHAPTER ONE
INTRODUCTION
1.1 Background Information……………………………………………………. 1
1.2 Statement of the Research Problem ………..………………………………. 3
1.3 Purpose of the Study ………………………………….……………............ 4
1.4 Specific Objectives ………..……………………………………................. 4
1.5 Research Hypotheses ...…………..……………………………………....... 5
1.6 Significance of the Study……………...…………………………………… 5
1.7 Assumptions …….…………………..………………….………................. 5
1.8 Limitations of the Study..………………………………………………….. 5
1.9 Delimitation of the Study………………………………………………...... 6
1.10 Conceptual Framework of the Study …...…………………………………. 7
1.11 Operational Definition of Central Terms…………………………………… 8
vi
CHAPTER TWO
LITERATURE REVIEW
2.1 Introduction………………………………………………………………... 9
2.2 The Managers and Designing of Hotel Service Quality …………………… 9
2.3 Guest‟s Perception of Service Quality of Tourist Hotel…………………..... 10
2.3.1 Service Quality gaps …………………………………………….... 12
2.3.2 Measuring Service Quality and SERVQUAL Model……………... 16
2.4 Skills Requirement for Services Employees…………...…………………… 18
2.5 Management Practices and Service Quality in Hotel Industry ….................. 21
2.6 Conclusion …………………………………………………………………. 24
CHAPTER THREE
RESEARCH METHODOLOGY
3.1 Introduction…...………………………………………………….................. 25
3.2 Research Design…..………………………………………………………… 25
3.3 Study Area ….....……………………………………………………………. 25
3.4 Research Variables………………………………………………………….. 26
3.5 Target Population ……………...…………………………………………… 26
3.5.1 Sample Size ………………………………………………….......... 29
3.5.2 Sampling Techniques and Procedures ……………………………. 30
3.6 Research Instruments ………………………………………………………. 32
3.7 Questionnaire Administration and Data Collection Procedures……………. 33
3.8 Ethical Considerations ……………………………....................................... 34
3.9 Reliability Validity of Data Collection Instruments …………………........... 34
3.10 Data Analysis…………………………………………………….................. 35
vii
CHAPTER FOUR
DATA ANALYSIS, FINDINGS AND DISCUSSION
4.1 Introduction ………………………………………………………………… 36
4.2 Research Response Rate …………………………………………………… 36
4.3 Presentation of Result and Discussions ……………………………………. 38
4.3.1 The Hotel Managers‟ Perception on Service Quality Standards…... 38
4.3.1.1 Managers‟ Perceptions on General Hotel products
Service Quality Standards……………………………….
38
4.3.1.2 Managers‟ Perceptions on Front Office Service Quality
Standards………………………………………………...
40
4.3.1.3 Managers‟ Perceptions on Restaurant and Bar Service
Quality Standards………………………………………..
41
4.3.1.4. Managers‟ Perceptions on Guestroom Service Quality
Standards………...............................................................
43
4.4 Actual Service Quality Standards Received by the Hotel Guests................... 45
4.4.1 Guests‟ Perceptions on General Hotel Products Service Quality
Standards ………………………………........................................
45
4.4.2 Guests‟ Perceptions on Front Office Service Quality Standards of
the Hotel…………………………………......................................
46
4.4.3 Guests‟ Perceptions on Restaurant and Bar Service Quality
Standards of the Hotel…………………………………………….
48
4.4.4 Guests‟ Perceptions on Guestroom Service Quality Standards of
the Hotel…………………………………………………………..
50
4.5 Skills Possessed by Service Employees Working in Researched
Hotels………………………………………………………………………..
53
4.5.1 Age of the Employees …………………………………………… 53
4.5.2 Professional Qualification of Hotel Employees………………….. 55
4.5.3 Professional Experience of Hotel Employees ……………............ 56
4.5.4 Employee Skills Gap In the Researched Hotels………………….. 57
viii
4.6 Role of Management Practices on Delivery of Service Quality in Tourist
Hotel ………………………………………..................................................
58
4.6.1 Provision of Transports to Service Employees …………............. 59
4.6.2 Understanding of Employees on Service Quality Concept........... 59
4.6.3 On- Job Training for Employees ………………………………... 60
4.6.4 Performance Appraisal of Employees …………………………… 61
4.6.5 Motivation of Employees for delivery of Quality Service…......... 62
4.6.6 Recruitment Methods of New employees………………………... 63
4.6.7 Skills Preferred in Selection of New Employees ……………….. 64
4.6.8 Aspects Considered in Short listing of Job Applicants ………….. 65
4.7 Factors Affecting Service Quality Standards In Tourist Hotels…………….. 66
4.7.1 Regression Analysis of Factors Affecting Service Quality
Provision …………………………………….................................
67
4.8 Hypotheses Testing …………………………………………………........... 70
4.8.1 Perceptions Gaps Between Managers‟ and Guests‟ on Service
Quality Standards……………………………………………........
70
4.8.1.1 The Gap Between Guests‟ and Managers‟ Perceptions
on the General Hotel Products Service Quality
Standards ………………………………………………
71
4.8.1.2 The Gap Between Guests‟ and Managers‟ Perceptions
on the Front Office Service Quality Standards……….
72
4.8.1.3. The Gap Between Guests‟ and Managers‟ Perceptions
on the Restaurant and Bar Service Quality
Standards.........................................................................
74
4.8.1.4 The Gap Between Guests‟ and Managers‟ Perceptions
on the Guestroom Service Quality
Standards.........................................................................
76
4.8.1.5 Total Gap Between Guests and Managers Perceptions
on Service Quality in Assessed Areas …………………
78
4.8.2 The Influence of Management Practices on the Service Quality 81
ix
Standards in Tourist Hotels……………………………………….
CHAPTER FIVE
SUMMARY, CONCLUSION AND RECOMMENDATIONS
5.1 Summary and Conclusion ………………………………………………….. 85
5.2 Recommendations …………………………………..................................... 86
5.2.1 Recommendations for Policy…………………………………….. 86
5.2.2 Recommendations for Practice ………………………………....... 87
5.3 Suggestion for Further Research …………………………………………... 88
6 References………………………………………………………………...... 89
APPENDICES
1.1.1 Sample of Informed Consent ……………………………………………..... 93
1.1.2 Request Letter to the Hotel……………………………………………......... 94
1.2 Guest‟s Questionnaire………………………………………………............ 96
1.3 Managers‟ Questionnaire…………………………………………………… 102
1.4 Human Resource Managers‟ Questionnaire……………............................... 107
1.5 Employees‟ Questionnaire………………………………………………….. 112
2 Published Table for Sample Size…………………………………………… 118
3 Areas that were Used to Measure Hotel Service Quantity Standards ……... 119
1.5 Employees‟ Questionnaire
…………………………………………………………………….
108 2 Published Table for Sample
Size……………………………………………………………..
113

x
LIST OF TABLES
Table 3.1 A Description of the Study Population …………………………... 27
Table 3.2 A Sample Frame ……………………………….……………….... 28
Table 3.3 Sampled Respondents in Each Hotel……………………………... 32
Table 3.4 Methods of Administering Questionnaires…...………………..... 33
Table 3.5 A description Data Analysis Methods ………………………….... 35
Table 4.1 Respond Rate …………………………………………………….. 37
Table 4.2 Managers‟ Perceptions on General Hotel Products Service
Quality Standards……………………………………………….....
39
Table 4.3 Managers‟ Perceptions on Front Office Service Quality
Standards…………………………………………………………..
40
Table 4.4 Managers‟ Perceptions on Restaurant and Bar Service Quality
Standards…………………………………………………………..
42
Table 4.5 Managers‟ Perceptions on Guestroom Service Quality
Standards…......................................................................................
44
Table 4.6 Guests‟ Perceptions on General Hotel Products Service Quality
Standards ………………………………………….........................
45
Table 4.7 Guests‟ Perceptions on Front Office Service Quality
Standards………………………………………………………..…
47
Table 4.8 Guests‟ Perceptions on Restaurant and Bar Service Quality
Standards…………………………………………………………..
49
Table 4.9 Guests‟ Perceptions on Guestroom Service Quality Standards…... 51
Table 4.10 Presentation of the Employees‟ Professional Experience ………... 55
Table 4.11 Employee Skills Gap In the Researched Hotels …………….......... 58
Table 4.12 Response of Employees‟ performance Appraisal ……………....... 62
Table 4.13 Motivation of Employees for Delivery of Service Quality …......... 63
Table 4.14 Recruitment Methods of New Employee ……………………........ 64
Table 4.15 Skills Preferred n Selecting Employees…………………............... 65
xi
Table 4.16 Aspects Considered in Short listing the Applicants ……………... 66
Table 4.17 Result of ANOVA Test for Factors Affecting Service Quality
Provision ….....................................................................................
67
Table 4.18 Factors Affecting the Provision of Service Quality ……………… 68
Table 4.19 Gap Between Guests‟ and Managers‟ Perception on the General
Hotel Product Service Quality Standards …………………………
71
Table 4.20 Gap Between Guests‟ and Managers‟ Perception on Front Office
Service Quality Standards……………………................................
73
Table 4.21 Gap Between Guests‟ and Managers‟ Perception on Restaurant
and Bar Service Quality Standards………………………………..
75
Table 4.22 Gap Between Guests‟ and Managers‟ Perception on Guestroom
Service Quality Standards…………………………………………
77
Table 4.23 Total Gap Between Guests and Manager Perception Service
Quality on Assessed .Areas………………………………………..
79
Table 4.24 Significant Attribute to Service Quality Standards …………......... 80
Table 4.25 Independent T- Test on Management Practices Satisfaction……... 83
xii
LIST OF FIGURES
Figure: 1.1 Correlates of Service Quality to Hotel Guests …………………..... 7
Figure: 2.1 Perceived Service Quality and Corporate Image …………………. 11
Figure 2.2 Service Quality Model…………………………………………...... 15
Figure 4.1 Service Employees‟ Age Distribution …………………………..... 54
Figure 4.2 Presentation of Employees‟ Professional Qualification ………...... 56
Figure 4.3 Responses on the Employees‟ on Job Training………………….... 61
xiii
ACRONYMS AND ABBREVIATIONS
ANOVA - Analysis of Variance
GDP - Gross Domestic Product
KSHs - Kenya Shillings
SERVQUAL - Service Quality Model
SPSS - Statistical Packages for Social Science
TTB - Tanzania Tourist Board
URT - United Republic of Tanzania
$ US - American Dollar
xiv
ABSTRACT
The expansion of hotel industry in Tanzania has stimulated the growth of tourism industry
in the country due to increase of availability and variety of accommodation, food, drinks
and other services. Together with this expansion the hotel industry is facing challenges in
meeting customers‟ satisfaction. Customers have complained that level of services
standard does not equate to the amount of money that are charged. Thus, the purpose of
the study was to establish the quality service standards and related factors in tourists‟
hotels in Arusha, Tanzania. The study design was a descriptive cross sectional survey. The
sample size included 180 guests residing in tourist hotels in Arusha at the time of data
collection, 240 service employees and 28 managers. Purposive, convenient and simple
random sampling methods were used. The data collection instruments were structured
questionnaires. Data were analysed by Statistics Packages for Social Science, (version16)
and explained in descriptive and inferential statistics. The Analysis of Variance (ANOVA)
was used to measure gaps between the managers‟ and guests‟ perception while
independent t-test measured the role played by management practices in delivery of
service quality. Regression analysis was used to predict factors that affect the service
quality standards. Findings showed that nearly all hotel employees (95%) had an
understanding on the service quality concept. The managers‟ and guests‟ perceptions were
significantly different in hotel design and presentation (p= 0.03) and location accessibility
and visibility (p= 0.02). Moreover the managers‟ and guests‟ perceptions were
significantly different in the speedy check-in and checkout, staff courtesy and
professionalism (p =0.04), reasonable room rates/value for money (p = 0.01) in front
office area. The manager‟ and guests‟ perceptions in restaurant and bar were also
significantly different in quality, colour and presentation of food (p= 0.02), reasonable
restaurant and bar prices, creativity in service techniques and styles (p= 0.01); billing and
cashiering procedures (p=0.02), health and dietary (p = 0.01) and; variety of dishes on
menu (p =0.00). Furthermore guestroom had more attributes which were significant when
managers‟ and guests‟ perceptions measured. These included room ambience, quietness
and colour (p= 0.02), comfortness of bedding and seating (p=0.04), quality of fixtures,
sufficient fixtures (p=0.03) and room maintenance, staff courtesy and professionalism,
voice and accent of staff (p = 0.01). The study indicated that, nine management practices
had influence on service quality and these were leadership styles (p = 0.04) motivation,
training and development, communication at all level (p = 0.01) and rewarding style (p=
0.02) while employment process, compensation and employees‟ welfare were significant
at p = 0.00. From the findings two conclusions were made: First, managers‟ and guests‟
perceptions on service quality standards were significantly different; secondly,
management practices significantly influence the service quality standards in tourists‟
hotel in Arusha. This study recommends that, effective implementation of management
practices is vital as it plays a key role in ensuring service quality and that the guests‟
requirement should be known before designing the service or product.
1
CHAPTER ONE
INTRODUCTION
1.1 Background Information
The contribution of hospitality industry in economic activities in Sub-Saharan Africa has
been noticed in provision of employment and increasing of Gross Domestic Products
(GDP) (Sharma and Upneja, 2005). The hospitality industry has become a major means
of diversifying the economy in most of Africa Sub-Saharan Countries (Sharma and
Upneja, 2005).
In Tanzania, the development of hospitality industry started in the early 70s, but was
wholly state owned (United Republic of Tanzania, 1999). This was different from the
usual perspective of managing the hospitality and tourism industries, whereby it is
widely known that the industry is private sector motivated. After independence,
Tanzania followed a socialist system whereby major means of production were owned
by the majority (Umma). Despite the fact that Tanzania had a lot to offer to foreign
tourists, the tourism industry found itself struggling for existence. This was due to
mismanagement, lack of accountability and responsibility which resulted in some
properties being closed and others operated at a loss (URT, 1999).
It was in the early 1990s when Tanzania liberated trade and adopted a free market
economy. Most of the state owned businesses, including hospitality business were
privatized. In that time Tanzania witnessed a boom of investments in tourism
enterprises, especially chain lodges and international hotels (URT, 1999). Though these
2
changes were important for the hospitality and tourism industry to revitalize, they did
not take into account the business environment factors. The industry faced poor
language proficiency, communication skills and lack of qualified employees to provide
services that met international standards (URT, 2002). Very few ordinary – level
Secondary school graduates were opting for tourism careers in hotel, travel and tourism
operations courses. Others opted because they had no other choices (URT, 2002). Even
parents themselves would not allow their children to take careers in hospitality and
tourism studies because those were considered to be for Primary education graduate or
Secondary education failures (URT, 1999). This led to the industry inheriting a labour
force with poor performance at all levels.
It is also, important to note that the service concept was not accepted in a socialist
society like Tanzania. In other socialist countries like China, it was also completely
nonexistent during Mao Zedong regime (Tsang and Qu, 2000). In Tanzania, the
hospitality industry was viewed as a foreign system which was trying to introduce Neo-
feudalism (Lord and servant relationship) literary in Swahili known as Ubwenyenye
(Ubwana na Utwana). Due to the origin of hospitality work, people associated the
hospitality industry with colonial legacy, servility and poor status work (Wood, 1995).
This could probably be the reason as to why during Tanzanian President Nyerere‟s
regime, the tourism industry was not a national priority in the country‟s development
plans. The societal perceptions and other factors inherited from the social and political
systems, resulted into attitude problems, poor education and training in hospitality and
tourism industry which set out poor level of service standards in Tanzania. Thus, this

3
study aims to establish the quality of service standards and related factors in tourist
hotels in Arusha, Tanzania.
1.2 Statement of the Research Problem
The operation of tourist hotel requires meeting international standards to ensure the
delivery of quality service. Despite the fact that the hotel in Tanzania industry has tried
to achieve these standards, complaints still arise about the quality of service offered
(URT, 2002). Studies have shown that Tanzania has a long history in the development of
the hotel industry but many challenges make the country not to full utilize its potential
(URT, 2002). Poor service standards have been a concern not only to the government
but also to other stakeholders including the hotel owners, tour operators and Tanzanian
development partners such as the European Union, the World Bank (URT, 2002).
To date, tourism industry in Tanzania contributes over 17% to the national GDP and is
ranked second in foreign exchange earnings after gold. It is estimated that for every
tourist arrival in Tanzania, 12 Tanzanians benefit directly and indirectly. Figures from
Tanzania Tourist Board (TTB) show that currently the tourism industry employs more
than two hundred and fifty people. Large percent of employment is from the hotel
industry which employs both skilled and semi-skilled labour. The Integrated Tourism
Master Plan of Tanzania (URT, 2002) identified that Tanzania international
competitiveness is being jeopardised by a poor level of service standards. Equally, large
proportions of European tour operators surveyed in 2002 felt that the service elements in
Tanzania were not high enough to justify the prices being charged (URT, 2002).

4
Moreover poor service standards have been indicated as an impediment to future growth
of tourism industry in Tanzania. The gap of the level service quality standard and the
potential of the tourism industry in Tanzania justified the need and viability of this
study.
This study was therefore intended to establish the quality of service standards and
related factors in tourist hotels in Arusha, Tanzania; which is widely recognised as the
tourism hub and gateway to the famous tourist attractions.
1.3 Purpose of the Study
The main objective of the study was to establish the quality of service standards and
related factors in tourist hotels in Arusha, Tanzania.
1.4 Specific Objectives
To achieve the purpose, the specific objectives of this study were to:
1. Determine hotel manager‟s perceptions on quality of service standards offered to
guests in Arusha.
2. Assess actual service quality standards received by the hotel guests in Arusha.
3. Establish skills possessed by service employees working in tourists hotels in
Arusha.
4. Establish the role of management practices on delivery of service quality in tourist
hotels in Arusha.
5. Examine factors affecting service quality standards in tourist hotel in Arusha.
5
1.5 Hypotheses
Ho1: There is no significant difference between managers‟ and guests‟ perceptions on
service quality standards.
Ho2: Management practices do not significantly influence the service quality standards
in tourist hotels in Arusha.
1.6 Significance of the Study
The findings of this study will be disseminated through peer reviewed refereed journal
publication and it is expected that they will be useful to government of Tanzania in
formulation of policies for hospitality and tourism industry. The findings will also be
useful to industry managers in designing service product, formulating and implementing
human resources management policies in Tanzania. In addition, the findings will
provide the hospitality training institutions with useful information in preparation of
teaching curricula.
1.7 Assumptions
Assumption was made that the total number of beds in hotels was equivalent to average
number of guests accommodated in a hotel or lodge per night.
1.8 Limitations of the Study
A limitation of study is an aspect of the study that the researcher knows may adversely
affect the results or generalizability of the results of the study, but over which she/he has
6
no direct control over (Orodho, 2008). In the course of this study the researcher faced
different limitations as follows:
Currently, Tanzania has not gazetted the classification of hotels. The classification of
hotels in Tanzania is still in the process. The researcher faced difficult on knowing
the standard of the hotels.
The nature of work in the hotel industry where employees are working on shift basis
was limitation to this study; this was because respondents could not be reached at the
same time in the researched hotels.
In addition, there was red tape in some of the hotel in providing information to
researcher. Most of the managers were either reluctant or not read to give
information that was required.
1.9 Delimitation of the Study
The use of Trip Advisory Popularity Index was used by a researcher to classify the
hotels (http:ww.tripadvisor.com).
The researcher used the respondents who were in day shift to overcome the problem
of respondents with different schedules of day and night.
The researcher used the information obtained from hotel managers who were read
to contribute and clearly understood that the main aim of that information was
purely academic.

7
1.10 Conceptual framework for the Study
The framework shows the interrelationship between management of the hotel,
employees and service quality provision to the guests.
Figure 1.1: Correlates of Service Quality to Hotel Guests
Source: Researcher, Author (2010)
The conceptual frame work shows interlink between service quality and variables which
directly affect the delivery of service quality. Managers should understand the guests‟
needs and wants, which provide a means of locking-in customers‟ requirements in the
services and products. The customers‟ requirements are translated into service or
products specifications and service employees trained on them. The training provides
skills in form of technical, interpersonal and aesthetic and utilized in delivering of
Gu
ests, satisfactions an
d Loyalty
Match guest perceptions and
management perceptions of
quality of service.
Employees Leadership style,
Tra
inin
g o
n s
ervic
e S
pec
ific
atio
n
Under
stan
d g
ues
t nee
ds
and w
ants
Interp
ersonal, T
echnical an
d A
esthetics sk
ills
Satisfaction
to bo
th emplo
yees and
Gu
est
Lock
in G
uest‟s req
uirem
ents in
service p
rovisio
n
Service quality to hotel
guests
Selection, Training, Evaluation, Rewarding Management of
hotels
Match guest perceptions and
management perceptions of
quality of service.
Employees
Leadership style, T
rain
ing o
n s
ervic
e S
pec
ific
atio
n
Under
stan
d g
ues
t nee
ds
and w
ants
Interp
ersonal, T
echnical an
d A
esthetics sk
ills
Satisfaction
to bo
th emplo
yees and
Gu
est
Lock
in G
uest‟s req
uirem
ents in
service p
rovisio
n
Service quality to hotel
guests
Selection, Training, Evaluation, Rewarding Management of
hotels
Gu
ests, satisfactions an
d Loyalty

8
quality services. In ideal service environment, the management practices facilitate the
delivery of quality service. When the situation shown in the conceptual framework
happens, the guests‟ perceptions definitely match with managers‟ perceptions hence
delivering of the quality service to the hotel guests.
1.11 Operational Definitions of Central Terms
Customer/Guest : This includes tourist residing in any of the tourist hotel in Arusha
Perceptions : That is what a guest or manager believe to be standards to attain
service quality
Respondents : These are guests, managers, employees, hotels and lodges that
will be included in a sample size.
Service Quality : Service performance has reached the level that guest expected
Skill : Defined as a competence to perform specific job-related tasks or
human characteristics on which people may differ in the
performance of work.
Tourist : In this study the tourist will be referred to a foreign tourist
residing in tourist hotel in Arusha.
Tourist hotel : Refers to an establishment which offers accommodation, food
and drinks to foreign tourists for a payment.
9
CHAPTER TWO
LITERATURE REVIEW
2.1 Introduction
Literature was reviewed under the following headings: Managers and designing service
quality in the hotel; guests‟ perception of service quality of tourist hotel, measuring
service quality and SERVQUAL model; skills requirement for service employees;
management practices and service quality in the hotel; and, the conclusion done at the
end of chapter.
2.2 The Managers and Designing of Service Quality in the Hotel
Designing service quality package poses a big challenge to hotel managers. This is
because locking-in guest requirements is the most important aspects in meeting service
quality and hence guest satisfaction. Hotel guests are always dynamic. Changes which
occur due to economic growth or decline, technology and globalization affect the
lifestyle, fashion, as well as customer preference and taste (Kandampully, 2006).These
changes have major impact on the service design and delivery. It is worth noting that
these changes have made the hospitality managers to move from offering the tradition
products (food, drinks and accommodation) to offering a bundle of other services to
fulfill both primary and secondary needs Kandampully (2006). The service components
make guests to be loyal to the hospitality firm, thus delivery of superior service becomes
a priority for the hospitality firm‟s success. The understanding of guest‟s requirements,
having correct service delivery plan and evaluation of the market will, therefore enable
10
the hospitality firm in designing a service quality package that fulfills guests‟
expectations (Sigala, 2008).
2.3 Guests’ Perception on Service Quality of the Tourist Hotel
For service firm to provide the quality service, it is important to understand the way
guests assess the quality service, parameter used in their assessment and the way quality
can be conceptualized. There are various models proposed by researchers; having
similarities to each other (Kandampully, 2007). As far as perception is concerned,
measuring service quality depends much on the subjective manner. What is best to one
individual does not guarantee that another individual will accept that evaluation. This
scenario makes assessment being quite personal and relative. (Kandampully, 2007)
identified three dimensions in which guests assess the service conformance. The
dimensions include material (e.g. food in the restaurant); and such facilities that
compliment the core offering as comfortable seating in restaurant and personnel such as
friendly and pleasant bellboy. The variation of views in explaining the way guests assess
the service quality have been expressed by Parasuraman et al., (1985, 1988) and Brady
and Cronin (2001).
Grönroos (1984) identified two dimensions which guests use in assessing the service
quality which are technical and functional qualities. The suggestion based on the fact
that service quality is combination of technical quality such as room and bed in a hotel
and functional quality which includes appearance of the hotel receptionist and waiter.
Later incorporated the aspect of corporate image in Grönroos (1984); the main argument

11
was a guest perceives service quality of the firm from the technical and functional
quality and this is influenced by corporate image. This is elaborated by Figure 2.1 as
adapted from Kandampully (2007).
Figure 2.1: Perceived Service Quality and Corporate Image
Source: Kandampully (2007).
Figure 2.1 indicate the way guests evaluate the service quality. In formulating the hotel
products and services the hotel managers should use the same view so as to achieve the
service quality.
Expected
Service
Corporate Image
Perceived
service
Technical Quality
Functional Quality
Perceived service
quality
12
2.3.1 Service Quality Gaps
The service quality is the function of gaps between the guest expectation of the service
quality and their perception of the actual service delivered (Parasuraman et al., 1985). In
simple understanding, a gap is the difference between what one wants and what one gets
(Kandampully, 2007). Although some researchers have shown seven gaps of service
quality (Tsang and Qu, 2000), this study focused on five gaps which were initially
identifies by SERVQUAL model pioneers.
Gap one is the result of the differences in guest expectations and management
perceptions of guest expectation. This gap arises due to mistaken information in market
research and demand analysis, wrong interpretation of information about expectations,
insufficient feedback information from guest to the management, unflattened
organizational management hierarchy and absence of employees‟ empowerment in an
organization.
Gap two arises due to the variation in translating guest expectations into specifications
of service quality. This emerges as a result of insufficient resources to lock in guest
specifications and requirement to service quality conformance standard. It also emerges
due to the management mindset that „it is impossible to meet guest needs‟. It is therefore
impossible to establish specifications of those needs. Moreover, lack of management
commitment to service quality and stiff competition in the market is another cause of the
second gap of service quality.

13
Gap three occurs as a result of the difference between the specifications of service
quality and real delivery of service. This gap is also referred to as service conformance
gap (Kandampully, 2007). It is the consequence of misunderstanding between service
employees and management. This could be that an employee is unable or not willing to
deliver service at the desired level. For example, if the hotel specification is to pick up
telephone calls within three rings, then this needs to be conformed by a switchboard
attendant. But, not every switchboard operator will adhere to the specification. Others
may ignore it and keep the telephone ringing up to five or six rings. This gap, therefore
caused by: poor training and development of service employees, communication flow
breakdown when management explains to the employees the desired level of service;
poor human resource management practices such as poor motivation, inadequate
recruitment and selection practices, unfulfilled promises to the employees and
inadequacy service supervision from the service area supervisors.
The fourth gap is the difference between service delivery and external communication.
This gap is also referred to as a communication gap (Gabbies and O‟Neill, 1997). The
information delivered to guests through various media such as website, email and
brochures, adverts and television becomes a company‟s promise to its guests. The guests
expect, on consuming services of that company must conform to the media information.
This gap, therefore, may arise due to: marketing department having insufficient
information about service quality specifications; exaggeration of what the service firm
offer; improper planning of marketing strategy of hotel services; and exaggeration
14
tendency of guest inherited from exaggerated publicity of quality of service that
organization offers.
Gap five is the sum of differences of other four gaps, and it is a deviation between
expected and perceived service. This gap arises as a result of overall discrepancies in
design, marketing and delivery of service. To close that gap, expectation and perception
must match when guest expectations are met; service quality is perceived satisfactory
(Berry et al., 1990). If the expectations are not met then, service quality is perceived as
less than satisfactory and when it exceeds the expectations, service quality is perceived
to be more than satisfactory. In actual fact, guests evaluate quality of service in both the
service delivery process and service outcome (Kandampully, 2007). These gaps are
clearly explained in the Figure 2.2.

15
Figure2.2: Service Quality Model
Source: Adapted from (Tsang & Qu, 2000; Zeithaml et al., 2006; Gržinic, 2007)
Guest‟s
Expectation
Guest perception
Gap 5
Actual hotel service
delivery
Translation guest‟s
perceptions into service
quality specifications
Management perception of
guests‟ expectation
External communication
with guest
Gap 4
Gap 1 Gap 3
Gap 2
Guest
Company
Guest needs Word of mouth Previous experience
16
2.3.2 Measuring Service Quality and SERVQUAL Model
Literature has shown how guests evaluate the service quality offered by an organization.
For the service organization to get feed-back from the guest on extent of service
excellence, it is vital to understand how to measure the perceived service quality by the
guests. However, before measuring of the service quality, it will be meaningful to define
the service quality both in scholars‟ perspective and in the context of this study. Service
quality has been defined as a gap between the guest expectation and the guest perception
of service received (Parasuraman et al., 1985).The same scholars in their research in
1988 redefined service quality as a global judgment or attitude related to the overall
excellence. The term judgment used in this definition refers to perception of the guest
against his or her expectation (Nadiri and Hussain, 2005). The use of expectation as the
means of benchmarking service quality in hospitality industry has been debated by
several researchers (Kandampully et al., 2001).This arise from the suggestions that
expectations may not exist or be clear enough in respondent‟s mind to act as a
benchmarking against perceptions assessed (Kandampully et al., 2001).This study
therefore has defined the service quality as a level at which service performance of the
hotel meets the customers‟ perceptions.
The measurement of perceived service quality has been widely studied by Parasuraman,
Zeithaml and Berry (2006). They came up with the tool called SERVQUAL for
evaluating a guest assessment of service quality (Kandampully 2007). This model has
extensively been used in various studies (Gabbie and O‟Neill, 1997; Tsang and Qu
2000; Gržinic, 2007; Bagherian, 2007; Wadawi, 2008). This indicates that the model is
17
well accepted within the field and hence was adapted in this study. Parasuraman et al.,
(1985) defined service quality through ten attributes which they sum up those attributes
to five (Parasuraman et al., 1988). These are: Tangibles, which includes physical
facilities equipments and personal appearance; reliability this refers to ability to perform
the desired service dependably accurately and consistently; responsiveness which
pertain to willingness to provision of prompt service and help customers; assurance
which base on knowledge, competence ability to convey trust confidence and credibility;
and empathy which is provision of caring service and individualized attention.
Though SERQUAL model is popular in many studies, there are criticisms in using it to
measure service quality (Grönroos, 2002; Kandampully, 2007). As pointed before, the
use of expectation as a means of benchmarking for perception is still debatable. This
brings criticisms which lie on the fact that it is impractical to ask the guests about
expectations of service immediately before the consumption and their perception of
performance immediately after (Kandampully et al., 2001).Some guests have a tendency
to choose “strongly agree” or “very important” for all aspects (Kandampully et al.,
2001).This brings out the argument that expectation is a result from previous service
encounter of which perceptions feed directly to the expectations (Kandampully et al.,
2001).Other criticism based on the truth that guests have difficulty in differentiating
scale items (Kandampully, 2007). Despite this, the tool is still widely accepted in
conducting empirical studies in the area of measuring the service quality (Fisk et al.,
1993). However, in this study the researcher will only assess perception to measure the
service quality performance of the hotels which will be surveyed. This direct approach

18
of measuring the service quality has been advocated by many researchers (Kandampully
et al., 2001). The study used hotel areas to evaluate the service quality of hotel as
perceived by guest and by manager expectation; the elaboration of these areas is given
appendix 3. These areas and attributes shown in appendix 3 were used in construction of
questionnaires.
2.4 Skills Requirement for Services Employees
Service firms such as hospitality and retails are labour intensive with employees
experiencing direct and frequent contacts with the customer. It is only through focused
development support of all employees with an emphasis on high-quality and high-skills
that the hospitality industry can reach its full business potential. Thus, for the hotel
industry to be able to deliver service quality which is expected by customer, it is
necessary for the employees to acquire required skills to become service – oriented.
The types of skills required in the hotel industry are divided into three categories. These
are technical skills which concerns product knowledge, Interpersonal skills which deals
with social behavior of individual during service encounter. The last is aesthetic skills
which generally focus on looking and sounding of individual. Though literature
indicates that most of the employers are now focusing on recruiting employees with
interpersonal and aesthetic skills (Nickson et al., 2005), there is need for employees to
be competent in technical skills (Hai-yan and Baum, 2006). A technical skill enables the
service employee to be confident when explaining the service product to the guest. Since
employees act as internal marketers during service encounter, it is necessary for them to

19
be fully acquainted with service products and how to deliver them to guests. The
production and consumption of hospitality service is simultaneous thus an organization
does not get time to inform their clients on the advantages of consuming their services.
Hence relies on the ability of personnel to convey that message to the guests. This brings
the necessity of training the service employees on product knowledge. It is widely
agreed that in order to improve the guests‟ satisfaction, all employees in service area
should understand guests, and, be familiar with the hotel service products (Hai-yan and
Baum, 2006). Thus, technical skills enable employees to execute the steps and
procedures which are required in achieving service quality in the hotel industry. For
example, if a cocktail waiter possesses technical skills of cocktail shaking in the bar;
then he/she can achieve quality standards of serving cocktail because skills of processing
determines quality of end product (Waller, 1996).
A trend in the hospitality industry has been moving to personal attributes than technical
skills. These personal attributes are those which relate to interpersonal skills such as
honesty, reliability, courtesy, professional attitude (Nickson et al., 2005). In generally,
the interpersonal skills are results of individual behaviour, background, education
system, social system and culture. Interpersonal skills enable one individual to interact
with another individual for a certain purpose such as business and socializing; example
of a business situation is when a waiter is taking drink or food order from the guest; or
socially is when employee and employee interact by discussing a certain issue regarding
their daily life (Nickson et al., 2005). The interpersonal skill is also very important for a
leader such as a supervisor because it tells other employees the kind of leader they have.
20
It is commonly accepted that improving a person‟s knowledge and skills through
training is relatively straight forward; however, significant problems are encountered
when trying to change employee‟s attitude (Caravan, 1997). Equally, the interpersonal
aspects of service delivery are potentially the most difficult to audit and improve (Teare,
1996). It is clear that training of employee on social skills improves service quality
(Provis et al., 2003). This explanation proves the necessity of employees training on
interpersonal skills.
Today, in the hospitality and tourism industry, the employee appearance plays a
significant role to the employer selection process (Harper, 2000). This practice is
recognized as aesthetic skill which can be explained as the way individuals appear or
look and how he/she sound. It also includes the dressing and make ups. The aesthetic
skills have been key factors in service encounter and this is justified by SERVQUAL
model which includes the aspect of demeanor as a crucial attribute in provision of
quality service. This is proved when considering the aspects of appearance in terms of
the person delivering service and the environment itself (Nickson et al., 2005). The
aspect of aesthetic skills is closely connected with customer satisfaction. Nickson et al.,
(2005) showed that employers with employees that look good and or sound good create
peculiar image to the company, and the managers are using that as a competitive
advantage in the market place.

21
2.5. Management Practices and Service Quality in the Hotel
The influences of management practices in ensuring that organizations deliver quality
service expected by guests cannot be ignored. Researchers have indicated the
relationship between management practices and organization performance of a service
firm (Pfeffer, 1998). Management practices are important in promoting service
excellence. This is through communicating with the employees to emphasize the norms
and values related to service quality and excellence (Hartog and Verburg, 2002).
Borucki and Burke (1999) argued that, if an organization is to deliver quality service
then the internal environment and subsystem must be well coordinated and managed to
facilitate the achievement of the wished standard of service. Schneider et al., (1998)
pointed out the same argument that service climate rests on certain basic issues which
are quality of internal service existing in an organization and human resource
management. These provide the fundamental facts that management practices have
significant contribution to achieving the service quality excellence in an organization.
The important aspects of managerial practices in ensuring service quality are human
resource management practices these include employee selection, training, evaluation,
compensation; empowerment and motivation are hereby discussed in detail. Employee
selection is the most critical part in ensuring that an organization achieves its objective
in delivering desired service quality. This is because service quality depends on the
skills, altitude and personality trait of the service employee (Provis et al., 2003). It is
indicated that three out of five dimensions of SERVQUAL model which hospitality
managers and researchers use in analyzing gaps in service delivery constitutes
personality traits which include responsiveness, assurance and empathy (Bailey and

22
McCullough, 2000). The argument of personal characteristics has actually become very
important when considering that delivery of service is associated with skills which
involve the emotional which is controlled by personal characteristics. A good example
of emotional trait which is associated with deterioration of service quality is job burnout
(Armstrong 2006). Thus, delivery of quality service commences with selection of
suitable employee with necessary personal characteristics. After selection the next step
is training the new employee.
Training is an essential tool in achieving the service quality in an organization. Slåtten,
(2009) indicated that training is the managerial practice that is linked to the
improvement of service quality. Training enhances empowerment of the employees
which play a great role in service recovery and performance (Babakus et al., 2003).
Training helps employees to understand the service vision of the organization, also helps
in ironing out ambiguities which an employee might be facing in the provision of the
service especially when he /she is new in the organization. Literature shows that the
reason for having gap three in service quality model is due to the management failing to
train their employees on specifications of service quality to be delivered to the guest.
Therefore, training should be considered as a vital part in achieving service quality in
the hotel industry (Cran, 1994). After training, it is imperative to measure the impact of
training, in bridging the gap identified before training (Armstrong, 2006). Measurement
of how training has impacted on employee performance is known as employee
evaluation. Evaluation provides time for employee to discuss obstacles and challenges
faced in provision of service quality. In evaluation, the manager and employee discuss

23
together how to solve the challenges and a solution is mutually agreed. The evaluation is
necessary for employees of a service organization as it promotes helpful internal
relationship within a service environment (Zeithaml et al., 2006). It is, therefore,
important for managers to be careful in assessment of employees, as a subjective
evaluation may ruin the effort of employee commitment to provision of service quality.
Research shows that fair compliments to the employees provide willingness to that
employee to provide quality service to guests (Hartog and Verburg, 2002; Schneider and
Bowen, 1993). The evaluation is followed with reward or compensation.
Reward or compensation plays an essential part in achieving the service quality.
Research reveals that rewarding has been associated with job satisfaction, commitment,
and employee loyalty (Bowen and Johnston, 1999; Brown and Peterson, 1993). Bowen
and Johnson (1999) pointed out that treating employee fairly will have advantage to the
organization as those employees will also reciprocate that treatment to guests hence
attaining the goal of providing quality service. But, in the hotel and tourism industry
there is a big controversy in regard to rewarding this is because Baum and Nickson,
(1998) pointed out that while industry proclaim itself to be peoples‟ industry, depend on
capability and enthusiasm of its front line employees in delivery of quality service to
guests. On the other hand, those employees are poorly developed, paid, and work for
long hours than employees of any other sector.
Leadership style is a critical aspect of service quality in hotel industry. Manager‟s
expressing an empowering leadership style and commitment to service quality promote

24
climate that lead employees to share the organization's values (Clark et al., 2009).
Empowerment has been cited as a key role to organization to achieve service quality
(Hickman and Mayer, 2003). And empowerment leads to employees‟ motivation and
happiness; equally lead to truth responsive to guests needs (Zeithaml et al., 2006).
2.6 Conclusion
Literature search identified that service quality is a gap between the guests‟ expectations
and perceptions this study has viewed the service quality as the guests‟ perceptions of
service performance after consuming. Emphasis has focused on the way managers view
the hotel services or products. Hence, this study compared the perceptions of the
industry managers and guests to identify the gap. The SERVQUAL model was utilized
to analyse the gap. This served as a means of knowing whether the industry managers in
Arusha understand guests‟ requirements; and how they translate them into specifications
of services and products offered to the guest. These specifications should form training
tasks for service employees for proper delivery of service. The training provides the
service employees the required skills to deliver the service standard perceived by guests
as a quality service. The service environment in the hotel industry must be conducive to
ensure service employees enjoy their work. The management practices have been
deemed as the factor which might inhibit or facilitate the delivery of service quality in
Arusha. This study was therefore, intended to establish the quality of service standards
and related factors in tourist hotels in Arusha, Tanzania.
25
CHAPTER THREE
RESEARCH METHODOLOGY
3.1 Introduction
Presented in this chapter are the highlights of how the study was conducted including
study design sampling, development of data, collection tools and the way data were
collected, analysed and presented.
3.2 Research Design
The research design enables the researcher to collect data with minimal expenditure of
effort time and money (Orodho, 2008). In this study, a cross sectional descriptive survey
design was adapted, whereby data were collected at the single point on variables
required to be analysed. This type of design allows collected data to make inference
about a surveyed population at one point in time (Hall, 2011).
3.3 Study Area
The study was conducted in Arusha City. Arusha is located at the foot of Mount Meru
positioned on the north east of Tanzania. Arusha was built by the Germans in the late
19thC and became the center of colonial administration. Arusha is recognised as a hub
for tourism in Tanzania (Sharma, 2007). Its geographical position makes it to be the
gateway to the top tourist attractions such as the Serengeti National Park and
Ngorongoro Conservation Area, Olduvai Gorge and Manyara National Park. From
Arusha, tourists can connect to the Mount Kilimanjaro, thus a starting point for many
26
safaris.The popularity of Arusha as a tourism hub and gateway to tourist attractions was
the motivation for the researcher to select it as a study area.
3.4 Research Variables
Research variables are categorized into independent and dependant. Independent
variable predicts the variation that may occur in dependable variables (Mugenda and
Mugenda, 2003). The dependable variable attempts to indicate the total influence arising
from the effect of the independent variables. In this study, tourist perceptions,
management perceptions, were independent variables. The quality of service delivered
by tourist hotel to tourists was dependant variable. In addition skills possessed by
service employees, management practices were intervening variables.
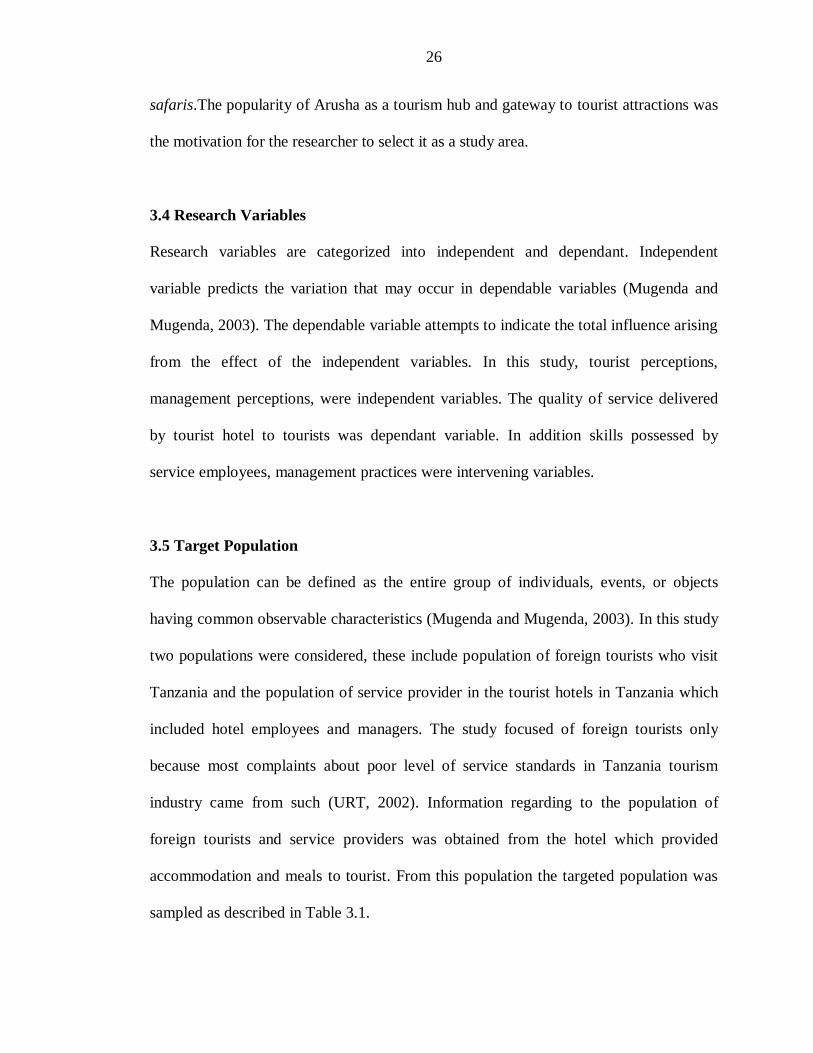
3.5 Target Population
The population can be defined as the entire group of individuals, events, or objects
having common observable characteristics (Mugenda and Mugenda, 2003). In this study
two populations were considered, these include population of foreign tourists who visit
Tanzania and the population of service provider in the tourist hotels in Tanzania which
included hotel employees and managers. The study focused of foreign tourists only
because most complaints about poor level of service standards in Tanzania tourism
industry came from such (URT, 2002). Information regarding to the population of
foreign tourists and service providers was obtained from the hotel which provided
accommodation and meals to tourist. From this population the targeted population was
sampled as described in Table 3.1.
27
Table 3.1: A Description of the Study Population
Target Population Survey population
1 Foreign Tourists visiting Tanzania Foreign Tourists residing in hotels in
Arusha.
2 All employees and managers from
Tourists‟ hotels in Tanzania
Employees and Managers from Tourists‟
hotels in Arusha.
A sample frame is a complete list of all sampling subjects that can adequately represent
the population (Mugenda and Mugenda, 2003). A sample frame may include records
such as register of hotels, hotel guests‟ lists, and employees list. At certain cases, formal
list may not exist, however literature shows that when there is no sample frame which
satisfy the needs of the research, the researcher may develop a sample frame which has
desired characteristics or attributes (Mugenda and Mugenda, 2003). Based on that
argument, this study developed the sampling frame as shown on Table 3.2

28
Table 3.2: A Sample frame
S/N Name of
Hotel/
Lodges
Hotel
Tag
Beds
Capacity
Rack
Rate ( US $)
Total
Service
employee
Total
Managers
in
Establish
ments
Trip
Advisor
Popularity
Index
(Stars)
1 Arusha Hotel AH 86 240 74 8 4
2 New Safari
Hotel
SH 74 90 29 6 3
3 *Naura
Spring Hotel
NH 125 120 60 4 3
4 Impala Hotel IH 177 90 64 4 3
5 Corridor
Spring Hotel
CS 96 135 24 3 3
6 East Africa
Suite Hotel
EA 54 85 20 3 4
7 Kibo Palace
Hotel
KP 77 160 46 7 4
8 African Tulip
Hotel
AT
29 170 33 2 4
9 Elewana
Coffee Lodge
CL 30 219 37 4
4
10 Mountain
Village
Serena Lodge
MV 63 215 30 2 4
11 Moivaro
Lodge
ML 88 160 49 1 3
12 Arumeru
River Lodge
AL
20 135 20 2 3
13 Snow Crest
Hotel
SC 57 150 28 5 3
14 Ngurdoto
Mountain
Lodge
NGM 360 135 56
3 4
Total 1336 570 54
The table was developed after visiting to each establishment listed above and discuss with
the management
*The status of hotel dropped during data collection hence left out of the sample
Source: Researcher, Author, (2010) from Tourist Hotels in Arusha, Tanzania
29
3.5.1 Sample Size
Literature has suggested the sample size which can be taken depends on the type of the
research to be undertaken and the study design. Gay in Mugenda and Mugenda (2003)
suggested that correlation research requires 30 cases or more, for descriptive study ten
percent of the population is enough for population of below 10,000 and for experimental
studies at 30 cases are required per group. However, this study was cross sectional and
data was collected in a period of one month, the number of beds in all hotels was
multiplied by 30 days to form sample frame of tourists residing in hotels in Arusha. That
means 1308 x 30 = 39240 tourists; that translated into approximate 470,880 tourists in a
year which was target population. In this study, the following formula was used to
calculate the sample size (Cochran, 1963):
2
2
d
PqZn
Where:
n = the desired sample size q= 1-P (1- 0.08 = 0.91)
Z= the standard normal deviation at the required confidence level which is 1.96
d= the level of statistical precision (5%) when Z is 1.96.
P= the proportion in the target population estimated to have characteristics being
Measured which was 0.08 of the total population.
Thus, Sample size = (1.96)2 (
0.9167) (0.0833) = 0.28274176
=117.34respondents
(0.05)2 0.0025
30
This study focused on 180 hotel guests as a sample size. This allowed the researcher to
achieve required sample size in the situation of non-response.
The sample size for managers was determined by a census whereby all were 24
managers. A total of 240 employees were included in the sample size. The estimation of
the employees sample size was taken from published table for sample size (Israeli,
2009).
3.5.2 Sampling Techniques and Procedures
Each survey population in this study was sampled using its own technique. The
population of the hotels were sampled using judgement method where by twelve hotels
in the sample frame were included. The judgemental method was employed because
hotels were selected according to the way tourists have rated them in the Trip Advisor
Website. On the sampling frame, researcher had indicated that fourteen hotels would be
surveyed but at the time of data collection, the status of one of the hotels had dropped
from three stars to two stars in the Trip Advisor Website rating (Trip Advisor, 2010).
This obliged the researcher to drop the hotel because the study did not target hotel below
three stars.
Selection of guests depended on their willingness and availability to participate in the
study thus convenient sampling was used. Purposive sampling was used to select the
hotel managers. The rationale was the hotel managers and human resource managers

31
were considered to have information on how; hotel products are designed and the
management practice influences in delivering quality service.
Simple random sampling was employed to select hotel employees. Due to the nature of
hotel industry, which is working on shift basis, it was difficult to ensure every employee
was represented in the sampling size. This brought in, sampling the employees who
were presented during the sampling day. After knowing the number of employees in
section, simple random sampling technique was employed. This was done by writing
YES and NO in pieces of paper equal to the number of employees presented on that day
in section of the hotel. Pieces of paper written YES were equal to the number of the
respondents required to participate in the research, in this case five service employee
respondents were picked in each department. Pieces of paper written YES and NO were
mixed together in a box, shaken then service employees asked to pick one each after
another. Those who picked YES were included in the sample size. This study used
probability sampling when selecting service employees and non -probability sampling
when picking the tourist residing in the hotels Arusha and hotel Managers as the
respondents. Table 3.3 show the number of respondents sampled from each hotel.

32
Table 3.3: Sampled Respondents in Each Hotel
Key: See Tables 3.2
3.6 Research Instruments
In this study, the researcher used a structured questionnaire (Appendix1.2) in collecting
information on perception of tourists on service quality and managers‟ perception in
designing the hotel products. Semi-structured questionnaire was used in collecting
information from service employees in the hotels. Semi-structured questionnaire was
also used to collect data which relates to management practices; and human resources
practices such as annual training schedules, evaluation forms and staff welfare facilities.
Serial
Number
Hotel
Name/Tag
Guests
Respondents
Sampled
Employees’
Respondents
Sampled
Manager’s
Respondents
Sampled
1. IM 15 25 2
2. NG 15 25 2
3. NS 20 25 2
4. MV 20 25 2
5. ML 20 25 2
6. AR 10 10 2
7. SC 10 15 2
8. KP 15 20 2
9. AH 10 15 2
10. EA 10 15 2
11. CS 15 15 2
12. CL 15 15 2
13. AT 5 10 2
Total
Respondents
180 240 26
33
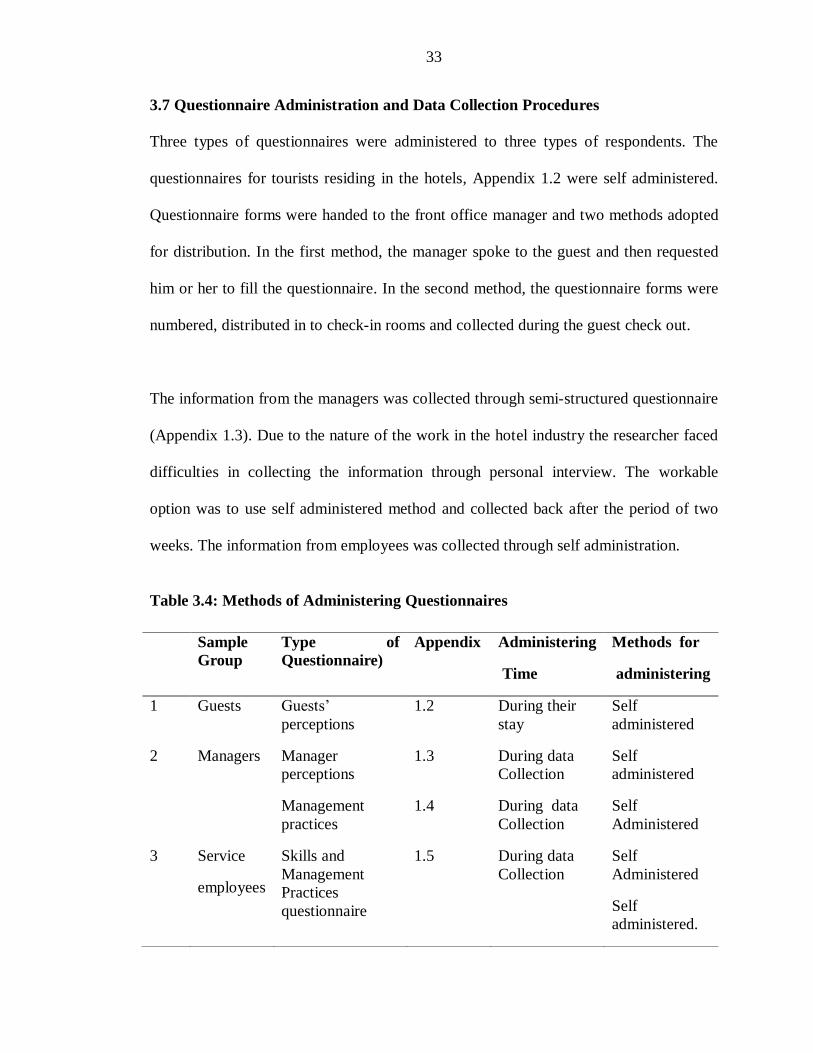
3.7 Questionnaire Administration and Data Collection Procedures
Three types of questionnaires were administered to three types of respondents. The
questionnaires for tourists residing in the hotels, Appendix 1.2 were self administered.
Questionnaire forms were handed to the front office manager and two methods adopted
for distribution. In the first method, the manager spoke to the guest and then requested
him or her to fill the questionnaire. In the second method, the questionnaire forms were
numbered, distributed in to check-in rooms and collected during the guest check out.
The information from the managers was collected through semi-structured questionnaire
(Appendix 1.3). Due to the nature of the work in the hotel industry the researcher faced
difficulties in collecting the information through personal interview. The workable
option was to use self administered method and collected back after the period of two
weeks. The information from employees was collected through self administration.
Table 3.4: Methods of Administering Questionnaires
Sample
Group
Type of
Questionnaire)
Appendix Administering
Time
Methods for
administering
1 Guests Guests‟
perceptions
1.2 During their
stay
Self
administered
2 Managers Manager
perceptions
1.3 During data
Collection
Self
administered
Management
practices
1.4 During data
Collection
Self
Administered
3 Service
employees
Skills and
Management
Practices
questionnaire
1.5 During data
Collection
Self
Administered
Self
administered.

34
3.8 Ethical Considerations
Ethical issues which are normally concern to research are confidentiality, privacy
anonymity and informed consent. The question of being ethical cannot be ignored by
any research; this is because there is law which prohibits unethical behaviour in
conducting researcher (Mugenda and Mugenda, 2003). The issue of ethics in this study
was highly taken in consideration. A research permit was obtained from the Kenyatta
University and the Ministry of Natural Resources and Tourism. The hotel managers,
guests and other respondents were requested to read an informed consent before filling
the questionnaire (Appendix 1.1). However, for respondents to sign the informed
consent was impossible because they perceived that they might be held responsible for
information which would be provided; others did not want their identity to be disclosed
because of their personal reasons.
3.9 Reliability and Validity of Data Collections Instrument
The reliability of the questionnaire used in this study was tested and found result is same
throughout the exercise. The reliability of the questionnaire was tested by pre-testing
questionnaire in one of the hotels with characteristics similar to the sampled hotels.
The validity in this study was achieved in three ways. Reviewing the relevant literatures
for this study made the researcher notice how other people have measured the variable
under investigation. The use of triangulation such as use of different samples and
methods of data collection increases the validity of the study also (Cooper and
Schindler, 2003). To ensure the triangulation, this study used three types of sample;

35
tourists, managers, and employees. In addition to that, the expert validated the data
collection instruments.
3.10 Data Analysis
To enhance accuracy, uniformity, completeness, consistency and to simplify the coding
exercise, data was edited as soon as it was collected. In this study, both field and office
editing were conducted by the researcher. The editing exercise started when collecting
the forms from respondents. At the time of receiving the filled questionnaires, the
researcher counterchecked for completeness. Table 3.5 summarizes the data analysis
procedures.
Table 3.5: A Description of Data Analysis Methods
Objectives Analysis methods
Determine the manager‟s perception on quality of
service standards offered to guests.
Frequencies, Mean and standard
deviation
Assess actual service quality standards received
by the hotel guests.
Frequencies, Mean and standard
deviation
Establish skills possessed by service employees
working in hotels in Arusha
Descriptive statistics; mean and
percentages
Establish the role of management practices on
delivery of service quality in tourists‟ hotels in
Arusha.
Independent T-test , Descriptive
statistics; mean, average,
Establish factors affecting service quality in
tourist hotel in Arusha
Regression analysis
Hypothesis testing ANOVA, independent T- test
36
CHAPTER FOUR
RESULTS AND DISCUSSION
4.1 Introduction
In this chapter, research results are presented, discussed and interpreted basing on stated
research objectives. At the end the research hypotheses were tested and findings
discussed accordingly.
4.2 Research Response Rate
The participation of the sampled hotels and the percentages of respondents achieved
were satisfactory to make inference of this research. In this study, 56% of guests, 53%
employees and 70% managers responded accordingly.

37
Table 4.1: Response Rate
Hotel
Name/
Tag
Guest’s Respondent Employee’s
Respondent
Manager’s
Respondent
Sampled Responded Sampled Responded Sampled Responded
IM 15 4 25 20 2 2
NG 15 6 25 10 2 2
NS 20 11 25 20 2 2
MV 20 20 25 15 2 1
ML 20 11 25 16 2 2
AR 10 6 10 8 2 2
SC 10 9 15 7 2 2
KP 15 15 20 15 2 2
AH 10 8 15 10 2 2
EA 10 0 15 0 2 0
CS 15 6 15 4 2 1
CL 15 0 15 0 2 0
AT 5 4 10 5 2 1
Total
Respo
ndents
180 100 240 127 26 18
%
Respo
ndents
55.6% 53% 69.2%
Source: Researcher, (2011) Key: See Table 3.2

38
4.3 Presentation of Results and Discussion
This part presents the research results and discussion of the findings. The results have
been presented according to the objectives.
4.3.1: The Hotel Managers’ Perception on Service Quality Standards
This part explains the perception of managers on service quality standards in areas of
general hotel product, front office, restaurants and bar and guestroom. Managers play a
major role in designing the service quality standards, the way they perceive certain
attribute important and other less important, affects the final evaluation of service
quality standards by the guest. This fact brings the importance of analyzing their
perception before the actual assessment of the service quality standards.
4.3.1.1: Managers’ Perception on General Hotel Product Service Quality Standards
The assessment of the general hotel product as one of the components of service quality
standard is based on the fact that guest evaluates the service quality standard technically
and functionally. Technical qualities include attributes like accessibility of the hotel, car
parking, architectural design and landscaping. In this study the perception of manager on
general hotel product was evaluated and presented in Table 4.2
39
Table 4.2: Managers’ Perception on General Hotel Product Service Quality
Standards
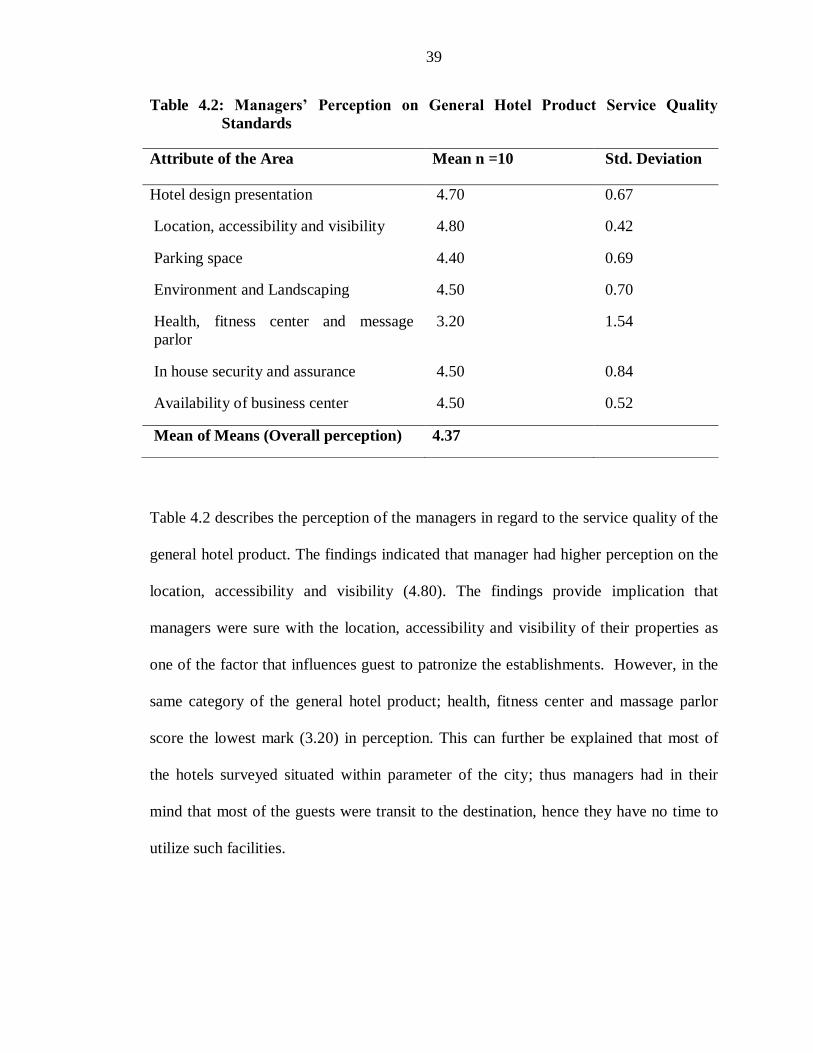
Table 4.2 describes the perception of the managers in regard to the service quality of the
general hotel product. The findings indicated that manager had higher perception on the
location, accessibility and visibility (4.80). The findings provide implication that
managers were sure with the location, accessibility and visibility of their properties as
one of the factor that influences guest to patronize the establishments. However, in the
same category of the general hotel product; health, fitness center and massage parlor
score the lowest mark (3.20) in perception. This can further be explained that most of
the hotels surveyed situated within parameter of the city; thus managers had in their
mind that most of the guests were transit to the destination, hence they have no time to
utilize such facilities.
Attribute of the Area Mean n =10 Std. Deviation
Hotel design presentation 4.70 0.67
Location, accessibility and visibility 4.80 0.42
Parking space 4.40 0.69
Environment and Landscaping 4.50 0.70
Health, fitness center and message
parlor
3.20 1.54
In house security and assurance 4.50 0.84
Availability of business center 4.50 0.52
Mean of Means (Overall perception) 4.37

40
4.3:1:2 Managers’ Perception on Front Office Service Quality Standards
Hotel‟s front office section is regarded as the nerve centre of all operations. To the
guests, manager is largely represented by the front office staff. The first impression
guest encounter during the first day on arrival plays important part to the final
assessment of the service quality standard delivered. The information regarding the
perception of manager on front office service quality was gathered and presented on
Table 4.3.
Table 4.3: Managers’ Perception on Front Office Service Quality Standards
Attribute of the Area Mean n=10 Std. Deviation
Comfortable and welcome feeling 4.60 0.69
Speedy check in and check out 4.70 0.67
Staff appearance, grooming and presentation 4.60 0.84
Language proficiency of staff 4.20 0.91
Voice and accent of staff 4.10 0.56
Reliability of message and wakeup call service 4.60 0.69
Provision of accuracy and reliable information 4.40 0.69
Reasonable room rates/value for money 4.60 0.51
Staff telephone manner 4.30 0.67
Utilization of technology system 3.80 0.91
Convenient and reliable reservation 4.60 0.69
Speed and responsiveness to requests 4.30 0.82
Professional complaint handling 4.50 0.70
Staff courtesy and professionalism 4.70 0.48
Mean of Means (Overall perception) 4.42
41
The finding showed above in Table 4.3 provides the perception of managers on service
quality offered at the front office. Managers ranked speedy check in and check out; staff
courtesy and professionalism highly (4.70). This means that when managers were
designing hotel product gave the attributes high priority. On the other hand utilization of
the technology system ranked lowest (3.80). The situation explained by the fact that
more than 80% of the hotels surveyed were between 25 and 80 rooms. The size of the
establishment may dictate the use of technology; as the numbers of guests were few
employees could handle them manually. Second, the utilization of technology requires
huge investment, with small hotels and small businesses, could not afford to install such
technology.
4.3.1.3 Managers’ Perception on Restaurants and Bar Service Quality Standards
Manager need to collect the information regarding the needs and expectation before
designing what to offer to guest. That assists in understanding of guests need and
expectation, hence meeting service quality standards. The perception of managers on
restaurant and bar were determined and the findings presented in Table 4.4.
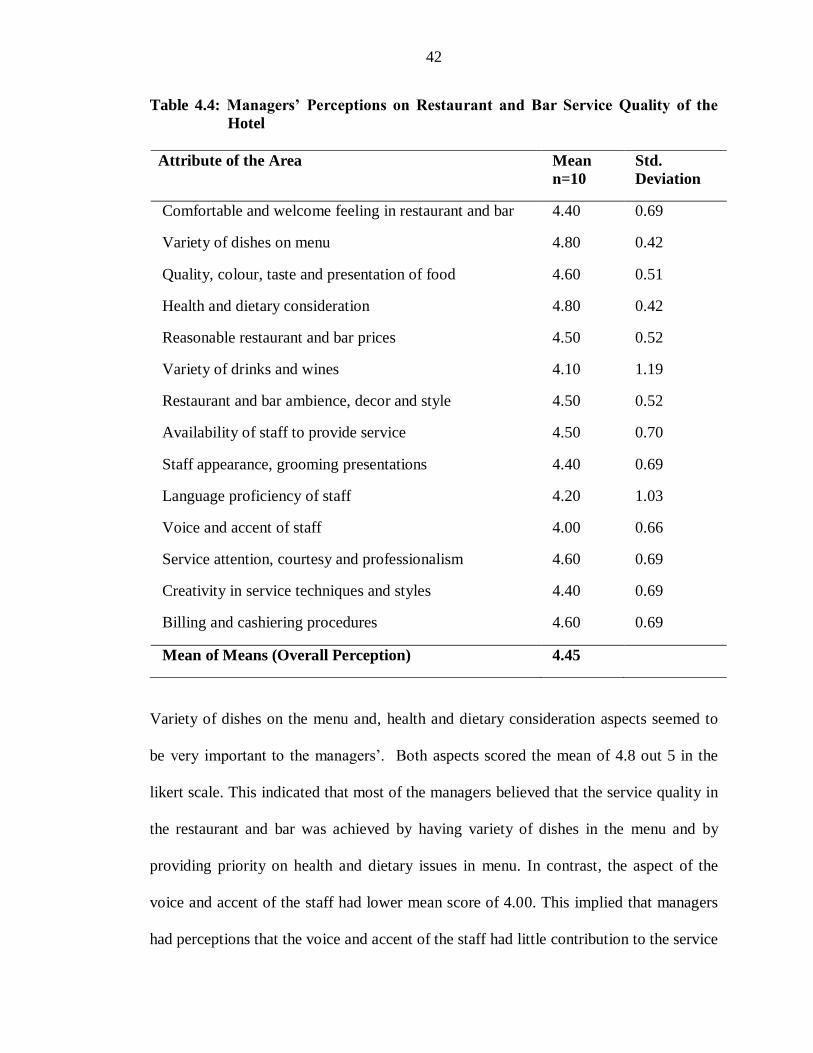
42
Table 4.4: Managers’ Perceptions on Restaurant and Bar Service Quality of the
Hotel
Variety of dishes on the menu and, health and dietary consideration aspects seemed to
be very important to the managers‟. Both aspects scored the mean of 4.8 out 5 in the
likert scale. This indicated that most of the managers believed that the service quality in
the restaurant and bar was achieved by having variety of dishes in the menu and by
providing priority on health and dietary issues in menu. In contrast, the aspect of the
voice and accent of the staff had lower mean score of 4.00. This implied that managers
had perceptions that the voice and accent of the staff had little contribution to the service
Attribute of the Area Mean
n=10
Std.
Deviation
Comfortable and welcome feeling in restaurant and bar 4.40 0.69
Variety of dishes on menu 4.80 0.42
Quality, colour, taste and presentation of food 4.60 0.51
Health and dietary consideration 4.80 0.42
Reasonable restaurant and bar prices 4.50 0.52
Variety of drinks and wines 4.10 1.19
Restaurant and bar ambience, decor and style 4.50 0.52
Availability of staff to provide service 4.50 0.70
Staff appearance, grooming presentations 4.40 0.69
Language proficiency of staff 4.20 1.03
Voice and accent of staff 4.00 0.66
Service attention, courtesy and professionalism 4.60 0.69
Creativity in service techniques and styles 4.40 0.69
Billing and cashiering procedures 4.60 0.69
Mean of Means (Overall Perception) 4.45
43
quality in the restaurant and bar. That is the reason why ranked less important in the
questionnaire. Nickson et. al., (2005) noticed, that managers use aesthetics skills as the
cutting edge in the marketing of the hotel business hence the diverging from the finding
of this study.
4.3.1.4: Managers’ Perception on Guestroom Service Quality Standards
Guests spend most of their stay in the hotel in the guest‟s room. This brings the
necessity to hotel managers to ensure that quality of service offered in the guestroom
meets the needs and expectation of the guest. Table 4.5 presents the information on
managers‟ perceptions on the guestroom service quality.
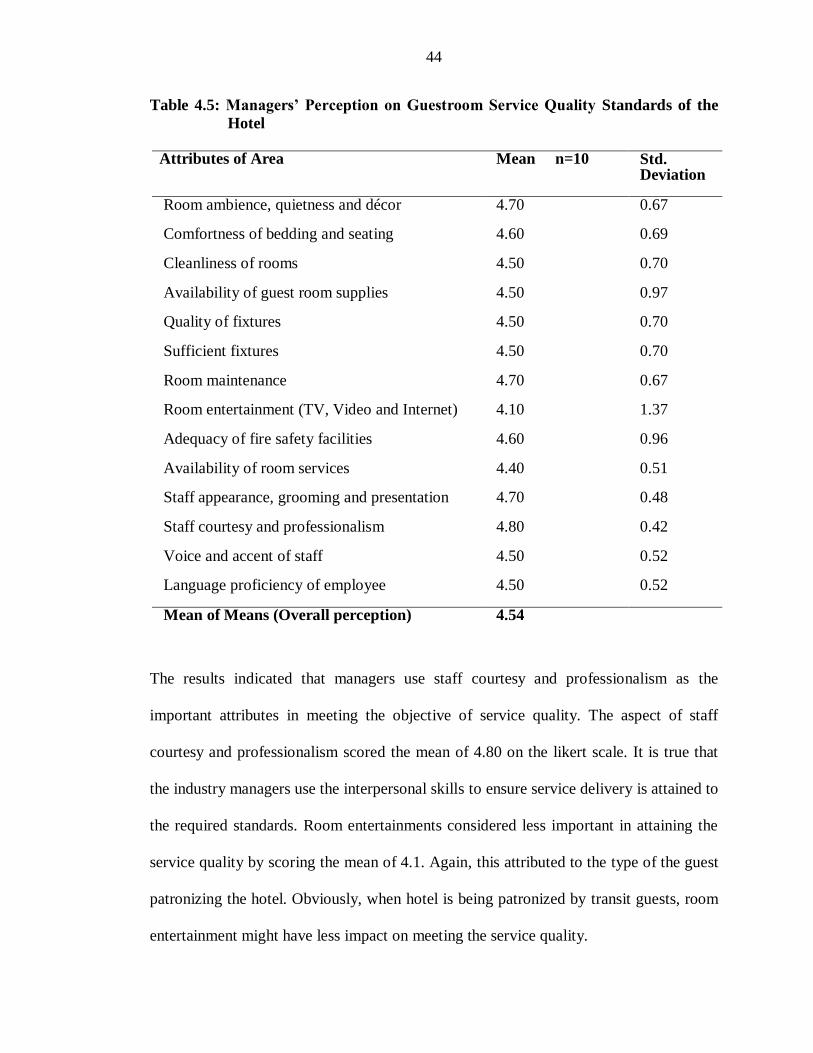
44
Table 4.5: Managers’ Perception on Guestroom Service Quality Standards of the
Hotel
The results indicated that managers use staff courtesy and professionalism as the
important attributes in meeting the objective of service quality. The aspect of staff
courtesy and professionalism scored the mean of 4.80 on the likert scale. It is true that
the industry managers use the interpersonal skills to ensure service delivery is attained to
the required standards. Room entertainments considered less important in attaining the
service quality by scoring the mean of 4.1. Again, this attributed to the type of the guest
patronizing the hotel. Obviously, when hotel is being patronized by transit guests, room
entertainment might have less impact on meeting the service quality.
Attributes of Area Mean n=10 Std. Deviation
Room ambience, quietness and décor 4.70 0.67
Comfortness of bedding and seating 4.60 0.69
Cleanliness of rooms 4.50 0.70
Availability of guest room supplies 4.50 0.97
Quality of fixtures 4.50 0.70
Sufficient fixtures 4.50 0.70
Room maintenance 4.70 0.67
Room entertainment (TV, Video and Internet) 4.10 1.37
Adequacy of fire safety facilities 4.60 0.96
Availability of room services 4.40 0.51
Staff appearance, grooming and presentation 4.70 0.48
Staff courtesy and professionalism 4.80 0.42
Voice and accent of staff 4.50 0.52
Language proficiency of employee 4.50 0.52
Mean of Means (Overall perception) 4.54
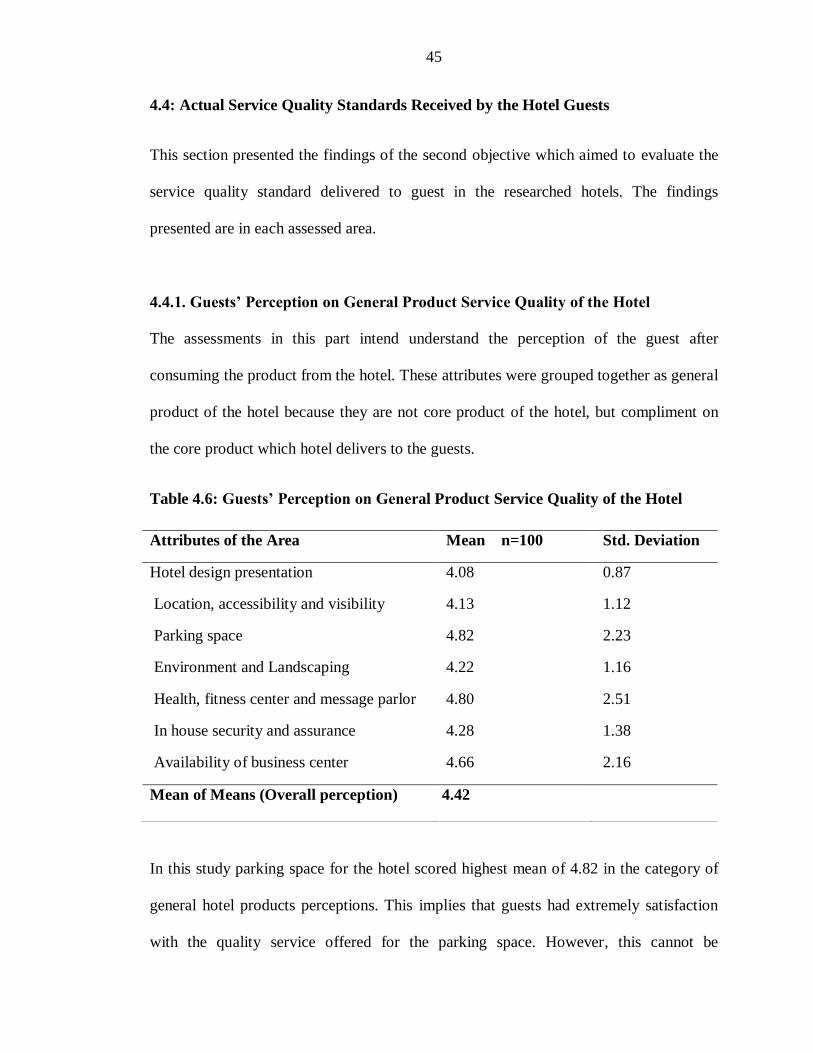
45
4.4: Actual Service Quality Standards Received by the Hotel Guests
This section presented the findings of the second objective which aimed to evaluate the
service quality standard delivered to guest in the researched hotels. The findings
presented are in each assessed area.
4.4.1. Guests’ Perception on General Product Service Quality of the Hotel
The assessments in this part intend understand the perception of the guest after
consuming the product from the hotel. These attributes were grouped together as general
product of the hotel because they are not core product of the hotel, but compliment on
the core product which hotel delivers to the guests.
Table 4.6: Guests’ Perception on General Product Service Quality of the Hotel
In this study parking space for the hotel scored highest mean of 4.82 in the category of
general hotel products perceptions. This implies that guests had extremely satisfaction
with the quality service offered for the parking space. However, this cannot be
Attributes of the Area Mean n=100 Std. Deviation
Hotel design presentation 4.08 0.87
Location, accessibility and visibility 4.13 1.12
Parking space 4.82 2.23
Environment and Landscaping 4.22 1.16
Health, fitness center and message parlor 4.80 2.51
In house security and assurance 4.28 1.38
Availability of business center 4.66 2.16
Mean of Means (Overall perception) 4.42
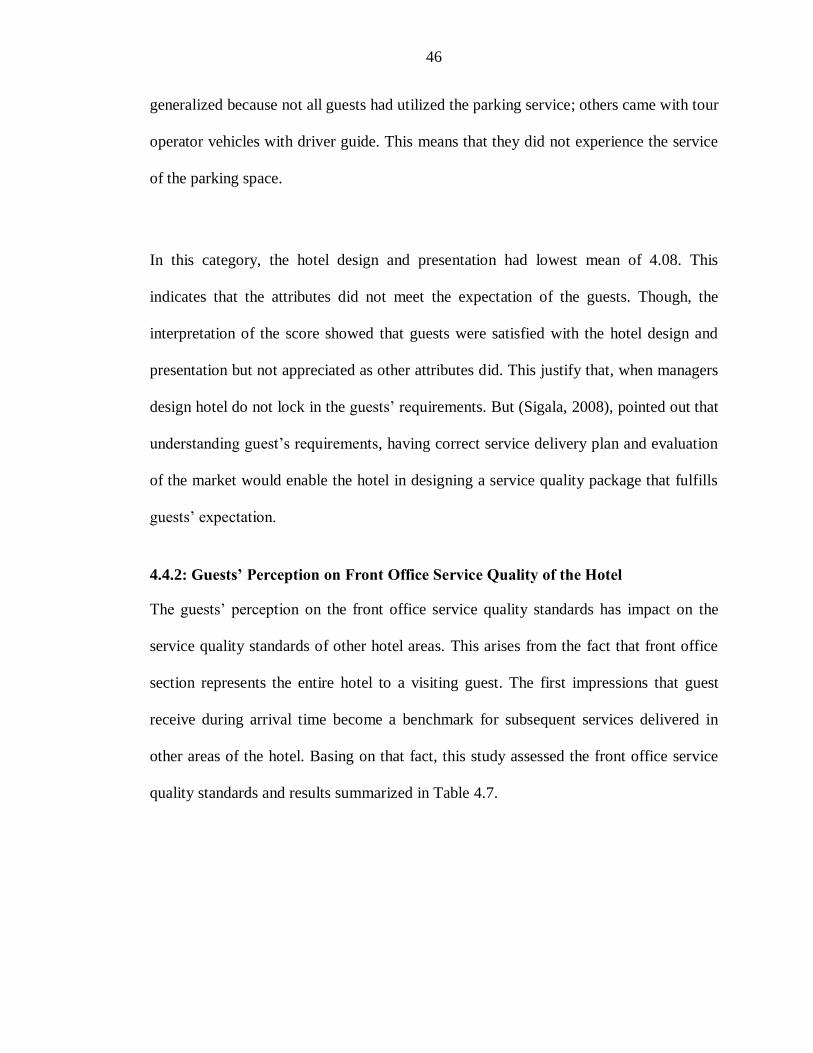
46
generalized because not all guests had utilized the parking service; others came with tour
operator vehicles with driver guide. This means that they did not experience the service
of the parking space.
In this category, the hotel design and presentation had lowest mean of 4.08. This
indicates that the attributes did not meet the expectation of the guests. Though, the
interpretation of the score showed that guests were satisfied with the hotel design and
presentation but not appreciated as other attributes did. This justify that, when managers
design hotel do not lock in the guests‟ requirements. But (Sigala, 2008), pointed out that
understanding guest‟s requirements, having correct service delivery plan and evaluation
of the market would enable the hotel in designing a service quality package that fulfills
guests‟ expectation.
4.4.2: Guests’ Perception on Front Office Service Quality of the Hotel
The guests‟ perception on the front office service quality standards has impact on the
service quality standards of other hotel areas. This arises from the fact that front office
section represents the entire hotel to a visiting guest. The first impressions that guest
receive during arrival time become a benchmark for subsequent services delivered in
other areas of the hotel. Basing on that fact, this study assessed the front office service
quality standards and results summarized in Table 4.7.
47
Table 4.7: Guests’ Perception on Front Office Service Quality of the Hotel
The front office is the focal point of communication in the hotel organization. The
guests assessed the front office area and the findings described in Table 4.7. The results
indicated that convenient and reliable reservation ranked the best in meeting guest
satisfaction. The scored mean was 4.77 out of 5 on the likert scale, which translated that
the guest were extremely satisfied. On the other hand this can be said that, 85% of the
respondents were holiday makers, conference and meeting guests; thus did not make
reservation on their own. The holiday and safari planners such as tour operators and
Attribute of the Area Mean n=100 Std. Deviation
Comfortable and welcome feeling 4.19 0.81
Speedy check in and check out 4.25 1.04
Staff appearance, grooming and presentation 4.26 0.81
Language proficiency of staff 4.04 0.86
Voice and accent of staff 4.09 1.08
Reliability of message and wakeup call service 4.65 2.18
Provision of accurate and reliable information 4.33 1.61
Reasonable room rates/value for money 4.28 1.78
Staff telephone manner 4.65 1.98
Utilization of technology system 4.41 2.04
Convenient and reliable reservation 4.77 1.76
Speed and responsiveness to requests 4.40 1.51
Professional complaint handling 4.65 2.24
Staff courtesy and professionalism 4.18 1.02
Mean of Means (Overall perception) 4.43

48
travel agents, conference organizers were responsible for the reservation. Thus, the
guests did not utilize such type of service.
Results showed that front office employees performed poorly in language proficiency
than any other element in front office. Guests perceived the language proficiency of
front office employees at the score mark of 4.04. That can be interpreted as satisfied in
likert scale. However, that was the element scored less than any other element. Thus
showing that language proficiency of the front office employees was a problem in the
researched hotels.
In assessing the importance of language proficiency of front office employee, the hotel
managers indicated that it was essential (4.1) in design of service quality which in not
very high. This perception of the managers might contribute to guest‟s perceptions;
because the quality of service in the front office depends on the understanding of the
manager on importance of having well trained employees in both interpersonal,
technical and aesthetics skills.
4.4.3: Guests’ Perception on Restaurant and Bar Service Quality of the Hotel
Satisfying guests in food and beverage operations face great challenge in meeting their
needs and expectations. Food and drinks are sensitive items to the guest patronizing the
hotel; it also includes a lot of purchasing of materials which make its budget to be
strictly monitored, to ensure it is within agreeable limit. In this study the information
regarding the perception of guests in service quality standards is presented in Table 4.8

49
Table 4.8: Guests’ Perception on Restaurant and Bar Service Quality of the Hotel
Restaurant and bar is one of the area which guests receive moment of truth about the
service quality delivery, and differ from other areas because employees and guests
contacts is longer when comparing to guestroom and front office. In this study the
service quality of twelve (12) hotels assessed by guests, the findings of the study is as
shown in Table 4.8. The result of this research indicated that service attention, courtesy
and professionalism scored rank 4.14 which indicate that guests were satisfied.
Attribute of Area n= Mean Std.
Deviation
Comfortable and welcome feeling in restaurant and
bar
100 4.14 0.94
Variety of dishes on menu 97 3.88 0.87
Quality, color, taste and presentation of food 98 3.98 0.85
Health and dietary consideration 93 3.97 1.01
Reasonable restaurant and bar prices 96 3.94 1.08
Variety of drinks and wines 95 3.85 1.01
Restaurant and bar ambience, decor and style 96 3.93 0.88
Availability of staff to provide service 97 3.98 0.89
Staff appearance, grooming presentations 98 4.02 0.83
Language proficiency of staff 99 3.90 0.90
Voice and accent of staff 96 3.94 1.01
Service attention, courtesy and professionalism 98 4.14 0.87
Creativity in service techniques and styles 89 3.70 0.91
Billing and cashiering procedures 91 3.83 1.03
Mean of Means (Overall Perception) 3.94

50
In provision of service quality, creativity in service technique and styles is important
factor in service industry. However, findings of this study showed that in restaurant and
bar, the aspects of creativity in service techniques style scored low (3.71). This was
attributed with employees training; on-job training stimulates creativity within the
establishment. The findings of the study indicated that on-job training was not
emphasized in many hotels.
4.4.4: Guests’ Perception on Guestroom Service Quality Standards of the Hotel
Hotel guests spend most of their stay in the room, hence they require high standard of
service in that room. To meet guest satisfaction, management of the organization needs
to provide service quality in each room elements. In this study the guests assessed each
element in the room and findings were shown in the Table 4.9. In general, guest‟s
perception in the guestroom was very low as compared to other areas.

51
Table 4.9: Guests’ Perception on Guestroom Service Quality of the Hotel
The findings indicated that cleanliness of the room scored highest mean of 4.15 meaning
that guests were satisfied with the room cleanliness. On other hand, room entertainment
scored low level (3.75), some of the guest commented on this, especially the provision
of internet in the room:
Attribute of the Area n= Mean Std.
Deviation
Room ambience, quietness and décor 100 4.04 0.87
Comfortness of bedding and seating 100 4.01 0.87
Cleanliness of rooms 100 4.15 0.82
Availability of guest room supplies 99 4.07 1.07
Quality of fixtures 99 3.89 0.86
Sufficient fixtures 100 3.89 0.85
Room maintenance 100 3.89 0.97
Room entertainment (TV, Video and
Internet)
95 3.75 1.33
Adequacy of fire safety facilities 89 3.85 1.42
Availability of room services 87 3.85 0.92
Staff appearance, grooming and
presentation.
98 4.01 1.04
Staff courtesy and professionalism. 98 3.95 0.88
Voice and accent of staff. 96 3.80 0.90
Language proficiency of employees. 95 3.86 0.89
Mean of means Overall Perceptions 3.93
52
……“Internet service connection was frequently out and every 30 minutes I need
to get new password. They do not provide via phone. I needed to go front desk to
get new one”……
Guest Respondent
Looking at the whole area of guest room, there were some of aspects which guests
assessed and awarded very low means score. The quality of fixtures, sufficient fixtures
and room maintenance, were ranked equally by guests. This is noticed by looking to
their means which were 3.89, 3.89 and 3.89 respectively. The poor quality of service of
the guests‟ room was justified by the number of comments written by the guests
regarding the service provision in the guests‟ room. Guests complained on the quality of
fixtures, most of the furniture was worn and needed attention. In addition, some of the
guests complained that rooms had no mirror which is an indication that hotel room had
no enough sufficient fixtures also room maintenance was critical. This comment
provides clear clarification:
“The air conditioner malfunctioned; the room was very humid at night,
unable to fix until next morning according to front desk”………………….
Guest respondent
Furthermore, guests indicated that the door locks were not functioning. This created the
feeling of unsecure to guests. Looking at the Service Quality mode, aspect of security is
clearly cited as a main component in achieving service quality. Parasuman et al., (1988)
described that customer assurance contribute to service quality that customer is

53
receiving from an organization. This scenario showed that the researched hotels could
not provide assurance to their guest, hence failing to achieve the service quality.
The findings of this study provide a clear picture that service quality requires maximum
co-operation and coordination in the hotel. Quality and insufficient of fixtures in the
guestroom was vivid example of gap two in the SERV-QUAL model; whereby there is
variation in translating guests‟ expectation into specification of service quality. This is
due to insufficient resources to lock in guest specifications and requirement to service
quality conformance standard; or management mindset that it is impossible to meet
guest needs (Tsang and Qu, 2000).
Failing to repair door locks could be result of information not delivered to maintenance
department, hence communication breakdown between department and department. This
type of gap referred to service quality conformance standard gap Kandampully (2007).
4.5 Skills Possessed by Service Employees working in the Researched Hotels
Results in this section are presented and discussed under the employees‟, age,
professional qualification and professional experience and skill gap of the employee.
Though age cannot be categorized as a skill, it has effects on other aspects especially
when considering the length of industrial experience of the service employees.
4.5.1 Age of the Employees
The age of the employees was established in the researched hotels with the aim of
knowing the age structure of the employees in the industry. Establishing the age

54
structure assist in designing the retention scheme of the employees. Data on age
structures were collected and presented in Figure 4.1
3.3
40.238.5
13.1
4.10.8
0
5
10
15
20
25
30
35
40
45
19 and
below
20 - 29
years
30-39
years
40 - 49
years
50 - 59
years
60 and
above
Per
centa
ge
of
Age
Dis
trib
uti
on
Age group
Figure 4.1: Employees‟ Age Distribution
The results presented in figure 4.1, provides the clear structure of the employees‟ age. It
shows that more than 40% of the employees are of age between 20 – 29 years. Though,
it is widely accepted that hospitality sector is the industry of young generation as it
needs energetic and enthusiastic people. It is also wise for hotel stakeholders to reason
why there is sharp decrease of employees with age between 40 and 49. The peoples‟
thought is that, matured employees would have experience and able to deliver good
service quality. The quick judgment is that, this group leaves hotel career and join other
related industry. This brings negative impact to hotel as it will not achieve to end labour
shortage.
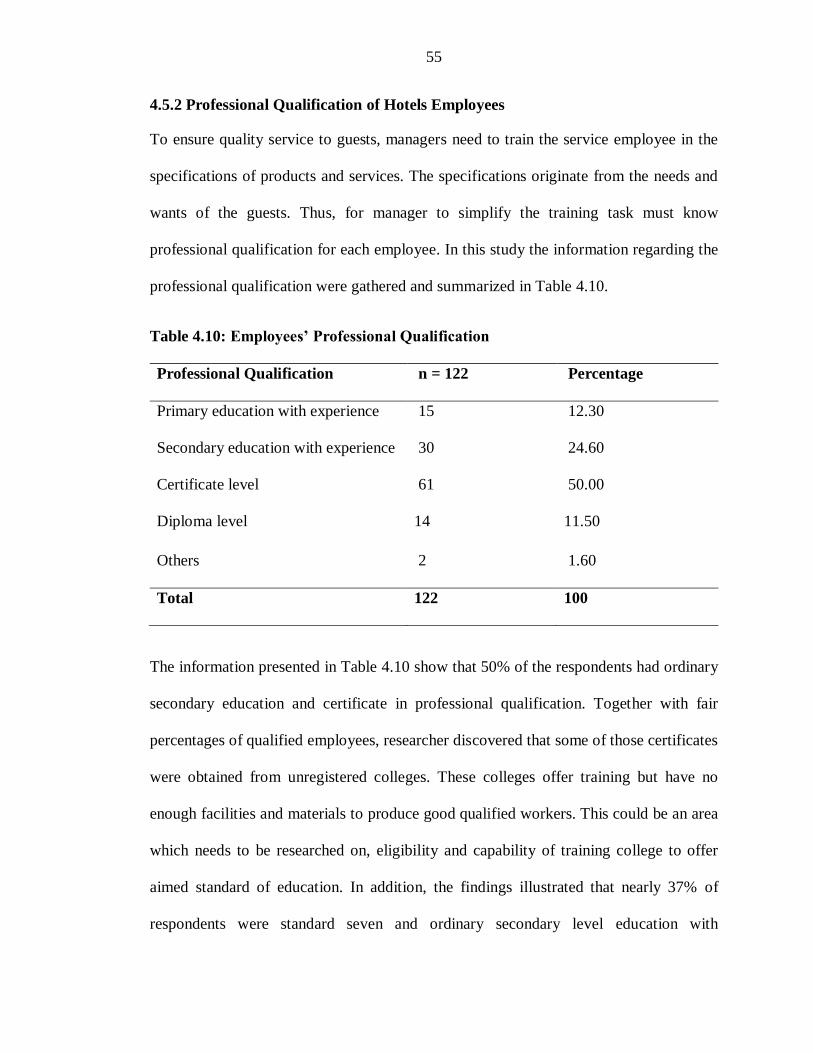
55
4.5.2 Professional Qualification of Hotels Employees
To ensure quality service to guests, managers need to train the service employee in the
specifications of products and services. The specifications originate from the needs and
wants of the guests. Thus, for manager to simplify the training task must know
professional qualification for each employee. In this study the information regarding the
professional qualification were gathered and summarized in Table 4.10.
Table 4.10: Employees’ Professional Qualification
Professional Qualification n = 122 Percentage
Primary education with experience 15 12.30
Secondary education with experience 30 24.60
Certificate level 61 50.00
Diploma level 14 11.50
Others 2 1.60
Total 122 100
The information presented in Table 4.10 show that 50% of the respondents had ordinary
secondary education and certificate in professional qualification. Together with fair
percentages of qualified employees, researcher discovered that some of those certificates
were obtained from unregistered colleges. These colleges offer training but have no
enough facilities and materials to produce good qualified workers. This could be an area
which needs to be researched on, eligibility and capability of training college to offer
aimed standard of education. In addition, the findings illustrated that nearly 37% of
respondents were standard seven and ordinary secondary level education with
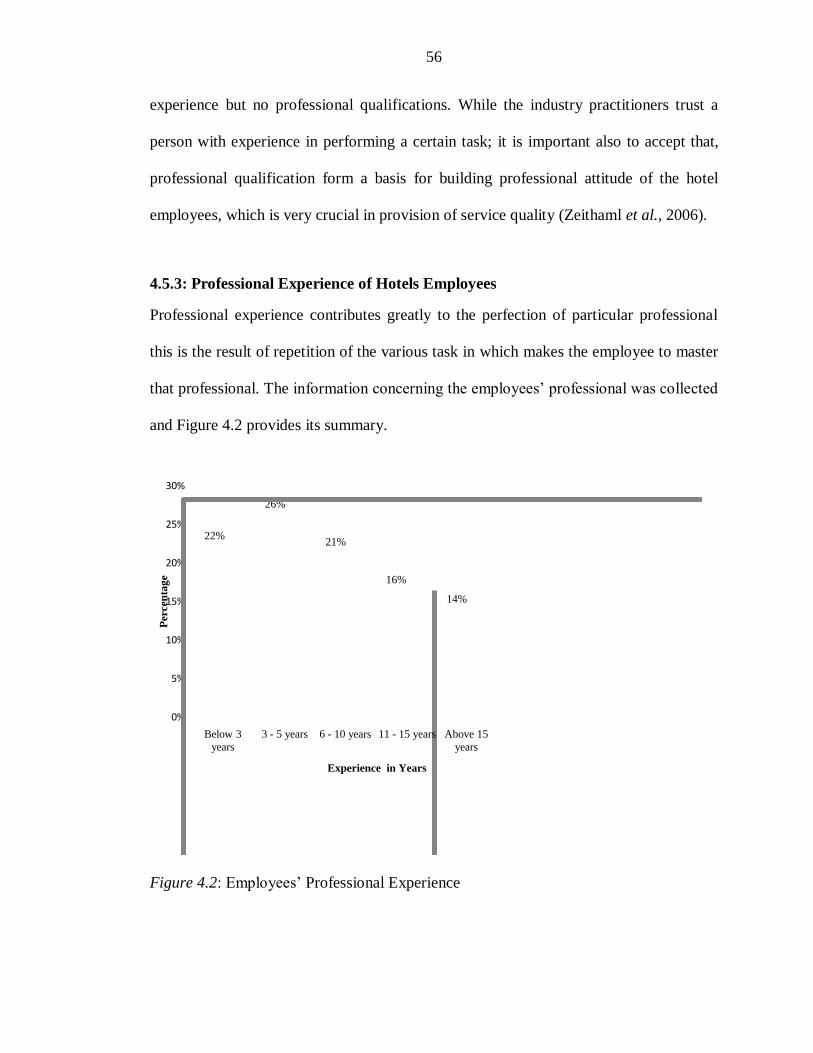
56
experience but no professional qualifications. While the industry practitioners trust a
person with experience in performing a certain task; it is important also to accept that,
professional qualification form a basis for building professional attitude of the hotel
employees, which is very crucial in provision of service quality (Zeithaml et al., 2006).
4.5.3: Professional Experience of Hotels Employees
Professional experience contributes greatly to the perfection of particular professional
this is the result of repetition of the various task in which makes the employee to master
that professional. The information concerning the employees‟ professional was collected
and Figure 4.2 provides its summary.
22%
26%
21%
16%
14%
0%
5%
10%
15%
20%
25%
30%
Below 3
years
3 - 5 years 6 - 10 years 11 - 15 years Above 15
years
Per
cen
tag
e
Experience in Years
Figure 4.2: Employees‟ Professional Experience
57
The findings provided a picture of the employees‟ professional experience of the hotel
industry in the researched area. More than 26% had experience between three and five
years. Trends showed that, as the experience grow, the number of employees with long
experience drops. This can be observed in the Figure 4.2, employees with experience
above 15 years were nearly 14%. The trends bring questions, why the number of
employees drops after the 5th year of the professional experience? Where do they go?
Despite the fact that this study did not focus on answering the above questions,
researcher deduced that after the 5th year of experience most of the people joined the
hotel industry become aware of the nature of the work. They further decide to leave and
join other industry which required the same or related discipline.
4.5.4: Employees’ Skills Gap in the Researched Hotels
The research conceptual framework indicated that the service quality is attained when
service employees proportionally combine three skills; interpersonal, aesthetics, and
technical in delivery of service quality to the guest. In this study scale 1 to 3 were used
to in rating skills which require more training .whereby 1 was less training, 2 neutral and
3 extensive training. To understand the skills gap in the hotel industry the researcher
requested the managers to indicate, the type of skill which lacks and hence need more
training and the findings are shown in Table 4.11.
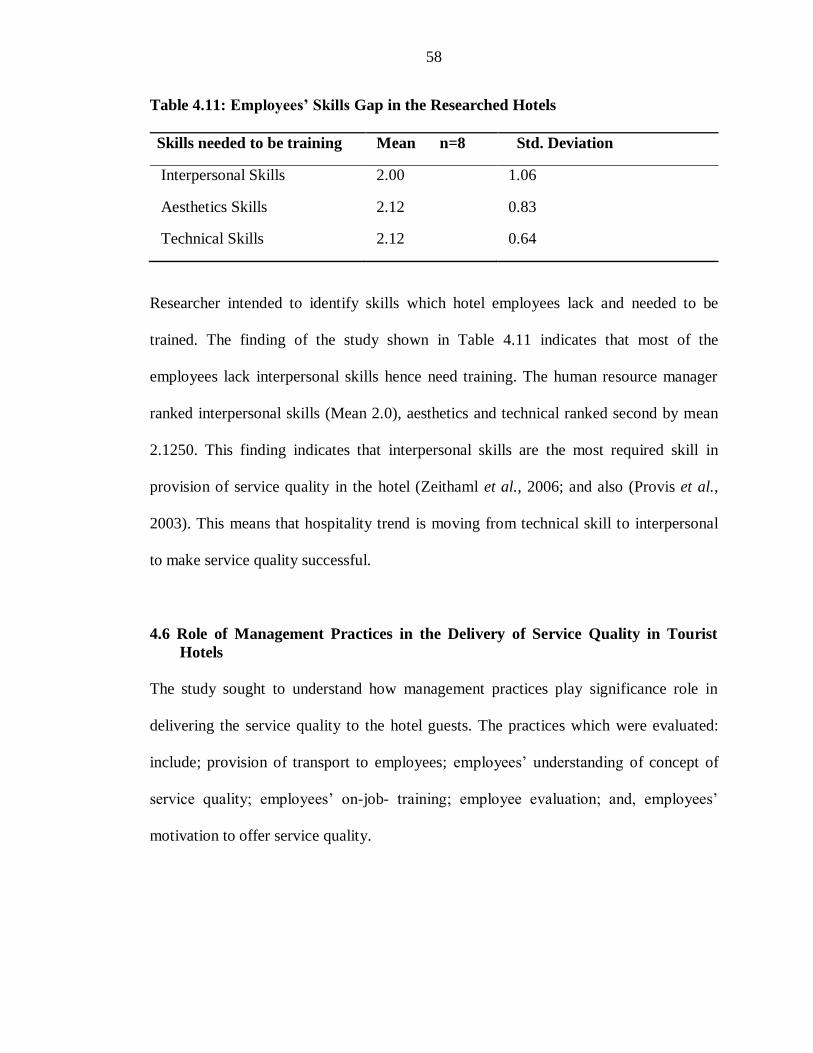
58
Table 4.11: Employees’ Skills Gap in the Researched Hotels
Skills needed to be training Mean n=8 Std. Deviation
Interpersonal Skills 2.00 1.06
Aesthetics Skills 2.12 0.83
Technical Skills 2.12 0.64
Researcher intended to identify skills which hotel employees lack and needed to be
trained. The finding of the study shown in Table 4.11 indicates that most of the
employees lack interpersonal skills hence need training. The human resource manager
ranked interpersonal skills (Mean 2.0), aesthetics and technical ranked second by mean
2.1250. This finding indicates that interpersonal skills are the most required skill in
provision of service quality in the hotel (Zeithaml et al., 2006; and also (Provis et al.,
2003). This means that hospitality trend is moving from technical skill to interpersonal
to make service quality successful.
4.6 Role of Management Practices in the Delivery of Service Quality in Tourist
Hotels
The study sought to understand how management practices play significance role in
delivering the service quality to the hotel guests. The practices which were evaluated:
include; provision of transport to employees; employees‟ understanding of concept of
service quality; employees‟ on-job- training; employee evaluation; and, employees‟
motivation to offer service quality.
59
4.6.1 Provision of Transport to Service Employees
The Employee transport is an integral aspect in ensuring the provision of service quality.
Company transport guarantees employees to report to work station on time and to get
enough time to do mis-en-place for the service. Company transport assures the
employees the likelihood of arriving home safe.
Decent transport for employees to and from the working station gives service staff
feeling of belonging and perceives the management that is treating them fairly; such
fairness feeling is likely to be reciprocated to the hotels guest. In this study employees
were asked to respond whether the management provides them with transport from and
to the working stations or not. The findings indicated that more than half of the
employees (53.3%) do not get transport to and from working station while just seven
percent said sometimes are provided. Yet, the mean distance from the employee
residence to the working station was nearly eight kilometers. This finding implies that
there was no management commitment to provide the transport to employees. This kind
of scenario could have impact on the service quality. Bowen and Johnson (1999)
commented that treating employees fairly would have positive gain to the organization.
The reason for this is fairness reciprocated to the hotel guests.
4.6.2 Understanding of Employees on Service Quality Concept
The intention behind to know whether the employees understand the service quality
concept derived from the fact that if the employees are trained and understand the
concept then it should not be difficult for them to deliver it. Secondly, employees
understanding of service quality concept would deliver service to the desired level.

60
Thus, in this study employees were asked to indicate whether understand the concept of
service quality. The finding indicated that nearly all the respondents (95%) said that they
understand what service quality is all about; few responded that they do not understand
the service quality. Kandampully, (2007) indicated that employees understanding of
service quality fill the gap between them and the Management.
4.6.3: On Job Training for Service Employees
On-Job-Training and service quality cannot be separated; several arguments have put
forward to enhance the service quality in the hospitality industry by training. Training
touches every corner of service quality provision. On–Job-Training impact skill(s) that
employee may lack in performing his/her tasks. On-Job–Training enhances creativity
and adds value to the service quality. Training plays a major role in correcting mistakes
which occur on the course delivering the service to the guest. Management need to know
that the aspect of training is managerial practices which need to be exercise daily. In this
study manager were asked how often they conduct in house training for their service
employees and results indicated in Figure 4.3

61
16.7
11.7
20.8
37.5
8.3
0.8
4.2
0
5
10
15
20
25
30
35
40
Within
past three
months
Six months
ago
One year
ago
None Two years
ago
3 years ago More than
three years
ago
Per
cen
atges
Interval for Employee on -Job- Training
Figure 4.3: Responses on the Service Employee On –Job Training
The result indicates that slightly more than half of the respondents (50.8%) had no
training or they had training in the past two years. Training ensure that service
specifications are imparted to service employees hence improve service quality (Slatten,
2009). This finding is the evidence that managers do not pay critical attention on the On-
Job- Training.
4.6.4 Performance Appraisal of Service Employees
Employees‟ performance appraisal plays crucial roles to organization in meeting service
quality. Empowerment of the employees starts with knowing the ability and capability
of each employee. This helps to understand what ability employee has in performing
certain task. Allocation of task correctly makes employee to perform it perfectly and
create feeling of thrust between manager and employee hence empowerment. This study
sought to establish frequency of appraising the service staff in the researched hotel and
the finding presented on Table 4.12.
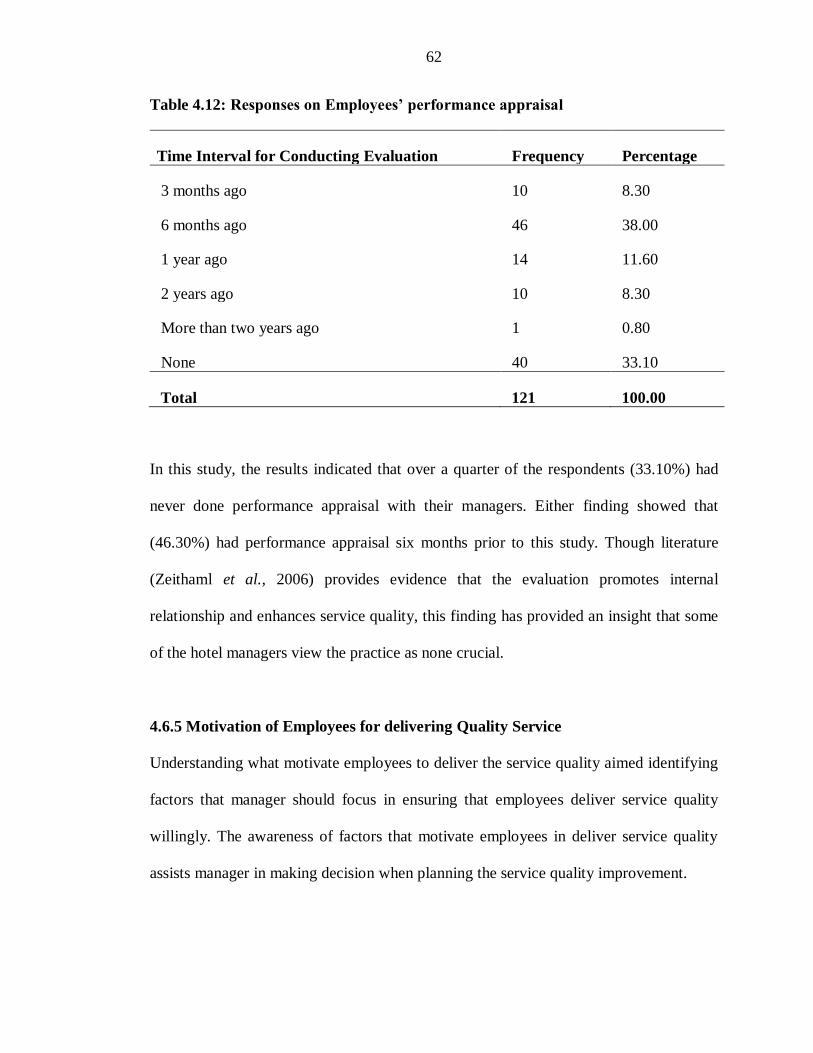
62
Table 4.12: Responses on Employees’ performance appraisal
Time Interval for Conducting Evaluation Frequency Percentage
3 months ago 10 8.30
6 months ago 46 38.00
1 year ago 14 11.60
2 years ago 10 8.30
More than two years ago 1 0.80
None 40 33.10
Total 121 100.00
In this study, the results indicated that over a quarter of the respondents (33.10%) had
never done performance appraisal with their managers. Either finding showed that
(46.30%) had performance appraisal six months prior to this study. Though literature
(Zeithaml et al., 2006) provides evidence that the evaluation promotes internal
relationship and enhances service quality, this finding has provided an insight that some
of the hotel managers view the practice as none crucial.
4.6.5 Motivation of Employees for delivering Quality Service
Understanding what motivate employees to deliver the service quality aimed identifying
factors that manager should focus in ensuring that employees deliver service quality
willingly. The awareness of factors that motivate employees in deliver service quality
assists manager in making decision when planning the service quality improvement.
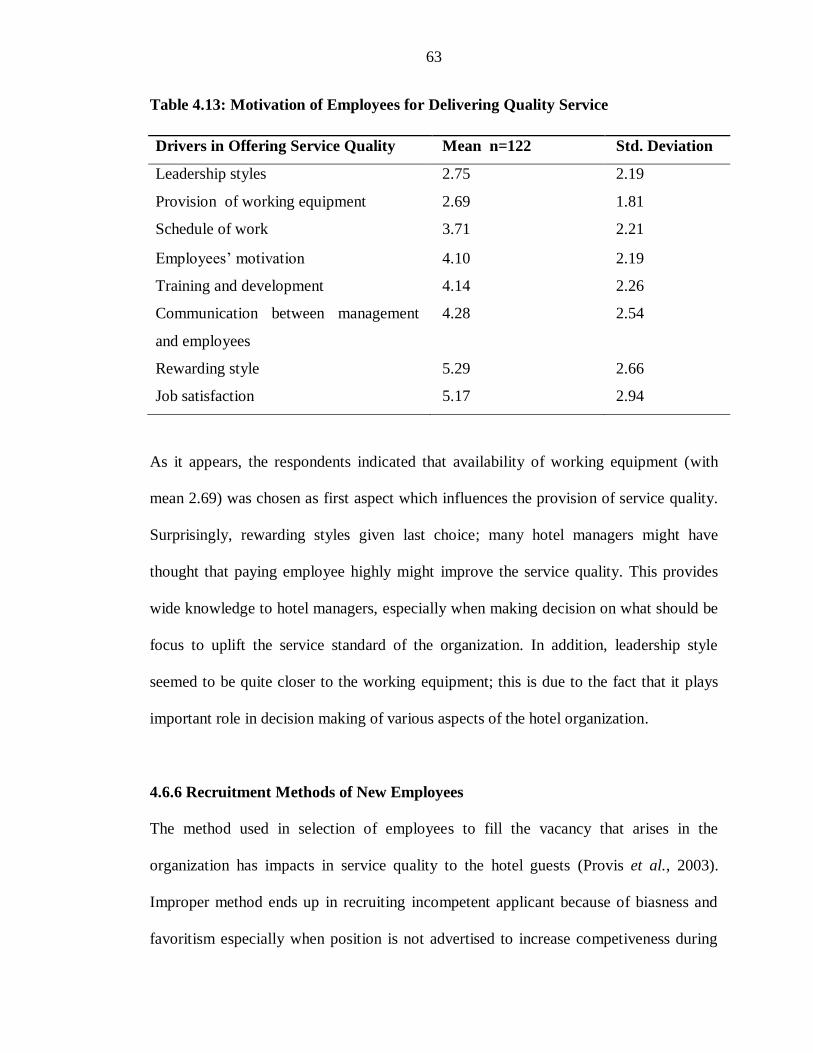
63
Table 4.13: Motivation of Employees for Delivering Quality Service
As it appears, the respondents indicated that availability of working equipment (with
mean 2.69) was chosen as first aspect which influences the provision of service quality.
Surprisingly, rewarding styles given last choice; many hotel managers might have
thought that paying employee highly might improve the service quality. This provides
wide knowledge to hotel managers, especially when making decision on what should be
focus to uplift the service standard of the organization. In addition, leadership style
seemed to be quite closer to the working equipment; this is due to the fact that it plays
important role in decision making of various aspects of the hotel organization.
4.6.6 Recruitment Methods of New Employees
The method used in selection of employees to fill the vacancy that arises in the
organization has impacts in service quality to the hotel guests (Provis et al., 2003).
Improper method ends up in recruiting incompetent applicant because of biasness and
favoritism especially when position is not advertised to increase competiveness during
Drivers in Offering Service Quality Mean n=122 Std. Deviation
Leadership styles 2.75 2.19
Provision of working equipment 2.69 1.81
Schedule of work 3.71 2.21
Employees‟ motivation 4.10 2.19
Training and development 4.14 2.26
Communication between management
and employees
4.28 2.54
Rewarding style 5.29 2.66
Job satisfaction 5.17 2.94
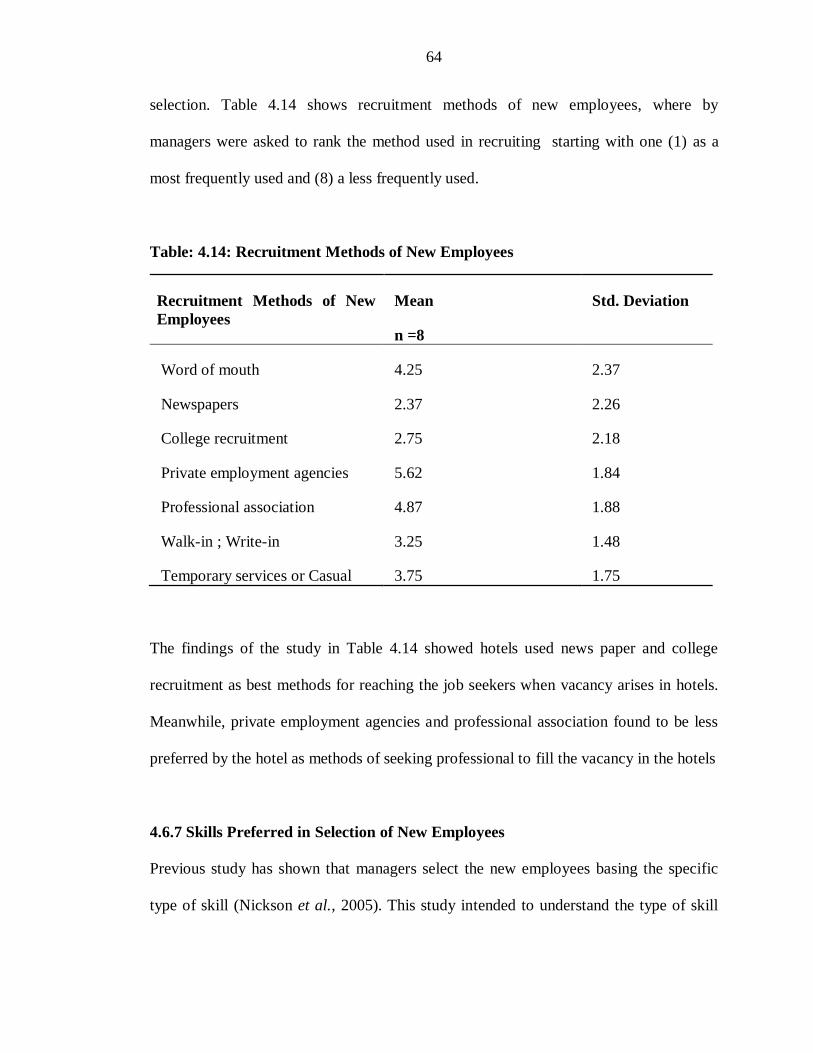
64
selection. Table 4.14 shows recruitment methods of new employees, where by
managers were asked to rank the method used in recruiting starting with one (1) as a
most frequently used and (8) a less frequently used.
Table: 4.14: Recruitment Methods of New Employees
Recruitment Methods of New
Employees
Mean
n =8
Std. Deviation
Word of mouth 4.25 2.37
Newspapers 2.37 2.26
College recruitment 2.75 2.18
Private employment agencies 5.62 1.84
Professional association 4.87 1.88
Walk-in ; Write-in 3.25 1.48
Temporary services or Casual 3.75 1.75
The findings of the study in Table 4.14 showed hotels used news paper and college
recruitment as best methods for reaching the job seekers when vacancy arises in hotels.
Meanwhile, private employment agencies and professional association found to be less
preferred by the hotel as methods of seeking professional to fill the vacancy in the hotels
4.6.7 Skills Preferred in Selection of New Employees
Previous study has shown that managers select the new employees basing the specific
type of skill (Nickson et al., 2005). This study intended to understand the type of skill

65
which is used as criterion for selecting the employees in the researched hotels, Table
4.15 presents that finding.
Table 4.15: Skills Preferred in Selection of New Employees
Skills Preferred in Selection of
New Employees
Mean
n =8
Std. Deviation
Interpersonal skills 1.00 0.00
Aesthetics Skills 2.75 0.46
Technical Skills 2.00 0.53
Table 4.15.explains the results of the study on type of skills used in selecting the
employees. Interpersonal skills were found to be the most favoured by human resource
manager in the selection of employees. The findings confirm what were revealed by
Nickson et al. (2005), that industry has been moving towards interpersonal skills than
technical and aesthetics skills. Conversely, an aesthetics skill was less important in the
selection of employees. This is different to previous study which indicates that looking
good and or sounding good is more preferred; as it creates peculiar image to the
company and is tool for competing in the market place. Hence, managers use it as the
criteria in the selection of employees (Nickson et al., 2005).
4.6.8 Aspects Considered in Short Listing of Job Applicants
The study required to understand aspects manager considered in short listing of job
applicants. This would shed light on what quality an applicant supposed to have so can
be shortlisted; the findings are presented on Table 4.16
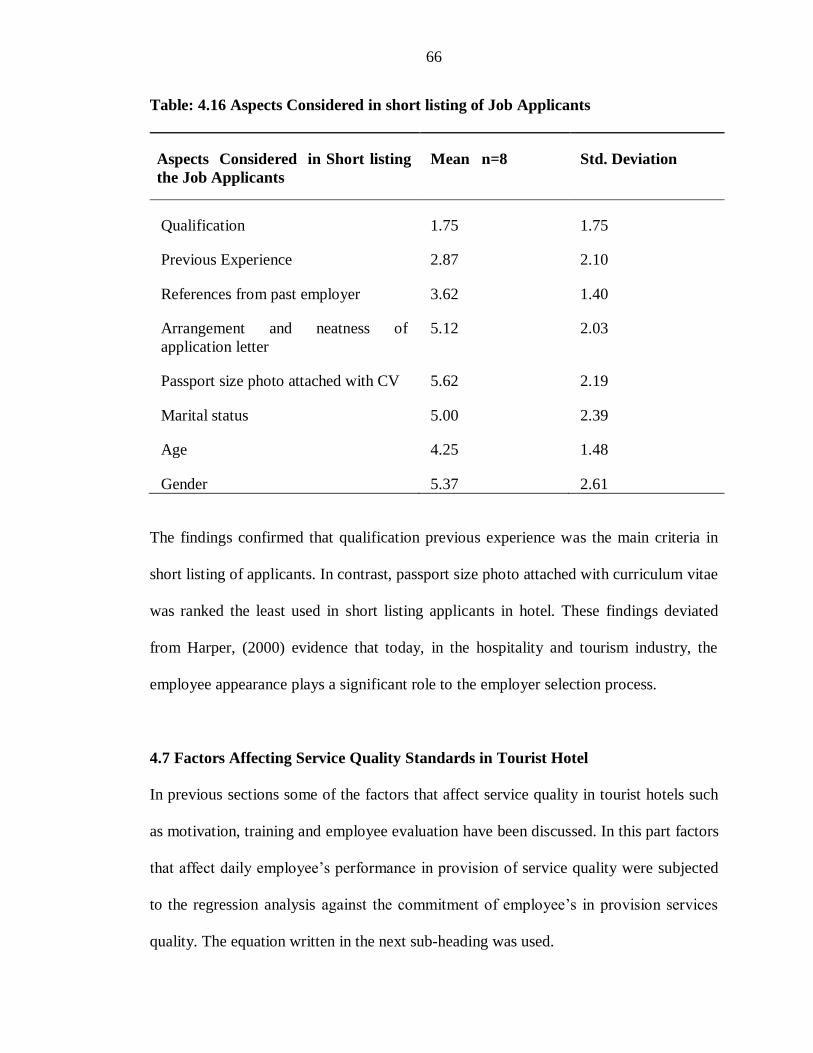
66
Table: 4.16 Aspects Considered in short listing of Job Applicants
Aspects Considered in Short listing
the Job Applicants
Mean n=8 Std. Deviation
Qualification 1.75 1.75
Previous Experience 2.87 2.10
References from past employer 3.62 1.40
Arrangement and neatness of
application letter
5.12 2.03
Passport size photo attached with CV 5.62 2.19
Marital status 5.00 2.39
Age 4.25 1.48
Gender 5.37 2.61
The findings confirmed that qualification previous experience was the main criteria in
short listing of applicants. In contrast, passport size photo attached with curriculum vitae
was ranked the least used in short listing applicants in hotel. These findings deviated
from Harper, (2000) evidence that today, in the hospitality and tourism industry, the
employee appearance plays a significant role to the employer selection process.
4.7 Factors Affecting Service Quality Standards in Tourist Hotel
In previous sections some of the factors that affect service quality in tourist hotels such
as motivation, training and employee evaluation have been discussed. In this part factors
that affect daily employee‟s performance in provision of service quality were subjected
to the regression analysis against the commitment of employee‟s in provision services
quality. The equation written in the next sub-heading was used.
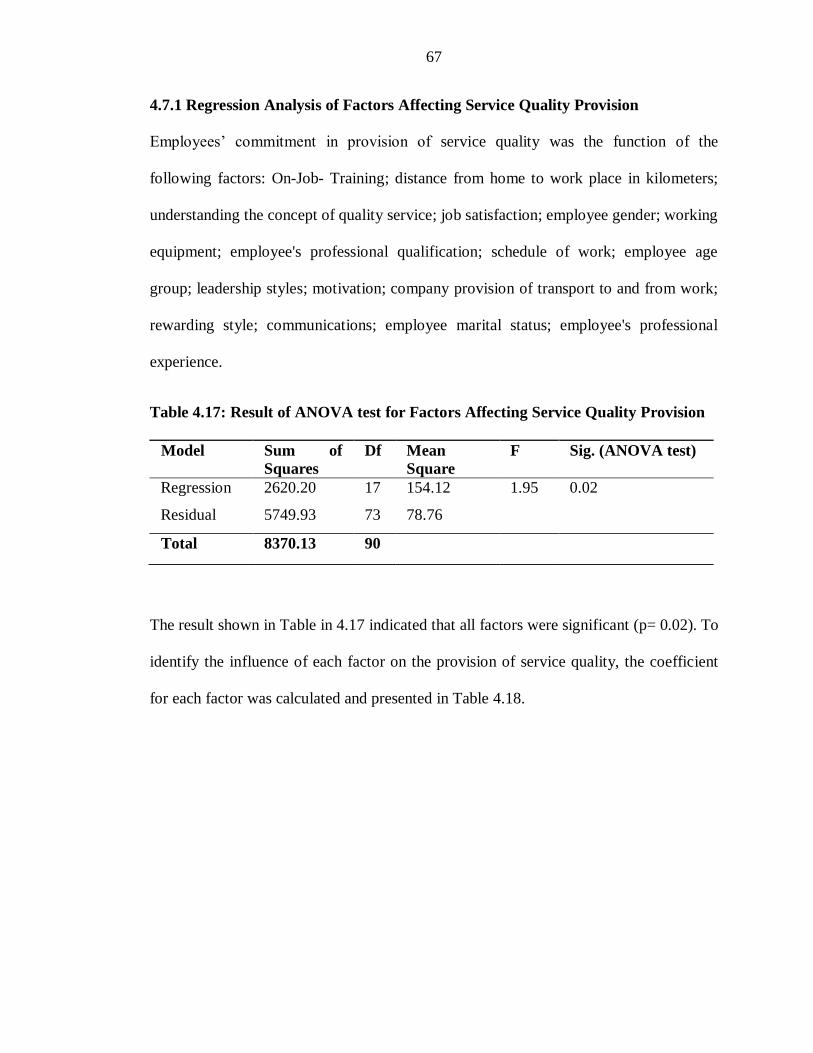
67
4.7.1 Regression Analysis of Factors Affecting Service Quality Provision
Employees‟ commitment in provision of service quality was the function of the
following factors: On-Job- Training; distance from home to work place in kilometers;
understanding the concept of quality service; job satisfaction; employee gender; working
equipment; employee's professional qualification; schedule of work; employee age
group; leadership styles; motivation; company provision of transport to and from work;
rewarding style; communications; employee marital status; employee's professional
experience.
Table 4.17: Result of ANOVA test for Factors Affecting Service Quality Provision
The result shown in Table in 4.17 indicated that all factors were significant (p= 0.02). To
identify the influence of each factor on the provision of service quality, the coefficient
for each factor was calculated and presented in Table 4.18.
Model Sum of
Squares
Df Mean
Square
F Sig. (ANOVA test)
Regression 2620.20 17 154.12 1.95 0.02
Residual 5749.93 73 78.76
Total 8370.13 90

68
Table 4.18: Factors Affecting the Provision of Service Quality
Table 4.18 shows the calculated coefficient for each factor. The findings implied that,
communication to all level was significant at p = 0.03 while employee professional
qualification and On –Job – Training were significant at p = 0.04.
Factors Affecting Service Quality Statistical
Significance
(ANOVA)
Leadership styles 0.58
Working equipment 0.91
Schedule of work 0.17
Motivation 0.81
Training and Development 0.78
Communication at all level 0.03
Rewarding style 0.35
Job satisfaction 0.08
Distance from home to work place in kilometers 0.09
Provision of company transport to and from work 0.08
Employee age group 0.72
Employee gender 0.54
Employee marital status 0.98
Employee's Professional Qualification 0.04
Employee's professional experience 0.60
Employees‟ understanding the concept of quality service 0.35
On Job training of employee 0.04
69
Basing on the above results, it is evident that communication has impacts on the service
quality delivery in the researched area. This could be the reason to why room
maintenance was poor in guest evaluation of service quality because there was no good
flow of information from one level to another. The impact of communication on the
service quality delivery has attracted attention to other researchers who have done
research in the same field. Hartog and Verburg (2002) indicated that communication
with emphasize in the norms and values is related to service quality in an organization.
On – job- training impact skill(s) that employees may lack in performing their tasks. On-
Job – training enhances creativity and adds value to the service quality. This could
possibly be one of the causes which contributed to poor scoring of creativity service
techniques and styles in restaurant and bar (Table 4.8) Slatten (2009) and Babakus et al.
2003 commented strongly on the training as a managerial practice that linked to
improvement of service quality and service recovery.
Employee Professional qualification measured the extent to which the service employees
are competent in performing their tasks. In this study, professional qualification of the
employees had great influence on the service quality. Table 4.9 indicated more than one
third of all service employees had no professional qualification. Hotel managers believe
that employee can be trained in house and become competent in performing
task(s).However, interpersonal skill is very important in service delivery, cannot be
impart to employee by just an experience (Caravan, 1997; Teare, 1996).
70
Therefore, communication to all levels employee professional qualification and On –Job
– Training were the factors which affects the service quality standards in tourist hotels in
Arusha Tanzania
4.8 Hypotheses Testing
In this study two hypotheses were stated; the first hypothesis focused on the gap
between guests and managers, second hypothesis focused on influence of management
practice on service quality delivery. Both hypotheses were statistically tested and results
discussed in sections 4.8.1.and 4.8.2.
4.8.1 Perception Gaps between Managers and Guest on Service Quality Standards
To achieve service quality in the hotel, the perceptions of manager and guest need to
match. When difference between two exists service quality gap occur. Service quality
gap happen for different reasons as discussed in the literature review. In this research,
service quality gap assessed by subtracting the means perceptions of the manager and
that of guest in all area of the hotel. The gap from each attributes added to get total gap
in specific area. The gaps for specific areas were added and general gap was obtained.

71
4.8.1.1 Perception Gap between Guests’ and Managers’ on the General Hotel
Product Service Quality Standards
The study was designed to assess the personal experience of the guest on general
product service quality versus the perception of the hotel managers. This aimed at
identifying the attributes which managers and guests‟ perception diverge so as to make
recommendation for improvement .The findings area shown on Tables 4.19.
Table 4.19: The Gap between Guests’ and Managers’ Perception on the General
Hotel Product Service Quality Standards
The findings showed that the negative gap on location, accessibility and visibility of the
hotel and; hotel design and presentation by (-0.67 and -0.62 respectively. These figures
indicated that guests perceived the service quality as satisfying. Contrary, managers
Attributes of the Area Guests (n =100) Manager (n = 10 ) Gap
Mean Std
Deviation
Mean Std
Deviation
Hotel design presentation 4.08 0.87 4.70 0.67 -0.62
Location, accessibility and
visibility
4.13 1.12 4.80 0.42 -0.67
Parking space 4.82 2.23 4.40 0.69 0.42
Environment and Landscaping 4.22 1.16 4.50 0.70 -0.28
Health, fitness center and
massage parlor
4.80 2.51 3.20 1.50 1.60
In house security and
assurance
4.28 1.38 4.50 0.84 -0.25
Availability of business center 4.66 2.16 4.50 0.52 0.16
Mean of Mean (Overall
Perception)
4.42 4.37 0.05

72
ranked these attributes as very important in designing service quality but guests
perceived it satisfactory; which can be translated that, managers‟ effort was not
recognized by guests. The assessed area is basically the tangible product and the gap
existed could be due to poor market information leading to the managers failing to
understand guests requirements (Tsang and Qu, 2000). Comments from the
questionnaires provided the evidence as one of the guests commented that the hotel they
stayed was far from the airport.
Conversely, not all aspects had negative perception gaps, some had positive gap. In this
research the results narrated that the managers put much effort on health, fitness and
massage parlor. This has been seen in gap between health, fitness center and massage
parlor guests‟ and managers‟ perception difference by 1.6. The positive gap observed
was due to the managers thought that the aspect is very important in delivering of
service quality while guests perceived what was available was beyond their expectations
4.8.1.2 The Gap between the Guests and Managers Perception on Service Quality
Standards in the Front Office
The disparity between the guests and managers perceptions obtained by establishing the
gap in each attribute. The gap provides the overall picture of the service quality in that
area of the hotel. Results of this study are summarized in Table 4.20 then discussed in
detail.
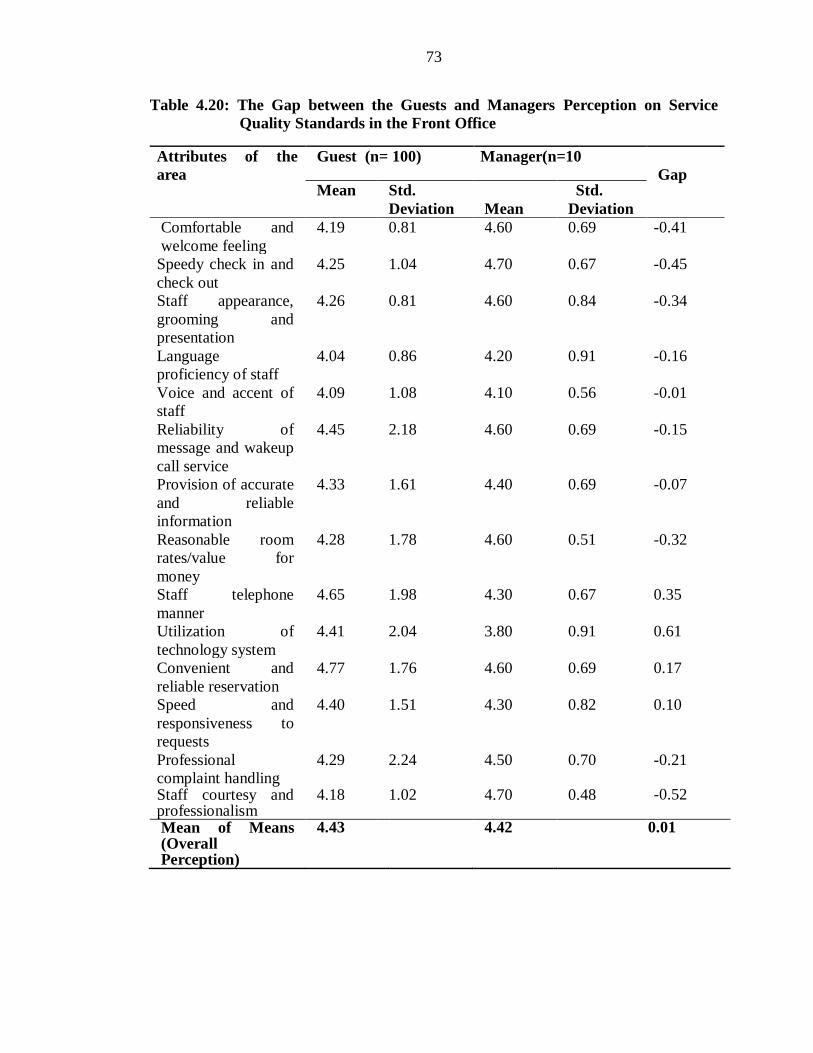
73
Table 4.20: The Gap between the Guests and Managers Perception on Service
Quality Standards in the Front Office
Attributes of the
area
Guest (n= 100) Manager(n=10
Gap Mean Std.
Deviation
Mean
Std.
Deviation
Comfortable and
welcome feeling
4.19 0.81 4.60 0.69 -0.41
Speedy check in and
check out
4.25 1.04 4.70 0.67 -0.45
Staff appearance,
grooming and
presentation
4.26 0.81 4.60 0.84 -0.34
Language
proficiency of staff
4.04 0.86 4.20 0.91 -0.16
Voice and accent of
staff
4.09 1.08 4.10 0.56 -0.01
Reliability of
message and wakeup
call service
4.45 2.18 4.60 0.69 -0.15
Provision of accurate
and reliable
information
4.33 1.61 4.40 0.69 -0.07
Reasonable room
rates/value for
money
4.28 1.78 4.60 0.51 -0.32
Staff telephone
manner
4.65 1.98 4.30 0.67 0.35
Utilization of
technology system
4.41 2.04 3.80 0.91 0.61
Convenient and
reliable reservation
4.77 1.76 4.60 0.69 0.17
Speed and
responsiveness to
requests
4.40 1.51 4.30 0.82 0.10
Professional
complaint handling
4.29 2.24 4.50 0.70 -0.21
Staff courtesy and professionalism
4.18 1.02 4.70 0.48 -0.52
Mean of Means (Overall Perception)
4.43 4.42 0.01
74
Table 4.20 describes the findings of the difference between the perceptions of guests and
managers in regards to front office service quality. The findings showed that staff
courtesy and professionalism had negative gap of -0.52, which indicate that guests
satisfactions was low as compared to managers understanding on the importance of the
aspects. This fact tells managers to train their employees in interpersonal skill to catch
up with guests‟ expectations. However, researchers have discovered that training in the
interpersonal skills such courtesy and professionalism is the most difficult issue to be
quantify (Teare, 1996).This reason might be the obstacles for the managers to achieve
the positive gap in the employees‟ courtesy and professionalism.
On the other hand, guests and managers perception had positive gap in utilization of
technology in the survey hotels. The difference of 0.6 was recorded, showing that
service quality was high in terms of technology utilization than managers understanding
of importance in technology utilization. But this should be taken with caution because
advancement in technology in hotel depends on country‟s development. A guest visiting
America or Japan would expect high level of technology utilization in hotel industry.
Hence, what guests found here in Tanzania, was satisfactory when considering the
Country‟s level of advancement in technology utilization.
4.8.1.3 The Gap between Guests and Managers Perception on the Restaurant and
Bar Service Quality Standards
After knowing the perception of service quality standards for the manager and guest
experience in each attribute of the restaurant and bar, their mean values were computed

75
to find out the difference in order to establish the gap between two. The study findings
are summarized on Table 4: 21
Table 4.21: The Gap between Guests and Managers Perception on the Restaurant
and Bar Service Quality Standards
Attributes of the Area Guest (n=Varied ) Manager ( n=10) Gap
Mean Std.
Deviation
Mean Std.
Deviation
Comfortable and
welcome feeling in
restaurant and bar
4.10 0.94
4.40
0.69
-0.26
Variety of dishes on
menu
3.88 0.87 4.80 0.42 -0.91
Quality, color, taste and
presentation of food
3.98 0.85 4.60 0.51 -0.61
Health and dietary
consideration
3.97 1.01 4.80 0.42 -0.82
Reasonable restaurant
and bar prices
3.94 1.08 4.50 0.52 -0.55
Variety of drinks and
wines
3.85 1.01 4.10 1.19 -0.24
Restaurant and bar
ambience, decor and
style
3.93 0.88 4.50 0.52 -0.56
Availability of staff to
provide service
3.98 0.89 4.50 0.70 -0.51
Staff appearance,
grooming presentations
4.02 0.83 4.40 0.69 -0.37
Language proficiency of
staff
3.90 0.90 4.20 1.03 -0.29
Voice and accent of staff 3.94 1.01 4.00 0.66 -0.05
Service attention,
courtesy and
professionalism
4.14 0.87 4.60 0.69 -0.45
Creativity in service
techniques and styles
3.70 0.91 4.40 0.69 -0.69
Billing and cashiering
procedures
3.83 1.03 4.60 0.69 -0.76
Mean of Means
(Overall perception)
3.94 4.45
0.50

76
Table 4.21 illustrates the finding of perception between guests and manager on the
restaurant and bar. The result indicated that variety of dishes on the menu had largest
negative gap of -0.91; which is clear sign that guest were not satisfied with managers‟
decision. This scenario could have risen because the information regarding guests‟ needs
and want were not interpreted in designing the food menus. This was clearly indicated in
the questionnaire as a special comment:
“…… Menu was not vegan friendly as lacks veggies varieties……’’
Guest Respondent
On the other hand, the negative gap could be as a result of market department of the
hotel failing to collect right information regarding the guests‟ needs and wants. The two
gaps which have noticed above are gap one and gap two in the SERVQUAL model
(Gržinic, 2007; Zeithaml et al. 2006; Tsang and Qu, 2000).
4.8.1.4: The Gap between Guests and Managers Perception on the Guestroom
Service Quality Standards
The best way of understanding the discrepancy between the manager‟s perception on
service quality standards and the experience guest received after consuming the service,
is to measure the gap. This is done through calculating the mean values difference. This
techniques was used in this study and findings are presented in Table 4.22

77
Table 4.22: The Gap between Guests and Managers Perception on the Guests room Service Quality Standards
Table 4.22 shows that staff courtesy and professionalism; room maintenance score
largest negative difference (-0.84 and -0.81) respectively. This denoted that managers
did not understand the guest‟s needs on attributes measured. Staff courtesy and
Attributes of the
Area
Guest (n=100) Managers (n= 10) Gap
Mean Std. Deviation
Mean Std.
Deviation
Room ambience,
quietness and décor
4.04 0.87 4.70 0.67 -0.66
Comfortness of
bedding and seating
4.01 0.87 4.60 0.69 -0.59
Cleanliness of rooms 4.15 0.82 4.50 0.70 -0.35
Availability of guest
room supplies
4.07 1.07 4.50 0.97 -0.42
Quality of fixtures 3.89 0.86 4.50 0.70 -0.60
Sufficient fixtures 3.89 0.85 4.50 0.70 -0.61
Room maintenance 3.89 0.97 4.70 0.67 -0.81
Room entertainment
(TV, Video and
Internet)
3.75 1.33 4.10 1.37 -0.34
Adequacy of fire
safety facilities
3.85 1.42 4.60 0.96 -0.74
Availability of room
services
3.85 0.92 4.40 0.51 -0.54
Staff appearances,
grooming and
presentation
4.01 1.04 4.70 0.48 -0.68
Staff courtesy and
professionalism
3.95 0.88 4.80 0.42 -0.84
Voice and accent of
staff
3.80 0.90 4.50 0.52 -0.69
Language proficiency
of employees
3.86 0.89 4.50 0.52 -0.63
Mean of means(
Overall Perceptions)
3.93 4.54 0.66
78
professionalism reflects lack of interpersonal skills to employees in service quality
delivery which necessitate the hotel manager to train their employees on interpersonal
skills.
The managers‟ understanding in design service quality in the guestroom maintenance
did not meet the guests‟ expectations. This situation arose in the hotel because
management was not committed to service quality in the room and also maintenance
employees could not translate the specification of room maintenance perfectly. The
scenario represent gaps two and three in the SERVQUAL model where by management
were reluctant to meets the needs of the service quality (Kandampully, 2007).
Conversely, the availability of room service score positive difference showing that
guests were satisfied with managers‟ effort to ensure service quality in the provision of
room service.
4.8.1.5 Total Gap between Guests and Managers Perception Service Quality
Standards in Assessed Areas
Table 4.23 presents the total gaps in all four areas of the hotel, general hotel product,
front office, restaurant and bar and guest room. The Mean value of the guests and
managers perceptions subtracted and the differences summed up to make the final
general gap on the service quality.
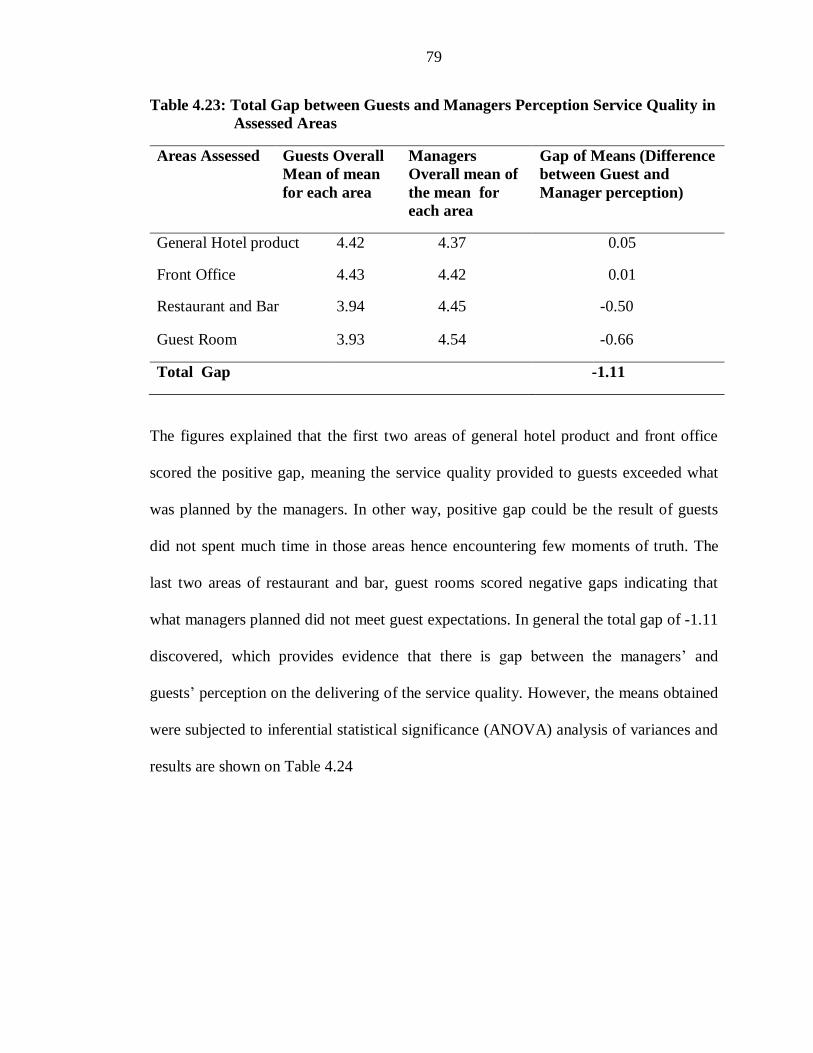
79
Table 4.23: Total Gap between Guests and Managers Perception Service Quality in
Assessed Areas
Areas Assessed Guests Overall
Mean of mean
for each area
Managers
Overall mean of
the mean for
each area
Gap of Means (Difference
between Guest and
Manager perception)
General Hotel product 4.42 4.37 0.05
Front Office 4.43 4.42 0.01
Restaurant and Bar 3.94 4.45 -0.50
Guest Room 3.93 4.54 -0.66
Total Gap -1.11
The figures explained that the first two areas of general hotel product and front office
scored the positive gap, meaning the service quality provided to guests exceeded what
was planned by the managers. In other way, positive gap could be the result of guests
did not spent much time in those areas hence encountering few moments of truth. The
last two areas of restaurant and bar, guest rooms scored negative gaps indicating that
what managers planned did not meet guest expectations. In general the total gap of -1.11
discovered, which provides evidence that there is gap between the managers‟ and
guests‟ perception on the delivering of the service quality. However, the means obtained
were subjected to inferential statistical significance (ANOVA) analysis of variances and
results are shown on Table 4.24
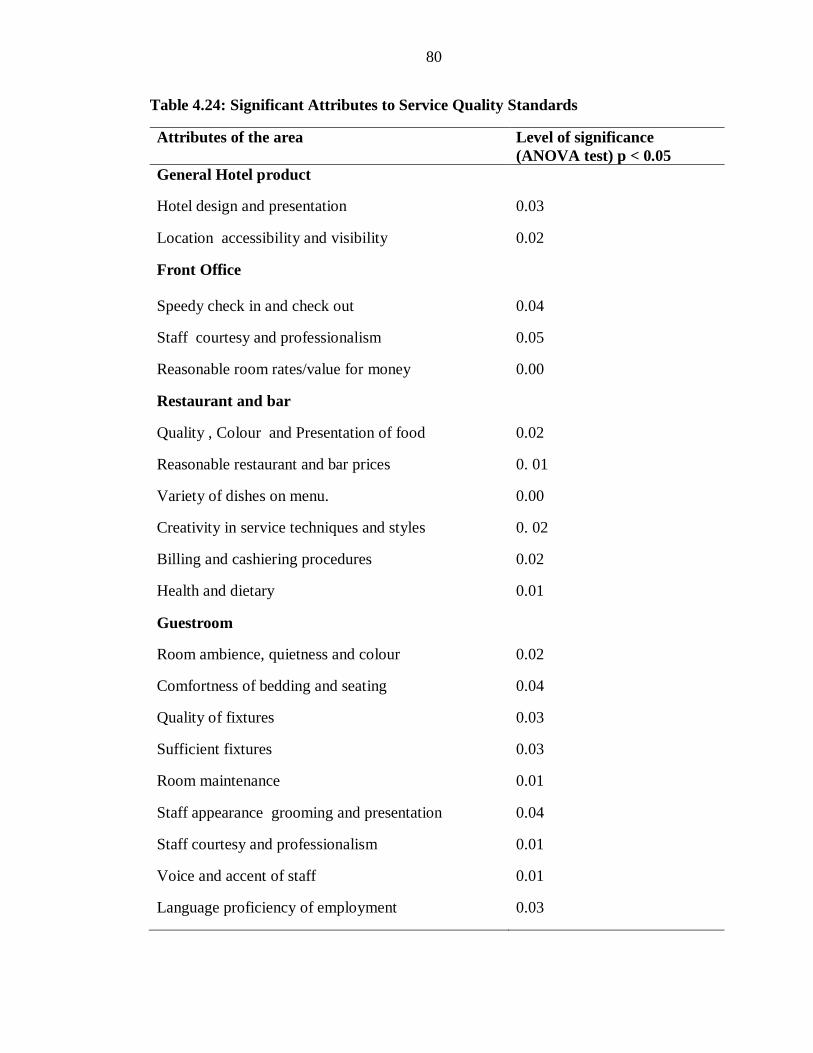
80
Table 4.24: Significant Attributes to Service Quality Standards
Attributes of the area Level of significance
(ANOVA test) p < 0.05
General Hotel product
Hotel design and presentation 0.03
Location accessibility and visibility 0.02
Front Office
Speedy check in and check out 0.04
Staff courtesy and professionalism 0.05
Reasonable room rates/value for money 0.00
Restaurant and bar
Quality , Colour and Presentation of food 0.02
Reasonable restaurant and bar prices 0. 01
Variety of dishes on menu. 0.00
Creativity in service techniques and styles 0. 02
Billing and cashiering procedures 0.02
Health and dietary 0.01
Guestroom
Room ambience, quietness and colour 0.02
Comfortness of bedding and seating 0.04
Quality of fixtures 0.03
Sufficient fixtures 0.03
Room maintenance 0.01
Staff appearance grooming and presentation 0.04
Staff courtesy and professionalism 0.01
Voice and accent of staff
Language proficiency of employment
0.01
0.03
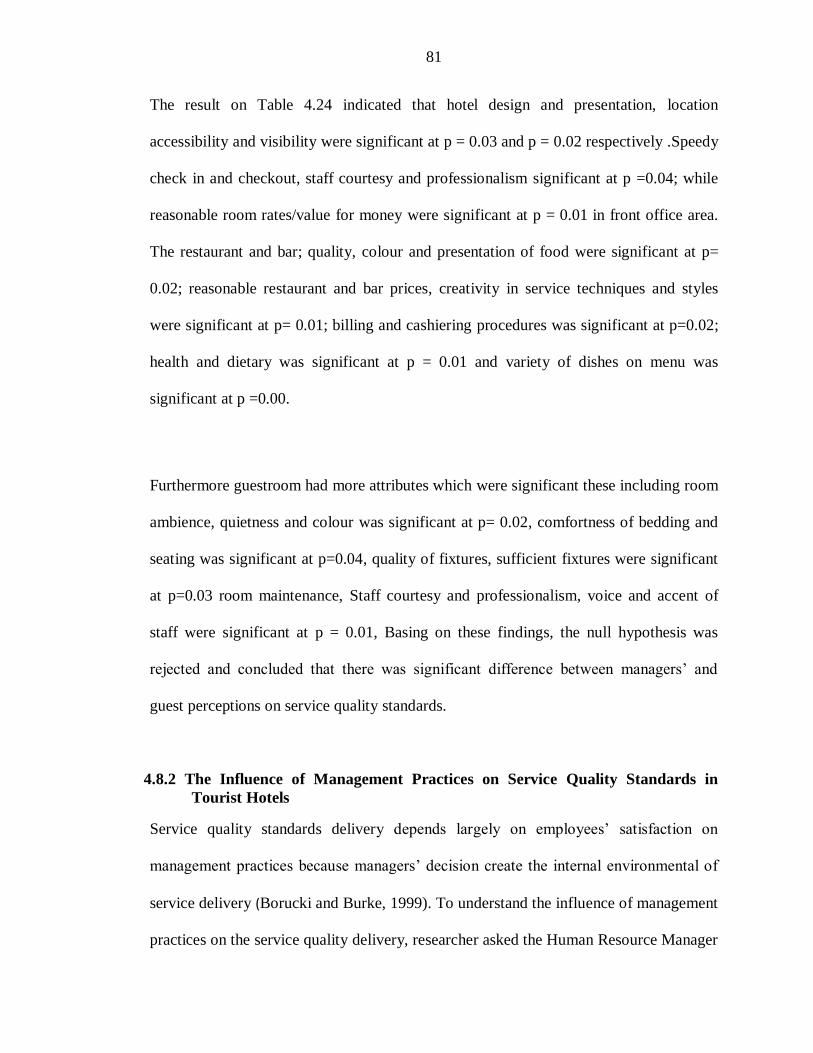
81
The result on Table 4.24 indicated that hotel design and presentation, location
accessibility and visibility were significant at p = 0.03 and p = 0.02 respectively .Speedy
check in and checkout, staff courtesy and professionalism significant at p =0.04; while
reasonable room rates/value for money were significant at p = 0.01 in front office area.
The restaurant and bar; quality, colour and presentation of food were significant at p=
0.02; reasonable restaurant and bar prices, creativity in service techniques and styles
were significant at p= 0.01; billing and cashiering procedures was significant at p=0.02;
health and dietary was significant at p = 0.01 and variety of dishes on menu was
significant at p =0.00.
Furthermore guestroom had more attributes which were significant these including room
ambience, quietness and colour was significant at p= 0.02, comfortness of bedding and
seating was significant at p=0.04, quality of fixtures, sufficient fixtures were significant
at p=0.03 room maintenance, Staff courtesy and professionalism, voice and accent of
staff were significant at p = 0.01, Basing on these findings, the null hypothesis was
rejected and concluded that there was significant difference between managers‟ and
guest perceptions on service quality standards.
4.8.2 The Influence of Management Practices on Service Quality Standards in
Tourist Hotels
Service quality standards delivery depends largely on employees‟ satisfaction on
management practices because managers‟ decision create the internal environmental of
service delivery (Borucki and Burke, 1999). To understand the influence of management
practices on the service quality delivery, researcher asked the Human Resource Manager

82
to indicate the extent to which they think employees were satisfied with management
practices. The same question was asked to employees to indicate the level of satisfaction
to management practices of hotel. The likert scale was used as an indicator to measure
both sides. The findings of study were analysed and computed for significance using
Independent t- test.
The study identified items which had significance influence on employees‟ service
quality delivery. This was done by analyzing the gaps of the management practices
mean scores by using independent t-test. The results showed nine management practices
out of eleven found significant. Leadership styles was significant at p = 0.04 motivation,
training and development, communication at all level significant at p = 0.01 and
rewarding style were significance at p= 0.02 while employment process, compensation
and employees‟ welfare were significance at p = 0.00

83
Table 4.25: Independent T- Test on Management Practices Satisfaction
Managers commented on the questionnaire that several methods were used to motivate
the employees, including provision of bonus and extra time allowance. But the findings
suggested that, the efforts were not enough to make employees feel appreciated. This
provides good illustrations to the hotel managers, as already indicated that well
compensated employees create a sense of ownership in the organization and encourage
employees‟ loyalty (Bowen and Johnston, 1999; Brown and Peterson, 1993).
The result confirms that, in all researched hotels, employees were not satisfied with
performance of the hotels management. This could be the reason for poor service
Management Practices Independent t-test Df Sig (2tailed)
Leadership style 2.02 126 0.04
Employment process 2.70 122 0.00
Motivation 2.43 127 0.01
Training and development 2.45 124 0.01
Communication at all levels 2.42 124 0.01
Empowerment to employees 0.89 126 0.37
Performance appraisal 1.63 120 0.10
Compensation 4.06 126 0.00
Rewarding styles 2.24 122 0.02
Commitment to service quality 1.41 123 0.15
Employee welfare 2.75 124 0.00

84
delivery in restaurant and bar, and guest room as shown in Tables 4.8 and 4.9
respectively. Hence, management practices significantly influence the service quality
standards in tourists‟ hotels; thus rejecting the stated hull hypothesis.
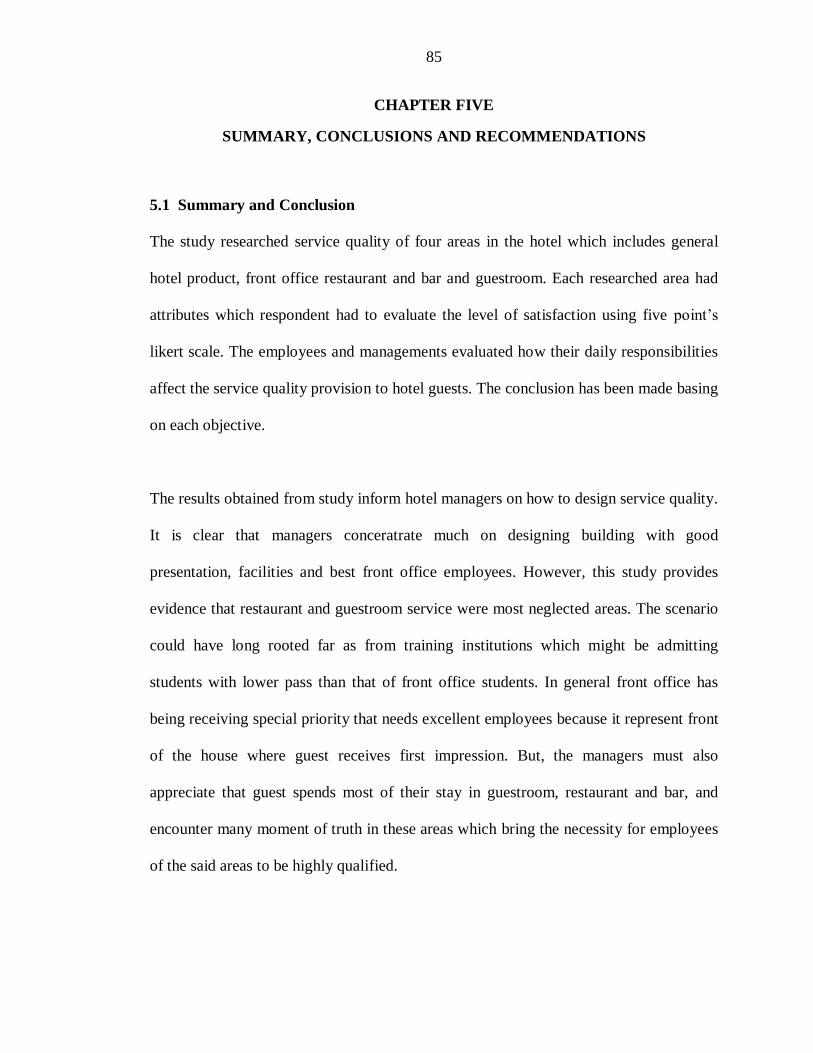
85
CHAPTER FIVE
SUMMARY, CONCLUSIONS AND RECOMMENDATIONS
5.1 Summary and Conclusion
The study researched service quality of four areas in the hotel which includes general
hotel product, front office restaurant and bar and guestroom. Each researched area had
attributes which respondent had to evaluate the level of satisfaction using five point‟s
likert scale. The employees and managements evaluated how their daily responsibilities
affect the service quality provision to hotel guests. The conclusion has been made basing
on each objective.
The results obtained from study inform hotel managers on how to design service quality.
It is clear that managers conceratrate much on designing building with good
presentation, facilities and best front office employees. However, this study provides
evidence that restaurant and guestroom service were most neglected areas. The scenario
could have long rooted far as from training institutions which might be admitting
students with lower pass than that of front office students. In general front office has
being receiving special priority that needs excellent employees because it represent front
of the house where guest receives first impression. But, the managers must also
appreciate that guest spends most of their stay in guestroom, restaurant and bar, and
encounter many moment of truth in these areas which bring the necessity for employees
of the said areas to be highly qualified.
86
This study has provided evidence that skills is very important in performing tasks and
managers must understand that formal professional education imparts a cognitive skill
which is very important in building up the interpersonal skills. The interpersonal skill
has been pointed out as important skills that employee require to have in order for the
organization to achieve service quality.
The researcher centered arguments on how hotel manager could create the internal
environment of the organization to promote quality service delivery. Findings indicated
that, there were no correction of mistakes and ambiguities which were happening during
delivery of service quality. This means that employees were repeating the same
mistakes, hence, manager failing to lock in guest‟s requirement into service quality
specifications. Findings concluded that of On–Job-Training, employee professional
qualification and communication at all level of the hotel are the factors which affect the
delivery of service quality in researched hotels in Arusha.
5.2 Recommendations
5.2.1 Recommendation for policy
The perceptions on service quality standards delivered differed significantly between
hotel managers and guests. This variation between hotel managers‟ and guests
perceptions emanated from the managers‟ failure to adhere to standards of service
quality which had promised to deliver to their guests through various source of
information. Therefore the formation of Quality Assurance for Accommodation and
catering establishment in Tanzania is necessary. This will ensure the adherence in
87
“Stars Standards” and will be used as the yardstick to measure the performance of the
hotel.
The assessed attributes of service quality standards, related to employees‟ competency
did not reach level which guests expected. Employees found to lack both technical and
interpersonal skills which are essential in delivering service quality. This could be
result of curricular used in hotel schools where they coming from not focusing on
building up prospective employees on these skills. Thus study recommends the hotel
school curricular to put efforts on ensuring that skills required to work in the hotel
industry are well addressed.
5.2.2 Recommendation for Practice
Role of management practices on delivery of quality services in hotels is very
essential. Management practices play important role in ensuring the delivery of
service quality hence, The hotel managers should ensure effective implementation
of Management practices.
The variation in perceptions between hotel managers and guest emerge from the fact
thus manager were not locking in customer requirement when designing the service
or product quality. Thus this study recommended that the guests‟ requirement should
be known before designing the service or product.

88
5.3 Suggestions for Further Research
The observed gaps in guestroom, restaurant and bar in this study provide evidence
that empirical research should be conducted to ascertain the reasons for the negative
service quality in these areas.
A study should be undertaken in other areas which receive tourists such as Zanzibar
and Dar-es-Salaam and their findings to be compared with the finding of this study.
The study will provide evidence which area of tourists‟ destination required more
effort to alleviate the service quality standards.
89
REFERENCES
Armstrong, M. (2006) Handbook of Human Resource Management Practice. 6th
ed.
United Kingdom, London, Kogan Page Limited
Babakus, E. Yavas, U., Karatepe, M.O. and Avci, T. (2003).The effect of management
commitment to service quality in employees‟ affective and performance
outcomes Journal of the Academy of Marketing Science, 31(3), p272-286.
Bagherian, M. (2007).Designing service quality in Four Star Hotels based on bound
travelers point of view: Case of Safir Hotel. Unpublished Master of
Marketing and e- Commerce Thesis: Lulea University of Technology and
University of Esfaham Sweden
Bailey, J.J. and McCullough, M.A. (2000), Emotional labor and the difficult customer:
Coping strategies of service agents and organizational consequences. Journal of
Professional Services Marketing 20 (2), p 51-72
Baum, T. and Nickson, D.(1998).Teaching human resource management in hospitality
and tourism: a critique. International Journal of Contemporary Hospitality
Management, 10 (2), p 75–79
Borucki C.C and Burke, M.J (1999) An Examination of service related antecedents to
Retail Store Performance. Journal of Organizational Behavior, 20(6), p 943-
962
Bowen, D. and Johnston, R. (1999). Internal service recovery: developing a new
construct, International Journal of Service Industry Management, 10(5), p 5-31
Brady, M. and Cronin, J. (2001). Some new thoughts on conceptualizing perceived
service quality: A hierarchical approach. Journal of Marketing, 65(July), p 34-
49.
Brown, S.P. and Peterson, R.A. (1993). Antecedents and consequences of Salesperson
Job Satisfaction: a Meta analysis and assessment of causal effects. Journal of
Marketing Research, 30 (February), p 63-77
Caravan, T. N. (1997). Interpersonal skills training for quality service interactions,
Journal of Industrial and Commercial Training, 29 (3), p 70–77
Clark, R. A., Hartline, M.D., Jones, K.C., (2009). The effects of leadership in hotel
employee commitment service quality. Cornell Hospitality Quarterly, 50(2), p
209 – 231
Cochran, W. G. 1963. Sampling Techniques, 2nd Ed., New York: John Wiley and
Sons, Inc p 462

90
Cooper, D. and Schindler, P. (2003). Business Research Methods. Boston. Mc Graw-
Hill
Cran, D J. (1994). Towards validation of the service orientation constructs. The Service
Industries Journal, 14, p 34-44
Fisk, R. P., Brown, S.W, Bitner, M.J. (1993).Tracking the service evolution in
marketing literatures, Journal of Retailing, 69 (1)
Gabbie, O. and O‟Neill, M. A.(1997). SERVQUAL and the Northern Ireland hotel
sector: a comparative analysis – part. Managing Service Quality, 6 (6), p 25–
321
Grönroos, C (1984).A Service quality Model and its managerial implications: European
Journal of marketing, 18 (4), p 36-44
Grönroos, C., (2002). Service Management and Marketing: A Customer
Relationship Management Approach (2nd
ed.). West Sussex, Wiley
publishers
Gržinic, D. (2007), Concepts of service quality measurement in hotel industry
Hrcak.Srce. Hr/File/24337. Accessed 25/4/2010
Hai-yan, K. and Baum, T. (2006). Skills and work in the hospitality sector: The case of
hotel front office employees in China, International Journal of Contemporary
Hospitality Management, 18 (6), p 509-518
Hall ,J. (2011) Cross-Sectional Survey Design: SAGE Research Methods,
http://www.srmo.sagepub.com/view/ of-survey./n120.xml. Retrieved 9.9.2012
Harper, B. (2000).'Beauty, stature and the labour market’, Oxford Bulletin of
Economics and Statistics. Changing Skill Needs of the Victorian Services
Industries. www.workandsociety.com/downloads/bodywork/aeslab.pdf.
Retrieved 5/5/2011
Hartog, D. and Verburg, R.M. (2002). Service Excellence from the employee point of
view: The role of first line Supervisors. Managing Service Quality, 12 (12) p
159 -164
Hickman, J and Mayer, K. (2003).Service quality and Human Resources Practices: A
Theme park case study. International Journal of Contemporary Hospitality
Management, 5 (2), p 116-119
Israel, G.D. (2009). Determining the Sample Size, Institute of Food and agriculture,
http://edis.ifas.ufl.edu. Retrieved 18.07.2010

91
Kandampully, J., (2006).The new customer-centered business model for the hospitality
industry. International Journal of Contemporary Hospitality Management,
18(3), p 173-187
Kandampully, J.A (2007). Service Management: The new Paradigm in Hospitality,
New Jersey, Upper Saddle River, Pearson Prentice Hall, p 65-127
Kandampully, J., Mork, C. and Spark, B. (2001). Service Quality Management in
Hospitality, Tourism and Leisure, p 159 – 191. New York, The Haworth Hospitality
Press
Mugenda, O. and Mugenda, A. (2003). Research Methods; Quantitative and
Qualitative Approaches, Nairobi, African Center for Technology Studies
Press, p 41-65
Nadiri, H. and Hussain, K. (2005). Perceptions of service quality in North Cyprus hotels,
International Journal of Contemporary Hospitality Management, 17 (6), p 469-
480
Nickson, D. Warhurst, C. and Dutton, E. (2005).The importance of attitude and
appearance in the service encounter in retail and hospitality. Journal of
Managing Service Quality, 15 (2), p 195-208
Orodho, J.A (2008) Techniques of Writing Research Proposal and Reports in
Educational and Social Science: Nairobi, Harlifax Printer and General
Supplies
Parasuraman, A. Zenithal, V.A. and Berry. L. L. (1988). SERVQUAL: A multiple-
item scale for measuring consumer perceptions of service quality.
Journal of Retailing, 64, p 12-40
Parasuraman, A., Zeithaml, V. and Berry, L. (1985), “A conceptual model of service
quality and its implications for future research” Journal of Marketing, Vol.
49,p 41-50
Pfeiffer, J. (1998), The Human Equation: Building profit by Putting People first.
Boston MA: Harvard Business School Press, p 80-85
Provis, C. Shirley J. Barbara A. (2003). The selection and training of workers in the
tourism and hospitality industries for the performance of emotional labor
Online Journal of Hospitality and Tourism Management,
www.allbusiness.com/human-resources/472177-1.html Retrieved 18/12/2009
Schneider, B. and Bowen (1993).The Service Organization- Human resource
management is Crucial. Journal of Organizational Dynamics, 21 (4) p 39 –
52
92
Schneider, B. White, S.S and Paul, M.C. (1998, Linking service climate and customers‟
perceptions of service quality: Test of a casual model, Journal of Applied
Psychology, 83 (20, p 150- 163
Sharma, A. and Upneja, A.(2005). Factors influencing financial performance of small
hotels in Tanzania, International Journal of Contemporary Hospitality
Management 17 (6), p 504-515
Sigala, M. (2008), Service quality and customer relationship management:
Interrelationships and implications (Guest Ed.) Managing Service Quality, Vol
18, Issue 5
Slåtten, T. (2009).The effect of managerial practice on employee-perceived service
quality the role of emotional satisfaction: Journal of Managing Service
Quality, 19 (4), p 431-455
Teare, R. (1996) Hospitality operations: patterns in management, service improvement
and business performance .International Journal of Contemporary Hospitality
Management, 8 (7), p 63-74
Trip Advisor (2010) Hotel Popularity Index, http://www.tripadvisor.com Retrieved
12.7.2010
Tsang, N. and Qu, H. (2000). Service quality in China's hotel industry: a perspective
from tourists and hotel managers. International Journal of Contemporary
Hospitality Management, 12 (5), p 316- 326
United Republic of Tanzania (2002), Integrate Tourism Master Plan. Ministry
Resources and Tourism. Tourism Department, Dar- Es – Salaam
Wadawi, J.K. (2008). An Assessment of hotel products quality in Kenya a basis for
building destination Competitiveness: Unpublished Thesis of Doctor of
Philosophy Degree, University of Johannesburg, South Africa
Waller, K. (1996). Improving Food and Beverage Performance, United Kingdom,
London, Caterer and Hotelkeeper Association
Wood, R.C. (1995). Status of hotel and catering work: theoretical dimensions and
practical implications. Hospitality Research Journal, 16 (3), p 3-15.
Zeithaml, V.A., Bitner, M.J. and Gremler D.D. (2006) Service Marketing: Integrating
customer focus across the firm (4th
ed.). , New–York, Mc Graw – Hill
International
93
APPENDICES
Appendix 1.1
1.1.1 Sample of Informed Consent
The Quality of Service Standards and Related Factors in Tourist hotels in Arusha,
Tanzania
I am Naiman Mbise a post graduate student at Kenyatta University, School of
Hospitality and Tourism Department of Hospitality Management .I am undertaking a
research entitled The Quality of Service Standards and Related Factors in Tourist
Hotels in Arusha, Tanzania. The aim of the study is part of the requirements for the
award of Master of Science in Hospitality and Tourism Management. Respondents are
kindly requested to answer the questions to the best of their knowledge; information
obtained will be accorded most confidentiality. Your participation and co-operation in
the exercise is highly appreciated.
Thank you for your cooperation.
I (name of respondent) agree to participate in this study. I understand that the purpose of
this research is for academic purposes and incase of any further clarification I can ask
Mr. Naiman Mbise of [email protected] , + 255 75633711.
This day__________________
Date_________________Signature__________________
94
1.1.2 Request Letter to Hotels
Naiman Ndelekwa Mbise,
Kenyatta University,
P.O. Box 43844 – 000100,
Nairobi, Kenya.
Date ___________________________
The General Manager,
_________________________________
__________________________________
Arusha, Tanzania
Dear Sir/ Madam
Ref: Request for Permission to Administer Research Questionnaires
Please, refer to the heading above: I am a Senior Tutor at the National College of
Tourism (NCT) which is under the Ministry of Natural resource and Tourism.
Currently I am enrolled in a postgraduate degree at Kenyatta University, Nairobi Kenya.
As part of the requirements for the award of Master of Science in Hospitality and
Tourism Management; I am obliged to conduct a research for the final Thesis. By that
obligation, I am conducting research on the quality of service standards and related
factors in tourist hotels in Arusha, Tanzania.
Your establishment has been sampled to take part in this study. I am therefore requesting
you to accept it; also to give me an appointment to come and discuss with you the
contents of the questionnaires and modality of administering it. Because of the time
frame given by the University I would be very grateful if you could offer me an
95
appointment before 15th August 2010. I am hopeful that this research will form a good
baseline for the continuous improvement of service quality of hotels in Tanzania.
I would like to assure you that any information gathered in this study will solely be used
for the intended purpose and high confidentiality will be practised. Lastly, the results of
this research will be available to you once the study is completed and approved by the
University examining board.
Thanking you in advance,
Yours Sincerely,
NAIMAN, N. MBISE
Contact + 255 756337113, E-mail [email protected]

96
Appendix 1.2 : Guests’ Questionnaire
Study Title: The Quality of Service Standards and Related Factors in Tourist
Hotels in Arusha, Tanzania
Hallo Guest,
I am kindly requesting you to indicate level of Satisfaction to the quality of service you
have received in this hotel by a TICK (√) in an appropriate scale given in the table
below. The scale ranges from 1 (one) Not Satisfied at all to 5 (five) highly satisfied.
1. Guests’ Perception on Quality of Service in a Hotel
1A .General Hotel product (Please TICK √)
Attributes of the Area
Level of satisfaction to quality of services
you have received in this hotel
Not Satisfied at all Highly
Satisfied
1 2 3 4 5
Hotel design and presentation
Location, accessibility and visibility
Parking space
Environmental and Landscaping
Health, fitness center and message
Parlor
In house security and safety and
assurance
Availability of business centre
No:
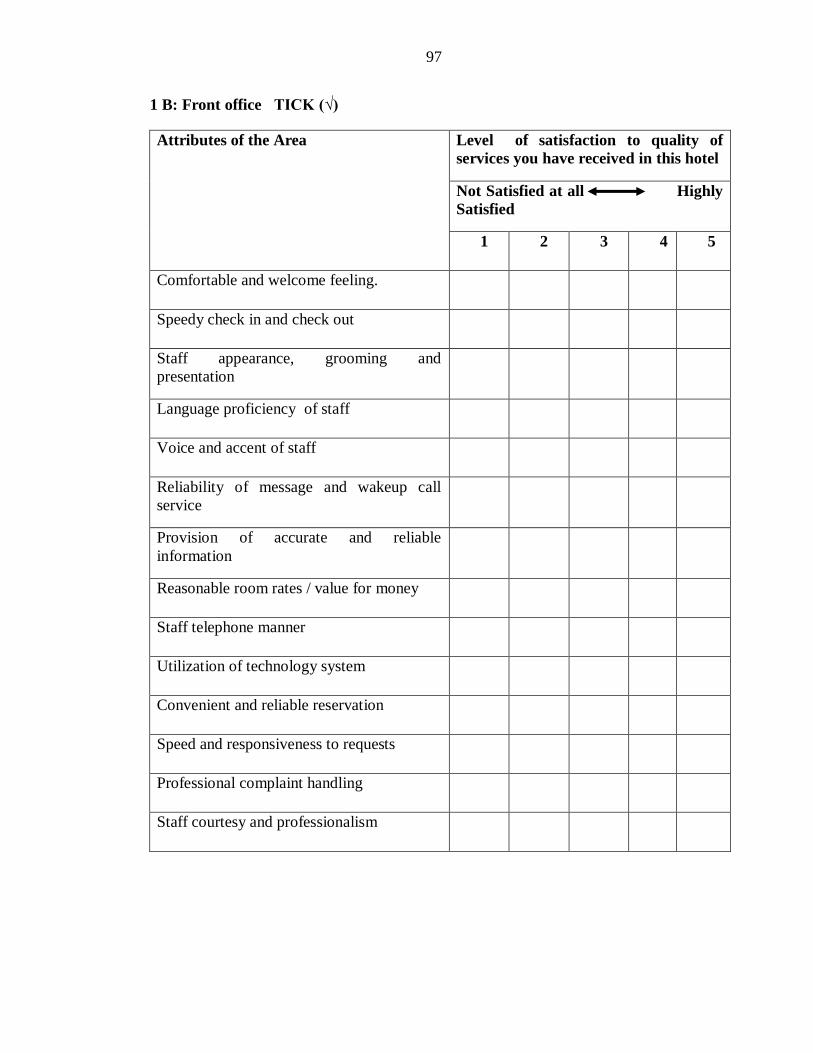
97
1 B: Front office TICK (√)
Attributes of the Area Level of satisfaction to quality of
services you have received in this hotel
Not Satisfied at all Highly
Satisfied
1 2 3 4 5
Comfortable and welcome feeling.
Speedy check in and check out
Staff appearance, grooming and
presentation
Language proficiency of staff
Voice and accent of staff
Reliability of message and wakeup call
service
Provision of accurate and reliable
information
Reasonable room rates / value for money
Staff telephone manner
Utilization of technology system
Convenient and reliable reservation
Speed and responsiveness to requests
Professional complaint handling
Staff courtesy and professionalism
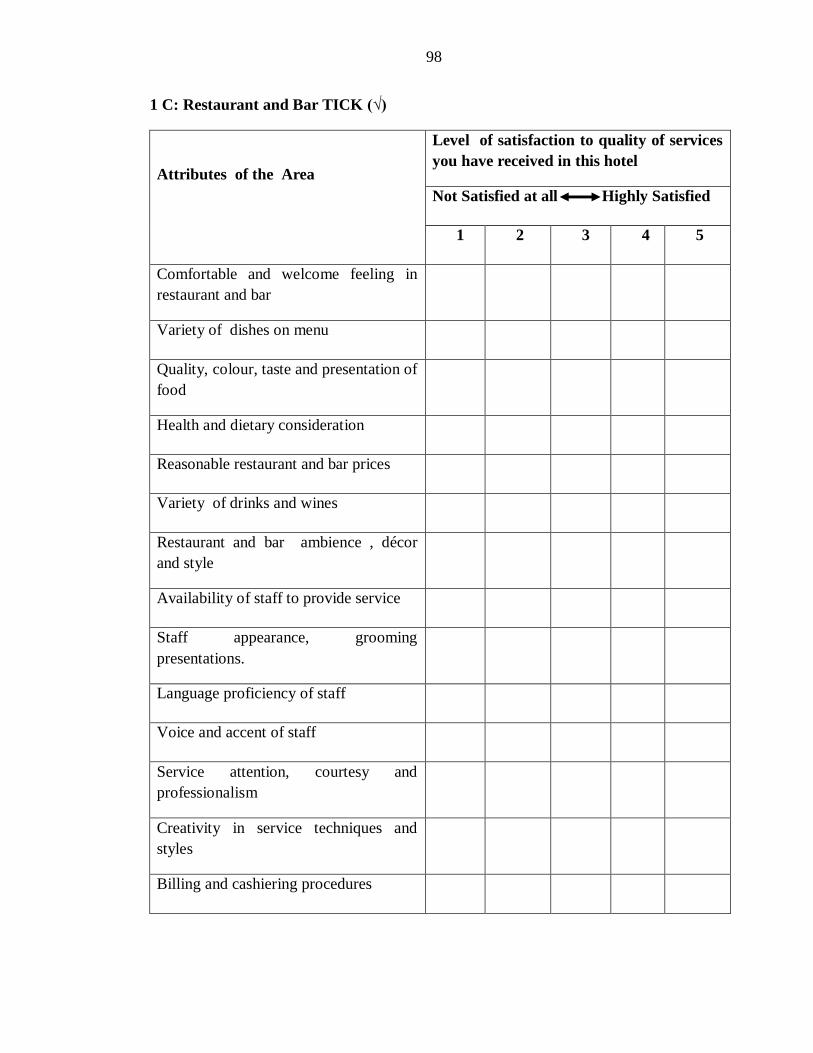
98
1 C: Restaurant and Bar TICK (√)
Attributes of the Area
Level of satisfaction to quality of services
you have received in this hotel
Not Satisfied at all Highly Satisfied
1 2 3 4 5
Comfortable and welcome feeling in
restaurant and bar
Variety of dishes on menu
Quality, colour, taste and presentation of
food
Health and dietary consideration
Reasonable restaurant and bar prices
Variety of drinks and wines
Restaurant and bar ambience , décor
and style
Availability of staff to provide service
Staff appearance, grooming
presentations.
Language proficiency of staff
Voice and accent of staff
Service attention, courtesy and
professionalism
Creativity in service techniques and
styles
Billing and cashiering procedures
Table 2:1 Continues

99
1 D: Guest Room TICK (√)
Attributes of the Area
Level of satisfaction to quality of services
you have received in this hotel
Not Satisfied at all Highly Satisfied
1 2 3 4 5
Room ambience, quietness and décor
Comfortness of bedding and seating
Cleanliness of room
Availability of guest room supplies
Quality of fixtures.
Sufficient fixtures.
Room maintenance
Room entertainment (TV, Video and
Internet).
Adequacy of fire safety facilities
Availability of room service
Staff appearance, grooming and
presentation.
Staff courtesy and professionalism
Voice and accent of staff
Language proficiency of employee
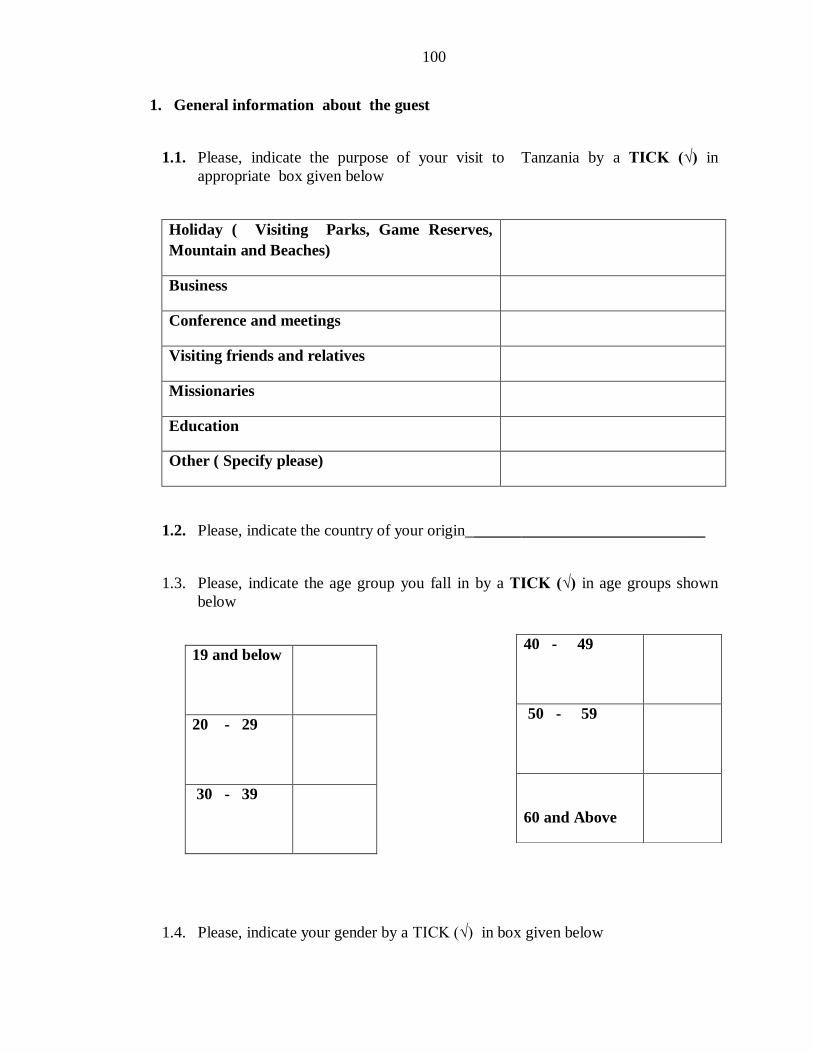
100
1. General information about the guest
1.1. Please, indicate the purpose of your visit to Tanzania by a TICK (√) in
appropriate box given below
Holiday ( Visiting Parks, Game Reserves,
Mountain and Beaches)
Business
Conference and meetings
Visiting friends and relatives
Missionaries
Education
Other ( Specify please)
1.2. Please, indicate the country of your origin______________________________
1.3. Please, indicate the age group you fall in by a TICK (√) in age groups shown
below
19 and below
20 - 29
30 - 39
1.4. Please, indicate your gender by a TICK (√) in box given below
40 - 49
50 - 59
60 and Above
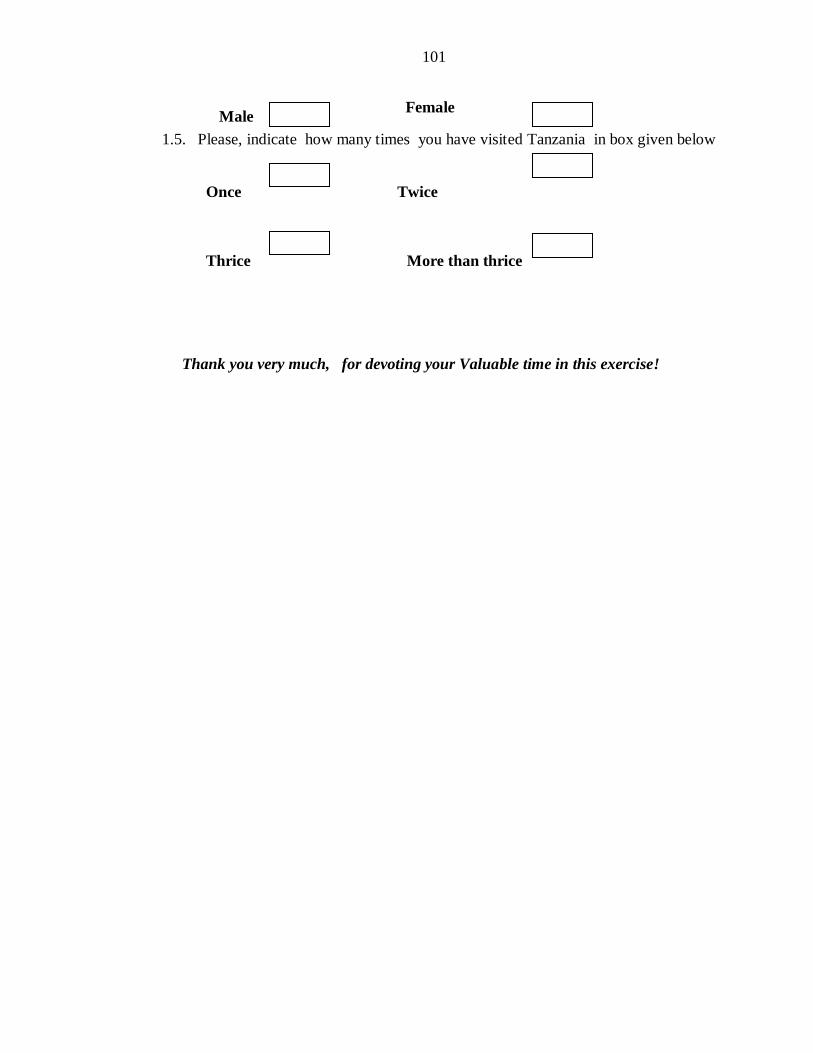
101
1.5. Please, indicate how many times you have visited Tanzania in box given below
Once Twice
Thrice More than thrice
Thank you very much, for devoting your Valuable time in this exercise!
Male Female

102
Appendix 1.3: Managers’ Questionnaire
Study Title: Quality of Service Standards and Related Factors in Tourist Hotels in
Arusha, Tanzania
The Manager’s perceptions on Quality of service hotel offers
As you are a Manager of this hotel; I kindly request you to indicate level of your
perception of quality of service which you offer to your guests by a TICK (√) in an
appropriate scale given in the table below. The scale ranges from 1 (one) Not important
at all to 5 (five) highly important.
1. A General Hotel product (Please TICK √)
Attributes of the Area
Level of importance of your perceptions to
quality of services offered by hotel to the
guests
Not Important at all Highly Important
1 2 3 4 5
Hotel design and presentation
Location, accessibility and visibility
Parking space
Environment and Landscaping
Health, fitness center and massage
Parlor
In house security, safety and assurance
Availability of business centre
No:-

103
1 B: Front office TICK (√)
Attributes of the Area Level of importance of your
perceptions to quality of services
offered by hotel to the guests
Not Important at all Highly
Important
1 2 3 4 5
Comfortable and welcome feeling.
Speedy check in and check out
Staff appearance, grooming and presentation
Language proficiency of staff
Voice and accent of staff
Reliability of message and wakeup call
service
Provision of accurate and reliable
information
Reasonable room rates / value for money
Staff telephone manner
Utilization of technology system
Convenient and reliable reservation
Speed and responsiveness to requests
Professional complaint handling
Staff courtesy and professionalism

104
1 C: Restaurant and Bar (TICK √)
Attributes of the Area
Level of importance of your
perceptions to quality of services
offered by hotel to the guests
Not Important at all Highly
Important
1 2 3 4 5
Comfortable and welcome feeling in
restaurant and bar
Varieties of dishes on menu
Quality, colour, taste and presentation of
food.
Health and dietary consideration
Reasonable restaurant and bar prices
Varieties of drinks and wines list
Restaurant and bar ambient , décor and
styles
Availability of staff to provide service
Staff appearance, grooming presentations.
Language proficiency of staff
Voice and accent of staff
Service attention courtesy and
professionalism
Creativity in service techniques and styles
Billing and cashiering procedures
Table 2:1 Continues

105
Attributes of the Area Level of importance of your
perceptions to quality of services
offered by hotel to the guests
Not Important at all Highly
Important
1 2 3 4 5
Room ambience, quietness and décor
Comfortness of bedding and seating
Cleanliness of room
Availability of guest room supplies
Quality of fixtures.
Sufficient fixtures.
Room maintenance
Room entertainment (TV, Video and
Internet).
Adequacy of fire safety facilities
Availability of room service
Staff appearance, grooming and
presentation.
Staff courtesy and professionalism
Voice and accent of staff
Language proficiency of employee
1 D: Guest Room (TICK (√)
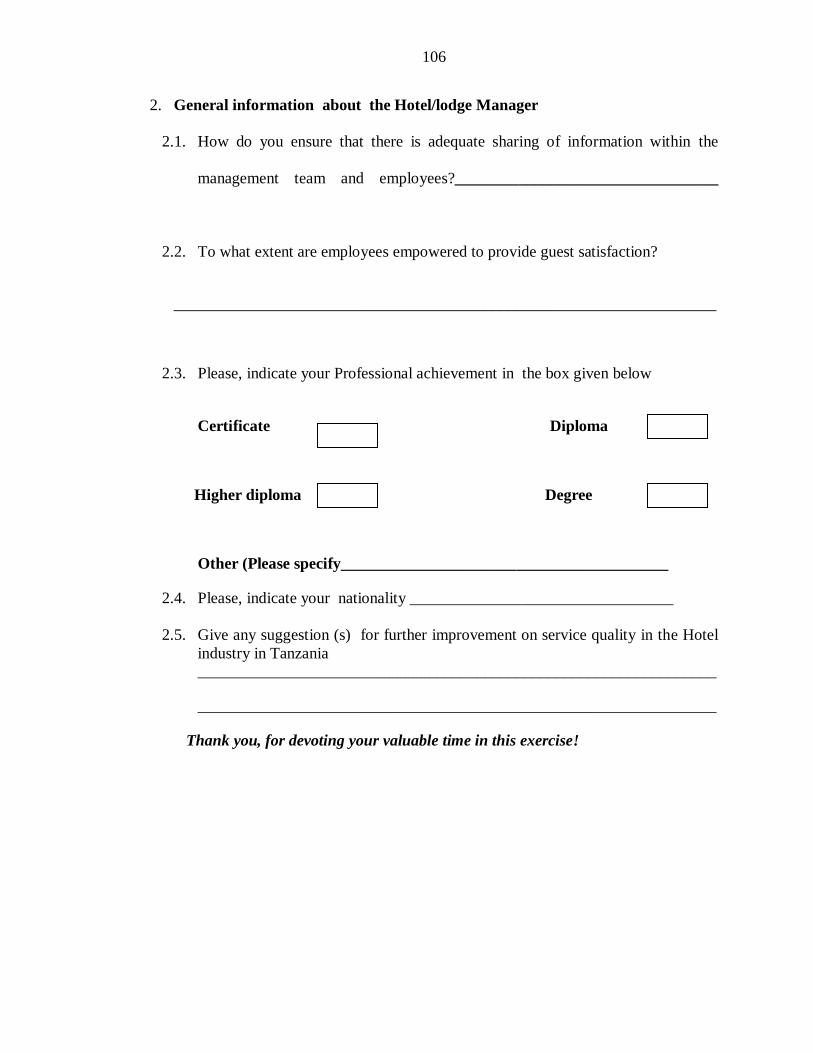
106
2. General information about the Hotel/lodge Manager
2.1. How do you ensure that there is adequate sharing of information within the
management team and employees?_________________________________
2.2. To what extent are employees empowered to provide guest satisfaction?
____________________________________________________________________
2.3. Please, indicate your Professional achievement in the box given below
Certificate Diploma
Higher diploma Degree
Other (Please specify_________________________________________
2.4. Please, indicate your nationality _________________________________
2.5. Give any suggestion (s) for further improvement on service quality in the Hotel
industry in Tanzania _________________________________________________________________
_________________________________________________________________
Thank you, for devoting your valuable time in this exercise!

107
Appendix 1.4: Human Resource Managers’ Questionnaire
Study Title: The Quality of Service Standards and Related Factors in Tourist
Hotels in Arusha, Tanzania
1. What is the name of your Organization ______________________________?
2. How do you reach job seekers when a vacancy arises in the service department
in your organization
Please rank your response by using 1, 2, 3… (1 being most frequently used lasting
with less frequently used)
3.Below are three types of skills which are required in performing duties in the hotel
industry especially for the employees in contact with guests. Please rank in accordance
to their importance during selection of new employee , by indicating in appropriate
table column ( Use 1 as most important and 3 as less important)
Word of mouth
Advertising in Public ( Newspaper)
College Recruiting
Private Employment Agencies
Professional Association
Walk- in ; Write –ins
Temporary Services or Casuals
Other (Specify)
No:-

108
Skills Type Ranks
Interpersonal skills ( Attitudes, Honesty,
Good communication skills , Motivation,
Control of emotion , Good speaking business
language ( English) etc)
Aesthetics Skills ( grooming, dress,
appearance, make up, voice, accents, body
shape, attractive to people)
Technical skills ( Carrying of plate
correctly, Good book keeping competence,
Good room cleaning competence)
4.Which of the following aspects listed below, do you use in the short listing of
prospective employees for interview; Rank them by 1,2,3… in order of ascending,
starting with most crucial aspect lasting with less crucial. Use 1 as a most crucial
lasting with less crucial
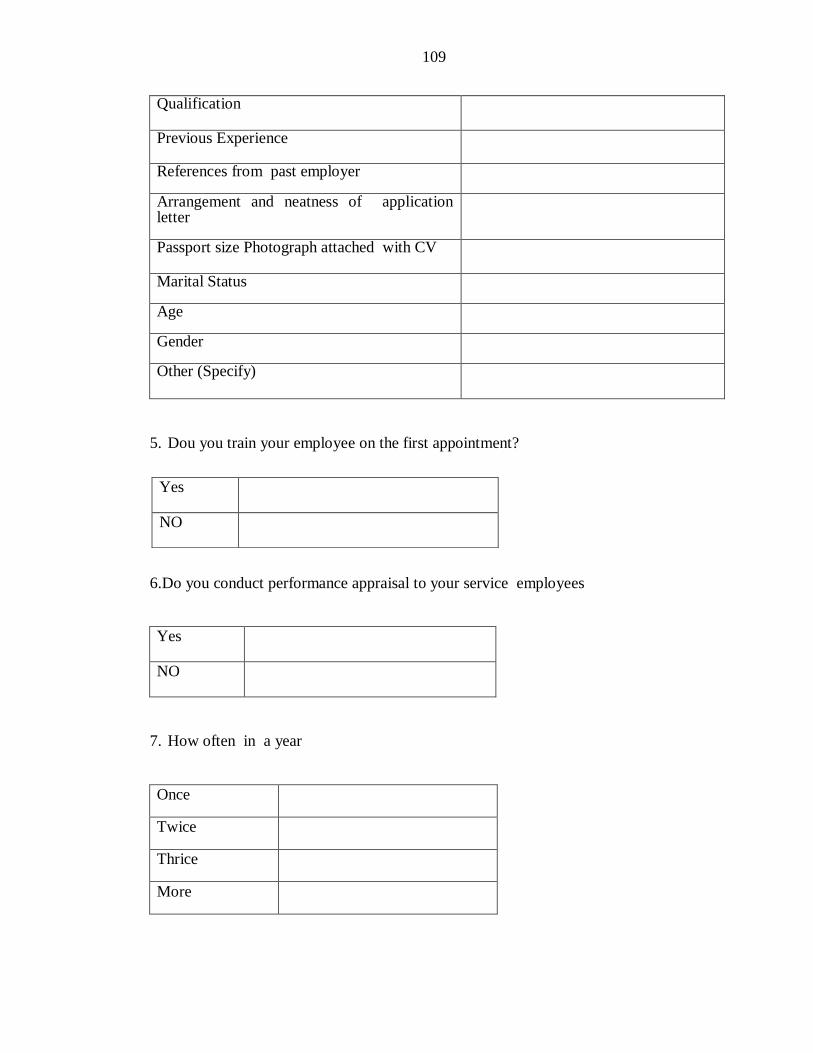
109
Qualification
Previous Experience
References from past employer
Arrangement and neatness of application letter
Passport size Photograph attached with CV
Marital Status
Age
Gender
Other (Specify)
5. Dou you train your employee on the first appointment?
6.Do you conduct performance appraisal to your service employees
Yes
NO
7. How often in a year
Once
Twice
Thrice
More
Yes
NO

110
8. Which following skills do your service employees lack, hence need to be trained? Use
1,2, an 3 to indicate the magnitude of the problem ( 1 being less training and 3
extensive training)
9. How do you motivate your employees?
____________________________________________________________
10. To what extent do you agree that employees are satisfied with the following
management practices?
Skills Type Ranks
Interpersonal skills ( Attitude, Honesty, Good communication skills ,
Motivation, Control of emotion , Good speaking business language ( English)
etc)
Aesthetics Skills ( grooming, dress, appearance, make up, voice, accent, body
shape, attractive to people)
Technical skills ( Carrying of plate correctly, Good book keeping competence,
Good room cleaning competence)
Important management practices
Com
ple
tely
Dis
sati
sfie
d
Dis
sati
sfie
d
Neu
tral
Sati
sfie
d
Com
ple
tely
Sati
sfie
d
1 2 3 4 5
Leadership style
Employment process
Motivation
Training and Development
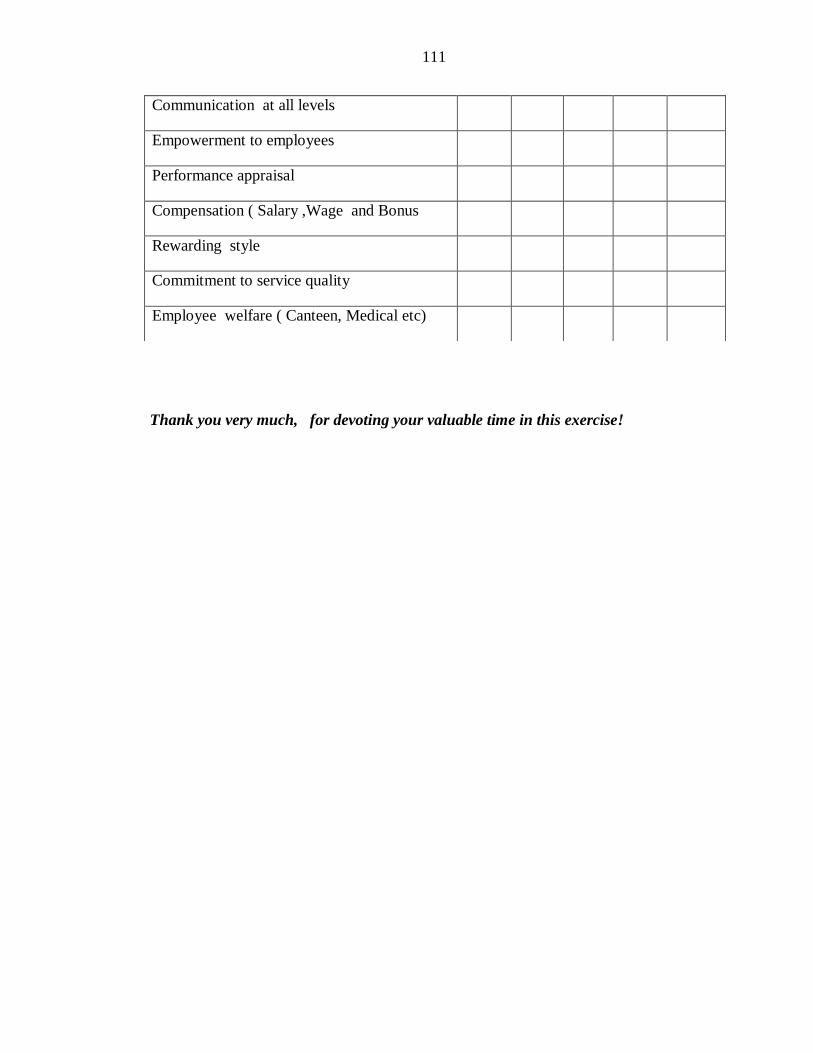
111
Thank you very much, for devoting your valuable time in this exercise!
Communication at all levels
Empowerment to employees
Performance appraisal
Compensation ( Salary ,Wage and Bonus
Rewarding style
Commitment to service quality
Employee welfare ( Canteen, Medical etc)
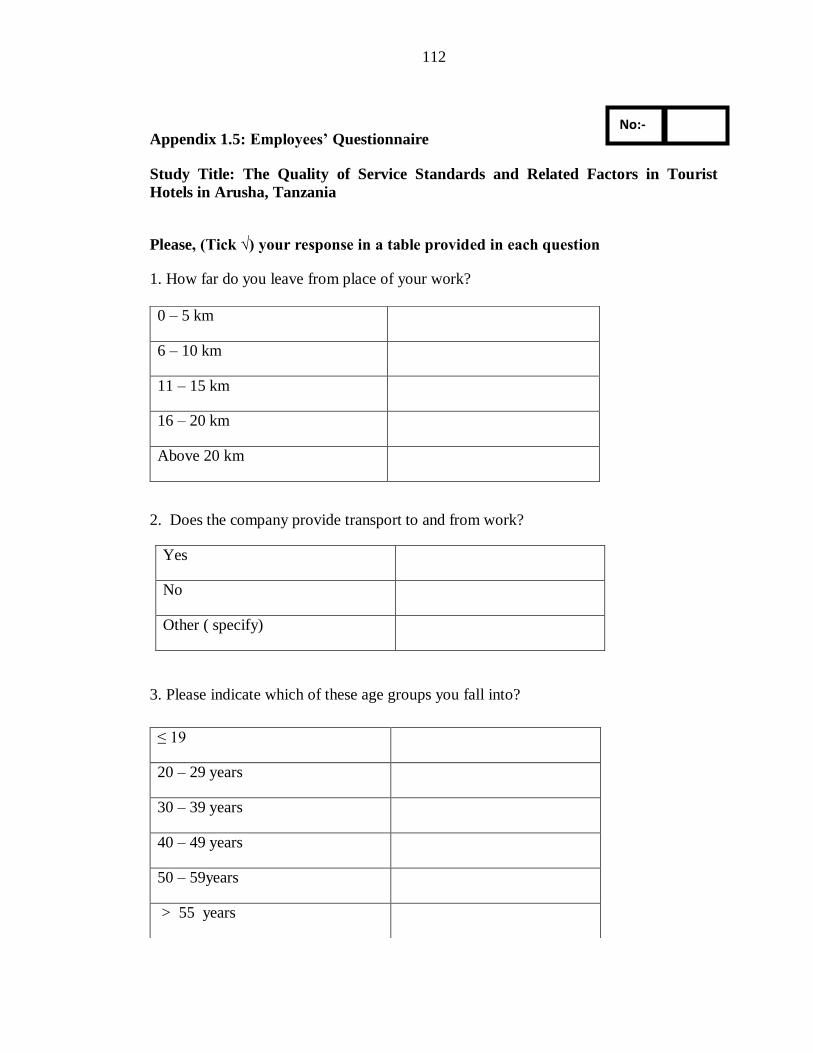
112
Appendix 1.5: Employees’ Questionnaire
Study Title: The Quality of Service Standards and Related Factors in Tourist
Hotels in Arusha, Tanzania
Please, (Tick √) your response in a table provided in each question
1. How far do you leave from place of your work?
2. Does the company provide transport to and from work?
Yes
No
Other ( specify)
3. Please indicate which of these age groups you fall into?
0 – 5 km
6 – 10 km
11 – 15 km
16 – 20 km
Above 20 km
≤ 19
20 – 29 years
30 – 39 years
40 – 49 years
50 – 59years
> 55 years
No:-
No:-
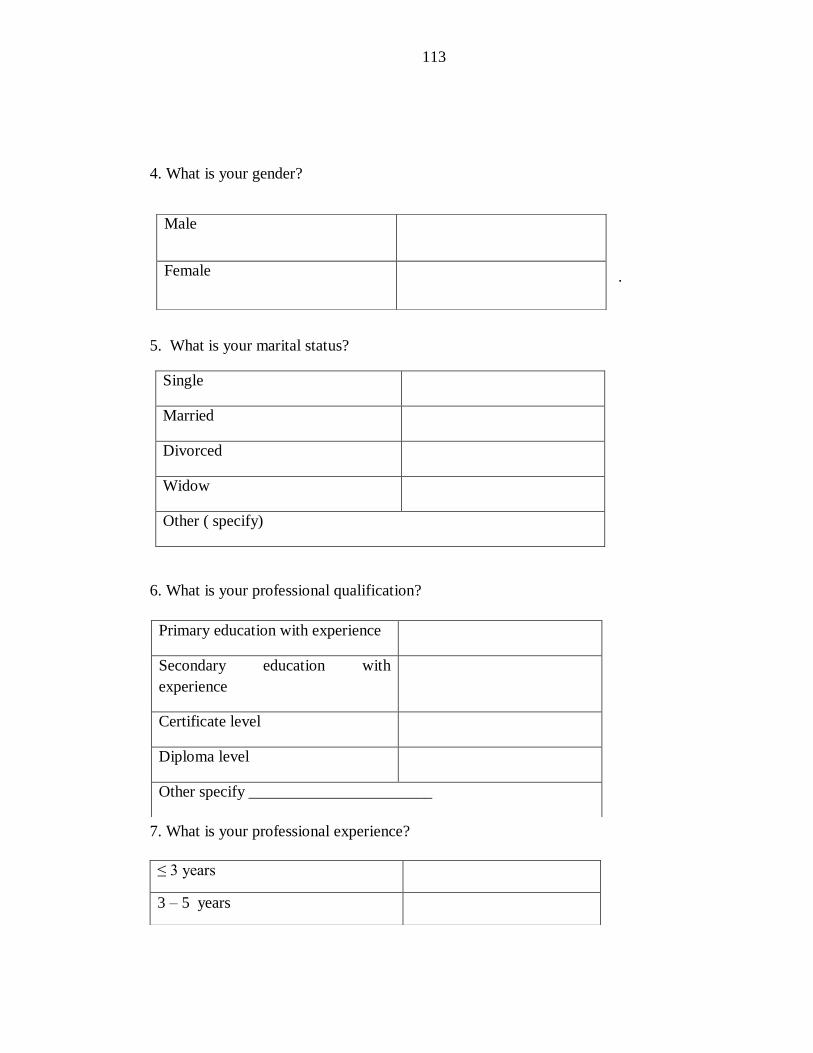
113
4. What is your gender?
.
5. What is your marital status?
Single
Married
Divorced
Widow
Other ( specify)
6. What is your professional qualification?
7. What is your professional experience?
Male
Female
Primary education with experience
Secondary education with
experience
Certificate level
Diploma level
Other specify _______________________
≤ 3 years
3 – 5 years

114
8. Do you understand the concept of service quality?
Yes
No
I have never heard
9. When was your last training from this organization in regard to provision of service
quality to guest?
10. Are you committed to provision of service quality?
Yes
No
6 – 10 years
11 – 15 years
>15 years
Within past three month
Six months ago
One year ago
None
Other specify

115
11.Which of the following aspects are main driver for you in offering service quality to
guest ( Please rank them in ascending order 1,2,3…., starting with 1 as the highest
order)
8. Which of the following aspects are main obstacles for you in offering service
quality to guest( Please rank them in ascending order 1,2,3…., starting with 1 as a
highest order)
Leadership styles
Working equipment
Schedule of work
Motivation
Training
Communication
rewarding style
Job satisfaction
Poor Leadership style
Lack of Working equipment
Poor schedule of work
Poor Motivation
Lack of training
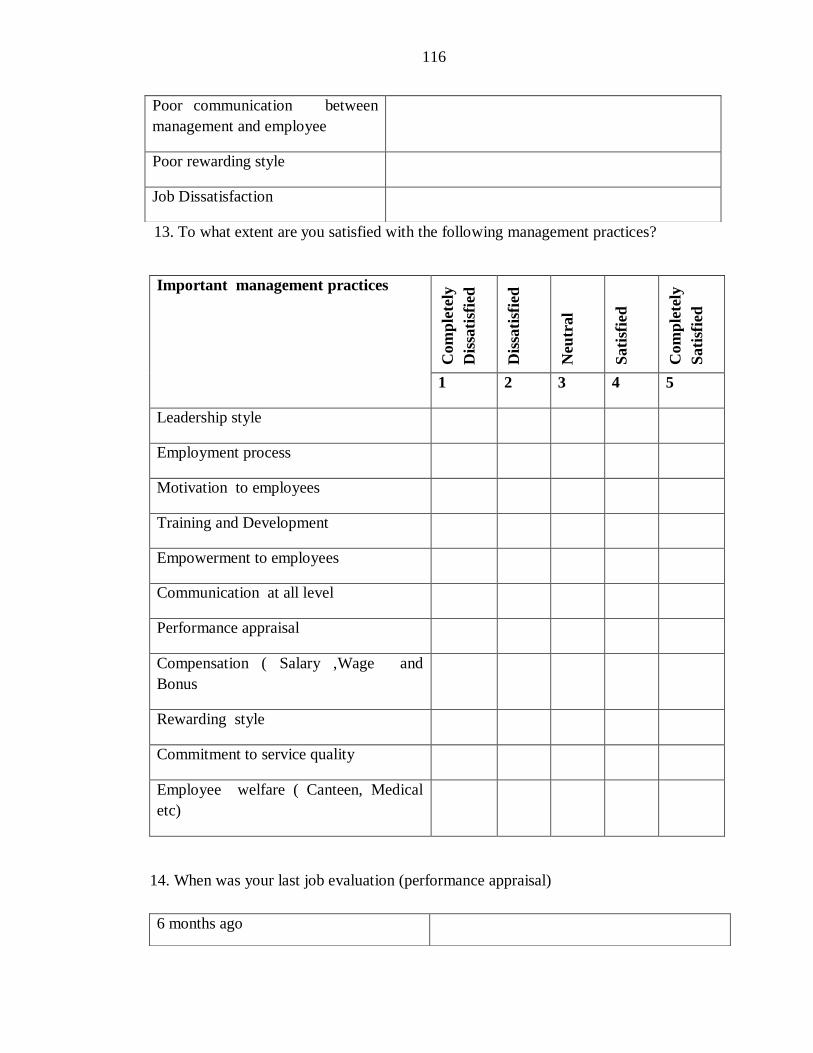
116
13. To what extent are you satisfied with the following management practices?
Important management practices
Com
ple
tely
Dis
sati
sfie
d
Dis
sati
sfie
d
Neu
tral
Sati
sfie
d
Com
ple
tely
Sati
sfie
d
1 2 3 4 5
Leadership style
Employment process
Motivation to employees
Training and Development
Empowerment to employees
Communication at all level
Performance appraisal
Compensation ( Salary ,Wage and
Bonus
Rewarding style
Commitment to service quality
Employee welfare ( Canteen, Medical
etc)
14. When was your last job evaluation (performance appraisal)
Poor communication between
management and employee
Poor rewarding style
Job Dissatisfaction
6 months ago
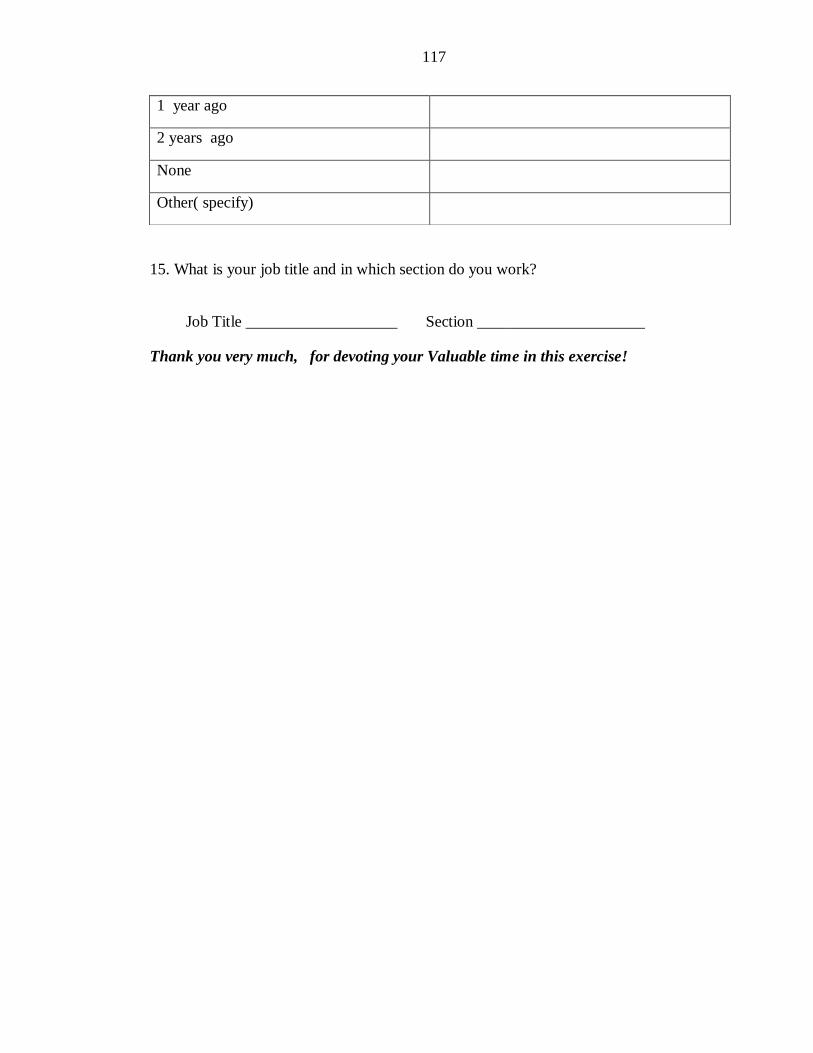
117
15. What is your job title and in which section do you work?
Job Title ___________________ Section _____________________
Thank you very much, for devoting your Valuable time in this exercise!
1 year ago
2 years ago
None
Other( specify)

118
Appendix 2: Published Tables for Sample Size
Size of Sample Size (n) for Precision (e) of:
Population ±3% ±5% ±7% ±10%
500 A 222 145 83
600 A 240* 152 86
700 A 255 158 88
800 A 267 163 89
900 A 277 166 90
1,000 A 286 169 91
2,000 714 333 185 95
3,000 811 353 191 97
4,000 870 364 194 98
5,000 909 370 196 98
6,000 938 375 197 98
7,000 959 378 198 99
8,000 976 381 199 99
9,000 989 383 200 99
10,000 1,000 385 200 99
A = Assumption of normal population is poor (Yamane, 1967). The entire population
should be sampled.
* Indicates the sample size taken in this study.

119
Source: Israeli (2009) Determining the Sample Size
Appendix 3: Areas that were used to Measure Hotel Service Quality Standards
No: Areas of Hotel Attributes of the Areas
1 General Hotel product Hotel design and presentation
Location, accessibility and visibility
Parking space and light
Environmental and Landscaping
Health and massage Parlor
In house security and safety and assurance
Availability of business centre
2 Front office Comfortable and welcome feeling.
Speed check in and check out
Staff appearance, grooming and presentation
Language proficiency of staff
Voice and accent of staff
Reliable of message and wakeup call service
Provision of accurate and reliable information
Reasonable room rate / value for money
Staff telephone manner
Utilization of technology system
Convenient and reliable reservation
Speed and responsiveness to requests
Professional complaint handling
Staff courtesy and professionalism
3 Food and Beverage Comfortable and welcome feeling in
restaurant and bar Varieties of dishes on
menu
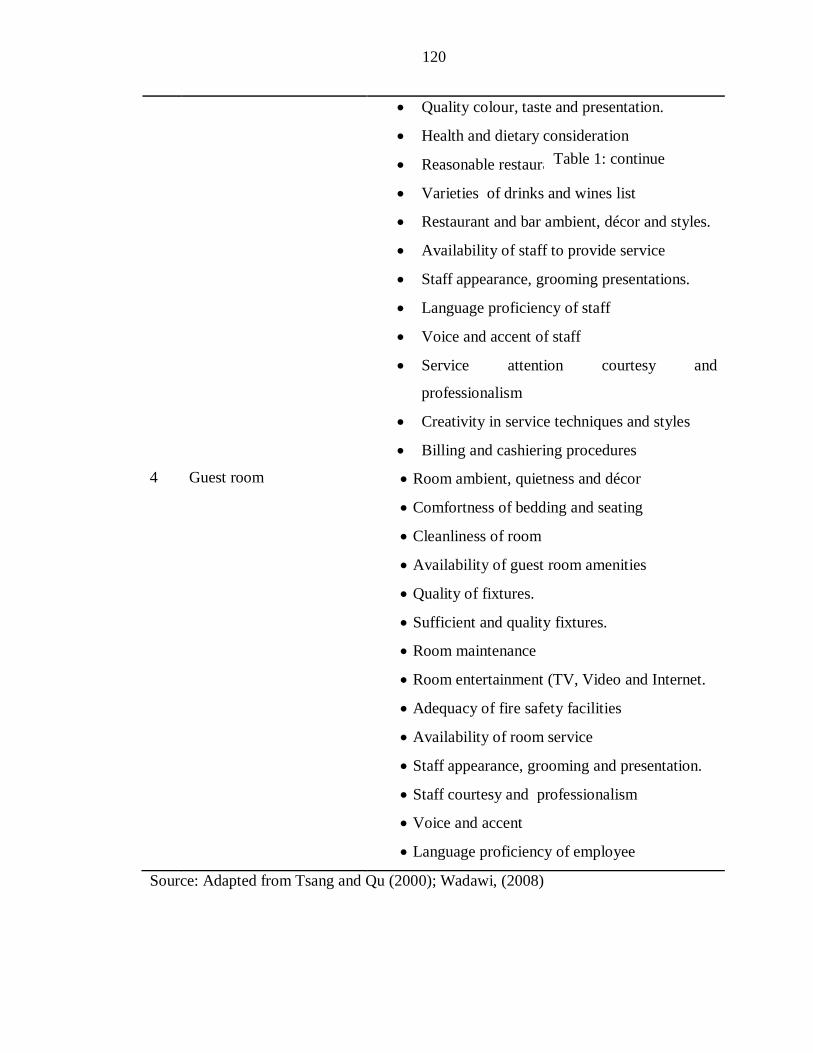
120
Quality colour, taste and presentation.
Health and dietary consideration
Reasonable restaurant and bar price
Varieties of drinks and wines list
Restaurant and bar ambient, décor and styles.
Availability of staff to provide service
Staff appearance, grooming presentations.
Language proficiency of staff
Voice and accent of staff
Service attention courtesy and
professionalism
Creativity in service techniques and styles
Billing and cashiering procedures
4 Guest room Room ambient, quietness and décor
Comfortness of bedding and seating
Cleanliness of room
Availability of guest room amenities
Quality of fixtures.
Sufficient and quality fixtures.
Room maintenance
Room entertainment (TV, Video and Internet.
Adequacy of fire safety facilities
Availability of room service
Staff appearance, grooming and presentation.
Staff courtesy and professionalism
Voice and accent
Language proficiency of employee
Source: Adapted from Tsang and Qu (2000); Wadawi, (2008)
Table 1: continue

121