the quantitative structure-mutagenicity relationship of polycylic
TRANSCRIPT
Int. J. Mol. Sci. 2006, 7, 556-570 International Journal of
Molecular Sciences ISSN 1422-0067 © 2006 by MDPI
www.mdpi.org/ijms/
The Quantitative Structure-Mutagenicity Relationship of Polycylic Aromatic Hydrocarbon Metabolites
Dooil Kim 1,2,*, Suk-In Hong 2,3, Dae-Sil Lee 1,*
1 Systems Microbiology Research Center, KRIBB, Daejeon 305-806, Korea
2 Department of Biomicrosystem Technology, Korea University, Seoul 136-701, Korea
3 Department of Chemical and Biological Engineering, Korea University, Seoul 136-701, Korea
* Author to whom correspondence should be addressed.
Received: 7 November 2006 / Accepted: 7 December 2006 / Published: 18 December 2006
Abstract: Quantitative structure-activity relationships (QSARs) for benz[a]anthracene (BA)
mutagens using 73 descriptors were searched. The mutagenicity data was obtained from
Ames assays for Mycobacterium vanbaalenii, Mycobacterium gilvum and Mycobacterium
flavescens strains. These data were fitted using a mutagenicity-cytotoxicity competition
model which defines the mutagenic potencies of BA metabolites, and include oxides,
phenols, quinones, and dihydrodiols. The QSAR equations were derived using the molecular
descriptor set (charged partial surface area, spatial, thermodynamic and electronic
descriptors) and semi-empirical energetic and charge descriptors. Genetic function
approximation was used to reduce and fit independent variables, including linear- and
quadratic-based functions. Multiple QSAR equations were generated and a separate QSAR
equation was chosen and evaluated for each strain using conventional r2, F-test, and cross-
validated r2. Each strain exhibited its own characteristic descriptors.
Keywords: QSAR; Benz[a]anthracene; Mutagenicity; Cytotoxicity.
1. Introduction
Benz[a]anthracene (BA) and its metabolitic products which are metabolically activated and are both
mutagenic and carcinogenic polycyclic aromatic compounds (PAH) include BA-oxides, -phenols, -
quinones, -dihydrodiols and -diolepoxides [1-17]. Although the mutagenicity of these metabolites has
Int. J. Mol. Sci. 2006, 7
557
been demonstrated repeatedly using short-term tests (STTs), a few dose-response data are available
[18-28]. Since the mutagenicity of PAH metabolites relies on both metabolic activation and their
ability to intercalate and bind DNA, performing a quantitative structure-activity relationships (QSARs)
study that relates the mutagenicity of these metabolites to physicochemical parameters such as potential
energy and electronic charge might provide statistically reliable insights such as providing quantitative
information on the mutagenic mechanisms of PAH by bay-region theory and activities of free radical
intermediates, as well as enable exploration of various structural features.
In the present work we have considered the mutagenicity data for 29 BA-oxides, -phenols, -
quinones, and -dihydrodiols from a data set presented by previous studies [1-17]. These compounds
were chosen for QSAR study because they are particularly mutagenic BA metabolites [18-30]. The
Ames test [31-35], which detects base-pair and frame-shift mutations, was used to examine the
mutagenic potential of these chemicals on Mycobacterium vanbaalenii, Mycobacterium gilvum and
Mycobacterium flavescens. We identified 73 descriptors (energetic, electronic, spatial and
thermodynamic) for the QSAR analysis, which were filtered by a genetic algorithm (GA) [36-39],
followed by multiple linear regression analysis and derivation of a QSAR equation.
2. Methods
We used a set of well-documented mutagenicity data obtained from investigations on several
microbial species strains [19-23]. Mutagenicity and cytotoxicity are assumed to be competitive and
using a similar model to Myers et al. [40], these two processes are described in (1) [41].
(Sd + B)e-td (1)
Mutagenic behavior is described as the linear function Sd + B, whereby S represents the slope of the
plot (number of revertants vs. dose applied), d is the dose of the mutagen (nmoles), and B is the
background number of revertants. The exponential function describes cytotoxicity and thus, t is the
cytotoxicity parameter. The data were fit using non-linear least squares. The value reported for
mutagenicity was the slope of the estimated function at dose = 0 nmol of BA compound, given by S -
Bt. The slope of the model (S - Bt) at d = 0 nmol is calculated as revertants nmol-1 and log(1 +
revertants nmol-1) is defined as the mutagenic potency (MP). The mutagenic potencies for strains M.
vanbaalenii(MV), M. gilvum (MG) and M. flavescens (MF) are MPmv, MPmg and MPmf,
respectively.
The molecular structures of BA metabolites were constructed using the Cerius2 package [42] and
optimized using the universal force field (UFF) generator [43], together with the charge equilibration
(QEq) method [44]. The routine for energy minimization ends upon completion of 10 iterations of the
steepest-descents and 500 of the Newton-Raphson minimization algorithms, or if the average tolerance
gradient is ≤ 0.001. The active compound is always assumed to take an energetically-stable
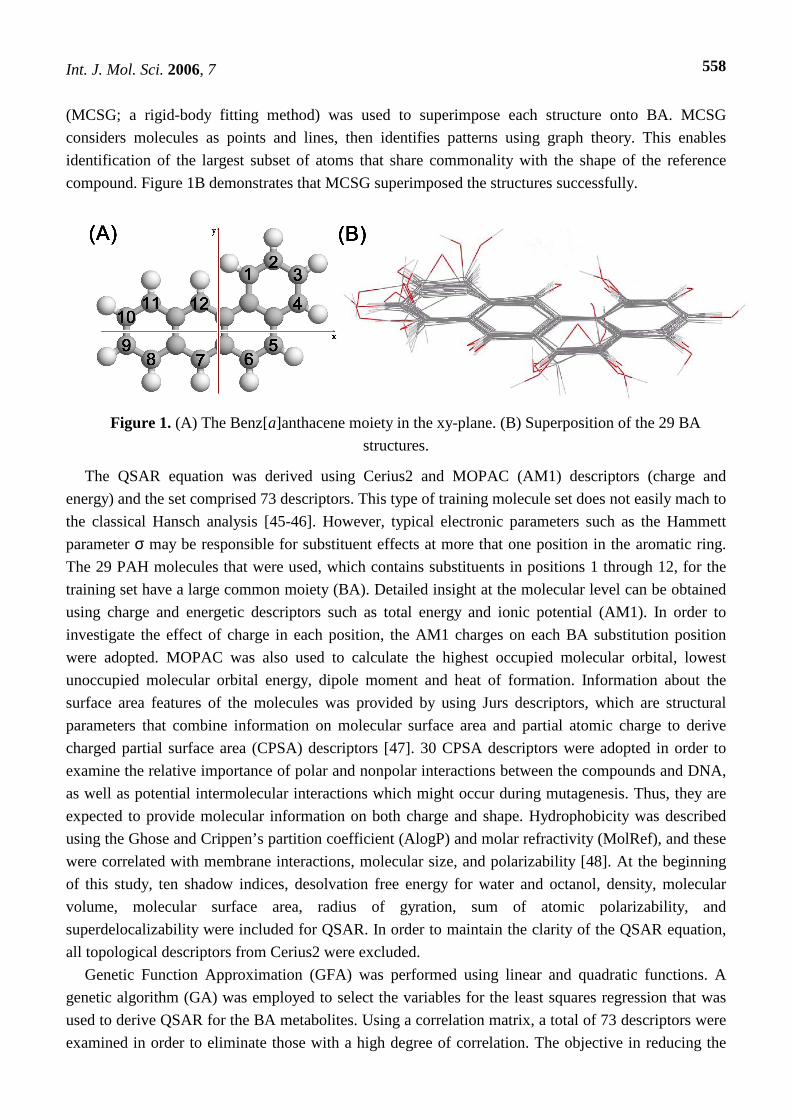
configuration. In order to relate physicochemical properties to the molecular geometry (e.g. shadow
indices), the longest, next longest and shortest axes were defined as the x-, y- and z-axes, respectively
(Figure 1). In order to prepare the training set, energetically-optimized molecular structures were
aligned to the core BA moiety using Cartesian coordinates, overlayed by the reference compound (BA),
which is the moiety common to all the molecules (Figure 1A). Maximum Common Sub Group
Int. J. Mol. Sci. 2006, 7
558
(MCSG; a rigid-body fitting method) was used to superimpose each structure onto BA. MCSG
considers molecules as points and lines, then identifies patterns using graph theory. This enables
identification of the largest subset of atoms that share commonality with the shape of the reference
compound. Figure 1B demonstrates that MCSG superimposed the structures successfully.
Figure 1. (A) The Benz[a]anthacene moiety in the xy-plane. (B) Superposition of the 29 BA
structures.
The QSAR equation was derived using Cerius2 and MOPAC (AM1) descriptors (charge and
energy) and the set comprised 73 descriptors. This type of training molecule set does not easily mach to
the classical Hansch analysis [45-46]. However, typical electronic parameters such as the Hammett
parameter σ may be responsible for substituent effects at more that one position in the aromatic ring.
The 29 PAH molecules that were used, which contains substituents in positions 1 through 12, for the
training set have a large common moiety (BA). Detailed insight at the molecular level can be obtained
using charge and energetic descriptors such as total energy and ionic potential (AM1). In order to
investigate the effect of charge in each position, the AM1 charges on each BA substitution position
were adopted. MOPAC was also used to calculate the highest occupied molecular orbital, lowest
unoccupied molecular orbital energy, dipole moment and heat of formation. Information about the
surface area features of the molecules was provided by using Jurs descriptors, which are structural
parameters that combine information on molecular surface area and partial atomic charge to derive
charged partial surface area (CPSA) descriptors [47]. 30 CPSA descriptors were adopted in order to
examine the relative importance of polar and nonpolar interactions between the compounds and DNA,
as well as potential intermolecular interactions which might occur during mutagenesis. Thus, they are
expected to provide molecular information on both charge and shape. Hydrophobicity was described
using the Ghose and Crippen’s partition coefficient (AlogP) and molar refractivity (MolRef), and these
were correlated with membrane interactions, molecular size, and polarizability [48]. At the beginning
of this study, ten shadow indices, desolvation free energy for water and octanol, density, molecular
volume, molecular surface area, radius of gyration, sum of atomic polarizability, and
superdelocalizability were included for QSAR. In order to maintain the clarity of the QSAR equation,
all topological descriptors from Cerius2 were excluded.
Genetic Function Approximation (GFA) was performed using linear and quadratic functions. A
genetic algorithm (GA) was employed to select the variables for the least squares regression that was
used to derive QSAR for the BA metabolites. Using a correlation matrix, a total of 73 descriptors were
examined in order to eliminate those with a high degree of correlation. The objective in reducing the
Int. J. Mol. Sci. 2006, 7
559
variables was to be able to assess the dimensionality of the data and interpret QSAR using the smallest
number of variables for which there was no loss of information. In addition to biological insights, these
variable reductions are very important for rapid and effective development of the GFA. Thus, the GA
performs descriptor filtering and reduction and least squares regression derives the QSAR equation.
Given that the GFA will generate multiple models, each QSAR equation must be evaluated using an F-
test, in order to determine significance and correlation coefficient to activity. The proper combination
of descriptors was derived by lack of fit (LOF) [36-37] and is defined as LSE/{1 - (c+dp)/M}, whereby
c is the number of non-constant basis functions i.e., descriptors, p is the total number of features
(coefficients + knots), M is the number of training molecules, and d is a user-adjusted smoothing
parameter. Using the smoothing parameter (d) = 1 often generates good results [36-37]. The evaluation
of the equation was done using least squares regression calculating cross-validated r2.
In order to avoid convergence upon a suboptimal solution, the GFA was performed five times using
different initial populations, then the optimum QSAR result was chosen as the equation for each strain.
The number of descriptors for the GFA was either fixed or varied from 2 to 6. Mutation of the equation
was performed by 50% addition of new terms for child equations. For a population of 100, GFA
evolution exhibited good convergence after 20000 crossovers in nonlinear two through four term
QSAR equations, and after 30000 crossovers in nonlinear five and six term equations.
For a regression model, r2 was used to describe the fitness of data and fitness is considered to
improve as r2 approaches 1. The sum of the squared deviations of dependent variables (SD) is
described by (Yobs - Ymean)2 and the predicted sum of squares (PRESS), by (Ypred - Yobs)
2. The cross-
validated correlation coefficient (rcv2) is defined as 1 – PRESS/SD and it used to evaluate the predictive
power of the QSAR equations that were generated. Each molecule was eliminated from the training set
and cross-validated rcv2 was calculated using the predicted values for the missing molecule. In addition,
the F value represents a measure of the statistical significance of the regression model and the number
of descriptors that are used for derivation of the model has a greater influence than the SD. The
standard deviation s, measures the quality of fitness and the number of degrees of freedom and takes
into consideration the number of objects and variables.
3. Results and Discussion
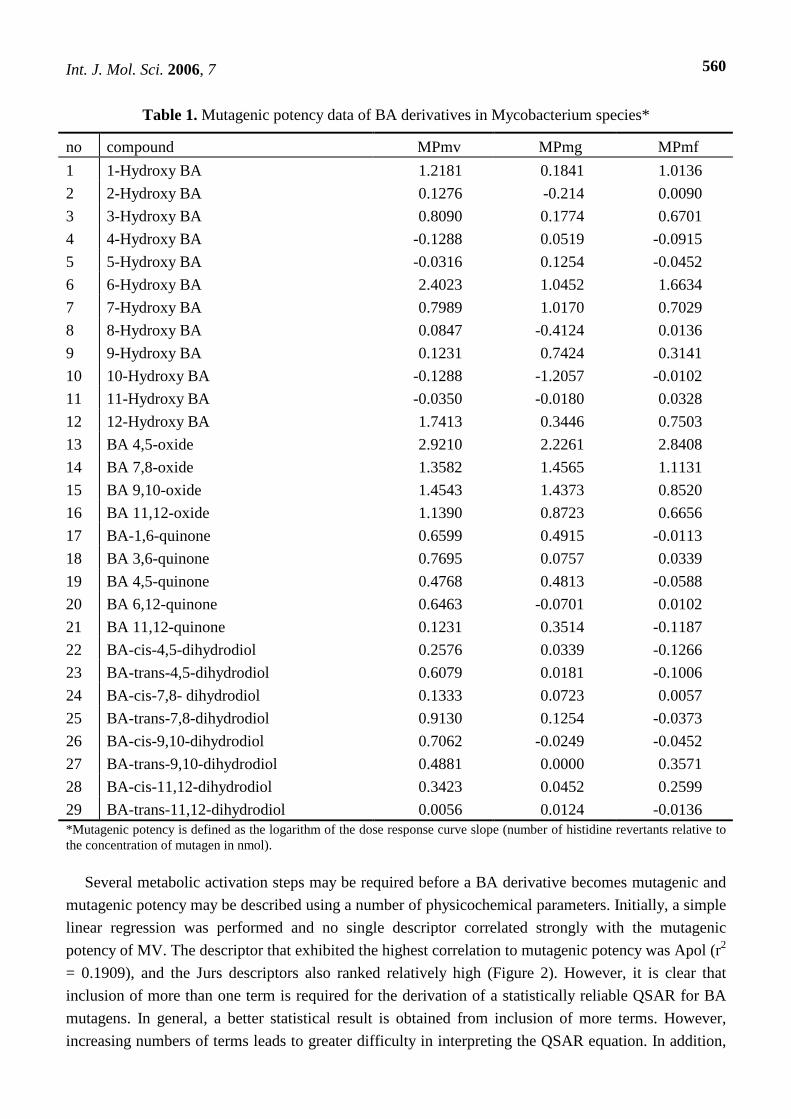
Mutagenic data are presented in Table 1. The following correlation values were obtained for the
three mutagenic activity data sets: 0.8509 (MV and MG); 0.8972 (MV and MF); and 0.8814 (MG and
MF). MV and MF exhibit a high level of collinearity and although there are differences, in general the
correlations are high. Four, six and ten negative mutagenic potencies were determined for the strains
MV, MG and MF, respectively, suggesting cytotoxicity exerts a dominant effect over mutagenicity.
However, it is likely that mutagenic potency exists to some degree. In Table 1, there were no large
negative values and the biggest negative value was -0.4125. The standard deviations obtained for each
strain were as follows: MV, 0.7435; MG, 0.6554; and MF, 0.6612. The strains are discussed
individually below.
Int. J. Mol. Sci. 2006, 7
560
Table 1. Mutagenic potency data of BA derivatives in Mycobacterium species*
no compound MPmv MPmg MPmf
1 1-Hydroxy BA 1.2181 0.1841 1.0136
2 2-Hydroxy BA 0.1276 -0.214 0.0090
3 3-Hydroxy BA 0.8090 0.1774 0.6701
4 4-Hydroxy BA -0.1288 0.0519 -0.0915
5 5-Hydroxy BA -0.0316 0.1254 -0.0452
6 6-Hydroxy BA 2.4023 1.0452 1.6634
7 7-Hydroxy BA 0.7989 1.0170 0.7029
8 8-Hydroxy BA 0.0847 -0.4124 0.0136
9 9-Hydroxy BA 0.1231 0.7424 0.3141
10 10-Hydroxy BA -0.1288 -1.2057 -0.0102
11 11-Hydroxy BA -0.0350 -0.0180 0.0328
12 12-Hydroxy BA 1.7413 0.3446 0.7503
13 BA 4,5-oxide 2.9210 2.2261 2.8408
14 BA 7,8-oxide 1.3582 1.4565 1.1131
15 BA 9,10-oxide 1.4543 1.4373 0.8520
16 BA 11,12-oxide 1.1390 0.8723 0.6656
17 BA-1,6-quinone 0.6599 0.4915 -0.0113
18 BA 3,6-quinone 0.7695 0.0757 0.0339
19 BA 4,5-quinone 0.4768 0.4813 -0.0588
20 BA 6,12-quinone 0.6463 -0.0701 0.0102
21 BA 11,12-quinone 0.1231 0.3514 -0.1187
22 BA-cis-4,5-dihydrodiol 0.2576 0.0339 -0.1266
23 BA-trans-4,5-dihydrodiol 0.6079 0.0181 -0.1006
24 BA-cis-7,8- dihydrodiol 0.1333 0.0723 0.0057
25 BA-trans-7,8-dihydrodiol 0.9130 0.1254 -0.0373
26 BA-cis-9,10-dihydrodiol 0.7062 -0.0249 -0.0452
27 BA-trans-9,10-dihydrodiol 0.4881 0.0000 0.3571
28 BA-cis-11,12-dihydrodiol 0.3423 0.0452 0.2599
29 BA-trans-11,12-dihydrodiol 0.0056 0.0124 -0.0136 *Mutagenic potency is defined as the logarithm of the dose response curve slope (number of histidine revertants relative to the concentration of mutagen in nmol).
Several metabolic activation steps may be required before a BA derivative becomes mutagenic and
mutagenic potency may be described using a number of physicochemical parameters. Initially, a simple
linear regression was performed and no single descriptor correlated strongly with the mutagenic
potency of MV. The descriptor that exhibited the highest correlation to mutagenic potency was Apol (r2
= 0.1909), and the Jurs descriptors also ranked relatively high (Figure 2). However, it is clear that
inclusion of more than one term is required for the derivation of a statistically reliable QSAR for BA
mutagens. In general, a better statistical result is obtained from inclusion of more terms. However,
increasing numbers of terms leads to greater difficulty in interpreting the QSAR equation. In addition,

Int. J. Mol. Sci. 2006, 7
561
GFA generates many statistically plausible equations that vary in number of terms and coefficients. In
respect to both r2 and rcv2, nonlinear QSAR equations were found to produce superior results to linear
equations for all strains.
Figure 2. Simple linear regression for (A) r2 and (B) F-test in MV, (C) r2 and (D) F-test in MG, and (E) r2 and (F) F-test in MF.
Int. J. Mol. Sci. 2006, 7
562
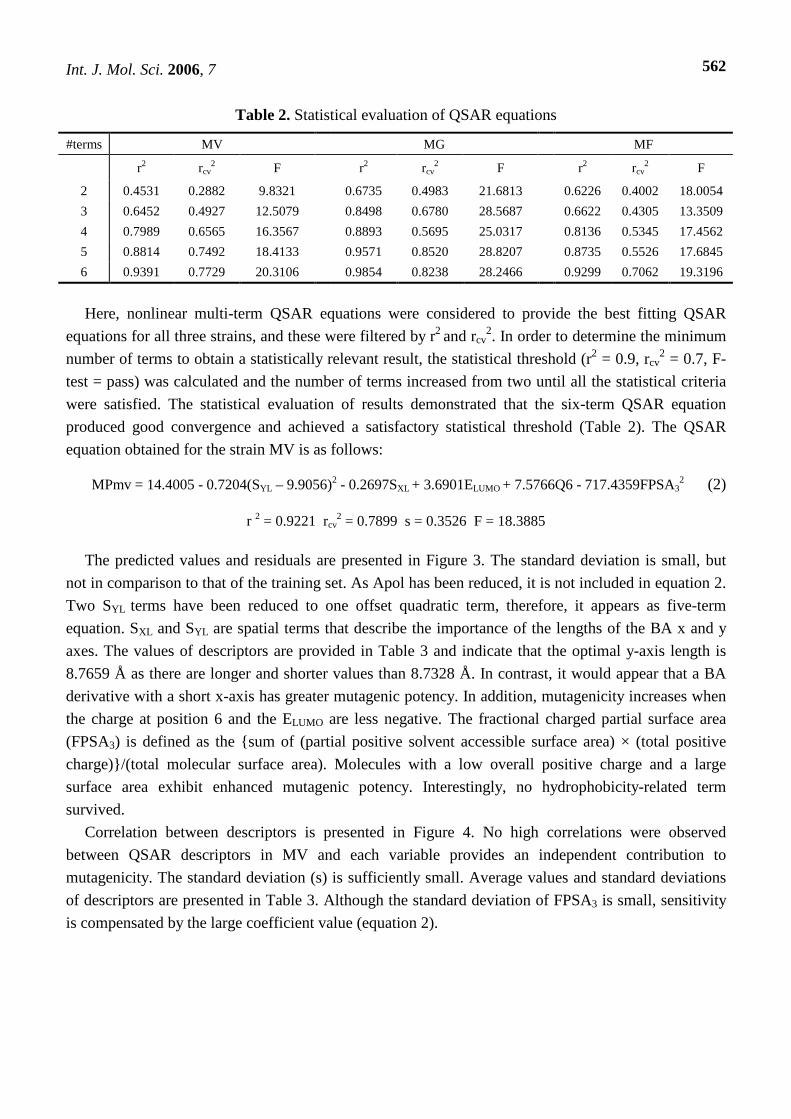
Table 2. Statistical evaluation of QSAR equations
#terms MV MG MF
r2 rcv2 F r2 rcv
2 F r2 rcv2 F
2 0.4531 0.2882 9.8321 0.6735 0.4983 21.6813 0.6226 0.4002 18.0054
3 0.6452 0.4927 12.5079 0.8498 0.6780 28.5687 0.6622 0.4305 13.3509
4 0.7989 0.6565 16.3567 0.8893 0.5695 25.0317 0.8136 0.5345 17.4562
5 0.8814 0.7492 18.4133 0.9571 0.8520 28.8207 0.8735 0.5526 17.6845
6 0.9391 0.7729 20.3106 0.9854 0.8238 28.2466 0.9299 0.7062 19.3196
Here, nonlinear multi-term QSAR equations were considered to provide the best fitting QSAR
equations for all three strains, and these were filtered by r2 and rcv2. In order to determine the minimum
number of terms to obtain a statistically relevant result, the statistical threshold (r2 = 0.9, rcv2 = 0.7, F-
test = pass) was calculated and the number of terms increased from two until all the statistical criteria
were satisfied. The statistical evaluation of results demonstrated that the six-term QSAR equation
produced good convergence and achieved a satisfactory statistical threshold (Table 2). The QSAR
equation obtained for the strain MV is as follows:
MPmv = 14.4005 - 0.7204(SYL – 9.9056)2 - 0.2697SXL + 3.6901ELUMO + 7.5766Q6 - 717.4359FPSA32 (2)
r 2 = 0.9221 rcv2 = 0.7899 s = 0.3526 F = 18.3885
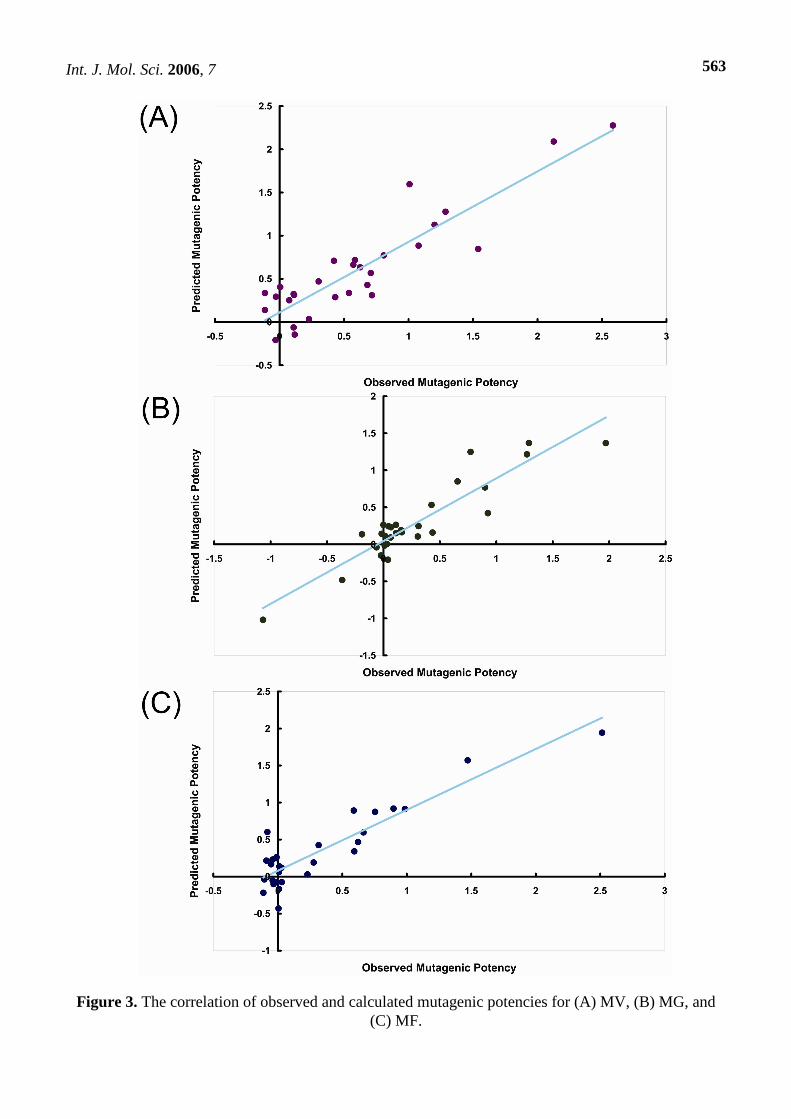
The predicted values and residuals are presented in Figure 3. The standard deviation is small, but
not in comparison to that of the training set. As Apol has been reduced, it is not included in equation 2.
Two SYL terms have been reduced to one offset quadratic term, therefore, it appears as five-term
equation. SXL and SYL are spatial terms that describe the importance of the lengths of the BA x and y
axes. The values of descriptors are provided in Table 3 and indicate that the optimal y-axis length is
8.7659 Å as there are longer and shorter values than 8.7328 Å. In contrast, it would appear that a BA
derivative with a short x-axis has greater mutagenic potency. In addition, mutagenicity increases when
the charge at position 6 and the ELUMO are less negative. The fractional charged partial surface area
(FPSA3) is defined as the {sum of (partial positive solvent accessible surface area) × (total positive
charge)}/(total molecular surface area). Molecules with a low overall positive charge and a large
surface area exhibit enhanced mutagenic potency. Interestingly, no hydrophobicity-related term
survived.
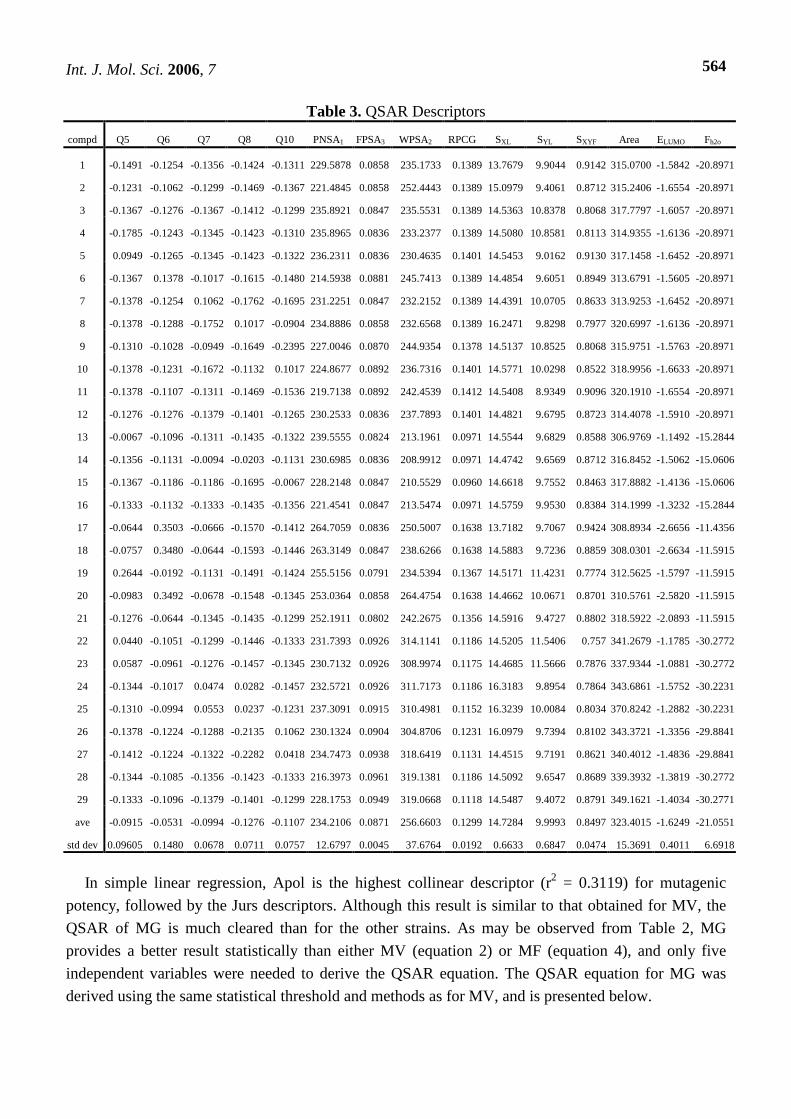
Correlation between descriptors is presented in Figure 4. No high correlations were observed
between QSAR descriptors in MV and each variable provides an independent contribution to
mutagenicity. The standard deviation (s) is sufficiently small. Average values and standard deviations
of descriptors are presented in Table 3. Although the standard deviation of FPSA3 is small, sensitivity
is compensated by the large coefficient value (equation 2).
Int. J. Mol. Sci. 2006, 7
563
Figure 3. The correlation of observed and calculated mutagenic potencies for (A) MV, (B) MG, and (C) MF.
Int. J. Mol. Sci. 2006, 7
564
Table 3. QSAR Descriptors
compd Q5 Q6 Q7 Q8 Q10 PNSA1 FPSA3 WPSA2 RPCG SXL SYL SXYF Area ELUMO Fh2o
1 -0.1491 -0.1254 -0.1356 -0.1424 -0.1311 229.5878 0.0858 235.1733 0.1389 13.7679 9.9044 0.9142 315.0700 -1.5842 -20.8971
2 -0.1231 -0.1062 -0.1299 -0.1469 -0.1367 221.4845 0.0858 252.4443 0.1389 15.0979 9.4061 0.8712 315.2406 -1.6554 -20.8971
3 -0.1367 -0.1276 -0.1367 -0.1412 -0.1299 235.8921 0.0847 235.5531 0.1389 14.5363 10.8378 0.8068 317.7797 -1.6057 -20.8971
4 -0.1785 -0.1243 -0.1345 -0.1423 -0.1310 235.8965 0.0836 233.2377 0.1389 14.5080 10.8581 0.8113 314.9355 -1.6136 -20.8971
5 0.0949 -0.1265 -0.1345 -0.1423 -0.1322 236.2311 0.0836 230.4635 0.1401 14.5453 9.0162 0.9130 317.1458 -1.6452 -20.8971
6 -0.1367 0.1378 -0.1017 -0.1615 -0.1480 214.5938 0.0881 245.7413 0.1389 14.4854 9.6051 0.8949 313.6791 -1.5605 -20.8971
7 -0.1378 -0.1254 0.1062 -0.1762 -0.1695 231.2251 0.0847 232.2152 0.1389 14.4391 10.0705 0.8633 313.9253 -1.6452 -20.8971
8 -0.1378 -0.1288 -0.1752 0.1017 -0.0904 234.8886 0.0858 232.6568 0.1389 16.2471 9.8298 0.7977 320.6997 -1.6136 -20.8971
9 -0.1310 -0.1028 -0.0949 -0.1649 -0.2395 227.0046 0.0870 244.9354 0.1378 14.5137 10.8525 0.8068 315.9751 -1.5763 -20.8971
10 -0.1378 -0.1231 -0.1672 -0.1132 0.1017 224.8677 0.0892 236.7316 0.1401 14.5771 10.0298 0.8522 318.9956 -1.6633 -20.8971
11 -0.1378 -0.1107 -0.1311 -0.1469 -0.1536 219.7138 0.0892 242.4539 0.1412 14.5408 8.9349 0.9096 320.1910 -1.6554 -20.8971
12 -0.1276 -0.1276 -0.1379 -0.1401 -0.1265 230.2533 0.0836 237.7893 0.1401 14.4821 9.6795 0.8723 314.4078 -1.5910 -20.8971
13 -0.0067 -0.1096 -0.1311 -0.1435 -0.1322 239.5555 0.0824 213.1961 0.0971 14.5544 9.6829 0.8588 306.9769 -1.1492 -15.2844
14 -0.1356 -0.1131 -0.0094 -0.0203 -0.1131 230.6985 0.0836 208.9912 0.0971 14.4742 9.6569 0.8712 316.8452 -1.5062 -15.0606
15 -0.1367 -0.1186 -0.1186 -0.1695 -0.0067 228.2148 0.0847 210.5529 0.0960 14.6618 9.7552 0.8463 317.8882 -1.4136 -15.0606
16 -0.1333 -0.1132 -0.1333 -0.1435 -0.1356 221.4541 0.0847 213.5474 0.0971 14.5759 9.9530 0.8384 314.1999 -1.3232 -15.2844
17 -0.0644 0.3503 -0.0666 -0.1570 -0.1412 264.7059 0.0836 250.5007 0.1638 13.7182 9.7067 0.9424 308.8934 -2.6656 -11.4356
18 -0.0757 0.3480 -0.0644 -0.1593 -0.1446 263.3149 0.0847 238.6266 0.1638 14.5883 9.7236 0.8859 308.0301 -2.6634 -11.5915
19 0.2644 -0.0192 -0.1131 -0.1491 -0.1424 255.5156 0.0791 234.5394 0.1367 14.5171 11.4231 0.7774 312.5625 -1.5797 -11.5915
20 -0.0983 0.3492 -0.0678 -0.1548 -0.1345 253.0364 0.0858 264.4754 0.1638 14.4662 10.0671 0.8701 310.5761 -2.5820 -11.5915
21 -0.1276 -0.0644 -0.1345 -0.1435 -0.1299 252.1911 0.0802 242.2675 0.1356 14.5916 9.4727 0.8802 318.5922 -2.0893 -11.5915
22 0.0440 -0.1051 -0.1299 -0.1446 -0.1333 231.7393 0.0926 314.1141 0.1186 14.5205 11.5406 0.757 341.2679 -1.1785 -30.2772
23 0.0587 -0.0961 -0.1276 -0.1457 -0.1345 230.7132 0.0926 308.9974 0.1175 14.4685 11.5666 0.7876 337.9344 -1.0881 -30.2772
24 -0.1344 -0.1017 0.0474 0.0282 -0.1457 232.5721 0.0926 311.7173 0.1186 16.3183 9.8954 0.7864 343.6861 -1.5752 -30.2231
25 -0.1310 -0.0994 0.0553 0.0237 -0.1231 237.3091 0.0915 310.4981 0.1152 16.3239 10.0084 0.8034 370.8242 -1.2882 -30.2231
26 -0.1378 -0.1224 -0.1288 -0.2135 0.1062 230.1324 0.0904 304.8706 0.1231 16.0979 9.7394 0.8102 343.3721 -1.3356 -29.8841
27 -0.1412 -0.1224 -0.1322 -0.2282 0.0418 234.7473 0.0938 318.6419 0.1131 14.4515 9.7191 0.8621 340.4012 -1.4836 -29.8841
28 -0.1344 -0.1085 -0.1356 -0.1423 -0.1333 216.3973 0.0961 319.1381 0.1186 14.5092 9.6547 0.8689 339.3932 -1.3819 -30.2772
29 -0.1333 -0.1096 -0.1379 -0.1401 -0.1299 228.1753 0.0949 319.0668 0.1118 14.5487 9.4072 0.8791 349.1621 -1.4034 -30.2771
ave -0.0915 -0.0531 -0.0994 -0.1276 -0.1107 234.2106 0.0871 256.6603 0.1299 14.7284 9.9993 0.8497 323.4015 -1.6249 -21.0551
std dev 0.09605 0.1480 0.0678 0.0711 0.0757 12.6797 0.0045 37.6764 0.0192 0.6633 0.6847 0.0474 15.3691 0.4011 6.6918
In simple linear regression, Apol is the highest collinear descriptor (r2 = 0.3119) for mutagenic
potency, followed by the Jurs descriptors. Although this result is similar to that obtained for MV, the
QSAR of MG is much cleared than for the other strains. As may be observed from Table 2, MG
provides a better result statistically than either MV (equation 2) or MF (equation 4), and only five
independent variables were needed to derive the QSAR equation. The QSAR equation for MG was
derived using the same statistical threshold and methods as for MV, and is presented below.
Int. J. Mol. Sci. 2006, 7
565
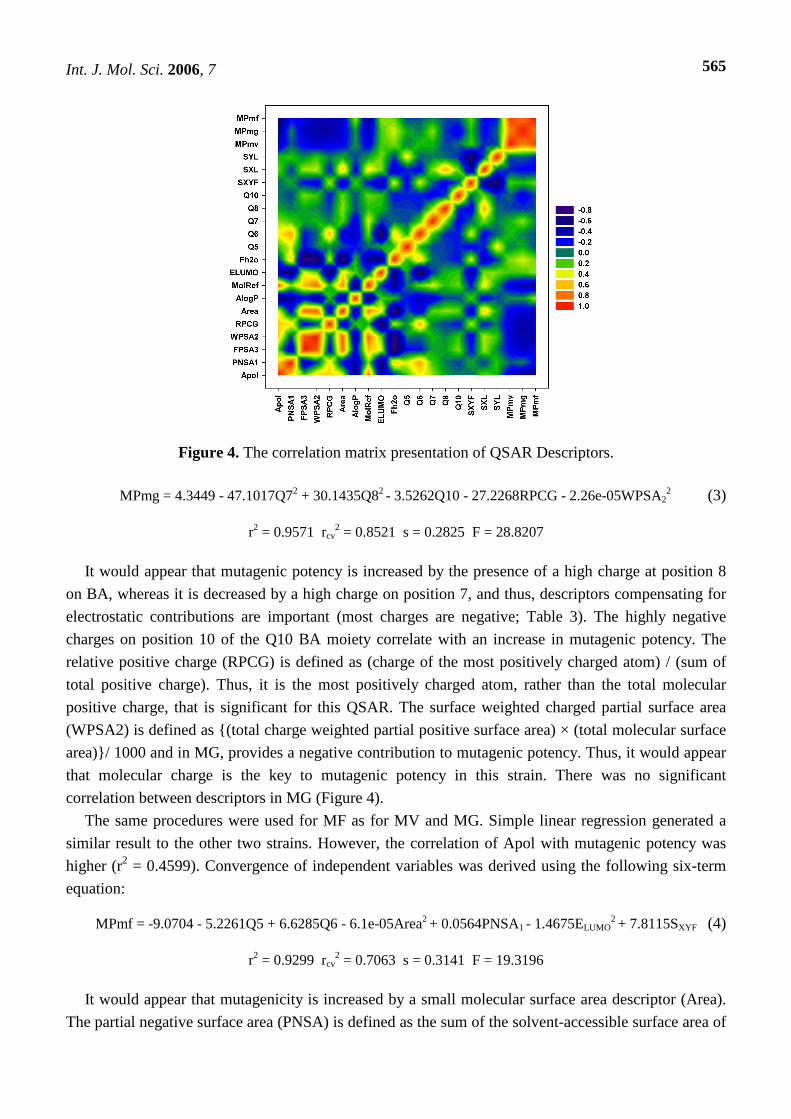
Figure 4. The correlation matrix presentation of QSAR Descriptors.
MPmg = 4.3449 - 47.1017Q72 + 30.1435Q82 - 3.5262Q10 - 27.2268RPCG - 2.26e-05WPSA22 (3)
r2 = 0.9571 rcv2 = 0.8521 s = 0.2825 F = 28.8207
It would appear that mutagenic potency is increased by the presence of a high charge at position 8
on BA, whereas it is decreased by a high charge on position 7, and thus, descriptors compensating for
electrostatic contributions are important (most charges are negative; Table 3). The highly negative
charges on position 10 of the Q10 BA moiety correlate with an increase in mutagenic potency. The
relative positive charge (RPCG) is defined as (charge of the most positively charged atom) / (sum of
total positive charge). Thus, it is the most positively charged atom, rather than the total molecular
positive charge, that is significant for this QSAR. The surface weighted charged partial surface area
(WPSA2) is defined as {(total charge weighted partial positive surface area) × (total molecular surface
area)}/ 1000 and in MG, provides a negative contribution to mutagenic potency. Thus, it would appear
that molecular charge is the key to mutagenic potency in this strain. There was no significant
correlation between descriptors in MG (Figure 4).
The same procedures were used for MF as for MV and MG. Simple linear regression generated a
similar result to the other two strains. However, the correlation of Apol with mutagenic potency was
higher (r2 = 0.4599). Convergence of independent variables was derived using the following six-term
equation:
MPmf = -9.0704 - 5.2261Q5 + 6.6285Q6 - 6.1e-05Area2 + 0.0564PNSA1 - 1.4675ELUMO2 + 7.8115SXYF (4)
r2 = 0.9299 rcv2 = 0.7063 s = 0.3141 F = 19.3196
It would appear that mutagenicity is increased by a small molecular surface area descriptor (Area).
The partial negative surface area (PNSA) is defined as the sum of the solvent-accessible surface area of
Int. J. Mol. Sci. 2006, 7
566
all negatively charged atoms and negatively charged atoms on the molecule surface contribute
positively to its mutagenic potency. Mutagenic potency should be increased by a large negative charge
at position 5 and a positive charge at 6. SXYF contributes positively to mutagenic potential, and it is
defined as the fraction of the area of the molecular shadow in the XY plane, divided by the area of the
enclosing rectangle. Mutagenicity is increased by a decreasingly negative ELUMO, and this finding is in
agreement with the QSAR equation for MV.
It is clear that for simple linear regression, Apol is the most important single descriptor for all three
strains. However, it is not included in any of the QSAR equations, even though the MF QSAR equation
demonstrates a moderately high correlation (r2 = 0.4599). In contrast, Jurs descriptors contribute to all
three QSAR equations, although they were found second to Apol, indicating that they are collinear and
provide more sensitive and detailed information.
Many variables were considered and the strains exhibit similar and characteristic patterns of
behavior. The inclusion of a number of variables is indicative of the metabolic activation steps and
variety of biological factors that are required in order for BA derivatives to become mutagenic. An
important step in this process is the formation of BADE.
Outliers that have arisen through experimental or calculation errors may be removed in order to
improve the statistical results and reduce the number of QSAR descriptors. One outlier (compound 12)
is present in the MV data and following its removal, 28 training molecules remain and are described
using the QSAR equation (5):
MPmv (12) = 11.2179 - 0.6268(SYL - 9.8681)2 + 7.7959Q6 + 3.6549ELUMO - 784.9409FPSA32 (5)
r 2 = 0.9198 rcv2 = 0.7921 s = 0.3503 F = 18.4134
In compound 12, the residual of the predicted value is larger than for any other compound.
However, its mutagenic potency is still found to be higher than the other BA derivatives.
Compounds 10 and 25 are outliers in the MG strain and following their omission, statistical
evaluation indicates that a four-term equation satisfies the statistical criteria. Whereas the residual of
compound 10 is large, that of compound 25 is smaller that some non-outliers and as one would
generally expect outliers to have larger residuals than non-outliers, this result may seem surprising.
However, outliers were removed in order to obtain the best statistical result and accordingly, the
residuals of outliers can be smaller than those of non-outliers.
For MG, an offset quadratic function for Area was used and the four-term QSAR equation was
reduced to three terms, as follows:
MPmg (10 and 25) = 1.8198 + 0.0007(Area – 363.1170)2- 46.7597Q72 – 138.5346RPCG2 (6)
r2 = 0.9198 rcv2 = 0.8125 s = 0.2927 F = 25.0318
Thus, only three descriptors are needed for MPmg. The molecular surface area descriptor (Area)
describes the van der Waals area of a molecule. On average its value for the 29 compounds was
323.4018 and all values were smaller than 363.117. This implies that the smaller the value of Area, the
higher the mutagenic potency. Mutagenic potency is decreased by a high charge at position 7 on BA
and therefore, Q7 is an important descriptor in compensating for the electrostatic contribution.
Int. J. Mol. Sci. 2006, 7
567
Although RPCG is included in this equation, the outliers are primarily dependent upon the value of
Area. After elimination of outliers, the QSAR equation for MF may differ greatly. It is:
MPmf (4, 5, 16, 25, and 29) = 0.5236 + 0.0019(Area - 356.8530)2 + 0.0032Fh2o2 - 29.8473RPCG (7)
r2 = 0.9266 rcv2 = 0.8147 s = 0.3435 F = 17.6755
The major difference in this equation is that charges are no longer included. The average Area value
for the 29 compounds is 323.4018 and all values are less than 363.1170. Thus, it appears that a smaller
value of Area correlates to a higher mutagenic potency. The desolvation free energy for waterA (Fh2o)
descriptor appears to be discriminating in this strain. This term is not based on conformation, but on
the connectivity of the atoms and it is derived from the hydration shell model developed by Hopfinger
[48]. Since Fh2o is negative and is included in the QSAR equation as a quadratic, increasingly negative
values of this descriptor correspond to increased mutagenic potency. There are five outliers for this
strain but only compounds 4 and 16 exhibit large residuals. Area and Fh2o demonstrate collinearity (r =
0.840, Fig. 4) indicating that molecular surface area is a major factor for determining mutagenicity in
the MF strain.
Although there are a relatively large number (5; compounds 4, 5, 16, 25, and 29) of outliers, upon
their removal the QSAR equation satisfies statistical criteria. Equation 4 contained a number of
descriptors that resulted from the large number of outliers for this strain.
Acknowledgements
This work was supported by a grant from the KRIBB Research Initiative Program, Korea.
References
1. Anstead, G. M.; Kym, P. R. Benz[a]anthracene diols: Predicted carcinogenicity and structure-
estrogen receptor binding affinity relationships, Steroids 1995, 60, 383-394.
2. Ito, Y.; Ueda, N.; Maeda, S.; Murao, S. I.; Sugiyama, T.; Lee, H.; Harvey, R. G. Induction of
chromosomal aberrations in rat bone marrow cells and mutations in Salmonella typhimurium by
benz[a]anthracene derivatives, Mutation Res. 1988, 206, 55-63.
3. Wood, A. W.; Chang, R. L.; Levin, W. Mutagenicity of the enantiomers of the diastereomeric bay-
region benz(a)anthracene 3,4-diol-1,2-epoxides in bacterial and mammalian cells, Cancer Res.
1983, 43, 5821-5825.
4. Nordling, M. M.; Nygren, J.; Bergman, J.; Sundberg, K.; Rafter, J. J. Toxicological
characterization of a novel in vivo benzo[a]pyrene metabolite, 7-oxo-benz[d]anthracene-3,4-
dicarboxylic acid anhydride, Chem. Res. Toxicol. 2002, 15, 1274-1280.
5. Morreal, C. E.; Sinha, D. K.; Schneider, S. L. Antiestrogenic properties of substituted
benz[a]anthracene-3,9-diols, J. Med. Chem. 1982, 25, 323-326.
6. Nashed, N. T.; Balani, S. K.; Loncharich, R. J.; Sayer, J. M.; Shipley, D. Y.; Mohan, R. S.;
Whalen, D. L.; Jerina, D. M. Solvolysis of K-region arene oxides: Substituent effects on reactions
of benz[a]anthracene 5,6-oxide, J. Am. Chem. Soc. 1991, 113, 3910-3919.
Int. J. Mol. Sci. 2006, 7
568
7. Mushtaq, M.; Weems, H. B.; Yang, S. K. Metabolic and stereoselective formations of non-K-
region benz[a]anthracene 8,9- and 10,11-epoxides, Arch. Biochem. Biophys. 1986, 246, 478-487.
8. Urano, S.; Price, H. L.; Fetzer, S. M.; Briedis, A. V.; Milliman, A.; LeBreton, P. R. Photoemission
probes of hydrocarbon-DNA interactions: A comparison of DNA influences on the reactivities of
(±)-trans-7,8-dihydroxy-anti-9,10-epoxy-7,8,9,10-tetrahydrobenzo[a]pyrene, benzo[a]pyrene 4,5-
oxide, and benz[a]anthracene 5,6-oxide, J. Am. Chem. Soc. 1991, 113, 3881-3893.
9. Smithgall, T. E.; Harvey, R. G.; Penning, T. M. Oxidation of the trans-3,4-dihydrodiol metabolites
of the potent carcinogen 7,12-dimethylbenz(a)anthracene and other benz(a)anthracene derivatives
by 3α-hydroxysteroid-dihydrodiol dehydrogenase: Effects of methyl substitution on velocity and
stereochemical course of trans-dihydrodiol oxidation, Cancer Res. 1988, 48, 1227-1232.
10. Wettstein, J. G.; Chien, M. T.; Flesher, J. W. DNA binding and mutagenicity of 7-substituted
derivatives of benz[a]anthracene, Drug Chem. Toxicol. 1979, 2, 383-396.
11. Slaga, T. J.; Huberman, E.; Selkirk, J. K. Carcinogenicity and mutagenicity of benz(a)anthracene
diols and diol-epoxides, Cancer Res. 1978, 38, 1699-1704.
12. Booth, J.; Sims, P. Metabolism of benz[a]anthracene epoxides by rat liver, Biochem. Pharm. 1974,
23, 2547-2555.
13. Roe, F. J.; Dipple, A.; Mitchley, B. C. Carcinogenic activity of some benz(a)anthracene derivatives
in newborn mice, Br. J. Cancer 1972, 26, 461-465.
14. Pataki, J.; Huggins, C. Molecular site of substituents of benz(a)anthracene related to
carcinogenicity, Cancer Res. 1969, 29, 506-509.
15. Boyland, E.; Sims, P. The carcinogenic activities in mice of compounds related to
benz[a]anthracene, Int. J. Cancer 1967, 2, 500-504.
16. Stevenson, J. L.; Von Haam, E. Carcinogenicity of benzo(a)anthracene and benz(c)phenanthrene
derivatives, Am. Ind. Hygiene Ass. J. 1965, 26, 475-478.
17. Aoki, T.; Ohshima, S.; Sakamoto, Y. Structure-carcinogenicity studies for Benz[a]anthracenes
by13C NMR spectroscopy and molecular orbital calculation, Polycyclic Aromatic Compounds
1996, 11, 245-252.
18. Cajthaml, T.; Erbanova, P.; Sasek, V.; Moeder, M. Breakdown products on metabolic pathway of
degradation of benz[a]anthracene by a ligninolytic fungus, Chemosphere 2006, 64, 560-564.
19. Moody, J. D.; Freeman, J. P.; Cerniglia, C. E. Degradation of benz[a]anthracene by Mycobacterium
vanbaalenii strain PYR-1, Biodegrad. 2005, 16, 513-526.
20. Schneider, J., Grosser, R., Jayasimhulu, K., Xue, W., Warshawsky, D. Degradation of pyrene,
benz[a]anthracene, and benzo[a]pyrene by Mycobacterium sp. strain RJGII-135, isolated from a
former coal gasification site, Appl. Env. Microbiol. 1996, 62, 13-19.
21. Juhasz, A. L.; Britz, M. L.; Stanley, G. A. Degradation of fluoranthene, pyrene, benz[a]anthracene
and dibenz[a,h]anthracene by Burkholderia cepacia, J. Appl. Microbiol. 1997, 83, 189-198.
22. Veille, M.; Kuroki, T.; Sims, P. Mutagenicity of isomeric diol-epoxides of benzo[a]pyrene and
benz[a]anthracene in S. typhimurium TA98 and TA100 and in V79 Chinese hamster cells,
Mutation Res. 1977, 44, 313-325.
Int. J. Mol. Sci. 2006, 7
569
23. Malaveille, C.; Bartsch, H.; Grover, P. L.; Sims, P. Mutagenicity of non K region diols and diol
epoxides of benz(a)anthracene and benzo(a)pyrene in S. typhimurium TA 100, Biochem. Biophy.
Res. Comm. 1975, 66, 693-700.
24. Boyle, S. P.; Craft, J. A. Gender-specific metabolism of benz[a]anthracene in hepatic microsomes
from Long-Evans and Hooded Lister rats, Chem.-Biol. Interact. 2000, 125, 209-220.
25. McCord, A.; Boyle, S. P.; Knowler, J. T.; Burnett, A. K.; Craft, J. A. Metabolism of
benz[a]anthracene by human bone marrow in vitro, Chem.-Biol. Interact. 1996, 99, 29-40.
26. Sahali, Y.; Kidd La, C. R.; Skipper, P. L.; Tannenbaum, S. R. Metabolism of benz[a]anthracene by
human liver microsomes, Cancer Lett. 1994, 83, 299-303.
27. Cerniglia, C. E.; Gibson, D. T.; Dodge, R. H. Metabolism of benz[a]anthracene by the filamentous
fungus Cunninghamella elegans, Appl. Environ. Microbiol. 1994, 60, 3931-3938.
28. Sims, P.; Grover, P. L.; Kuroki, T.; Huberman, E.; Marquardt, H.; Selkirk, J. K.; Heidelberger, C.
The metabolism of benz(a)anthracene and dibenz(a,h)anthracene and their related "K-region"
epoxides, cis-dihydrodiols and phenols by hamster embryo cells, Biochem. Pharm. 1973, 22, 1-8.
29. Geancintov, N. E.; Cosman, M.; Hingerty, B. E.; Amin, S.; Broyde, S.; Patel, D. J. NMR solution
structures of stereoisomeric covalent polycyclic aromatic carcinogen-DNA adducts: Principles,
patterns, and diversity, Chem. Res. Toxicol. 1997, 10, 111-146.
30. Heidelberger, C. Chemical oncogenesis in culture, Advan. Cancer. Res. 1973, 18, 317-366.
31. Glatt, H.; Vogel, K.; Bentley, P. Large differences in metabolic activation and inactivation of
chemically closely related compounds: Effects of pure enzymes end enzyme induction on the
mutagenicity of the twelve monomethylated benz[a]anthracenes, 7,12-dimethylbenz[a]anthracene
and benz[a]anthracene in the Ames test, Carcinogenesis 1981, 2, 813-821.
32. Coombs, M. M.; Dixon, C.; Kissonerghis, A. M. Evaluation of the mutagenicity of compounds of
known carcinogenicity, belonging to the benz[a]anthracene, chrysene, and
cyclopenta[a]phenanthrene series, using Ames's test, Cancer Res. 1976, 36, 4525-4529.
33. Norpoth, K.; Kemena, A.; Jacob, J.; Schumann, C. The influence of 18 environmentally relevant
polycyclic aromatic hydrocarbons and Clophen A50, as liver monooxygenase inducers, on the
mutagenic activity of benz[a]anthracene in the Ames test, Carcinogenesis 1984, 5, 747-752.
34. MacNicoll, A. D.; Cooper, C. S.; Ribeiro, O. The metabolic activation of benz[a]anthracene in
three biological systems, Cancer Lett. 1981, 11, 243-249.
35. Seike, K.; Murata, M.; Oikawa, S.; Hiraku, Y.; Hirakawa, K.; Kawanishi, S. Oxidative DNA
Damage Induced by Benz[a]anthracene Metabolites via Redox Cycles of Quinone and Unique
Non-Quinone, Chem. Res. Toxicol. 2003, 16, 1470-1476.
36. Devillers, J. Genetic algorithms in molecular modeling, Academic Press, 1996.
37. Rogers, D.; Hopfinger, A. J. Application of genetic function approximation to quantitative
structure-activity relationships and quantitative structure-property relationships, J. Chem. Inf.
Comput. Sci. 1994, 34, 854-866.
38. Holland, J. Adaptation in artificial and natural systems, University of Michigan Press, 1975.
39. Friedman, J. Multivariate adaptive regression splines, Technical Report 102, Laboratory for
Computational Statistics, Department of Statistics, Stanford University; Stanford, CA, 1988;
revised 1990.
Int. J. Mol. Sci. 2006, 7
570
40. Myers, L. E.; Sexton, N. H.; Southerland, L. I.; Wolff, T. J. Regression analysis of Ames test
data, Environ. Mutagen. 1981, 3, 575-586.
41. Smith, C. J.; Hansch, C.; Morton, M. J. QSAR treatment of multiple toxicities: the mutagenicity
and cytotoxicity of quinolines, Mutation Res. 1997, 379, 167-175.
42. Cerius2, Version 3.5; Molecular Simulations Inc., San Diego, CA.
43. Rappé, A. K.; Casewit, C. J.; Colwell, K. S.; Goddard, W. A.; Skiff, W. M. UFF, a full periodic
table force field for molecular mechanics and molecular dynamics simulations, J. Am. Chem. Soc.
1992, 114, 10024-10035.
44. Rappé, K.; Goddard III, W. A. Charge equilibration for molecular dynamics simulation, J. Phys.
Chem. 1991, 95, 3358-3363.
45. Hansch, C.; Fujita, T. ρ-σ-π analysis. A method for the correlation of biological activity and
chemical structure, J. Am. Chem. Soc. 1964, 86, 1616-1626.
46. Kubinyi, H. QSAR: Hansch analysis and related approaches, VCH, 1993.
47. Stanton, T.; Jurs, P. C. Development and use of charged partial surface area structural descripters in
computer-assisted quantitative structure-property relationship studies, Anal. Chem. 1990, 62, 2323-
2329.
48. Ghose, A.; Crippen, G. Atomic physicochemical parameters for three-dimensional structure
directed quantitative structure-activity relationships I. Partition coefficients as a measure of
hydrophobicity, J. Comp. Chem. 1986, 7, 565-577.
49. Hopfinger, J. Polymer-Solvent Interactions for Homopolypeptides in Aqueous Solution,
Macromolecules 1971, 4, 731-737.
© 2006 by MDPI (http://www.mdpi.org). Reproduction is permitted for noncommercial purposes.