the quarterly journal of the international union for housing finance … - housing... · the...
TRANSCRIPT

HOUSING FINANCE INTERNATIONAL
Subprime Crisis & Emerging Markets
Structured Financing & Affordable Rental Housing in Austria
Mortgage Registration & Foreclosure Around the Globe
Housing Microfinance Feasibility Analysis
Solar Energy for Social Housing in Pakistan
Impact of the Subprime Crisis on South African Housing Finance
The Quarterly Journal of the International Union for Housing Finance
June 2009


June 2009 HOUSING FINANCE INTERNATIONAL 3
International Union for Housing Finance
Housing Finance International
JUNE 2009
Contents: 4 . . . . . . . . Editor’s Introduction
5 . . . . . . . . The Subprime Crisis: Implications for Emerging Markets William B. Gwinner and Anthony Sanders
14 . . . . . . Structured Finance Allows for Affordable Rental Housing in Austria Wolfgang Amann, Julie Lawson and Alexis Mundt
19 . . . . . . Mortgage Registration and Foreclosure around the Globe: Evidence from 42 Countries Stephen Butler, Mariya Kravkova and Mehnaz Safavian
30 . . . . . . Housing Microfinance Feasibility Analysis Brendan Ahern
41 . . . . . . Solar for Social Housing: Elaborated using Pakistan’s Case Zaigham Mahmood Rizvi
44 . . . . . . The Impact of the Subprime Mortgage Financial Crisis on Housing Finance in South Africa Tumellano Sebehela
IUHF OFFICERS:
President: CAS COOVADIA, South Africa
First Deputy President: KHAN PRACHUABMOH, Thailand
Deputy Presidents: RENU SUD KARNAD, India
ADRIAN COLES, United Kingdom
ALEX J. POLLOCK, United States of America
DOUG DUNCAN, United States of America
Publisher: ANNIK LAMBERT
Editor: FRIEDEMANN ROY
Other Executive Committee Members: CHARALAMBOS SHAMBARTAS, Cyprus NIELS TORSLEV, Denmark PEKKA AVERIO, Finland ANDREAS J. ZEHNDER, Germany KAPIL WADHAWAN, India EARL JARRETT, Jamaica, West Indies HERBERT PFEIFFER, Slovakia SOULA PROXENOS, South Africa MATTHEW BULLOCK, United Kingdom MICHAEL LEA, United States of America LOÏC CHIQUIER, United States of America
Secretary General: Annik Lambert, E-mail: [email protected]
Head of Administration: Daniel Bradley, E-mail: [email protected]
ISSN: 1534-8784
Subscriptions:Regular Annual Rate €120; three-Year discounted rate €245. For further details, please contact Daniel Bradley ([email protected])
International Union for Housing Finance
Avenue de Cortenbergh 71, B-1000 Brussels - BelgiumTel: +32 2 285 40 30 Fax: +32 2 285 40 31 www.housingfinance.orgSecretary General - Annik Lambert
Copyright © 2009 International Union for Housing Finance
Housing Finance International is published four times a year by the International Union for Housing Finance (IUHF). The views expressed by authors are their own and do not necessarily represent those of the Editor or of the International Union.

Editor’s Introduction By Friedemann Roy
Editor’s Introduction
Is the crisis bottoming out? If we believe in the recent economic data, it appears that we can at least observe a slowing-down of the contraction. In the US, lending for housing has increased, al-though most of it is linked to refinancing existing debt thanks to interest rates of about five percent for 30-year fixed rate mortgages.1
This edition of the HFI looks at various topics. On the one hand, it provides further insight into the reasons for the global financial crisis and on studies concerning the housing finance systems that appear to have performed better during the last 18 months. On the other hand, it analyses the regulatory regimes of 42 nations and evaluates the still un-tapped potential of housing microfinance in many countries.
Our first article is by William B. Gwinner and Anthony Sanders. In their article, they discuss some of the key characteristics of the US’ sub-prime mortgage boom and bust, and contrast them with the characteristics of emerging mor-tgage markets, and make recommendations for emerging market policy makers. The cur-rent crisis has raised questions in the minds of many as to the wisdom of extending mortgage lending to low- and moderate-income house-holds. According to the authors, it is important to note that prior to the growth of subprime lending in the 1990s, US mortgage markets already reached low- and moderate-income households without taking large risks or suffe-ring large losses. In contrast, in most emerging markets, mortgage finance is a luxury product, restricted to upper-income households. As po-licy makers in emerging markets seek to move lenders downmarket, they should adopt policies that include a variety of financing methods and should allow for rental or purchase as a func-tion of the financial capacity of the household. In this context, they believe that securitisation remains a useful tool when developed in the context of well-aligned incentives and over-sight. It is possible to extend mortgage lending downmarket without repeating the mistakes of the subprime boom and bust.
The authors of the second article are Wolfgang Amann, Julie Lawson and Alexis Mundt. They analyse the social and economic outcomes of Austria’s long-term commitment to the supply of affordable rental housing. In their view, the Austrian policy differs from many other European countries that have increasingly come to rely
on demand assistance and home ownership to address their housing concerns. In their article, they outline the key characteristics of Austria’s housing policy, with its focus on regulated limited profit cost rent housing and its layered financing arrangements. They identify core features of what is often referred to as structured financing in commercial markets and explore the various instruments that are being applied in raising fi-nancial sources for social housing construction in Austria. They conclude that the efficiency of social housing finance in Austria may serve as a role model for countries seeking to reform, reinvigorate or establish new social housing sys-tems, such as those in transition with a deficit of affordable rental housing.
Our third article by Stephen Butler, Mariya Kravkova and Mehnaz Safavian benchmarks regulatory efficiency in the registration of a mortgage and title transfer, and in foreclosure in 42 countries. Using a methodology modelled on the World Bank Doing Business indicators that allow for comparisons across countries and over time, the study investigates the time and cost required to comply with regulation. It creates indices on the efficiency of the registra-tion system and the degree to which notaries are involved in the process of registering a mor-tgage and title transfer. To identify features of registration and foreclosure systems that may foster housing finance, the study links these indicators to the size of mortgage markets. It also documents and analyses recent reforms in order to highlight the benefits of regulatory improvements for developing home ownership.
Brendan Ahern is the author of our fourth ar-ticle. He assesses the potential of housing microfinance in emerging markets. With nearly a seventh of the world’s population currently living in slum conditions and an even greater number of people unable to afford conventio-nal housing finance, the demand for alternative housing finance is enormous. Housing micro-finance represents a market-based solution capable of expanding beyond its current scale. The purpose of Mr. Ahern’s article is therefore to determine which developing countries exhibit both strong demand for housing microfinance and the proper conditions for the expansion of the housing microfinance sector.
Our next article is written by Zaigham Mahmood Rizvi. He evaluates the potential of solar energy
to provide low- and middle-income households with electricity, thereby helping to improve their living conditions. High energy prices are often due to a lack of supply from the national grid and/or rising fuel prices (that is of the fuel used to generate electricity in cases where no traditional electricity provider is accessible). In his article, Mr. Rizvi refers to the situation and experiences in Pakistan, even though such scenarios are similar in other developing and under-developed countries.
The author of our last article is Tumellano Sebehela. He analyses the impact of the glo-bal financial crisis on the South African housing finance market in view of studies focussing on property price crisis. His review of such litera-ture has a major focus on Asian markets.
As always, I hope that you will enjoy reading these articles. Please do not hesitate to let me have your comments on them or recommendations for fu-ture articles - they are more than welcome!
Friedemann Roy
1 See Financial Times, “Lower rates fuel mortgage boom”, Thursday, May 14, 2009.
4 HOUSING FINANCE INTERNATIONAL June 2009

The Subprime Crisis: Implications for Emerging Markets1
By William B. Gwinner 2 and Anthony Sanders 3
The Subprime Crisis: Implications for Emerging Markets
This paper discusses some of the key charac-teristics of the US subprime mortgage boom and bust, contrasts them with characteristics of emerging mortgage markets, and makes recommendations for emerging market po-licy makers. The crisis has raised questions in the minds of many as to the wisdom of extending mortgage lending to low- and mode-rate-income households. It is important to note, however, that prior to the growth of subprime lending in the 1990s, US mortgage markets already reached low- and moderate-income households without taking large risks or suffe-ring large losses. In contrast, in most emerging markets, mortgage finance is a luxury good, restricted to upper-income households. As po-licy makers in emerging markets seek to move lenders downmarket, they should adopt policies that include a variety of financing methods and should allow for rental or purchase as a func-tion of the financial capacity of the household. Securitisation remains a useful tool when deve-loped in the context of well-aligned incentives and oversight. It is possible to extend mortgage lending downmarket without repeating the mis-takes of the subprime boom and bust.
1. Weakened Lending Practices – Betting on the Collateral Rather than the Borrower
Ten years of ballooning property prices led to excessive optimism by investors and lenders. In the US, depending on the index employed, national average house prices rose between 53% and 86% between the mid-1990s and 2006.4 At the same time, mortgage originations rose by five times, peaking at $3.9 trillion in
2003 (Chart 1). Markets such as those of Los Angeles and New York have strongly outper-formed the national average and many other cities. National indexes for real rents and house prices largely moved together until 2000, when they diverged, and real house prices moved to a level 70% higher than that of real rents. Later, as the property balloon deflated in 2006 and 2007, rising subprime defaults spurred a re-evaluation of credit spreads and credit mar-ket conditions that reflected broader and more fundamental issues.5 Apparently, individuals viewed real estate as a foolproof investment opportunity until they decided that it was not, at which point prices began to decline (André, et al., 2006, Shiller, 2007).
Subprime lending drove house price increases in some areas. Banks and investors act pro-cyclically, extending credit more aggressively and competing for market share as collate-ral prices rise, when lending decisions seem less risky. Real estate cycles are lengthened by investor optimism during a boom and pes-simism following its exhaustion. The current credit crunch is emblematic, with liquidity drying up and spreads widening dramatically on high quality prime mortgage-backed pa-per even though it continues to perform well. Booming real estate lending carries acce-lerator effects and its cessation in a bust contributes to a more rapid slowdown. Mian and Sufi (2008) show that mortgage credit un-
1 This paper benefitted from comments by Roberto Rocha, Bertrand Renaud, Michael Lea, Simon Walley, Roger Blood and Loic Chiquier, for which the authors are grate-ful. All errors remain the responsibility of the authors.
2 Mr. Gwinner works at the IFC as Principal Housing Finance Specialist and is based in Lima (Peru). Mr. Anthony Saunders is Professor of Finance and Real Estate at the W.P. Carey College of Business of Arizona State University in the United States.
3 The Findings, interpretations, statements and conclusions expressed herein are those of the authors alone and do not necessarily reflect the views of the International Bank for Reconstruction and Development/The World Bank and its affiliated organizations, or those of the Executive Directors of The World Bank or the Arizona State University.
4 Shiller uses the Case-Shiller house price index, a repeat-sales index that samples properties from twenty metropolitan areas in the country, excluding several states. André, et al. use the OFHEO house price index, which excludes higher priced pro-perties, and samples from a much larger number of metropolitan areas. (Leventis, 2007).
5 The economic stability in Europe and the US since the mid-1980s (falling GDP vo-latility, low inflation) has been termed the “great moderation.” It has been blamed in part for lowered credit risk spreads and persistent search for yield on the part of investors. (Bernanke 2004, Stock and Watson 2003).
June 2009 HOUSING FINANCE INTERNATIONAL 5
Chart 1 House Prices and Mortgage Originations
Dolla
rs in
Mill
ions
S&P/
Case
-Shi
ller N
atio
nal H
ouse
Pric
e In
dex
Sources: S&P Case-Shiller, Inside Mortgage Finance
Total Mortgage Originations(Right Hand Scale)
House Prices(Left Hand Scale)
FHA/VA
Subprime
50
1990 1991 1992 1993 1994 1995 1996 1997 1998 1999 2000 2001 2002 2003 2004 2005 2006 2007
70
90
130
150
170
190
4,500
4,000
3,500
3,000
2,500
2,000
1,500
1,000
500
0
110

derwriting standards were relaxed from 2001 to 2005 in neighbourhoods or zip/post codes with large numbers of high-risk borrowers and negative relative income and employment growth. Relaxed standards were associated with increased mortgage lending, rising house prices and a subsequent increase in defaults.
The primary cause of subprime ARM defaults has been weak underwriting in large part by non-bank lenders. Between 40% and 50% of subprime loans were made by independent non-bank lenders between 2004 and 2006 (Avery, et al 2007). Non-bank lenders such as New Century Financial aggressively pursued the “originate to distribute business model”, where it originated loans for sale to the capital markets. Founded in 1995, by the end of 2006 New Century was the third largest subprime lender in the country, with loan production that year of $51.6 billion. New Century filed for bankruptcy protection in April 2007, primarily as a result of insufficient capital to satisfy demands from investors to repurchase defaulted and deficient mortgages. According to the bankruptcy court examiner, New Century had a “brazen obsession with increasing loan originations without due regard to the risks asso-ciated with that business strategy.” The primary consideration for loan quality was the ability to sell in the secondary market. More than 70% of loans originated by the company had low initial teaser rates and 40% were underwritten on a stated income basis. New Century made fre-quent exceptions to its underwriting guidelines for borrowers who might not otherwise qualify for a loan. Early payment defaults, a sure sign of weak underwriting, rose from 4.38% of loans made in 2003 to 13.1% of loans in early 20076
(Missal, 2008).
Alternative mortgage designs can be dan-gerous to the financial system. Subprime borrowers - those with poor credit records, a history of bankruptcy, or who are over-extended on their credit - often selected mortgage pro-ducts that are not typical of prime borrowers who have stronger credit records. Prime bor-rowers typically choose standard, long-term, fixed-rate mortgages and make a down pay-ment of 20% or more. Historically, roughly 80% of prime originations have been fixed-rate in any given year and about 20% have been ARMs. Subprime borrowers often made low down payments (between zero and 10%) and chose riskier loan products, including:
“option” mortgages, which allow borrowers to defer some of their payments but which also result in increasing loan balances, also known as negative amortization mortgages;
“convertible” mortgages, which start with fixed rates, then convert to adjustable rates at a pre-specified reset date; and
“low or no documentation” mortgages, where the borrower provides no or minimal documentation on employment, income, etc.
Given the recent failure of IndyMac, an Alt-A lender in Southern California, increased at-tention is likely to be given to Alt-A, low or no documentation lending since these are inhe-rently risky and susceptible to downturns in national and local housing markets.7
Geographic concentration of subprime len-ding has increased loss severity. Agarwal, et al (2008) find that subprime loans tend to be concentrated geographically. In their study of the Phoenix, Arizona area, they find that subprime loans are found in primarily older neighbourhoods in the inner city. As foreclo-sures surge in these older neighbourhoods, they find that house prices decline more than in neighbourhoods (or zip/post codes) with higher concentrations of prime loans. Thus, it is important to understand that high-risk len-ding in geographically concentrated areas can result in “default cascades” where the decline in property value can contribute to the decline in neighbouring property values and increasing loss severities in these neighbourhoods.
Higher LTV and debt-to-income (DTI) ratios were accepted for both prime and subprime loans. LTVs rose in two respects: 1) higher LTVs accepted at purchase, and 2) equity extracted by refinancing an appreciated house. Mian and Sufi (2008) found that LTVs and DTI ratios rose substantially in the early 2000s. Foote, et al (2008) found that in New England, for bor-rowers with FICO scores less than 6208, LTV ratios on purchase and refinance loans rose from 82% in 1999 and 2000 to 92% in 2005 and 2006. DTIs for similar borrowers rose from 36% in 1999-2000 to 43% in 2005-2006. For high FICO scores, average LTVs rose to almost 95% and DTIs rose from 36% to 42%.
Many foreclosed borrowers put little mo-ney down and had lived for a short time in
their homes. Foote, et al (2008) report that in New England in 2007, 40% of foreclosures were of mortgages with zero down payments and that 40% had owned their homes for less than three years. Since in Massachusetts, fo-reclosure usually takes six months or more, most recent foreclosed borrowers spent little time in their homes before financial pro-blems occurred. In the current downturn in New England, house prices have fallen 12% between the first quarter of 2006 and the first quarter of 2008. During this period, unemploy-ment has fallen 0.4%, so financial pressure on owners remains muted.
The extension of subprime lending was supported in part by the increased use of credit scores without adjusting models and assumptions to reflect changing market conditions. Econometric models permit len-ders to adjust the price of loans to reflect the expected and unexpected risk of making loans to lower and moderate income borrowers. Improved risk-based pricing has been a boon to the financial industry overall and reflects industry best practice for financial risk ma-nagement. However, in the case of subprime lending, default models have not kept up with the evolving market and so subprime default rates have surprised investors and lenders. The models particularly seemed to have missed the growing likelihood of default that resul-ted from the rise in interest rates that began in 2005, the slowdown in house price appre-ciation that started in some markets in 2005 and gained momentum in 2006 and 2007, and loosened underwriting standards (Jaffee 2008, President’s Working Group 2008).
2. The Subprime Boom and Access to Finance
US Housing Finance Priorities
Before subprime lending grew, US mortgage lenders reached the majority of households and the overall housing system delivered high quality shelter to 98% of households. Economic growth, a relatively elastic supply of land and the public and private financial institutions created during the 1930s laid the foundation for a market that delivers high qua-lity shelter to more than 98% of households. When the New Deal housing finance institu-
The Subprime Crisis: Implications for Emerging Markets
6 An early payment default is defined as a default on a loan in any of the first three months of its life.
7 Alt-A loans are extended to borrowers whose credit scores fall short of prime but are believed to be above levels associated with subprime lending.
8 A credit score, in the US, is a number representing the creditworthiness of a per-son, or the likelihood that person will pay his or her debts. It has shown to be very predictive of risk, made credit more widely available to consumers and lowered the cost of providing credit. A credit score is primarily based on a statistical analysis of
a person’s credit report information, typically from the three major American credit bureaus: Equifax, Experian, and TransUnion. Lenders, such as banks and credit card companies, use credit scores to evaluate the potential risk posed by lending money to consumers and to mitigate losses due to bad debt. Using credit scores, lenders determine who qualifies for a loan, at what interest rate, and to what credit limits. The Fair Isaac Corporation, known as FICO, created the first credit scoring system in 1958, for American Investments, and the first credit scoring system for a bank credit card in 1970, for American Bank and Trust (from Wikipedia).
6 HOUSING FINANCE INTERNATIONAL June 2009

The Subprime Crisis: Implications for Emerging Markets
9 These institutions included the Federal Housing Administration (FHA), Fannie Mae, the Federal Home Loan Banks, and the Federal Savings and Loan Insurance Corpo-ration. In the 1930s and 1940s, the FHA played a central role in improving quality by setting minimum construction standards for the houses that collateralized mor-tgages that it insured.
10 Conventional signifies loans that carry neither FHA credit insurance nor a VA guarantee.11 A VA Loan is a home loan mortgage that is made available to Veterans by the
Veterans Administration (VA). The VA does not actually fund the loan, they simply guarantee the loan for the investors. The VA will guarantee a loan up to $203,000 for eligible veterans. Eligible Veterans are Army, Navy, Air Force, Marine Corps, or Coast Guard members, eligible Reservists of Army, Navy, Air Force, Marine Corps, and Coast Guard Reserves as well as Army National Guard and Air National Guard, unmarried Surviving Spouse of a Veteran as well as eligible individuals with ser-vice as members in certain organisations, such as Public Health Service officers, cadets/midshipmen at service academies, officers of National Oceanic and Atmos-
pheric Administration, merchant seamen with WWII service, and others and quali-fied individuals whom are purchasing a VA foreclosed home (from the VA website).
12 Sources: HMDA data, author calculation, and Census (2008).13 Access to ownership of a high quality, single family stand-alone house is a central
focus of the US housing policy dialogue. Since almost the entire housing stock meets construction standards, the driving determinants of ownership are the cost of urban land, required down payment, and the cost of financing.
14 Federal tax exemptions are available only to taxpayers who file itemized returns, where they itemize, or list separate deductions to reduce the tax paid. These include mor-tgage interest paid, moving expenses, medical expenses, charitable contributions and a host of other expenses. To make itemization worthwhile, the reduction in taxes has to compensate for the extra effort of filing a more complicated itemized return. In 2005, 35.5% of taxpayers itemized and 11.8% of these earned less than the median house-hold income. Interest paid on mortgages represented one of the largest categories of exemptions, 32.8% of total deductions taken (IRS, 2007).
June 2009 HOUSING FINANCE INTERNATIONAL 7
tions were created in the 1930s,9 much of the housing stock was substandard, with one-third of housing units lacking sewage attachments and 20% overcrowded. By 2000, only 1.1% of the US housing stock lacked sewage hook-ups, even though 9.8% of households lived in poverty (Census, 2006). Access to financial ser-vices is widespread; between 85% and 90% of households have bank accounts; the majority of unbanked households are recent immigrants (Barr 2001, Caskey, et al 2006). In recent years, about 40% of conventional10 mortgages were made to households earning less than the median household income, 64% of FHA or VA-insured11 loans were made to households earning less than the median, and overall, half of homeowners earn less than the median.12
US housing policy has prioritized access to owner-occupied housing by increasing the supply of finance and by providing tax sub-sidies.13 New Deal housing finance institutions such as FHA and Fannie Mae are predominately oriented to increasing and stabilising financing for owner-occupied single-family homes, origi-nally by providing long-term mortgages. Home ownership is further subsidised by tax bene-fits. These policies, along with the post-World War II economic boom, succeeded in spurring homeownership and housing quality. Garriga, et al., (2007) estimate that about half of the increase in home ownership during the 1950s and 1960s can be explained by the introduction of the 30 year fixed-rate mortgage and that the more recent increase can be attributed to the acceptance of smaller down payments. The home ownership rate rose from 43.6% in 1940 to 61.9% in 1960, and peaked at 69.1% in the first quarter of 2005.
U.S. tax subsidies for home ownership are regressive, particularly in comparison to rental subsidies. Given the progressivity of the Federal income tax, mortgage deductions have no value for low-income households and little value to moderate-income owners.14 In 2005, the total mortgage interest tax de-duction claimed amounted to US$340.5 billion (IRS, 2007a). By contrast, the ma-
jor tax subsidy that supports the creation of new low-cost rental units, the Low Income Housing Tax Credit (LIHTC) cost the govern-ment about US$5.1 billion in tax expenditures in 2007 (NLIHC, 2008). While almost 50% of homeowner households earn less than the median income, 80% of renter households earn less than the median (Census, 2006).
The Links Between Subprime Lending and Access to Finance
Subprime lending has provided only limited access to finance. More than half of sub-prime loans have been for refinancing existing mortgages rather than purchasing a house (Chart 2). In the US, individuals frequently re-place existing fixed-rate mortgages with new ones to take advantage of declines in market rates or to extract equity from the house by refinancing at a higher LTV. Many subprime borrowers refinanced to pay off riskier ARM loans before they reached the end of their low teaser interest rate period. As such, refinan-cing represents no new access to finance.
3. Weaknesses in Secondary Market Practices
Between 2001 and 2006, between 60% and 80% of subprime loans were bundled into mor-tgage-backed securities and sold to investors in capital markets (Inside Mortgage Finance, 2008). Securitisation in the US has clear bene-fits because it taps the bond market, which is less expensive on a risk-adjusted basis than funding with deposits. Securitisation permits banks more flexibility in managing capital al-location as they are able to monetise long maturity assets and sell credit risk to the ca-pital market.
Increased Moral Hazard Problems
Securitisation comes at a cost, which is that there is a risk of moral hazard. Lenders that originate then sell the loans to another party (investors) have incentives to originate and sell loans that are riskier than they would originate if they had to hold them in their portfolios. For securitisation to work properly there must be a means to control moral hazard. This could be
Chart 2
2005 2006
Most Subprime Lending for Refinancing
Source: Inside Mortgage Finance, Center For Responsible Lending
Perc
ent o
f Tot
al S
ubpr
ime
Lend
ing
1998
0
10
20
30
40
50
60
70
80
90
100
1999 2000 2001 20032002 2004
Refinance
Purchase

The Subprime Crisis: Implications for Emerging Markets
8 HOUSING FINANCE INTERNATIONAL June 2009
through a third party agent, such as a credit rating agency (CRA) or through a contractual arrangement, such as requiring lenders that sell portfolios to retain capital against the performance of the portfolio, or to retain a subordinated portion of the security that is eventually issued. When the moral hazard pro-blem is not controlled and defaults rise above what has been expected, investors are exposed to additional unexpected risks.
The basic structure of the US residential mor-tgage securitisation market is found in Figure 1. A lender makes the loan to a borrower then sells the loan to a third party (aggregator) that bundles it with other mortgages and issue bonds based on the cash flow of the portfo-lio. Federal government sponsored enterprises (Fannie Mae, Freddie Mac) buy most confor-ming loans (loan amount of $350,000 and excellent borrower credit). Investment banks buy loans over the conforming limit (jumbo loans) and they buy credit impaired or subprime mortgages. The jumbo and subprime markets together are termed the “private label” or non-agency market.15 The investment bank bundles the loans into a pool and then underwrites the pool and sells bonds (or tranches) based on the pool to investors. At each point in the process, the investor is relying on the underwriters to have properly underwritten the loans and the pool of loans. Given that the lender has the option to retain loans for the bank’s portfolio, one must consider whether the lender has sold the lower quality loans to investors through the securitisation markets. In other words, did the lender sell its “lemons” to investors?16
Market disclosures and contractual constraints failed to prevent weak practices in subprime underwriting. Contractual representations and warranties in securitisation documents require that the loan originator repurchase or make whole the investor for mortgage loans that were not made according to what was promised by the lender. That is, if investors (or another party) discover that the loans were inappropriate or that underwriting was not sufficient, the inves-tors can require that the lender repurchase the tainted loans. Typically, the offering memoran-dum for a subprime asset-backed security deal will convey these representations and warran-ties that supposedly protect investors from poor origination and underwriting by the lender. The mortgage loan purchase agreement (MLPA) details the representations and warranties co-vering the lender’s origination and underwriting. While this seems sufficient to overcome the po-tential moral hazard problems associated with the lender, there are two problems associated
with relying on representations and warranties to solve the moral hazard problem. First, the lender can challenge the claims in court and such cases may last several years. Second, lenders like New Century Financial did not maintain sufficient capital to cover all claims. Since lenders can file for bankruptcy protection, the lender will in practice tolerate only a certain level of repurchase claims. In practice, many lightly capitalized subprime mortgage lenders were bankrupted in 2006 and 2007 because they lacked the funds to make good on investor claims to repurchase early defaulting loans out of the pools. Thus, the representations and war-ranties requiring lenders to repurchase tainted loans may not be an effective tool in a default wave such as has been occurring in the US du-ring 2007 and 2008.
Not Fully Understanding the Shortcomings of Credit Rating Agencies
Credit Rating Agency models were misapplied. The credit rating agencies (CRAs) (Moody’s, S&P, Fitch) provide ratings for credit-sensi-tive products such as subprime Asset-backed Securities (ABS). Investors around the world rely on the ratings agencies’ assessment of risk for the underlying collateral and the struc-ture of the ABS tranches. Unfortunately, the rating agencies were delayed in downgrading the ratings on ABS tranches, waiting until af-
ter the problems had already begun.17 A partial explanation for the rating agencies being slow to react to the deteriorating credit conditions in the subprime market is that their risk models are historically based. Subprime defaults during 2004-2006 were low and house prices were increasing (given little incentive for subprime borrowers to default). However, the slowdown and decline of house prices led to a sudden increase in delinquencies and defaults in the subprime sector. Consequently, it is not surpri-sing that historically-based ratings would take a while to adjust to the downturn.
In addition to being slow to downgrade sub-prime ABS, the rating agencies may also suffer from the incentive structure inherent in their business model. Issuing investment banks pay the rating agencies to analyse and rate the collateral underlying credit sensitive MBS and ABS. Two ratings are typically used. Given that there are more than two rating agen-cies, a potential problem surfaces when the issuing investment banks pay for the ratings, in that a rating agency could give favourable ra-tings in return for repeat business. However, the incentive for rating agencies to be overly ge-nerous with their ratings must be offset by the reputational effects of being too generous; that is, the rating agencies must maintain credibility to generate repeat business.
15 See Bruskin, Sanders and Sykes , “The Non-Agency Mortgage Market: Background and Overview” The Handbook of Non-Agency Mortgage-backed Securities, edited by Frank J. Fabozzi, Chuck Ramsey and Michael Marz, 2000
16 See Akerlof for a discussion of asymmetric information and markets for lemons.17 “Stopping the Subprime Crisis,” New York Times, July 25, 2007.
Figure 1 Traditional model
Key:
Flow of money
Home appraiser
Mortgage broker
Rating agencies
Home buyer
Mortgage bond market
BankBank
Home valuation
Income check
Home buyer
Subprime model
Safeguards
Bank checks
Independent checks
1 Bank grants mortgage
2 Homebuyer pays bank
1 Bank sells mortgage bond2 Bank grants mortgage3 Homebuyer pays bank4 Bank pays bondholders
2
2 3
41
1
Mortgage bond
Bond payments
Mortgage loan
RepaymentsMortgage loan
Repayments

The Subprime Crisis: Implications for Emerging Markets
June 2009 HOUSING FINANCE INTERNATIONAL 9
4. Regulation of Subprime Lending and Securitisation
The Importance of Systemic Effects
Most market observers and participants failed to anticipate the threat to system stabi-lity that subprime lending posed. In the words of the IMF (2008), there was a collective failure to appreciate the extent of leverage taken on by a wide range of institutions. Subprime lending has been a relatively small part of overall US mor-tgage lending, rising to 20% of mortgage lending for its peak years of 2005 and 2006, but avera-ging 7% between 1994 and 2007, and ending up at about 12% of outstanding mortgages by 2006 (Inside Mortgage Finance, 2008). The sub-prime mortgages with the highest default rate were predominately made by non-depository lenders and sold to sophisticated institutional investors that were expected to understand and manage risk. Aside from the failure of investors to exercise due diligence, there was only a limi-ted understanding on any observer’s part of the cumulative extent of leverage within financing structures at hedge funds and in offshore invest-ment vehicles created by banks outside the US.
Mortgage Lenders Weakened Their Underwriting Standards
Lightly regulated non-bank financial companies linked weak subprime credit underwriting with international capital mar-kets. The majority of the riskier adjustable-rate subprime loans were originated by non-bank mortgage bankers and brokers that originated the loans for securitisation, frequently referred to as the “originate to distribute” model. Mian and Sufi (2008) show that the growth in supply of mortgages by non-bank lenders under the originate to distribute model was associated with a decline in underwriting standards and an eventual rise in defaults. The resulting securities were sold to institutional investors, primarily pri-vate hedge funds and other asset managers for the riskiest structured credit products. Monoline credit insurers provided credit enhancements to subprime securitisation transactions and have suffered significant erosion in capital as defaults rose. Mortgage bankers and brokers are not subject to prudential supervision. As private in-vestment firms, hedge funds have no disclosure requirements and insurers generally face diffe-rent capital standards than do banks.
Non-bank lenders dependent solely upon se-curitisation found themselves unable to sell their loans once the crisis hit. The lack of fun-ding diversity is most pressing for non-depository lenders that depend solely on securitisation or portfolio sales. As the subprime crisis grew in 2007, issuance and trading in subprime and prime mortgage-backed securities stopped for months at a time as investors fled the sector in its entirety. Major lenders, such as Northern Rock in Great Britain and Countrywide Financial in the US, suffered serious liquidity shortages even though neither was primarily a subprime lender.18 Although each had thousands of high quality loans in its pipeline ready for sale, they could not find buyers. Eventually, Northern Rock was acquired by the Bank of England. Since Countrywide had as a part of its assets a Federally-chartered thrift, it was able to tap lines of credit at the Federal Home Loan Bank of Atlanta. Even this proved inadequate, and eventually Countrywide too was required to sell itself to a larger commercial bank with greater resources, Bank of America.
Consumer Protection Failures
Predatory subprime lenders have misled bor-rowers and convinced them to take out loans that they did not understand or that carried inappropriate risks. Statistics show subprime borrowers to be higher-risk than prime borrowers, to pay more for loans, to be predominately mino-rity, to have lower income, be less well financially educated, and less likely to search for the best in-terest rates and terms for their mortgage loans19 . A commonly cited practice has been “fee pac-king”, where excessive processing fees were included in the balance of the new loan, increasing the borrower’s indebtedness without providing value. About 70% of subprime loans carry pre-payment fees, compared to about 2% of prime loans. Other practices include charging rates of interest much higher than those charged for other borrowers with similar credit histories, misleading borrowers about the costs of the loan by failing to disclose the costs of required taxes and insu-rance, and abuses in servicing such as refusing to correctly credit payments received and then declaring borrowers to be in default. (Tomkin, et al., 2002, Lax, et al., 2004, GAO, 2004a, FTC 2007, Renuart, 2004.)
The Role of Auditors
External auditors abetted the boom menta-lity by under-reporting risks and losses. In
the case of New Century Financial Corporation, New Century’s auditor, KPMG, apparently enabled significant improper and imprudent practices related to loan originations, ope-rations, accounting and financial reporting processes. Among other actions, KPMG ap-parently suggested reducing reserves against possible loan repurchases in 2006 at the same time that early payment defaults rose and New Century was “flooded” with repurchase claims from investors. The examiner indentified ac-counting issues with the allowance for loan losses on loans held for investment, mortgage servicing rights, deferral and amortisation of loan origination fees, hedge accounting and goodwill from an acquisition. In the third quarter of 2006, as a result of these accounting failures, New Century was said to have understated its repurchase reserve by 1000%, reported a pro-fit of $63.5 billion and met analysts’ earnings expectations, when it should have reported a loss and at least a 40% decline in earnings per share (New Century Examiner Report, 2008).
The Role of Credit Rating Agencies
The widespread downgrading of subprime securities in 2007 severely undermined market confidence in the ratings process and in market prices for those securities. The role and supervision of Credit Rating Agencies (CRAs) has been an issue for some years in a number of financial markets (Partnoy, 2006). As noted by the International Organisation of Securities Commissions (IOSCO 2008), the growing volume of subprime securitisations gave the rating agencies little incentive to discourage investors from effectively outsourcing their eva-luation. Regulatory requirements for investors, issuers and banks, including in particular the Basel II capital accords, require authorities to accept the role of rating agencies on a much larger scale than has been the case in the past. However, in several important instances, ratings have lagged market developments and have appeared out of touch with defaults, as in the case of Enron. In the wake of the financial scandals of 2000-2002, among a number of other financial market re-forms, Congress requested that the Securities and Exchange Commission (SEC) review the role of CRAs and their oversight.20 By 2007, the SEC had finalised new regulations that established clearer standards for the recognition of CRAs. IOSCO has developed a code of conduct for CRAs and pu-blished several studies on its implementation.21
18 As defined in the US, there was very little subprime lending in Great Britain, and Northern Rock was predominately a prime lender. Between 2001 and 2006, about 10% of the loans that Countrywide originated were subprime.
19 Access to credit should be predicated on an objective assessment of ability and wil-lingness to pay. Prior to the passage of anti-discrimination laws and court cases in the 1970s and 1980s, racial criteria unrelated to creditworthiness played an explicit role in mortgage credit allocation in the US. Some racial discrimination persists. However, in
recent years much of the racial disparity in access to mortgage lending and in mortgage costs has reflected differences in credit scores, which carry no racial information (Fede-ral Reserve, 2007). Lower credit scores reflect broader issues of social equity, such as access to education and employment.
20 Sarbanes-Oxley Act of 2002, Pub. L. No. 107-204, § 702(b), 116 Stat. 745 (2002).21 www.iosco.org

The Subprime Crisis: Implications for Emerging Markets
10 HOUSING FINANCE INTERNATIONAL June 2009
Basel II Capital Accords Would Have Had Limited Effect on the Subprime Boom and Crisis
Basel II was not in effect in the US during the subprime boom and it does not apply to non-bank lenders. Basel II Pillar 1 capital standards primarily affect mortgage lending in three respects: 1) lower risk weights for mortgages retained on bank balance sheets in countries where lower losses can be de-monstrated; 2) lower risk weights for loans backed by mortgage default insurance; and 3) specific capital requirements for bank invest-ments in mortgage-related securities. Pillar 3 of Basel II requires banks to provide qualitative discussions of securitisations and off balance sheet exposures, representing a limited im-provement, given the qualitative nature of the requirements (IMF, 2008). Pillar 2 requires supervisors to review the quality of these dis-closures. The more advanced Basel II internal ratings based standards will be implemented between 2008 and 2011 by large, internatio-nally active banks in the US, and so were not in effect during the growth of subprime lending at the beginning of the decade.22 The Basel II accords do not apply to non-bank lenders, to investment banks, or to CRAs.
Although the US has arguably one of the most transparent financial markets in the world, market discipline was of little use in reining in the subprime boom or preven-ting the crisis. Offering documents provide summary descriptions of key collateral perfor-mance indicators.23 Risky subprime-backed
securities were sold only to sophisticated ins-titutional investors, not to individuals. Investors depended excessively on agency ratings for assurance that the bonds would pay, rather than conducting their own analysis. Investors apparently felt that the yields offered by sub-prime securities compensated for the risks they were taking (Jaffee, 2008). While they are a crucial part of efficient and stable financial systems, market disclosures were insufficient to prevent subprime excesses. The short-term earnings incentives from fees and the strong demand for higher yield paper created a race to the bottom with respect to credit unde-rwriting rules and leverage. Individual market participants maximised their short-term in-dividual utility in the form of fee income and issuance volume, while ignoring the longer-term system-wide effects of higher defaults and leverage.
5. Observations and Recommendations for Emerging Markets
Broadly speaking, there has been no sub-prime mortgage lending in emerging markets. Instead, mortgage lending is typically made on conservative terms to middle- and upper-income households employed in the formal sector. Given the overall lack of access to credit, the predominant lack of access to financial ser-vices and the relatively high cost of registering and enforcing a mortgage lien, emerging mar-ket banks have been slow to move downmarket with mortgages. Mortgage lending is typically
less than 20% of GDP in emerging markets, while it ranges between 40% and 100% of GDP in developed countries (Chart 3).
The challenge for emerging markets is to increase access to housing finance for mo-derate- and low-income households while maintaining strong standards for credit risk management. Governments can reduce the cost of housing by increasing efficiency in land markets. Banks may increase the sup-ply and maturity of mortgages by financing themselves with covered bonds or by secu-ritising portfolios. They may extend credit to lower-income households by employing more labour-intensive microfinance management methods. Emerging market lenders can extend credit to moderate-income households using alternative documentation methods and credit scoring technology while maintaining strong credit underwriting standards.
Primary Market Practices
Evaluate mortgage credit risk in terms of the borrower’s income, not the value of the pro-perty. Even though mortgages are secured with a lien on a house, collecting mortgage debt by foreclosing on the house generally results in a loss to the lender, especially when house prices are flat or falling. However, as the recent boom persisted, lenders came to rely increasingly on expected house price increases rather than bor-rower income. At the same time, lenders became increasingly tolerant of very high loan-to value ratios (LTVs) without income verification or cre-dit enhancements (Demyanyk and Van Hemert 2007, Gramlich 2007, various OCC guidances).
The primary means to evaluate the capacity to pay is the borrower’s debt-to-income ratio. It may be expressed either in terms of monthly housing payment to monthly income gross of taxes, or total monthly obligations (mortgage and other consumer debt) divided by monthly gross income. For prime mortgage loans in the US, the standard for mortgage debt to gross income is 28% for monthly housing payment to gross in-come and 36% for total debt obligations to gross income.24 For subprime lending, the mortgage payment to income ratio was allowed to range much higher, averaging 41% in 2006 and in some cases exceeding 50% (Fitch, 2007).
Allow flexibility in sound credit management practices while increasing access for low- and moderate-income borrowers. Lenders should be required to document borrower in-come, but be allowed flexibility with respect to the means by which informal income earners establish their ability to pay. This can include
22 See www.frb.com for the US implementation schedule, www.bis.org for the overall schedule and for separate countries’ decisions regarding their implementation.
23 See Engel and McCoy (2007), as cited above.
24 Monthly housing payment includes principal, interest, taxes and insurance. Total monthly obligations are defined as monthly housing payment plus other recurring debt obligations.
Chart 3
Denm
ark
0%
20%
40%
60%
80%
100%
Unite
d Ki
ngdo
m
Unite
d St
ates
Spai
n
Germ
any
Hong
Kon
g SA
R
Japa
n
Mal
aysi
a
Fran
ce
Kore
a
Pana
ma
Italy
Thai
land
Mor
occo
Chile
Chin
a
Lith
uani
a
Mex
ico
Pola
nd
Colo
mbi
a
Turk
ey
Kaza
khst
an
Ukra
ine
Indo
nesi
a
Guat
emal
a
Sene
gal
Peru
Arge
ntin
a
Russ
ia
Ugan
da
Azeb
aija
n
Cam
eroo
n
Paki
stan
Nige
ria
Mortgage Debt as Percent of GDP Selected Countries
Source: World Bank

The Subprime Crisis: Implications for Emerging Markets
June 2009 HOUSING FINANCE INTERNATIONAL 11
structured savings programmes, rent and uti-lity receipts, and co-signatures by friends and family members. Mexican lenders have deve-loped proprietary credit scoring systems. Half of the mortgage lending in recent years funded by Mexico’s Federal Mortgage Company (known by its Spanish language acronym SHF) via non-bank lenders has reached households earning between the median and 70th percentile, a signi-ficant improvement over previous years, when most lending was to households in the 70th per-centile or higher. As much as 15% of non-bank lending has gone to informal sector workers. SHF also supports microfinance for housing and sub-sidy programs for households earning less than the median.25 Financial products such as mor-tgage default insurance have contributed to the stable extension of mortgage credit to moderate-income households in Mexico, Hong Kong, the US, Canada and other countries.
Prepayment fees should be limited to the actual financial cost of refinancing incurred by the lender or investor. Yield maintenance fees are common in many countries that fea-ture long-term fixed rate loans.26 These fees eliminate the financial gain for the consumer from exercising the prepayment option. In some countries, contractual limits on prepayment are the norm. Any such fees or limitations should be clearly disclosed to the borrower. Prepayment fees should not exceed the mark-to-market loss that the lender incurs as a result of prepayment.
Set LTV requirements in terms of the local history of house price movements and pre-vailing foreclosure costs. Authorities should look at the history of house prices in their mar-kets to see how volatility is likely to affect the equity position of a high LTV loan. Countries with higher volatility will want to set the LTV stan-dard lower than others. For instance, if house prices have a substantial likelihood of dropping 5% over a given five year period, then 95% LTV loans would be inadvisable. Rapidly urbanising markets, such as China and Mexico, where va-luations are based largely on new construction, should require lower LTVs (in fact, China has restricted LTVs to 65% in its more overheated cities). In more mature markets, with a longer history of trading of both new and used hou-sing, higher LTVs may be acceptable. Likewise, longer or more uncertain foreclosure periods or higher costs should drive lower LTV norms.
Create a public database on property prices, mortgage interest rates, mortgage lending volumes and mortgage loan performance. Confidence increases when investors are aware of price movements and cycles. The IMF and World Bank have jointly developed recommended indicators for real estate mar-kets as part of their work on financial stability monitoring. These include separately reporting real estate lending by types of financial insti-tutions and creating real estate price indexes.27 Central banks, financial regulators, statistical agencies and the private sector should colla-borate to create real estate information centres that gather and report basic data on real es-tate markets and financial activity. Such data enables property appraisers to provide more accurate estimates of market value. Thailand created such a centre in 2004.28 Lenders and mortgage insurers in Mexico have reliable data from the beginning of the 2000s, when the public MI product was restructured, and a few mortgage lenders began to securitise their port-folios, but this data reflects a period of rising house prices, similar to the boom experienced in the US in the same period. In Colombia, data exists for mortgages that survived the crisis of 1998 that were securitised and for loans that have been originated more recently as the market has rebounded. But these time periods represent separate paradigms in terms of mar-ket circumstances and do not lend themselves easily to sweeping conclusions about default probability or loss given default. In China, mor-tgages have been made only since the reforms of 1998, in a real estate boom in coastal cities, and loan data has not been consistently gathe-red across the industry. In many other emerging markets, lending is much less widespread and no industry-wide data is collected at all.
Provide Robust Links to Capital Markets
Capital market funding can take at least two forms: securitisation and covered bonds. Diversity in funding instruments and funding sources provides lenders with choices for ma-naging capital in the context of term matching, credit risk and operational risk. Many countries have developed securitisation or covered bonds along with second tier liquidity facilities that allow lenders to keep mortgages on balance sheet.29 Spain and Chile have developed active markets with both covered bonds and securiti-sation as capital market tools.
Credit Rating Agencies should be subject to rules for disclosures for their activities. Many countries have a licensing requirement and at least a nominal oversight function for CRAs. Competition issues associated with CRAs are more pronounced in emerging markets, particularly small ones with small and illiquid capital markets. In many emerging markets, only one of the three major international CRAs are active, often via contracts with domestic economic consulting firms, or via offices in nearby countries.30 These local firms typically lack expertise in arcane topics like structured finance. Authorities could establish in regula-tion the requirement that CRAs adhere to the IOSCO code of conduct.
Consumer Protection in Mortgage Lending31
Consumer protection rules should provide for clear disclosures and fair competition, and should prohibit abusive charges. Predatory lending can have a much broader reach than the individual borrower. In the US, risky sub-prime lending practices could have been restricted much earlier by tightening existing rules on non-bank lenders. Arguably, this would have reduced the scale of the crisis. As they work to increase access to finance, authorities in emerging markets should establish clear and workable rules for disclosing the complete costs and risks of mortgage borrowing, and to protect consumers from unscrupulous len-ders. Examples of disclosures include Mexico’s transparency law and the United Kingdom’s disclosure regulation.
Consumer disclosures are important in emerging markets that issue price level adjusting mortgages, where the principal amount varies with inflation.32 Credit risk can rise if mortgages and salaries are not indexed in the same fashion. Clear disclosures and ex-planations are required to make sure that the borrower understands how their mortgage pay-ment may change over time.
25 Sources: SHF, interviews with lenders. 26 For example: Germany, Ireland, Netherlands, Sweden and Australia.27 IMF (2006). 28 http://www.reic.or.th/home_eng/home/default.asp29 For instance, Malaysia, France and the United States.30 For example, Fitch’s Peru office relies on staff from its office in Chile. Mainland
China has not yet licensed any of the three major CRAs to operate.31 For a more extensive discussion of consumer protection issues see Chapter 6 in
Chiquier and Lea, 2008.32 Inflation-indexed mortgages have been prominent at different times in a number
of countries, including Israel, Poland, Chile, Argentina and Mexico. As inflation has fallen in recent years, shorter maturity fixed nominal rate loans have become po-pular in Colombia and Mexico.

The Subprime Crisis: Implications for Emerging Markets
12 HOUSING FINANCE INTERNATIONAL June 2009
Bibliography
Agarwal, Sumit, Brent Ambrose, Souphala Chomsisengphet and Anthony B. Sanders, 2008. “Subprime Lending and Default: The Impact of Loan Concentration,” Working Paper, Arizona State University.
Aharony, Joseph, Anthony Saunders, Itzhak Swary. 1988. “The Effects of DIDMCA on Bank Stockholders Returns and Risk” Journal of Banking and Finance 12. 317-331. North-Holland
Akerlof, George A. 1970. “The Market for “Lemons”: Quality Uncertainty and the Market Mechanism,” The Quarterly Journal of Economics, Vol. 84, No. 3 August, pp. 488-500.
André, et al. 2006. “Recent House Price Developments: The Role of Fundamentals”, OECD Economics Department Working Papers, No. 475, OECD Publishing.
Ashcraft, Adam B., and Til Schuermann. 2007. “Understanding the Securitisation of Subprime Mortgage Credit,” Federal Reserve Bank of New York.
Avery, Robert B. Kenneth P. Brevoort, Glenn B. Canner, 2007. “The 2006 HMDA Data,” Federal Reserve Bulletin v93 September 12.
Bair, Sheila. 2001. “Mortgage Reform and Predatory Lending: Addressing the Challenges,” Statement by Treasury Assistant Secretary Sheila Bair
Bernanke, Ben S. 2004. “Remarks by Governor Ben S. Bernanke at the meetings of the Eastern Economic Association,” Washington, D.C., February 20. http://www.federalreserve.gov.
Berson, David W., 2006 “Challenges & Emerging Risks in the Home Mortgage Business”, Presentation to The National Housing Forum, Office of Thrift Supervision, Washington, DC, December 11.
Bureau of Economic Analysis. 2007. “Table 1.1.2. Contributions to Percent Change in Real Gross Domestic Product”, www.bea.gov.
Butera and Andrews. 2007. “State and Local Predatory Lending Laws (As of 01-22-07)”, mimeo.
Calhoun, Charles. 2005. “The Hidden Risks of Piggyback Lending”, June memo.
Camerer, Colin F. 2003. “The behavioral challenge to economics: Understanding normal people”, Federal Reserve of Boston.
Case, Karl E. and Robert J. Shiller. 1989. “The Efficiency of the Market for Single Family Homes,” The American Economic Review 79:1, 125-37.
Caskey, John P., Clemente Ruíz Durán, and Tova Maria Solo, 2006. “The Urban Unbanked in Mexico and the United States,” World Bank Policy Research Working Paper 3835. February.
Center for Responsible Lending, 2008 “A Snapshot
of the Subprime Crisis,” available at http://www.responsiblelending.org/issues/mortgage/quick-references/a-snapshot-of-the-subprime.html#_edn29
Chiquier, Loic, and Michael Lea. 2008. “Housing Finance Policy in Emerging Markets,” World Bank Group, forthcoming.
Chomsisenghphet, Souphala and Anthony Pennington-Cross. 2006 “The Evolution of the Subprime Mortgage Market,” Fed. Reserve Bank of St. Louis Review at 34 January/February.
Clauretie, Terrence M., and Thomas N Herzog. 1990. “The Effect of State Foreclosure Laws on Loan Losses: Evidence from the Mortgage Insurance Industry.” Journal of Money, Credit and Banking, vol. 22, issue 2, pages 221-33.
Common Cause. 2007. “Ask Yourself Why Mortgage Foreclosure Rates are So High,” Celia Wexler.
Demyanyk, Yulia, and Otto van Hemert. 2007. “Understanding the Subprime Mortgage Crisis,” Federal Reserve bank of New York.
Department of Justice. 2008. “The Attorney General’s 2007 Annual Report To Congress Pursuant To The Equal Credit Opportunity Act Amendments of 1976,” April
Djankov, Simeon, Rafael La Porta, Florencio Lopez-de-Silanes, and Andrei Shleifer. 2002. “Courts: The Lex Mundi Project.” NBER Working Paper Series, Working Paper 8890.
Duebel, Joachim. 2006. “Consumer Information & Protection in Mortgage Finance”, Presentation World Bank Group Housing Finance Conference.
Dugan, John C. 2007. “Remarks by John C. Dugan Comptroller of the Currency Before the Neighborhood Housing Services of New York”.
E. Scott Reckard. 2008. “Sub-prime mortgage watchdogs kept on leash.” Los Angeles Times.
Edmund L. Andrews. 2007. “Fed Shrugged as Subprime Crisis Spread,” Wall Street Journal
Engel, Kathleen C., and Patricia A. McCoy. 2007. “Turning a Blind Eye: Wall Street Finance of Predatory Lending,” University of Connecticut School of Law, Working Paper 73
Federal Trade Commission (FTC). 2007. “Prepared Statement of the Federal Trade Commission on Consumer Protection in Financial Services Before the House Committee on Financial Services.”
Federal Trade Commission (FTC). 1998. “Prepared Statement of the Federal Trade Commission by Jodie Bernstein, Director. Bureau of Consumer Protection before the Senate Special Committee On Aging on Home Equity Lending Abuses in the Subprime Mortgage Industry.”
Federal Deposit Insurance Corporation (FDIC).
1997. “Financial Institution Letters Subprime Lending,” FIL-44-97.
Federal Financial Institution Examination Council (FFIEC). 2008. Home Mortgage Disclosure Act (HMDA) Data. National Aggregate Tables. www.ffiec.gov
Federal Reserve Board. 2007. “Proposed Amendments to Regulation Z (Truth in Lending).”
Federcasa, Italian Housing Foundation. September 2006. “Housing Statistics in the European Union 2005/2006”,
Fernandez De Lis, Santiago, 2008. “New Regulatory Challenges for Mortgage Markets: Lessons from Spain,” presentation the World Bank Conference, Housing Finance in Emerging Markets: Is the Expansion Affected by the Sub-Prime Crisis? May.
Fitch Ratings. 2007. “U.S. Subprime Rating Surveillance Update, Glenn Costello Managing Director,” presentation.
Fitch. October 2006. “Republic of Guatemala Intervention of Banco del Café (Bancafe)”.
Foote, Christopher L., Krisopher Gerardi, Lorenz Goette, and Paul S. Willen. 2008. “Subprime Facts: What (We Think) We Know About the Subprime Crisis and What We Don’t,” May, Federal Reserve Bank of Boston Public Policy Discussion Papers, No. 08-2.
General Accounting Office (GAO). 2004a. “Consumer Protection Federal and State Agencies Face Challenges in Combating Predatory Lending,” GAO-04-280
General Accounting Office. 2004b. “Financial Regulation Industry Changes Prompt Need to Reconsider U.S. Regulatory Structure.” GAO-05-61
Gensler, Gary. 2000. “Treasury Under Secretary Gary Gensler House Banking And Financial Services Committee.”
Glaeser, Edward L., and J. Shapiro. August 2003. “The Benefits of the Home Mortgage Deduction.” Tax Policy and the Economy, 17, pp. 37-82
Glaeser, Edward L., Joseph Gyourko, and Raven E. Saks. 2005. “Why Have Housing Prices Gone Up?” American Economic Association Papers and Proceedings, May, 2005.
Gramlich, Edward M. 2007. “Subprime Mortgages, America’s Latest Boom and Bust,” Washington, Urban Institute Press.
Green, Richard K., Stephen Malpezzi and Stephen K. Mayo. 1999. “Metropolitan-Specific Estimates of the Price Elasticity of Supply of Housing, and Their Sources.”, University of Wisconsin James A. Grasskamp Center for Real Estate Working Paper 99-16.
Herring, Richard and Susan Wachter. 1999. “Real Estate Booms and Banking Busts: An International

The Subprime Crisis: Implications for Emerging Markets
June 2009 HOUSING FINANCE INTERNATIONAL 13
Perspective”, working paper 99-27, Wharton School Financial Institutions Center
Herring, Richard, and Susan Wachter. 2002. “Bubbles in Real Estate Markets”, memo, Federal Reserve Bank of Chicago and World Bank Group
Housing and Urban Development, Department of (HUD), and Department of the Treasury (Treasury). 2000. “Curbing Predatory Home Mortgage Lending.” http://www.huduser.org/publications/hsgfin/curbing.html
Internal Revenue Service. 2007c, “Home Mortgage Interest Deduction,” Publication 936, Cat. No. 10426G
Internal Revenue Service. Fall 2007a, “Individual Income Tax Returns, 2005,” Statistics of Income Bulletin.
Internal Revenue Service. Fall 2007b, “Tax-exempt Bonds, 2005” Statistics of Income Bulletin.
International Monetary Fund. April 2008. “Global Financial Stability Report, Containing Systemic Risks and Restoring Financial Soundness.”
International Monetary Fund. March 2006. Financial Soundness Indicators Compilation Guide.
Ip, Gregory and Damian Paletta. 2007. “Regulators Scrutinized In Mortgage Meltdown,” Wall Street Journal
Jaffee, Dwight M. 2008. “The U.S. Subprime Mortgage Crisis: Issues Raised and Lessons Learned,” Draft Date: April 7, 2008, Prepared for the Commission on Growth and Development and the World Bank http://www.growthcommission.org/
Jappelli, Tullio, Marco Pagano, and Magda Bianco. 2002. “Courts and Banks: Effects of Judicial Enforcement on Credit Markets,” Working Paper No. 58, Centre for Studies in Economics and Finance, University of Salerno
Lacko, James, and Janis K. Pappalardo. 2007. “Improving Consumer Mortgage Disclosures, An Empirical Assessment of Current and Prototype Disclosure Forms,” Federal Trade Commission Bureau of Economics Staff Report
Lax, Howard, Michael Manti, Paul Raca, and Peter Zorn. 2004. “Subprime Lending: An Investigation of Economic Efficiency,” Housing Policy Debate, Volume 15, Issue 3.
Leamer, Edward E. 2007. “Housing is the Business Cycle”, National Bureau of Economic Research Working Paper 13428
Leventis, Andrew. 2007. “A Note on the Differences between the OFHEO and S&P/Case-Shiller House Price Indexes,” Office of Federal Housing Enterprise Oversight
Mian, Atif and Amir Sufi. 2008. “The Consequences of Mortgage Credit Expansion: Evidence from the 2007 Mortgage Default Crisis,” January, http://
ssrn.com/abstract=1072304
Missal, Michael J. 2008. “Final Report of Michael J. Missal Bankruptcy Court Examiner.” United States Bankruptcy Court for the District Delaware. In re: New Century TRS Holdings, Inc. A Delaware Corporation, et al, Debtors.
Mortgage Bankers Association. 2007. “Characteristics of Outstanding Residential Mortgage Debt: 2006,” Research Data Note.
Mortgage Bankers Association. 2007. “National Delinquency Survey Third Quarter.
National Low Income Housing Coalition (NLIHC). 2008. “2008 Advocate’s Guide”
Office of the Comptroller of Currency (OCC), etc. 1999. “Interagency Guidance on High LTV Residential Real Estate Lending”.
Office of the Comptroller of Currency (OCC), etc. 2001. “Expanded Guidance for Subprime Lending Programs,”
Office of the Comptroller of Currency (OCC), etc. 2005. “Credit Risk Management Guidance For Home Equity Lending,”
Office of the Comptroller of Currency (OCC), etc. 2006. “Interagency Guidance on Nontraditional Mortgage Product Risks,”
Office of the Comptroller of Currency, Board of Governors of the Federal Reserve System, Federal Deposit Insurance Corporation, Office of the Comptroller of the Currency, Office of Thrift Supervision. 1999. “Interagency Guidance on Subprime Lending.”
Partnoy, Frank. 2006. “How and Why Credit Rating Agencies are Not Like Other Gatekeepers,” in Financial Gatekeepers: Can They Protect Investors? Yasuyuki Fuchita, Robert E. Litan, eds., Brookings Institution Press and the Nomura Institute of Capital Markets Research.
Pence, Karen M. 2006. “Foreclosing on Opportunity: State Laws and Mortgage Credit” Review of Economics and Statistics Vol. 88, No. 1: 177–182.
Quercia, Roberto G., Michael A., Stegman, and Walter R. Davis. 2004. “Assessing the Impact of North Carolina’s Predatory Lending Law,” Housing Policy Debate, Volume 15, Issue 3.
Reckard, E. Scott. March 17, 2008, “Sub-prime mortgage watchdogs kept on leash”. Los Angeles Times
Reinhart, Carmen M. and Kenneth S. Rogoff. 2008. “Is the 2007 U.S. Sub-prime Financial Crisis So Different? An International Historical Comparison,” National Bureau of Economic Research, Working Paper 13761.
Renuart, Elizebeth. 2004. “An Overview of the Predatory Mortgage Lending Process,” Housing
Policy Debate, Volume 15, Issue 3.
United States Census Bureau News Release, 2008. “Census Bureau Reports On Residential Vacancies And Homeownership”, April 28, CB08-60
Van den Nord, Paul, 2006. “Are House Prices Nearing A Peak? A Probit Analysis For 17 OECD Countries,” Organization of Economic Cooperation and Development, Economics Department Working Papers No. 488.
Verband Deutscher Pfandbriefbanken (VDP) 2006, “Regulation on the Determination of Mortgage Lending Values of Properties in Accordance with 16 pars. 1 and 2 of the Pfandbrief Act,” May 12, working translation, available at http://www.pfandbrief.org/d/internet.nsf/tindex/en_lending_value.htm

Structured Financing Allows for Affordable Rental Housing in Austria
14 HOUSING FINANCE INTERNATIONAL June 2009
Structured Financing Allows for Affordable Rental Housing in Austria By Wolfgang Amann, Julie Lawson & Alexis Mundt 1 2
Introduction
Despite the convergent view that the era of broad-based housing supply strategies has come to an end (Harloe 1995), the drift away from social housing and supply-side programmess since the 1970s has been far from universal. Indeed, recent assessments by CECODHAS (2007), Whitehead and Scanlon (2007) and Lawson and Milligan (2007) suggest a more variable picture of the role of governments in their very different housing markets (Kemeny et al 2005). While some countries, notably Germany, have sold or demolished large amounts of subsidised rental housing, there are several countries, such as Austria, France and Switzerland that continue to exercise a more direct influence on the sup-ply of different tenures, using a range of policy levers in the land, finance and housing mar-kets (Lawson 2009, Schaeffer 2008, Deutsch 2007, FOH 2006). Furthermore, a number of home ownership orientated countries, including Ireland, New Zealand and, most recently, the UK and Australia, are now promoting social and af-fordable housing supply-side strategies in their reinvigorated national housing policies (Milligan et al forthcoming). These efforts are gaining pace amidst the worsening global financial crises, in which the promotion of housing is being used as a tool to stimulate flagging national economies.
This paper examines the experience of Austria, which suggests that a new set of ideas around what is considered good housing policy should replace the demand side hegemony that charac-terised the role of governments in housing policy during the late 20th century. Rather than enable financial markets to determine the level of hou-sing investments and indeed housing costs, this new paradigm would promote a more strategic role for governments in facilitating an adequate supply of decent affordable housing.
The Austrian model is interesting for policy makers and financiers not only because it has been successful and resilient in stabilising hou-
sing markets and has provided quality housing outcomes, but also because it provides lessons for countries seeking to reform, reinvigorate or establish new social housing systems, as in countries in transition where it is now taking hold. To enable a clearer understanding of what is often considered a complex system of finance, this paper presents the Austrian model as a form of risk-averse structured finance, which employs a variety of different sources within a well regu-lated framework and consequently reduces risks for investors and financing costs for providers of cost rent housing.
Austrian Housing Policy in a Nutshell
Austria performs well in terms of quality and quantity when compared to the housing outcomes of other European systems, particularly in terms of housing cost, security of occupancy and habitable space (Czasny 2004:57). Indeed, the general price level is relatively low; household expenditure on housing is only 20.6% representing much less of a burden than in other European countries (Czasny et al. 2008: 819). Consequently, there is a very low proportion of households with rent arrears (2.4% opposed to 9.1%) and of households that see their living expenses as a heavy burden (14% as op-posed to the EU25-average of 28%) (Czasny et al 2008:56).
Unlike the boom bust cycles of housing mar-kets of many other West European and North American countries, the smoother Austrian cycle has been far less volatile, even in recent months. Price developments have been steadily positive and between 1999 and 2007, annual percentage growth rates were only 1.2 %, compared with 6.1% in the Euro area (ECB 2009). Consequently, tenancies of different duration exhibit only marginal cost differences. While rents for new contracts (less than five years) are on an EU25-average 27% higher than those of old contracts (more than 15 years), this difference amounts to only 10% in Austria (Czasny et al 2008: 45). New construction is on a stable and relatively
high level of 5.0 to 5.5 completions per 1,000 inhabitants for the past decade (45,000 units in 2008), compared with a much higher volatility in countries such as Ireland or Spain, or a much lower level in Germany or the UK. Unlike most EU countries, which face a sharp downturn in housing production from 2007 to 2010, Austrian housing production is forecast to report a modest adjustment only (Euroconstruct 12/2008).
Austrian housing policy is characterised by sta-bility and continuity, which is sustained by the following elements:
Housing legislation is primarily a federal res-ponsibility with an explicit emphasis on the protection of tenants and regulation of limited profit housing associations;
New construction is highly influenced by ex-tensive, mostly supply-side, housing subsidy schemes, designed by regional governments (Länder);
The federal government transfers dedicated tax revenue to the Länder to ensure a long-term focus on housing policy development;
A limited profit housing sector has developed to become a very efficient tool for the im-plementation of housing policy targets (e.g. regarding energy efficient and environmentally sustainable housing); and
The banking sector plays a decisive and constructive role in channelling investment to-wards approved housing projects (contractual savings schemes, housing banks).
These elements underpin the limited profit housing sector, which is described in more detail below.
The Limited Profit Housing Scheme
By providing discounted building land, grants, public loans and tax favoured investment, the federal government, together with its regional (Länder) and municipal governments has stra-tegically promoted the development of limited profit, cost-capped, cost rent housing, often in
1 Dr. Wolfgang Amann is director of the Vienna based IIBW – Institute for Real Estate, Construction and Hous-ing Ltd. with a focus on housing finance and housing legis-lation in Austria and CEE countries (www.iibw.at), Dr. Julie Lawson is a researcher in international housing finance, governance and institutions at OTB Research Institute for Housing, Urban and Mobility Studies, TU Delft, The Netherlands. Mag. Alexis Mundt is research associate at the Vienna based IIBW – Institute for Real Estate, Construction and
Housing Ltd. with a focus on comparative housing policy and social housing in Europe. 2 The findings, interpretations, statements and conclusions expressed herein are those of the authors alone and do not necessarily reflect the views of the International Bank for Reconstruction and Development/The World Bank and its affiliated organizations, or those of the Executive Directors of The World Bank or the TU Delft or the IIBW.

Structured Financing Allows for Affordable Rental Housing in Austria
June 2009 HOUSING FINANCE INTERNATIONAL 15
complex urban renewal projects catering for a range of households including new migrants and the socially disadvantaged. The Austrian government tailors its expenditure in housing programmes to lessen cyclical fluctuations (WIFO, 2007), most subsidies are directed to-wards supply rather than demand assistance.
Limited profit housing is procured and managed mainly by limited profit housing associations (LPHA) but also by municipal housing compa-nies. Approximately 190 LPHA manage 22.5% of the total housing stock in Austria, primarily in major urban areas but also in small towns and villages (865,000 dwellings, Bauer 2004). LPHA are responsible for around 28% of new residential construction and more than 60% of all multi-apartment housing construction. With this very high market share, LPHA have not only outperformed municipal housing, but also private multi-apartment housing construction.
The Austrian legislative framework for limi-ted profit housing is very well developed and concerns the following:
the definition of acceptable activities, which restrict them to limited profit cost-capped hou-sing of moderate but adequate standards;
interest limits on financing provided by capital markets;
rules for setting rents and the principles of rent contracts;
the compulsory re-investment of profits into to construction and renovation;
limits on administration costs including income ceilings for managers;
the decision-making and management pro-cess that involves tenants and which has a key role for government in regular systems of eva-luation and auditing, as well as enforcement procedures; and
the design principles for state based programs.
There are formal income limits for access to so-cial housing, but these are high enough to cover 80-90% of the population (Reinprecht 2007:39). Municipalities create their own allocation sche-mes and provide special emergency dwellings for households in imminent danger of homelessness, mostly from within the municipal housing stock.
LPHA are both self-audited and publicly re-gulated. An umbrella organisation audits and regulates individual associations and repre-sents them in negotiations with the government, whilst regional governments also act as exter-nal supervisors. This arrangement improves the creditworthiness and, importantly, the financial rating of the sector. This contributes to the struc-tured financing goal of reducing the costs of
capital and reducing risk for capital market finan-cial contributors.
Social Housing Financing
Anti-cyclical Keynesian fiscal policy was prac-tised in Austria for much longer than in other Western welfare states (Unger & Heitzmann 2003), which helps to explain why supply-side subsidies towards the construction and renova-tion of buildings were preferred to a major shift towards demand-side housing benefits that pro-vide less possibility of applying steers through housing policy. In Austria, housing promotion was always regarded as a policy instrument able to attain various policy targets beyond social pol-icy, such as economic, environmental and land planning aims (Lugger 2007:56).
Importantly, housing finance consists of a number of different layers, illustrated below by Figure 1. The specific quality of each layer and their interaction contributes in a significant way towards strong performance of the Austrian housing system.
To illustrate how this works in practice, the fi-nancing of a typical social housing project is as follows (Table 1):
The financing scheme in Table 1 allows for net rents (annuities) of 3 to 4 €/m² with additional mainte-nance costs and taxes of 2 to 2.5 €/m². This results in rents in the scope of market rents in less devel-oped regions, but is considerably below the private market level in metropolitan areas. Such rents are affordable for households from the third income decile upwards. Lower income groups have access to additional means-tested housing benefits. Due to the generally moderate rent level, less than 6% of households receive demand-side subsidies. This contrasts starkly with the situation in the UK, where more than two-thirds of tenants in the social sector and 25% in the private sector are reliant on housing benefits (Whitehead 2007:66). In Austria, de-mand-side subsidies to low-income households function as a public guarantee for continuous rental incomes of the LPHA. Cost rents ensure that expenditure on demand assistance is both stable and contained. Affordable rents, secured by demand assistance when needed, ensure that eviction rates and rent arrears in the LPHA hou-sing stock are extremely low.
A sustained supply-side policy in Austria, compri-sing significant bricks and mortar subsidies, has resul-ted in a large housing stock with reaso-nable rents, allocated to middle-income groups,
Figure 1: Tranches of structured financing for LPHA-housing in Austria3
Source: IIBW
Senior loanCapital market mortgage loan; refinancing mostly with HCCB or contract saving
Low interest loan, grant or interest
Public subsidy as compensation for service obligations of general economic interest
Equity + cross-subsidies Solidity of LPHA allows for equity invest-ment
Upfront payments of tenants
Mostly for land costs; if >60 €/m² in return for a right to buy; reimbursement when moving out
Building land In some cases at low price from municipalities; prepayment with LPHA equity; bearing the cost by upfront payment of tenants
Table 1 Typical financing arrangements for limited profit housing projects in Austria
Capital market loan: 20-30 years maturity, Euribor + 0-30 BP, fixed- or variable-rate interest
40-60%
Public loan: 30 years maturity, 1% fixed-rate interest 30-40%
Equity of developer, mostly for land purchase or construction financing (temporarily)
10-20%
Upfront payment of tenants 0-10%
3 HCCB = housing construction convertible bonds

16 HOUSING FINANCE INTERNATIONAL June 2009
with additional means-tested benefits for lower income groups. This has been efficiently achie-ved at reasonable cost to the public purse: public expenditure on housing currently represents a modest 1% of GDP and is below the Western European average (Lugger & Amann 2006:29). The Austrian model allows for relatively low shares of public financing in social housing. At the same time, only a small part of the population needs to be supported with housing allowances and there are almost no fiscal subsidies.
In addition to the public subsidy schemes of the regional governments, capital market funding increasingly plays a role in financing limited profit housing projects. Mortgage loans are, as anywhere, an important product of commer-cial banks. In Austria, borrowing conditions are very favourable for LPHA being as low as the Euribor rate plus 0-30 basis points (Amann & Mundt 2006).
Limited Profit Housing Associations are conside-red as low-risk borrowers for several reasons. Firstly, co-financing by housing subsidies ensures a favourable loan-to-value ratio and represents a very low-risk to investors. Secondly, public bo-dies act as external supervisors tightly controlling the financial situation of the LPHA. Furthermore, there is a strong market for affordable rental housing and LPHA experience only minimal va-cancy rates. Further, their considerable size and strong asset base is taken into account, as well as their ownership constellations, which bolster their favourable creditworthiness. Bringing these aspects together, private investors consider limited profit affordable rental housing a funda-mentally low-risk asset (Whitehead 1999:671). Grants and subordinate public loans provide sound collateral for the commercial loans taken out by the LPHA, removing the need for govern-ment funded guarantees. This financial support, sound control and supervision are responsible for the very favourable conditions LPHA face on the capital market.
In order for commercial banks to be able to deliver the cheapest possible finance, a spe-cial financing vehicle was designed in the early 1990s, the “Wohnbaubanken” – housing banks. Today, all major banks have established hou-sing banks that issue tax-privileged housing construction convertible bonds (HCCB), which enjoy preferential public treatment in two ways. Firstly, a capital income tax relief is granted for the first 4% of returns. Therefore, HCCB can be issued below the market rate as the yield after taxes stays competitive, saving mortgage borrowers around 0.75% in interest costs (Ball 2005:29). Secondly, another incentive to the demand side of the market has been designed by considering an HCCB purchase as a special expense when assessing income tax. In addi-tion to these privileges, a tight legal framework
for the operation field of housing banks was created: money raised through the issuance of HCCBs has to be allocated towards new appro-ved housing construction programmes, which are eligible for additional object-side subsidies by the provinces, i.e. mainly in LPHA housing (Schmidinger 2008). Further, funds raised must be assigned to Austrian-based construction projects within a period of three years. This has created healthy competition between banks for the LPHA with the best credit history, chan-nelling funds towards projects that the public considers worth funding.
The housing banks operating in Austria today have been very successful in raising construc-tion money. However, since 2008, because HCCBs are not covered by the state deposit guarantee for private savings, the volume of ac-quired capital has decreased considerably, but declining interest rates have alleviated potential financing problems. Housing Banks remain an important institution in the Austrian model for the long-term.
There are additional innovations worth men-tioning in the Austrian housing finance system. Public loans often start with low interest pay-ments. In order to attain low (but always amortising) annuities in the first years, adjustable rate mortgages (ARM) with uncertain maturity or term for public loans have been introduced in the 1990s (“Kletterdarlehen”) and are mostly bound to developments of the Consumer Price Index. Due to its specific design, it was warranted that these loans kept amortising in any economic environment. At the same time, commercial housing developers have been introduced to the social rental housing scheme. During this period, the City of Vienna institutionalised competitions between commercial and limited-profit housing developers to promote innovation and public value in larger projects. Commercial developers are still able to make profitable returns on their investment using long-term sales strategies, such as buy-to-let schemes, while remaining within the income limits of approved schemes. In some cases, social housing projects realised by commercial developers (organised in inde-pendent project companies) were sold to listed commercial housing funds. The rationale was to mix low-risk low-return investments in so-cial housing with other investments with usually much higher risks. Another important innovation by the City of Vienna has been the acceptance that public loans have a subordinate ranking to commercial loans when the financing of social rental housing is involved, making desirable commercial developments within social housing projects easier to finance.
What is Structured Finance?
We now turn to the topic of structured finance (Jobst 2007, CGFS 2005, Standard & Poor’s 2003), which in some important ways shares common characteristics with the Austrian mode of financing social housing. Around the world, structured finance markets have become an important part of the financial system with is-suance volumes having grown strongly over recent years. This market aims to reduce the economic costs of capital, to reduce regulatory minimum capital requirements, to diversify as-set exposures and to redistribute asset risks to investors and broader capital markets (Jobst 2007, CGFS 2005).
Residential mortgages have formed an im-portant part of the asset pools for structured finance from the very beginning. However, to date, social housing has not been an explicit target of financing of this kind. Being highly dependent on state funding, attempts to se-cure long-term financing have often involved a downsizing of new construction and the transfer of debt obligations to the tenants with the pro-motion of right-to-buy schemes. In this process, mixed funding including commercial mortgages has become an important model within social housing finance across many parts of Europe since the late 1980s (White-head 2003, Gibb & Whitehead 2007:192).
Structured finance can be defined by three key characteristics, pooling, de-linking and tran-ching, as out-lined below:
1) Pooling of financial assets: Assets in the collateral pool can range from cash instruments (e.g. residential mortgages, credit card receivables, loans and bonds) to synthetic exposures such as credit default swaps (CDSs). Claims on the cash flows backed by these pools are sold to investors.
2) De-linking of the credit risk of the asset pool from the credit risk of the originator: Structured finance is a form of financing where the investor does not rely on the cre-dit risk of the originator, but on the quality of the underlying claim. This is because the securities are traded usually through a finite, standalone special purpose vehicle (SPV).
De-linking generates several benefits, both for the originator and the investor. With the asset pool as collateral, structured finance transforms into a form of secured borrowing (if defaults do not run rampant). However, the investor is affected only by the performance of the de-linked asset pool and not by the performance of the originator. While defaults in the underlying asset pool will lower the payments to the investor, other factors, such
Structured Financing Allows for Affordable Rental Housing in Austria

June 2009 HOUSING FINANCE INTERNATIONAL 17
as management default of the originator, should have no impact if the assets have been successfully de-linked. De-linked as-sets will not come under court jurisdiction should the originator file for bankruptcy. The returns of the well-defined tranches of the asset pool may be more predictable than the total returns of the originator (e.g. cash flows with stable distributions). Consequently, the credit risk of the de-linked assets is often lower than the credit risk of the originator, which facilitates access by the originator to cheaper sources of funding.
3) Tranching of liabilities that are backed by the collateral assets: Tranching is the feature that most distin-guishes structured finance products from traditional securitisations such as Asset Backed Securities, as de-linking and poo-ling is common to both types of instruments.
Typically, several tranches of securities are issued to distribute cash flows received from the underlying asset pool to diffe-rent investor groups. Tranching transforms the risk characteristics of the collateral pool into classes of securities with distinct, transaction-specific risk features. The risk-return profile of each tranche is defined according to factors such as riskiness, ti-ming of payments and fixed versus floating rates. The risk-return profile can be tai-lored to specific investment preferences.
A key goal of the tranching process is to create at least one class of securities whose rating is higher than the average rating of the underlying collateral pool. This is accom-plished, for example, through prioritisation of payments to the different tranches. The equi-ty/first-loss tranche absorbs initial losses, followed by a mezzanine tranche, which ab-sorbs some additional losses, again followed by more senior tranches. Thus, the most se-nior claims should be insulated from default risk of the underlying asset pool to the extent that the more junior tranches absorb credit losses. The higher the ranking of a given tranche, the lower the probability that the holder of that tranche will lose money. Losses to senior tranches, therefore, will be relati-vely rare, as these tranches are served first.
In a world of perfect financial markets, with no information asymmetries and with all assets readily tradable (i.e. without liquidity premium), tranching would not add value relative to a share in the pool, since the structure of liabilities would be irrelevant. Market imperfections are thus needed for structured finance to add value. Two such imperfections, which may play a role indi-vidually or in combination, are asymmetric information and market segmentation.
The implementation of structured finance re-quires a mature legal system and a stable economic framework that allows for all the aforementioned secondary market operations. The model requires that the SVP is legally sepa-rated from the balance sheet of the originator. De-linking of the originator of assets and the SVP is therefore a particularly demanding but important legal exercise.
As the model refers primarily to the cash flow of the projects, monitoring requirements are extensive. Structured finance needs detailed, deal-specific documentation including a de-finition of the transaction’s structure. This is a prerequisite for the intended characteristics, such as the seniority ordering of the various tranches, to be actually delivered under all plau-sible scenarios (CGFS 2005).
The tranches of structured finance are charac-terised by different risk-return profiles. There is scope for “splitting” the cash flows from an asset to create multiple types of securities. Jobst (2007) builds on this observation, de-monstrating that diversification improves the pricing and management of risk, increases stability at all levels of the financial system and ideally enhances general welfare. However, whilst the growth of risk-based lending has developed mortgage markets around the world, the retreat of lending informed by lo-cal banking relationships, and the complexity and lack of transparency of derivative financial products, have been largely held responsible for the present financial, housing market and consequently economic crisis.
Summing up, structured finance can be defined as a form of financial intermediation, based upon securitisation technology. Structured fi-nance encompasses all advanced private and public financial arrangements that serve to efficiently refinance and hedge any profitable economic activity beyond the scope of conven-tional forms of on balance sheet securities (debt, bonds, equity) at lower capital cost and agency costs from market impediments on li-quidity (CGFS 2005, Jobst 2007)
Elements of Structured Finance in Austrian Social Housing Funding
Social housing finance in Austria is a specific way to securitize financial assets, which aims to re-duce financing costs and minimise risks. For this reason, affordable housing finance in Austria can be considered as a risk-averse model of structu-red finance. In contrast to more common models of structured financing in commercial real estate financing, such as those mentioned above, it not only lowers capital costs, but also contributes to the stabilisation of financing and real estate mar-kets (Springler 2008).
Austrian social housing finance, as in the section above, shows some remarkable similarities to commercial structured finance:
It is a financing scheme that aims to reduce financing costs and minimise risks, and effectively combines interdependent mea-sures to reduce the risks to investment in any LPHA project.
Tranching, as shown in Figure 1, is a form of structured finance. However, there is a shift from high-risk low-ranking junior loans or mezzanine capital to low-risk equity like tranches, such as the provision of building land from municipalities or low-ranking pu-blic loans.
The scheme relies on a comprehensive econo-mic and legal framework, which transparently and effectively regulates the financial manage-ment of the LPHA sector.
The financing model refers to the cash flow of the projects and is only subordinated to the as-sets of the borrower (CGFS, 2005). This allows favourable financing conditions for smaller LPHA with smaller equity capital as well.
Monitoring requirements are extensive (CGFS, 2005).
Less informed investors purchase the senior tranches (HCCB), whereas the well-informed investors (the public) purchase the subordina-ted tranches.
The significant size of equity-like tranches reduces, combined with measures to reduce interest on equity.
The following aspects differ from structured finance:
Austrian social housing finance creates tradable securities only in the one tranche of HCCBs.
Housing banks cannot be considered as Special Purpose Vehicles (SPVs).
Assets are on balance sheet.
Financing bears much lower risk compared to common structured finance. The bigger part of the tranches may be characterised as equity capital. There is no need for junior loans or mezzanine capital.
Conclusions
Social housing finance in Austria appears to be very complex. By drawing parallels to the well documented commercial financing tool of struc-tured finance, this article attempts to promote more clarity into this structure of social housing in Austria. The comparison demonstrates that the Austrian model can be considered as an advanced financing system that effectively obtains moderate rents, security against rent volatility, secure returns for the property owner and moderates demands on state expenditure.
Structured Financing Allows for Affordable Rental Housing in Austria

18 HOUSING FINANCE INTERNATIONAL June 2009
The Austrian model of financing housing is suitable for adaptation in countries seeking to reform, re-invigorate or establish new social housing systems, and is now being applied in countries in transition. It is particularly relevant when combined with the business model of li-mited profit, cost rent cost-capped housing and may well serve the urgent needs of many Central and Eastern European (CEE) countries to provide rental housing in substantial quantities, serving the needs of middle- and lower-income groups (Dübel et al. 2006). Towards this end, it is not only necessary to build capacity in housing de-velopment, but also in housing investment and housing management as well.
References
Amann, W. & Mundt, A. (2006) The Austrian System of Social Housing Finance Institute for Real Estate Construction and Housing Ltd, Vienna, IIBW.
Ball, M. (2005) RICS European Housing Review 2005, London et al., Royal Institute of Chartered Surveyors.
Bauer, E. (2004) Austria, in Asset Management in the Social Rented Sector: Policy and Practice in Europe and Australia Kluwer Academic Publishers Dordrecht, London and Boston.
CECODHAS (2007) Housing Europe 2007: Review of Social, Co-operative and Public Housing in the 27 EU Member States, Brussels, CECODHAS European Housing Observatory.
CGFS – Committee on the Global Financial System (2005) The role of ratings in structured finance issues and implications, Bank for International Settlements.
Czasny, K. (Ed.) (2004) The Importance of Housing Systems in Safeguarding Social Cohesion in Europe. Final Report, Vienna, SRZ.
Czasny, K; Feigelfeld, H.; Hajek, J.; Moser, P. & Stocker, E. (2008) Wohnzufriedenheit und Wohnbedingungen in Österreich im europäischen Vergleich, Vienna, SRZ.
Deutsch, E. (2007) ‘The process of diffusion through the social rented sector.’ Research Group EOS, University of Technology, Vienna. Paper presented to the Housing Economics Group (ENHR) Workshop, Edinburgh, 15th-16th February.
Dübel, H.-J., Brzeski, W.J., & Hamilton, E. (2006) Rental Choice and Housing Policy Realignment in Transition, Post-Privatization Challenges in the Europe and Central Asia Region, Washington, The World Bank.
ECB (2009) Housing Finance in the Euro Area, Structural issues Report. Frankfurt a.M., European Central Bank.
Euroconstruct (12/2008) Summary of the European construction markets 12/2008, Munich, Euroconstruct.
FOH (Federal Office of Housing) (2006) Human Settlement in Switzerland, Grenchen, FOH.
Gibb, K. & Whitehead, C. (2007) Towards the More Effective Use of Housing Finance and Subsidy, in: Housing Studies, Vol. 22 (2), pp. 183-200.
Gorton, G. & Pennacchi, G. (1990) Financial Intermediaries and Liquidity Creation, in: Journal of Finance, Vol. 45 (1), pp. 49-71.
Harloe, M. (1995) The People’s Home: social rented housing in Europe and America, Oxford, Blackwell.
Jobst A. (2007) A primer on structured finance, in: Journal of Derivatives and Hedge Funds, Vol. 13 (3), pp. 199-213.
Kemeny, J., Kersloot, J. & Thalmann, P. (2005) Non-profit housing influencing, leading and dominating the Unitary Rental Market: Three Case Studies, in: Housing Studies, Vol. 20 (6), pp. 855-872
Lawson, J & Milligan, V. (2007) International trends in housing issues and policy responses, Melbourne, Australian Housing and Urban research Institute (AHURI).
Lawson, J. (2009) The transformation of social housing provision in Switzerland mediated by federalism, direct democracy and the urban/rural divide, in: European Journal of Housing Policy, Vol. 9 (1), pp. 45-67.
Lugger, K. (2007) Österreichisches Wohnhandbuch 2007, Innsbruck, Studienverlag.
Lugger, K. & Amann, W. (Ed.) (2006) Der soziale Wohnbau in Europa. Österreich als Vorbild, Vienna, IIBW.
Lundqvist, L. (1992) Dislodging the Welfare State? Housing and Privatisation in Four European Nations. Housing and Urban Policy Studies no. 3, Delft, Delft University Press.
Milligan, V., Gurran, N., Lawson, J., Phibbs, P. & Phillips, R. (forthcoming) Innovations in Affordable Housing in Australia, Melbourne, Australian Housing and Urban research Institute (AHURI).
Reinprecht, C. (2007) Social housing in Austria, in: Whitehead, C. & Scanlon, K. (Ed.) Social Housing in Europe, LSE, London, pp. 35-43.
Schmidinger, J. (2008) Wohnbaubanken und ge-meinnützige Bauvereinigungen – eine Partnerschaft für nachhaltig günstiges Wohnen, in: Lugger, K. & Holoubek, M. (Ed.) Die österreichische Wohnungs-gemeinnützigkeit – ein europäisches Erfolgsmodell, Vienna, Manz pp. 259-268.
Springler, E. (2008) Wohnbaufinanzierung aus volk-swirtschaftlicher Sicht, in: Lugger, K. & Holoubek, M. (Ed.) Die österreichische Wohnungsgemeinnützigkeit – ein europäisches Erfolgsmodell, Vienna, Manz, pp. 281-92.
Standard & Poor’s (2003) Structured Finance. Glossar zur Verbriefung von Finanzaktiva.
Unger, B. & Heitzmann, K. (2003) The adjustment path of the Austrian welfare state: back to Bismarck?, in: Journal of European Social Policy, Vol. 13 (4), pp. 371-387.
Whitehead, C. & Scanlon, K. (2007) (Ed.) Social Housing in Europe, LSE, London.
Whitehead, C. (1999) The Provision of Finance for Social Housing: The UK Experience, in: Urban Stud-ies, Vol. 36 (4), pp. 657-672.
Whitehead, C. (2003) Financing Social Housing in Europe, Housing Finance International, June 2003.
Whitehead, C. (2007) Social housing in England, in: Whitehead, C. & Scanlon, K. (Ed.) Social Housing in Europe, LSE, London, pp. 54-69.
Structured Financing Allows for Affordable Rental Housing in Austria

June 2009 HOUSING FINANCE INTERNATIONAL 19
Mortgage Registration and Foreclosure around the Globe: Evidence from 42 Countries
1 Stephen Butler is Senior Associate at the National Opinion Research Center at the University of Chicago (NORC). Ms Kravkova is an Associate Investment Officer at the International Finance Corporation. Ms. Safavian (corresponding author) is a Senior Economist at the World Bank. The authors would like to thank Simeon Djankov, Kenroy Dowers, Olivier Hassler, Anjali Kumar and Simon Walley for their comments and suggestions. Maximilien Heimann provided valuable research support for data collection. The Findings, interpretations, statements and conclusions expressed herein are those of the authors alone and do not necessarily reflect the views of
the International Bank for Reconstruction and Development/The World Bank and its affiliated organisations, or those of the Executive Directors of The World Bank or NORC.
2 Data was collected and assembled for a World Bank report, Financing Homes, pu-blished in September, 2008.
3 http://www.doingbusiness.org.4 Butler (2003).
Mortgage Registration and Foreclosure around the Globe:
Evidence from 42 Countries By Stephen Butler, Mariya Kravkova and Mehnaz Safavian1
Overview
Mortgage financing amounts to less than 1% of GDP in Egypt. It comes to 10% of GDP in Mexico, 39% in South Africa and it is equal to more than 85% of GDP in New Zealand. Why these big differences? They stem in part from the difficulties buyers face in registering a mor-tgage and title transfer - and the difficulties creditors face in foreclosing on a property when a borrower defaults.
Registering a mortgage and title transfer takes three days in New Zealand and four in Georgia - but 193 days in Egypt and a year in Rwanda. The cost to do so ranges from a low of 0.04% of the property value in Canada and 0.08% in New Zealand to a high of 12% in Burkina Faso and 13% in Guatemala.
Foreclosing on a property in default takes 260 days on average. But the time varies conside-rably across countries, ranging from a low of 55 days in Kazakhstan to a high of 706 in Ghana. The cost of foreclosure also varies greatly, ran-ging from 1.4% of the property value in Japan and 1.9% in Romania to almost 48% in Zambia.
This article benchmarks regulatory efficiency in the registration of a mortgage and title trans-fer, and in foreclosure in 42 countries.2 Using a methodology modeled on the Doing Business indicators, which allow comparisons across countries and over time, the study investigates the time and cost to comply with regulation.3 It creates indices on the efficiency of the registra-tion system and the degree to which notaries
are involved in the process of registering a mor-tgage and title transfer. In addition, it documents countries’ choice of judicial or administrative procedures for foreclosure. To identify features of registration and foreclosure systems that may foster housing finance, the study links these indicators to the size of mortgage mar-kets. It also documents and analyzes recent reforms to highlight the benefits of regulatory improvements for growing homeownership.
Mortgage registration and foreclosure are just part of what drives growth in mortgage finance and the housing market. Other features of an economy also have an effect - the existence of secondary mortgage markets and other sources of long-term funding, income distri-bution and effective demand, the size of the overall financial sector, macroeconomic stabi-lity and land titling and use policies.
Still, mortgage registration and foreclosure are an important part. When the system for regis-tering a mortgage and title transfer functions poorly, it can create a bottleneck in the housing finance system and add substantially to the costs of a housing transaction. When foreclosure processes are slow and outcomes uncertain, housing finance becomes more expensive or even unavailable for many borrowers.
1. Registering a Mortgage
Inefficiency in the process to register a mortgage and title transfer matters because it can create a bottleneck in the housing finance system and
substantially increase the costs of a housing transaction. Registration of real property rights affects secured housing finance at almost every step. It enables the creditor to determine that the borrower owns the property and has the right to pledge it, and makes it possible to identify any third-party rights to the property that might in-terfere with enforcement of the mortgage right. Registration of the mortgage ensures the cre-ditor’s priority over other secured creditors and most holders of unregistered rights.4
When registration is unreliable - for example, if there are long delays in publishing the registra-tion or if there is a potential for competing title claims to emerge later - creditors face much higher risk in extending a mortgage. The result is likely to be higher interest rates and larger down payments for homeowners.
Speed, low-cost and simplicity are fundamental to an efficient system for registering mortgages and title transfers. The following sections use these three criteria in examining the efficiency of the registration process across 42 countries.
1.1 Time to Register a Mortgage
The time for registration is measured by the number of calendar days required to register a mortgage and title transfer, starting with the conclusion of the sale agreement and up to the perfection of the mortgage lien. The analysis as-sumes that a mortgage loan is used to acquire a registered residential property from a seller who is the registered owner and that there are in effect two transactions to be registered - the

Mortgage Registration and Foreclosure around the Globe: Evidence from 42 Countries
5 Without these assumptions, the delays would be much longer. For example, the initial registration of a property is the most difficult and time-consuming registration transaction. Moreover, if the seller is not the current registered owner, the entire
intervening chain of title might have to be reviewed once the registration application is submitted.
20 HOUSING FINANCE INTERNATIONAL June 2009
transfer of the title to the property and the esta-blishment of a mortgage on the new title.5
The speed of registration varies considerably. The process takes three days in New Zealand and four days in Armenia and Georgia. However, it takes nearly seven months in Egypt and a year in Rwanda (Figure 1).
What drives these differences? Delays may be rooted in the operational infrastructure of the registration system, the bureaucratic pro-cess itself, the capacity of registry staff or the overall legal environment. Rwanda has simple regulation, yet still has the slowest process for registering property and mortgages in the sample. Once it has been verified that the owner has a valid title and that the property is free from encumbrances, the sale agreement can be drafted and authenticated. With these documents and payment receipts in hand, along with a certificate of good standing from the tax authority, it is then possible to go to the registrar and register the transfer. Nevertheless, here is where the problem lies: there is only one registrar and issuing a new title and registering the mortgage charge attached to it takes from six months to a full year (Figure 2).
In Ghana, with two land titling systems, there is much uncertainty about the authenticity of titles. Lenders, though not required to do so, usually register property in the registries of both systems. That is what causes the delay in the registration process.
Figure 1 Time for Registration of a Sale and Mortgage Transaction
Source: Financing Homes database.
400
300
200
100
0
Rwan
da
Egyp
t
Nica
ragu
a
Ghan
a
Burk
ina
Faso
Sri L
anka
Mex
ico
Keny
a
Alge
ria
Croa
tia
Dom
inic
an R
epub
lic
Pana
ma
Kaza
khst
an
Indi
a
Arge
ntin
a
Russ
ia
Nige
ria
Tuni
sia
Zam
bia
Ugan
da
Alba
nia
Rom
ania
Braz
il
Peru
Uzbe
kist
an
Chile
Sout
h Af
rica
Mal
i
Guat
emal
a
Colo
mbi
a
Japa
n
El S
alva
dor
Cana
da
Viet
nam
Leba
non
Paki
stan
Azer
baija
n
Turk
ey
Geor
gia
Arm
enia
New
Zea
land
Days
Figure 2
9 months to complete the last procedure in
Procedures
Finalize registration at the Registrar of Real Estate and obtain new deed
400
300
200
100
0
270
Source: Getting Housing Finance
1 2 3 4 5 6
60 days to Register title in Ghana
Procedures
Property is registered at both the Deeds Registry and the Land Title Registry.
150
100
50
0
60
Source: Getting Housing Finance
1 2 3 4 65 7

Mortgage Registration and Foreclosure around the Globe: Evidence from 42 Countries
June 2009 HOUSING FINANCE INTERNATIONAL 21
Figure 3 Total Cost of Registration (Percent of Property Value)
Source: Financing Homes database.
20
18
16
14
12
10
8
6
4
2
0
Nige
ria
Guat
emal
a
Burk
ina
Faso
Rwan
da
Mal
i
Arge
ntin
a
Indi
a
Alge
ria
Tuni
sia
Leba
non
Sout
h Af
rica
Zam
bia
Croa
tia
Mex
ico
Sri L
anka
Paki
stan
Keny
a
El S
alva
dor
Dom
inic
an R
epub
lic
Japa
n
Nica
ragu
a
Ugan
da
Peru
Braz
il
Ghan
a
Pana
ma
Uzbe
kist
an
Rom
ania
Colo
mbi
a
Turk
ey
Chile
Kaza
khst
an
Egyp
t
Alba
nia
Azer
baija
n
Arm
enia
Viet
nam
Russ
ia
Geor
gia
New
Zea
land
Cana
da
1.2 Cost to Register a Mortgage
The cost to register a mortgage and title transfer is another target of reforms aimed at increasing homeownership. This cost is measured by cal-culating all official expenses associated with each procedure for registration. These include fees, transfer taxes, stamp duties and other payments made to public agencies as well as payments to notaries or lawyers if their partici-pation is required by law.
The biggest fees and charges are not related to registering the mortgage itself. The fees to register a mortgage are typically minor, though once notary fees are taken into account they can be as high as 2–3% of the amount of the property value. Instead, the biggest costs are associated with the transfer of the property to be mortgaged. For this, state stamp duties and transfer taxes in the range of 7–10% of the pro-perty value are common.
Such transfer taxes can be among the main causes of informality of property tenure. Consider Lagos, Nigeria, where the cost to re-gister a mortgage is only 0.2% of the amount of the property value, while the transfer taxes and stamp duties are 10% of the property value. Similarly, in Croatia, registering a mortgage re-quires only a nominal fixed registration fee and moderate notary charge, but transferring the property involves a tax amounting to 5% of the property value. On average across countries, taxes and stamp duties account for 73% of the cost to register a mortgage and title transfer.
The cost of registering the property sale and mortgage transaction varies widely, ranging from a low of 0.04% of the property value in
Canada and 0.08% in New Zealand to a high of 12% in Burkina Faso and 13% in Guatemala (Figure 3). In Guatemala, the seller pays a value added tax of 12% when the title is transferred. In Brazil, the costs consist of a transfer fee of 2–7% (depending on the state) and various other costs amounting to about $2,000.
1.3 Simplicity of Mortgage Registration
Simplicity of registration of a mortgage and title transfer is captured through two dimensions of the process: whether notaries are involved and how easily registry information can be accessed. Fewer steps in registration tend to mean lower costs and greater speed. However, many countries add steps by requiring that mortgage documents be certified by a notary. Similarly, cheap and efficient access to registry data on property ownership and encumbrances is important for lenders. Nevertheless, many countries restrict access or impose complica-ted rules and procedures, increasing costs and time, and decreasing reliability.
The involvement of notaries in registration is measured by the mandatory notary index. This index reflects whether there are requirements for notaries to certify mortgage documents, to prepare such documents and to complete the registration process as well as whether their fees are legally regulated. The index ranges from 0 to 1, with higher values indicating higher levels of mandatory participation by notaries.
The registry inefficiency index focuses on speed, transparency, cost and accessibility. Speed is measured by the number of days to check encumbrances, transparency by whether
the system is electronic, cost by the fees charged to search for encumbrances and ac-cessibility by whether there are restrictions on access. This index also ranges from 0 to 1, with higher values indicating greater inefficiency (Figure 4 next page).
What effect does involving notaries have on registration of a mortgage and title transfer? As the mandatory notary index increases, the cost of registration increases by 1%. However, notaries do not necessarily slow the registration process: no significant association was found between the involvement of notaries and the time to register a mortgage and title transfer.
Inefficiency of the property registry was found to have no association with either the time or the cost to register a mortgage and title trans-fer. However, having an electronic registry does matter: in countries with electronic systems the registration process took 26 fewer days, controlling for country income and other as-pects of the legal environment.
Poor countries have more inefficient registra-tion: the time and cost decrease as country incomes increase. Africa emerges as the region with the most onerous and costly processes for registering mortgages (Figure 5 next page).
2. Foreclosing on a Property
An efficient foreclosure law balances the rights of lenders and borrowers in the event of a loan de-fault. However, in some countries the law gives excessive protections to borrowers who may have fallen on hard times and these protections can impose substantial costs on lenders. When

22 HOUSING FINANCE INTERNATIONAL June 2009
lenders adjust for these costs, the outcome can be higher interest rates, larger down payments or credit rationing in the overall market.6
These costly outcomes for borrowers can be avoided with faster foreclosure processes. A faster process means greater certainty in reali-sing collateral rights - and thus lower risks for the creditor of lost interest and principal from a collapse in the real estate market or a dete-rioration in the value of collateral because of vandalism or poor property maintenance. It also means lower costs - and thus greater proceeds from the sale of the home. That benefits both the creditor and the debtor. It also benefits the government, through greater tax revenue.7
Time and Cost of Foreclosure
In many countries, the mortgage market is still evolving, so there are few examples of len-ders enforcing a mortgage. This is the case in Rwanda. In other countries, the foreclosure process is cumbersome and lenders rely on workouts to avoid court proceedings. This is the case in the Russian Federation.
Variations like these can complicate compa-risons of the time and cost of foreclosure. To ensure comparability across countries, the cal-culations of time and cost are based on several assumptions. These assumptions mean that the findings here represent a best-case scena-rio - the minimum time and cost possible for carrying out a foreclosure. In practice, foreclo-sure times are likely to be greater than those presented here. In addition, costs may be higher in some countries because of bribes.
6 Pence (2006).7 Butler (2003).
Mortgage Registration and Foreclosure around the Globe: Evidence from 42 Countries
Figure 5: Time and Cost to Register property - Regional Averages
0.0 0.0 %
1.0 %
2.0 %
3.0 %
4.0 %
5.0 %
6.0 %
7.0 %
8.0 %
20.0
40.0
60.0
80.0
100.0
120.0
Tim
e ( d
ays
)
Cost ( % of property value )
Time
Highincome :
OECD
Europe &Central
Asia
LatinAmerica &Caribbean
SouthAsia
Middle East& NorthAfrica
Sub-SaharanAfrica
Cost
Source: Getting Housing Finance.
Figure 6: Foreclosure Times Around the World
Source: Financing Homes database.
020
040
060
080
0Ti
me
to F
orec
lose
( D
ays )
Ghan
aCo
lom
bia
El S
alva
dor
Viet
nam
Tuni
sia
Japa
nM
ali
Pana
ma
Mex
ico
Arm
enia
Arge
ntin
aPe
ruZa
mbi
aGe
orgi
aBr
azil
Russ
iaUz
beki
stan
Croa
tiaCh
ileKe
nya
Ugan
daLe
bano
nAl
bani
aSo
uth
Afric
aEg
ypt
Indi
aGu
atem
ala
New
Zea
land
Turk
eyAz
erba
ijan
Paki
stan
Nige
riaBu
rkin
a Fa
soCa
nada
Dom
inic
an R
epub
licRo
man
iaNi
cara
gua
Sri L
anka
Unite
d St
ates
Kaza
khst
an
Source: Financing Homes database.
South AfricaGuatemala
New ZealandColombia
CroatiaZambia
JapanGeorgia
PeruLebanon
El SalvadorArgentina
CanadaArmenia
Dominican RepublicPanamaTunisia
PakistanRwandaVietnam
MaliAzerbaijan
IndiaUzbekistan
RomaniaRussiaNigeria
Kazakhstan AlgeriaAlbania
EgyptNicaragua
Burkina FasoChileBrazil
Sri LankaTurkeyKenya
UgandaGhana
Mexico
.2 .4 .6 .80
Registry Inefficiency Index
.2 .4 .6 .8 10
Notary Involvement Index
CanadaJapan
New ZealandBrazil
Georgia Ghana
IndiaKazakhstan
NigeriaPakistanRwanda
TurkeyArmenia
AzerbaijanCroatia
Dominican RepublicEl Salvador
LebanonPeru
RomaniaRussia
Sri LankaUganda
UzbekistanVietnamZambiaAlbania
ArgentinaChile
ColombiaKenya
NicaraguaPanama
South AfricaTunisiaAlgeria
Burkina FasoEgypt
GuatemalaMali
Mexico
Figure 4

June 2009 HOUSING FINANCE INTERNATIONAL 23
Time is calculated as the number of calendar days starting from the time the borrower receives a notice of intent to commence foreclosure pro-ceedings until the time the lender collects on the loan. The assumption is that the borrower does not resort to unnecessary delaying tactics or ex-ploit all appeals processes available. However, if the time for an appeal is provided to the bor-rower before a judgment becomes effective, it is factored into the time calculations. The property is owner-occupied and the borrower vacates it voluntarily once a judgment is reached. The property is in good condition, has maintained its market value and is sold during the first auction. Finally, all calculations are based on the system in place in the capital or most populous city; in countries with federal systems, such as Mexico and Nigeria, foreclosure processes may vary from state to state.
Across countries, the average foreclosure time is 260 days. However, there is much variation. Foreclosure times range from a low of 55 days in Kazakhstan and 58 in the United States to a high of 705 days in Colombia and 706 in Ghana (Figure 6 previous page).
Just as the total time to foreclose on a property varies, so too does the time to complete the
three main steps that make up the foreclosure process: notification of the borrower, judgment and enforcement of the judgment. Notification starts when the lender, a court or a notary sends written warnings to the borrower that if the debt is not paid in full within a certain pe-riod, the borrower’s rights to the property will be terminated. It ends once the borrower receives official notification that the foreclosure process has begun.8
Judgment is the process by which a court rules on the existence of the debt and the right to enforce the mortgage. This process, when applicable, starts once the borrower’s default on the mortgage is officially registered or de-clared or the case is accepted by the court. It ends when a judgment is issued. Depending on the law, judgment may include a redemption period, when the borrower may still prevent or reverse the sale of the property by paying the debt in full and an appeal period.
Enforcement, the process of collecting on the loan, starts from the day the judgment is issued or, in non-judicial foreclosure, the day the bor-rower is notified by the lender of its intent to sell the property. Enforcement ends once the lender collects on the loan. It is assumed that
the borrower does not appeal the judgment. Enforcement of the mortgage by sale of the pro-perty may entail either a public open or sealed bid auction (and any announcements or publi-cations required beforehand) and a transfer of deed to a new owner when the property is sold. In non-judicial enforcement systems, the pro-perty may be sold by private contract between the lender and a third-party purchaser.
With a few exceptions, notification is a small part of the foreclosure process. It is the judg-ment and enforcement phases that are responsible for delays. The judgment phase in Ghana can take up to 545 days. Enforcement in El Salvador can take up to 286 (Figure 7).
The cost of foreclosure consists of the fees paid by the lender to obtain property foreclosure in the jurisdiction. These fees do not represent the entire cost of foreclosure. The real cost is likely to be higher, especially when processes are long. Consider the US’ housing market. A study shows that transaction costs account for only about 37% of the total. The rest comes from in-terest expense, the loss on the unpaid balance of the loan, utilities and preservation and main-tenance (Figure 8).
Mortgage Registration and Foreclosure around the Globe: Evidence from 42 Countries
Figure 7: Time for Foreclosure Processes Notification Judgment Enforcement
0
Tim
e to
For
eclo
se (
Day
s )
200
400
600
800
Colo
mbi
aGh
ana
El S
alva
tor
Viet
nam
Tuni
sia
Japa
nM
ali
Pana
ma
Mex
ico
Arm
enia
Arge
ntin
aPe
ruZa
mbi
aGe
orgi
aBr
azil
Russ
iaUz
beki
stan
Croa
tiaCh
ileKe
nya
Ugan
daLe
bano
nAl
bani
aSo
uth
Afric
aEg
ypt
Indi
aGu
atem
ala
New
Zea
land
Turk
eyAz
erba
ijan
Paki
stan
Nige
riaBu
rkin
a Fa
soCa
nada
Dom
inic
an R
epub
licRo
man
iaNi
cara
gua
Sri L
anka
Kaza
khst
anUn
ited
Stat
es
Time allocated for notification
Time allocated for enforcement
Time allocated for judicial process
Source: Financing Homes database.
8 In most countries the notice of intent to foreclose is preceded by a prior notice, also required by law, notifying the debtor of the default and requesting that the account be brought current. Only upon lack of response to this default notice is the notice of intent to foreclose issued. The time for the default notice, which can be as long
as 15–30 days, is not considered in these calculations. A main difference between a default notice and a notice of intent to foreclose is that the first usually holds out the possibility of bringing the account current while the second typically accelerates the loan and demands payment in full.

9 See, for example, Pence (2006). 10 Pennington-Cross (2003).
24 HOUSING FINANCE INTERNATIONAL June 2009
Mortgage Registration and Foreclosure around the Globe: Evidence from 42 Countries
Like the time for foreclosure, the cost too varies widely. It ranges from 1.4% of the property value in Japan and 1.9% in Romania to almost 48% in Zambia (Figure 9).
Judicial or Non-Judicial?
One factor in the time and cost to foreclose is whether judicial foreclosure is required. A re-quirement of judicial foreclosure, as in Ghana or Mexico, means that a creditor cannot sell collateral without first going through the courts to obtain a court judgment on the debt and an order of execution. That can raise lenders’ fo-reclosure costs by as much as 10% of the loan balance and add up to five months to the time on average.9 A study of the US market finds that houses in foreclosure sell for 4% less in states that require judicial foreclosure than in those
that do not, presumably because of greater deterioration of the property during the longer process.10 This report finds similar patterns, with even stronger associations.
One alternative to judicial foreclosure is a non-judicial process that gives the creditor the power to sell the pledged property without court intervention. Under a power-of-sale procedure, a creditor may proceed directly to sale of the property, by auction or private transaction, af-ter a notice to the debtor. In practical terms, the power of sale relieves the creditor of the burden of going to court and presenting a case. It ins-tead places this burden on the debtor, who can go to court to stop the sale of the property. In this case, the debtor has the burden of proof.
In another alternative, this one in judicial fore-closure, the judicial proceedings are a formality,
as in the summary proceedings of Brazil and South Africa. A summary proceeding is typically what happens when a creditor skips the judg-ment phase of an action and applies directly for an order of execution against the property. This can be done by presenting a simple case by affidavit, with or without the debtor appearing. Summary proceedings place a greater burden on the debtor to stop the sale of the property. However, they can be converted into full-fle-dged judicial proceedings by lodging permitted defences. Often the availability of a summary proceeding hinges on the existence of a loan agreement or similar document that does away with the need to prove the debt.
All three variations exist in the countries in the sample, with clear differences in outcomes (Table 1). In countries with judicial procedures, foreclosing on a property takes 415 days on ave-
Judicial Summary proceedings Non-Judicial
Albania Argentina CanadaArmenia Azerbaijan IndiaColombia Brazil Kazakhstan El Salvador Burkina Faso Kenya Ghana Chile New Zealand Japan Croatia Nigeria Lebanon Dominican Republic Pakistan Mali Egypt Romania Mexico Georgia Sri Lanka Panama Guatemala Uganda Tunisia Nicaragua United StatesUzbekistan PeruVietnam Russian FederationZambia South Africa
Turkey
Note: The laws of Vietnam and Azerbaijan provide power of sale for lenders, but few attempt private sale. The two countries are therefore categorised as judicial or summary proceeding jurisdictions. Source: Financing Homes database.
Table 1: Countries by type of foreclosure procedure
Figure 8: Composition of Average Total Costs to a Mortgage Inverstor
Legal & Court Fees, 6%
Loss on UPB, 20%
Utilities and other,9%
Preservation and Maintenance, 9%
Interest Expense,24%
Taxes, Ins, HOAFees, 10%
Commissions & SellerConcessions, 21%
Source: Cutts and Merrill (2008).
Figure 9: Total Cost to Foreclose as Percent of Market Value
% o
f Mar
ket V
alue
Zam
bia
Uzbe
kist
anEl
Sal
vado
rTu
nisi
aAr
gent
ina
Mex
ico
Azer
baija
nLe
bano
nDo
min
ican
Rep
ublic
Pana
ma
Geor
gia
Peru
Paki
stan
Arm
enia
Ghan
aCo
lom
bia
Turk
eyGu
atem
ala
Braz
ilCh
ileBu
rkin
a Fa
soRu
ssia
Sri L
anka
Nige
riaUg
anda
Nica
ragu
aCa
nada
Egyp
tKe
nya
Croa
tiaAl
bani
aKa
zakh
stan
New
Zea
land
Sout
h Af
rica
Indi
aRo
man
iaJa
pan
0.2
.4.6
Source: Financing Homes database.

rage. In those allowing summary proceedings, the average is 200 days. Moreover, in countries with non-judicial procedures, foreclosure takes only 139 days on average.
Splitting the sample into two groups rather than three shows a statistically significant association between non-judicial procedures and shorter foreclosure time. This result holds whether the comparison is between countries allowing non-judicial or summary proceedings and those with judicial procedures - or between countries with
strictly non-judicial procedures and those with judicial (including summary) proceedings.11
Similar differences emerge for the cost of foreclosure. In judicial procedures, the cost ave-rages 16% of the property value; in summary proceedings, 8.7%; and in strictly non-judicial procedures, 5%. The difference in cost is dri-ven mainly by legal fees. On average, legal fees amount to 8% of the property value in judicial procedures, but only 4% in summary procee-dings and 1% in non-judicial procedures.
Judicial processes are kept in place mainly to protect borrowers from abusive practices by len-ders. However, there is little evidence that court involvement is necessary to do so. Conversely, there is evidence that the long foreclosure times associated with judicial procedures reduce the chances that borrowers will keep their home.12
Borrower protections can be built into non-judicial procedures through power-of-sale regulations and rights of appeal. Power-of-sale regulations often include detailed rules on the organisation and advertising of the sale, notice
June 2009 HOUSING FINANCE INTERNATIONAL 25
Mortgage Registration and Foreclosure around the Globe: Evidence from 42 Countries
Figure 10: Mortage Debt Outstanding
Figure 10: Mortage Market Size By Region
Sub-
Saha
ran
Afric
a
Sout
h As
ia
Mid
dle
East
& N
orth
afri
ca
Latin
Am
eric
a Ca
ribbe
an
Hign
inco
me :
OEC
D
Euro
pe &
Cen
tral A
sia
East
Asi
a &
Paci
fic
Mor
tage
Deb
t Out
stan
ding
as
% o
f GD
P
0.2
.6.4
Mor
tage
Deb
t Out
stan
ding
as
% o
f GDP
New
Zea
land
Unite
d St
ates
Cana
da
Japa
n
Sout
h Af
rica
Pana
ma
Coat
ia
Chile
El S
alva
dor
Mex
ico
Tuni
sia
colo
mbi
a
Braz
il
Indi
a
Leba
non
Nica
ragu
a
Alba
nia
Ghan
a
Turk
ey
Geor
gia
Dom
inic
an R
epub
lic
Kaza
khst
an
Peru
Rom
ania
Guat
emal
a
Arge
ntin
a
Viet
nam
Arm
enia
Ugan
da
Paki
stan
Russ
ia
Nige
ria
Egyp
t
Uzbe
kist
an
0.2
.4.6
.8
Mortage Debt Outstanding as % of GDP
Source: Financing Homes database.
Figure 10: Mortage Market Size By Income Level
Low income
Lower middle income
Upper middle income
High income
0 .2 .4 .6
11 When the sample is divided into three groups (countries with judicial procedures, those with summary proceedings and those with non-judicial procedures), there are too few observations to produce statistically significant results.
12 Cutts and Merrill (2008).

26 HOUSING FINANCE INTERNATIONAL June 2009
Mortgage Registration and Foreclosure around the Globe: Evidence from 42 Countries
to interested parties, minimum sale price and distribution of sale proceeds. Some laws make creditors explicitly liable to the debtor for any difference between the sale price and the fair market value of the property. Others prohibit cre-ditors from collecting deficiency judgments from debtors if the property is sold below market va-lue. Few, if any, non-judicial procedures prevent debtors from stopping a non-judicial process by lodging an objection with a court of first instance. Moreover, moving foreclosure out of the courts can relieve court backlogs. In many countries, debt collection accounts for a large share of court cases.13
Rapid processes for foreclosure that are well de-fined and that balance the rights of creditors and debtors should be the objective of any meaning-ful reform. This report’s evidence (and evidence from several developed economies) suggests that non-judicial foreclosure can achieve this objective.14 Nevertheless, other mechanisms potentially could as well, such as a system of specialised commercial courts or training for judges enabling them to process cases much faster. However, commercial courts and judicial training programmes are not a subject of the data collection exercise for this report, and jud-ging their effectiveness goes beyond its scope.
Enforcement Mechanisms
Another aspect of the foreclosure process is the mechanism for enforcing the security - or liquidating the property. A public auction is often required for the sale and in many jurisdictions a minimum price is set by the court, by agree-ment of the parties or by the auctioneer subject to the approval of the court or the parties. This is to ensure transparency in the process for li-quidating the property and to protect the debtor from possible abuse by the creditor.
Whether or not requiring a public auction ful-fils these objectives is debatable. Evidence in developed mortgage markets suggests that participation in auction sales is limited to pro-fessional speculators seeking bargains. Auction prices rarely exceed the established starting price or the debtor’s outstanding obligations.
There are no detailed data for analysing pro-perty sales and public auction requirements.15 However, it is possible to study the effect of the public auction requirement on the cost of foreclosure and the depth of the mortgage mar-ket in the sample of 42 countries. What are the findings? Public auctions are associated with higher foreclosure costs and thinner mortgage markets. Indeed, requiring a public auction - rather than allowing sale by private treaty - increases the cost of foreclosure by 6%.
3. Effects on Housing Markets
Determining which attributes of mortgage re-gistration and foreclosure help increase housing finance is a worthwhile analysis. The depth of housing finance is not the same as access to housing. Access to housing is the direct measure of success. However, the data for this are not wi-dely available.
An indirect measure of the depth of housing fi-nance is the share of households with access to housing finance products.16 However, these data are available for only a few countries. The next-best indirect measure is mortgage debt outstanding relative to a country’s income.17 These data exist for 34 of the 42 sample countries.
In New Zealand and the United States, mor-tgage debt amounts to around 80% of GDP (Figure 10 previous page). In Egypt, it amounts to less than 1%. The average for rich countries is 60%; the average for low- and middle-in-come countries is 6%.
The size of the housing finance market in a country depends on many economic characte-ristics, including land rights, income distribution, macroeconomic stability, financial market depth, urban planning policies and the availability of other sources of long-term financing. The ana-lysis here is more modest. It correlates aspects of the mortgage registration and foreclosure processes with housing finance. The analysis controls for country income and for the overall strength of the legal environment, proxied by the strength of legal rights.18
The results show that the amount of housing finance, measured by mortgage debt outstan-
ding relative to GDP, is linked to several features of the regulatory environment. Simplicity of pro-cesses (as measured by the mandatory notary index) has a significant positive association with the size of the mortgage market. The time it takes to complete these processes, however, is not strongly associated with the market’s size.
Higher legal fees for foreclosure are linked with smaller mortgage markets. As legal fees required for foreclosure increase by one stan-dard deviation, the size of the mortgage market decreases by 4%.19 In Pakistan, legal fees for foreclosure are more than twice income per capita. Therefore, the recent reform making non-judicial foreclosure an option has a big po-tential payoff: an increase in mortgage lending from less than 1% of GDP to 4.5%.
High registration fees, stamp duties and trans-fer taxes on property transfers similarly appear to have a dampening effect on the mortgage market. For every $1,000 increase in these costs, mortgage debt outstanding decreases by nearly 5%.
More bureaucracy is also linked with less housing finance. There is a strong negative association between the mandatory notary index and the size of the mortgage market.20 Take the examples of Guatemala and El Salvador. Guatemala scores the maximum on the mandatory notary index (1, indicating more bureaucracy), while El Salvador scores at the mean (.5). The two countries have similar in-come levels. However, in Guatemala mortgage debt outstanding is 1.8% of GDP, while in El Salvador it is 10%. Simple regression analysis suggests that if Guatemala had a level of no-tary involvement similar to that in El Salvador, its mortgage debt could potentially increase to about 8% of GDP.
Switching from a judicial to a non-judicial procedure could increase the depth of the mortgage market by 12%. Putting in place summary proceedings to limit (but still main-tain) judicial intervention could also expand the mortgage market. However, requiring a public auction rather than allowing a private sale by the lender has the opposite effect: it is asso-ciated with 7.6% less mortgage debt relative to country income.21
13 Fleisig, Safavian and de la Peña (2006).14 Pence 2006, Pennington-Cross 2003, and Cutts and Merrill, 2008. 15 Respondents were asked when estimating time for foreclosure to assume that the
property is sold during the first auction. However, there are no reliable data on how many sales are actually closed during the first auction. This assumption is likely to lead to underestimation of the true time for foreclosure.
16 Warnock and Warnock (2007). 17 See the data notes for sources. 18 The data on the strength of legal rights come from Djankov, McLiesh and Shleifer
(2007). Legal rights are measured by an index composed of 10 categories, seven
of which center on collateral laws and three on bankruptcy laws. 19 This finding holds for legal fees normalised by income per capita or property value.
The 4% figure is based on point estimates for the former. 20 Notaries can potentially play a useful role in the registration process by providing
advice on contracts and processes, particularly helpful for consumers with poor knowledge of finance or the law. In addition, they can initiate a title search at the registry and act as guarantors of its result. However, this function can also be provided by mortgage title insurance, such as in the United States.
21 Since the right of private sale tends to be associated with non-judicial foreclosure, the analysis here controls for the type of procedure.

June 2009 HOUSING FINANCE INTERNATIONAL 27
Mortgage Registration and Foreclosure around the Globe: Evidence from 42 Countries
4. How to Reform
The development of mortgage markets varies greatly across countries. Regulations that raise the cost of registering and enforcing a mortgage play a big part in this.
The findings on mortgage registration suggest wide scope for improvement. When registering a property sale and mortgage transaction takes a year, as it does in Rwanda - or when registering a property costs more than 10% of its value, as it does in Guatemala, Burkina Faso, Rwanda and Mali - reformers might look to other countries for ways to improve regulation.
Country-specific bottlenecks often explain the time and cost of processes. However, some cross-country patterns also explain the ineffi-ciency. Involving notaries tends to increase the cost of registering a mortgage. The absence of an electronic registration system tends to in-crease the time required.
However, reform may be difficult. Eliminating the participation of notaries in registration would be politically problematic given the strong vested interests. Instead, reforms could simply allow any licensed attorney to certify conveyances and mortgage documents. Alternatively, they could allow documents to be certified directly at the registry by registry officials. In Vietnam, local go-vernment officials are authorised by law to certify property purchase and sale agreements. Georgia has a similar system.
One important obstacle to developing mortgage markets in many countries is tenure informality and outdated title records. Since mortgages are applied only to legal titles, lack of title reduces the amount of housing finance. It also greatly ex-tends the time to complete a transaction, because the mortgage can be registered only after “first registration” of the property, a difficult and time-consuming process even in developed systems.
Countries have tackled this issue in creative ways. The Russian Federation’s regulation allowing a notation of mortgage in a property purchase and sale agreement has avoided the need to register a legal mortgage. Azerbaijan introduced the “mixed agreement,” a tripartite agreement between sel-ler, purchaser and mortgage provider that allows simultaneous registration of sale and mortgage. Other countries have established a mortgage prio-rity that is linked to the date of the application, not the actual registration.
Mortgage markets decrease in size with higher fees and charges for property transactions. However, even with notary fees included, mor-tgage registration fees are typically far smaller than stamp duties or taxes imposed on the transfer of a property. These account for more than 70% of all registration costs. High trans-
fer duties and taxes encourage informal titles, which cannot be mortgaged, and reduce pro-perty turnover in the market, lessening the amount of mortgage lending.
Proposals to lower property transfer taxes can be accompanied by efforts to increase alternative taxes that are less distorting. One option is recur-ring ad valorem taxation of real property, which is harder to avoid and spreads the tax burden over a larger universe of property owners.
Shortening foreclosure times is another way to expand mortgage lending. The findings in this report corroborate other empirical analysis on developed countries: non-judicial procedures mean shorter foreclosure times and lower costs for the creditor and the debtor. In addition, remo-ving the requirement of sale by public auction speeds up foreclosure.
Recent mortgage reforms in Pakistan and Turkey have focused mainly on appeal rights, such as requiring debtors to post bigger appeal bonds (sureties) and increasing courts’ discretion to impose costs on parties bringing groundless appeals. Reforms in many countries have gone in the direction of defining more clearly a cre-ditor’s prima facie case for proving the right to foreclose; narrowing and clearly defining allo-wable objections to foreclosure and the grounds on which execution and non-judicial proceedings may be stopped or delayed; and imposing appro-priate costs on debtors (and their attorneys) who seek to manipulate the appeals process for the purpose of delay.
Reforms in many rich countries have gone toward negotiated market sales, jointly undertaken by the creditor and borrower - estimated to produce bet-ter results for the borrower. Such reforms may be possible in developing countries too.
Data Notes
Two sets of indicators are presented and ana-lysed in this report. Those in the first set measure the time and cost associated with registering a residential property and the mortgage charge contracted for its purchase. In addition, two in-dices are constructed to measure the simplicity of the process: the mandatory notary index and the registry inefficiency index. The indicators in the second set measure the time and cost associated with foreclosing on a property when the borrower fails to ensure loan repayments. The data for both sets of indicators were collected in the period March–November 2007, with respondents asked to provide data for the previous calendar year.
Methodology
The data were collected in a standardised way. A survey was developed using a simple case study to ensure comparability across countries
and over time - with assumptions about the property, its size, its location and its value. The survey was administered to more than 150 local experts, including lawyers, consultants, government officials, in-house legal counsel of commercial and government banks, and other professionals routinely administering or advi-sing on legal and regulatory requirements.
These experts had several rounds of interac-tion, involving conference calls and written correspondence, with the Financing Homes team. The data from the survey have been subjected to numerous tests for robustness, leading to revisions or expansions of the infor-mation collected.
The methodology has three limitations that should be considered when interpreting the data. First, the collected data refer to residen-tial property in the country’s capital or most populous city and may not be representative of regulation in other parts of the country. Second, transactions described in the standardised case study refer to a specific set of issues and may not represent the full set of issues individuals and credit institutions encounter. Third, the measures of time involve an element of judg-ment by the expert respondents. When sources indicate different estimates, the time indicators reported represent the median values of several responses given under the assumptions of the case study. In practice, completing a procedure may take longer if the agents involved in regis-tration or foreclosure lack information or are unable to follow up promptly.
Registering a Mortgage and Title Transfer
The study records the full sequence of pro-cedures necessary when an individual purchases land and a house - with the help of a mortgage loan - to register the transfer of the property title from another individual as well as to register the mortgage charge attached to it. Every pro-cedure required by law or necessary in practice is included, whether it is the responsibility of the seller, buyer or lender or must be completed by a third party on their behalf. Local property lawyers, notaries and property registries provide information on procedures as well as the time and cost to complete each of them.
To make the data comparable across countries, several assumptions about the parties to the pro-perty transaction, the property and the procedures are used.
Assumptions about the parties (buyer and seller)
The parties:
Are individuals.
Are located in an urban area of the country’s capital or most populous city.

Regulation of Mortgage Default Insurance: Principles and Issues
28 HOUSING FINANCE INTERNATIONAL June 2009
Assumptions about the property The property:
Is fully owned by an individual.
Has no mortgages attached and has been un-der the same ownership for the past 10 years.
Is adequately measured and filed in the ca-dastre, registered in the land registry and free of title disputes.
Is located in an urban residential zone.
Consists of land and a house. No renovations or additions are required. The house is 10 years old, is in good condition and complies with all safety standards, building codes and other legal requirements. The property will be transferred in its entirety.
Will not be subject to renovations or additional building following the purchase.
Assumptions about the mortgage loan The down payment amounts to 20% of the property value.
The mortgage loan amounts to the remaining 80% of the property value.
The loan is obtained through the major do-mestic mortgage institution in the country.
The mortgage loan is repayable over a period of 15 years.
Time
Time is recorded in calendar days. The mea-sure captures the median duration that property lawyers, notaries or registry officials indicate is necessary to complete a procedure. It is assu-med that the minimum time required for each procedure is one day. Although procedures may take place simultaneously, they cannot start on the same day. It is assumed that the parties involved do not waste time and commit to com-pleting each remaining procedure without delay. If a procedure can be accelerated for an addi-tional cost, the fastest legal procedure available and used by the majority of the general public is chosen. It is assumed that all parties to the tran-saction follow the fastest legal option available and do not employ an outside facilitator to com-plete procedures unless required by law to do so. If procedures can be undertaken simultaneously, it is assumed that they are. It is assumed that the parties involved are aware of all regulations and their sequence from the beginning. Time spent on gathering information is not considered.
Cost Cost is recorded as a percentage of the property value. Only official costs required by law are re-corded, including fees, transfer taxes, stamp duties and any other payment to the property registry, notaries, public agencies or lawyers.
Other taxes, such as capital gains tax or value added tax, are excluded from the cost measure. If cost estimates differ among sources, the me-dian reported value is used.
Mandatory notary index
The mandatory notary index measures the in-volvement of notaries in registration. The index is constructed from four questions in the survey:
Whether it is mandatory to have documents notarised before registering the mortgage.
Whether it is mandatory for a notary to pre-pare legal documents to be presented in the registrar’s office.
Whether it is mandatory to hire a notary or a lawyer to conduct all the necessary steps required for mortgage registration.
Whether notary fees are regulated.
The index ranges from 0 to 1, with higher values indicating higher levels of mandatory participa-tion by notaries.
Registry inefficiency index
The registry inefficiency index measures speed, transparency, cost and accessibility. The index is constructed from four questions in the survey:
How many days it takes to search the registry to determine whether the title is subject to a registered mortgage (normalized between values of 0 and 1).
Whether the registry records are electronic.
What fee is required to search the registry (in US Dollars, normalised between values of 0 and 1).
Whether there are restrictions on who can ac-cess the registry.
The index ranges from 0 to 1, with higher va-lues indicating greater inefficiency.
Foreclosing on a Property
To construct data on foreclosing on a property, the study follows the step-by-step evolution of a mortgage loan dispute, computing time and cost. The time and cost indicators measure the efficiency of the judicial system - or, if the system is non-judicial, of the out-of-court enforcement procedures - in resolving mortgage disputes. The data are collected through study of the codes of civil procedure and other court regulations as well as a survey completed by local litigation lawyers, notaries and in-house legal counsel of commercial and state banks.
Assumptions about the case
To ensure comparability across countries, the following assumptions are used:
The value of the mortgage is equal to the cur-rent market value of the property.
The foreclosure process begins at the time the borrower receives a notice of intent to commence foreclosure proceedings. The delinquency time that must pass before the lender is allowed to initiate foreclosure is not recorded, even if determined in the law.
The borrower is docile and shows good faith, recognising his/her failure to service the mor-tgage debt and accepting the process without using delaying tactics.
The borrower is therefore easy to locate and is assumed to receive notification on the first attempt.
The borrower does not exercise his/her right to appeal judicial decisions. However, whene-ver time is allocated to allow for an appeal (statutory deadlines), this time is recorded.
The borrower vacates the premises volunta-rily once a judgment has been reached and thus need not be evicted.
The lender takes all required steps for prompt enforcement of the judgment. The money is successfully collected through a public sale of the borrower’s immovable asset.
The property is sold during the first auction.
Time
Time is recorded in calendar days, counted from the moment the borrower receives a notice of intent to commence foreclosure proceedings until payment. This includes both the days when actions take place and the waiting pe-riods between actions. The respondents make separate estimates of the average duration of the three steps that make up the foreclosure process: notification of the borrower, judgment (time for the trial and obtaining the judgment) and enforcement of the judgment. The measure captures the median duration that litigation lawyers, in-house legal counsel of banks and other contributors indicate is necessary to com-plete each step of the foreclosure process. It is assumed that the parties do not waste time and commit to completing each step without de-lay. The fastest legal procedure available that is used by the majority of the general public is chosen. If steps can be undertaken simulta-neously, it is assumed that they are.
Cost
Cost is recorded as a percentage of the property value. Only official costs required by law are recorded, including court costs, stamp duties, bailiff fees, expert fees, lawyer fees, notary fees, auction fees and enforcement fees.
Mortgage Registration and Foreclosure around the Globe: Evidence from 42 Countries

Regulation of Mortgage Default Insurance: Principles and Issues
June 2009 HOUSING FINANCE INTERNATIONAL 29
References
Buckley, Robert M., and Jerry Kalarickal. 2005. “Housing Policy in Developing Countries: Conjectures and Refutations.” World Bank Research Observer 20 (2): 233–57.
Butler, Stephen. 2003. “Housing Finance in Emerging Markets: Policy and Regulatory Challenges.” World Bank Institute, Washington, DC. http://rru.worldbank.org/PapersLinks/Open.aspx?id=7799.
Cutts, Amy Crews, and William A. Merrill. 2008. “Interventions in Mortgage Default: Policies and Practices to Prevent Home Loss and Lower Costs.” Joint Center for Housing Studies, Harvard University, Cambridge, MA.
de Soto, Hernando. 2003. The Mystery of Capital: Why Capitalism Triumphs in the West and Fails Everywhere Else. New York: Basic Books.
Djankov, Simeon, Caralee McLeish and Andrei Shleifer. 2007. “Private Credit in 129 Countries.” Journal of Financial Economics 84 (2): 299–329.
Fleisig, Heywood, Mehnaz Safavian and Nuria de la Peña. 2006. Reforming Collateral Laws to Expand Access to Finance. Washington, DC: World Bank.
Pence, Karen M. 2006. “Foreclosing on Opportunity: State Laws and Mortgage Credit.” Review of Economics and Statistics 88 (1): 177–82.
Pennington-Cross, Anthony. 2003. “Subprime and Prime Mortgages: Loss Distributions.” OFHEO Working Paper 03-01, Office of Federal Housing Enterprise Oversight, Washington, DC.
Sanders, Anthony B. 2005. “Barriers to Homeownership and Housing Quality: The Impact of the International Mortgage Market.” Journal of Housing Economics 14 (3): 147–52.
Warnock, Veronica Cacdac, and Francis E. Warnock. 2007. Markets and Housing Finance. NBER Working Paper 13081. Cambridge, MA: National Bureau of Economic Research.
World Bank. 2007. World Development Indicators 2007. Washington, DC.
Mortgage Registration and Foreclosure around the Globe: Evidence from 42 Countries

Housing Microfinance Feasibility Analysis
Introduction
The present global housing crisis will demand in-telligent policy responses in the decades ahead. While 850 million people, or one-seventh of the world’s population, currently dwell in slum condi-tions, the number will increase to 1.5 billion by 2025 (Ferguson 2004). Developing countries will bear the majority of the world’s overall po-pulation growth. The population of Sub-Saharan Africa alone will triple by 2025 (Ferguson). The sheer scale of this problem necessitates a pre-cise and targeted approach, one fundamentally different from earlier attempts. Policies such as interest rate subsidies, though well intentioned, have distorted housing markets by eliminating or dampening market incentives. Since most go-vernments in developing nations cannot afford to provide housing for all in need of it, typically only a small proportion of low-income households re-ceive assistance. A different approach, one that has proven to be financially self-sustaining and capable of reaching millions, is required.
One such market-based strategy with the poten-tial for dramatic growth is housing microfinance (HMF). Though the field of microfinance has existed for decades, the HMF sector has been slower to develop. For one, many lenders have been reluctant to address the issue of collateral that accompanies housing finance. In countries where property titles are uncertain and the legal enforcement of foreclosures is unlikely, home lending, in both the formal and informal sectors, can be sparse. Yet housing microfinance can succeed in countries with established microfi-nance sectors. The characteristics of HMF loans resemble those of microenterprise loans, inclu-ding small loan sizes and lowered transaction costs from repeat customers. Most HMF loans are for “progressive” homebuilders - those who
borrow incrementally, as needed, to expand their dwellings in piecemeal fashion. Although housing loans differ from small business loans because group accountability, a hallmark of microfinance, is considered inappropriate for home lending, microfinance institutions (MFIs) nonetheless are experts at lending to informal sector employees and ought to be able to diversify into this line of business given the right conditions.
This paper attempts to identify which countries have these conditions for HMF expansion. The ideal country would have both a high demand for alternative housing financing and an ena-bling environment for HMF. Three applications of the linear regression model are utilised to exa-mine the prospects for HMF expansion in each country. In part one a global regression equation, applied to all countries, offers a rough estimate of each one’s HMF capacity. Parts two and three build upon these findings by providing a series of regressions at the regional and sub-regional le-vels. It is hypothesised that stronger relationships will emerge at these smaller scales, as countries are more similar within regions than between them. The size of a nation’s housing microfi-nance portfolio is the dependent variable in all regressions, while each regression’s explanatory variables were selected from a common pool of 11 variables.
Though computer software was used to build the HMF regressions, the data alone do not prove or disprove any causal relationships. Rather, the researcher always assumes the direction of causality. To make the regression results more meaningful, it is helpful to state the expected relationships between the variables beforehand. One would expect a country’s levels of foreign di-rect investment and microfinance donor money to have a positive correlation with the HMF port-
folio. Both are monetary inputs and so, all else being equal, greater funding availability should result in more housing microfinance loans. For similar reasons, the per capita GNI of the in-formal sector should bear a direct relationship to HMF portfolio size.2 The World Bank’s Doing Business indicator, which ranks the quality of each country’s business environment from 1 to 180, should also exhibit a direct relationship to HMF portfolio size: as conditions worsen across countries (and the ranking rises), more infor-mal sector lending should occur. Similarly, as the Corruption Index created by Transparency International increases across countries, HMF levels should rise. In short, housing microfinance should capture a greater share of the mar-ket where difficult business conditions inhibit conventional home lending.
Higher rates of homeownership should lead to greater housing microfinance activity because renters have little incentive to invest in housing. Though high homeownership rates in developing countries typically indicate large levels of squat-ting and informal settlement rather than fully titled property ownership, most microfinance institu-tions (MFIs) do not require full title as a condition to lend. Housing microfinance should also be more prevalent in countries with high population densities and urban population shares, as these reduce business costs for MFIs. Furthermore, as MFIs become more financially self-sufficient in terms of funding and can boast higher returns on equity (ROE), and returns on assets (ROA), HMF portfolio sizes should increase. Lastly, the depth of outreach or down-market penetration of the MFI sector could ostensibly be either positively or negatively correlated with HMF portfolio size. This metric measures the average loan size of the microfinance sector’s customers and it is unclear whether a country’s HMF portfolio would
Housing Microfinance Feasibility Analysis By Brendan Ahern1
1 Mr. Ahern has a Master of City Planning from the University of Pennsylvania. The findings, interpretations, statements and conclusions expressed herein are those of the author alone and do not necessarily reflect the views of the International Bank for Reconstruction and Development/The World Bank and its affiliated organisations, or those of the Executive Directors of The World Bank or the University of Pennsylvania.
2 Per capita informal sector earnings is a rough figure calculated by multiplying the size
of each country’s informal sector (measured in US Dollars) by its per capita income. This figure represents the country’s per capita informal sector income were everyone to work in the formal sector. Though this assumption is not accurate, this figure at least offers a comparative statistic for the gross amount of informal sector income that exists in the country. One would expect HMF activity to be greater where there is more income coming out of the informal sector, other things being equal.
30 HOUSING FINANCE INTERNATIONAL June 2009

Housing Microfinance Feasibility Analysis
be bigger or smaller depending on the income level of their clientele. These 11 variables were all tested for their ability to predict HMF levels in each regression below.
HMF Feasibility
Several authorities in the fields of housing poli-cy and microfinance have identified, in general, which factors lead to large HMF portfolios at the country level. Ferguson argues that widespread legal and land tenure problems, high interest rates, rapid urbanisation, and a pre-existing microfinance sector are all prerequisites for
HMF growth (Ferguson 2004). The Economist’s Intelligence Unit cited a strong microfinance regulatory environment and a favourable business conditions in general as being asso-ciated with high levels of microfinance activity (The Economist 2007). Yet to establish causal relationships between explanatory variables and country-level HMF performance, one must quantify these linkages.
The first regression attempts to explain HMF va-riation via a single, global equation. It generates a predicted HMF portfolio size for each country, which is then compared to each country’s
current portfolio. The greater the difference between the actual and the predicted port-folio size, the greater the country’s degree of underinvestment in housing microfinance. The regressions in sections two and three improve upon the global regression’s predictive power by generating separate equations for each of six global regions: North Africa and the Middle East; Sub-Saharan Africa; eastern Europe and western Asia; southern and central Asia; south and southeast Asia; and Latin America. As only developing countries are under consideration, most of North America and western Europe are excluded from this analysis.
3 The R2 variable simply captures how good (or bad) the equation is at explaining variation in portfolio sizes across countries. Since it is only 0.30, or 30% here, it means that the majority (70%) of HMF variation is NOT explained by this equation. Hence, the other equations presented below will be also studied.
June 2009 HOUSING FINANCE INTERNATIONAL 31
Section 1: Global HMF Equation
Dependent Variable: HMF portfolio size
N = 138 countries
R = 0.548
R2 = 0.3003
* indicates significance at the 90% level
** indicates significance at the 95% level
Table 1: HMF Regression for Developing Countries
Independent Variable Coefficient (B) Standard Error
MF Donor $ 0.949 0.247**
Corruption Perception 159,173 140,506
Density 102,358 31,339** Operational Self-Sufficiency 20,940,000 10,680,000* East, SE Asia 59,510,000 1.845E+7 South, Central Asia 14,230,000 19,190,000 East Europe, western Asia 35,620,000 22,480,000
Latin America 27,290,000 19,400,000 North Africa, Middle East 3,318,437 21,140,000
Constant -44,700,000 18,960,000**
The global regression equation, presented above in table format, is a multivariate regres-sion of the form:
Yi = B0 + B1Xi + B2Zi +… BnWi + ui
wherein variation of the dependent variable, HMF portfolio size, is explained by a host of in-dependent variables. B0 is simply the constant or y-intercept term, while ui is a placeholder for the effects of unobservable random variables. The independent variables are the financial self-sufficiency of the country’s microfinance institutions; the country’s level of corruption;
its population density; and the amount of mi-crofinance donor money in a given country. The density and donor money variables are signi-ficant at the 95% level, while self-sufficiency is significant at the 90% level (see table for variable coefficients). The variables named for geographic regions such as “East, SE Asia” are dummy variables whose binary values {0,1} al-low the equation to capture regional variation in HMF levels. In effect, there are six sub-equa-tions within this regression, because for a given region, all dummy variables besides the one associated with that region are set to zero and
thus knocked-out of the equation. The R2 value of 0.300 indicates that approximately 30% of the variation in HMF portfolio sizes is explained by the regression equation
Using this equation, it becomes possible to identify which countries would benefit most from further investment in housing microfi-nance. Target countries will have a predicted HMF value higher than their current HMF portfo-lio size. The countries below have been placed into three groups according to the size of their estimated underinvestment in HMF.

4 The regions “east and southeast Asia” and “south and central Asia” from the global regression have been combined into one region in sections two and three to in-crease the sample size for this region and increase the reliability of the projections.
32 HOUSING FINANCE INTERNATIONAL June 2009
Section 2: A Regional Approach to Housing MicrofinanceThe weak predictive power of the global re-gression demonstrates that there are few independent variables capable of explaining HMF portfolio variation across all countries. This result is not surprising, given that microfinance
sectors differ greatly from one country to the next. To obtain a more accurate picture of where HMF investment could be greater, it is necessary to examine countries at the regional level. For this purpose, a separate regression has been generated for each region. Though the regional models’ sample sizes are inevitably smaller, their higher R2 values indicate that there are strong
relationships between HMF portfolios and the explanatory variables within each region. Section two’s regression predicts HMF portfolio size for each country based upon these regional rela-tionships. The appendix provides a full listing of each region’s regressors and their coefficients. Featured in Table 3 are the independent variables for each region’s regression equation4.
Of the 33 countries identified above, the majo-rity are from Latin America (11) and east and southeast Asia (10). The rest are located in Eastern Europe and western Asia (six), Sub-Saharan Africa (four), North Africa and the Middle East (one), and southern and central Asia (one). While several other countries exhibi-ted underinvestment of $30 million or less, this
result is not necessarily significant. Predicted portfolio sizes will rarely, if ever, be equal to that of the current portfolio; approximately one-half of predicted HMF values should fall below the actual portfolio and one half above it. This fact highlights the difficulty of interpreting re-gression residuals: a negative residual (where predicted HMF exceeds actual) could mean that
either a) there is underinvestment in HMF or b) that the model’s forecast is simply inaccurate. With an R2 value of only 0.300 for the global equation, this concern is valid. For this reason, sections two and three feature regional regres-sion models with a higher predictive power.
Table 2: Predicted vs. Actual HMF Portfolio Sizes
Countries Estimated Underinvestment in HMF
Cambodia, Gabon, Moldova, The Philippines, Thailand Above $70 million
Argentina, Brunei Darussalam, Guatemala, Nicaragua, Poland Between $50 and $70 million
Armenia, Azerbaijan, Belarus, Belize, China, Costa Rica, Cuba, Dominican Republic, El Salvador, Georgia, Ghana, Haiti, Jordan, Democratic Republic of Korea, Kyrgyz Republic, Lao, Malaysia, Mongolia, Nigeria, Panama, Uganda
Between $30 and $50 million
Table 3: Regional HMF Variables
Region Independent Variables R2 Value Number of Countries
Latin America
Foreign Direct Investment**(-) Informal GNIMicrofinance Donor Money**(-)Doing Business Rank Density
0.707 23
Sub-Saharan AfricaForeign Direct Investment**Microfinance Donor Money**(-) Return on Equity**
0.658 42
North Africa and the Middle East
Microfinance Donor Money(-) Doing Business RankCorruption Ranking(-) Urban Population Share**
0.707 15
Eastern Europe and western Asia
Foreign Direct InvestmentDoing Business Rank**Homeownership Rate**Depth of MFI OutreachReturn on Equity*
0.900 13
Asia Density 0.152 23
Weighted Average (by number of countries) 0.601 116
Housing Microfinance Feasibility Analysis

June 2009 HOUSING FINANCE INTERNATIONAL 33
Section 3: A Regional High- Flyers ApproachTo ascertain the factors that predict HMF suc-cess, this section investigates each region’s “high-flyers”, those countries with the largest HMF portfolios. After obtaining a regression that
explains HMF variation among each region’s high flyers, each of the remaining countries is exa-mined for its likeness to them. Those countries which prove similar to the high-flyers yet lack large HMF portfolios are considered to exhibit underinvestment in housing microfinance. Listed
below are the explanatory variables associated with each region’s high-flyers and their R2 va-lues. The appendix contains the full regression equations. The equations from sections one and two function as a check upon any conclusions drawn from this approach
The variables foreign direct investment and mi-crofinance donor money both appear in three of the five regional regressions. The regional R2 values are greater than that of the global equa-tion for every region except Asia, meaning that these equations do a better job explaining HMF portfolio variation across countries. Within Asia, only population density bears a relationship to HMF portfolio size, and the equation’s weak predictive power suggests that it is difficult to predict HMF outcomes using one equation across this large continent.
In Latin America, the coefficients for foreign direct investment and microfinance donor money are each significant at the 95% level. HMF portfolio size tends to increase with population density, as expected, and to decrease for countries with poorer business sector rankings. This latter rela-tionship runs counter to the expectation stated above. Another surprising finding is that country-level HMF portfolio decreases as the per capita earnings from the informal economy increases. In Latin America, HMF activity does not depend on poor business conditions or the presence of a large informal economy.
In countries in Sub-Saharan Africa, foreign direct investment, microfinance donor mo-ney and ROE were all significant at the 95% level. Portfolio size actually decreases as ROE increases, suggesting that microfinance institu-tions in this region have yet to achieve adequate scale and are reliant upon foreign investment and microfinance donor money.
In North Africa and the Middle East, housing mi-crofinance activity increases with the amount of microfinance donor money and the country’s level of corruption; it decreases as the general business environment becomes worse, mirroring the trend in Latin America. Running counter to expectations, North African and Middle Eastern countries that are more urban exhibit less HMF activity, a pattern unique to this region.
The regression for eastern Europe and western Asia holds the highest R2 value of all equations at 0.900. Five variables - foreign direct invest-ment, the depth of outreach for MFIs, the return on equity of MFIs, the homeownership rate and severity of business sector problems - are po-sitively correlated with housing microfinance portfolios in this region. Unlike in Sub-Saharan
Africa, countries with higher ROEs tend to have greater microfinance activity. HMF port-folios in the region also increase as business conditions worsen, countering the trends in Latin America and the Middle East and North Africa. Furthermore, eastern Europe and wes-tern Asia is the only region wherein higher rates of homeownership predict higher HMF levels. This may be because high homeownership rates in this region do not signify informal or illegal housing settlements. Rather, many of these countries are in transition from majo-rity-renter nations during the Soviet era, into homeownership societies and so housing mi-crofinance activity is larger in countries where a greater proportion of people are homeowners.
Though the regional HMF approach yields equa-tions with greater predictive power, it retains the principle drawback of the global regression equation, namely that the differences between actual and predicted HMF portfolio sizes could be due to the equation’s own inaccuracies. The approach taken in the next section mitigates this problem by examining only countries with large HMF portfolios relative to their neighbours.
Table 4: High-Flyers Equations
Region High-Flyer Variables R2 Number of Countries
Latin America
Foreign Direct Investment**Informal GNI**Corruption(-) Doing Business Rank**DensityUrban Population Share*
0.584 12
Sub-Saharan Africa
Foreign Direct InvestmentInformal GNIMicrofinance Donor MoneyReturn on AssetsReturn on Equity
0.709 19
North Africa and the Middle East Microfinance Donor Money(-) Urban Population Share 0.324 8
Eastern Europe and western AsiaForeign Direct Investment**Urban Population Share*Return on Equity**
0,953 7
Asia Foreign Direct Investment**Density 0.584 13
Weighted Average (by number of countries) 0.701 59
Housing Microfinance Feasibility Analysis
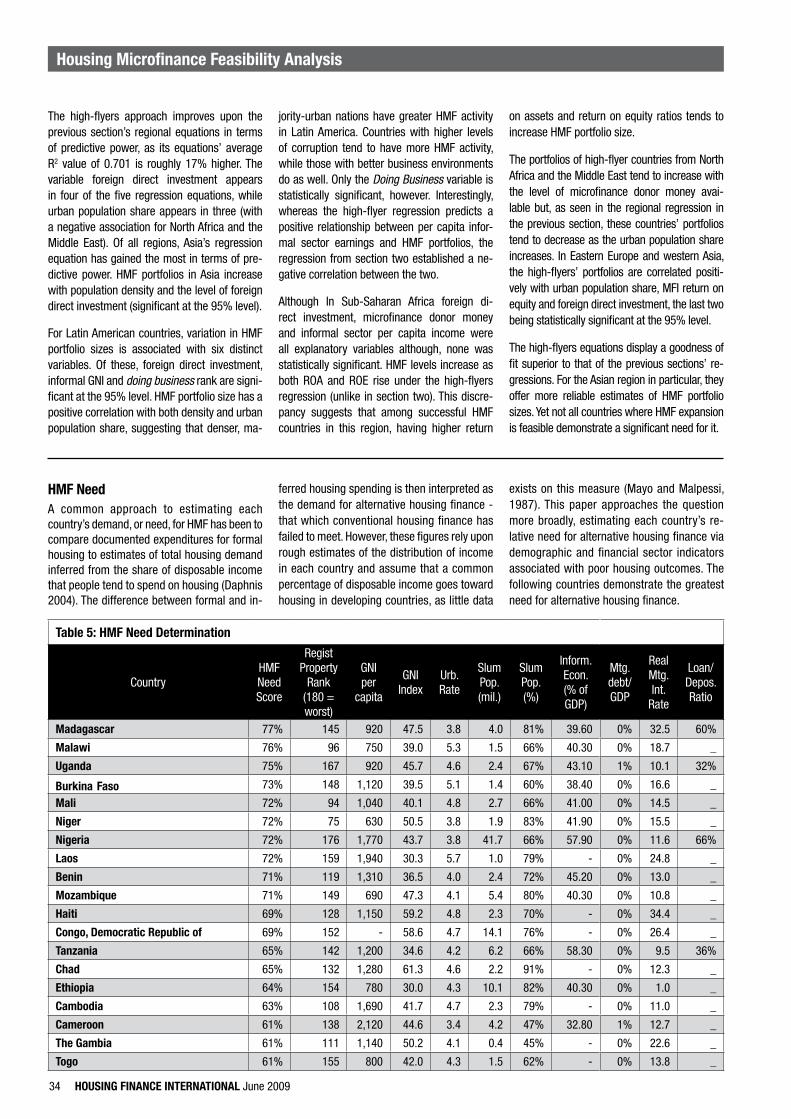
34 HOUSING FINANCE INTERNATIONAL June 2009
The high-flyers approach improves upon the previous section’s regional equations in terms of predictive power, as its equations’ average R2 value of 0.701 is roughly 17% higher. The variable foreign direct investment appears in four of the five regression equations, while urban population share appears in three (with a negative association for North Africa and the Middle East). Of all regions, Asia’s regression equation has gained the most in terms of pre-dictive power. HMF portfolios in Asia increase with population density and the level of foreign direct investment (significant at the 95% level).
For Latin American countries, variation in HMF portfolio sizes is associated with six distinct variables. Of these, foreign direct investment, informal GNI and doing business rank are signi-ficant at the 95% level. HMF portfolio size has a positive correlation with both density and urban population share, suggesting that denser, ma-
jority-urban nations have greater HMF activity in Latin America. Countries with higher levels of corruption tend to have more HMF activity, while those with better business environments do as well. Only the Doing Business variable is statistically significant, however. Interestingly, whereas the high-flyer regression predicts a positive relationship between per capita infor-mal sector earnings and HMF portfolios, the regression from section two established a ne-gative correlation between the two.
Although In Sub-Saharan Africa foreign di-rect investment, microfinance donor money and informal sector per capita income were all explanatory variables although, none was statistically significant. HMF levels increase as both ROA and ROE rise under the high-flyers regression (unlike in section two). This discre-pancy suggests that among successful HMF countries in this region, having higher return
on assets and return on equity ratios tends to increase HMF portfolio size.
The portfolios of high-flyer countries from North Africa and the Middle East tend to increase with the level of microfinance donor money avai-lable but, as seen in the regional regression in the previous section, these countries’ portfolios tend to decrease as the urban population share increases. In Eastern Europe and western Asia, the high-flyers’ portfolios are correlated positi-vely with urban population share, MFI return on equity and foreign direct investment, the last two being statistically significant at the 95% level.
The high-flyers equations display a goodness of fit superior to that of the previous sections’ re-gressions. For the Asian region in particular, they offer more reliable estimates of HMF portfolio sizes. Yet not all countries where HMF expansion is feasible demonstrate a significant need for it.
HMF NeedA common approach to estimating each country’s demand, or need, for HMF has been to compare documented expenditures for formal housing to estimates of total housing demand inferred from the share of disposable income that people tend to spend on housing (Daphnis 2004). The difference between formal and in-
ferred housing spending is then interpreted as the demand for alternative housing finance - that which conventional housing finance has failed to meet. However, these figures rely upon rough estimates of the distribution of income in each country and assume that a common percentage of disposable income goes toward housing in developing countries, as little data
exists on this measure (Mayo and Malpessi, 1987). This paper approaches the question more broadly, estimating each country’s re-lative need for alternative housing finance via demographic and financial sector indicators associated with poor housing outcomes. The following countries demonstrate the greatest need for alternative housing finance.
Table 5: HMF Need Determination
CountryHMF Need Score
RegistProperty
Rank (180 = worst)
GNI per
capita
GNIIndex
Urb.Rate
Slum Pop.(mil.)
SlumPop.(%)
Inform.Econ.(% ofGDP)
Mtg. debt/ GDP
RealMtg.Int.
Rate
Loan/Depos.Ratio
Madagascar 77% 145 920 47.5 3.8 4.0 81% 39.60 0% 32.5 60%
Malawi 76% 96 750 39.0 5.3 1.5 66% 40.30 0% 18.7 _
Uganda 75% 167 920 45.7 4.6 2.4 67% 43.10 1% 10.1 32%
Burkina Faso 73% 148 1,120 39.5 5.1 1.4 60% 38.40 0% 16.6 _
Mali 72% 94 1,040 40.1 4.8 2.7 66% 41.00 0% 14.5 _
Niger 72% 75 630 50.5 3.8 1.9 83% 41.90 0% 15.5 _
Nigeria 72% 176 1,770 43.7 3.8 41.7 66% 57.90 0% 11.6 66%
Laos 72% 159 1,940 30.3 5.7 1.0 79% - 0% 24.8 _
Benin 71% 119 1,310 36.5 4.0 2.4 72% 45.20 0% 13.0 _
Mozambique 71% 149 690 47.3 4.1 5.4 80% 40.30 0% 10.8 _
Haiti 69% 128 1,150 59.2 4.8 2.3 70% - 0% 34.4 _
Congo, Democratic Republic of 69% 152 - 58.6 4.7 14.1 76% - 0% 26.4 _
Tanzania 65% 142 1,200 34.6 4.2 6.2 66% 58.30 0% 9.5 36%
Chad 65% 132 1,280 61.3 4.6 2.2 91% - 0% 12.3 _
Ethiopia 64% 154 780 30.0 4.3 10.1 82% 40.30 0% 1.0 _
Cambodia 63% 108 1,690 41.7 4.7 2.3 79% - 0% 11.0 _
Cameroon 61% 138 2,120 44.6 3.4 4.2 47% 32.80 1% 12.7 _
The Gambia 61% 111 1,140 50.2 4.1 0.4 45% - 0% 22.6 _
Togo 61% 155 800 42.0 4.3 1.5 62% - 0% 13.8 _
Housing Microfinance Feasibility Analysis

June 2009 HOUSING FINANCE INTERNATIONAL 35
Nearly all of the countries with the greatest need are located in Sub-Saharan Africa. A com-posite need indicator for each country (out of 100) was calculated as a weighted average of the indicators above. Though this system lacks the precision of a dollar estimate of HMF de-mand, it produces cross-country comparisons that do not rely on tenuous income projections. Those countries exhibiting both an undersupply of housing microfinance and strong demand for alternative housing finance are the best candi-dates for further HMF investment.
The relevance of each of the indicators above to housing affordability is well established in the literature on the subject. By definition, countries with large slums demonstrate a need for housing solutions. All things being equal, the larger the size of the slum popu-lation, the greater the demand for alternative housing finance. Those countries with slum populations greater than three million are considered to meet the “large slums” criteria for the HMF need index; for each additional five million people living in slums above this threshold, the indicator score increases by 0.1 (to a maximum of 2.0). In recognition of the fact that smaller countries may also have large housing issues, countries with greater than 40% of their populations living in slums also meet the criteria. The threshold values of three million and 40% are intended as a reasonable standard for evaluating relative slum sizes ra-ther than absolute cut-off points. Throughout this section on need, countries receive one point for meeting a key threshold value (such as the 40% above) and an additional point based on the percent by which the indicator exceeds the threshold value.
Developing countries with rapid rates of urba-nisation are more likely to experience strains upon their natural resources and their infras-tructure, including the supply of housing. In a study of 89 developing countries over 15 years, researchers Kelley and Ahlburg found that a 0.02% increase in the population growth rate results in a 0.16% decline in GDP growth (Kelley and Ahlburg, 2004). That is, popula-tion growth adversely affects GDP growth by a factor of eight. Therefore, where population growth is rapid, countries will find it difficult to keep pace with the rising demand for housing. Since urban growth rates in excess of 3% will cause the population to double in less than 25 years, the “rapid urbanisation” indicator gives 1 point to countries with 3% growth and an additional 0.1 point for every 0.25% above the 3% threshold (maximum: 2.5 points).
Countries with low per capita income levels are also likely to exhibit large levels of unmet housing demand. Banks and other conventio-nal financial institutions are reluctant to deal
with both informal sector employees and loan amounts that are small relative to transaction costs. All other things being equal, HMF demand will be largest in low- and lower middle-income countries, which the World Bank classifies as those having a per capita GNI figure below $3,705 (World Bank 2007). Because per capita income is an average figure that can be infla-ted by large values at the top of the distribution, those countries with high Gini Indices also de-monstrate a significant need for HMF. Countries exhibiting either a per capita GNI below $3,705 or a Gini Index more than one standard devia-tion greater than the average for developing countries (over 53.0) receive a score of 1.0 in the “low-income” indicator category.
As noted above, informal sector workers have difficulty obtaining mortgage finance. According to a 2004 study based in Ghana, they also suffer from significantly lower quality of housing. Fiadzo found that those employed in the informal sector had a housing quality index score of 3.5 points lower on a 31 point scale as compared to formal sector employees (Fiadzo 2004). It is a plausible assumption that the greater the size of a country’s informal economy, the greater the extent of housing quality issues and that, further, a lack of housing finance is partially responsible for this trend. For the “large informal economy” indicator, countries received 1 point if their in-formal economy was greater than 30% of GDP and an additional .025 points for every 1% above the 30% threshold (max: 2.0 points).
Another set of indicators captures the ability of the conventional finance sector to deliver housing finance. By definition, low levels of mortgage credit indicate that a majority of people must venture outside conventional home finance channels to meet their demand for housing. In developed countries, mortgage credit levels are close to 100% of GDP, whereas in developing countries the figures frequently lie below 5%. For the “low mortgage activity” indicator, countries with mortgage to GDP ratios of less than 2% receive 1.0 and an additional 0.5 point for each 1% below the 2% threshold (maximum: 2.0 points). A nation’s real mortgage interest rate also determines the down-market penetration of the mortgage sector. Ferguson holds that where the rate exceeds 10%, the majority of people cannot afford the cheapest commercial housing unit in a country (Ferguson 2004). It is assumed here that as the interest rate rises above the 10% figure, less and less people can afford a home mortgage. For the “high real interest rate” indicator, countries with rates above 10% receive 1 point and a fur-ther 0.1 points for every 2% increase above the 10% threshold (maximum score: 2.0).
The general willingness of a country’s banks to extend credit also influences the cost and availability of mortgage finance. This, in turn, influences the extent to which alterna-tive housing finance is needed. A banking sector’s loan to deposit (LtD) ratio measures its reliance upon its deposit base in making loans. While many developed countries have LtD’s of close to 100%, the ratios of developing countries’ banks are typically lower, indicating a reluctance to lend. Banks’ LtD ratios are ty-pically evaluated relative to those of their peer institutions. The FDIC in the US, for example, mandates that a bank’s LtD be no lower than 50% of the host state’s average LtD. Otherwise, according to the FDIC, that bank is unable to “meet the credit needs of the communities in the host state” (FDIC). Similarly, for the “low loan to deposit ratio” indicator, those countries with an LtD ratio more than one standard deviation below the average for developing countries’ banking sectors (35%) receive 1.0 points as they are reluctant to lend. Again, hou-sing microfinance need is greatest where the conventional housing finance channels are the most limited.
The efficiency of countries’ property markets also relates to the need for alternative hou-sing finance. Ferguson notes that land tenure problems and difficulty in executing mortgage liens create a need for HMF, and Angel likewise suggests that a lack of property rights cripples a nation’s mortgage market (Ferguson 2004, Angel 1999). It is assumed here that where land tenure issues are most severe, there will be a greater need for housing microfinance; the top countries with respect to property re-gistration are less likely to need this option on a massive scale. For the “poor property rights regime” indicator, countries outside the top 50 in the World Bank’s registering property ranking receive 1.0 points.
Integrating the Demand for and Supply of Housing Microfinance Measurements
This paper’s ultimate task is to distinguish which countries are both amenable to HMF expansion and in need of it. By combining the regression analysis with an HMF need indicator, each country’s HMF profile emerges.
Housing Microfinance Feasibility Analysis

5 Blank cells in the table indicate the countries for which the other regressions predicted over-investment in housing microfinance.
36 HOUSING FINANCE INTERNATIONAL June 2009
Table 6: Combining the Feasibility and Need Indicators
Country HMF Need HMF Underinvestment (in millions)
High-Flyers Regional Global
China 15% 2,634.1 32.8 34.4
Argentina 24% 520.6 112.3 58.2
Thailand 12% 311.4 79.3 83.2
Panama 29% 260.1 37.8
India 30% 127.6 10.2
Pakistan 56% 79.5 17.5 -28.8
Kazakhstan 10% 74.8 22.3 29.1
Haiti 69% 65.8 7.4 46.9
Philippines 50% 61.2 32.4 73.0
Guatemala 35% 54.2 54.0
Nicaragua 33% 51.6 96.9 69.3
Dominican Republic 15% 41.5 35.4
Poland 7% 27.6 21.0 63.9
Uzbekistan 38% 26.2 43.9 16.1
Egypt 30% 21.8 16.8 12.0
These 15 countries were ranked according to their residuals from the high-flyers equations, as this approach had the highest predictive power5. Each country features an estimated HMF investment in excess of $20 million (co-lumn 3, Table 6). The HMF forecasts from sections one and two provide support for the findings of the high-flyers equations: for most countries, all three regressions predict HMF underinvestment. The most striking features of this group are that the amount of HMF unde-rinvestment varies significantly by the approach taken and that HMF feasibility does not neces-sarily align with HMF need.
Several countries on this list display large levels of HMF underinvestment but do not appear to have strong demand for housing microfinance. Though China has an estimated $2.6 billion in HMF underinvestment, its strong property rights regime, moderate income level, low interest rates, high mortgage activity relative to other de-veloping countries and modest urban population growth rate indicate that it does not have a large need for HMF. Furthermore, China’s HMF resi-duals are far lower for the other two regression approaches. Thailand, Poland, Kazakhstan and the Dominican Republic also lack strong HMF demand, due mainly to their status as middle-in-come countries with small slum populations, low urbanisation rates and strong financial sectors.
None of these countries should be considered front-runners for further HMF investment.
The remaining countries in this group have both a large capacity for HMF expansion and ample demand for it. Argentina and Panama exhibit over $250 million in HMF underinvestment as well as moderate HMF demand. Panama’s need for HMF stems from its poor property rights regime, skewed income distribution and large informal sector, while Argentina’s relates to its property regime issues, its low level of mortgage acti-vity and its slum population, which exceeds nine million. India displays an HMF underinvestment of $127 million dollars and a moderate HMF demand owing to its low-income levels, poor property regime and enormous slum population (second only to China’s), whereas its neighbour, Pakistan, displays higher HMF demand but lower HMF capacity due to a low population density of only 13 people per square kilometre.
The predicted HMF levels of the two remaining Asian countries depend mainly upon their popu-lation density and foreign direct investment - the only independent variables in this region’s high-flyer regression. In the Philippines, high levels of foreign direct investment and population density indicate that HMF expansion is feasible, while its particularly large slum population of 22 million combined with its rapid urbanisation rate indicates that HMF is needed. Uzbekistan does not possess
a large slum population but it is a low-income country with little home mortgage activity.
The HMF portfolio of Egypt, the lone African country on the list, benefits from a high level of microfinance donor money and from being a majority-rural society (which bears an inverse relationship to HMF). For these reasons, HMF may help mitigate Egypt’s slum settlements, currently home to five million.
Haiti has the greatest HMF need score of all Latin America countries: its per capita income figure is low and its income structure is une-qual; its 5% urbanisation rate is putting great pressure on its slums, already home to 70% of the country’s population; and its real interest rates of 34% preclude the development of mor-tgage markets. On the supply side, its predicted HMF portfolio would be higher if not for low le-vels of foreign direct investment and its hostile business climate (associated with lower HMF portfolios).
Of the remaining Latin American countries in this group, Guatemala and Nicaragua have strong HMF capacity due to their moderate le-vels of foreign direct investment, poor rankings for their business environments and high cor-ruption levels. Their HMF portfolios would show more growth potential if not for both counties’ rural status. As to their demographic profiles,
Housing Microfinance Feasibility Analysis

6 The following countries were excluded from the percent growth analysis due to concerns over their political stability: Zimbabwe, Sudan, Timor-Leste and Afghanis-
tan. A second group was not included because its countries’ HMF need indicators were low: Tunisia, Kazakhstan and Jordan.
June 2009 HOUSING FINANCE INTERNATIONAL 37
Guatemala is urbanising at slightly more than 3% annually, while both Nicaragua and Guatemala have more than 45% of their po-pulation classified as slum dwellers by the UN.
Yet this method ignores countries whose HMF sectors can make dramatic increases in per-
centage terms. Most of these countries are located in Sub-Saharan Africa and exhibit lower HMF portfolio sizes on the order of one to five million dollars. It would be unrealistic to expect the housing microfinance industries in these countries to expand by the $250 or even $30 million totals displayed above. The
countries detailed in Table 7 have large ca-
pacities for HMF expansion relative to their
original portfolio sizes.
Table 7: Largest HMF Sector Growth in Percentage Terms (numbers in thousands)
Country % change HMF Portfolio Predicted Portfolio HMF Need
Namibia 324,379 3.5 11,430.0 23%
Laos 148,604 17.5 26,113.8 72%
Liberia 68,875 17.1 11,817.9 46%
Republic of Congo 2,961 188.5 5,771.9 52%
The Gambia 2,767 295.0 8,460.1 61%
Central African Republic 2,240 371.3 8,689.5 53%
Rwanda 1,480 734.2 11,597.3 54%
Zambia 1,120 799.1 9,750.9 51%
Sierra Leone 936 415.3 4,304.8 53%
Chad 878 712.5 6,966.0 65%
Guinea 724 1433.3 11,804.3 47%
Yemen 289 164.0 637.8 35%
Cote d’Ivoire 248 3,848.7 13,385.6 47%
Niger 242 1,367.2 4,678.9 72%
Nepal 166 9,362.7 24,889.0 54%
Swaziland 148 3,300.6 8,201.8 22%
Tanzania 96 7,783.9 15,231.8 65%
The Sub-Saharan African countries in this group feature similar HMF-need profiles. Most are low-income countries with weak property regimes, weak financial sectors and large slum populations. Laos follows roughly the same pattern, as its urbanisation rate (5.7%) and the share of its population classified as slum-dwellers (79%) are both high.
On the HMF feasibility side, the extremely large portfolio change ratios for Namibia, Laos and Liberia stem from their small current port-folio sizes, each of which is less than $18,000. The pertinent variables for the Sub-Saharan regression are foreign direct investment, mi-crofinance donor money and return on equity (inverse relationship), indicating that for this
region in particular, international monetary inputs play a large role in the success of housing microfinance. Considering that HMF portfolio size increases as ROE decreases, it is evident that MFIs in Sub-Saharan Africa re-main dependent on external funding.
The key independent variables for Asia’s high-flyer regression were foreign direct in-vestment and density. Both Nepal’s and Laos’ HMF sectors are poised for growth due to its modest level of foreign direct investment. Yemen’s level of microfinance donor money could have a similar effect upon its HMF in-dustry. Both Yemen and Nepal have strong property rights, and low interest rates, while Yemen’s slums are small relative to those of
the other countries. In short, HMF feasibility must be judged along two lines, depending on the size of the current HMF portfolio. Where portfolios are large it is appropriate to eva-luate their growth potential in absolute terms; where they are small, the metric should be the percent growth of the portfolio.
Housing Microfinance Feasibility Analysis

38 HOUSING FINANCE INTERNATIONAL June 2009
Conclusion
Although the literature on housing microfinance has identified some of the key features of a posi-tive microfinance environment, there have been few attempts to quantify these factors’ role in
explaining HMF variation across countries. Using the size of the HMF portfolio as the dependent variable, this paper has suggested three ap-proaches to this issue. By comparing regressions at the global, regional and sub-regional levels, it is possible to establish each nation’s future ca-
pacity for HMF. With the addition of a composite HMF need indicator, it became evident which of these nations also had a strong demand for housing microfinance. The countries detailed in Table 8 are considered to be the best for future investment in housing microfinance:
The sections in Table 8 present two paths for fu-ture HMF investment. Most of the countries on the left are in Latin America and south and southeast Asia. These countries were selected based on the difference between their current HMF portfo-lios and their portfolio sizes as generated by the high-flyers regressions. In pure dollar terms, these countries are likely to see the greatest expansion in their HMF portfolios.
By contrast, the countries on the right are mainly from Sub-Saharan Africa and have far smaller HMF portfolio sizes at present. These countries’ high urbanisation rates and large slum sizes indi-cate a great need for HMF. The inverse relationship between ROE and the national HMF portfolio may give some potential HMF investors pause for
thought; for this reason, investing only in those African MFIs with an established record of sustai-nable lending is advisable. Currently, no uniform, international database on the financial status of MFIs exists. Though the MIX Microfinance forum does compile some of this information, it relies upon surveys filled out by the MFIs themselves; it is unknown what proportion of the surveys is ac-tually returned. Instead, UN-Habitat or some other international body should create and manage a microfinance authority, charged with indepen-dently auditing the books of MFIs at least once every three years. After an initial grace period of several years, all MFIs would be required to dis-close their financial statuses. Promoting greater transparency within the microfinance sector would surely spur greater outside investment.
For all regions these results must be interpreted cautiously, for there lurks a trade-off between the different regression equations. As one progresses from the global to the sub-regional scale, the equations’ predictive power increases as their sample sizes decrease. While this is no small is-sue, such sample sizes are unavoidable in a study that uses countries as its subjects. Further re-search is needed as to the contradictions between several of the regression equations. For example, return on equity is associated with lower HMF portfolio sizes in Sub-Saharan Africa but higher ones in eastern Europe and western Asia. Further non-linear or parametric approaches may reveal stronger relationships at the regional level.
Table 8: HMF Investment Countries
By Largest Absolute Portfolio Growth By Largest Percent Portfolio Growth
Argentina Nicaragua Central African Republic Niger
Egypt Pakistan Chad Rwanda
Guatemala Panama Cote d’Ivoire Republic of Congo
Haiti The Philippines The Gambia Sierra Leone
India Uzbekistan Guinea Swaziland
Laos Tanzania
Liberia Yemen
Namibia Zambia
Nepal
Appendices
Appendix A: Explanation of Variables
Dependent Variable
Housing Microfinance Portfolio (HMF): dollar
amount of HMF occurring in a country
Independent Variables
Foreign Direct Investment (FDI): dollar amount of
FDI in a country, according to World Dev. Indicators
Informal GNI per capita: per capita earnings in
the informal sector for each country (total popu-
lation assumed to work informally)
Microfinance Donor Money (MF $): dollar amount of MF donations in a country
Doing Business Rank (DB): Ranking of all countries, from 1 to 180 (worst-performing) World Bank: Doing BusinessHomeownership: The proportion of households owning homes in a given country
Corruption Ranking: Ranking of all countries, from 1 to 180 (worst; Transparency International)
Density: population density in people per square kilometre
Urban %: The proportion of people living in urban areas
Depth of Outreach of Microfinance Institutions (Depth): Equal to the average loan balance per MFI
borrower divided by GNI per capita. Measures how far “down-market” the country’s microfinance sector serves. Lower depth figures indicate that microfinance institutions serve the poorer income segments in their respective countries.
Operational Self-Sufficiency: For the microfi-nance sector as a whole, how self-sufficient MFIs are in terms of funding their own operations; a score of under 100% means the organisations are relying upon outside funding.
ROA: Return on assets for a country’s microfi-nance sector
ROE: Return on equity for a country’s microfi-nance sector
Housing Microfinance Feasibility Analysis

June 2009 HOUSING FINANCE INTERNATIONAL 39
Appendix B: Regression Equations
Section 2: Regional Regressions Asia
n= 23; R= .39 R2 = .152 Y = (147,593.12*Density)+(3.385*10^7) (2.44 E7) (2.44 E7)
Eastern Europe, Western Asia
N= 13; R = .949 R2= .90Y=(0.001*FDI)+(757292.219*doing business rank)+((9.227*10^7)*homeownership %)-(4,515,033.86*depth of MFI outreach)+((9.419*10^7)*ROE)-(7.169*10^7) (.002) (251,957)** (3.039 E7)** (9,125,686.7) (4.74 E7)* (2.76 E7)**
Latin America
N= 23; R= .841 R2= .707Y =(0.011*FDI)-(48.84*Informal GNI)+(1.4*MFI donor $)-(512,556.536*doing business rank)+(416,682.754*Density)+(2.4*10^7) (.003)** (123.44) (.548)** (449,311) (152,131)** (6.8 E7)
Sub-Saharran Africa
N= 42; R= .811 R2= .658Y =(0.002*FDI)+(0.439*MFI donor $)-((2.607*10^7)*ROE)+(3,184,996.076) (.001)** (.107)** (4,599,967)** (1,423,038.7)**
North Africa and the Middle East
n=15; R= .841 R2= .707Y =(0.396*MF Donor $)-(203,863.348*DB Rank)+(290,006.124*corruption)-(932,868.6*urban population %)+(4.6*10^7) (1.42) (202,859) (197,141.9) (449,092)** (2.9 E7)*
Section 3: High-Flyers Approach Asia
N= 13 R= .764 R2= .584Y=(0.033*FDI)+(70,340.221*Density)+(2.42*10^7) (.01)** (73,190.6) (3.33 E7)
Latin America
n=12; R= .96 R2= .921Y=(0.011*FDI)-(1,743.31*informal GNI)+(1,197,774.6*corruption)-(3,203,023.884*DB rank)+(543,313.5*Density)+(9,194,400.771*Urban %)+(8.758*10^7) (.004)** (704.142)** (860,715.2) (1,047,289.9)** (347,445.2) (4,583,470.9)* (1.03 E8)
Eastern Europe / Western Asia
N= 7; R= .976 R2=.953Y=(0.01*FDI)+(1,439,001.35*Urb %)+((1.516*10^8)*ROE)-(7.33*10^7) (.003)** (746,671)* (3.6 E7)** (5.12 E7)
Middle East / North Africa
N=8 R= .57 R2=.324Y=(1.217*MF Donor $)-(617,253.221*Urban %)+(3.556*10^7) (2.124) (727,018) (4.038 E7)
Sub-Saharan Africa
n=19 ; R=.842 R2=.709
Y=(0.002*FDI)-(16.6*Informal GNI)+(0.218*MF Donor$)-((5.67*10^7)*ROA)-((1.797*10^7)*ROE)+(1.143*10^7)
(.002) (18.0) (.194) (4.68 E7) (1.07 E7)* (3,705,974.9)
Housing Microfinance Feasibility Analysis

40 HOUSING FINANCE INTERNATIONAL June 2009
Works Cited
Ahlburg, D., & Kelley, A. (1996). Impact of Population Growth on Well-being in Developing Countries. Springer.
Bank, I. B. (2007). Doing Business 2008. Washington, D.C.: The World Bank and the International Financial Corporation.
Bank, W. (2007). Financial Sector Development Indicators. Washington, D.C.: World Bank.
Bank, W. (2008). World Development Indicators. The World Bank.
Daphnis, F. (2004). Housing Microfinance: A Guide to Practice. Sterling, Virginia: Stylus Publishing.
Economist Intelligence Unit. (2007). Microscope on the Microfinance Business Environment in Latin America 2007. The Economist.
Ferguson, B. (2003). Housing Microfinance-- A Key to Improving Habitat and the Sustainability of Microfinance Institutions. Small Enterprise Development , 14 (1).
Fiadzo, E. (2004). Estimating The Determinents of Housing Quality: the Case of Ghana. World Bank.
Honohan, P., & Beck, T. (2008). Making Finance Work For Africa. World Bank.
Malpezzi, S., Mayo, S. K., & Gross, D. J. (1987). Demand for Housing in Developing Countries. Economic Development and Cultural Change , 35 (4), 687-721.
Mesarina, N., & Stickney, C. (2007). Getting to Scale in Housing Microfinance. Accion Insight (21).
MIX Microfinance. (2008, December). Retrieved December 10, 2008, from http://www.mixmar-ket.org/en/about_mix_market.asp
Nations, U. (2007). UN World Urbanization Prospects. Retrieved December 10, 2008, from http://esa.un.org/unup/
Saunders, A., & Cornett, M. M. (2007). Financial Institutions Management: A Risk Management Approach. New York: The McGraw-Hill Companies.
Schneider, F. (2005). Size and Measurement of the Informal Economy in 110 Countries Around the World. World Bank.
Stephens, M. (2005). A Critical Analysis of Housing Finance Reform. Urban Studies (No. 10).
Transparcny International. (2008). Corruption Perceptions Index 2008. Retrieved December 10, 2008, from http://www.transparency.org/policy_research/surveys_indices/cpi
Walley, S. (2008). World Mortgage Database. Washington, D.C.: The World Bank
Housing Microfinance Feasibility Analysis

June 2009 HOUSING FINANCE INTERNATIONAL 41
1 Zaigham Mahmood Rizvi is currently working as a Consultant on Housing and Hou-sing Finance for the World Bank Group. The findings, interpretations, statements and conclusions expressed herein are those of the authors alone and do not ne-
cessarily reflect the views of the International Bank for Reconstruction and Deve-lopment/The World Bank and its affiliated organizations, or those of the Executive Directors of The World Bank.
Solar for Social Housing: Elaborated using Pakistan’s Case
By Zaigham Mahmood Rizvi1
Housing development has a direct linkage to a number of Construction Material Industries (CMIs). In Asian countries that number is around 40-45 CMIs; while Europe and America have been stated to have more than 70 CMIs. At the same time, development of housing and real estate needs the support of utilities (water, electricity etc.), as well as residential infrastruc-tures like sewerage, roads and public transport in addition to health and education facilities.
Since land availability and price are the critical and determining factors for “affordability”, most of the low-income housing schemes in the un-der developed and developing world emerge in the suburbs and on the outskirts of cities. In the developed world, the poor live in the downtown/slum areas, while the wealthy prefer to live in the suburbs. Whilst in under developed and de-veloping world, the rich prefer dwellings close to the centre of the city in downtown areas while the poor find shelter in the suburbs.
Experience has shown that for a habitat to be ac-cepted as liveable by the poor and needy, electricity and water are the main deciding factors. Although access to water can be gained by digging local wells, there still needs to be some form of affor-dable and reliable source for lighting and energy. Since provision of electricity through the national grid (transmission lines), is capital intensive, it re-sults in years of waiting for budgetary allocation. The more fundamental issue is the availability of surplus electricity, which could be fed into the system for this un-served part of the population. Most of the under developed and developing world is facing an acute shortage of electricity even to supply those who do have access to the national grid. Since a major portion of electricity production in these countries is “thermal”, rising fuel prices and rapidly depleting fossil fuel reserves (non-re-newable resources), make this neither viable nor sustainable for the low-income individual or even for the country’s economy at large.
This paper focuses on the practicality and viability of solar energy for the poor and the needy - ideal
candidates for social housing. The following pa-ragraphs aim to elaborate further on this subject, through the situation and experiences in Pakistan, even though such scenarios are similar in other developing and under developed countries.
Social Aspects
Like many developing countries in the world, Pakistan faces an acute shortage of electricity. The power generation capacity is largely ther-mal and hydro, with the following breakdown:
Thermal (Public) 25% Thermal (Private) 40% Hydro (Public) 33% Nuclear 2% Alternative Energy Sources = Insignificant
The generation capacity is approximately 15,941 MW, out of which 14,263 MW is avai-lable in the summer but only 11,013 MW during the winter months, primarily due to a shortfall in the water level at the hydroelectric dams.
The demand estimate for the period 2007-08 was 17,398 MW, whilst the actual supply was only around 12,442 MW. This means that the country is currently facing a shortage of around 4,550 MW, which results in frequent power “shutdowns” for both residential and industrial consumers. With a growth rate of 10-11% per annum in recent years, the country’s electricity demand is projected to grow to 28,630 MW by 2014-15, which will further widen the demand/supply gap. Unless new generation capacity is installed on a war-footing basis with a visible shift to alternate energy sources, including solar and wind power, the situation will severely af-fect Pakistan’s socio-economic conditions.
The power consumption per consumer category is:
Domestic 49% Industrial 25% Agriculture 14% Commercial 7% Others 5%
More than two-thirds of the country’s population lives in rural areas. Under the village electrification program, 132,569 villages have now been provi-ded with electricity (this figure was 609 in 1958). Although these villages have been provided with electricity transmission lines (connected to the national grid), due to frequent power shortages, they also become the first victims of power “shu-tdowns”. Thus, the “served” population becomes “underserved” instead. Another sizeable popu-lation living in remote/mountain areas remains largely “un-served” as well because the provision of electricity to these remote areas through the national grid has its own budgetary constraints for the government. Therefore, many such areas currently being served by the national grid are not economically viable due to a scattered population.
Economic Aspects
Rising fuel prices are making thermal electricity increasingly expensive and thus unaffordable for the general public. The difficult economic situa-tion currently being faced by most countries is resulting in governments withdrawing all “sub-sidies” previously available for residential users on electricity tariffs. The oil price-hike during 2007-08 demonstrated that the economies of countries with massive oil import bills are ex-posed to oil price volatilities. For Pakistan, the oil import bill constitutes nearly 25-33% of the total import bill and 40-50% of the country’s export bill. During the price-hike, the foreign exchange reserves were wiped out with the currencies being depreciated whilst production costs rose. For political expediency, the power cuts were made to affect primarily the industrial wheel. The consequent production loss has resulted in fur-ther economic losses and unemployment.
Solar for Social Housing: Elaborated using Pakistan’s Case
Solar for Social Housing: Elaborated using Pakistan’s Case
42 HOUSING FINANCE INTERNATIONAL June 2009
Renewable and Non-Renewable Energy
Non-renewable energy sources include fossil fuels like oil, coal and natural gas. However, these sources are being depleted rapidly and cannot be renewed. However, due to an in-creasing demand for them, their prices are volatile and will inevitably rise. In addition, the use of fossil fuels has environmental conside-rations, which have led to the economic cost of “Carbon Credits’. The government of Pakistan is considering a levy of a Carbon Tax - similar to many other countries - in order to discourage the use of fossil fuels.
Renewable energy sources include solar, wind, bio-mass, hydro and geo-thermal power. The use of nuclear power has its own environmental and safety concerns; therefore, a gradual switch to renewable energy sources is imminent. The viable and sustainable alternative would be a partial shift to renewable sources of energy. For residential consumers in “un-served” and “un-derserved” areas, the practical and sustainable option would be solar and wind power.
Solar Energy: The Kindness of Nature
The global demand for energy is 15 Tera Watts (TW), while the Sun - nearly 93 million miles away - blazes energy towards the earth, esti-mated at 89,000 TW - an enormous amount in relation to our need. The sun produces light/heat energy by burning massive amounts of hydrogen emitted from its core - in a form of continuous and controlled nuclear reaction. According to one estimate, considering that the sun is expending 700 billion tonnes of hydrogen every second, it is likely to keep burning for another 4.5 billion years. Therefore, the key issue is neither its cost nor its continuity, but of harnessing this blessing of nature as a valuable resource. The solar en-ergy distribution pattern is:
Scattered and reflected back by clouds 20% Scattered from the atmosphere 6% Absorbed by the atmosphere and clouds 19% Reflected by the Earth’s surface 4% Absorbed by the Earth 51%
Thus, nearly half of the energy emitted by the sun is available to us as solar energy - around 6,000 times more than our current global energy needs.
Why Solar in Pakistan?
Pakistan is currently facing a power shortage of more than 4,500 MW. Oil and gas generated electricity currently contributes nearly two-thirds of its total power generation. The required oil reserves are mostly imported. Over recent
years, the oil import bill has been rising and it consumes a major part of the country’s foreign exchange earnings. Furthermore, generating thermal energy is neither environmentally frien-dly nor sustainable for the economy.
On average, solar energy is available 8-10 hours per day in most of Pakistan, while wind energy at desired levels is available mostly on coastal areas. On the other hand, a combination of solar and wind generated energy may work in most areas of Pakistan.
Market Segmentation
Based on the availability of electricity, the entire consumer market could be segregated into three segments:
Served Population:These are mostly urban populations, which have access to the national grid and face intermittent load-shedding - i.e. managed “brownouts.” This segment is more sensitive to comparative economics, reliability and quality of alternative energy sources. Although not the first victims of power shortages, they are the decision-makers when it comes to planning and policy issues.
Underserved Population:These are the low-income sections of the popu-lation living in urban and rural areas, which have a deficient and frequently interrupted electricity supply. While they have bare minimum require-ments for lighting, ventilation etc., the tragedy is that they are the first victims of load-shedding.
Un-served Population: These often happen to be people living in vil-lages with no electricity or those living in remote areas that have either no electricity or a very poor supply of electricity. They are not served by the national grid primarily for economic and budgetary constraints. This segment’s electricity needs are also a bare minimum (lighting, mobile charger, and maybe the luxury of a running fan for ventilation).
Solar Solutions based on Market Segments
To design and develop modules for the “Solar for Social Housing”, the market can be divided into three segments, namely:
1. Basic Module(Low-Income Group)
Retail Solutions: DC system of 90W panel, four bulbs each equivalent to 75W, one DC fan (22W) and a mobile charger.
Cost Estimate: Rs 80,000 (US$ 1000). The electricity savings amount to 113 units per month, which could be made available for the industry at a higher tariff, meaning an electricity bill sa-ving of Rs 800 (US$10) per month to the consumer.
If the housing finance companies extend a sub-sidised loan of Rs 60,000 at an LTV of 80:20 at 6% per annum, the monthly mortgage payment would be around Rs 600 per month, which compares favourably with the electricity bill of Rs 800 per month.
The government could provide subsidised credit under the “Solar for Social Housing Programme”.
In the Basic Module for village solar electrifica-tion, a typical village of 30 houses (two bulbs of 8W plus a mobile charger, a place of worship and a school (two fans of 60W, two bulbs of 14W) and a community centre (lighting plus TV), would cost about US$15,000. Even NGOs and corporations could be motivated to come forward to support such a programme.
2. Regular Module (Middle-Income Group)
Retail Solutions: Air conditioning (AC) system of a 400W panel, six bulbs each equivalent to 75W, three AC fans and a mobile charger.
Cost Estimate: US$ 3,000. Similar economics would apply as in the case of the Basic Module.
3. Community Module (Community-Based Projects)
Wholesale Solutions: 200-1000KW AC system, supplied on national grid. The community solu-tions are more applicable to clusters of low- and middle-income groups. China is the main sup-plier of solar plants in this size range at very competitive costs, provided one has the techni-cal support to verify quality. Initiatives for such community-based solutions could be taken forward by both the public and private sectors’ power generation companies. For the wholesale community-based solutions, both on-grid and off-grid options may work.
Such retail solutions may also be applied for street lighting programmes as well as for solar water heaters.

Solar for Social Housing: Elaborated using Pakistan’s Case
June 2009 HOUSING FINANCE INTERNATIONAL 43
Cross Subsidy Models for Solar Solutions
An argument that is generally extended against the use of solar energy is the upfront capital cost, which is deemed to make it unaffordable. This argument might have had some standing when solar technologies were very capital intensive, electricity shortages were not as common and awareness about the scarcity of fossil fuels did not exist.
During the last years, however, the dynamics have radically changed and none of the above arguments have retained any value. Although solar solutions are still quite capital intensive and raise affordability issues for the deserving seg-ments of the population, there are several ways to reduce costs here. One way to enhance affor-dability is through the provision of “subsidies”. The subsidies could be provided either as “direct subsidies “by the state or as “cross-subsidies” from the rich to the poor.
The use of renewable energy such as solar power is encouraged by providing subsidies in capital and interest costs. In view of the weak economic conditions faced by developing countries, direct subsidies from the state are neither possible nor are such subsidy models sustainable. Therefore, a cross-subsidy model could be used as a viable and sustainable format.
Industry would save on economic losses by pro-viding cross-subsidies:
In Pakistan, the power tariff for industrial consumers is almost double that of domestic consumers. However, due to political expe-diency, “shut-downs” are applied mostly to the industrial rather than to domestic consu-mers. Such a policy has two adverse impacts on the economy:
Economic Loss: a loss of industrial produc-tion causes an “economic loss” estimated at Rs 15/unit.
Tariff Loss: the industrial tariff is about Rs 10/unit while domestic consumers are charged a subsidised tariff of Rs 5/unit.
Therefore, by keeping the industrial wheel tur-ning, the economy would gain more by saving such an economic loss and earning additional revenues. A part of this economic gain could be passed on to domestic users using solar power. The industry could finance/subsidise a part of the capital cost and the state could subsidise the in-terest rate by cross-subsidising the above gains.
Carbon Credits:
By switching to environmentally friendly sources of energy, the earned “Carbon Credits” could also be passed on to provide subsidies in capital and interest costs.
Carbon Tax:
The government of Pakistan is considering a levy of a “Carbon Tax” on industries using fossil fuels as a source of energy. The revenues collected should be used to subsidise the promotion of re-newable energy such as solar power.
Solar and Renewable Energy Initiatives in India
India has a population of 1,027 million people (2001) and a much bigger energy issue than Pakistan but it has taken some very good initia-tives to promote the use of renewable energy, including solar power. Solar energy has a great promise for India, since India receives 5,000 trillion KWH of energy per year from the sun - a daily average of 4-7 KWH/m3 - and has 300 clear sunny days per year. The programme covers the following sources of energy:
Solar (on-grid and off-grid systems) Wind Energy Bio-mass/Bio-gas Small Hydro Power Plants
The Indian programme has been started at both central and state governments levels. Supported by the central government, 24 states have Village Electrification Programmes using solar energy. Under this programme, 5,259 villages were sanctioned, out of which 3,332 villages have been provided with solar power, while 1,675 villages are on their way to achie-veing the same. The Solar Photo-Voltaic (SPV) Home Lighting Programme initially covered four lights per house, and after 2005, it provided two lights per house. A two light system is desig-ned to provide 0.1 KWH/day, with a typical cost of Indian Rupees (IRs) 13-15,000. The subsidy amount is based on a defined “model” of solar lighting for a household. The Central Financial Assistance subsidises as follows:
Solar Home-lighting Model-1 IRs 6,000 Solar Home-lighting Model-2 IRs 11,000 Solar Street-lighting IRs 20,000
There are always questions about the ef-fectiveness and transparency of a subsidy programme. The Indian experience has shown that since the subsidies reduce the upfront ca-pital cost impact, the vendors also support and market such programmes. In Pakistan, the go-vernment has not yet announced any incentive programme to promote solar power usage.
Conclusions and Recommendations
Providing housing to low- and very low-income households is a major “economic” issue, due to the challenge of “affordability”. At the same time, it is a “social” issue because this market
segment constitutes nearly two-thirds of the population. In view of the issue of mismatches in household income and property cost, market forces do not come forward to meet this mas-sive potential demand. This makes this segment, the “social housing” segment. To make such real estate projects “affordable”, most of these de-velopments take place on the outskirts of cities. Such areas are either un-served or underserved by utility providers and residential infrastructure - electricity being the most critical of these. Due to budgetary constraints, the option of laying national grid transmission lines is also limited. Furthermore, due to power shortages, these un-derserved and un-served areas become the first victims of any power cuts.
Renewable sources of energy are preferred be-cause of environmental considerations. The solar energy option is economical on a long-term ba-sis, needs less maintenance and is more handy and dependable. The cross-subsidy models as discussed in the paper suggest that the financial burden on the state could also be minimised, if not eliminated.
Therefore, it is a good time to consider linking any social housing project with the provision of solar energy. Existing success stories of solar en-ergy for social housing needs appear to support its use in large scale housing schemes for low-income populations.

44 HOUSING FINANCE INTERNATIONAL June 2009
The Impact of the Subprime Mortgage Financial Crisis on Housing Finance in South Africa
Introduction
The subprime mortgage financial crisis has been experienced in most parts of the world for a number of years and most recently in the United States of America (USA) since mid- to late 2007. According to Wikipedia, the subprime mortgage financial crisis’ growth is positively correlated to the growth in the subprime lending3 market. The subprime mortgage market around the world was worth US$800 billion in 2007 according to Bloomberg News, published on the site on 12th July 2007, and a large portion of that subprime mortgage market is concentrated in the USA.
The objective of this research report is to assess the impact of the subprime mortgage crisis in the housing finance market in South Africa (SA). More importantly, the paper tries to analyse the lending patterns of South African financial institu-tions during the subprime mortgage crisis period. This paper is shaped around Chiu’s (1998) em-pirical research report. Chiu (1998) analysed the Asian financial crisis in 1997 and 1998 on Asian Tigers (Singapore, Hong Kong, Taiwan and South Korea) and in her empirical study, she looked at the following variables: growth rates of the Asian Tigers’ Gross Domestic Product (GDP), openness to the global economy, financing activities of the Asian Tigers and housing market policies.
Firstly, the article gives the background on sub-prime mortgages in SA and then it explores the impact of the subprime crisis from other authors’ perspectives. Many articles on the subprime mortgage crisis were researched from developed countries’ perspectives as the crisis seems to be prevalent in those markets. The Asian housing markets experienced the subprime mortgage crisis due to high openness of the economies, the relaxation of policies regulating housing mar-
kets and high economic growth. Thereafter, the paper analyses the current mortgage state of the South African market and specific lending trends are highlighted. In conclusion, the research paper makes recommendations to South African hou-sing finance institutions on issues and measures that such institutions should be aware of when issuing loans for buying houses.
Literature Review
The literature review explores readings from different authors who analyse the factors that contribute to the subprime mortgage financial crisis. According to their research, some com-mon prevailing factors are reckless lending, strong economic growth and relatively poor ban-king systems.
Chiu (1998) analysed the economic perfor-mance and housing markets of the Asian Tigers (Singapore, Hong Kong, Taiwan and South Korea) in the light of the Asian financial crisis in 1997 and 1998. Her empirical study analysed growth rates of Gross Domestic Product (GDP) of Asian Tigers, openness of the economies, di-rect foreign investments into the Asian Tigers’ economies and policies regulating the housing markets in the given countries. In Chiu’s (1998) empirical study, movements of global funds inside Asian Tigers’ economies was one of the factors that triggered the housing financial crisis. She showed that prior to the financial crisis, the Asian Tigers’ economies were experiencing high volumes of foreign direct investments (FDI). For example, Hong Kong’s FDI between 1997 and 2004 was at least 10% of its GDP. Chiu (1998) said that property markets move in tandem with the economic growth of the country. Therefore, when the economic growth is relatively high,
more people will invest in the property market. Additionally, she shows that in times of slowing economic growth, the property market slows down as well.
The government policies differed in all four countries but had in common a general tendency to reduce government involvement. This policy move was hampered by various elements, such as price control mechanisms, housing finance control, supply control and others. In contrast to Singapore and Taiwan, reforms in South Korea and Hong Kong were more far reaching.
Edison, Luangaram and Miller (2000) looked at the property booms and busts in Asia, and pos-sible drivers of those booms and busts in South Korea, Indonesia and Thailand. According to them, in early 1997 the three economies enjoyed rapid economic growth, their currencies were pegged to the US Dollar and there was exces-sive credit build-up during the rapid economic growth within those countries. During that time, most financial institutions within those countries financed their borrowings through short-term foreign currencies; this increased the value of assets immensely, especially within the property market. Despite successful economic growth within the region, there were signs that in some sectors, prices were at or reaching their peaks and most investors ignored them. Another pro-blem with the Asian countries’ financial systems was that they were not properly regulated, which led to failure to dampen overheating pressures within the real estate sector. Most of the Asian indexes reached their peaks and were followed by massive declines within a short space of time.
Edison, Luangaram and Miller (2000) say that most currency crises have often been preceded by a boom-bust cycle in property prices. They
The Impact of the Subprime Mortgage Financial Crisis on Housing Finance in South Africa By Tumellano Sebehela1 2
1 Tumellano Sebehela works as a Credit Analyst at National Housing Finance Corpora-tion Ltd (NHFC), in Johannesburg (South Africa). The findings, interpretations, state-ments and conclusions expressed herein are those of the authors alone and do not necessarily reflect the views of the International Bank for Reconstruction and Deve-lopment/The World Bank and its affiliated organisations, or those of the Executive Directors of The World Bank or the NHFC.
2 I am grateful to the valuable contribution of Dr. Friedemann Roy and Nokuthula Mguli.3 Wikipedia defines subprime lending as the practice of making loans to borrowers who do not qualify for market interest rates because of problems with their credit history or the ability to prove that they have enough income to support the monthly payment on the loan for the applying.

June 2009 HOUSING FINANCE INTERNATIONAL 45
The Impact of the Subprime Mortgage Financial Crisis on Housing Finance in South Africa
used the Kiyotaki and Moore (1997) (KM) mo-del to analyse the relationship between property cycles and banking systems. Their findings were that the availability of abundant funds with no proper regulations was one of the reasons for busting property prices. In Thailand, for example, property prices fell by more than a quarter and the national currency (Baht) lost half of its value against the US Dollar.
Furthermore, their empirical analysis looked at ways of stabilising economies during busting property prices. Using the KM model, results confirmed that financial institutions within those economies should recall loans within a reaso-nable time; authorities need to implement proper relations for financial institutions, encourage take-overs between financial institutions and banks need to have their own internal cover for loans issued. The crises at the time, forced banks to keep on financing properties in order to minimise incurred losses from the crisis in property prices.
State of the South African Housing Market and Possible Factors Affecting Housing Finance
The literature review serves as a basis for the as-sessment of the current state of the South African housing finance market. The data for default within mortgage home loans is taken from the South African Reserve Bank (SARB), covering the period from November 2001 to December 2007. The data is mainly from South Africa’s four big banks (Standard Bank, Amalgamated Banks of South Africa, First National Bank and Nedbank). Figure 1 shows the percentage of default versus time from November 2001 to December 2007.
Most South African and international market commentators say that SA now has relatively good macroeconomic policies as compared to those of the last 15 years. The global financial
crisis has impacted upon the South African eco-nomy through declining commodity prices and rising fuel and food prices, fuelling inflation.
Irrespective of the positive economic develop-ment before the outbreak of the crisis, mortgage defaults have increased over the last seven years, but at a decreasing rate as shown by the actual figures of default in Table 1 (trillions of South African Rands).
Recently, in an interview published on the Moneyweb website (South African online finan-cial publication) between Kennedy Bungane, Director and Head of Institutional & Corporate Banking, Standard Bank of South Africa, and Geoff Candy, Editor of Moneyweb, Mr. Bungane said that the securitisation of low-cost houses was increasing in South Africa despite the glo-bal financial crisis. Mr. Bungane added that the amount of money contributed by South African financial institutions and the government had been at least R10 billion.
Du Toit (2008) goes further, indicating that des-pite the global financial mortgage crisis, its effect on the South African housing market was either not severe or had no impact at all. Du Toit (2008) lists the following reasons that support strong growth of the South African housing market:
South African economic development: South Africa’s economy expanded by 5.1% (real terms) in 2007, which is relatively good for an emerging economy.
The effects of the National Credit Act (NCA) curbed the amount of debt the South African consumer is permitted to have.
The house price rises in the country: ave-rage prices of affordable housing increased by 19% (nominal terms). Further, the prices of residential properties along South African coastal areas increased by 10% in 2007. In South Africa’s major metropolitan areas, no-minal house price growth was between 10.6% and 25.5% in 2007. In 2008, nominal house price growth is projected to increase by 7.8%, already indicating a decreasing trend.
Rising spreads for bond issues indicate a wea-kening economy. According to Moodley, Lipson and Pein (2008), this development is largely due to negative global sentiment and uncertainty of financial markets, deteriorating local market fundamentals and increasing inflation and in-terest rates.
At the same time, there seems to be a strong correlation between mortgage finance taken out by consumers and existing levels of interest rates within South Africa as indicated by Figure 2.
The correlation co-efficient
€
ρ( p,h )( ) between
the South African prime interest rate and the housing growth in percentage is 0.5977, which is relatively high, but it does not explain any cau-sality. In order to see a causality effect whether the increase in the prime rate as determined by the South African Reserve Bank (SARB) causes a decrease in the funds allocated to building or buying houses, it will be assumed that housing growth is a dependent variable while the prime rate is an independent variable. A linear regres-sion is used. Figure 3 illustrates the impact.
Nov-
01
Feb-
02
May
-02
Aug-
02
Nov-
02
Feb-
03
May
-03
Aug-
03
Nov-
03
Feb-
04
Feb-
05
Feb-
06
Feb-
07
May
-04
May
-05
May
-06
May
-07
Aug-
04
Aug-
05
Aug-
06
Aug-
07
Nov-
04
Nov-
05
Nov-
06
Nov-
07
0%
0,50%
0,86%
0,82%0,64%
0,68%
0,84%
1,33%
1,54%
2,00
1,96%
1,54%
1,20%
0,78%
0,62%
0,63%
1,00%
1,50%
2,50%
2,00%
Percentage of Default in South Africa
Defa
ult (
in %
)
Time
Perecentage of Default in South Africa
Source: SARB, DI500-Tumellano SebehelaFigure 1
Source: SARBTable 1
Time Actual Loss (in R'000s)
Dec-07 7 166 052
Nov-07 6 715 462
Dec-06 4 277 389
Nov-06 4 059 777
Dec-05 3 240 871
Nov-05 3 366 078
Dec-04 3 095 822
Nov-04 3 270 171
Dec-03 3 832 647
Nov-03 4 182 513
Dec-02 4 259 991
Nov-02 4 222 218
Dec-01 4 868 923
Nov-01 4 927 028

46 HOUSING FINANCE INTERNATIONAL June 2009
Figure 2 shows that for every one unit increase in the prime rate, the housing demand increases by 1.79 units (almost twice per one unit increase in the prime rate). This confirms the widely held view that interest rates have a great impact on housing demand in South Africa. However, the coefficient of determination (R2) indicates that the dependent variable is not well (i.e. R2= 0.3572) explained by the independent variable.
Conclusion
Despite various studies by authors like Zhu (2006) showing that most financial institutions do not support the financing of houses, especially for low-income home owners, the South African study has not confirmed any financial institutions’ vigilance during increasing property prices. At present, the South African government seems to have adopted the right macroeconomic policies. For example, banks shall limit the amount of debt for an individual borrower (as stated in the South African Housing Market State section).
In order to be well prepared for the weakening economic conditions, it is recommended that South African financial institutions should pay more attention to the individual borrower’s fi-nancial capacities - i.e. their level of education, employability and the individual’s spending behaviour as South Africa is not immune from the subprime financial mortgage crisis. During times of high economic growth, consumers should be encouraged to use their own money and limit their borrowings.
From the consumer’s or borrower’s perspective, more education on taking out loans appears to be required as well. Consumers should have a clear picture about the different loan products available and the various risks involved in these products. Consumers should also be educated
about when it is the right time to take out a loan and the various factors and risks that exist in re-lation to such borrowing.
References
Ackert L. F. & Hunter W. C. (Dec, 1999). Intrinsic Bubbles: The Case of Stock Prices: Comment. The American Economic Review, Vol. 89, No. 5: pp. 1372-1376.
Apergis N. (2003). Housing Prices & Macroeconomic Factors: Prospects within the European Monetary Union. International Real Estate Review, Vol. 6 No. 6:pp. 63-74.
Cao H. & Qi L. (Feb, 2007). Financial System Reform & Monetary Policies in Asia. Journal of Asian Economics, Vol. 18, No. 1: pp. 63-75.
Chiu R.L.H. (1998). Globalization and Localization: Economic performance and the housing markets of the Asian Tigers since the financial Crisis.
Du Toit J. (4th Qua. 2007). Residential Property Perspective. ABSA’s Property Review, pp.1-10.
Du Toit J. (4th Qua. 2008). Housing Review. ABSA Home Loans, pp. 1-8.
Edison H. J., Luangaram P. & Miller M. (Jan, 2000). Asset Bubbles, Leverage and “Lifeboats”: Elements of the East Asian Crisis. The Economic Journal, Vol. 110, No. 460; pp. 309-334.
Evans B. (2007). Bubbles, Booms, and Busts. First Edition. McGraw-Hill Publishers.
Goffinet R. C., Koehler V. E. & Merchant R. (1998). Applied Statistics for Business and Economics using Excel. An Essentials Version. Third Edition. McGraw-Hill Publishers.
Jaffe A. J. & Sirmans C. F. (2001). Fundamentals of Real Estate Investment. Third Edition. South-Western Publishers.
Koh W., Mariano R. S., Pavlov A., Phang S., Tan A and Wachter S. (2005). Bank Lending and Real Estate Markets in Asia: Market Optimism and Real Estate Bubbles. Journal of Asian Economics, No.15: pp 1103-1118.
Moodley R., Lipson A. & Pein J. (Apr. 23rd 2008). CreditResearch, Pricing Analytics, Standard Bank of South Africa.
Red R. (2000). Baby Boomers and Property Busts. Australian Population Association.
Rode E. (Feb. 13th 2008). How will the Electricity Crisis affect Property? South African Property News, (www.rode.co.za).
Rode E. (Apr. 16th 2008). Electricity Crisis could af-fect Property Values. South African Property News, (www.rode.co.za).
Strong R.A. (1998). Practical Investment Management. First Edition. South-Western College Publishing.
Taylor J. B. (1993). Discretion versus Policy Rules in Practice. Carnegie-Rochester Conference Series on Public Policy, Vol. 39: pp. 195-214.
Tsatsaronis K. and Zhu H. (Mar, 2004). What Drives Housing Price Dynamics: Cross-Country Evidence. BIS Quarterly Review: pp. 65-78.
www.moneyweb.co.za /12th December 2007: 09H00.
Zhu H. (Dec, 2006). The Structure of Housing Finance Markets and House Prices in Asia. BIS Quarterly Review: pp. 55-69.
Relationship between Housing Growth & Prime Rate
Hous
ing
grow
th (
in %
)
Housing (in %) Prime rate (in %)
-10
-5
0
5
10
15
20
2000 2001 2002 2003 2004 2005 2006 2007 2008
Time
Hous
ing
dem
and
Housing Demand (in %) vs. Prime Rate (in %)
-10
0 2 4 6 8 10
y = 1.7855x - 19.798R2 = 0.3572
12 14 16 18
-6
-4
-2
0
2
4
6
8
10
12
Prime rate
Source: South African Reserve Bank Quarterly Bulletin; December 2008Figure 2
Source: SARB, SARB Quarterly 2008Figure 3
The Impact of the Subprime Mortgage Financial Crisis on Housing Finance in South Africa

www.emfconference.org
18 & 19 NOVEMBER 2009SHERATON BRUSSELS
EMF AnnuAl ConFErEnCE 2009

48 HOUSING FINANCE INTERNATIONAL June 2009
Notes
NOTES

June 2009 HOUSING FINANCE INTERNATIONAL 49
Notes
NOTES

50 HOUSING FINANCE INTERNATIONAL June 2009
Notes
NOTES


INTERNATIONAL UNION FOR HOUSING FINANCE
The International Union for Housing Finance (IUHF)
is a multinational networking organisation that
enables its members to keep up-to-date with
the latest developments in housing finance from
around the world, to learn from the experience
of others and to anticipate trends in their own
countries before they happen.
For more information, please see www.housingfinance.org or contact us at:
International Union for Housing Finance | 8th Floor, Avenue de Cortenbergh 71, B-1000 Brussels, Belgium | Tel: +32 2 285 40 30 | Fax: +32 2 285 40 31
How does the Union do this? By communicating!
The Union runs a website - www.housingfinance.org. Please pay a visit!
The Union publishes a quarterly journal, Housing Finance International (HFI)
The Union publishes a bi-monthly Newsletter
The Union organises a World Congress every two or three years and collaborates with other organisations to sponsor various events
The Union facilitates the exchange of information and networking opportunities between its members
The Union does this in five
different ways