the real effects of financial markets: the impact of...
TRANSCRIPT

THE JOURNAL OF FINANCE • VOL. LXVII, NO. 3 • JUNE 2012
The Real Effects of Financial Markets:The Impact of Prices on Takeovers
ALEX EDMANS, ITAY GOLDSTEIN, and WEI JIANG∗
ABSTRACT
Using mutual fund redemptions as an instrument for price changes, we identify astrong effect of market prices on takeover activity (the “trigger effect”). An interquar-tile decrease in valuation leads to a seven percentage point increase in acquisitionlikelihood, relative to a 6% unconditional takeover probability. Instrumentation ad-dresses the fact that prices are endogenous and increase in anticipation of a takeover(the “anticipation effect”). Our results overturn prior literature that finds a weakrelation between prices and takeovers without instrumentation. These findings im-ply that financial markets have real effects: They impose discipline on managers bytriggering takeover threats.
DOES A LOW MARKET valuation make a firm a takeover target? In theory, if acqui-sition prices are related to market prices, acquirers can profit from taking over afirm whose market value is low relative to its peers—due either to mispricing ormismanagement—and restore it to its potential. Indeed, in practice, acquirersand other investors appear to track a firm’s valuation multiples for indicationson the potential for acquisition, and managers strive to maintain high marketvaluations to prevent a hostile takeover. Understanding whether such a linkexists is important because, if so, this would suggest that the market is not asideshow, but rather exerts a powerful disciplinary effect on firm management(as suggested by Marris (1964), Manne (1965), and Jensen (1993)).
Despite the above logic, existing empirical studies on takeovers fail to sys-tematically uncover a meaningful relationship between market valuations
∗Edmans is from The Wharton School, University of Pennsylvania, NBER, and ECGI. Goldsteinis from The Wharton School, University of Pennsylvania. Jiang is from Columbia Business School.For helpful comments and discussions, we thank the Editor (Cam Harvey), two anonymous refer-ees, an Associate Editor, Jack Bao, Thomas Bates, Jonathan Berk, Philip Bond, Jess Cornaggia,Todd Gormley, Dirk Hackbarth, Ayla Kayhan, Alexander Ljungqvist, Ernst Maug, Konrad Menzel,Randall Morck, Stew Myers, Lalitha Naveen, Gordon Phillips, Michael Roberts, Jacob Sagi, JeremyStein, and seminar participants at Columbia, Drexel, Georgia State, HBS, HEC Paris, HKUST,Houston, Mannheim, MIT Sloan, SUNY Binghamton, Temple, Tilburg, UNC, UT Dallas, Yale,AFA, Caesarea Center Conference, FIRS, LSE Paul Woolley Center Conference, NBER, the UBCSummer Conference, and the Washington University Conference on Corporate Finance. RobertReady and Carrie Wu provided valuable research assistance. Edmans gratefully acknowledgesthe Goldman Sachs Research Fellowship from the Rodney White Center for Financial Research.This paper was previously circulated under the title “Takeover Activity and Target Valuations:Feedback Loops in Financial Markets.”
933

934 The Journal of Finance R©
and takeover probabilities. While Cremers, Nair, and John (2009) and Bates,Becher, and Lemmon (2008) find a negative (but economically insignifi-cant) relation between takeover likelihood and Tobin’s Q, Palepu (1986) andAmbrose and Megginson (1992) uncover no link and Rhodes-Kropf, Robinsonand Viswanathan (2005) document that market-to-book ratios of targets arein fact higher than those of control firms. Agrawal and Jaffe (2003) furtherfind that targets do not exhibit inferior prior stock performance to peer firms.These results cast doubt on the received wisdom that market valuations createa takeover threat that forces managers to improve firm performance.
We argue that there is a fundamental challenge to finding a relation betweenmarket prices and takeover activity in the data. While markets may exhibita trigger effect, whereby a decrease in market valuation due to mispricing ormismanagement induces a takeover attempt, market prices are endogenousand affected by other factors that may attenuate the above relationship andmake it difficult to detect empirically. There are three potential sources ofendogeneity. First, an anticipation effect may lead to reverse causality fromtakeover activity to market valuations, with forward-looking prices inflated bythe probability of a future takeover. Second, there may be omitted variablescorrelated with both takeover probabilities and market valuations. For exam-ple, if a technology shock creates the potential for synergies, it may increasea firm’s probability of becoming a takeover target and its market price at thesame time. In both of the above cases, even if a low valuation attracts an ac-quisition, a high valuation may indicate that an acquisition is probable, thusattenuating any relationship between valuation and takeover probability inthe data. Third, there may be measurement error. As indicated in the openingparagraph, we hypothesize that the true driver of takeover attempts is a de-cline in a firm’s market valuation below its potential—due either to mispricingor mismanagement. A firm’s raw market valuation is quite different from thefirm’s valuation discount and thus likely an inaccurate measure of it, biasingthe measured coefficient toward zero.
In this paper, we adopt a new approach that represents a first step towardovercoming the above endogeneity issues and cleanly identifying the triggereffect from market prices to takeover activity. Our approach consists of twomajor deviations from the existing literature. First, prior literature studies theeffect of raw valuations (such as price-to-earnings or market-to-book ratios)on takeover likelihood. However, a low raw valuation may not indicate under-performance and thus a need for a corrective action, as it may be driven byirremediably low quality (e.g., because the firm is mature and in a competitiveindustry). We thus construct a “discount” measure of the difference betweena firm’s current market valuation and potential value. This discount aims tomeasure undervaluation due to mismanagement or mispricing, and in turn thevalue that an acquirer can create by restoring a firm to its potential. Therefore,it has a theoretical link to the likelihood that a firm becomes targeted by abidder. We estimate a firm’s potential value using tools from the literature onstochastic frontier analysis, based on the values of other firms in the industryor with similar basic fundamentals.
The Real Effects of Financial Markets 935
Second, we employ an instrumental variable that directly affects the marketprice, but that affects takeover probability only via its effect on the marketprice. Conceptually, this is a difficult problem: any variable that is directlyassociated with the firm’s characteristics or management would not qualify asan instrument since it is directly related to both the price and the probabil-ity of a takeover. Hence, while the trigger effect is based on the idea that pricedecreases due to either mismanagement or mispricing will induce a takeover at-tempt, identifying it requires a measure of mispricing alone, that is, a variablethat changes the price but not due to issues related to the firm’s fundamentalsor management.
Friction-driven mispricing events have been the subject of a large recentliterature in finance, as summarized by Duffie (2010) in his presidential addressto the American Finance Association. Building on this literature, we constructa measure of price pressure induced by mutual funds not due to informationalreasons but rather to flows they face from investors. The idea follows from Covaland Stafford (2007), who document that large flows by mutual fund investorslead prices of stocks held by the funds to shift away from fundamental value forprolonged periods of time. While Coval and Stafford (2007) investigate actualtrades executed by mutual funds, they may not be a valid instrument in ourcontext if funds are trading deliberately based on private information on a firm’slikely takeover potential. We instead study mutual funds’ hypothetical tradesmechanically induced by flows by their own investors. We argue that fundinvestors’ decisions to accumulate or divest mutual fund shares are unlikelyto be directly correlated with the takeover prospects of individual firms heldby the fund. An investor who wishes to speculate on the takeover likelihoodof an individual firm will trade the stock of that firm rather than a mutualfund share.1 Hence, investor flows lead to price pressure that may affect theprobability of a takeover but are not directly motivated by this probability.We find that our measure causes significant price changes followed by slowreversal that ends with full correction only after about 2 years.
Our analysis uncovers a statistically and economically significant effect ofmarket prices on takeover probabilities. First, our discount measure exhibitsa more significant correlation with takeover probabilities than the valuationmeasures used previously in the literature: an interquartile change in the dis-count is associated with a one percentage point increase in takeover probabilityin the following year. Second, our main result shows that, by accounting for theendogeneity of the discount and instrumenting it with mutual fund investors’flows, the trigger effect rises substantially: an interquartile change in the dis-count causes a seven percentage point increase in takeover probability in thefollowing year. This is both statistically significant and economically importantrelative to the 6.2% unconditional probability that an average firm receives atakeover bid in a particular year.
1 Importantly, we exclude mutual funds that specialize in specific industries, to ensure thatinvestors’ flows are not driven by a takeover wave among many firms held by the fund.
936 The Journal of Finance R©
We also use our results to shed light on the determinants of market pricesin equilibrium. Inspecting the gap between the equilibrium correlation be-tween discounts and takeover probabilities and the causal effect of discountson takeover probabilities (i.e., comparing our estimated trigger effects withoutand with instrumentation), our results imply that, for the average firm, a onepercentage point increase in the probability of a takeover next year reduces thecurrent discount by 1.2 percentage points. Since takeover premium is, on aver-age, 40% of market value, one-third of this estimated decrease in discount (0.4percentage points) can be directly attributed to the anticipation of a takeoverin the following year. The remainder could result from other factors, such asthe technology-driven synergies mentioned above or anticipation of takeoversin future years.
Our findings have a number of implications for takeover markets. Firstand foremost, the trigger effect implies that financial markets are not justa sideshow. They have a real effect on corporate events such as takeovers andthus on firm value. In this respect, our paper adds to existing evidence on thereal effects of financial markets, such as Baker, Stein, and Wurgler (2003) andChen, Goldstein, and Jiang (2007).2 While these previous papers identify realeffects via comparative statics (showing that the sensitivity of real decisionsto prices increases in some firm characteristic that is hypothesized to augmentthe importance of prices), our paper identifies it directly. In particular, we arethe first to use an instrumental variable to capture the effect of exogenous pricechanges on corporate events.
In general, market prices will affect takeover activity if they are related toexpected future acquisition prices. This may happen for a couple of reasons.First, as in models by Fishman and Hagerty (1992), Dow and Gorton (1997), andGoldstein and Guembel (2008), decision makers may learn from market pricesto guide their actions. In a takeover context, this argument is more complex.For prices to affect takeover likelihood (rather than just the price paid in atakeover), there must be an asymmetry in learning between the acquirer andthe target’s shareholders. For example, suppose that target shareholders learnthe firm’s true value from the market price and thus demand a takeover pricethat is closely linked to the market price (e.g., a certain premium above marketprice),3 but the acquirer has additional information on the firm’s potential valueunder his management and so the value of the target to him is less sensitiveto the market price. In this case, a decrease in target valuation will increasethe potential gain for the acquirer and thus the likelihood of a bid. Note thatto date the possibility of asymmetric learning has not yet been incorporatedinto the theoretical takeover literature. Our empirical findings thus call fora modification of the existing takeover theories. Second, market participantsmay anchor on the price, as in Baker, Pan, and Wurgler (2012). For example,
2 For an early discussion, see Morck, Shleifer, and Vishny (1990).3 Schwert (1996) provides related evidence, finding that the offer price increases almost dollar-
for-dollar with the target’s pre-bid runup. He argues that the higher offer price may be justified bythe target’s greater perceived value based on new information from the runup. He does not explorethe effect on takeover probability.
The Real Effects of Financial Markets 937
practitioners often study premia to the market price in related past deals toestimate an appropriate premium to offer in the current transaction (known as“precedent transactions analysis”).
Interestingly, the active role of financial markets implies that any factor thatinfluences prices can also influence takeover activity (and other real actions).Therefore, mispricing (e.g., due to market frictions or investor errors) can havereal consequences by impacting takeovers. Our paper is therefore related tothe behavioral corporate finance literature (surveyed by Baker, Ruback, andWargler (2007)). In particular, Dong et al. (2006) use a firm’s multiple as anindicator for mispricing and link it to takeover activity. Unlike us, they do notmodel the relationship between prices and takeovers as a simultaneous sys-tem or use an instrumental variable to identify the effect of exogenous pricechanges, but instead focus on the equilibrium correlation between the valua-tion multiples and takeovers. Note that, in the behavioral corporate financeliterature, temporary overvaluation often improves a firm’s fundamental valueas it allows managers to raise capital or undertake acquisitions at favorableprices (e.g., Stein (1996), Shleifer and Vishny (2003)). Here, it can reduce fun-damental value by deterring value-creating takeovers.
Second, regarding the anticipation effect, our results demonstrate the illu-sory content of stock prices. While researchers typically use valuation measuresto proxy for management performance, a firm’s stock price may not reveal thefull extent of its agency problems, as it may also incorporate the expectedcorrection of these problems via a takeover. Our results thus challenge thecommon practice of using Tobin’s Q or stock price performance to measuremanagement quality. By breaking the correlation between market valuationsand takeover activity into trigger and anticipation effects, our analysis allowsus to determine the extent to which future expected takeovers are priced in.In that respect, our paper is related to Song and Walkling (2000), who findthat firms’ stock prices increase following the acquisition of their rivals andattribute this to the increased expectation that they will be taken over them-selves. Other papers analyze the effect of takeover anticipation on stock returnsrather than valuations. Hackbarth and Morellec (2008) and Cremers, Nair, andJohn (2009) show that anticipated takeovers affect the correlation of a stock’sreturn with the market return and hence have an effect on the discount rate.Prabhala (1997) and Li and Prabhala (2007) note that takeover anticipationwill affect the market return to merger announcements.
Third, considering the full feedback loop—the combination of the triggereffect and the anticipation effect—our results suggest that the anticipation ef-fect could become an impediment to takeovers. The anticipation of a takeoverboosts prices, deterring the acquisition of underperforming firms. Moreover, itmay also allow managers to underperform in the first place since they are lessfearful of disciplinary acquisitions.4 Indeed, many practitioners believe that
4 Brealey, Myers, and Allen (2010) note that “the most important effect of acquisitions may befelt by the managers of companies that are not taken over. Perhaps the threat of takeover spursthe whole of corporate America to try harder.”
938 The Journal of Finance R©
the anticipation effect has significant effects on real-life takeover activity. ADecember 22, 2005 Wall Street Journal article claims that this has been a ma-jor problem in the U.S. banking industry: “takeover potential raises [the] valueof small financial institutions, making them harder to acquire.” This may haveled to severe consequences, as small banks remained stand-alone and were lessable to withstand the recent financial crisis. Many commentators believe thatthe same phenomenon recently occurred in the U.K. water industry. For exam-ple, an October 13, 2006 article in This Is Money notes that “there are concernsthat the race for control of [water] assets has overheated valuations, adding tospeculation that the [merger] bubble is about to burst.”5 Essentially, in thesecases and others, the belief of an upcoming takeover becomes self-defeating.6
This self-defeating nature of takeover expectations sheds new light on otherimportant real-world phenomena. First, it suggests why merger waves endoge-nously die out. If a recent spate of mergers leads the market to predict futureacquisitions, this causes valuations to rise (anticipation effect), dissuading fur-ther acquisition attempts. Second, it provides a rationale for the practice ofCEOs publicly expressing concerns about an upcoming takeover. Such state-ments act as a takeover defense, as they inflate the price, which in turn detersthe takeover from occurring. We reiterate the caveat that we are only able toattribute a portion of the endogeneity to the anticipation effect; the anticipationeffect that we are able to pin down is economically modest.
In addition, our paper has a number of wider implications outside thetakeover market. The feedback loop may apply to other corrective actions, suchas CEO replacement, shareholder activism, and regulatory intervention. Lowvaluations trigger intervention, but market anticipation causes prices to rise,which in turn may deter the correction from occurring. Bradley et al. (2010)show that the discount at which a closed-end fund is traded affects and reflectsthe probability of activism at the same time. In addition, while many existingpapers use raw valuation or profitability to measure management quality oragency problems (e.g. to correlate it with CEO pay or corporate governance),this paper’s approach of measuring these variables using a discount to poten-tial value can be applied to these other settings. Furthermore, trigger effectsare often estimated in non-M&A settings, such as the link between firm valua-tion and CEO turnover. Our approach of purging valuations of the anticipationeffect is applicable to the estimation of these trigger effects also.
More broadly, our results contribute to the growing literature that analyzesthe link between financial markets and corporate events (see Bond, Edmans,and Goldstein (2012) for a recent survey). While the corporate finance litera-ture typically studies the effect of prices on firm actions and the asset pricingliterature examines the reverse relation, our paper analyzes the full feedback
5 See, “Water Takeovers Bubbling Up,” by This is Money, October 13, 2006. Available at:http://www.thisismoney.co.uk/money/news/article-1603327/Water-takeovers-bubbling-up.html.
6 This effect is reminiscent of the free-rider problem in the theoretical model of Grossman andHart (1980), although the market price plays no role in coordinating expectations in their setting.Equilibrium outcomes in settings where the combination of the trigger effect and the anticipationeffect becomes self-defeating have been analyzed by Bond, Goldstein, and Prescott (2010).
The Real Effects of Financial Markets 939
loop—the simultaneous, two-way interaction between prices and corporate ac-tions that combines the trigger and anticipation effects. We show that pricesboth affect and reflect real decisions. One important strand of this literatureconcerns the link between financial market efficiency and real efficiency. Whilemost existing research suggests that the former is beneficial for the latter,7 ourresults point to an intriguing disadvantage of forward-looking prices—theymay deter the very actions that they anticipate.
The remainder of the paper is organized as follows. Section I specifies themodel that we use for the empirical analysis. In Section II we describe our dataand variable construction. Section III presents the empirical results. In SectionIV we consider some extensions and robustness tests. Section V concludes.
I. Model Specification
A. Firm Valuation and Discount
A number of earlier papers study the effect of raw valuations on takeoverprobability. By contrast, our key explanatory variable is the “discount” at whicha firm trades relative to its maximum potential value absent managerial inef-ficiency and mispricing, which we call the “frontier value.” Theoretically, it isthis variable that will drive a firm’s likelihood of becoming a takeover target,as it measures the potential gain from an acquisition.
In some settings the frontier value is well defined. For example, in closed-end funds, it is the net asset value (NAV). The discount can then be simplycalculated as the difference between the NAV and the market price. Indeed,Bradley et al. (2010) find that activist shareholders are more likely to targetclosed-end funds that are trading at deeper discounts. Analogously, the marketvalue of regular corporations can deviate from their potential value owing toagency problems and/or mispricing, and this might make the corporation atakeover target.
For a regular corporation, the frontier value cannot be observed and mustbe estimated. This is done by observing the valuation of “successful” firmswith similar fundamentals. Specifically, let X be a vector of variables repre-senting firm fundamentals that determine potential value: V ∗ = f (X). SinceV ∗ represents the potential value after the acquirer has corrected managerialinefficiencies, the X variables should consist of firm characteristics that biddersare unlikely to change upon takeover.
If the set of value-relevant variables X is exhaustive, and if there is no noiseor mispricing in valuation, then the maximum valuation commanded amongthe group of peer firms that share the same fundamentals can be perceivedas the “potential” of all other firms. However, a particular firm could havean abnormally high valuation owing to luck, misvaluation, or idiosyncraticfeatures (such as unique core competencies) if X is not fully exhaustive of
7 See, for example, Fishman and Hagerty (1992), Holmstrom and Tirole (1993), Subrahmanyamand Titman (1999), Dow, Goldstein, and Guembel (2010), Admati and Pfleiderer (2009), Edmans(2009), and Edmans and Manso (2011).
940 The Journal of Finance R©
all value-relevant fundamental variables. For example, a rival search engine isunlikely to command the valuation of Google even if it is efficiently run. Settingthe potential value to the maximum value among peers would thus erroneouslyresult in assuming that this high valuation was achievable for all firms andoverestimating the discount.
An improved specification is to set the potential value to a high percentile,rather than maximum, valuation of peer firms. We define “successful” firmsas those that command valuations at the (1 − α)th percentile or higher amongpeer firms, where 0 < α < 1
2 . A firm valued at below the (1 − α)th percentileis classified as operating below potential value. When α = 0, the benchmarkis the maximum valuation among peers; when α = 1
2 , the benchmark becomesthe median (we require α < 1
2 to reflect the fact that a successful firm shouldbe above median).
We now discuss the choices for the X variables and the parameter α, startingwith the former. In our first approach, X includes only a firm’s industry affilia-tion. Acquirers are unlikely to change the target’s sector and instead typicallyaim to restore its value to that commanded by successful firms in the samesector, so the industry affiliation easily satisfies the requirement for X to beexogenous to acquirers’ actions. In using the industry benchmark, we followother papers in the takeover literature (see, e.g., Rhodes-Kropf, Robinson, andViswanathan (2005)) as well as practitioners. For example, “comparable com-panies analysis” compares a firm’s valuation to its industry peers and is oftenused by practitioners to identify undervalued companies that might be suitabletakeover targets. The potential concern is that an industry benchmark ignoresother determinants of potential value. For example, small and growing firmsare likely to command higher valuations than larger, mature peers. Also, thisapproach implicitly assumes that a particular industry cannot be systemati-cally over or undervalued, often contradicted by evidence (Hoberg and Phillips(2010)).
We therefore also employ a second approach, using firm characteristics as Xvariables.8 We take two steps to reduce the concern that the estimated fron-tier value can be affected by the acquirer. First, following Habib and Ljungqvist(2005), who also estimate a frontier value, we choose variables that are unlikelyto be radically transformed by an acquirer. For example, while a firm’s marketshare and financial policies (such as dividend payout) both affect its actual val-uation, only the former affects its frontier valuation: it is difficult to transformmarket share immediately, but financial policies can be quickly reversed. TheX variables we use are firm size, firm age, asset intensity, R&D intensity, mar-ket share, growth opportunities, and business cyclicality. These variables arefurther motivated in Section II.B as well as in Habib and Ljungqvist (2005).
Second, we recognize that firm characteristics are not completely exogenousand that acquirers may be able to change them within some range. Accordingly,
8 We do not use industry affiliation in conjunction with firm characteristics as we wish to allowparticular industries to be over- or undervalued.
The Real Effects of Financial Markets 941
we do not use the raw measures of these variables (except for age, which is fullyexogenous) but rather their tercile ranks. This specification allows for biddersto change the value of these fundamentals within a given tercile, but not toalter it sufficiently to move it into a different tercile. Since an acquirer is morelikely to change the tercile of a firm that is currently close to the cutoffs, weexclude such firms in a sensitivity analysis in Section IV.
Indeed, existing research finds that takeover gains typically stem from cor-recting underperformance given a set of fundamentals rather than chang-ing the fundamentals themselves. For the typical mergers and acquisitions(M&A) deal, one cannot observe whether the target’s fundamentals changesince they are consolidated with the acquirer, but this is possible in a lever-aged buyout (LBO) since the target continues to be reported independently.Muscarella and Vetsuypens (1990) find that the sales (one of our X vari-ables) of LBO targets change at a similar rate to sales of nontargets, andSmith (1990) documents no significant difference in the rate of change in R&D(a second X variable). Further, many papers find that the bulk of value creationfrom LBOs is due to improvements in efficiency. This literature is surveyed byEckbo and Thorburn (2008); we briefly mention the key papers here. Kaplan(1989), Smith (1990), and Muscarella and Vetsuypens (1990) find improvementsin accounting performance. Smith (1990) shows that these improvementsarise from superior working capital management, and Muscarella and Vet-suypens (1990) demonstrate that they stem from cutting expenses rather thanincreasing revenues. Using plant-level data, Lichtenberg and Siegel (1990)document significant increases in productivity, and the case study of Bakerand Wruck (1989) finds improved incentives, monitoring, and working capitalmanagement.
In summary, there is a trade-off between our two approaches. The advantageof the second approach is that a more extensive list of variables provides a moreaccurate assessment of true potential value. The disadvantage is that some ofthe added X variables may not be completely outside the acquirer’s control.This concern does not arise under the first approach, where the only X variableis industry affiliation. As we describe later, our results turn out to be slightlystronger under the industry approach.
The remaining specification issue is the choice of α. Here again there is atrade-off. A low α may overweight abnormal observations, while a high α mayunderestimate the potential value and thus the occurrence of discounts. Wecalibrate α from the empirical facts documented by prior literature. Accordingto Andrade, Mitchell, and Stafford (2001), the median takeover premium was37% to 39% during the 1980 to 2002 period; Jensen and Ruback (1983) docu-ment similar magnitudes in an earlier period. Since bidder returns are closeto zero on average (Jensen and Ruback (1983), Betton, Eckbo, and Thorburn(2008)), the target captures almost the entire value gains from the takeover.Therefore, on average, the takeover premium represents the potential for valueimprovement at the target. We thus calibrate the (1 − α)th percentile (i.e., theexpected posttakeover value) to capture the value of the median target firm
942 The Journal of Finance R©
(pretakeover) plus the median takeover premium (38%).9 Specifically, we poolall firms within a given three-digit SIC industry across all years and subtractyear fixed effects. We then add 38% to the pre-acquisition equity value of eachfirm that was a takeover target and rank each target’s cum-premium valuewithin its industry peers. We find that after including the premium, the me-dian ranking of targets in our sample is at the 77th percentile of the respectiveindustry. Rounding to the nearest decile, this corresponds to an α of 20%. Inother words, about 80% (20%) of the firms are traded at a discount (premium)in a given year. This choice of α is also supported by evidence from closed-endfunds, a setting in which the discount can be precisely measured. Bradley et al.(2010) find that, on average, about 20% (80%) of closed-end funds trade at a pre-mium (discount) to NAV. In Section IV, we vary α across the range of [0.10, 0.30]and find that our results are not sensitive to the choice of α within this region.
Once X and α are chosen, and given observed valuations V , the potentialvalue can be estimated using the quantile regression method pioneered byKoenker and Bassett (1978):
V = Xβ + ε, (1)
where Quantile1−α(ε) = 0, ε is a disturbance term, and Xβ is the potential value.More specifically, with actual data {Vi,t, Xi,t} and for a given α, we estimate β
in (1) via the least absolute deviation (LAD) method:
minβ∈B
1n
⎧⎨⎩ ∑Vi,t> f (Xi,t ;β)
(1 − α)|Vi,t − f (Xi,t; β)| +∑
Vi,t≤ f (Xi,t ;β)
α|Vi,t − f (Xi,t; β)|⎫⎬⎭ ,
s.t. f (Xi,t; β) ≥ 0,
(2)
where f (Xi,t; β) is the estimated maximum potential value. Note that (2) holdsregardless of the distribution of ε (or its empirical analog Vi,t − f (Xi,t; β)), andso we do not require any assumptions over the disturbance term, except for itsvalue at the (1 − α)th percentile. The added nonnegativity constraint f (Xi,t; β) ≥0 (which reflects limited liability) is a minor variation of the original model ofKoenker and Bassett (1978). The nonnegativity constraint is addressed by thecensored least absolute deviation (CLAD) method of Powell (1984). Obviously,this estimation is simple under the first approach, where there is a single Xvariable, industry affiliation. In this case, the frontier value is simply the 80th
percentile firm in the industry.Having estimated β, the empirical analog to Discount = (V ∗ − V ) /V ∗ is
(Xi,tβ − Vi,t)/Xi,tβ. (3)
9 Arguably, the takeover premium might include synergy as well as efficiency gains. Accordingto Betton, Eckbo, and Thorburn (2008), same-industry takeovers (where synergies are most likely)do not involve higher takeover premia, and hostile takeovers (which are less likely to be synergy-driven) do not feature lower premia. Therefore, valuation-driven takeovers likely exhibit similarpremia to takeovers in general.
The Real Effects of Financial Markets 943
Our estimation of the potential value is a form of the stochastic frontier methodproposed by Aigner, Lovell, and Schmidt (1977) and analyzed by Kumbhakarand Lovell (2000). A different form of stochastic frontier analysis has been usedin finance by Hunt-McCool, Koh, and Francis (1996) and Habib and Ljungqvist(2005). Our specification (1) makes no parametric assumptions regarding ε andthus accommodates skewness, heteroskedasticity, and within-cluster correla-tion, all of which are common features in finance panel data.
We emphasize that the frontier value is a standalone concept, and deliber-ately does not take into account any synergies with specific acquirers. This isbecause our goal is to study the effect of prices on takeover activity, and moregenerally the importance of financial markets for real decisions. If synergies arethe primary motive for mergers and/or financial markets are a sideshow, ourDiscount measure (which ignores acquirer-specific synergies and captures onlymanagerial inefficiency and mispricing) should have no explanatory power. Bycontrast, we find that standalone Discount does attract takeovers.10
B. Interaction of Takeover and Discount
Our goal is to estimate the effect of the discount on takeover likelihood.We will show that accounting for the endogeneity of the discount is crucialin quantifying the trigger effect from the discount to the takeover likelihood.To ease the exposition, we hereforth refer to one source of endogeneity in thediscount, namely, the anticipation effect (from the takeover likelihood to thediscount). In Section III.B.2, we discuss how much of the endogeneity canindeed be accounted for by the anticipation effect.
Let us start with a benchmark model in which the discount is exogenous tothe takeover likelihood, that is, the discount only affects the takeover likeli-hood. We use Discount0 to denote the “underlying” discount that would exist insuch a world. In this benchmark model, the system can be written as
Discount0 = γ0 X + γ1 Z1 + γ2 Z2 + η, (4)
Takeover∗ = μ1 Discount0 + μ2 X + μ3 Z1 + ξ, (5)
Takeover ={
1, if Takeover∗> 0,
0, otherwise,(6)
corr(η, ξ ) = 0, (7)
10 Note that, to the extent that other peer firms have already merged and achieved synergies,our measure does capture these potential synergies. In addition, the takeover premium used tocalibrate α = 0.2 is based on transactions that likely involved synergies. The synergies that ourmeasure does not capture are those that are not reflected in the current value of comparable firmsand are specific to a combination with a particular acquirer.
944 The Journal of Finance R©
where Takeover∗ is the latent variable for the propensity of a takeover bid, andTakeover is the corresponding observed binary outcome. Since corr(η, ξ ) = 0,the two equations can be separately estimated using a linear regression modeland a binary response regression model, respectively.
We classify determinants of the discount into two groups. The vector Z1 com-prises variables that affect both the discount and the probability of takeover.These include variables that capture managerial agency problems, as theyaffect operational inefficiency and are likely also correlated with takeover re-sistance. The variable Z2 represents market frictions that affect the stock pricebut have no independent effect on takeover probability other than through theprice. The distinction between the Z1 and Z2 variables will become importantwhen we consider the endogeneity of the discount and require instruments.
Since the discount is calculated using tercile ranks of X (except Age, whichenters with its full value), it is not orthogonal to the raw values of X and so X(except Age) appears in (4). We also allow the X variables to enter the Takeoverequation directly as certain firm characteristics may make an acquisition easierto execute. For example, small acquisitions are easier to finance and less likelyto violate antitrust hurdles (Palepu (1986), Mikkelson and Partch (1989)). Inaddition, it is easier to raise debt to finance targets with steady cash flows, highasset tangibility, and in noncyclical businesses. All variables are described inSection II.B.
Allowing for the endogeneity of the discount, the equations above becomeinterdependent. Specifically, if the endogeneity is due to the market rationallyanticipating the probability of a takeover, then the observed discount (Discount)will shrink below the underlying Discount0 as modeled by (4). In this case, (4)and (5) should be remodeled as
Discount = γ0 X + γ1 Z1 + γ2 Z2 + δξ + η′, (8)
Takeover∗ = μ1 Discount + μ2 X + μ3 Z1 + ξ, (9)
where η in (4) becomes δξ + η′ in (8), with δξ representing the shrinkage fromthe anticipation effect, that is, δ is expected to be negative. As a result, we have
ρ = corr(η, ξ ) = corr(δξ + η′, ξ ) = δσ 2ξ
< 0 if δ < 0,(10)
and hence the simultaneity of the system. Note that since ρ < 0, the endo-geneity acts in the opposite direction from the true μ1 and using equation (9)alone will underestimate μ1. In other words, empiricists might estimate a lowμ1 simply because a low discount is observed when the market anticipates atakeover. The only way to uncover the true μ1 is by using an instrumentalvariable Z2 that has a direct effect on Discount but only affects Takeover∗ viaits effect on Discount.
The system cannot be estimated using conventional two-stage least squares
The Real Effects of Financial Markets 945
because the observed variable Takeover is a binary variable. Our estimationfollows Rivers and Vuong (1988) and adopts the maximum likelihood method.We estimate (9) as the main equation, using the reduced form of (8) as aninput to the main equation, and instrumenting the endogenous variableDiscount by the Z2 variable. Later, we back out the relation from Takeovershocks to Discount in (8) from the estimation (see Section III.B).
The intuition of the estimation is as follows. Suppose we obtain the residualdiscount, ˜Discount, from the linear regression as specified in (8):
˜Discount = Discount − γ0 X − γ1 Z1 − γ2 Z2 = δξ + η′. (11)
Having controlled for the observable determinants of the discount, the residualdiscount ˜Discount consists of two components: the anticipation effect (δξ ) andan unmodeled residual disturbance (η′). The power of the test rests on theexplanatory power of X, Z1, and Z2 so that, within ˜Discount, the unmodeledresidual η′ (which is not correlated with any other variables in the model)does not dominate the anticipation effect δξ . The residual in (9), ξ , can beexpressed as a linear function of ˜Discount as follows:
ξ = λ ˜Discount + ξ ′. (12)
Substituting (12) into (9) yields
Takeover∗ = μ1Discount + μ2 X + μ3 Z1 + λ ˜Discount + ξ ′︸ ︷︷ ︸=ξ
. (13)
By adding the projected residual, ˜Discount, as a control function (or “auxil-iary” regressor) in equation (13), it “absorbs” the correlation between the errorterm and the Discount regressor. Therefore, the resulting residual ξ ′ is nowa well-behaved disturbance that is uncorrelated with all other regressors inthe Takeover equation, including Discount. As a result, (13) resembles a regu-lar probit specification except that ˜Discount, which is not a natural covariate,needs to be integrated out in order to obtain the structural coefficients on theobservable variables. Equation (B3) in Appendix B presents the full likelihoodfunction.
II. Data and Variable Description
A. Data
We obtain data on M&A from Securities Data Company (SDC) for 1980 to2007. We include all bids, regardless of whether they are eventually completed,since the target’s valuation is likely to have greatest effect on an acquirer’sdecision to bid; we repeat the analysis with completed bids only at the endof Section IV.C. Since we are assuming a sufficient change of control that
946 The Journal of Finance R©
the acquirer is able to improve the target’s efficiency, we use SDC’s “Form ofthe Deal” variable to exclude bids classified as acquisitions of partial stakes,minority squeeze-outs, buybacks, recapitalizations, and exchange offers. Wealso delete bids for which the acquirer had a stake exceeding 50% before theacquisition, or a final holding of under 50%. This leaves us with 13,196 deals.As we require the target’s valuation, we drop all bids for which the target doesnot have stock return data on CRSP and basic accounting data on Compustat.We also exclude all financial (SIC code 6000-6999) and utilities (SIC code 4000-4949) firms from the sample, because takeovers are highly regulated in theseindustries. These restrictions bring the final sample down to 6,555 deals. Fromthis list we construct the variable Takeover, a dummy variable that equals oneif the firm receives a takeover bid in a particular calendar year. The universe ofpotential targets is all nonfinancial and nonutility firms that have the necessaryCRSP and Compustat data.
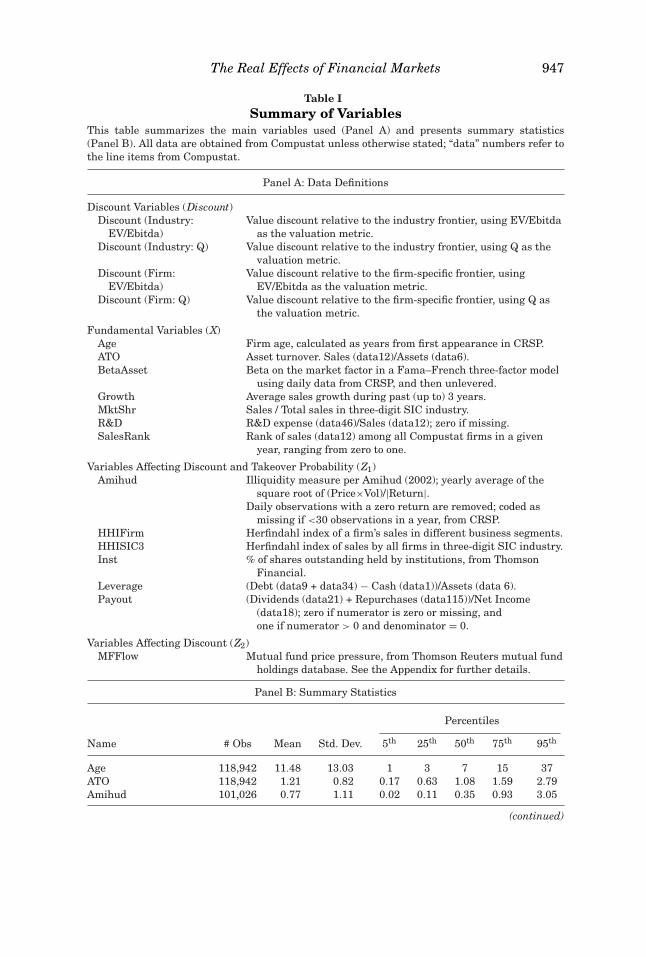
Table I, Panel A, provides a full definition of all the independent variablesused in our analysis; summary statistics are in Panel B. All of our accountingvariables come from Compustat; we obtain additional variables from CRSP,Thomson Reuters, and SDC as detailed later. All variables from Compustatare calculated for the fiscal year ending the year before the Takeover dummy;the others are calculated for the prior calendar year. All potentially unboundednumbers are winsorized at the 1% and 99% levels.
B. Variable Description
The construction of the Discount variable relies on the choice of a valuationmetric to determine V and a set of fundamental variables that can be usedto predict the frontier value. Our primary valuation measure is Q, the ratio ofenterprise value (debt plus market equity) to book value (debt plus book equity),as it is the most widely used valuation metric in the finance literature. We alsouse a secondary measure, EV /Ebitda, the ratio of enterprise value to earningsbefore interest, tax, depreciation, and amortization, because most takeoversare driven by the acquirer’s desire to access the target’s cash flows rather thanliquidate target assets. In addition, this variable is frequently used by M&Apractitioners. Negative values for these observations are coded as missing.
We describe the rationale behind the choice of X variables in Section I.A.In our first specification, the only X variable is a firm’s industry affiliation asclassified by the three-digit SIC code. Therefore, the frontier value is the 80th
percentile valuation of a given industry. To construct this measure, we firstpool observations from all years for a given industry, filter out year fixed effectsfrom the valuation measures, retrieve the 80th percentile value, and then addback the year fixed effects.11 Finally, we calculate Discount as in (3), which is
11 We pool observations from all years for a given industry (while adjusting for year fixed effects)to have a sufficiently large sample to form accurate percentile estimates. On average, there are 26observations in an industry-year, and 693 observations in an industry across all years from 1980to 2006.
The Real Effects of Financial Markets 947
Table ISummary of Variables
This table summarizes the main variables used (Panel A) and presents summary statistics(Panel B). All data are obtained from Compustat unless otherwise stated; “data” numbers refer tothe line items from Compustat.
Panel A: Data Definitions
Discount Variables (Discount)Discount (Industry:
EV/Ebitda)Value discount relative to the industry frontier, using EV/Ebitda
as the valuation metric.Discount (Industry: Q) Value discount relative to the industry frontier, using Q as the
valuation metric.Discount (Firm:
EV/Ebitda)Value discount relative to the firm-specific frontier, using
EV/Ebitda as the valuation metric.Discount (Firm: Q) Value discount relative to the firm-specific frontier, using Q as
the valuation metric.
Fundamental Variables (X)Age Firm age, calculated as years from first appearance in CRSP.ATO Asset turnover. Sales (data12)/Assets (data6).BetaAsset Beta on the market factor in a Fama–French three-factor model
using daily data from CRSP, and then unlevered.Growth Average sales growth during past (up to) 3 years.MktShr Sales / Total sales in three-digit SIC industry.R&D R&D expense (data46)/Sales (data12); zero if missing.SalesRank Rank of sales (data12) among all Compustat firms in a given
year, ranging from zero to one.
Variables Affecting Discount and Takeover Probability (Z1)Amihud Illiquidity measure per Amihud (2002); yearly average of the
square root of (Price×Vol)/|Return|.Daily observations with a zero return are removed; coded as
missing if <30 observations in a year, from CRSP.HHIFirm Herfindahl index of a firm’s sales in different business segments.HHISIC3 Herfindahl index of sales by all firms in three-digit SIC industry.Inst % of shares outstanding held by institutions, from Thomson
Financial.Leverage (Debt (data9 + data34) − Cash (data1))/Assets (data 6).Payout (Dividends (data21) + Repurchases (data115))/Net Income
(data18); zero if numerator is zero or missing, andone if numerator > 0 and denominator = 0.
Variables Affecting Discount (Z2)MFFlow Mutual fund price pressure, from Thomson Reuters mutual fund
holdings database. See the Appendix for further details.
Panel B: Summary Statistics
Percentiles
Name # Obs Mean Std. Dev. 5th 25th 50th 75th 95th
Age 118,942 11.48 13.03 1 3 7 15 37ATO 118,942 1.21 0.82 0.17 0.63 1.08 1.59 2.79Amihud 101,026 0.77 1.11 0.02 0.11 0.35 0.93 3.05
(continued)
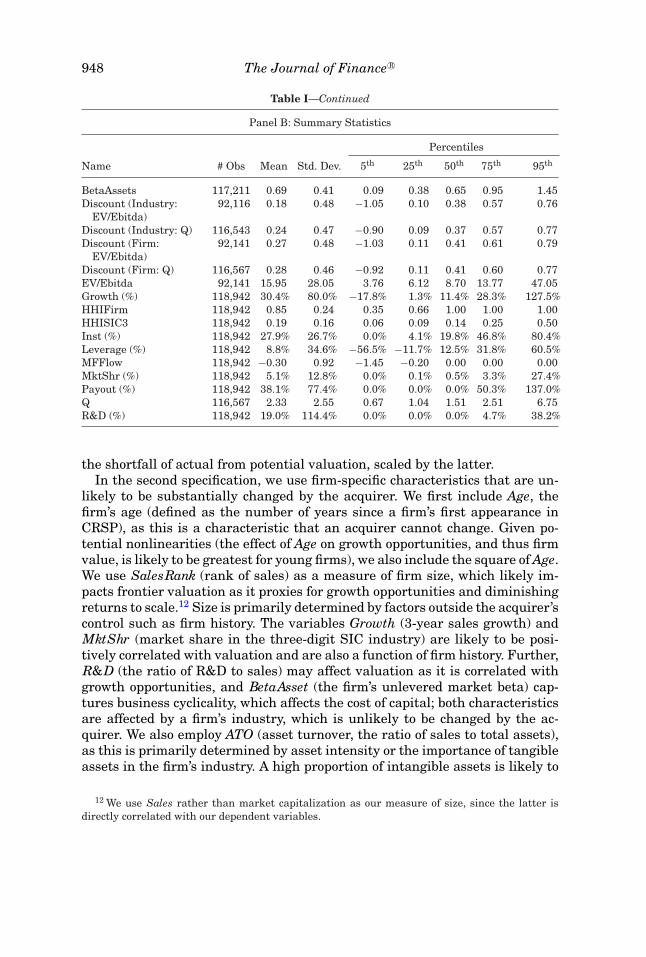
948 The Journal of Finance R©
Table I—Continued
Panel B: Summary Statistics
Percentiles
Name # Obs Mean Std. Dev. 5th 25th 50th 75th 95th
BetaAssets 117,211 0.69 0.41 0.09 0.38 0.65 0.95 1.45Discount (Industry:
EV/Ebitda)92,116 0.18 0.48 −1.05 0.10 0.38 0.57 0.76
Discount (Industry: Q) 116,543 0.24 0.47 −0.90 0.09 0.37 0.57 0.77Discount (Firm:
EV/Ebitda)92,141 0.27 0.48 −1.03 0.11 0.41 0.61 0.79
Discount (Firm: Q) 116,567 0.28 0.46 −0.92 0.11 0.41 0.60 0.77EV/Ebitda 92,141 15.95 28.05 3.76 6.12 8.70 13.77 47.05Growth (%) 118,942 30.4% 80.0% −17.8% 1.3% 11.4% 28.3% 127.5%HHIFirm 118,942 0.85 0.24 0.35 0.66 1.00 1.00 1.00HHISIC3 118,942 0.19 0.16 0.06 0.09 0.14 0.25 0.50Inst (%) 118,942 27.9% 26.7% 0.0% 4.1% 19.8% 46.8% 80.4%Leverage (%) 118,942 8.8% 34.6% −56.5% −11.7% 12.5% 31.8% 60.5%MFFlow 118,942 −0.30 0.92 −1.45 −0.20 0.00 0.00 0.00MktShr (%) 118,942 5.1% 12.8% 0.0% 0.1% 0.5% 3.3% 27.4%Payout (%) 118,942 38.1% 77.4% 0.0% 0.0% 0.0% 50.3% 137.0%Q 116,567 2.33 2.55 0.67 1.04 1.51 2.51 6.75R&D (%) 118,942 19.0% 114.4% 0.0% 0.0% 0.0% 4.7% 38.2%
the shortfall of actual from potential valuation, scaled by the latter.In the second specification, we use firm-specific characteristics that are un-
likely to be substantially changed by the acquirer. We first include Age, thefirm’s age (defined as the number of years since a firm’s first appearance inCRSP), as this is a characteristic that an acquirer cannot change. Given po-tential nonlinearities (the effect of Age on growth opportunities, and thus firmvalue, is likely to be greatest for young firms), we also include the square of Age.We use SalesRank (rank of sales) as a measure of firm size, which likely im-pacts frontier valuation as it proxies for growth opportunities and diminishingreturns to scale.12 Size is primarily determined by factors outside the acquirer’scontrol such as firm history. The variables Growth (3-year sales growth) andMktShr (market share in the three-digit SIC industry) are likely to be posi-tively correlated with valuation and are also a function of firm history. Further,R&D (the ratio of R&D to sales) may affect valuation as it is correlated withgrowth opportunities, and BetaAsset (the firm’s unlevered market beta) cap-tures business cyclicality, which affects the cost of capital; both characteristicsare affected by a firm’s industry, which is unlikely to be changed by the ac-quirer. We also employ ATO (asset turnover, the ratio of sales to total assets),as this is primarily determined by asset intensity or the importance of tangibleassets in the firm’s industry. A high proportion of intangible assets is likely to
12 We use Sales rather than market capitalization as our measure of size, since the latter isdirectly correlated with our dependent variables.
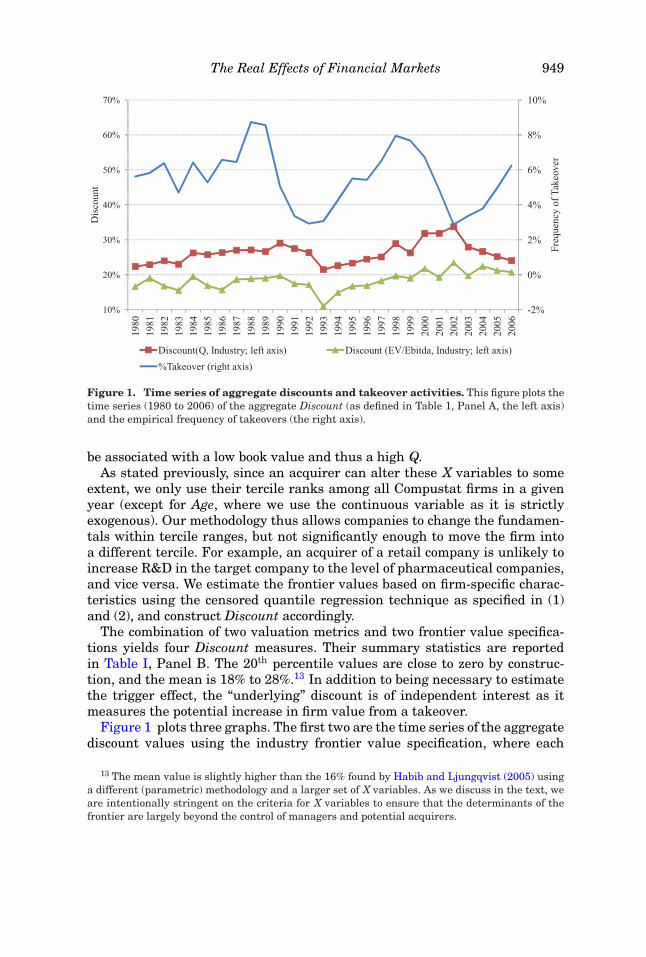
The Real Effects of Financial Markets 949
Figure 1. Time series of aggregate discounts and takeover activities. This figure plots thetime series (1980 to 2006) of the aggregate Discount (as defined in Table 1, Panel A, the left axis)and the empirical frequency of takeovers (the right axis).
be associated with a low book value and thus a high Q.As stated previously, since an acquirer can alter these X variables to some
extent, we only use their tercile ranks among all Compustat firms in a givenyear (except for Age, where we use the continuous variable as it is strictlyexogenous). Our methodology thus allows companies to change the fundamen-tals within tercile ranges, but not significantly enough to move the firm intoa different tercile. For example, an acquirer of a retail company is unlikely toincrease R&D in the target company to the level of pharmaceutical companies,and vice versa. We estimate the frontier values based on firm-specific charac-teristics using the censored quantile regression technique as specified in (1)and (2), and construct Discount accordingly.
The combination of two valuation metrics and two frontier value specifica-tions yields four Discount measures. Their summary statistics are reportedin Table I, Panel B. The 20th percentile values are close to zero by construc-tion, and the mean is 18% to 28%.13 In addition to being necessary to estimatethe trigger effect, the “underlying” discount is of independent interest as itmeasures the potential increase in firm value from a takeover.
Figure 1 plots three graphs. The first two are the time series of the aggregatediscount values using the industry frontier value specification, where each
13 The mean value is slightly higher than the 16% found by Habib and Ljungqvist (2005) usinga different (parametric) methodology and a larger set of X variables. As we discuss in the text, weare intentionally stringent on the criteria for X variables to ensure that the determinants of thefrontier are largely beyond the control of managers and potential acquirers.
950 The Journal of Finance R©
annual observation is obtained as the equal-weighted average across all firmsduring that year. The second is the empirical frequency of takeovers duringthe sample period, which ranges from about 3% to above 8% annually. Theaggregate discount and takeover levels tend to move in the same direction,except for 2002 to 2003, when the market crash depressed valuations andreduced firms’ ability to finance acquisitions.
As specified in (4), three sets of variables can explain the cross-sectionalvariation in Discount. The first group comprises the firm fundamental vari-ables X. The second group consists of our Z1 variables, which measure firmcharacteristics or policies that affect both the valuation discount and also thetakeover likelihood, either by proxying for managerial entrenchment (thus de-terring takeovers), or by affecting the ease of takeover execution. The variablesLeverage (net debt/book assets) and Payout (dividends plus repurchases dividedby net income) both reduce the free cash available to managers and thereforeare likely to lessen discounts. In addition, both variables are correlated withbusiness maturity and thus cash flow stability, which facilitates financing ofthe takeover. As an external governance measure, we include HHISIC3, theHerfindahl index of all firms’ sales within the firm’s primary three-digit SIC,to capture the degree of product market competition and antitrust concerns,which may impede acquisition.14 We also construct the Herfindahl index of thefirm’s sales by business segment, HHIFirm, as a measure of diversification.Diversification may proxy for an empire-building manager and thus increasethe discount; it may also directly deter takeovers since it complicates targetintegration. Institutional shareholder monitoring is an internal governancemechanism that is likely associated with a lower discount. Institutional own-ership concentration also facilitates coordination among shareholders, thus re-ducing the Grossman and Hart (1980) free-rider problem in takeovers. Indeed,Mikkelson and Partch (1989) and Shivdasani (1993) find that block ownershipincreases the probability of a takeover attempt. We construct Inst to be thetotal percentage ownership by institutions from Thomson Reuters.15 We alsoadd Amihud, the Amihud (2002) illiquidity measure. Although not a measure
14 Industry concentration could also be a fundamental variable, as industry competitiveness canaffect firm profitability. We follow Habib and Ljungqvist (2005) and include it in the category ofagency variables. Giroud and Mueller (2010) show that product market competition can disciplinemanagement and render corporate governance unimportant.
15 We do not use the Gompers, Ishii, and Metrick (2003) shareholder rights measure or theBebchuk, Cohen, and Ferrell (2009) entrenchment index as additional corporate governance vari-ables as they substantially reduce our sample size (by about two-thirds) and skew the sampletoward large firms. Since large firms are less likely to be taken over, the sample becomes unrep-resentative of the universe of takeover targets. In the Internet Appendix we show that, in thesubsamples in which they are available, the entrenchment index is uncorrelated with takeoverprobability in equilibrium. (An Internet Appendix for this article is available online in the “Sup-plements and Datasets” section at http://www.afajof.org/supplements.asp.) The shareholder rightsindex is uncorrelated with takeover probability in equilibrium using the EV /Ebitda valuationmeasure. While it is positively correlated with takeover probability using the Q measure, Discountretains its significance. We further show that both indexes are positively correlated with Discount,suggesting that worse governed firms command lower valuations, consistent with Gompers, Ishii,and Metrick (2003) and Bebchuk, Cohen, and Ferrell (2009). Bates, Becher, and Lemmon (2008)
The Real Effects of Financial Markets 951
of agency costs, we classify it as a Z1 variable as it impacts both Discount andTakeover. Illiquidity directly affects takeover likelihood as it deters toeholdaccumulation, which in turn affects takeover success rates (Betton and Eckbo(2000)). In addition, it causes firms to trade at a discount (Amihud (2002)).
Finally, the Z2 variable affects Discount but has no effect on takeover prob-ability other than through its impact on the discount. We therefore seek avariable that affects the price due to market frictions and is unrelated to ei-ther firm fundamentals or managerial resistance. Our chosen instrument isMFFlow, the price pressure created by mutual fund trading that is not inducedby information but rather by investor flows. The Appendix describes technicaldetails on the construction of this variable. We assume that, following investoroutflows, a mutual fund will be pressured to sell shares in proportion to its cur-rent holdings. We consider only mutual funds that have experienced outflowsof at least 5% of total assets, because only extreme outflows are likely to havean impact on pricing, while moderate flow shocks could be absorbed by internalcash or external liquidity providers. Hence, for each stock, this measure is thehypothetical (signed) net selling by all mutual funds that have experiencedextreme shocks. Because the impact of a given outflow on prices depends onthe stock’s liquidity, we scale the dollar outflow by the stock’s dollar tradingvolume. Since order imbalances affect stock prices (see, e.g., Sias, Starks, andTitman (2006) and Coval and Stafford (2007)), MFFlow is significantly andnegatively correlated with Discount.
An important feature of our MFFlow measure is that it is constructed notusing mutual funds’ actual purchases and sales (as in Sias, Starks, and Titman(2006) and Coval and Stafford (2007)), but instead using hypothetical ordersprojected from their previously disclosed portfolio. Therefore, MFFlow does notreflect mutual funds’ discretionary trades possibly based on changes in theirviews of a stock’s takeover vulnerability. Rather, this measure captures theexpansion or contraction of a fund’s existing positions that is mechanicallyinduced by investor flows to and from the fund. Such flows are in turn unlikelyto be driven by investors’ views on the takeover likelihood of an individualfirm held by the fund, since these views would be expressed through directtrading of the stock. Hence, MFFlow satisfies the exclusion restriction—theeconometric requirement of being correlated with the discount but not directlywith the probability of a takeover.
Still, a potential concern is that there may be a direct correlation betweenfund flows and the takeover probability of the firms held by the fund. We canthink of three possible reasons for such a correlation. First, some funds maybe overweighting future takeover targets (e.g., due to the manager’s abilityto predict takeovers), and investors’ redemption decisions may be affected bythis stock selection. Any such effect, however, should attenuate our findings.Funds skilled in identifying takeover targets will exhibit superior performanceand thus be more likely to experience inflows than outflows; in turn, such
also find that the Gompers, Ishii, and Metrick (2003) antitakeover measures do not reduce thelikelihood of takeover (and in some cases are positively correlated with takeover probability).
952 The Journal of Finance R©
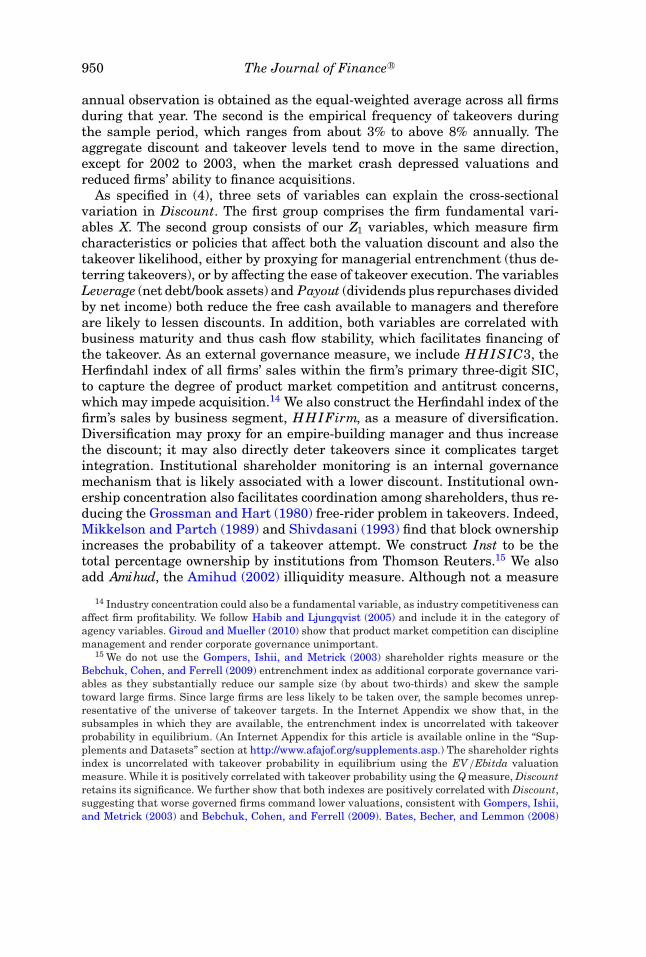
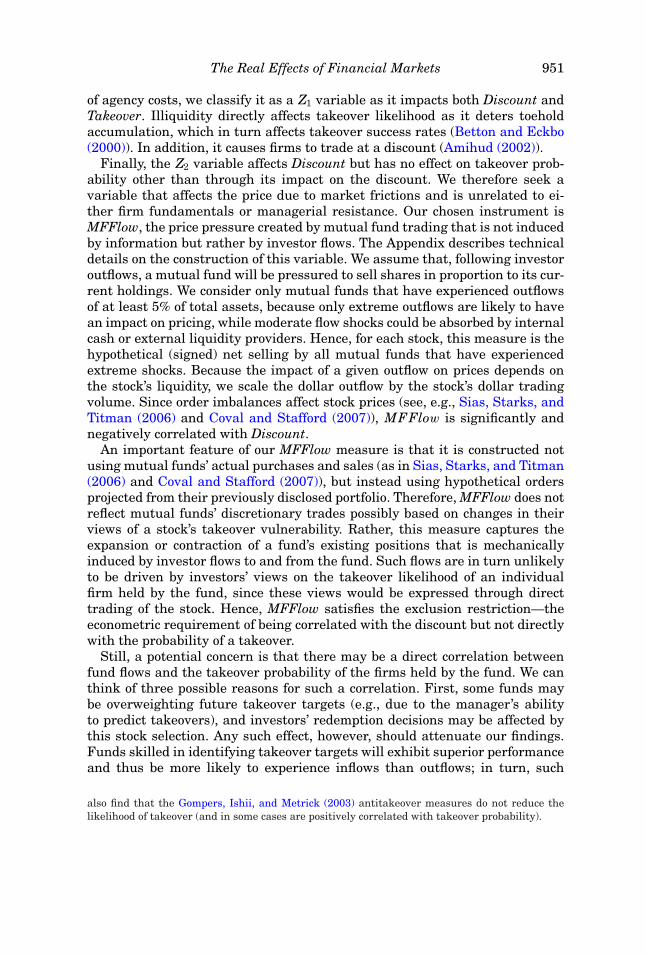
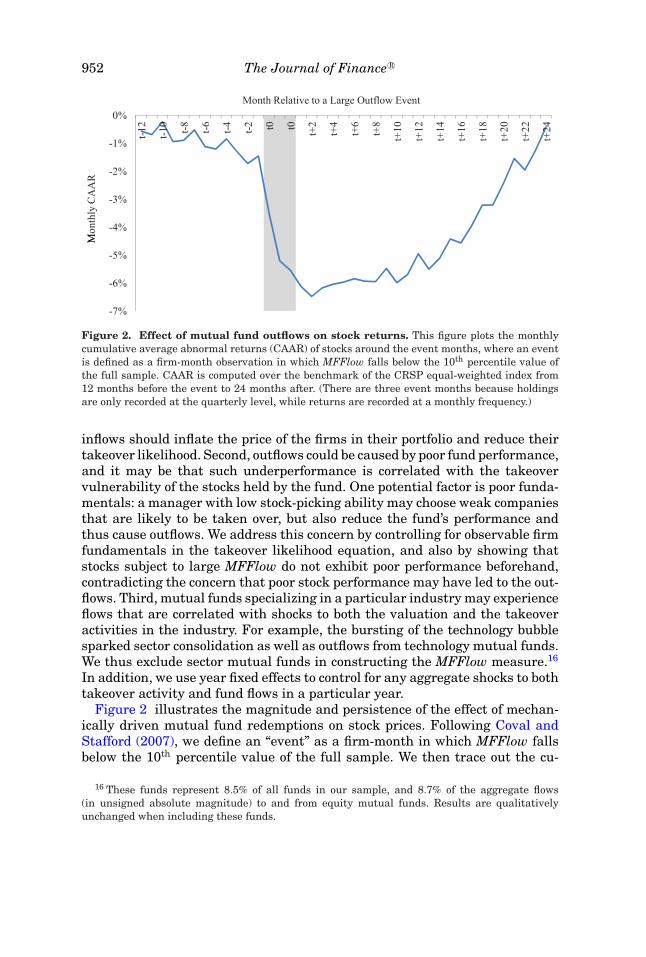
Figure 2. Effect of mutual fund outflows on stock returns. This figure plots the monthlycumulative average abnormal returns (CAAR) of stocks around the event months, where an eventis defined as a firm-month observation in which MFFlow falls below the 10th percentile value ofthe full sample. CAAR is computed over the benchmark of the CRSP equal-weighted index from12 months before the event to 24 months after. (There are three event months because holdingsare only recorded at the quarterly level, while returns are recorded at a monthly frequency.)
inflows should inflate the price of the firms in their portfolio and reduce theirtakeover likelihood. Second, outflows could be caused by poor fund performance,and it may be that such underperformance is correlated with the takeovervulnerability of the stocks held by the fund. One potential factor is poor funda-mentals: a manager with low stock-picking ability may choose weak companiesthat are likely to be taken over, but also reduce the fund’s performance andthus cause outflows. We address this concern by controlling for observable firmfundamentals in the takeover likelihood equation, and also by showing thatstocks subject to large MFFlow do not exhibit poor performance beforehand,contradicting the concern that poor stock performance may have led to the out-flows. Third, mutual funds specializing in a particular industry may experienceflows that are correlated with shocks to both the valuation and the takeoveractivities in the industry. For example, the bursting of the technology bubblesparked sector consolidation as well as outflows from technology mutual funds.We thus exclude sector mutual funds in constructing the MFFlow measure.16
In addition, we use year fixed effects to control for any aggregate shocks to bothtakeover activity and fund flows in a particular year.
Figure 2 illustrates the magnitude and persistence of the effect of mechan-ically driven mutual fund redemptions on stock prices. Following Coval andStafford (2007), we define an “event” as a firm-month in which MFFlow fallsbelow the 10th percentile value of the full sample. We then trace out the cu-
16 These funds represent 8.5% of all funds in our sample, and 8.7% of the aggregate flows(in unsigned absolute magnitude) to and from equity mutual funds. Results are qualitativelyunchanged when including these funds.
The Real Effects of Financial Markets 953
mulative average abnormal returns (CAAR) over the CRSP equal-weightedindex from 12 months before the event to 24 months after. (There are 3 eventmonths because holdings are only recorded at the quarterly level, while returnsare recorded at a monthly frequency). Figure 2 shows that there is no signifi-cant decline in stock price prior to the event. Upon the event, the price pres-sure effects are both significant in magnitude and long-lasting, persisting forover a year. Equally important, they are temporary rather than fundamental,with the price recovering by the end of the 24th month. The duration effect issimilar to that found by Coval and Stafford (2007).17
III. Empirical Results
A. Determinants of Discount and Takeover without Feedback
As a first step and for comparison with later results, we estimate (4) and (5)without incorporating the anticipation effect. In this setting, the two equationsare estimated separately. Table II reports the determinants of Discount andTakeover, for all four measures of Discount.
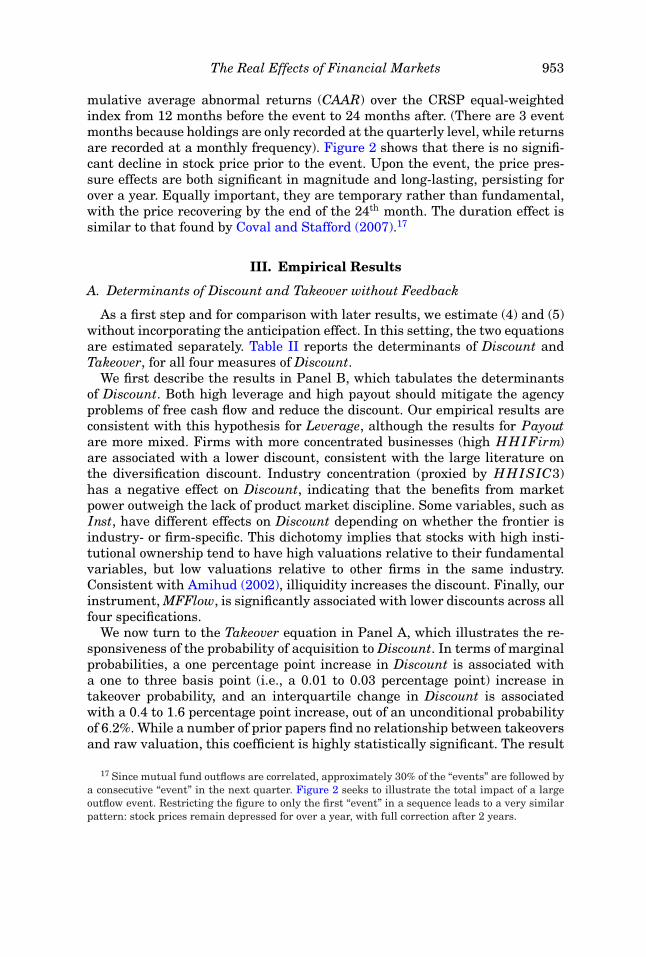
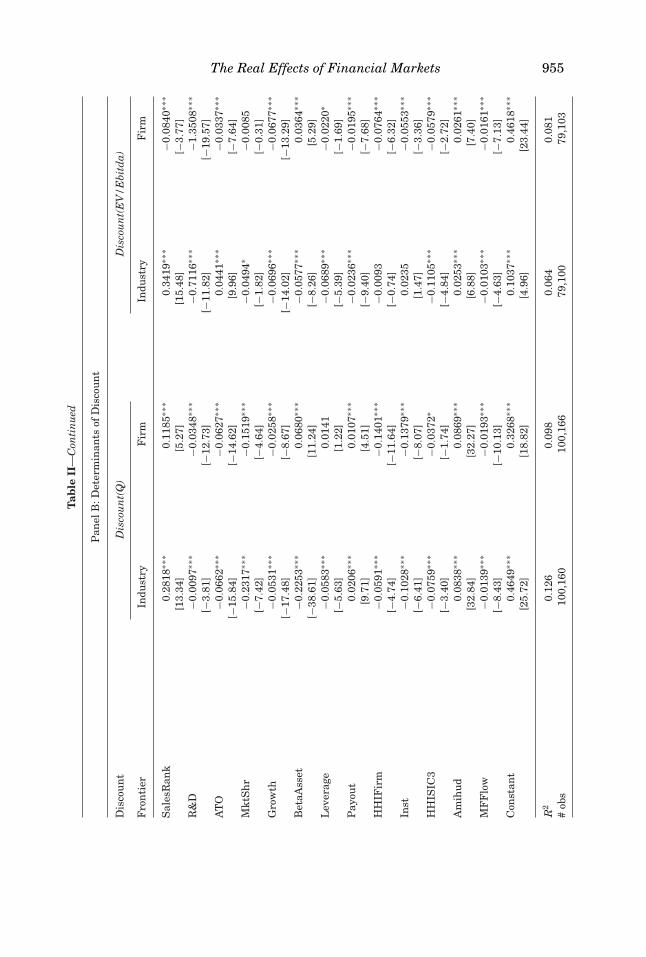
We first describe the results in Panel B, which tabulates the determinantsof Discount. Both high leverage and high payout should mitigate the agencyproblems of free cash flow and reduce the discount. Our empirical results areconsistent with this hypothesis for Leverage, although the results for Payoutare more mixed. Firms with more concentrated businesses (high HHIFirm)are associated with a lower discount, consistent with the large literature onthe diversification discount. Industry concentration (proxied by HHISIC3)has a negative effect on Discount, indicating that the benefits from marketpower outweigh the lack of product market discipline. Some variables, such asInst, have different effects on Discount depending on whether the frontier isindustry- or firm-specific. This dichotomy implies that stocks with high insti-tutional ownership tend to have high valuations relative to their fundamentalvariables, but low valuations relative to other firms in the same industry.Consistent with Amihud (2002), illiquidity increases the discount. Finally, ourinstrument, MFFlow, is significantly associated with lower discounts across allfour specifications.
We now turn to the Takeover equation in Panel A, which illustrates the re-sponsiveness of the probability of acquisition to Discount. In terms of marginalprobabilities, a one percentage point increase in Discount is associated witha one to three basis point (i.e., a 0.01 to 0.03 percentage point) increase intakeover probability, and an interquartile change in Discount is associatedwith a 0.4 to 1.6 percentage point increase, out of an unconditional probabilityof 6.2%. While a number of prior papers find no relationship between takeoversand raw valuation, this coefficient is highly statistically significant. The result
17 Since mutual fund outflows are correlated, approximately 30% of the “events” are followed bya consecutive “event” in the next quarter. Figure 2 seeks to illustrate the total impact of a largeoutflow event. Restricting the figure to only the first “event” in a sequence leads to a very similarpattern: stock prices remain depressed for over a year, with full correction after 2 years.

954 The Journal of Finance R©T
able
IID
eter
min
ants
ofD
isco
un
tan
dT
akeo
ver
wit
hou
tF
eed
bac
kT
his
tabl
ere
port
sre
sult
sfr
omes
tim
atin
geq
uat
ion
s(4
)an
d(5
)se
para
tely
.All
vari
able
sar
ede
fin
edin
Tabl
eI.
Th
ede
pen
den
tva
riab
lein
Pan
elA
isT
akeo
ver,
and
that
inP
anel
Bis
Dis
cou
nt.
Th
efi
rm-s
peci
fic
fron
tier
isfo
rmed
bya
quan
tile
(at
the
80th
perc
enti
le)
regr
essi
onof
valu
atio
nm
easu
res
onS
ales
Ran
k,R
&D
,AT
O,M
ktS
hr,
Gro
wth
,Bet
aAss
et(a
llex
pres
sed
inte
rcil
era
nks
),A
ge,a
nd
Age
2.Y
ear
fixe
def
fect
sar
eu
sed
inal
lsp
ecifi
cati
ons
but
are
un
repo
rted
.All
stan
dard
erro
rsar
ead
just
edfo
rh
eter
oske
dast
icit
yan
dw
ith
in-c
lust
erco
rrel
atio
n.I
nP
anel
A,t
hey
are
clu
ster
edat
the
firm
leve
l;in
Pan
elB
,th
eyar
edo
ubl
e-cl
ust
ered
atth
eye
aran
dfi
rmle
vels
,an
dth
eco
rres
pon
din
gt-
stat
isti
csar
ere
port
edin
the
brac
kets
belo
wth
eco
effi
cien
ts.T
he
colu
mn
dP
r/d
Xgi
ves
the
mar
gin
alef
fect
onta
keov
erpr
obab
ilit
yof
aon
eu
nit
(or
100
perc
enta
gepo
int)
chan
gein
each
regr
esso
r.T
he
bott
omro
wof
the
tabl
ere
port
sth
en
um
ber
ofob
serv
atio
ns,
the
pseu
doR
2,a
nd
the
all-
sam
ple
freq
uen
cyof
the
depe
nde
nt
vari
able
bein
gon
e.∗ ,
∗∗,a
nd
∗∗∗
indi
cate
stat
isti
cals
ign
ifica
nce
atth
e10
%,5
%,a
nd
1%le
vels
.
Pan
elA
:Det
erm
inan
tsof
Take
over
Dep
ende
nt
Var
iabl
e=
Tak
eove
r
Dis
cou
nt
=D
isco
un
t(Q
)D
isco
un
t=
Dis
cou
nt(
EV
/E
bitd
a)
Indu
stry
-Spe
cifi
cF
ron
tier
Fir
m-S
peci
fic
Fro
nti
erIn
dust
ry-S
peci
fic
Fro
nti
erF
irm
-Spe
cifi
cF
ron
tier
Coe
ft-
Sta
tdP
r/dX
Coe
ft-
Sta
tdP
r/dX
Coe
ft-
Sta
tdP
r/dX
Coe
ft-
Sta
tdP
r/dX
Dis
cou
nt
0.28
2∗∗∗
15.3
43.
28%
0.12
8∗∗∗
7.99
1.51
%0.
116∗
∗∗6.
661.
37%
0.07
0∗∗∗
4.30
0.84
%(e
ffec
tof
inte
rqu
arti
lech
ange
)1.
58%
0.74
%0.
65%
0.41
%
Sal
esR
ank
0.06
51.
420.
76%
0.11
4∗∗
2.51
1.35
%−0
.065
−1.2
1−0
.76%
−0.0
22−0
.42
−0.2
6%R
&D
−0.0
20∗∗
∗−2
.71
−0.2
3%−0
.018
∗∗−2
.51
−0.2
1%0.
145
1.15
1.71
%0.
158
1.26
1.86
%A
TO
0.02
3∗∗
2.44
0.27
%0.
014
1.47
0.16
%−0
.005
−0.4
2−0
.05%
0.00
30.
260.
03%
Mkt
Sh
r−0
.233
∗∗∗
−3.1
9−2
.71%
−0.2
73∗∗
∗−3
.70
−3.2
2%−0
.275
∗∗∗
−3.5
9−3
.24%
−0.2
79∗∗
∗−3
.63
−3.2
9%G
row
th0.
004
0.47
−0.0
5%−0
.007
−0.8
0−0
.08%
−0.0
04−0
.29
−0.0
5%−0
.007
−0.5
1−0
.08%
Bet
aAss
et−0
.054
∗∗∗
−2.7
8−0
.63%
−0.1
23∗∗
∗−6
.40
−1.4
5%−0
.112
∗∗∗
−4.9
8−1
.31%
−0.1
21∗∗
∗−5
.38
−1.4
3%L
ever
age
0.03
01.
230.
35%
0.01
20.
510.
14%
0.11
2∗∗∗
3.65
1.32
%0.
105∗
∗∗3.
441.
24%
Pay
out
−0.0
00−0
.01
−0.0
0%0.
004
0.47
0.05
%0.
006
0.67
0.07
%0.
005
0.55
0.06
%H
HIF
irm
0.23
0∗∗∗
7.19
2.67
%0.
233∗
∗∗7.
282.
75%
0.17
5∗∗∗
5.13
2.06
%0.
180∗
∗∗5.
262.
12%
Inst
0.10
0∗∗∗
2.53
1.16
%0.
090∗
∗2.
281.
06%
0.06
91.
610.
82%
0.07
7∗1.
790.
91%
HH
ISIC
3−0
.082
−1.5
3−0
.95%
−0.0
91∗
−1.7
1−1
.07%
−0.0
63−1
.03
−0.7
4%−0
.072
−1.1
9−0
.85%
Am
ihu
d−0
.034
∗∗∗
−4.0
5−0
.39%
−0.0
23∗∗
∗−2
.84
−0.2
7%−0
.027
∗∗∗
−2.6
2−0
.32%
−0.0
26∗∗
−2.5
4−0
.31%
#ob
s,ps
eudo
R2
and
all-
sam
ple
freq
uen
cy10
0,16
00.
019
6.18
%10
0,16
60.
015
6.18
%79
,100
0.01
86.
24%
79,1
030.
017
6.24
%
(con
tin
ued
)
The Real Effects of Financial Markets 955T
able
II—
Con
tin
ued
Pan
elB
:Det
erm
inan
tsof
Dis
cou
nt
Dis
cou
nt
Dis
cou
nt(
Q)
Dis
cou
nt(
EV
/E
bitd
a)
Fro
nti
erIn
dust
ryF
irm
Indu
stry
Fir
m
Sal
esR
ank
0.28
18∗∗
∗0.
1185
∗∗∗
0.34
19∗∗
∗−0
.084
0∗∗∗
[13.
34]
[5.2
7][1
5.48
][−
3.77
]R
&D
−0.0
097∗
∗∗−0
.034
8∗∗∗
−0.7
116∗
∗∗−1
.350
8∗∗∗
[−3.
81]
[−12
.73]
[−11
.82]
[−19
.57]
AT
O−0
.066
2∗∗∗
−0.0
627∗
∗∗0.
0441
∗∗∗
−0.0
337∗
∗∗[−
15.8
4][−
14.6
2][9
.96]
[−7.
64]
Mkt
Sh
r−0
.231
7∗∗∗
−0.1
519∗
∗∗−0
.049
4∗−0
.008
5[−
7.42
][−
4.64
][−
1.82
][−
0.31
]G
row
th−0
.053
1∗∗∗
−0.0
258∗
∗∗−0
.069
6∗∗∗
−0.0
677∗
∗∗[−
17.4
8][−
8.67
][−
14.0
2][−
13.2
9]B
etaA
sset
−0.2
253∗
∗∗0.
0680
∗∗∗
−0.0
577∗
∗∗0.
0364
∗∗∗
[−38
.61]
[11.
24]
[−8.
26]
[5.2
9]L
ever
age
−0.0
583∗
∗∗0.
0141
−0.0
689∗
∗∗−0
.022
0∗[−
5.63
][1
.22]
[−5.
39]
[−1.
69]
Pay
out
0.02
06∗∗
∗0.
0107
∗∗∗
−0.0
236∗
∗∗−0
.019
5∗∗∗
[9.7
1][4
.51]
[−9.
40]
[−7.
68]
HH
IFir
m−0
.059
1∗∗∗
−0.1
401∗
∗∗−0
.009
3−0
.076
4∗∗∗
[−4.
74]
[−11
.64]
[−0.
74]
[−6.
32]
Inst
−0.1
028∗
∗∗−0
.137
9∗∗∗
0.02
35−0
.055
3∗∗∗
[−6.
41]
[−8.
07]
[1.4
7][−
3.36
]H
HIS
IC3
−0.0
759∗
∗∗−0
.037
2∗−0
.110
5∗∗∗
−0.0
579∗
∗∗[−
3.40
][−
1.74
][−
4.84
][−
2.72
]A
mih
ud
0.08
38∗∗
∗0.
0869
∗∗∗
0.02
53∗∗
∗0.
0261
∗∗∗
[32.
84]
[32.
27]
[6.8
8][7
.40]
MF
Flo
w−0
.013
9∗∗∗
−0.0
193∗
∗∗−0
.010
3∗∗∗
−0.0
161∗
∗∗[−
8.43
][−
10.1
3][−
4.63
][−
7.13
]C
onst
ant
0.46
49∗∗
∗0.
3268
∗∗∗
0.10
37∗∗
∗0.
4618
∗∗∗
[25.
72]
[18.
82]
[4.9
6][2
3.44
]
R2
0.12
60.
098
0.06
40.
081
#ob
s10
0,16
010
0,16
679
,100
79,1
03
956 The Journal of Finance R©
is consistent with the hypothesis that the discount to potential value, ratherthan raw valuation, motivates acquisitions.18 Nevertheless, the economic mag-nitude is modest, especially when using EV /Ebitda. One important source ofthe modest effect is the endogeneity of the discount, which is shrunk by theprospects of a takeover. Such an anticipation effect attenuates the relation be-tween takeover and valuation. The next section shows that, when feedback istaken into account, the economic significance rises substantially.
B. Determinants of Takeover and Discount with Feedback
B.1. The Trigger Effect
We now analyze the simultaneous system of (8) and (9). We first investi-gate the effect of the underlying discount, Discount0, on takeover probabilitythat would prevail if the former were not affected by the latter, that is, weestimate the trigger effect, controlling for the anticipation effect. The triggereffect therefore measures the “true” importance of the discount for takeoverattractiveness. The results are reported in Table III.
Compared to the estimates in Table II, the coefficients on Discount are or-ders of magnitude higher in all four specifications. Table III shows that a onepercentage point increase in Discount would lead to a statistically significant12 to 16 basis point increase in Takeover probability if Discount did not shrinkin anticipation of a takeover. An interquartile change in Discount is associatedwith a 5.7 to 7.6 percentage point increase in Takeover probability, economicallysignificant relative to an unconditional probability of 6.2%. The sensitivity ishigher using the Discount measure derived from industry-specific value fron-tiers, indicating that acquirers are more attracted to firms with low valuationscompared to their industry peers.
The table also presents the results of two Wald tests. The first is a Stockand Yogo (2005) weak instrument test, which rejects the hypothesis that theinstruments are weak. The second evaluates the exogeneity of the system, thatis, whether Discount is exogenous to shocks in Takeover. The null is rejectedat less than the 1% level in all four specifications. The second test result, com-bined with the difference in the Discount coefficient between Tables II and III,highlights the need to control for endogeneity by using an instrument whenestimating the trigger effect. Doing so shows that prices are a far more impor-tant driver of takeover activities than implied by the equilibrium correlationbetween the two variables.
B.2. The Anticipation Effect
18 Replacing Discount with raw valuation leads to an interquartile response of 0.04 (usingEV /Ebitda) and 0.65 (using Q) percentage points in takeover frequency. Both values, thoughsignificant in our large sample, are considerably lower than those using Discount. This economicallyinsignificant coefficient is consistent with prior empirical findings.

The Real Effects of Financial Markets 957
Tab
leII
IE
ffec
tsof
Dis
cou
nt
onT
akeo
ver
wit
hF
eed
bac
kT
his
tabl
ere
port
sre
sult
sfr
omes
tim
atin
geq
uat
ion
(9)
inth
e(8
)–(9
)jo
int
syst
em.
All
vari
able
sar
ede
fin
edin
Tabl
eI.
Th
ede
pen
den
tva
riab
leis
Take
over
.All
stan
dard
erro
rsar
ead
just
edfo
rh
eter
oske
dast
icit
yan
dco
rrel
atio
ncl
ust
ered
atth
efi
rmle
vel.
Th
eco
lum
nd
Pr/
dX
give
sth
em
argi
nal
effe
cton
take
over
prob
abil
ity
ofa
one
un
it(o
r10
0pe
rcen
tage
poin
t)ch
ange
inea
chre
gres
sor.
Year
fixe
def
fect
sar
eu
sed
inal
lspe
cifi
cati
ons
but
are
un
repo
rted
.Th
ebo
ttom
ofth
eta
ble
repo
rts
the
nu
mbe
rof
obse
rvat
ion
s,th
eps
eudo
R2,a
nd
the
all-
sam
ple
freq
uen
cyof
the
depe
nde
nt
vari
able
bein
gon
e.A
lso
repo
rted
are
the
test
for
wea
kin
stru
men
ts(w
hic
hre
ject
sth
en
ull
that
the
inst
rum
enta
lva
riab
leis
wea
kat
any
sign
ifica
nce
leve
lh
igh
erth
anth
ein
dica
ted
p-va
lue)
and
the
Wal
dte
stfo
rth
eex
ogen
eity
ofth
esy
stem
(wh
ich
reje
cts
the
nu
llth
atth
ejo
int
syst
emco
uld
bere
duce
dto
two
inde
pen
den
teq
uat
ion
sat
any
sign
ifica
nce
leve
lhig
her
than
the
indi
cate
dp-
valu
e).∗
,∗∗ ,
and
∗∗∗
indi
cate
stat
isti
cals
ign
ifica
nce
atth
e10
%,5
%,a
nd
1%le
vels
.
Dep
ende
nt
Var
iabl
e=
Tak
eove
r
Dis
cou
nt
=D
isco
un
t(Q
)D
isco
un
t=
Dis
cou
nt(
EV
/E
bitd
a)
Indu
stry
-Spe
cifi
cF
ron
tier
Fir
m-S
peci
fic
Fro
nti
erIn
dust
ry-S
peci
fic
Fro
nti
erF
irm
-Spe
cifi
cF
ron
tier
Coe
ft-
Sta
tdP
r/dX
Coe
ft-
Sta
tdP
r/dX
Coe
ft-
Sta
tdP
r/dX
Coe
ft-
Sta
tdP
r/dX
Dis
cou
nt
1.37
1∗∗∗
4.24
15.6
6%0.
989∗
∗∗3.
6711
.58%
1.51
2∗∗∗
4.51
15.8
7%1.
101∗
∗∗3.
6412
.64%
(eff
ect
ofin
terq
uar
tile
chan
ge)
7.55
%5.
65%
7.48
%6.
25%
Sal
esR
ank
−0.2
59∗∗
−2.3
1−2
.96%
0.00
20.
020.
02%
−0.5
36∗∗
∗−4
.34
−5.6
2%0.
069
1.17
0.79
%R
&D
−0.0
06−0
.73
−0.0
7%0.
014
1.13
0.17
%1.
138∗
∗∗4.
2811
.95%
1.56
7∗∗∗
3.61
17.9
0%A
TO
0.09
4∗∗∗
4.09
1.07
%0.
0667
∗∗∗
3.51
0.78
%−0
.067
∗∗∗
−3.7
2−0
.70%
0.03
72∗∗
2.51
0.43
%M
ktS
hr
0.05
80.
470.
66%
−0.1
15−1
.23
−1.3
5%−0
.135
−1.5
2−1
.42%
−0.2
31∗∗
∗−2
.96
−2.6
4%G
row
th0.
064∗
∗∗3.
190.
73%
0.01
71.
490.
20%
0.09
7∗∗∗
3.00
0.53
%0.
066∗
∗2.
580.
22%
Bet
aAss
et0.
208∗
∗2.
472.
37%
−0.1
70∗∗
∗−7
.65
−1.9
9%0.
000
0.00
0.00
%−0
.141
∗∗∗
−6.6
6−1
.61%
Lev
erag
e0.
094∗
∗∗3.
101.
07%
0.00
10.
040.
01%
0.18
7∗∗∗
6.16
1.96
%0.
119∗
∗∗4.
031.
36%
Pay
out
0.02
3∗∗
−2.1
6−0
.26%
−0.0
06−0
.66
−0.0
7%0.
038∗
∗∗3.
580.
40%
0.02
5∗∗
2.49
0.28
%H
HIF
irm
0.27
1∗∗∗
8.53
3.10
%0.
340∗
∗∗8.
113.
98%
0.14
8∗∗∗
3.94
1.55
%0.
239∗
∗∗6.
902.
73%
Inst
0.19
6∗∗∗
4.16
2.24
%0.
195∗
∗∗3.
872.
28%
0.01
20.
270.
12%
0.11
7∗∗∗
2.74
1.33
%
(con
tin
ued
)
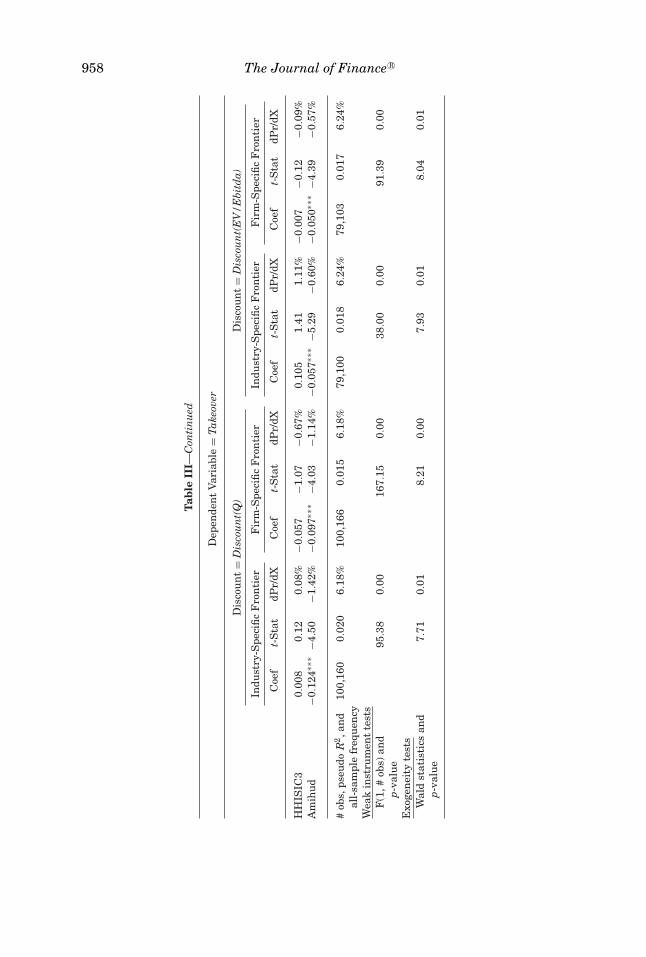
958 The Journal of Finance R©
Tab
leII
I—C
onti
nu
ed
Dep
ende
nt
Var
iabl
e=
Tak
eove
r
Dis
cou
nt
=D
isco
un
t(Q
)D
isco
un
t=
Dis
cou
nt(
EV
/E
bitd
a)
Indu
stry
-Spe
cifi
cF
ron
tier
Fir
m-S
peci
fic
Fro
nti
erIn
dust
ry-S
peci
fic
Fro
nti
erF
irm
-Spe
cifi
cF
ron
tier
Coe
ft-
Sta
tdP
r/dX
Coe
ft-
Sta
tdP
r/dX
Coe
ft-
Sta
tdP
r/dX
Coe
ft-
Sta
tdP
r/dX
HH
ISIC
30.
008
0.12
0.08
%−0
.057
−1.0
7−0
.67%
0.10
51.
411.
11%
−0.0
07−0
.12
−0.0
9%A
mih
ud
−0.1
24∗∗
∗−4
.50
−1.4
2%−0
.097
∗∗∗
−4.0
3−1
.14%
−0.0
57∗∗
∗−5
.29
−0.6
0%−0
.050
∗∗∗
−4.3
9−0
.57%
#ob
s,ps
eudo
R2,a
nd
all-
sam
ple
freq
uen
cy10
0,16
00.
020
6.18
%10
0,16
60.
015
6.18
%79
,100
0.01
86.
24%
79,1
030.
017
6.24
%
Wea
kin
stru
men
tte
sts
F(1
,#ob
s)an
dp-
valu
e95
.38
0.00
167.
150.
0038
.00
0.00
91.3
90.
00
Exo
gen
eity
test
sW
ald
stat
isti
csan
dp-
valu
e7.
710.
018.
210.
007.
930.
018.
040.
01
The Real Effects of Financial Markets 959
Table III quantifies the trigger effect—the impact of discount changes on theprobability of a takeover. In this section, we attempt to estimate the extent towhich shocks to takeover probability affect the discount, for example, due tothe anticipation effect.
One way to identify the effect of takeover vulnerability (i.e., Takeover∗) onDiscount would be to use an instrumental variable that impacts Takeover∗ butdoes not affect Discount directly. Firm-specific variables usually do not satisfythis exclusion restriction. Valid instruments could come from the “supply side,”such as capital inflows to buyout funds or interest rates that proxy for the easeof financing. However, such instruments suffer from low power because theyfail to generate variation in the cross-section.
We therefore adopt a different approach. We identify the effect of the shocksto takeover vulnerability on Discount (i.e., the δ term in equation (8) by us-ing the intermediate and final outputs from estimating equation (9)). Recallequation (11),
˜Discount = δξ + η′,
which shows that the anticipation coefficient δ is a linear projection of theresidual discount (defined in (11)) on ξ , the residual in the takeover equation.We can therefore construct a δ estimate by regressing the empirical analog ofresidual discount ( ˜Discount) on the empirical analog of ξ (ξ ). The empiricalanalog ˜Discount is readily available from (11). For the empirical analog ξ , weadopt the “generalized residual” for discrete response models as proposed byGourieroux et al. (1987),
ξ = [Takeover − Pr(Takeover)]Pr′(Takeover)
Pr(Takeover)[1 − Pr(Takeover)],
where Pr(Takeover
)and Pr
′ (Takeover
)represent the estimated probability
and density (derivative of probability) of Takeover, respectively. Assuming thaterror disturbances are drawn from normal distributions, the above expressionbecomes
ξ = [Takeover − �(u)]φ(u)�(u)[1 − �(u)]
, (14)
where u = μ1 Discount + μ2 X + μ3 Z1, with � and φ representing the cumula-tive distribution function and the density function of the standard normaldistribution, respectively.
The results from all four specifications are reported in Table IV. Our es-timates for the coefficient δ are uniformly negative, as expected, and highlystatistically significant. The economic magnitude of the coefficients is not read-ily interpretable because ξ is a shock to the propensity of takeover, whichdoes not have a natural unit. One way to interpret the economic significanceof our results is to consider the effect of a one percentage point increase inthe probability of a takeover on the discount. This is given by [dDiscount/dξ ]/
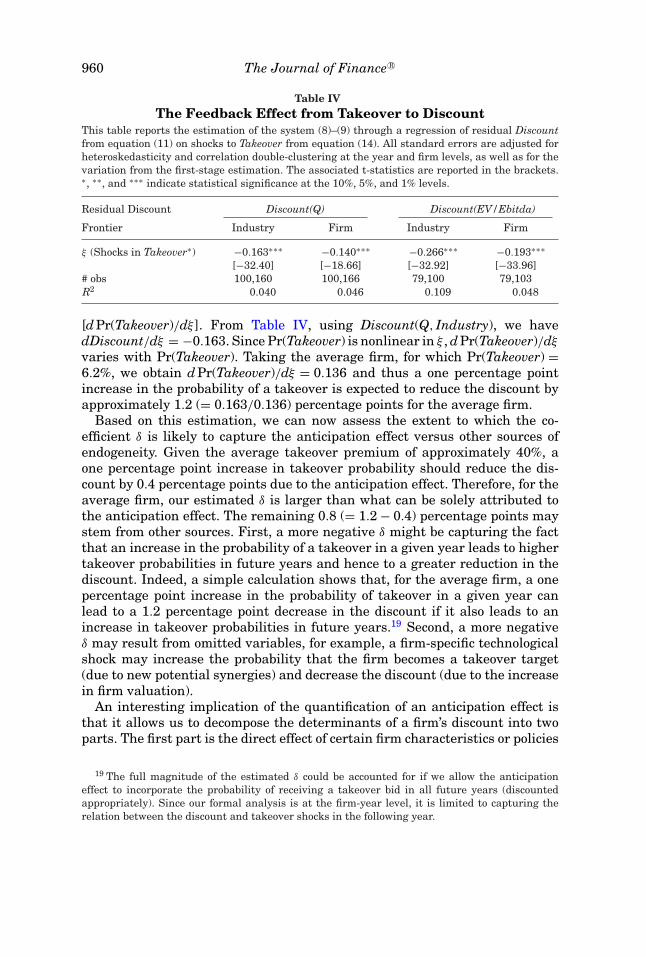
960 The Journal of Finance R©
Table IVThe Feedback Effect from Takeover to Discount
This table reports the estimation of the system (8)–(9) through a regression of residual Discountfrom equation (11) on shocks to Takeover from equation (14). All standard errors are adjusted forheteroskedasticity and correlation double-clustering at the year and firm levels, as well as for thevariation from the first-stage estimation. The associated t-statistics are reported in the brackets.∗, ∗∗, and ∗∗∗ indicate statistical significance at the 10%, 5%, and 1% levels.
Residual Discount Discount(Q) Discount(EV/Ebitda)
Frontier Industry Firm Industry Firm
ξ (Shocks in Takeover∗) −0.163∗∗∗ −0.140∗∗∗ −0.266∗∗∗ −0.193∗∗∗[−32.40] [−18.66] [−32.92] [−33.96]
# obs 100,160 100,166 79,100 79,103R2 0.040 0.046 0.109 0.048
[dPr(Takeover)/dξ ]. From Table IV, using Discount(Q, Industry), we havedDiscount/dξ = −0.163. Since Pr(Takeover) is nonlinear in ξ , dPr(Takeover)/dξ
varies with Pr(Takeover). Taking the average firm, for which Pr(Takeover) =6.2%, we obtain dPr(Takeover)/dξ = 0.136 and thus a one percentage pointincrease in the probability of a takeover is expected to reduce the discount byapproximately 1.2 (= 0.163/0.136) percentage points for the average firm.
Based on this estimation, we can now assess the extent to which the co-efficient δ is likely to capture the anticipation effect versus other sources ofendogeneity. Given the average takeover premium of approximately 40%, aone percentage point increase in takeover probability should reduce the dis-count by 0.4 percentage points due to the anticipation effect. Therefore, for theaverage firm, our estimated δ is larger than what can be solely attributed tothe anticipation effect. The remaining 0.8 (= 1.2 − 0.4) percentage points maystem from other sources. First, a more negative δ might be capturing the factthat an increase in the probability of a takeover in a given year leads to highertakeover probabilities in future years and hence to a greater reduction in thediscount. Indeed, a simple calculation shows that, for the average firm, a onepercentage point increase in the probability of takeover in a given year canlead to a 1.2 percentage point decrease in the discount if it also leads to anincrease in takeover probabilities in future years.19 Second, a more negativeδ may result from omitted variables, for example, a firm-specific technologicalshock may increase the probability that the firm becomes a takeover target(due to new potential synergies) and decrease the discount (due to the increasein firm valuation).
An interesting implication of the quantification of an anticipation effect isthat it allows us to decompose the determinants of a firm’s discount into twoparts. The first part is the direct effect of certain firm characteristics or policies
19 The full magnitude of the estimated δ could be accounted for if we allow the anticipationeffect to incorporate the probability of receiving a takeover bid in all future years (discountedappropriately). Since our formal analysis is at the firm-year level, it is limited to capturing therelation between the discount and takeover shocks in the following year.
The Real Effects of Financial Markets 961
on valuation; the second is the indirect effect of such characteristics or policiesvia their impact on takeover probability. To illustrate this point, consider thevariable Amihud. From Table II, we see that, using Discount(Q, Industry), a oneunit increase in Amihud is associated with a 8.38 percentage point increase inDiscount. We also learn from Table III that a one unit increase in Amihuddecreases takeover propensity (measured by Takeover∗) by −0.124, which,according to Table IV, leads to an increase of 1.69 (= −0.124 × (−0.136)) per-centage points in Discount. Hence, the overall effect of Amihud on Discount—8.38 percentage points—can be decomposed into an indirect effect via the im-pact on takeover likelihood (1.69 percentage points) and a direct effect on price(6.69 percentage points). Thus, while it is well known that illiquidity reduces afirm’s market valuation, this decomposition demonstrates that approximately20% of this effect arises indirectly through the reduced takeover probability.
We are unable to perform a similar decomposition using governance variables(such as the Gompers, Ishii, and Metrick (2003) shareholder rights measureor the Bebchuk, Cohen, and Ferrell (2009) entrenchment index) because theyare only available for one-third of our sample, reducing the power of our tests(see also footnote 15). For a similar reason, our methodology estimates a singletrigger effect and a single anticipation effect across the whole sample; we areunable to make these effects depend on firm governance. There is also anotherreason we are unable to allow the anticipation effect to differ across governance,or any other firm characteristic (even if such data were available for the fullsample)—any such characteristic should also belong to Z1 (a vector of variablesthat proxy for managerial agency), which enters in both equations (8) and (9).Both ˜Discount and ξ (the estimated shock to takeover) are thus, by construction,orthogonal to Z1 and hence to proxies of governance.20
IV. Additional Analyses
A. Discount, Takeover Premium, and Acquirer Return
In equilibrium, we would expect our discount measure to be positively corre-lated with the premium paid to the target, as well as with the acquirer return.A higher discount implies greater gains from a corrective takeover. Thus, aslong as the target has some bargaining power, it should capture a proportionof these gains in the form of a higher premium. Similarly, as long as the ac-quirer has some bargaining power, it should also realize a higher gain whenthe discount is higher.
As is standard in the literature, we calculate Premium as the percentageincrease in the target’s stock price over the [−60, 0] window relative to theannouncement date,21 and AcquirerRET as the [−1,+1] percentage increasein the acquirer’s stock price above the CRSP value-weighted index. We find
20 The idea of making coefficients dependent on other parameters is feasible in standard regres-sions but is not possible here because we have a “residual on residual” regression rather than astandard regression, and by construction the residuals are orthogonal to the covariates.
21 The results are qualitatively similar using alternative windows (such as [−40, 0]) or the
962 The Journal of Finance R©
that both are positively and significantly correlated with Discount: averagingacross all four Discount measures, the correlation coefficients are 7.2% and1.8%, respectively. By the same logic, a measure of total return from the acqui-sition (TotalRET = Premium + AcquirerRET) should also be positively corre-lated with the discount. Indeed, the average correlation coefficient is 7.4%.
To further explore the relation between Discount and the three measuresof acquisition return, we run regressions of these measures on Discount, con-trolling for other determinants of these measures. The regressions appear inthe Internet Appendix. The relationship between Discount and both Premiumand TotalRET retains its significance in all specifications after the addition ofcontrols. Importantly, while the relationship between Premium and Discountremains highly significant, it is still far from one. This suggests that the ac-quirer does indeed enjoy part of the gains from buying a discounted target,and is thus consistent with our main result that acquirers are more likely totarget discounted firms. The relationship between Discount and Acquirer RETremains significant in the EV /Ebitda specifications. In the Q regressions, theassociation is positive but not statistically significant, perhaps because mea-sures of acquirer return are noisy, as is known in the literature.22
B. Financially Driven Takeovers
The results thus far document that takeovers in general are driven by lowtarget valuations. However, certain acquisitions are motivated by other fac-tors, such as synergies or empire building. As such, the trigger effect should bestronger among takeovers that are particularly likely to be valuation-driven.We classify these “financially driven takeovers” as acquisitions that are ei-ther leveraged buyouts or undertaken by financial sponsors. Such acquisitionsare typically motivated by underperforming current management or marketundervaluation, both of which manifest in low market prices. There are anumber of reasons for these different motives. First, the aforementioned syn-ergy and empire-building motives for standard acquisitions do not exist to thesame degree for LBOs: targets typically remain standalone, and LBO man-agers are compensated by carried interest above a threshold rate of return. Bycontrast, for regular corporations, Bebchuk and Grinstein (2009) find a signif-icant link between firm expansion and CEO pay. Second, the LBO structurewas designed precisely to correct agency problems. The high debt (comparedto standard M&A deals) imposes discipline on the manager by forcing him to
actual premium paid. The latter is available for a smaller subsample as transaction terms areoften missing.
22 There are a number of challenges with measuring acquirer returns accurately. First, thereis significant long-run drift after an M&A announcement (Agrawal, Jaffe, and Mandelker (1992)),making it hard to define an event window that is isolated from other corporate events. Second, theM&A announcement only reflects the value creation/destruction relative to what was anticipatedby the market. Third, the M&A announcement return implicitly assumes that the counterfactualif the deal had not been undertaken is zero (Prabhala (1997), Li and Prabhala (2007)), which maynot be the case.
The Real Effects of Financial Markets 963
disgorge excess cash, and concentrates his equity stake to provide incentives(see, e.g., Jensen (1989) and Edmans (2011)). Third, the literature summa-rized in Section I.A systematically finds that LBO gains arise from correctingunderperformance.
We repeat the trigger effect analysis of Table III, removing all nonfinan-cially driven takeovers from the sample and report the results in Table V,Panel A. Indeed, the effect of Discount becomes stronger relative to the smallerunconditional probability. An interquartile change in Discount is associatedwith a 2.2% increase in the probability of a financially driven takeover. Thefull-sample probability of such a takeover is 1.3%, compared to the 6.2% prob-ability of any takeover. In addition, we repeat the anticipation effect analysisof Table IV and report the results in Table V, Panel B.
C. Robustness Checks
In this section we report results from further robustness checks. First, wecheck the sensitivity of our results to the choice of α = 0.20 as our defaultpercentile for frontier values. As discussed earlier, such a choice reflects thetrade-off between reducing the influence of outliers and not underestimatingpotential values. Higher α values are associated with lower aggregate valuesof Discount. The Internet Appendix indicates that the correlation of Discountestimates based on different quantile restrictions around α = 0.20 (our defaultvalue) is extremely high (above 0.89). Since our analysis is driven by the relativeranking (rather than the absolute level) of Discount, it is not surprising thatour results for various α values in the range of [0.1, 0.3] are similar to thosereported in Tables II to IV.
Second, we estimate the firm-specific frontier using tercile ranks rather thanraw measures of the X variables, to allow bidders to change these variableswithin a given tercile. However, for firms already close to the tercile cutoffs,it is easier for bidders to move these variables into a different tercile. Wetherefore rerun the analyses excluding firms within 2.5% of any tercile thresh-old. The Internet Appendix shows that the results are just as strong as inthe full sample in Table III, with an interquartile response of 6.0% to 7.8%relative to an unconditional takeover probability of around 6% for this sub-sample. A related concern is that, in merger waves (which may be drivenby regulatory changes), fundamentals may be particularly likely to change.The Internet Appendix removes both aggregate merger waves (in Panel A)and industry merger waves (in Panel B) and finds that the results are littlechanged.
Finally, our analysis focuses on bids announced rather than completed, sincethe target’s valuation is likely to have greatest effect on an acquirer’s decision tobid. Whether the takeover is subsequently completed often depends on factorsunrelated to valuation, for example, antitrust concerns. Nevertheless, we re-run the data defining takeover as completed deals (76.5% of the deals in oursample) and tabulate the equivalent of Table III in the Internet Appendix. Theresults are again qualitatively similar.
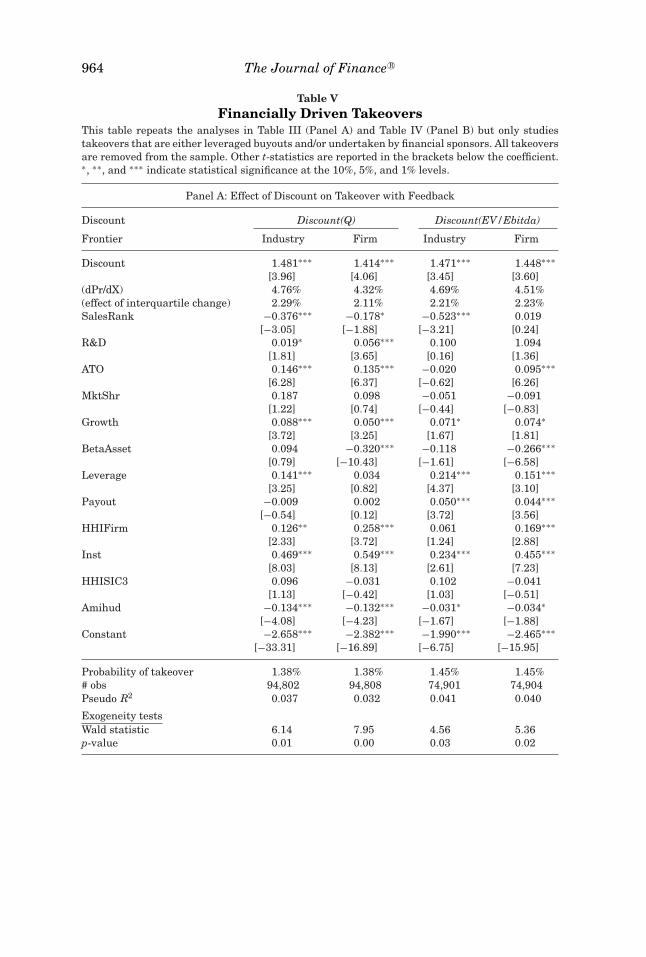
964 The Journal of Finance R©
Table VFinancially Driven Takeovers
This table repeats the analyses in Table III (Panel A) and Table IV (Panel B) but only studiestakeovers that are either leveraged buyouts and/or undertaken by financial sponsors. All takeoversare removed from the sample. Other t-statistics are reported in the brackets below the coefficient.∗, ∗∗, and ∗∗∗ indicate statistical significance at the 10%, 5%, and 1% levels.
Panel A: Effect of Discount on Takeover with Feedback
Discount Discount(Q) Discount(EV/Ebitda)
Frontier Industry Firm Industry Firm
Discount 1.481∗∗∗ 1.414∗∗∗ 1.471∗∗∗ 1.448∗∗∗[3.96] [4.06] [3.45] [3.60]
(dPr/dX) 4.76% 4.32% 4.69% 4.51%(effect of interquartile change) 2.29% 2.11% 2.21% 2.23%SalesRank −0.376∗∗∗ −0.178∗ −0.523∗∗∗ 0.019
[−3.05] [−1.88] [−3.21] [0.24]R&D 0.019∗ 0.056∗∗∗ 0.100 1.094
[1.81] [3.65] [0.16] [1.36]ATO 0.146∗∗∗ 0.135∗∗∗ −0.020 0.095∗∗∗
[6.28] [6.37] [−0.62] [6.26]MktShr 0.187 0.098 −0.051 −0.091
[1.22] [0.74] [−0.44] [−0.83]Growth 0.088∗∗∗ 0.050∗∗∗ 0.071∗ 0.074∗
[3.72] [3.25] [1.67] [1.81]BetaAsset 0.094 −0.320∗∗∗ −0.118 −0.266∗∗∗
[0.79] [−10.43] [−1.61] [−6.58]Leverage 0.141∗∗∗ 0.034 0.214∗∗∗ 0.151∗∗∗
[3.25] [0.82] [4.37] [3.10]Payout −0.009 0.002 0.050∗∗∗ 0.044∗∗∗
[−0.54] [0.12] [3.72] [3.56]HHIFirm 0.126∗∗ 0.258∗∗∗ 0.061 0.169∗∗∗
[2.33] [3.72] [1.24] [2.88]Inst 0.469∗∗∗ 0.549∗∗∗ 0.234∗∗∗ 0.455∗∗∗
[8.03] [8.13] [2.61] [7.23]HHISIC3 0.096 −0.031 0.102 −0.041
[1.13] [−0.42] [1.03] [−0.51]Amihud −0.134∗∗∗ −0.132∗∗∗ −0.031∗ −0.034∗
[−4.08] [−4.23] [−1.67] [−1.88]Constant −2.658∗∗∗ −2.382∗∗∗ −1.990∗∗∗ −2.465∗∗∗
[−33.31] [−16.89] [−6.75] [−15.95]
Probability of takeover 1.38% 1.38% 1.45% 1.45%# obs 94,802 94,808 74,901 74,904Pseudo R2 0.037 0.032 0.041 0.040
Exogeneity testsWald statistic 6.14 7.95 4.56 5.36p-value 0.01 0.00 0.03 0.02
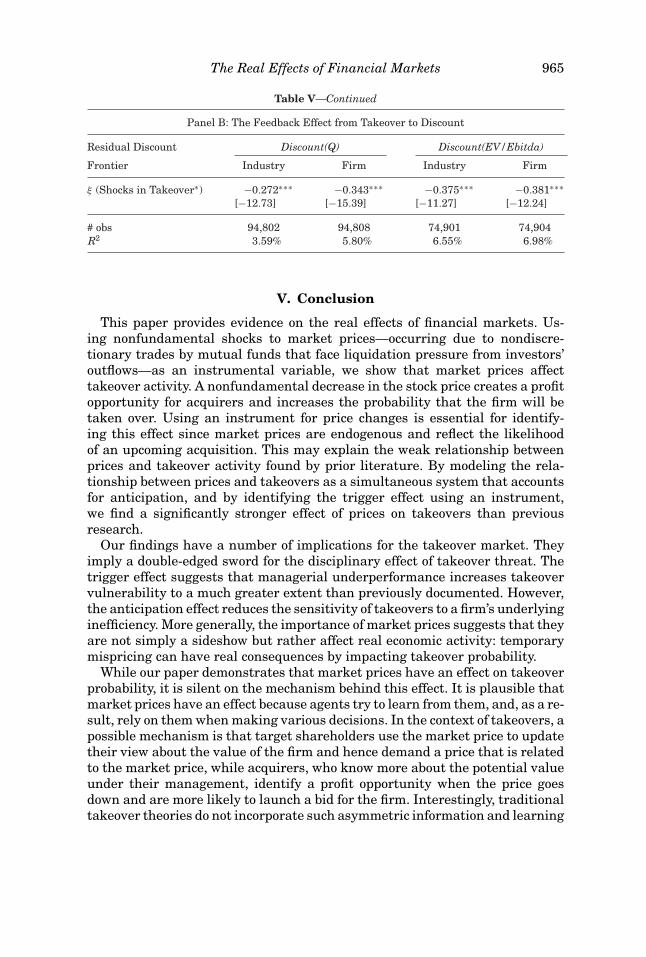
The Real Effects of Financial Markets 965
Table V—Continued
Panel B: The Feedback Effect from Takeover to Discount
Residual Discount Discount(Q) Discount(EV/Ebitda)
Frontier Industry Firm Industry Firm
ξ (Shocks in Takeover∗) −0.272∗∗∗ −0.343∗∗∗ −0.375∗∗∗ −0.381∗∗∗[−12.73] [−15.39] [−11.27] [−12.24]
# obs 94,802 94,808 74,901 74,904R2 3.59% 5.80% 6.55% 6.98%
V. Conclusion
This paper provides evidence on the real effects of financial markets. Us-ing nonfundamental shocks to market prices—occurring due to nondiscre-tionary trades by mutual funds that face liquidation pressure from investors’outflows—as an instrumental variable, we show that market prices affecttakeover activity. A nonfundamental decrease in the stock price creates a profitopportunity for acquirers and increases the probability that the firm will betaken over. Using an instrument for price changes is essential for identify-ing this effect since market prices are endogenous and reflect the likelihoodof an upcoming acquisition. This may explain the weak relationship betweenprices and takeover activity found by prior literature. By modeling the rela-tionship between prices and takeovers as a simultaneous system that accountsfor anticipation, and by identifying the trigger effect using an instrument,we find a significantly stronger effect of prices on takeovers than previousresearch.
Our findings have a number of implications for the takeover market. Theyimply a double-edged sword for the disciplinary effect of takeover threat. Thetrigger effect suggests that managerial underperformance increases takeovervulnerability to a much greater extent than previously documented. However,the anticipation effect reduces the sensitivity of takeovers to a firm’s underlyinginefficiency. More generally, the importance of market prices suggests that theyare not simply a sideshow but rather affect real economic activity: temporarymispricing can have real consequences by impacting takeover probability.
While our paper demonstrates that market prices have an effect on takeoverprobability, it is silent on the mechanism behind this effect. It is plausible thatmarket prices have an effect because agents try to learn from them, and, as a re-sult, rely on them when making various decisions. In the context of takeovers, apossible mechanism is that target shareholders use the market price to updatetheir view about the value of the firm and hence demand a price that is relatedto the market price, while acquirers, who know more about the potential valueunder their management, identify a profit opportunity when the price goesdown and are more likely to launch a bid for the firm. Interestingly, traditionaltakeover theories do not incorporate such asymmetric information and learning
966 The Journal of Finance R©
from prices. In a framework with symmetric information, if there is free-ridingby target shareholders (as in Grossman and Hart (1980)), the bidder must paythe potential value V ∗ regardless of the current price because target share-holders have full bargaining power. Even if the bidder has some bargainingpower, it should bargain with the target over the underlying Discount0 ratherthan the observed Discount, since it is the former that represents the potentialfundamental value that can be created. Regardless of the source of a high mar-ket valuation, it has no effect on takeover likelihood if viewed symmetricallyby the bidder and the target. If high valuation is due to positive news aboutfundamentals (as in Schwert (1996)), both the bidder and the target will agreethat a higher takeover price is warranted. Since the superior fundamentalsalso increase the target’s value to the acquirer, the bidder is fully willing topay the higher price and so the target’s attractiveness is unchanged. If highvaluation is instead due to mispricing, both the bidder and the target will agreethat it should not lead to a high takeover price and so takeover likelihood isagain unaffected. Our findings thus suggest the need for new takeover theoriesto explain why market prices should impact acquisition likelihood.
While our analysis is able to identify the trigger and anticipation effects sep-arately, we are only able to estimate an average trigger effect and an averageanticipation effect across the full sample, rather than allow these effects to de-pend on firm characteristics such as governance, due to limitations of the dataand methodology described earlier. In future research it would be interesting toextend our analysis to study the firm-level determinants of these effects. Songand Walkling (2000) show how peer firms’ stock price reaction to a merger intheir industry depends on characteristics related to the probability of acquisi-tion. While they study a one-time “event-study” effect, our anticipation effectcorresponds to the shrinkage of discount that exists in steady state. The triggereffect may similarly depend on firm-level factors.
There are many other settings in which the interaction between the financialmarket and the real economy is important. These include the impact of marketprices on investment decisions, CEO replacement, and other real activities. Itis typically difficult to identify a real effect of the financial market since, evenif there is a correlation between prices and real activity, it may be driven byan omitted variable that affects both, or it may be attenuated by the antic-ipation effect. We are able to identify the active role of the financial marketby exploring the effects of nonfundamental changes in the price that are notdirectly correlated with real activity. This insight can be used to explore theempirical relation between financial markets and real activities in these othersettings.
Appendix A: Data
This section details the calculation of the mutual fund price pressure vari-able. We obtain quarterly data on mutual fund holdings from CDA Spec-trum/Thomson and mutual fund flows from CRSP. We remove funds that

The Real Effects of Financial Markets 967
specialize in a single industry and calculate
Outflowj,t = −Fj,t/T Aj,t−1,
where j (= 1, . . . , m) indexes mutual funds, t represents one quarter, Fj,t is thetotal inflow experienced by fund j in quarter t, and T Aj,t−1 is fund j’s totalassets at the end of the previous quarter. We then construct
MFFlowi,t =m∑
j=1
Fj,tsi, j,t−1
VOLi,t
for each stock-quarter pair, where i (= 1, . . . , n) indexes stocks and the sum-mation is only over funds j for which Outflowj,t ≥ 5%. The term VOLi,t is totaldollar trading volume of stock i in quarter t , and
si, j,t = SHARESi,j,t × PRCi,t
T Aj,t
is the dollar value of fund j’s holdings of stock i as a proportion of fund j’stotal assets at the end of the quarter. Substitution gives our mutual fund pricepressure measure as
MFFlowi,t =m∑
j=1
Fj,t × SHARESi, j,t−1 × PRCi,t−1
T Aj,t−1 × V OLi,t,
where the summation is only over funds j for which Outf low j,t ≥ 5%. Finally,we sum MFFlow across the four quarters in a given calendar year.
Appendix B: Estimation Procedures
This section derives the full-information maximum likelihood (FIML) likeli-hood function for equation (9). The likelihood of an individual takeover in oursimultaneous equation model is as follows, omitting the i and t subscripts forbrevity:
L = g(Takeover = 1, Discount)Takeoverg(Takeover = 0, Discount)1−Takeover,
where the joint density function g is
g(Takeover = 1, Discount) =∫ ∞
−μ1Discount−μ2 X−μ3 Z1
f (ξ, η) dξ, (B1)
and
g(Takeover = 0, Discount) =∫ −μ1Discount−μ2 X−μ3 Z1
−∞f (ξ, η) dξ, (B2)
and f (ξ, η) is the bivariate density function (assumed to be normal for es-timation purposes), which can be expressed as the product of a conditional
968 The Journal of Finance R©
distribution and a marginal distribution:
f (ξ, η) = f (ξ |η) f (η).
The conditional distribution f (ξ |η) is normal with mean ρξ,ηη/ση and variance1 − ρ2
ξ,η, where ρ and σ are the standard notation for correlation coefficient andstandard deviation. Therefore the joint density function of (B1), assuming allvariables are jointly normal, can be rewritten as
g(Takeover=1, Discount)=�
⎛⎝μ1 Discount + μ2 X + μ3 Z1 + ρξ,ηη/ση√1 − ρ2
ξ,η
⎞⎠φ
(η
ση
),
and � and φ are the cumulative probability and density functions of the stan-dard normal distribution. Equation (B2) can be rewritten analogously. Combin-ing all equations, we arrive at the log likelihood for a takeover on a firm-yearobservation:
li,t = Takeoveri,t ln[�(ui,t−1)] + (1 − Takeoveri,t) ln[1 − �(ui,t−1)] − ln(ση) − η2
2σ 2η
,
(B3)
where
u = μ1 Discount + μ2 X + μ3 Z1 + ρξ,ηη/ση√1 − ρ2
ξ,η
,
η = Discount − γ1 Z1 − γ2 Z2.
The estimation methodology is FIML. It is “full information” because it em-ploys the full information about the joint distribution of f (ξ, η) by using theconditional distribution f (ξ |η) and the marginal distribution f (η) simultane-ously. Further, it is a “maximum likelihood” estimator and thus provides themost efficient estimates (i.e., attains the Cramer–Rao bound) to the extent thatthe model is correctly specified.
REFERENCESAdmati, Anat, and Paul Pfleiderer, 2009, The “Wall Street Walk” and shareholder activism: Exit
as a form of voice, Review of Financial Studies 22, 2645–2685.Agrawal, Anup, and Jeffrey F. Jaffe, 2003, Do takeover targets underperform? Evidence from
operating and stock returns, Journal of Financial and Quantitative Analysis 38, 721–746.Agrawal, Anup, Jeffrey F. Jaffe, and Gerson N. Mandelker, 1992, The post-merger performance of
acquiring firms: A re-examination of an anomaly, Journal of Finance 47, 1605–1621.Aigner, Dennis, C.A. Knox Lovell, and Peter Schmidt, 1977, Formulation and estimation of stochas-
tic frontier production function models, Journal of Econometrics 6, 11–37.Ambrose, Brent, and William Megginson, 1992, The role of asset structure, ownership structure,
and takeover defenses in determining acquisition likelihood, Journal of Financial and Quan-titative Analysis 27, 575–589.
Amihud, Yakov, 2002, Illiquidity and stock returns: Cross-section and time series effects, Journalof Financial Markets 5, 31–56.

The Real Effects of Financial Markets 969
Andrade, Gregor, Mark Mitchell, and Erik Stafford, 2001, New evidence and perspectives onmergers, Journal of Economic Perspectives 15, 103–120.
Baker, George, and Karen Wruck, 1989, Organizational changes and value creation in leveragedbuyouts: The case of the O.M. Scott and Sons Company, Journal of Financial Economics 25,163–190.
Baker, Malcolm, Xin Pan, and Jeffrey Wurgler, 2012, The effect of reference point prices on mergersand acquisitions, Journal of Financial Economics, forthcoming.
Baker, Malcolm, Richard Ruback, and Jeffrey Wurgler, 2007, Behavioral corporate finance: Asurvey, in Espen Eckbo, ed. Handbook of Corporate Finance: Empirical Corporate Finance(Elsevier/North Holland, New York).
Baker, Malcolm, Jeremy C. Stein, and Jeffrey Wurgler, 2003, When does the market matter? Stockprices and the investment of equity dependent firms, Quarterly Journal of Economics 118,969–1006.
Bates, Thomas W., David A. Becher, and Michael L. Lemmon, 2008, Board classification and man-agerial entrenchment: Evidence from the market for corporate control, Journal of FinancialEconomics 87, 656–677.
Bebchuk, Lucian A., Alma Cohen, and Allen Ferrell, 2009, What matters in corporate governance?Review of Financial Studies 22, 787–827.
Bebchuk, Lucian A., and Yaniv Grinstein, 2009, Firm expansion and CEO pay, Working paper,Harvard University.
Betton, Sandra, and B. Espen Eckbo, 2000, Toeholds, bid-jumps, and expected payoffs in takeovers,Review of Financial Studies 13, 841–882.
Betton, Sandra, B. Espen Eckbo, and Karin Thorburn, 2008, Corporate takeovers, in Espen Eckbo,ed. Handbook of Corporate Finance: Empirical Corporate Finance (Elsevier/North Holland,New York).
Bond, Philip, Alex Edmans, and Itay Goldstein, 2012, The real effects of financial markets, AnnualReview of Financial Economics, forthcoming.
Bond, Phillip, Itay Goldstein, and Edward Simpson Prescott, 2010, Market-based corrective ac-tions, Review of Financial Studies 23, 781–820.
Bradley, Michael, Alon Brav, Itay Goldstein, and Wei Jiang, 2010, Activist arbitrage: A study ofopen-ending attempts of closed-end funds, Journal of Financial Economics 95, 1–19.
Brealey, Richard A., Stewart C. Myers, and Franklin Allen, 2010, Principles of Corporate Finance(McGraw-Hill, New York)
Chen, Qi, Itay Goldstein, and Wei Jiang, 2007, Price informativeness and investment sensitivityto stock price, Review of Financial Studies 22, 1409–1445.
Coval, Joshua, and Erik Stafford, 2007, Asset fire sales (and purchases) in equity markets, Journalof Financial Economics 86, 479–512.
Cremers, Martijn, Vinay B. Nair, and Kose John, 2009, Takeovers and the cross-section of returns,Review of Financial Studies 22, 1409–1445.
Dong, Ming, David Hirshleifer, Scott Richardson, and Siew Hong Teoh, 2006, Does investor mis-valuation drive the takeover market? Journal of Finance 61, 725–762.
Dow, James, Itay Goldstein, and Alexander Guembel, 2010, Incentives for information pro-duction in markets where prices affect real investment, Working paper, London BusinessSchool.
Dow, James, and Gary Gorton, 1997, Stock market efficiency and economic efficiency: Is there aconnection? Journal of Finance 52, 1087–1129.
Duffie, Darrell, 2010, Asset price dynamics with slow-moving capital, Journal of Finance 65,1238–1268.
Eckbo, B. Espen, and Karin S. Thorburn, 2008, Corporate restructuring: Breakups and LBO’s,in B. Espen Eckbo, ed. Handbook of Corporate Finance: Empirical Corporate Finance(Elsevier/North Holland, New York).
Edmans, Alex, 2009, Blockholder trading, market efficiency, and managerial myopia, Journal ofFinance 62, 2481–2513.
Edmans, Alex, 2011, Short-term termination without deterring long-term investment: A theory ofdebt and buyouts, Journal of Financial Economics 102, 81–101.
970 The Journal of Finance R©
Edmans, Alex, and Gustavo Manso, 2011, Governance through trading and intervention: A theoryof multiple blockholders, Review of Financial Studies 24, 2395–2428.
Fishman, Michael, and Kathleen Hagerty, 1992, Insider trading and the efficiency of stock prices,RAND Journal of Economics 23, 106–122.
Giroud, Xavier, and Holger M. Mueller, 2010, Does corporate governance matter in competitiveindustries? Journal of Financial Economics 95, 312–331.
Goldstein, Itay, and Alexander Guembel, 2008, Manipulation and the allocation role of prices,Review of Economic Studies 75, 133–164.
Gompers, Paul, Joy Ishii, and Andrew Metrick, 2003, Corporate governance and equity prices,Quarterly Journal of Economics 118, 107–155.
Gourieroux, Christian, Alain Monfort, Eric Renault, and Alain Trognon, 1987, Generalized resid-uals, Journal of Econometrics 34, 4–32.
Grossman, Sanford J., and Oliver D. Hart, 1980, Takeover bids, the free-rider problem, and thetheory of the corporation, Bell Journal of Economics 11, 42–64.
Habib, Michael, and Alexander Ljungqvist, 2005, Firm value and managerial incentives: A stochas-tic frontier approach, Journal of Business 78, 2053–2094.
Hackbarth, Dirk, and Erwan Morellec, 2008, Stock returns in mergers and acquisitions, Journalof Finance 63, 1213–1252.
Hoberg, Gerard, and Gordon M. Phillips, 2010, Real and financial industry booms and busts,Journal of Finance 65, 45–86.
Holmstrom, Bengt, and Jean Tirole, 1993, Market liquidity and performance monitoring, Journalof Political Economy 101, 678–709.
Hunt-McCool, Janet, Samuel Koh, and Bill Francis, 1996, Testing for deliberate underpricingin the IPO premarket: A stochastic frontier approach, Review of Financial Studies 9, 1251–1269.
Jensen, Michael C., 1989, Eclipse of the public corporation, Harvard Business Review 67, 61–74.Jensen, Michael C., 1993, The modern industrial revolution, exit, and the failure of internal control
systems, Journal of Finance 48, 831–880.Jensen, Michael C., and Richard S. Ruback, 1983, The market for corporate control: The scientific
evidence, Journal of Financial Economics 11, 5–50.Kaplan, Steven N., 1989, The effects of management buyouts on operating performance and value,
Journal of Financial Economics 24, 217–254.Koenker, Roger, and Gilbert Bassett, 1978, Regression quantiles, Econometrica 46, 33–50.Kumbhakar, Subal, and Knox Lovell, 2000, Stochastic Frontier Analysis (Cambridge University
Press, Cambridge, MA).Li, Kai, and N. R. Prabhala, 2007, Self-selection models in corporate finance, in Espen Eckbo, ed.
Handbook of Corporate Finance: Empirical Corporate Finance (Elsevier/North Holland, NewYork).
Lichtenberg, Frank R., and Donald Siegel, 1990, The effects of leveraged buyouts on productivityand related aspects of firm behavior, Journal of Financial Economics 27, 165–194.
Manne, Henry, 1965, Mergers and the market for corporate control, Journal of Political Economy73, 110–120.
Marris, Robin, 1964, The Economic Theory of Managerial Capitalism (Macmillan, London).Mikkelson, Wayne, and Megan Partch, 1989, Managers’ voting rights and corporate control, Jour-
nal of Financial Economics 25, 163–190.Morck, Randall, Andrei Shleifer, and Robert Vishny, 1990, The stock market and investment: Is
the market a sideshow? Brookings Papers on Economic Activity 2, 157–202.Muscarella, Chris J., and Michael R. Vetsuypens, 1990, Efficiency and organizational structure: A
study of reverse LBOs, Journal of Finance 45, 1389–1413.Palepu, Krishna, 1986, Predicting takeover targets: A methodological and empirical analysis,
Journal of Accounting and Economics 8, 3–35.Powell, James, 1984, Least absolute deviations estimation for the censored regression model,
Journal of Econometrics 25, 303–325.Prabhala, N. R., 1997, Conditional methods in event-studies and an equilibrium justification for
using standard event-study methods, Review of Financial Studies 10, 1–38.
The Real Effects of Financial Markets 971
Rhodes-Kropf, Matthew, David Robinson, and S. Viswanathan, 2005, Valuation waves and mergeractivity: The empirical evidence, Journal of Financial Economics 77, 561–603.
Rivers, Douglas, and Quang Vuong, 1988, Limited information estimators and exogeneity tests forsimultaneous probit models, Journal of Econometrics 39, 347–366.
Schwert, G. William, 1996, Markup pricing in mergers and acquisitions, Journal of FinancialEconomics 41, 153–192.
Shivadasani, Anil, 1993, Board composition, ownership structure, and hostile takeovers, Journalof Accounting and Economics 16, 167–198.
Shleifer, Andrei, and Robert Vishny, 2003, Stock market driven acquisitions, Journal of FinancialEconomics 70, 295–311.
Sias, Richard, Laura T. Starks, and Sheridan Titman, 2006, Changes in institutional ownershipand stock returns: Assessment and methodology, Journal of Business 79, 2869–2910.
Smith, Abbie J., 1990, Corporate ownership structure and performance: The case of managementbuyouts, Journal of Financial Economics 27, 143–164.
Song, Moon, and Ralph Walkling, 2000, Abnormal returns to rivals of acquisition targets: A test ofthe “acquisition probability hypothesis,” Journal of Financial Economics 55, 143–171.
Stein, Jeremy, 1996, Rational capital budgeting in an irrational world, Journal of Business 69,429–455.
Stock, James, and Motohiro Yogo, 2005, Testing for weak instruments in linear IV regression, inJames Stock and Donald Andrews, eds. Identification and Inference for Econometric Models:A Festschrift in Honor of Thomas Rothenberg (Cambridge University Press, Cambridge).
Subrahmanyam, Avindar, and Sheridan Titman, 1999, The going-public decision and the develop-ment of financial markets, Journal of Finance 54, 1045–1082.