the reality of applying decision support … · (hris); university education environment (uee). ......
TRANSCRIPT

http://www.iaeme.com/IJITMIS/index.asp 1 [email protected]
International Journal of Information Technology & Management Information System
(IJITMIS)
Volume 9, Issue 1, January-April 2018, pp.01–20, Article ID: IJITMIS_09_01_001
Available online at
http://www.iaeme.com/ IJITMIS/issues.asp?JType= IJITMIS&VType=9&IType=1
Journal Impact Factor (2016): 6.9081 (Calculated by GISI) www.jifactor.com
ISSN Print: 0976 – 6405 and ISSN Online: 0976 – 6413
© IAEME Publication
THE REALITY OF APPLYING DECISION
SUPPORT SYSTEM SUCCESS FACTORS IN THE
UNIVERSITY EDUCATION ENVIRONMENT:
CASE STUDY APPLIED TO TAIBAH
UNIVERSITY
Dr. Ahmad Abdelqader Abuseeni and Dr. Husam Alfahl
Department of Management Information Systems,
College of Business Administration, Taibah University
ABSTRACT
The development of the field of information technology has led to systems, tools,
and techniques that aim to support managers in making decisions, reflected in
improved business performance at all managerial levels in the organization,
particularly arising from its contribution to the process of continual improvement of
employees. This study highlights the reality of applying the success factors of design
support systems in the university education environment, through a case study of
Taibah University in Saudi Arabia. First, a model was built based on the decision
support system success factors that were identified by previous studies. These factors
are then tested to determine which applied in the university educational environment,
from the point of view of faculty and staff. Data were collected using a measurement
questionnaire, and subjected to statistical analysis using SPSS and structural equation
modeling using AMOS. The results suggested a number of conclusions, the most
important of which was the validity of the relationship between the two dimensions of
the research. The paper concludes with the presentation of a set of recommendations,
providing all the requirements for the implementation decision support systems in the
field work of the university.
Key words: decision support systems (DSS); human resource information systems
(HRIS); university education environment (UEE).
Cite this Article: Dr. Ahmad Abdelqader Abuseeni and Dr. Husam Alfahl, The
Reality of Applying Decision Support System Success Factors in the University
Education Environment: Case Study Applied to Taibah University. International
Journal of Information Technology & Management Information System 9(1), 2018,
pp. 01–20.
http://www.iaeme.com/IJITMIS/issues.asp?JType=IJITMIS&VType=9&IType=1

The Reality of Applying Decision Support System Success Factors in the University Education
Environment: Case Study Applied to Taibah University
http://www.iaeme.com/IJITMIS/index.asp 2 [email protected]
1. INTRODUCTION
The information age, with its explosion of knowledge and flow of information, has seen
businesses seek to improve or maintain their competitiveness in the increasingly challenging
global marketplace. Information systems are regularly used as a tool to advance customer
service, shorten cycle times, and reduce costs(Hitt, Wu, & Zhou, 2002). Brockbank (1999)
recommended human resources (HR) become a strategic partner, and emphasized the need for
human resource information systems (HRIS).HRIS supports planning, administration,
decision-making, and control of human resource related issues. In addition, it can be utilized
to enhance employees selection and placement, payroll, pension, reimbursement management,
training projections, career pathing, equity monitoring, and productivity evaluation. Such
information systems increase administrative efficiency and produce reports capable of
improving decision-making (DeSanctis, 1986).
The current study was conducted to focus on the reality of Decision Support Systems
(DSS) success factors in the University Education Environment (UEE). A model was built
based on the DSS success factors identified by (Mabrouk, 2012)and these factors include
physical resources, technical resources, HR, organizational facilities, and senior management
awareness. The next section presents a literature review followed by sections on the research
problem, the importance of the research, the research objectives, hypotheses, and model. The
methodology is explained in the following section, including subsections on exploratory
factor analysis (EFA), data collection, analysis, reliability and validity analysis, convergent
validity analysis, discrimination validity analysis, and confirmatory factor analysis (CFA).
The following section describes frequent analysis, and the final section presents a discussion
and conclusions with some suggestions for future work.
2. LITERATURE REVIEW
Al Hassani (2013)studied the both direct and indirect impact of DSS on information quality
and effective decision-making in the Ministry of Civil Service of the Sultanate of Oman. In
his study, 78 employees were surved using a questioner. In addition, simple and multi-
regression analysis, and path analysis were preforred to analiyze the collected data. The
results shows that there is a significant impact for the dimensions of the information quality
on the effective decision-making(Al Hassani, 2013). The study also confirm that, in such
setting, DSS had a significant impact on the effectiveness of decision-making and information
quality.
Ramadan (2009)investigated the impact of DSS on developing the performance of the
Ministry of Education, Gaza. 230 employees who are working in the supervisory positions
were surveyd using a questionnaire. The study found that there are significant differences the
on the impact of DSS on the development of performance attributable based on the variables
of sex, qualifications,specialization, and region of the respondents.
Al-Mobaideen, Allahawiah, and Basioni (2013)examined the main factors influencing the
successful adoption of DSS in the Aqaba Special Economic Zone Authority, Jordan, including
system characteristics (perceived ease of use and perceived usefulness), technical aspects
(information technology infrastructure and information systems interoperability), and
organizational aspects (top management support, management style, and organizational
structure). The findings indicated that IT infrastructure has a positive and significant effect on
the successful adoption of HRIS, but there is no significant effect from perceived usefulness
and ease of use, top management support and IEC on the successful adoption of HRIS.
Finally, the results indicated that there were no significant statistical differences arising from
Dr. Ahmad Abdelqader Abuseeni and Dr. Husam Alfahl
http://www.iaeme.com/IJITMIS/index.asp 3 [email protected]
demographic characteristics on HRIS adoption. The researchers proposed a set of
recommendations for better adoption of HRIS in the Aqaba Special Economic Zone.
Guimares, Igbaria, and Lu (1992)investigated the determinants of DSS success. A
multivariate model was developed and tested using multiple regression hierarchical analysis
and data analyses, which indicated that DSS success, as measured by DSS satisfaction and
perceived benefits, depends on several factors, including user experience with DSS, user
involvement, user training, top management support, information sources, level of managerial
activity, task structure and difficulty, and interdependence.
Sanders and Courtney (1985)explored several variables in the organizational environment
thought to influence the success of DSS. Further support was given to the importance of
factors that have historically been shown to affect transaction processing systems and
management information systems; for example, top management support has consistently
been shown to influence the implementation of computer-based systems, and this study
reaffirmed those findings. They also provided further evidence regarding the role of training
in DSS development. Further, length of use was shown to be a critical factor contributing to
DSS satisfaction.
Mabrouk (2012) defined DSS success factors in terms of the relevance of the available
information, the adequacy of the available information, the appropriateness of the models and
reports used, with success factors including the availability of appropriate physical, technical,
and human resources, and the degree of organizational facilities and senior management
awareness and support. In our study, as noted in the introduction, we adopt the factors defined
in Mabrouk (2012).
3. RESEARCH PROBLEM
Based on the introduction, the research problem can be expressed by asking the following
question: what are the design support system factors that apply in the UEE? Further, what are
most influential design support system factors that apply in the UEE?
The Importance of the Research
This research is of both academic and practical importance. The research questions prompt
answers that add to the understanding of the theoretical framework for definitions of DSS and
associated success factors. In practical terms, this research adds to evidence on DSS success
factors that apply to the UEE.
Research Objectives
The objectives of the research are:
To determine via respondent answers the levels of use of DSS in the UEE.
To determine the nature of the most influential DSS factors in the UEE.
Research Hypotheses
The following research hypotheses were formulated:
There is a significant difference in the extent of application of DSS factors.
Respondent answers vary in terms of the most influential DSS factors applied in the UEE.
4. RESEARCH MODEL
This research focuses on the reality of applying DSS success factors in the UEE. The model
was built based on the five DSS success factors defined by Mabrouk (2012)(see Figure 1):

The Reality of Applying Decision Support System Success Factors in the University Education
Environment: Case Study Applied to Taibah University
http://www.iaeme.com/IJITMIS/index.asp 4 [email protected]
Physical resources: sufficient computers with appropriate capabilities and a variety of storage
facilities suited to the needs of the work; a network with suitable characteristics, capabilities
and speed to connect devices; a specialized technical support and maintenance team to update
the hardware and software periodically.
Technical resources: the quality of the programs used, in terms of being current, easy to learn,
suitable for the requirements of the work, and compatible with the devices and the network
used; available programs must cover all required activities, with continuous evaluation by
users.
HR: specialized highly qualified IT personnel, available to respond to and capable of
understanding employee inquiries and problems.
Organizational facilities: facilitating access to appropriate information regarding work, as well
as the necessary financial support for the use of DSS; the administration should take note of
the opinions and suggestions of the employees and provide training programs on the use of
DSS, as well the necessary requirements to improve the use of DSS. The organizational
structure should be such that officials can evaluate performance.
Senior management awareness: the extent to which management relies on DSS in decision-
making, and the extent to which managers encourage staff to use DSS, support training
courses, provide the necessary hardware and software, and support the efforts of staff to
design and develop DSS. The administration should be concerned with making the process of
design and development of DSS part of the comprehensive organizational development
process, and be well aware of the importance of DSS.
Figure 1 Research module (Mabrouk, 2012).

Dr. Ahmad Abdelqader Abuseeni and Dr. Husam Alfahl
http://www.iaeme.com/IJITMIS/index.asp 5 [email protected]
5. METHODOLOGY
Our survey population consisted of faculty members of Taibah University. A regular random
sample was used, in which 131 respondents were identified. The questionnaire was divided
into five parts: part 1, containing eight questions on demographic information; part 2,
containing 12 items to measure aspects of the organization (OR); part 3, containing nine items
to measure aspects pertaining to management (MA); part 4, containing 16 items to measure
aspects pertaining to technology (TECH). All factors were measured using a five-point Likert
scale: (1) Strongly Disagree, (2) Disagree, (3) Undecided, (4) Agree, (5) Strongly Agree.
The current study applied Structural Equation Modeling (SEM) as to analyze the collected
data instead of multiple regressions because SEM can give more goodness of fit indices for
the full structural model, giving more superior empirical results (Hair, Black, Babin, &
Anderson, 2010).
6. DATA COLLECTION AND ANALYSIS
The survey questionnaires were available online and 131 responses were collected.
Demographic information for the study sample is presented in Table 1.
Table 1 Participant Demographic Information
Demographic profile Group Number Percentage
Sex Male 94 72%
Female 37 28%
Age Less than 40 46 35%
40 or more 84 65%
Qualification
Professor 5 4%
Associate professor 24 18%
Assistant professor 73 56%
Lecturer 24 18%
Teaching assistant 1 0.8%
Administrative 4 3.2%
Years of experience
Seven years or more 81 63.3%
3–7 37 28.9%
Less than three years 5 3.9%
The majority of respondents were over 40 years old, with more male than female
respondents (see Table 1). Almost two-thirds of the respondents were assistant professors and
associate professors. Finally, most respondents had greater than seven years experience.
7. RELIABILITY AND VALIDITY ANALYSIS
For each of the five variables in this study, SPSS 22.0 was used to find Cronbach’s alpha and
AMOS to find correlation values. According to Nunnally and Bernstein (1994),to be
acceptable, each variable must show Cronbach’s alpha values above 0.60 and correlations
above 0.5. In the current study, these conditions are met for all variables (see Figures 2 and 3).

The Reality of Applying Decision Support System Success Factors in the University Education
Environment: Case Study Applied to Taibah University
http://www.iaeme.com/IJITMIS/index.asp 6 [email protected]
PHR Reliability Test:
Reliability Statistics
Cronbach’s
Alpha N of Items
0.859 12
OF Reliability Test:
Reliability Statistics
Cronbach’s
Alpha N of Items
0.938 9
TR Reliability Test:
Reliability Statistics
Cronbach’s
Alpha N of Items
0.911 8
SMA Reliability Test:
Reliability Statistics
Cronbach’s
Alpha N of Items
0.941 8
HR Reliability Test:
Reliability Statistics
Cronbach’s
Alpha N of Items
0.928 7
Figure 2 Cronbach’s alpha results (from SPSS).
Figure 3 Correlation value results (from AMOS).
Cronbach’s alpha and correlation values for all items are presented in Table 2. It can be
seen that the correlations are above 0.5 and all Cronbach’s alphas are above 0.9. Therefore,
the variables have an acceptable level of reliability(Nunnally & Bernstein, 1994).

Dr. Ahmad Abdelqader Abuseeni and Dr. Husam Alfahl
http://www.iaeme.com/IJITMIS/index.asp 7 [email protected]
Table 2 Results of Reliability Analysis
Correlation Values # of Items Cronbach’s Alpha Variable
44 0.967 Total
0.60 12 0.859 PHR
0.75 8 0.911 TR
0.80 7 0.928 HR
0.79 9 0.938 OF
0.82 8 0.941 SMA
8. CONVERGENT VALIDITY ANALYSIS
The investigation of the validity was accomplished using confirmatory factor analysis (CFA).
Moreover, the average variance extracted (AVE) and combination validity (CR) were
calculated manually by following the steps mentioned by (Hair et al., 2010). The results of
convergent validity analysis are presented the in Table 3. As shown in table 3, the AVE is
more than 0.5 and the CR is above 0.6 for all the constructs which is acceptable (Hair et al.,
2010). Table 3 Convergent Validity Analysis
CR AVE Factor loading Items Construct
0.837 0.44
0.54
0.71
0.73
-0.35
0.71
0.68
0.77
0.68
0.73
0.58
0.65
0.72
PHR12
PHR11
PHR10
PHR9
PHR8
PHR7
PHR6
PHR5
PHR4
PHR3
PHR2
PHR1
PHR
0.905 0.56
0.71
0.63
0.61
0.79
0.79
0.80
0.84
0.80
TR8
TR7
TR6
TR5
TR4
TR3
TR2
TR1
TR
0.907 0.65
0.80
0.60
0.76
0.87
0.90
0.86
0.83
HR7
HR6
HR5
HR4
HR3
HR2
HR1
HR
0.931 0.63 0.77
0.73
OF9
OF8 OF

The Reality of Applying Decision Support System Success Factors in the University Education
Environment: Case Study Applied to Taibah University
http://www.iaeme.com/IJITMIS/index.asp 8 [email protected]
0.85
0.80
0.90
0.87
0.78
0.71
0.69
OF7
OF6
OF5
OF4
OF3
OF2
OF1
0.928 0.67
0.77
0.80
0.91
0.87
0.80
0.84
0.80
0.74
SMA8
SMA7
SMA6
SMA5
SMA4
SMA3
SMA2
SMA1
SMA
As can be seen in Table 3, AVE and CR for all constructs meet the standards, except for
items PHR9and PHR3, which have factor loadings of −0.347 and 0.58 respectively, which
render the value of AVG for the variable PHR to be less than the allowable standard
(0.44 < 0.5). This did not appear through Cronbach’s alpha and correlation value analysis,
underscoring the importance of the convergent validity analysis using CFA. On the basis of
this result, PHR3 and PHR9 were eliminated, and the previous analysis for PHR repeated.
With this change, the value of AVG became 0.50, implying the scales have acceptable
convergent validity(Hair et al., 2010) (see Table 4).
Table 4 Modification Convergent Validity Analysis for PHR
CR AVE Factor loading Items Construct
0.871 0.50
0.533
0.713
0.734
0.707
0.687
0.78
0.683
0.719
0.633
0.716
PHR12
PHR11
PHR10
PHR8
PHR7
PHR6
PHR5
PHR4
PHR2
PHR1
PHR
9. DISCRIMINATION VALIDITY ANALYSIS
The square root of AVE and the correlation coefficient matrix were used to test the
discrimination validity of the constructs. According to Fornell and Larcker (1981), the square
root of AVE is required to be greater than its correlation coefficient with another construct.. In
Table 5, the values in the diagonal line represent the square root of AVE of constructs; other
data represent the correlation coefficient of the row construct and the column construct of the
data. Therefore, the scale has an acceptable discrimination validity.

Dr. Ahmad Abdelqader Abuseeni and Dr. Husam Alfahl
http://www.iaeme.com/IJITMIS/index.asp 9 [email protected]
Table 5 Analysis Results of Discrimination Validity
PHR TR HR OF SMA
PHR 0.7071
TR 0.6470 0.7483
HR 0.5390 0.5680 0.8062
OF 0.498 0.6820 0.5490 0.7937
SMA 0.379 0.5560 0.4250 0.7680 0.8185
As each construct’s square root of AVE is greater than its correlation coefficient with
another construct, we conclude that the scales have acceptable discrimination validity.
10. CONFIRMATORY FACTOR ANALYSIS (CFA)
CFA is the next step following EFA in determining the factor structure of the data set; CFA is
used to confirm the factor structure extracted in the previous stage (Hair et al., 2010). The
CFA was conducted using AMOS for each variable. Results for the CFA of the 12 PHR items
measuring organization(OR) are shown in Figure 4.
Figure 4 PHR CFA.
According to Hair et al. (2010), the standardized loading estimates should be 0.5 or
higher. As the values for the PHR item loading factors lie in the range 0.53–0.78, we conclude
that PHR has an acceptable factor loading (see Figure 4).
The same steps were done for TR CFA, CFA OF, HR CFA , SMA CFA, the details was
illustrated in the appendix., as the items loading factor values lie in the range 0.50–0.90, we
conclude that it have an acceptable factor loading(Hair et al., 2010).

The Reality of Applying Decision Support System Success Factors in the University Education
Environment: Case Study Applied to Taibah University
http://www.iaeme.com/IJITMIS/index.asp 10 [email protected]
11. FREQUENT DISCUSSIONS
An estimated Likert scale balance was calculated by dividing the scale into equal ranges; that
is, calculating the range = 5−1 = 4, then dividing by 5,to give 0.80as shown in table 6.
Table 6 Likert Scale Balance
Response Mean General trend
Strongly disagree 1–1.80 Strongly disagree
Disagree 1.81–2.60 Disagree Quite true 2.61–3.40 Quite true
Agree 3.41–4.20 Agree
Strongly agree 4.21 or more Strongly agree
Table 7 Results for Physical Resources (PHR)
Item
Str
on
gly
dis
ag
ree
Dis
ag
ree
Qu
ite
tru
e
Ag
ree
Str
on
gly
ag
ree Mean Std. Deviation The general
trend
PHR1
Number of computer devices suitable for
the number of employees in the
department
34 18 20 33 26 2.99 1.49 Quite true
PHR2
Computers provide enough space to store
information
17 17 30 39 28 3.33 1.30 Quite true
PHR3
There are default storage devices (external
location using the Internet)
22 28 34 28 19 2.95 1.30 Quite true
PHR4
Data entry is available to suit the business
needs of the department
19 29 40 37 6 2.86 1.12 Quite true
PHR5
The capability of the existing network
iscompatiblewith the work needs of the
circuit
20 24 39 41 7 2.93 1.15 Quite true
PHR6
The output devices are compatible with the
work requirements of the circuit
12 32 52 31 4 2.87 0.98 Quite true
PHR7
The speed of computers is compatible with
the volume of work required to be
completed
12 41 39 30 9 2.87 1.08 Quite true
PHR8
The speed of connection is appropriate
17 43 34 31 6 2.74 1.09 Quite true
PHR9
Frequent interruptions occur in the
network used
8 22 38 34 35 3.50 1.22 Agree
PHR10
The network malfunction is processed
quickly
22 32 44 25 8 2.73 1.14 Quite true
PHR11
When computer devices fail, maintenance
is quick
20 34 49 22 6 1.69 1.07 Quite true
PHR12
Information technology (network and
related devices) is updated periodically
26 34 41 25 5 2.61 1.12 Quite true

Dr. Ahmad Abdelqader Abuseeni and Dr. Husam Alfahl
http://www.iaeme.com/IJITMIS/index.asp 11 [email protected]
The general trend of the responses for PHR (calculating averages, frequencies,
percentages and standard deviations) was ‘Quite True’; this held for all items except PHR9.
This result implies some difficulties in providing:
A suitable number of computer devices.
Enough space to store information.
A default storage device (external location using the Internet).
Data entry that suits the business needs of the department.
A network with appropriate capabilities.
Output devices compatible with the work requirements.
Computer speed compatible with the volume of work required.
Adequate speed of connection.
Processes to adequately resolve network malfunctions.
Well-maintained computerized devices.
Updated information technology (network and related devices).
The result for PHR9 was ‘Agree’, which implies that frequent interruptions occur in the network.
Note that in applying CFA, weeliminatedPHR3 and PHR9, so results are not included in
the final recommendations.
The same steps were done for (TR), (HR), (OF), (SMA), the details was illustrated in the
appendix.
After calculating averages, frequencies, percentages and standard deviations, the general
trend of responses regarding senior management awareness was ‘Quite True’ (see Table 11).
This implies some difficulties regarding:
Senior managers’ conviction in regards to DSS.
Senior managers’ encouragement of staff to use DSS.
Senior managers’ support of training courses in DSS.
Senior managers’ provision of hardware and software required to use DSS.
Senior managers’ support for staff efforts to design and develop DSS.
Senior managers’ concern for making the process of design and development of DSS part
of the overall comprehensive organizational development procedures.
The stimulation of employees who rely on DSS.
Senior managers’ awareness of the importance of DSS.
12. DISCUSSION AND CONCLUSION
In summary, regarding the first factor, physical resources(PHR), the general trend of
responses indicates a need to provide:
A suitable number of computer devices.
Enough space to store information.
A default storage device (external location using the Internet).
Data entry that suits the business needs of the department.
A network with appropriate capabilities.
Output devices compatible with the work requirements.
Computer speed compatible with the volume of work required.
Adequate speed of connection.
The Reality of Applying Decision Support System Success Factors in the University Education
Environment: Case Study Applied to Taibah University
http://www.iaeme.com/IJITMIS/index.asp 12 [email protected]
Processes to adequately resolve network malfunctions.
Well-maintained computerized devices.
Updated information technology (network and related devices).
The result for PHR9 was ‘Agree’, which implies that frequent interruptions occur in the network.
Note that in applying CFA, we eliminated PHR3 and PHR9, so results are not included in
the final recommendations.
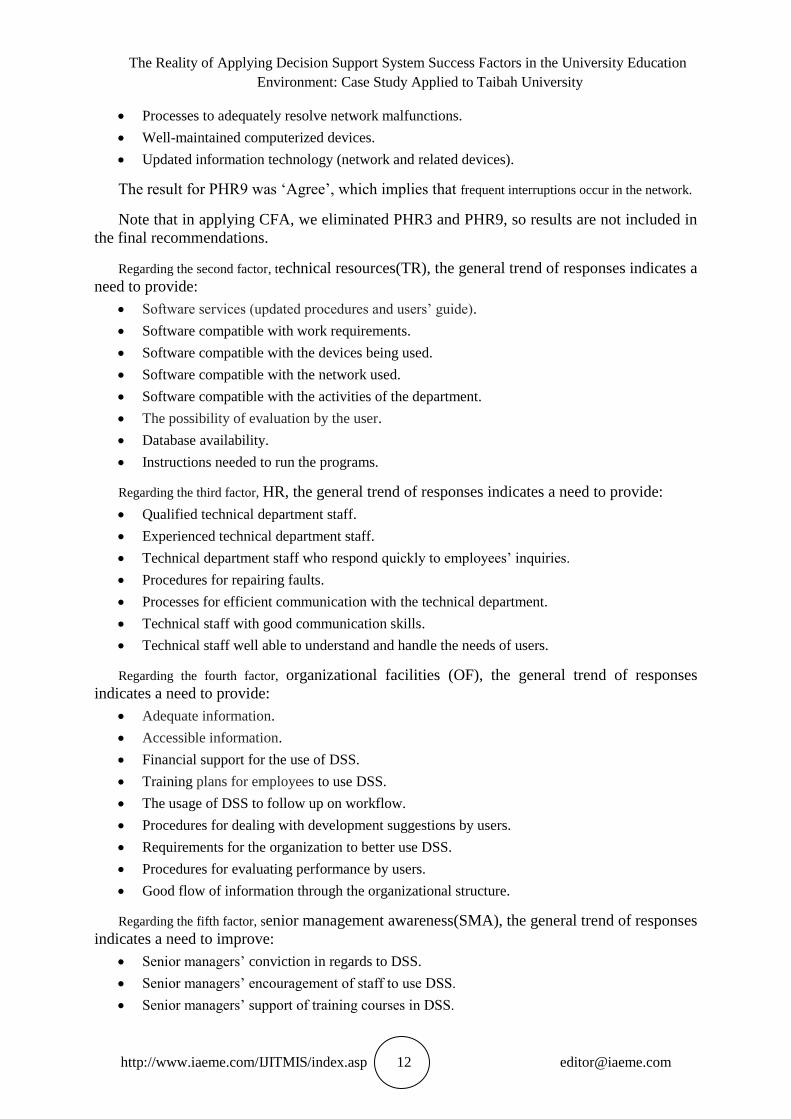
Regarding the second factor, technical resources(TR), the general trend of responses indicates a
need to provide:
Software services (updated procedures and users’ guide).
Software compatible with work requirements.
Software compatible with the devices being used.
Software compatible with the network used.
Software compatible with the activities of the department.
The possibility of evaluation by the user.
Database availability.
Instructions needed to run the programs.
Regarding the third factor, HR, the general trend of responses indicates a need to provide:
Qualified technical department staff.
Experienced technical department staff.
Technical department staff who respond quickly to employees’ inquiries.
Procedures for repairing faults.
Processes for efficient communication with the technical department.
Technical staff with good communication skills.
Technical staff well able to understand and handle the needs of users.
Regarding the fourth factor, organizational facilities (OF), the general trend of responses
indicates a need to provide:
Adequate information.
Accessible information.
Financial support for the use of DSS.
Training plans for employees to use DSS.
The usage of DSS to follow up on workflow.
Procedures for dealing with development suggestions by users.
Requirements for the organization to better use DSS.
Procedures for evaluating performance by users.
Good flow of information through the organizational structure.
Regarding the fifth factor, senior management awareness(SMA), the general trend of responses
indicates a need to improve:
Senior managers’ conviction in regards to DSS.
Senior managers’ encouragement of staff to use DSS.
Senior managers’ support of training courses in DSS.

Dr. Ahmad Abdelqader Abuseeni and Dr. Husam Alfahl
http://www.iaeme.com/IJITMIS/index.asp 13 [email protected]
Senior managers’ provision of hardware and software required to use DSS.
Senior managers’ support for staff efforts to design and develop DSS.
Senior managers’ concern for making the process of design and development of DSS part of
the overall comprehensive organizational development procedures.
The stimulation of employees who rely on DSS.
Senior managers’ awareness of the importance of DSS.
By highlighting the reality of applying the success factors of design support systems in
the university education environment, the results indicate that there is a need to develop some
elements supporting these factors. According to respondents' recommendations, the technical
resources(TR) and senior management awareness (SMA) captured a great deal of
concentration and attention so we can say it is the most influential factors, this is consistent
with previous studies discussed in the literature review. It is hoped that this will contribute in
the development and the improvement of the university education environment.
REFERENCES
[1] Al-Mobaideen, H., Allahawiah, S., & Basioni, B. (2013). Factors influencing the
successful adoption of human resource information system: The content of Aqaba Special
Economic Zone Authority. Intelligent Information Management, 5, 1-9.
[2] Al Hassani, A. (2013). The Impact between Decision Support Systems , Information
Quality and Effective Decision-Making: A field study on Ministry of Civil Service –
Sultanate of Oman. (Master), Middle East University, Oman.
[3] Brockbank, W. (1999). If HR were really strategically proactive: Present and future
directions in HR’s contribution to competitive advantage. Human Resource Management,
38(4), 337-352.
[4] DeSanctis, G. (1986). Human resource information systems—A current assessment. MIS
Quarterly, 10(1), 15-27.
[5] Fornell, C., & Larcker, D. F. (1981). Evaluating structural equation models with
unobservable variables and measurement error. Journal of marketing research, 18, 39-50.
[6] Guimares, T., Igbaria, M., & Lu, M. (1992). The determinants of DSS success: An
integrated model. Decision Sciences, 23, 409-430.
[7] Hair, J., Black, W., Babin, B., & Anderson, R. (2010). Multivariate Data Analysis. Upper
Saddle River, New Jersey.: Prentice Hall.
[8] Hitt, M., Wu, J., & Zhou, X. (2002). Investment in enterprise resource planning: Business
impact and productivity measures. Journal of Management Information Systems, 19(1),
71-98.
[9] Mabrouk, A. I. (2012). Information and its role in support and strategic decision-making
(1st ed.). Cairo: Arab Group for Training and Publishing.
[10] Nunnally, J., & Bernstein, I. (1994). Psychometric Theory (3rd ed.). New York: McGraw-
Hill. .
[11] Ramadan, F. (2009). The impact of decision support systems on developing the
performance of the ministry of education. (Master), Islamic University, Gaza.
[12] Sanders, G. L., & Courtney, J. F. (1985). A field study of organizational factors
influencing DSS success. MIS Quarterly, 9(1), 77-93.
APPENDIX 1
Confirmatory Factor Analysis (CFA)
CFA is the next step following EFA in determining the factor structure of the data set; CFA is
used to confirm the factor structure extracted in the previous stage (Hair et al., 2010). The
CFA was conducted using AMOS for each variable. Results for the CFA of the 12 PHR items
measuring organization (OR) are shown in Figure 1.

The Reality of Applying Decision Support System Success Factors in the University Education
Environment: Case Study Applied to Taibah University
http://www.iaeme.com/IJITMIS/index.asp 14 [email protected]
Figure 1 PHR CFA.
Figure 2 TR CFA.

Dr. Ahmad Abdelqader Abuseeni and Dr. Husam Alfahl
http://www.iaeme.com/IJITMIS/index.asp 15 [email protected]
HR contains seven items. Values for all loading factors for these HR items lie in the range
0.60–0.90, implying that HR has an acceptable factor loading (Hair et al., 2010).
Figure 3 HR CFA.
OF contains nine items. In the CFA OF, the loading factor values were in the range 0.69–
0.90, implying an acceptable factor loading (see Figure 4)(Hair et al., 2010).
Figure 4 OF CFA.

The Reality of Applying Decision Support System Success Factors in the University Education
Environment: Case Study Applied to Taibah University
http://www.iaeme.com/IJITMIS/index.asp 16 [email protected]
SMA includes eight items. As shown in Figure 8, the SMA items’ loading factor values
were in the range 0.74–0.90, implying an acceptable factor loading (Hair et al., 2010).
Figure 5 SMA CFA.
FREQUENT DISCUSSIONS
An estimated Likert scale balance was calculated by dividing the scale into equal ranges; that
is, calculating the range = 5−1 = 4, then dividing by 5, to give 0.80 (Table 1).
Table 1 Likert Scale Balance
Response Mean General trend
Strongly disagree 1–1.80 Strongly disagree
Disagree 1.81–2.60 Disagree
Quite true 2.61–3.40 Quite true
Agree 3.41–4.20 Agree
Strongly agree 4.21 or more Strongly agree
Table 7 Results for Physical Resources(PHR)
Item
Str
on
gly
dis
ag
ree
Dis
ag
ree
Qu
ite
tru
e
Ag
ree
Str
on
gly
ag
ree
Mean Std. Deviation The general
trend
PHR1
Number of computer devices suitable for the
number of employees in the department
34 18 20 33 26 2.99 1.49 Quite true
PHR2
Computers provide enough space to store
information
17 17 30 39 28 3.33 1.30 Quite true
PHR3
There are default storage devices (external
location using the Internet)
22 28 34 28 19 2.95 1.30 Quite true

Dr. Ahmad Abdelqader Abuseeni and Dr. Husam Alfahl
http://www.iaeme.com/IJITMIS/index.asp 17 [email protected]
PHR4
Data entry is available to suit the business
needs of the department
19 29 40 37 6 2.86 1.12 Quite true
PHR5
The capability of the existing network is
compatible with the work needs of the circuit
20 24 39 41 7 2.93 1.15 Quite true
PHR6
The output devices are compatible with the
work requirements of the circuit
12 32 52 31 4 2.87 0.98 Quite true
PHR7
The speed of computers is compatible with the
volume of work required to be completed
12 41 39 30 9 2.87 1.08 Quite true
PHR8
The speed of connection is appropriate
17 43 34 31 6 2.74 1.09 Quite true
PHR9
Frequent interruptions occur in the network
used
8 22 38 34 35 3.50 1.22 Agree
PHR10
The network malfunction is processed quickly
22 32 44 25 8 2.73 1.14 Quite true
PHR11
When computer devices fail, maintenance is
quick
20 34 49 22 6 1.69 1.07 Quite true
PHR12
Information technology (network and related
devices) is updated periodically
26 34 41 25 5 2.61 1.12 Quite true
The general trend of the responses for PHR (calculating averages, frequencies,
percentages and standard deviations) was ‘Quite True’; this held for all items except PHR9.
This result implies some difficulties in providing:
A suitable number of computer devices.
Enough space to store information.
A default storage device (external location using the Internet).
Data entry that suits the business needs of the department.
A network with appropriate capabilities.
Output devices compatible with the work requirements.
Computer speed compatible with the volume of work required.
Adequate speed of connection.
Processes to adequately resolve network malfunctions.
Well-maintained computerized devices.
Updated information technology (network and related devices).
The result for PHR9 was ‘Agree’, which implies that frequent interruptions occur in the
network.
Note that in applying CFA, we eliminated PHR3 and PHR9, so results are not included in
the final recommendations.

The Reality of Applying Decision Support System Success Factors in the University Education
Environment: Case Study Applied to Taibah University
http://www.iaeme.com/IJITMIS/index.asp 18 [email protected]
Table 2 Results for Technical Resources (TR)
Item
Str
on
gly
dis
ag
ree
Dis
ag
ree
Qu
ite
tru
e
Ag
ree
Str
on
gly
ag
ree
Mean Std. Deviation The
general
trend
TR1
The software used is updated and
easy to learn
9 33 39 41 9 3.06 1.05 Quite true
TR2
The software used is compatible with
the work requirements of the
department
12 25 44 44 6 3.05 1.04 Quite true
TR3
The software used is compatible with
the devices being used
14 23 38 52 4 3.06 1.06 Quite true
TR4
The software is compatible with the
network
9 27 45 48 2 3.05 0.96 Quite true
TR5
The software available cover all the
activities of the department
14 38 46 28 5 2.79 1.02 Quite true
TR6
Software effectiveness can be
evaluated by users
22 44 43 19 3 2.52 1.01 Quite true
TR7
A database is available to assist in the
progress of performance
23 39 39 26 4 2.61 1.08 Quite true
TR8
All instructions are available to run
the programs needed at work
15 43 42 27 4 2.70 1.01 Quite true
For technical resources, the general trend of the responses was ‘Quite True’, indicating
some difficulties in providing:
Software services (updated procedures and users’ guide).
Software compatible with work requirements.
Software compatible with the devices being used.
Software compatible with the network used.
Software compatible with the activities of the department.
The possibility of evaluation by the user.
Database availability.
Instructions needed to run the programs.
Table 3 shows the responses for the items pertaining to extent of support.
Table 3 Results for Human Resources (HR)
Item
Str
on
gly
dis
ag
ree
Dis
ag
ree
Qu
ite
tru
e
Ag
ree
Str
on
gly
ag
ree
Mean Std.
Deviation
The
general
trend
HR1
The technical department is
staffed by IT specialists
19 30 35 38 9 2.90 1.17 Quite true
HR2
There are highly qualified staff in
the technical department
19 29 46 32 5 2.81 1.08 Quite true

Dr. Ahmad Abdelqader Abuseeni and Dr. Husam Alfahl
http://www.iaeme.com/IJITMIS/index.asp 19 [email protected]
HR3
The technical department
responds quickly to employees’
inquiries
23 27 39 37 5 2.81 1.15 Quite true
HR4
The relevant technical section
fixes the problems faced by
network and software users
quickly
16 25 44 40 6 2.96 1.08 Quite true
HR5
There is direct contact with the
technical department
10 28 31 50 12 3.20 1.11 Quite true
HR6
I have good relations with the
technical staff responsible for the
systems
8 20 41 43 19 3.34 1.09 Quite true
HR7
Employees in the technical
department understand the needs
of employees
13 20 38 47 13 3.20 1.13 Quite true
The general trend of the responses pertaining to HR was ‘Quite True’, implying some
difficulties in providing:
Qualified technical department staff.
Experienced technical department staff.
Technical department staff who respond quickly to employees’ inquiries.
Procedures for repairing faults.
Processes for efficient communication with the technical department.
Technical staff with good communication skills.
Technical staff well able to understand and handle the needs of users.
Table 4 Results for Organizational Facilities (OF)
Item
Str
on
gly
dis
ag
ree
Dis
ag
ree
Qu
ite
tru
e
Ag
ree
Str
on
gly
ag
ree
Mean Std.
Deviation
The
general
trend
OF1
The information available from
the support systems is
commensurate with the needs of
the work
7 33 55 31 5 2.95 0.93 Quite true
OF2
The information available to
senior management can easily be
obtained from my work
17 41 40 27 6 2.73 1.07 Quite true
OF3
The department provides financial
support for the use of DSS
27 43 40 18 3 2.44 1.03 Quite true
OF4
The organization follows up the
workflow based on DSS
19 32 48 27 5 2.74 1.06 Quite true
OF5
The organization is concerned
with the views and suggestions of
staff
22 37 40 35 7 2.67 1.12 Quite true
OF6
The organization provides training
programs on the use of DSS
17 45 40 25 4 2.64 1.02 Quite true
OF7
The organization provides
19 40 39 29 4 2.68 1.06 Quite true

The Reality of Applying Decision Support System Success Factors in the University Education
Environment: Case Study Applied to Taibah University
http://www.iaeme.com/IJITMIS/index.asp 20 [email protected]
requirements for better use of
DSS
OF8
The organizational structure
makes it easy for the user to
evaluate performance
14 38 40 29 10 2.87 1.11 Quite true
OF9
The organizational structure
allows information to flow easily
17 30 44 30 10 2.89 1.13 Quite true
The general trend of the responses on organizational facilities was ‘Quite True’, implying
some difficulties in providing:
Adequate information.
Accessible information.
Financial support for the use of DSS.
Training plans for employees to use DSS.
The usage of DSS to follow up on workflow.
Procedures for dealing with development suggestions by users.
Requirements for the organization to better use DSS.
Procedures for evaluating performance by users.
Good flow of information through the organizational structure.
Table 5 Results for Senior Management Awareness (SMA)
Item
Str
on
gly
dis
ag
ree
Dis
ag
ree
Qu
ite
tru
e
Ag
ree
Str
on
gly
ag
ree
Mean Std.
Deviation
The
general
trend
SMA1
Senior managers rely on DSS to make
decisions
20 26 54 25 6 2.77 1.06 Quite true
SMA2
Senior managers encourage staff to use
DSS
18 33 48 21 11 2.80 1.12 Quite true
SMA3
Senior managers support training
courses in DSS
27 34 36 28 6 2.63 1.16 Quite true
SMA4
Organization managers provide the
hardware and software required to use
DSS
21 40 37 29 4 2.65 1.08 Quite true
SMA5
The organization supports staff efforts
to design and develop DSS
21 38 41 26 5 2.66 1.08 Quite true
SMA6
Organization managers are concerned
with making the process of design and
development of DSS part of the
overall comprehensive organizational
development
21 33 49 23 5 2.67 1.06 Quite true
SMA 7
Organization stimulates employees
who rely on DSS
21 44 42 21 3 2.54 1.01 Quite true
SMA8
Organization managers are well aware
of the importance of DSS
15 23 53 27 13 3.00 1.11 Agree