the recent colonization history of the most widespread
TRANSCRIPT

HAL Id: hal-03036193https://hal.archives-ouvertes.fr/hal-03036193
Submitted on 2 Dec 2020
HAL is a multi-disciplinary open accessarchive for the deposit and dissemination of sci-entific research documents, whether they are pub-lished or not. The documents may come fromteaching and research institutions in France orabroad, or from public or private research centers.
L’archive ouverte pluridisciplinaire HAL, estdestinée au dépôt et à la diffusion de documentsscientifiques de niveau recherche, publiés ou non,émanant des établissements d’enseignement et derecherche français ou étrangers, des laboratoirespublics ou privés.
The recent colonization history of the most widespreadPodocarpus tree species in Afromontane forests
Jérémy Migliore, Anne-Marie Lézine, Olivier Hardy
To cite this version:Jérémy Migliore, Anne-Marie Lézine, Olivier Hardy. The recent colonization history of the mostwidespread Podocarpus tree species in Afromontane forests. Annals of Botany, Oxford UniversityPress (OUP), 2020, 126 (1), pp.73-83. �10.1093/aob/mcaa049�. �hal-03036193�

1
01. MANUSCRIPT CATEGORIES: 1
Original Article for Annals of Botany AOB-19699 2
3
02. TITLE: 4
The recent colonisation history of the most widespread Podocarpus tree species in 5
Afromontane forests 6
7
03. AUTHORS: 8
Jérémy Migliore1,2,3*
, Anne-Marie Lézine1, Olivier J. Hardy
2 9
10
04. AUTHORS AFFILIATIONS: 11
1Sorbonne Université, Laboratoire d'Océanographie et du Climat : Expérimentations et 12
Approches Numériques (LOCEAN/IPSL), CNRS UMR 7159, Paris, France. 13
2Université Libre de Bruxelles, Faculté des Sciences, Service Evolution Biologique et 14
Ecologie, Bruxelles, Belgium. 15
3Muséum départemental du Var, Toulon, France. 16
17
05.*CORRESPONDING AUTHOR: 18
Jérémy Migliore - Université Libre de Bruxelles, Faculté des Sciences, Service Evolution 19
Biologique et Ecologie, CP 160/12, 50 avenue F.D. Roosevelt, 1050 Bruxelles, Belgium. 20
Phone: +33 (0)681.112.891 21
Email addresses: [email protected] / [email protected] 22
23
06. RUNNING TITLE: 24
Phylogenomics of Afromontane Podocarpus 25
2
Abstract 1
● Background and Aims Afromontane forests host a unique biodiversity distributed in 2
isolated high elevation habitats within a matrix of rain forests or savannahs. Yet, they share a 3
remarkable flora that raises questions about past connectivity between currently isolated 4
forests. Here, we focused on the Podocarpus latifolius - P. milanjianus complex 5
(Podocarpaceae), the most widely distributed conifers throughout sub-Saharan African 6
highlands, to infer its demographic history from genetic data. 7
● Methods We sequenced the whole plastid genome, mitochondrial DNA regions, and 8
nuclear ribosomal DNA of 88 samples from Cameroon to Angola in western Central Africa 9
and from Kenya to the Cape region in eastern and southern Africa to reconstruct time-10
calibrated phylogenies and perform demographic inferences. 11
● Key Results We show that P. latifolius and P. milanjianus form a single species, whose 12
lineages diverged during the Pleistocene, mostly between c. 200 and 300 kyrs BP, after which 13
they underwent a wide range expansion leading to their current distributions. Confronting 14
phylogenomic and palaeoecological data, we argue that the species originated in East Africa 15
and reached the highlands of the Atlantic side of Africa through two probable latitudinal 16
migration corridors: a northern one towards the Cameroon volcanic line, and a southern one 17
towards Angola. Although the species is now rare in large parts of its range, no demographic 18
decline was detected, probably because it occurred too recently to have left a genetic signature 19
in our DNA sequences. 20
● Conclusions Despite the ancient and highly fluctuating history of podocarps in Africa 21
revealed by palaeobotanical records, the extended distribution of current P. 22
latifolius/milanjianus lineages is shown to result from a more recent history, mostly during 23

3
the mid-late Pleistocene, when Afromontane forests were once far more widespread and 1
continuous. 2
Key words: Afromontane forest, genome skimming, molecular dating, palaeoecology, 3
phylogenomics, phylogeography, plastome sequencing, Podocarpaceae, Podocarpus 4
latifolius, Podocarpus milanjianus 5
6

4
INTRODUCTION 1
Considered as hotspots of biodiversity (Gehrke and Linder 2014), African high mountains are 2
characterized by a complex dynamics of species diversity linked to their fragmented 3
distribution. They are described as islands, since low-elevation habitats (rain forests or 4
savannahs) act as dispersal barriers, facilitating the divergence of isolated populations 5
(McCormack et al. 2009). However, many species are shared between African mountains, 6
indicating long-distance dispersal between mountains and/or habitat connectivity in the past 7
(Hedberg 1969; Kebede et al. 2007; Gehrke and Linder 2009; Chala et al. 2017). To explain 8
such Afromontane diversity, one emerging hypothesis is the flickering connectivity system, 9
where Plio‐Pleistocene climatic changes recurrently affected the distribution of montane 10
vegetation belts, generating new lineages (Flantua et al. 2019). An alternation of population 11
connectivity and fragmentation periods was thus suggested for Prunus africana (Kadu et al. 12
2011, 2013), Hagenia abyssinica (Ayele et al. 2009; Gichira et al. 2017), Rand Flora species 13
(Mairal et al. 2017), and Afroalpine species (Gizaw et al. 2013; Schwery et al. 2015; Chartier 14
et al. 2016). Unfortunately, genetic studies are still lacking for many Afromontane trees and it 15
remains difficult to know how and when populations/species have been able to disperse 16
among Afromontane 'islands'. 17
In Africa, Podocarpaceae, represented by the genera Podocarpus and Afrocarpus, are 18
typical montane forest trees. Among them, Podocarpus latifolius (Thunb.) R. Br. ex Mirb. is 19
often considered as a synonym of Podocarpus milanjianus Rendle (Barker et al. 2004) so that 20
we will refer to this taxon as P. latifolius/milanjianus. It is the most widespread species, 21
ranging from Cameroon to Angola in western Central Africa and from Kenya to the Cape 22
region in eastern and southern Africa (Fig. 1A). Despite being very extensive, its distribution 23
is extremely fragmented, and the species is nowadays rare and very localised in large parts of 24
5
its range, such as in western Central Africa. The origin of such an extensive but fragmented 1
distribution range remains unclear but could suggest past large-scale expansions of montane 2
forests through mid- to low elevation areas (White 1993). More specifically, western 3
populations have been postulated to originate from eastern populations following either a 4
northern dispersal corridor (Aubréville 1976) or a southern migratory track through the 5
Zambezi-Congo watershed (Maley et al. 1990; White 1993; Adie and Lawes 2011). 6
The most ancient fossil pollen data in Africa reported the sporadic occurrence of 7
podocarps during the (pre-) Cretaceous time (Goldblatt 1978; Salard-Cheboldaeff and Dejax 8
1991) and the late Oligocene (Coetzee 1980). Podocarps expanded during the Miocene in 9
eastern (Retallack 1992; Boaz et al. 1992) and southern Africa (Coetzee 1980; Dupont et al. 10
2011; Hoetzel et al. 2015), probably in response to the global climate change following the 11
setting of the high latitude ice sheets (Zachos et al. 2001) and the uplift of the East African 12
Plateau (Wichura et al. 2010). Podocarps were recorded in East Africa in most of the Plio-13
Pleistocene hominid sites (Bonnefille 2010; Owen et al. 2018), and also in western Africa 14
(Morley 2000), where its presence coincides with the onset of northern hemisphere 15
glaciations at 2.7 Myrs (million years) (Knaap 1971; Adeonipekun et al. 2017). During the 16
last million years, the abundance of podocarp pollen underwent large amplitude variations 17
(Fig. 1B), generally increasing during the moist phases of forest development coinciding with 18
interglacial phases (Dupont et al. 2001). However, the chronology of palynological records is 19
less reliable for ancient periods, and as pollen grains of P. latifolius/milanjianus cannot be 20
distinguished from those of other Podocarpus or Afrocarpus species, it is difficult to assess 21
how individual podocarp species responded to glacial/interglacial cycles. In this context, 22
studying the genetic diversity of P. latifolius/milanjianus should provide key insights into the 23
demographic scenario associated with colonisation processes and routes, the role of refugia in 24

6
the preservation of genetic diversity, and the magnitude of gene flow, in such extremely 1
fragmented Afromontane forests (Sklenář et al. 2014; Wondimu et al. 2014; Gizaw, 2
Brochmann, et al. 2016). 3
Here, to gain insights into the past dynamics of Afromontane forests, we investigate 4
the phylogeography of P. latifolius/milanjianus using a genome skimming approach, by 5
sequencing plastid, mitochondrial and ribosomal DNA of a sampling representative of the 6
natural distribution of the species. Phylogenomic patterns from dated gene phylogenies will 7
be discussed against what we know from podocarp palaeorecords to examine the role of 8
Pleistocene climate oscillations on the demographic history of P. latifolius/milanjianus. We 9
will test the following hypotheses. (i) P. latifolius (southern Africa) and P. milanjianus 10
(western Central Africa, East Africa) are so closely related that they belong to the same 11
species. (ii) P. latifolius/milanjianus underwent a species range expansion, involving a 12
demographic expansion during the Pleistocene, followed by a demographic decline in parts of 13
its range where it is nowadays rare. (iii) P. latifolius/milanjianus populations from western 14
Central Africa (from Cameroon to Angola) originate from East Africa following a southern 15
and/or northern migration route. 16
17
18
19
MATERIALS AND METHODS 20
Biological model 21
The Podocarpaceae family is represented in Africa by six Afrocarpus species and seven 22
Podocarpus species (Barker et al. 2004; Adie and Lawes 2011). Species delimitation in 23
African Podocarpus is not yet completely resolved, since P. latifolius and P. milanjianus are 24

7
considered either as synonymous or as distinct species restricted to South Africa and 1
East/Central Africa respectively (Barker et al. 2004). 2
Podocarpus latifolius/milanjianus is a medium to large evergreen tree (20-30 m in 3
height) slowly growing in Afromontane forests, usually between 900 and 3,200 m asl, 4
although it sometimes occurs at lower elevation notably in coastal forests of South Africa 5
(Fig. 1A). Its ecology is not well documented, but it is a key component of montane forests, 6
where it dominates old-growth stages, being capable of establishing in relatively high light 7
conditions as well as in a fragmented landscape (Turner and Cernusak 2011). The leaves are 8
strap-shaped, with a bluntly pointed tip. The male cones of this dioecious tree are 10-50 mm 9
long and look like small pinkish catkins inflorescences adapted for wind pollination. The 10
female cones are fleshy, with a single (rarely two) 7-11 mm seed in apical position on an 8-14 11
mm pink, edible and sweet aril. Being animal dispersed (by birds, monkeys, bush pigs and 12
sometimes by humans) and capable of rapid germination after 4-6 weeks in a variety of 13
habitats, P. latifolius/milanjianus is an annual seeder fitting the model of a good disperser 14
(Geldenhuys 1993; Adie and Lawes 2011). 15
16
Genomic libraries preparation, sequencing, and bioinformatic treatment 17
A total of 88 field and herbarium specimens of P. latifolius/milanjianus and three outgroup 18
taxa (Afrocarpus falcatus from South Africa and Kenya, A. usambarensis, and Podocarpus 19
elongatus; see Supplementary Data Table S1) were selected for paired-end sequencing (2 × 20
150 bp) of non-enriched genomic libraries. After CTAB extraction with QIAquick 21
purification, we performed genome skimming, following the NEBNext Ultra II DNA Library 22
Prep Kit for Illumina (details in Supplementary Data Appendix S1). 23

8
Three reference genomes were reconstructed for the whole plastome (cpDNA, using 1
MIRA 3.4.1.1 - MITOBIM 1.7; Chevreux et al. 1999; Hahn et al. 2013), the nuclear ribosomal 2
DNA (nrDNA, using NOVOplasty; Dierckxsens et al. 2017), and two mitochondrial DNA 3
regions (mtDNA NADH dehydrogenase nad5 gene and the small subunit ribosomal RNA 4
gene SSU-RNA, using ARC 1.1.4; Hunter et al. 2015). Each genomic library was then 5
mapped on these reference genomes, before SNP calling, VCF filtering, and conversion to 6
fasta multi-alignment files after removing indels and heterozygous sites as detailed in 7
Appendix S2. 8
9
Phylogenomic analyses 10
To estimate the divergence time of current P. latifolius/milanjianus lineages, we generated 11
dated gene phylogenies in BEAST 1.8.2 (Drummond and Rambaut 2007) using the CIPRES 12
platform (Miller et al. 2011) for the cpDNA, nrDNA, and mtDNA datasets (n = 71, 82, 60 13
respectively, including outgroups taxa, as detailed in Tables 1 and S1), assuming the 14
following evolutionary sites models GTR, HKY+I, and GTR+G respectively, according to 15
JMODELTEST 2.1.7 (Darriba et al. 2012). A strict clock model and an “Extended Bayesian 16
Skyline Plot” coalescent tree model (‘mitochondrial data’ or ‘autosomal data’ with ‘linear 17
growth’ between population size change events) were applied. To time-calibrate the 18
phylogenies, the divergence between Afrocarpus and Podocarpus was set as a normally 19
distributed variable with a mean of 87.46 Myrs and a 95% HPD (Highest Posterior Density) 20
between 69.40 and 108.06 Myrs, following the divergence estimated by Quiroga et al. 2016 21
(nodes A, A’, and A’’ in Figs 2-3, S1-2, and S3-4). Five independent MCMC runs were 22
launched for 100 million generations each, sampling trees at 10,000 step intervals in order to 23
check the congruence of phylogenetic trees and divergence time estimations, before 24

9
combining them using LOGCOMBINER 1.8.2 (Drummond and Rambaut 2007). We used 1
TRACER 1.6 (Drummond and Rambaut 2007) to assess convergence, estimate Effective 2
Sample Sizes (ESS), and examine the posteriors of all the parameters. Mean heights were 3
taken in TREEANNOTATOR 1.4.8 (Drummond and Rambaut 2007), and trees were plotted in 4
FIGTREE 1.1.2 (http://tree.bio.ed.ac.uk/software/figtree/). Bayesian skyline plot were used to 5
graphically represent changes in coalescent rate through time (IICR, Inverse Instantaneous 6
Coalescence Rate; Chikhi et al. 2018), which is classically interpreted as underlying changes 7
of the effective size of a panmictic population (Ho and Shapiro 2011). 8
In addition, a network analysis of each reconstructed DNA region was undertaken 9
from a NeighborNet analysis using SPLITSTREE 4.14.2 (Huson and Bryant 2006), with 10
mapping of phylogroups using QGIS 2.18 (http://qgis.osgeo.org). Phylogroups were defined to 11
encompass closely related haplotypes (well supported clades in general) or isolated 12
haplotypes, combining phylogenetic and geographic coherence. 13
Three geographic groups of P. latifolius/milanjianus samples were also delineated 14
according to the main gene flow barriers detected: North-West (Cameroon), South-West 15
(Angola and Republic of the Congo), and East-South (remaining countries from Kenya to 16
South Africa). We computed Tajima’s D statistics (Tajima 1989) and nucleotide diversity (π) 17
for each group, as well as mean genetic distances between groups using MEGA 10.0.5 (Kumar 18
et al. 2016). 19
20
21
22
23
24

10
RESULTS 1
Sequence data and reference genomes 2
We obtained on average 3,089,119 R1-R2 reads per sample (SD = 1,465,677). Our 3
reconstructed references for P. latifolius/milanjianus reached 134,031 bp for the plastome, 4
which lacked one of the large inverted repeat regions as evidenced for the Neotropical P. 5
lambertii (Vieira et al. 2014), 7,890 bp for the nrDNA, 6,026 bp for the mtDNA nad5 gene, 6
and 2,330 bp for the SSU-RNA region (Supplementary Data Tables S1-S2). After mapping 7
each sample on these four references, and filtering out samples with >10% missing data, the 8
average proportions of mapped reads reached, respectively, 1.96%, 0.19%, 0.08% and 0.11%, 9
and the depth reached, respectively, 52X (n = 71), 75X (n = 82), 47X (n = 77) and 33X (n = 10
61) (Table S2). The numbers of SNPs detected over all samples decreased a lot after 11
excluding outgroup taxa: from 4152 to 212 SNPs for cpDNA, from 206 to 18 SNPs for 12
nrDNA, from 583 to 35 SNPs for nad5 and SSU-RNA mtDNA after concatenating data from 13
the two mtDNA references (Tables 1 and S3). 14
15
Phylogeographic pattern and molecular dating 16
The age of the crown node of the current lineages of P. latifolius/milanjianus ranged from 17
0.86 Myrs (95% HPD: 0.54-1.17 Myrs; Fig. 2) using plastomes, to 1.74 Myrs (95% HPD: 18
0.55-3.08 Myrs; Fig. S1) using nrDNA data, and to 1.17 Myrs (95% HPD: 0.52-1.87 Myrs; 19
Fig. S3) using mtDNA data. High support (PP>0.9) was obtained for 37% of the nodes of the 20
plastid phylogenetic tree (Fig. 2B) but for only 5% and 12% of the nodes of the nrDNA and 21
mtDNA trees (Figs S1B, S3B), reflecting their lower number of SNPs (Table 1). The 22
NeighborNet networks of the P. latifolius/milanjianus sequences presented star-like structures 23
for all the three genomes (Figs 3B, S2B, S4B). 24

11
For cpDNA, we identified six plastid phylogroups (CP) relatively well geographically 1
circumscribed (Fig. 3A), although two of them received low support (Fig. 2), plus five 2
isolated samples that were also numbered. The two oldest nodes (C dated to 0.86 Myrs and D 3
to 0.45 Myrs; Fig. 2B) isolated two samples coming from eastern D. R. Congo (CP 01) and 4
South Africa (CP 02) respectively, while the next oldest node (E is 0.31 Myrs, Fig 2B) 5
included all the phylogroups identified. Phylogroups CP 04, CP 05 and CP 09 were 6
distributed in eastern and south-eastern Africa with some degree of overlapping, whereas the 7
sister phylogroups CP 10 and CP 11 were exclusively found in the western part of Central 8
Africa, distributed in Cameroon (CP 10) and from Angola to the Republic of the Congo (CP 9
11). This main east-west genetic divergence was confirmed by the highest mean genetic 10
distances calculated between eastern and western populations of P. latifolius/milanjianus 11
(Table S4). The phylogroup CP 06 was more northerly distributed in Cameroon, Equatorial 12
Guinea, eastern D.R. Congo, and Tanzania. However, the low posterior probabilities for 13
phylogroups CP 06 (0.28) and CP 07-08 (0) prevented us from establishing their phylogenetic 14
relationship with other CP phylogroups. If we exclude the two most early-branching 15
haplotypes (CP 01 and CP 02), it is worth noting that all major phylogroups diverged from 16
each other between 0.2 Myrs (lower 95% HPD limit at 0.13 Myrs) and 0.31 Myrs (upper 95% 17
HPD limit at 0.43 Myrs). The most recent divergence time between west and east African 18
samples (between CP 03 in Cameroon and CP 04 or CP 05) was estimated at 0.24 Myrs (95% 19
HPD: 0.16- 0.33 Myrs). 20
Regarding nrDNA and mtDNA data, their low levels of polymorphism combined with 21
their star-like networks implied that posterior probabilities of nodes were extremely low and 22
generally null (due to a low number of informative SNPs). We could delineate the two 23
earliest-branching phylogroups of nrDNA: (i) a Central African phylogroup distributed until 24

12
the Albertine Rift (NR 01), and (ii) a northerly distributed phylogroup (NR 02) in Cameroon, 1
Uganda and Kenya (Fig. S2). According to mtDNA data, the delineation of some robust 2
phylogroups was highly congruent with those found from cpDNA data: MT 01-02 and CP 01-3
02, MT03 and CP 09, MT 05b and CP 04, MT 06b and CP 10, MT 07b and CP 04 (Figs 2-3 4
and S3-4). This congruence could imply a same mode of uniparental transmission of the two 5
organelles, although paternal inheritance of chloroplasts (Vieira et al. 2014) and maternal 6
inheritance of mitochondria are often assumed in gymnosperms (Petit and Vendramin 2007). 7
8
Demographic inferences and genetic diversity gradients 9
Bayesian skyline plots were congruent between genomic datasets, showing a ten-fold increase 10
of coalescence rate between c. 200 kyrs ago compared to the present (i.e. inferred Ne ten 11
times lower 200 kyrs ago), which could result from a demographic and range expansion after 12
a bottleneck event (Figs 2C, S1C, S3C). There was no evidence of a recent increase in 13
coalescence rate (demographic decline) that we hypothesized given the low current population 14
sizes in several regions. Congruently with the apparent demographic expansion inferred by 15
the skyline plots, Tajima's D statistics were very negative across populations at the species 16
scale (most values <-2; Table 1) and also considering only East and South African samples 17
and, to a lower extent, western samples (Table S3). For all genomes, nucleotide diversity 18
decreased from South and East Africa to North-West (Cameroon) and to South-West (Angola 19
and Republic of the Congo) (Table S3), suggesting a more recent origin of the later 20
populations. 21
22
23
DISCUSSION 24

13
Species delimitation 1
Our phylogenomic data show that a large number of SNPs separates Afrocarpus from 2
Podocarpus, consistently with the ancient divergence dated between 82.6 and 87.5 Myrs 3
between Podocarpus and its sister group including Afrocarpus, Nageia and Retrophyllum 4
(Quiroga et al. 2016). By contrast, the number of SNPs per genomic region decreased 10 to 5
18 times when considering only P. latifolius/milanjianus samples (Table 1). As South-African 6
samples (P. latifolius) did not form a clade separated from the other ones (P. milanjianus), we 7
confirm that the two taxa can be considered as synonyms (Fig. 2B). 8
9
Genetic diversification of P. latifolius/milanjianus during the Pleistocene 10
The current lineages of P. latifolius/milanjianus started to diverge 0.86 Myrs ago (95% HPD: 11
0.54-1.17 Myrs) according to our cpDNA results (Fig. 2), coinciding with the mid-Pleistocene 12
period, when vegetation changes in Central Africa started to follow a clear glacial-interglacial 13
alternation (Dupont et al. 2001). However, most lineages diverged more recently, 0.31 Myrs 14
ago (95% HPD: 0.19-0.43 Myrs), and eventually reached locations distant by up to c. 4,500 15
km, implying wide dispersal. Recurrent widespread colonisation of Afromontane forests in 16
lowlands, followed by their fragmentation and decline driven by climate changes, could thus 17
have played a key role in connecting fragmented montane floras, during interglacial phases 18
(Ivory et al. 2018). However, this flickering connectivity pattern does not appear so simple 19
and synchronized throughout Africa. In East Africa, the expansion of mountain glaciers 20
during the last glacial period (Osmaston and Harrison 2005) led to the downward 21
displacement of the upper treeline and Afromontane forest, so that subalpine and alpine taxa 22
expanded into low- and midlands down to 470 m around Lake Malawi (Ivory et al. 2012) and 23
1,139 m around Lake Victoria (Pinklington Bay; Kendall 1969). Such a “glacial” expansion is 24

14
not observed in Cameroon where traces of Quaternary glaciers have never been observed and 1
podocarps populations seem to have remained at their current altitudinal range during the last 2
glacial period (Lézine et al. 2019). Southwards, however, pollen data report the presence of 3
Podocarpus/Afrocarpus in Congo and also probably in Gabon during the last glacial period 4
(Elenga and Vincens 1990; Dupont et al. 2000), suggesting that podocarps considerably 5
expanded in western Central Africa south of the Equator. As P. latifolius/milanjianus is today 6
the only podocarp growing in western Central Africa (except Afrocarpus mannii, endemic to 7
São Tomé island), it can be hypothesised that it was this species which is recorded in pollen 8
data in this area. 9
The divergence times between geographically isolated lineages and the Bayesian 10
skyline plots provide compelling clues that P. latifolius/milanjianus expanded substantially 11
from c. 200 kyrs BP to reach its current distribution range; the signal of demographic 12
expansion being congruent with geographic expansion of lineages (Figs 2, S1, S3). These 13
results fit into what we know from pollen data showing that P. latifolius/milanjianus widely 14
expanded in central Africa during the wet phases of the Quaternary (Elenga and Vincens 15
1990; Dupont et al. 2000; Lézine et al. 2019). Interestingly, the apparent demographic 16
bottleneck revealed by the skyline plot c. 200 kyrs BP (Fig. 2) closely coincides with a trend 17
of reduction of pollen abundance of podocarps in Atlantic marine cores between 400 and 250 18
kyrs BP, followed by an increase (with substantial variation) between 200 and 100 kyrs BP 19
(Fig. 1B). In Prunus africana, another Afromontane tree, coalescent simulations conducted on 20
chloroplast loci also suggested that this species expanded its range and reached its current 21
distribution during the late Pleistocene, within the last 100-180 kyrs (Kadu et al. 2011). The 22
relatively recent divergence time between disconnected populations of Afromontane trees 23
located thousands of kilometres apart sharply contrasts with the ancient divergence (several 24

15
million years) reported for parapatric populations of a central African mature rain forest tree 1
species (Migliore et al. 2019), probably highlighting the contrasted population dynamics of 2
lowland and montane tree species. 3
4
Past migration routes between African mountains 5
The centre of diversity and thus the putative centre of origin of P. latifolius/milanjianus was 6
likely centred in East Africa which hosts the highest number of plastid phylogroups (Fig. 3) 7
and the most divergent sample in the cpDNA and mtDNA phylogenies (phylogroups CP/MT 8
01 – Figs 2 and S3) as well as the highest genetic diversity (Table S3). Reconstructing 9
migration routes is difficult after a fast demographic expansion followed by a drastic 10
fragmentation because DNA sequences linking regions along migration paths may have 11
disappeared or may not have accumulated enough indicative mutations. Nevertheless, P. 12
latifolius/milanjianus plastome data reveal a clear east/west phylogeographic signal dated to 13
310 kyrs BP (node E; Fig. 2). Two phylogroups are restricted to western Central Africa, in 14
Cameroon (CP 10) and from Angola to the Republic of the Congo (CP 11). Three 15
phylogroups are exclusively distributed in East Africa, either in the Western branch of the 16
East African Rift (CP 04), or in the Eastern branch and the Lake Malawi branch (CP 05), or in 17
the Eastern branch and South Africa (CP 09). Central and East African phylogroups 18
diversified during the same temporal window between 200 and 210 kyrs BP (nodes J and I: 19
95% HPD of 130-280 kyrs; Fig. 2). Despite a lower phylogenetic resolution from nrDNA 20
sequences, the phylogroup NR01 is also restricted to Central Africa, from Cameroon to 21
Angola and Zambia (Figs S1-S2). This phylogeographic pattern suggests a barrier to gene 22
flow between Central and East/South Africa, as already detected for Prunus africana 23
(Dawson and Powell 1999; Kadu et al. 2011). Such east-west phylogeographic breaks were 24

16
also reported for non-montane species in Adansonia digitata (Pock Tsy et al. 2009), and in 1
several savannah ungulates and carnivores (Bertola et al. 2016). The convergence in the 2
timing of phylogeographic divergence might indicate that the same “recent” environmental 3
changes drove the distribution of these species. 4
Two migratory tracks between East/South and West Africa received support from our 5
data. Phylogroups CP 06 (Fig. 3) and NR 02 (Fig. S2) connect Cameroon to Tanzania and 6
Kenya, respectively, supporting the hypothesis of a ”northern” migration corridor already 7
suggested by the plastid lineages shared between Cameroon and Uganda in Prunus africana 8
(Kadu et al. 2011). By contrast, phylogroups CP 05 and NR 01 support the hypothesis of a 9
southern corridor through the highlands and plateaus of Zambia, and an extension until 10
eastern D. R. Congo close to Malawi. Along the Congo-Zambezian watershed, patchily 11
distributed Afromontane forests in the southern D. R. Congo, Zambia, northern Angola and 12
Gabon could have acted as ‘stepping stones’ (White 1983, 1993). Although the exact 13
migration routes connecting Central and East/South Africa cannot be definitively determined, 14
our data are compatible with the occurrence of both northern and southern migration corridors 15
already hypothesised by White 1981, and also suggested for Delphinium dasycaulon (Chartier 16
et al. 2016). 17
Finally, plastome data suggest a barrier to gene flow between samples from Cameroon 18
(CP 10) and Angola/Congo (CP 11). This could account for the isolation of the Cameroon 19
highlands, as shown by pollen data from the last glacial period in western Central Africa. As 20
discussed by Dupont et al. (2000) and recently confirmed by Lézine et al. (2019) and 21
references therein, it is probable that the Podocarpus expansion in the lowlands during the 22
last glacial period never crossed the Equator to the North. Although several living trees of P. 23
latifolius/milanjianus currently occur at mid-altitude in Cameroon, as probable relicts of a 24

17
formerly wider distribution, there is no evidence that this expansion took place during the last 1
glacial period: P. latifolius/milanjianus was absent at that time from Lake Barombi Mbo (300 2
m asl; Maley and Brenac 1998) and Lake Monoun (1083 m asl; Lézine et al. submitted). Rare 3
pollen grains found at sites within the current elevation range of the species suggest that 4
Podocarpus populations survived only in the form of extremely restricted populations in the 5
Cameroon highlands. In this context, climate oscillations should not be considered as the only 6
driver of changes of range distribution; plant competition could also play a key role in the 7
succession of species during phases of forest expansion. It is likely that P. 8
latifolius/milanjianus does not occupy all its potential niche today. 9
10
Past dynamics of Afromontane forests 11
Phylogeographic studies on Afroalpine flora showed that gene flow between mountains is low 12
but possible even across geographic barriers (Wondimu et al. 2014) with patterns of 13
differentiation coincident or predating the glacial cycles (Gizaw, Brochmann, et al. 2016; 14
Tusiime et al. 2017). Two Afroalpine species, Erica arborea and Koeleria capensis, that also 15
extend to lower vegetation belts in the mountains show no isolation-by-distance pattern 16
(Gizaw et al. 2013; Masao et al. 2013), possibly indicating that habitat connectivity through 17
lowland corridors has been more important than long-distance dispersal. By contrast to 18
Afroalpine vegetation, Afromontane forests seem to have been better connected, as evidenced 19
by P. latifolius/milanjianus across South Africa (CP 09), across East Africa (CP 04-05), 20
across the Cameroon Volcanic Line (CP 10), between Congo and Angola (CP 11), and 21
between Central and East Africa (CP 06; Fig. 3). 22
In addition, the low levels of polymorphism detected, the star-like topology of 23
NeighborNet networks, and the wide distribution of each phylogroup are consistent with a 24

18
relatively recent and fast range expansion of P. latifolius/milanjianus. This hypothesis is 1
further supported by the apparent demographic expansion since c. 200 kyrs revealed by the 2
Bayesian skyline plots and Tajima's D statistics (Figs 2, S1, S3; Tables 1-S3). Extensive 3
lowland colonisation is consistent with palaeorecords which reveal high podocarp abundances 4
at low elevation (Ivory et al. 2018), while modern pollen samples of Podocarpus indicate that 5
high pollen grain concentration are only found close to the source trees (Maley et al. 1990; 6
Verlhac et al. 2018). Additional population genetics data would be necessary to better 7
estimate the intensity of gene flow and to assess if seed dispersal mechanisms play a crucial 8
role in shaping the distribution of genetic diversity and differentiation in Afromontane flora 9
(Gizaw, Brochmann, et al. 2016; Gizaw, Wondimu, et al. 2016; Minaya et al. 2017). We 10
should thus better evaluate the role of pollen dispersal by wind versus seed dispersal. 11
Potentially 36 frugivorous birds and mammals disperse seeds of Prunus africana over short- 12
and medium distances (Farwig et al. 2006), but whether they contributed to long-distance 13
dispersal at a subcontinental scale remains an open question. 14
Nowadays P. latifolius/milanjianus populations are generally very small, in particular 15
in western Central Africa, while the skyline plot does not display any recent increase in the 16
rate of coalescence as could be expected under strong demographic decline (Fig. 2). This 17
paradox is probably explained by two factors. First, if the demographic decline started 18
recently, during the major environmental crisis which occurred at the end of the Holocene 19
Humid Period (4.5-3.5 kyrs ago; Vincens et al. 1999; Lézine, Holl, et al. 2013) as suggested 20
by pollen records (Lézine, Assi-Kaudjhis, et al. 2013), it is maybe too early to detect a genetic 21
signature. Second, coalescence rate can increase between samples at a local scale due to 22
demographic decline but not between distant samples in the absence of gene flow, while our 23
samples are widely distributed. This is related to the problematic interpretation of skyline 24

19
plots in terms of demographic changes when there is a strong spatial genetic structure (Chikhi 1
et al. 2018). Hence, further studies must be conducted at a local scale to possibly detect recent 2
population declines. 3
4
CONCLUSIONS 5
A long-standing question in African biogeography is whether colonisation of the mountains 6
and subsequent intermountain gene flow mainly depend on long-distance dispersal across 7
unsuitable lowland habitat or on intermittent suitable habitat bridges (Kebede et al. 2007; 8
Mairal et al. 2017). Podocarpus latifolius/milanjianus seems to illustrate that migration has 9
been possible through habitat bridges under more suitable climates in the past, when the 10
montane forest habitat extended to lower elevation than today. Despite the ancient history of 11
podocarps in Africa revealed by palaeobotanical records, the extended distribution of current 12
P. latifolius/milanjianus lineages is shown to result from a more recent history, mostly during 13
the mid-late Pleistocene. Phylogenomic analyses support the hypothesis that the Afromontane 14
forests were once far more widespread and continuous, and that the current patches are a 15
result of recent fragmentation, probably too recent to be detected at the genomic scale. 16
Finally, this work highlights the resilience of Afromontane forests during previous drastic 17
climate changes but questions also the complex history of these hotspots of biodiversity such 18
as the Cameroon volcanic line where several lineages still persist and could represent 19
successive waves of migration more or less ancient. 20
21
22
20
ACKNOWLEDGEMENTS 1
This study was financially supported by the BELMONT FORUM research program VULPES 2
(ANR-15-MASC-0003), the BRAIN-be BELSPO research program BR/132/A1/AFRIFORD, 3
and the Fonds de la Recherche Scientifique (F.R.S.-FNRS, grants J.0143.15 and J.0292.17). 4
Thanks are due to Rachid Cheddadi (CNRS Montpellier), Arthur Boom and Esra Kaymak 5
(ULB-EBE) for their constructive discussions, and to Laurent Grumiau (ULB-EBE Molecular 6
Biology platform, Belgium), Latifa Karim and Wouter Coppieters (GIGA Liège, Belgium) for 7
their advices in genomics. Special thanks go to Michel Veuille (ANR IFORA) for his helpful 8
comments on the manuscript. Finally, friendly thanks to all the colleagues who have 9
participated in the sampling for several years: Gaël Bouka, Vincent Droissart, João 10
Farminhão, Alexandra Ley, Francisco Maiato, Franck Kameni Monthe, Olivier-Valérie Séné, 11
Tariq Stévart, with special thanks to Claire Micheneau and Rosalía Piñeiro (the first to study 12
Podocarpus), Stephen F. Omondi and Priscilla N. Kimani from the Kenya Forestry Research 13
Institute, Barthélemy Tchiengué and Gaston Achoundong from the National Herbarium of 14
Cameroon, and Lawrence Wagura in Kenya. For herbarium material, we sincerely thank the 15
Botanic Garden Meise (BR; Steven Janssens and Samuel Vanden Abeele), the Herbarium and 16
Library of African Botany at the Université Libre de Bruxelles (BRLU; Tariq Stevart and 17
Geoffrey Fadeur), and the Muséum National d’Histoire Naturelle (P; Myriam Gaudeul). For 18
pollen data, we acknowledge the African Pollen Database and Pangaea.de. For distribution 19
data we thank GBIF.org (26th
January 2019 - GBIF Occurrence Download), and the Conifers 20
of the world database (https://herbaria.plants.ox.ac.uk/bol/conifers). 21
22
23

21
DATA ACCESSIBILITY 1
- Sampling locations are available as supporting information. 2
- Reference cpDNA, nrDNA, and mtDNA regions of Podocarpus latifolius/milanjianus are 3
available in GenBank and their accession numbers as supporting information. 4
- Fasta alignments are available on request. 5
6
SUPPLEMENTARY DATA 7
Supplementary data are available online at https://academic.oup.com/aob and consist of the 8
following. 9
10
APPENDIX S1. DNA extraction, genomic libraries preparation, and sequencing 11
12
APPENDIX S2. Bioinformatic treatment 13
14
FIG. S1. Phylogenetic relationships and tempo of diversification of Podocarpus 15
latifolius/milanjianus, using nuclear ribosomal DNA data 16
17
FIG. S2. Geographic distribution of nuclear ribosomal phylogroups (NR) of Podocarpus 18
latifolius/milanjianus with their NeighborNet representation 19
20
FIG. S3. Phylogenetic relationships and tempo of diversification of Podocarpus 21
latifolius/milanjianus, using mitochondrial DNA data 22
23
FIG. S4. Geographic distribution of mitochondrial phylogroups (MT) of Podocarpus 24
latifolius/milanjianus with their NeighborNet representation 25
26
TABLE S1. Characteristics of samples of Podocarpus latifolius/milanjianus used for genome 27
skimming 28
29
TABLE S2. Assembling and mapping statistics of plastid, ribosomal and mitochondrial DNA 30
regions reconstructed from genomic libraries of Podocarpus latifolius/milanjianus 31
32
TABLE S3. Diversity and Tajima statistics for plastid, ribosomal and mitochondrial DNA 33
regions reconstructed from genomic libraries of Podocarpus latifolius/milanjianus 34
35
TABLE S4. Mean distances between African geographic groups for plastid, ribosomal and 36
mitochondrial DNA regions of Podocarpus latifolius/milanjianus 37
38

22
LITERATURE CITED 1
Adeonipekun PA, Sowunmi MA, Richards K. 2017. A new Late Miocene to Pleistocene 2
palynomorph zonation for the western offshore Niger Delta. Palynology 41: 2–16. 3
Adie H, Lawes MJ. 2011. Podocarps in Africa: temperate zone relicts or rainforest 4
survivors? In: Turner BL, Cernusak LA, eds. Ecology of the Podocarpaceae in tropical 5
forests. Smithsonian Institution Scholarly Press, 79–100. 6
Aubréville A. 1976. Centres tertiaires d’origine, radiations et migrations des flores 7
angiospermiques tropicales. Adansonia 2: 297–354. 8
Ayele TB, Gailing O, Umer M, Finkeldey R. 2009. Chloroplast DNA haplotype diversity 9
and postglacial recolonization of Hagenia abyssinica (Bruce) J.F. Gmel. in Ethiopia. Plant 10
Systematics and Evolution 280: 175–185. 11
Barker NP, Muller EM, Mill RR. 2004. A yellowwood by any other name: molecular 12
systematics and the taxonomy of Podocarpus and the Podocarpaceae in southern Africa. 13
South African Journal of Science 100: 629–632. 14
Bertola LD, Jongbloed H, van der Gaag KJ, et al. 2016. Phylogeographic patterns in 15
Africa and high resolution delineation of genetic clades in the Lion (Panthera leo). Scientific 16
Reports 6: 30807. 17
Boaz NT, Bernor RL, Brooks AS, et al. 1992. A new evaluation of the significance of the 18
Late Neogene Lusso Beds, Upper Semliki Valley, Zaire. Journal of Human Evolution 22: 19
505–517. 20
Bonnefille R. 2010. Cenozoic vegetation, climate changes and hominid evolution in tropical 21
Africa. Global and Planetary Change 72: 390–411. 22
Chala D, Zimmermann NE, Brochmann C, Bakkestuen V. 2017. Migration corridors for 23
alpine plants among the ‘sky islands’ of eastern Africa: do they, or did they exist? Alpine 24
Botany 127: 133–144. 25
Chartier M, Dressler S, Schönenberger J, et al. 2016. The evolution of afro-montane 26
Delphinium (Ranunculaceae): morphospecies, phylogenetics and biogeography. Taxon 65: 27
1313–1327. 28
Chevreux B, Wetter T, Suhai S. 1999. Genome sequence assembly using trace signals and 29
additional sequence information. In: German conference on bioinformatics. Citeseer, 45–56. 30
Chikhi L, Rodríguez W, Grusea S, Santos P, Boitard S, Mazet O. 2018. The IICR (inverse 31
instantaneous coalescence rate) as a summary of genomic diversity: insights into demographic 32
inference and model choice. Heredity 120: 13–24. 33
Coetzee JA. 1980. Tertiary environmental changes along the south-western African coast. 34
Palaeontologia Africana 23: 197–203. 35

23
Darriba D, Taboada GL, Doallo R, Posada D. 2012. jModelTest 2: more models, new 1
heuristics and parallel computing. Nature Methods 9: 772. 2
Dawson IK, Powell W. 1999. Genetic variation in the Afromontane tree Prunus africana, an 3
endangered medicinal species. Molecular Ecology 8: 151–156. 4
Dierckxsens N, Mardulyn P, Smits G. 2017. NOVOPlasty: de novo assembly of organelle 5
genomes from whole genome data. Nucleic Acids Research 45: e18. 6
Drummond AJ, Rambaut A. 2007. BEAST: Bayesian evolutionary analysis by sampling 7
trees. BMC Evolutionary Biology 7: 214–222. 8
Dupont LM, Caley T, Kim J-H, Castañeda I, Malaizé B, Giraudeau J. 2011. Glacial-9
interglacial vegetation dynamics in South Eastern Africa coupled to sea surface temperature 10
variations in the Western Indian Ocean. Climate of the Past 7: 1209–1224. 11
Dupont LM, Donner B, Schneider R, Wefer G. 2001. Mid-Pleistocene environmental 12
change in tropical Africa began as early as 1.05 Ma. Geology 29: 195–198. 13
Dupont LM, Jahns S, Marret F, Ning S. 2000. Vegetation change in equatorial West 14
Africa: time-slices for the last 150 ka. Palaeogeography, Palaeoclimatology, Palaeoecology 15
155: 95–122. 16
Dupont LM, Marret F, Winn K. 1998. Land-sea correlation by means of terrestrial and 17
marine palynomorphs from the equatorial East Atlantic: phasing of SE trade winds and the 18
oceanic productivity. Palaeogeography, Palaeoclimatology, Palaeoecology 142: 51–84. 19
Elenga H, Vincens A. 1990. Paléoenvironnements quaternaires récents des plateaux Bateke 20
(Congo) : étude palynologique des dépôts de la dépression du bois de Bilanko In: Lanfranchi 21
R, Schwartz D, eds. Didactiques. Paysages quaternaires de l’Afrique centrale atlantique. 22
Paris: ORSTOM, 271–282. 23
Farwig N, Böhning-Gaese K, Bleher B. 2006. Enhanced seed dispersal of Prunus africana 24
in fragmented and disturbed forests? Oecologia 147: 238–252. 25
Flantua SGA, O’Dea A, Onstein RE, Giraldo C, Hooghiemstra H. 2019. The flickering 26
connectivity system of the north Andean páramos. Journal of Biogeography, in press. 27
Gehrke B, Linder HP. 2009. The scramble for Africa: pan-temperate elements on the 28
African high mountains. Proceedings of the Royal Society Biological Sciences 276: 2657–29
2665. 30
Gehrke B, Linder HP. 2014. Species richness, endemism and species composition in the 31
tropical Afroalpine flora. Alpine Botany 124: 165–177. 32
Geldenhuys CJ. 1993. Reproductive biology and population structures of Podocarpus 33
falcatus and P. latifolius in southern Cape forests. Botanical Journal of the Linnean Society 34
112: 59–74. 35

24
Gichira AW, Li Z-Z, Saina JK, et al. 2017. Demographic history and population genetic 1
structure of Hagenia abyssinica (Rosaceae), a tropical tree endemic to the Ethiopian 2
highlands and eastern African mountains. Tree Genetics & Genomes 13: 72. 3
Gizaw A, Brochmann C, Nemomissa S, et al. 2016. Colonization and diversification in the 4
African ‘sky islands’: insights from fossil-calibrated molecular dating of Lychnis 5
(Caryophyllaceae). New Phytologist 211: 719–734. 6
Gizaw A, Kebede M, Nemomissa S, et al. 2013. Phylogeography of the heathers Erica 7
arborea and E. trimera in the afro-alpine ‘sky islands’ inferred from AFLPs and plastid DNA 8
sequences. Flora - Morphology, Distribution, Functional Ecology of Plants 208: 453–463. 9
Gizaw A, Wondimu T, Mugizi TF, et al. 2016. Vicariance, dispersal, and hybridization in a 10
naturally fragmented system: the afro-alpine endemics Carex monostachya and C. 11
runssoroensis (Cyperaceae). Alpine Botany 126: 59–71. 12
Goldblatt P. 1978. An analysis of the flora of Southern Africa: its characteristics, 13
relationships, and origins. Annals of the Missouri Botanical Garden 65: 369–436. 14
Hahn C, Bachmann L, Chevreux B. 2013. Reconstructing mitochondrial genomes directly 15
from genomic next-generation sequencing reads—a baiting and iterative mapping approach. 16
Nucleic Acids Research 41: e129–e129. 17
Hedberg O. 1969. Evolution and speciation in a tropical high mountain flora. Biological 18
Journal of the Linnean Society 1: 135–148. 19
Ho SYW, Shapiro B. 2011. Skyline-plot methods for estimating demographic history from 20
nucleotide sequences. Molecular Ecology Resources 11: 423–434. 21
Hoetzel S, Dupont LM, Wefer G. 2015. Miocene–Pliocene vegetation change in south-22
western Africa (ODP Site 1081, offshore Namibia). Palaeogeography, Palaeoclimatology, 23
Palaeoecology 423: 102–108. 24
Hunter SS, Lyon RT, Sarver BAJ, Hardwick K, Forney LJ, Settles ML. 2015. Assembly 25
by Reduced Complexity (ARC): a hybrid approach for targeted assembly of homologous 26
sequences. bioRxiv: 014662. 27
Huson DH, Bryant D. 2006. Application of phylogenetic networks in evolutionary studies. 28
Molecular Biology and Evolution 23: 254–267. 29
Ivory SJ, Lézine A-M, Vincens A, Cohen AS. 2012. Effect of aridity and rainfall 30
seasonality on vegetation in the southern tropics of East Africa during the 31
Pleistocene/Holocene transition. Quaternary Research 77: 77–86. 32
Ivory SJ, Lézine A-M, Vincens A, Cohen AS. 2018. Waxing and waning of forests: Late 33
Quaternary biogeography of southeast Africa. Global Change Biology 24: 2939–2951. 34
Kadu CAC, Konrad H, Schueler S, et al. 2013. Divergent pattern of nuclear genetic 35
diversity across the range of the Afromontane Prunus africana mirrors variable climate of 36
African highlands. Annals of Botany 111: 47–60. 37

25
Kadu CAC, Schueler S, Konrad H, et al. 2011. Phylogeography of the Afromontane Prunus 1
africana reveals a former migration corridor between East and West African highlands. 2
Molecular Ecology 20: 165–178. 3
Kebede M, Ehrich D, Taberlet P, Nemomissa S, Brochmann C. 2007. Phylogeography 4
and conservation genetics of a giant lobelia (Lobelia giberroa) in Ethiopian and Tropical East 5
African mountains. Molecular Ecology 16: 1233–1243. 6
Kendall RL. 1969. An ecological history of the Lake Victoria Basin. Ecological Monographs 7
39: 121–176. 8
Knaap WA. 1971. A montane pollen species from the upper Tertiary of the Niger delta. 9
Journal of Mining and Geology 6: 23–29. 10
Kumar S, Stecher G, Tamura K. 2016. MEGA7: Molecular Evolutionary Genetics Analysis 11
version 7.0 for bigger datasets. Molecular Biology and Evolution 33: 1870–1874. 12
Lézine A-M, Assi-Kaudjhis C, Roche E, Vincens A, Achoundong G. 2013. Towards an 13
understanding of West African montane forest response to climate change. Journal of 14
Biogeography 40: 183–196. 15
Lézine A-M, Holl AF-C, Lebamba J, et al. 2013. Temporal relationship between Holocene 16
human occupation and vegetation change along the northwestern margin of the Central 17
African rainforest. Comptes Rendus Geoscience 345: 327–335. 18
Lézine A-M, Izumi K, Kageyama M, Achoundong G. 2019. A 90,000-year record of 19
Afromontane forest responses to climate change. Science 363: 177–181. 20
Mairal M, Sanmartín I, Herrero A, et al. 2017. Geographic barriers and Pleistocene climate 21
change shaped patterns of genetic variation in the Eastern Afromontane biodiversity hotspot. 22
Scientific Reports 7: 45749. 23
Maley J, Brenac P. 1998. Vegetation dynamics, palaeoenvironments and climatic changes in 24
the forests of western Cameroon during the last 28,000 years B.P. Review of Palaeobotany 25
and Palynology 99: 157–187. 26
Maley J, Caballe G, Sita P. 1990. Etude d’un peuplement résiduel à basse altitude de 27
Podocarpus latifolius sur le flanc congolais du massif du Chaillu. Implications 28
paléoclimatiques et biogéographiques. Etude de la pluie pollinique actuelle. Paysages 29
Quaternaires de l’Afrique centrale Atlantique: 336. 30
Masao CA, Gizaw A, Piñeiro R, et al. 2013. Phylogeographic history and taxonomy of some 31
afro-alpine grasses assessed based on AFLPs and morphometry: Deschampsia cespitosa, D. 32
angusta and Koeleria capensis. Alpine Botany 123: 107–122. 33
McCormack JE, Huang H, Knowles LL. 2009. Sky islands In: Gillespie RG, Clague DA, 34
eds. Encyclopedia of islands. University of California Press, 841–843. 35

26
Migliore J, Kaymak E, Mariac C, et al. 2019. Pre-Pleistocene origin of phylogeographical 1
breaks in African rain forest trees: new insights from Greenwayodendron (Annonaceae) 2
phylogenomics. Journal of Biogeography 46: 212–223. 3
Miller MA, Pfeiffer W, Schwartz T. 2011. The CIPRES science gateway: a community 4
resource for phylogenetic analyses In: TG ’11. Proceedings of the 2011 TeraGrid 5
Conference: Extreme Digital Discovery. New York: ACM, 41:1–41:8. 6
Minaya M, Hackel J, Namaganda M, et al. 2017. Contrasting dispersal histories of broad- 7
and fine-leaved temperate Loliinae grasses: range expansion, founder events, and the roles of 8
distance and barriers. Journal of Biogeography 44: 1980–1993. 9
Morley RJ. 2000. Origin and evolution of tropical rain forests. John Wiley & Sons. 10
Osmaston HA, Harrison SP. 2005. The Late Quaternary glaciation of Africa: a regional 11
synthesis. Quaternary International 138–139: 32–54. 12
Owen RB, Muiruri VM, Lowenstein TK, et al. 2018. Progressive aridification in East 13
Africa over the last half million years and implications for human evolution. Proceedings of 14
the National Academy of Sciences 115: 11174–11179. 15
Petit RJ, Vendramin GG. 2007. Plant phylogeography based on organelle genes: an 16
introduction In: Weiss S, Ferrand N, eds. Phylogeography of Southern European refugia. 17
Dordrecht: Springer, 23–97. 18
Pock Tsy J-ML, Lumaret R, Mayne D, et al. 2009. Chloroplast DNA phylogeography 19
suggests a West African centre of origin for the baobab, Adansonia digitata L. 20
(Bombacoideae, Malvaceae). Molecular Ecology 18: 1707–1715. 21
Quiroga MP, Mathiasen P, Iglesias A, Mill RR, Premoli AC. 2016. Molecular and fossil 22
evidence disentangle the biogeographical history of Podocarpus, a key genus in plant 23
geography. Journal of Biogeography 43: 372–383. 24
Retallack GJ. 1992. Middle Miocene fossil plants from Fort Ternan (Kenya) and evolution 25
of African grasslands. Paleobiology 18: 383–400. 26
Salard-Cheboldaeff M, Dejax J. 1991. Evidence of cretaceous to recent West African 27
intertropical vegetation from continental sediment spore-pollen analysis. Journal of African 28
Earth Sciences (and the Middle East) 12: 353–361. 29
Schwery O, Onstein RE, Bouchenak-Khelladi Y, Xing Y, Carter RJ, Linder HP. 2015. 30
As old as the mountains: the radiations of the Ericaceae. New Phytologist 207: 355–367. 31
Sklenář P, Hedberg I, Cleef AM. 2014. Island biogeography of tropical alpine floras. 32
Journal of Biogeography 41: 287–297. 33
Tajima F. 1989. Statistical method for testing the neutral mutation hypothesis by DNA 34
polymorphism. Genetics 123: 585–595. 35

27
Turner BL, Cernusak LA (Eds.). 2011. Ecology of the Podocarpaceae in Tropical Forests. 1
Smithsonian Institution Scholarly Press. 2
Tusiime FM, Gizaw A, Wondimu T, et al. 2017. Sweet vernal grasses (Anthoxanthum) 3
colonized African mountains along two fronts in the Late Pliocene, followed by secondary 4
contact, polyploidization and local extinction in the Pleistocene. Molecular Ecology 26: 5
3513–3532. 6
Verlhac L, Izumi K, Lézine A-M, et al. 2018. Altitudinal distribution of pollen, plants and 7
biomes in the Cameroon highlands. Review of Palaeobotany and Palynology 259: 21–28. 8
Vieira L do N, Faoro H, Rogalski M, et al. 2014. The complete chloroplast genome 9
sequence of Podocarpus lambertii: genome structure, evolutionary aspects, gene content and 10
SSR detection. PLOS ONE 9: e90618. 11
Vincens A, Schwartz D, Elenga H, et al. 1999. Forest response to climate changes in 12
Atlantic Equatorial Africa during the last 4000 years BP and inheritance on the modern 13
landscapes. Journal of Biogeography 26: 879–885. 14
White F. 1981. The history of the Afromontane archipelago and the scientific need for its 15
conservation. African Journal of Ecology 19: 33–54. 16
White F. 1983. Long distance dispersal, overland migration and extinction in the shaping of 17
tropical African floras. Bothalia 14: 395–403. 18
White F. 1993. Refuge theory, ice-age aridity and the history of tropical biotas: an essay in 19
plant geography. Fragmenta Floristica et Geobotanica 2: 385–409. 20
Wichura H, Bousquet R, Oberhänsli R, Strecker MR, Trauth MH. 2010. Evidence for 21
middle Miocene uplift of the East African Plateau. Geology 38: 543–546. 22
Wondimu T, Gizaw A, Tusiime FM, et al. 2014. Crossing barriers in an extremely 23
fragmented system: two case studies in the afro-alpine sky island flora. Plant Systematics and 24
Evolution 300: 415–430. 25
Zachos J, Pagani M, Sloan L, Thomas E, Billups K. 2001. Trends, rhythms, and 26
aberrations in global climate 65 Ma to present. Science 292. 27
28

28
FIGURES AND TABLE CAPTIONS 1
FIG. 1. (A) Distribution map of African Podocarpus and Afrocarpus species. Data were 2
extracted from GBIF (GBIF.org - 26 January 2019 - GBIF Occurrence Download), field 3
missions, herbarium specimens (BRLU, BR, P), the Conifers of the world database 4
(https://herbaria.plants.ox.ac.uk/bol/conifers), and scientific literature. (B) Evolution of 5
Podocarp-type pollen abundance throughout the Quaternary in three Atlantic marine cores 6
located on the map: the gravity core GIK 16827-2 and the piston core GIK16827-3 from the 7
same location off Gabon (Dupont et al. 1998), and ODP 175-1075 from the Congo fan 8
(Dupont et al. 2001). 9
10
FIG. 2. Phylogenetic relationships and tempo of diversification of Podocarpus 11
latifolius/milanjianus lineages, using plastome data. (A) Dated phylogeny including four 12
outgroup taxa (n = 71). (B) Chronogram of P. latifolius/milanjianus plastomes, and molecular 13
dating of nodes A-M, including 95% highest posterior densities (HPD) and posterior 14
probabilities (PP). Nodes with a diamond symbol have a PP > 0.90. The main CP phylogroups 15
are represented by different coloured symbols, and five isolated samples are represented by 16
black stars and numbered as are phylogroups. (C) Inference of the inverse instantaneous 17
coalescence rate (IICR) through time using the Bayesian Skyline plot approach in BEAST, 18
expressed as the product of the effective population size Ne of panmictic population and the 19
generation time t (logarithmic scale). 20
21
FIG. 3. Geographic distribution of plastome phylogroups (CP) of Podocarpus 22
latifolius/milanjianus (A) with their NeighborNet representation (B). Countries are 23
represented by their alpha-2-character alphabetic codes (ISO 3166). 24
29
1
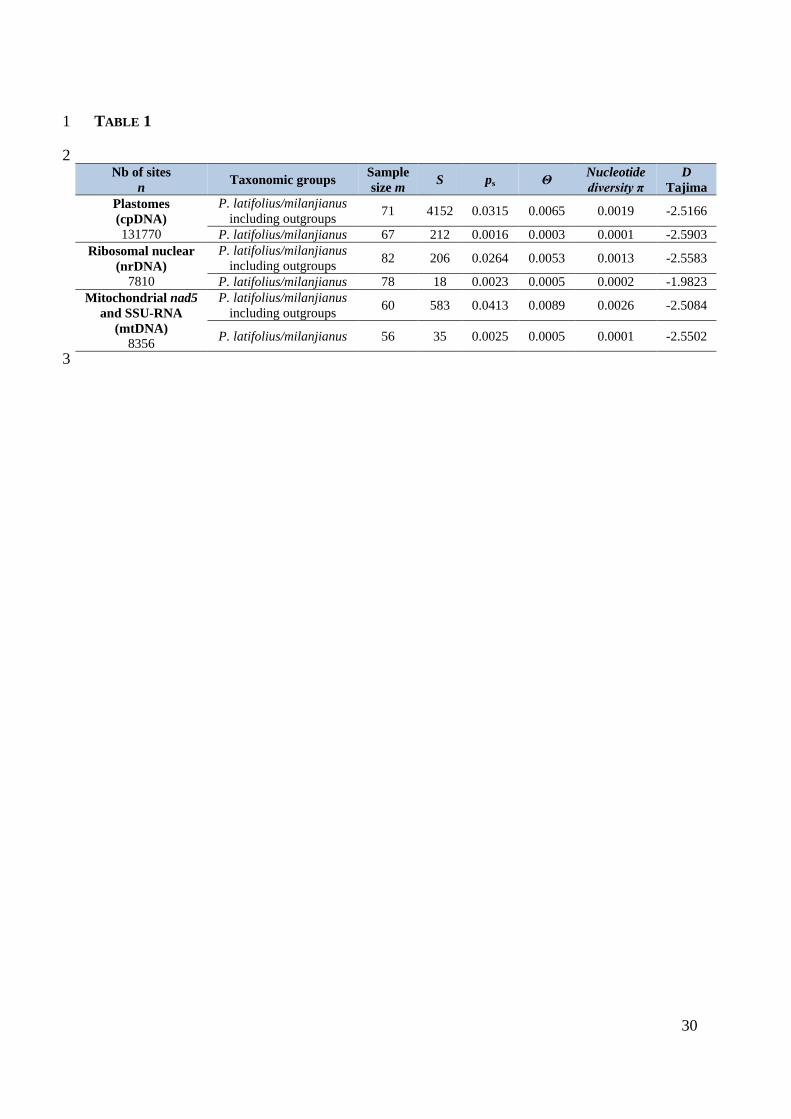
TABLE 1. Diversity and Tajima statistics for plastid, ribosomal and mitochondrial DNA 2
regions of Podocarpus latifolius/milanjianus. The following genomic indices were calculated 3
using MEGA 10.0.5 (Kumar et al. 2016) after pairwise deletion: total number of sites (n), 4
number of sequences (m), number of segregating sites (S), proportion of variable sites (ps = 5
S/n), mean estimate of the expected number of single nucleotide polymorphisms between two 6
DNA sequences under the neutral mutation model (Θ = ps/a1), nucleotide diversity as the 7
mean number of pairwise differences (π), and the Tajima statistic (D). 8
9
30
TABLE 1 1
2 Nb of sites
n Taxonomic groups
Sample
size m S ps Θ
Nucleotide
diversity π
D
Tajima
Plastomes
(cpDNA)
131770
P. latifolius/milanjianus
including outgroups 71 4152 0.0315 0.0065 0.0019 -2.5166
P. latifolius/milanjianus 67 212 0.0016 0.0003 0.0001 -2.5903
Ribosomal nuclear
(nrDNA)
7810
P. latifolius/milanjianus
including outgroups 82 206 0.0264 0.0053 0.0013 -2.5583
P. latifolius/milanjianus 78 18 0.0023 0.0005 0.0002 -1.9823
Mitochondrial nad5
and SSU-RNA
(mtDNA)
8356
P. latifolius/milanjianus
including outgroups 60 583 0.0413 0.0089 0.0026 -2.5084
P. latifolius/milanjianus 56 35 0.0025 0.0005 0.0001 -2.5502
3

Podocarpus la�folius/milanjianus
Podocarpus henkelii
Podocarpus elongatus
Afrocarpus spp.GIK 16867ODP 175-1075AB Eleva�on (km)02200 km
N

Afrocarpus falcatus (Kenya)Afrocarpus usambarensis (Tanzania)Podocarpus elongatus (S. Africa) 01-0306050411100907-08HGFEDC CA B JBA IPodocarpus la�folius/milanjianusPlastome phylogroups CP80 70 60 50 40 30 20 10 0 Myrs0.8 0.7 0.6 0.5 0.4 0.3 0.2 0.1 0 MyrsNodesABCDEFGHIJKLM Age (95% HPD)85.13 (62.55-105.42)5.58 (4.03-7.15)0.86 (0.54-1.17)0.45 (0.29-0.64)0.31 (0.19-0.43)nana0.24 (0.16-0.33)0.21 (0.13-0.28)0.20 (0.13-0.28)0.19 (0.11-0.28)0.16 (0.10-0.22)0.15 (0.09-0.22) PP1.001.001.001.001.000.280.010.901.001.000.960.941.00 K LMC 1001010.195% HPDMedian
Coalescent rate (IICR)
(calibra�on node)
Podocarpus la�folius/milanjianus
Afrocarpus falcatus (S. Africa)

01200 km
N
CM UG KEZMZAAONG GAGN ZW MZMWBIRWCDCG TZA 08 0703 02BPodocarpus la�folius/milanjianusPlastome phylogroups CPCA
MER
OON VOLCANIC
LINE
EAST
AFRICAN RIFT Eleva�on (km)02