the relation between propagation paths of barometric waves …
TRANSCRIPT

Proceedings of the 22nd IAHR-APD Congress 2020, Sapporo, Japan
1
THE RELATION BETWEEN PROPAGATION PATHS OF BAROMETRIC WAVES OVER THE EAST CHINA SEA AND SEA-LEVEL FLUCTUATIONS OFF THE WEST COAST OF KYUSHU, JAPAN
TOMONORI SAITA Kagoshima University, Kagoshima, Japan, [email protected]
TORU YAMASHIRO Kagoshima University, Kagoshima, Japan, [email protected]
ABSTRACT
Secondary undulations caused by meteorological disturbances over the East China Sea are frequently observed in the sea areas off the west coast of Kyushu Island, Japan. In this study, numerical analyses were carried out to determine the relationship between the propagation paths of barometric waves over the East China Sea and characteristics of sea-level fluctuations in these sea areas. The results indicate that a drastic increase in the propagation velocity causes a strong reflection of water surface waves at the Okinawa Trough (a back-arc basin with a section more than 1000 m deep and approximately 200 km wide) and that this is an important factor affecting the behavior of the waves at the edge of the trough. Therefore, the magnitude of sea-level fluctuations off Kyushu Island strongly depends on the relationship between the propagation path of the barometric wave and the Okinawa Trough, specifically the incident angle and position of the wave relative to the trough. The results also suggest that the propagation paths of barometric waves have a significant influence on the timing of peaks in sea-level fluctuations in the sea areas off Meshima Island, Uji Island, Nagasaki, Kami-Koshiki Island, and Makurazaki. In some cases, the peak in sea-level fluctuations may occur around 4 h earlier off Kyushu Island than that off Meshima Island, which is located on the west side of the Okinawa Trough.
Keywords: Numerical simulation, Meteorological tsunami, Atmospheric pressure wave, East China Sea
1. INTRODUCTION
A meteorological tsunami, also called a meteotsunami, is a phenomenon similar to earthquake-generated tsunamis which is caused by the progress of atmospheric disturbances such as fronts, gravity waves, and pressure jumps (Hibiya and Kajiura, 1982; Monserrat, 1991; Mercer, 2002). Normally, resonance occurs when the speed of atmospheric disturbances coincides with the speed of ocean waves, leading to a meteotsunami (Renault, 2011; Vilibić et al., 2008; Monserrat et al., 2006). Semi-closed waters have a natural period, and strong amplification occurs when the period of ocean waves matches the natural period of the waters. This amplification can result in damage such as coastal flooding. The process of occurrence and development of meteotsunamis is detailed in Monserrat (2006) and NOAA (2014). The susceptibility of a geographical location to meteotsunamis is governed by factors such as seafloor topography, coastline shape, and the presence of landforms that affect the occurrence of atmospheric turbulences. Places that are particularly susceptible to these events include the port of Longkou on the coast of Bohai Bay in China (Wang et al., 1987), the northern and central parts of the Adriatic Sea (e.g., Vilibić and Šepić, 2009; Vučetić et al., 2009), and the Balearic Islands and the eastern part of the Iberian Peninsula in Spain (Garcies et al., 1996; Rabinovich and Monserrat, 1996, 1998; and many others).
Off the west coast of Kyushu Island (place names are summarized in Figures 1–3), secondary undulations, locally called “Abiki,” are frequently observed from winter to spring. In particular, Nagasaki Bay, in the northwestern part of Kyushu Island (hereinafter, Kyushu), experiences unusually frequent occurrences of secondary undulations. On 31 March 1979, a secondary undulation with a maximum wave height of almost 3 m caused catastrophic damage to the area around Nagasaki Bay. Additionally, secondary undulations have been reported in southwest Kyushu, for example, off Kami-Koshiki Island and Makurazaki (Akamatsu, 1982; Odamaki et al., 1982). From 24–26 February 2009, a secondary undulation with a total amplitude of about 3 m damaged embankments and marine structures, capsized fishing boats, and flooded houses around Urauchi Bay, Kami-Koshiki Island (Kakinuma et al., 2009).
Pressure disturbances over the East China Sea are thought to cause the long-period waves that lead to secondary undulations off the coast of Kyushu (Odamaki et al., 1982; Hibiya and Kajiura, 1982). There is an urgent need to take measures to prevent serious damage from secondary undulations. However, it is difficult to prevent the generation of long-period waves in the East China Sea and the propagation of long-period waves toward the

2
coast of Kyushu. To prevent serious damage, hardware measures such as installing structures to reduce secondary undulations or strengthening harbor facilities are necessary, but such measures are limited by costs. Meanwhile, if the occurrence of secondary undulations could be predicted, it would be possible to mitigate damage by moving ships to safe sea areas and appropriately operating floodgates. Tanaka et al. (2012) attempted to predict secondary undulations along the west coast of Kyushu using numerical forecasting data from the Japan Meteorological Agency.
Ikeda et al. (2014) examined the feasibility of monitoring the sea level at Meshima in the Danjyo archipelago in order to forecast secondary undulations, and reported that the power of sea level fluctuations at Meshima is a good index for evaluating the possibility of secondary undulations off the west coast of Kyushu. On the other hand, Kamiuto et al. (2017) reported that the time between sea level fluctuations above a certain level at Meshima and peaks in secondary undulation along the coast of Kyushu varies by several hours. Additionally, Matsuo and Asano (2015) pointed out that the arrival time and magnitude of sea level fluctuations along the coast of Kyushu are strongly affected by changes in the propagation direction of long-period waves at the Okinawa Trough. These findings indicate that it is necessary to accumulate knowledge of these phenomena by systematically examining the relationship between the characteristics of barometric waves over the East China Sea and the occurrence of secondary undulations off the west coast of Kyushu. Accordingly, in this study, the relationship between the propagation path of barometric waves in the East China Sea and the characteristics of sea level fluctuations occurring along the Kyushu coast was investigated by numerical analyses.
Figure 1. Location of the study area (dashed rectangle).
Figure 2. Calculational domain.
(This area corresponds to the dashed rectangle in Fig. 1.) Figure 3. Water-level monitoring points.
(This area corresponds to the dashed rectangle in Fig. 2.)
2. OUTLINE OF NUMERICAL CALCULATIONS
2.1 Setting of domain and boundary
In this study, the Princeton Ocean Model (Blumberg and Mellor, 1987) was used. The calculation domain was an area along the west coast of Kyushu and the East China Sea between 120°00′00′′E and 131°28′00′′E and between 26°00′00′′N and 35°30′00′′N, as shown in Figures 1 and 2. The sizes of ∆x and ∆y in the calculation grid were set to 1/30°. The number of grid cells was 344 in the east–west direction and 285 in the north–south direction. The number of layers in the vertical direction was set to 20. The calculation time intervals were 0.5 s
120˚ 125˚ 130˚ 135˚ 140˚ 145˚25˚
30˚
35˚
40˚
45˚
0 400 800
km
East China Sea
Pacific Ocean
Japan
Sea of Japan
120˚ 122˚ 124˚ 126˚ 128˚ 130˚26˚
28˚
30˚
32˚
34˚
0 200 400
km
East China Sea
Jeju
Oki
naw
a Tr
ough
Kyushu
-6000
-4000
-2000
0Depth (m)
128˚ 129˚ 130˚ 131˚30˚
31˚
32˚
33˚
34˚
Nagasaki
MeshimaKami-Koshiki
Makurazaki
Uji
-1000
-500
0Depth (m)

3
for the external mode and 2.0 s for the internal mode. The salinity and water temperature were kept constant throughout the calculation domain at 34 and 20 °C, respectively. There seasons were assumed to be winter and spring when secondary undulations occur frequently. All open boundaries were set for radiation conditions and all land boundaries were set as complete reflection conditions.
Sea level fluctuations caused by the propagation of barometric waves in the calculation domain were evaluated. Monitoring points for sea level fluctuations were set in the waters off Nagasaki, Kami-Koshiki, Makurazaki, Meshima, and Uji, as shown in Figure 3. Of these locations, Nagasaki, Kami-Koshiki, and Makurazaki are representative points along the coast of Kyushu and are places where secondary undulations occur frequently. On the other hand, Meshima and Uji were selected as front-line sites for detecting long-period waves propagating from the East China Sea in advance, because these sites are expected to be usable for a secondary undulation forecasting off the west coast of Kyushu in the future.
2.2 Modeling of barometric waves
The shape of the barometric waves (that is, the spatial pressure distribution) used in the calculation was determined by referring to the scale and shape of the barometric waves used in the previous studies of Hibiya and Kajiura (1982) and Matsuo and Asano (2015). As shown in Figure 4, the pressure increases by 3 hPa in the 30 km in front of the crest of the propagating wave and decreases to the background pressure in the 150 km behind the crest. The width of the barometric wave is 270 km.
The azimuth angle (θa) of the direction of propagation of the barometric waves was set to 90°, 78.75°, and 67.5°,
as shown in Figure 5. The velocity (Cp) of the barometric waves was set to 110 km/h based on a study by Saida and Asano (2011). When applying the barometric waves to the calculation region, the pressure at the start of the calculation was set to 0 hPa over the entire calculation region and was then gradually changed to the pressure distribution described above over 3 h from the start of the calculation. The barometric wave was diminished east of 129 o E, and the wave disappeared before reaching the open boundary. We consider 17 cases of propagating barometric waves: Cases 1-1 to 1-6, Cases 2-1 to 2-6, and Cases 3-1 to 3-5, where the first number corresponds to azimuth angle and the second number corresponds to latitude (see Fig. 5).
Figure 4. Shape of the barometric waves used in the calculations.
(a) θa = 90°: Case 1-1 to Case 1-6 (b) θa = 78.75°: Case 2-1 to Case 2-6 (c) θa = 67.5°: Case 3-1 to Case 3-5
Figure 5. Angles of the propagation directions of the barometric waves (θa) used in the calculations.
3. CALCULATION RESULTS
3.1 Behavior of water surface disturbances induced by barometric waves
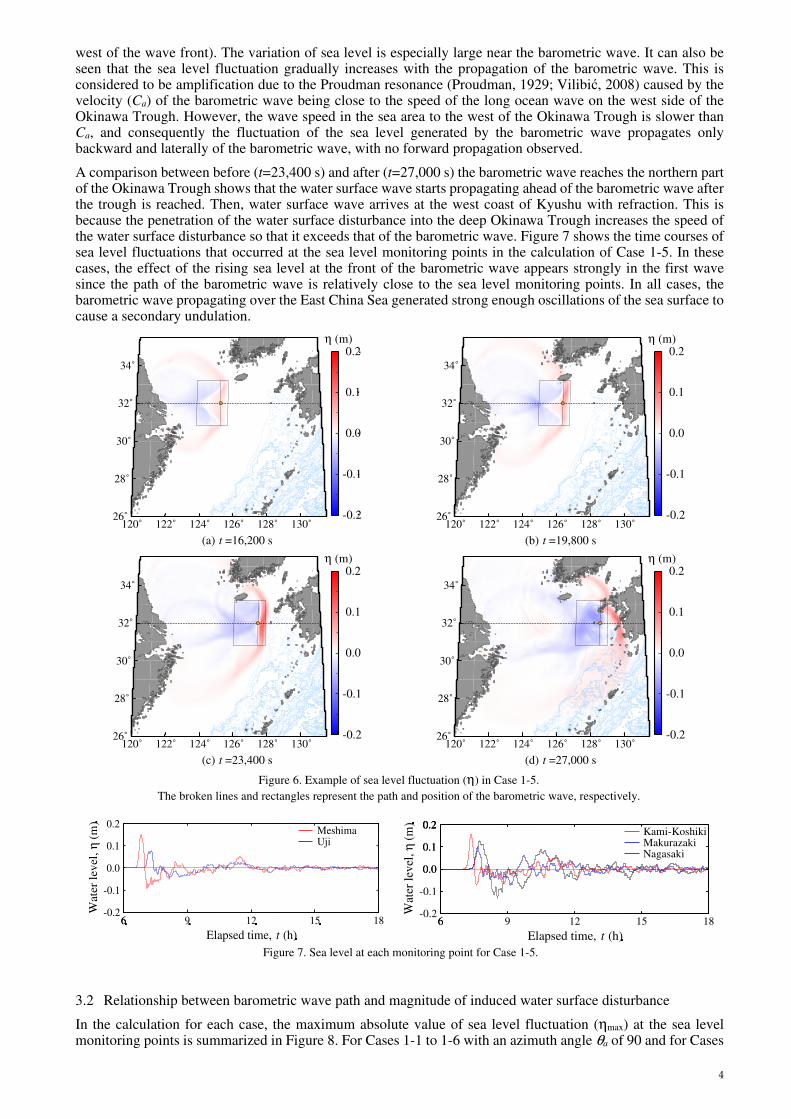
As an example of the calculation results, Figure 6 shows the spatial distribution of sea level fluctuations in Case 1-5 every 3600 s from 16,200 to 27,000 s.
Focusing on t=16,200–23,400 s, before the barometric wave reaches the Okinawa Trough, the sea level rises to the front of the barometric wave (i.e., to the east of the wave front) and decreases behind the wave (i.e., to the
30 km
3 hPa
150 km
Propagationdirection
Case 1-1
Case 1-2
Case 1-3
Case 1-4
Case 1-5
Case 1-6
120˚ 122˚ 124˚ 126˚ 128˚ 130˚26˚
28˚
30˚
32˚
34˚
120˚ 122˚ 124˚ 126˚ 128˚ 130˚26˚
28˚
30˚
32˚
34˚
Case 2-1Case 2-2Case 2-3Case 2-4Case 2-5Case 2-6
Case 3-1Case 3-2Case 3-3Case 3-4Case 3-5
120˚ 122˚ 124˚ 126˚ 128˚ 130˚26˚
28˚
30˚
32˚
34˚
4
west of the wave front). The variation of sea level is especially large near the barometric wave. It can also be seen that the sea level fluctuation gradually increases with the propagation of the barometric wave. This is considered to be amplification due to the Proudman resonance (Proudman, 1929; Vilibić, 2008) caused by the velocity (Ca) of the barometric wave being close to the speed of the long ocean wave on the west side of the Okinawa Trough. However, the wave speed in the sea area to the west of the Okinawa Trough is slower than Ca, and consequently the fluctuation of the sea level generated by the barometric wave propagates only backward and laterally of the barometric wave, with no forward propagation observed.
A comparison between before (t=23,400 s) and after (t=27,000 s) the barometric wave reaches the northern part of the Okinawa Trough shows that the water surface wave starts propagating ahead of the barometric wave after the trough is reached. Then, water surface wave arrives at the west coast of Kyushu with refraction. This is because the penetration of the water surface disturbance into the deep Okinawa Trough increases the speed of the water surface disturbance so that it exceeds that of the barometric wave. Figure 7 shows the time courses of sea level fluctuations that occurred at the sea level monitoring points in the calculation of Case 1-5. In these cases, the effect of the rising sea level at the front of the barometric wave appears strongly in the first wave since the path of the barometric wave is relatively close to the sea level monitoring points. In all cases, the barometric wave propagating over the East China Sea generated strong enough oscillations of the sea surface to cause a secondary undulation.
(a) t =16,200 s (b) t =19,800 s
(c) t =23,400 s (d) t =27,000 s
Figure 6. Example of sea level fluctuation (η) in Case 1-5. The broken lines and rectangles represent the path and position of the barometric wave, respectively.
Figure 7. Sea level at each monitoring point for Case 1-5.
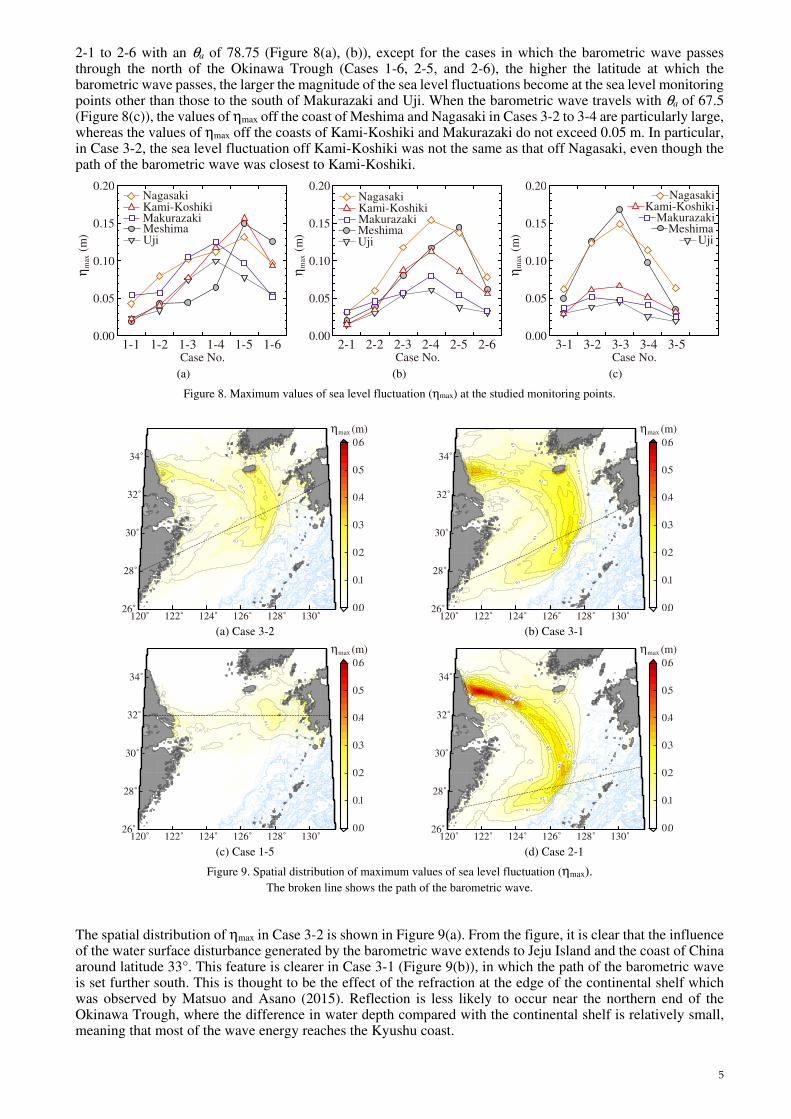
3.2 Relationship between barometric wave path and magnitude of induced water surface disturbance
In the calculation for each case, the maximum absolute value of sea level fluctuation (ηmax) at the sea level monitoring points is summarized in Figure 8. For Cases 1-1 to 1-6 with an azimuth angle θa of 90 and for Cases
120˚ 122˚ 124˚ 126˚ 128˚ 130˚26˚
28˚
30˚
32˚
34˚
-0.2
-0.1
0.0
0.1
0.2η (m)
120˚ 122˚ 124˚ 126˚ 128˚ 130˚26˚
28˚
30˚
32˚
34˚
-0.2
-0.1
0.0
0.1
0.2η (m)
120˚ 122˚ 124˚ 126˚ 128˚ 130˚26˚
28˚
30˚
32˚
34˚
-0.2
-0.1
0.0
0.1
0.2η (m)
120˚ 122˚ 124˚ 126˚ 128˚ 130˚26˚
28˚
30˚
32˚
34˚
-0.2
-0.1
0.0
0.1
0.2η (m)
-0.2
-0.1
0.0
0.1
0.2
Wat
er l
evel
,η (
m)
MeshimaUji
6 9 12 15 18Elapsed time, t (h)
6-0.2
-0.1
0.0
0.1
0.2
Wat
er le
vel,
η (
m)
6 9 12 15 18Elapsed time, t (h)
0.0
0.1
0.2
6
0.2Kami-Koshiki
NagasakiMakurazaki
5
2-1 to 2-6 with an θa of 78.75 (Figure 8(a), (b)), except for the cases in which the barometric wave passes through the north of the Okinawa Trough (Cases 1-6, 2-5, and 2-6), the higher the latitude at which the barometric wave passes, the larger the magnitude of the sea level fluctuations become at the sea level monitoring points other than those to the south of Makurazaki and Uji. When the barometric wave travels with θa of 67.5 (Figure 8(c)), the values of ηmax off the coast of Meshima and Nagasaki in Cases 3-2 to 3-4 are particularly large, whereas the values of ηmax off the coasts of Kami-Koshiki and Makurazaki do not exceed 0.05 m. In particular, in Case 3-2, the sea level fluctuation off Kami-Koshiki was not the same as that off Nagasaki, even though the path of the barometric wave was closest to Kami-Koshiki.
(a) (b) (c)
Figure 8. Maximum values of sea level fluctuation (ηmax) at the studied monitoring points.
(a) Case 3-2 (b) Case 3-1
(c) Case 1-5 (d) Case 2-1
Figure 9. Spatial distribution of maximum values of sea level fluctuation (ηmax). The broken line shows the path of the barometric wave.
The spatial distribution of ηmax in Case 3-2 is shown in Figure 9(a). From the figure, it is clear that the influence of the water surface disturbance generated by the barometric wave extends to Jeju Island and the coast of China around latitude 33°. This feature is clearer in Case 3-1 (Figure 9(b)), in which the path of the barometric wave is set further south. This is thought to be the effect of the refraction at the edge of the continental shelf which was observed by Matsuo and Asano (2015). Reflection is less likely to occur near the northern end of the Okinawa Trough, where the difference in water depth compared with the continental shelf is relatively small, meaning that most of the wave energy reaches the Kyushu coast.
0.00
0.05
0.10
0.15
0.20
ηm
ax (
m) Meshima
Uji
NagasakiKami-KoshikiMakurazaki
1-1 1-2 1-3 1-4 1-5 1-6Case No.
MeshimaUji
NagasakiKami-KoshikiMakurazaki
2-1 2-2 2-3 2-4 2-5 2-6Case No.
0.00
0.05
0.10
0.15
0.20
ηm
ax (
m) Meshima
Uji
NagasakiKami-Koshiki
Makurazaki
3-1 3-2 3-3 3-4 3-5Case No.
0.00
0.05
0.10
0.15
0.20
ηm
ax (
m)
0
0.1
0.1
0.10.1
0.1
0.1
0.1
0.1
0.1
0.1
0.10.1
0.1
0.0
0.1
0.2
0.3
0.4
0.5
0.6ηmax (m)
120˚ 122˚ 124˚ 126˚ 128˚ 130˚26˚
28˚
30˚
32˚
34˚0
0.1
0.1
0.1
0.1
0.10.1
0.1
0.1
0.1
0.2
0.2
0.2
0.2
0.2
0.2
0.0
0.1
0.2
0.3
0.4
0.5
0.6ηmax (m)
120˚ 122˚ 124˚ 126˚ 128˚ 130˚26˚
28˚
30˚
32˚
34˚
120˚ 122˚ 124˚ 126˚ 128˚ 130˚26˚
28˚
30˚
32˚
34˚
0.1
0.1
0.1
0.1
0.2
0.0
0.1
0.2
0.3
0.4
0.5
0.6ηmax (m)
0.1
0.1
0.1
0.1
0.1
0.1
0.1
0.1
0.2
0.2
0.2
0.2
0.2
0.30.3
0.3
0.3
0.4
0.0
0.1
0.2
0.3
0.4
0.5
0.6ηmax (m)
120˚ 122˚ 124˚ 126˚ 128˚ 130˚26˚
28˚
30˚
32˚
34˚

6
On the other hand, the energy of waves reaching the area east of the Okinawa trough becomes smaller due to strong reflection at the edge of the continental shelf near Kami-Koshiki, where the trough is relatively deep. In Case 1-5 (Figure 9(c)), in which a barometric wave passes near Kami-Koshiki as in Case 3-2, the effect of reflection cannot be seen. Among the calculation cases performed in this study, the effect of refraction is the largest in Case 2-1, in which the barometric wave approaches the Okinawa Trough with an azimuth angle θa of 78.75° at around 28°N (Figure 9(d)). As can be seen from a comparison of the calculation results shown in Figure 9, the occurrence of reflection at the edge of the continental shelf greatly depends on the angle and position at which the barometric wave passes through the Okinawa Trough.
3.3 Relationship between path of barometric wave and arrival time of water surface disturbance off Kyushu
Based on the analysis of observational data, Kamiuto et al. (2017) determined that the time lag between the appearance of the relatively large magnitude of sea level fluctuations at Meshima and Uji and the occurrence of the maximum total amplitude of sea level fluctuations at Kami-Koshiki and Makurazaki is several hours. The time lags between the arrival time (Tfw) of the first wave at Meshima and Uji and the arrival time at Nagasaki, Kami-Koshiki, and Makurazaki were calculated, and the results are summarized in Figure 10. The time lags between the times that the root mean square (r.m.s.) values of the sea level fluctuations were maximum (hereinafter, referred to as the oscillation peak occurrence time [Top]) are also shown in Figure 10. The r.m.s. values were calculated by using data for 60 minutes while shifting the time.
(a) Time lags relative to Meshima (b) Time lags relative to Uji
Figure 10. Time lags between the occurrence of sea level fluctuations at each monitoring point. r.m.s: root mean square.
The time lags of Tfw (∆Tfw) relative to Meshima were 23 to 63 min, –7 to 35 min, and –36 to 59 min at Nagasaki, Kami-Koshiki, and Makurazaki, respectively. The values of ∆Tfw relative to Uji were 22 to 59 min, 0 to 34 min, and –14 to 28 min at Nagasaki, Kami-Koshiki, and Makurazaki, respectively. Comparing the ∆Tfw values relative to Meshima with those relative to Uji, there are no significant differences in the case of Nagasaki and Kami-Koshiki, but the ∆Tfw values at Makurazaki relative to Uji tended to be smaller than those relative to Meshima. It is presumed that the differences were observed in the ∆Tfw values at only Makurazaki because monitoring point is closer to Uji than the other two monitoring points. In some cases, the arrival time of the first wave at Meshima and Uji is later than that at each monitoring point along the Kyushu coast. These are all cases where the sea level fluctuations are relatively small, which is due to a slight difference in the waveform of the first wave caused by the superposition of the waves.
The time lags of Top (∆Top) relative to Meshima were –189 to 221 min, –216 to 103 min, and –248 to 142 min at Nagasaki, Kami-Koshiki, and Makurazaki, respectively. The ∆Top values relative to Uji were 25 to 121 min, –19 to 97 min, and –23 to 111 min at Nagasaki, Kami-Koshiki, and Makurazaki, respectively. At each point, the variability became larger than the time lags of the first wave arrival time. In the results relative to Uji, there were cases both where the time lags became larger than time lags of Tfw and where they became shorter. However, as a rough tendency, the time lags changed toward the side where they are larger than the time lags of Tfw. Furthermore, the variations were larger when Meshima was used as a reference than when Uji was used.
In particular, there were cases where the Top at Meshima was delayed by 3–4 h relative to that at the monitoring site along the coast of Kyushu. In each of these cases, the barometric wave passed through low latitudes. Uji, located east of the Okinawa Trough, is affected only by the water surface disturbances that propagate over the trough. On the other hand, Meshima is affected not only by these disturbances but also by the water surface disturbances which are reflected at the edge of the continental shelf. In the cases where the barometric waves pass through low latitudes, it is considered that the first wave is brought to both Meshima and Uji by the water surface disturbances that entered the Okinawa Trough, and the wave reflected at the edge of the continental shelf arrives at Meshima later than the first wave. This then leads to larger sea level fluctuations at Meshima.
It might be possible to detect the arrival of the first wave and thereby forecast secondary undulations. However, in reality, background noise caused by water surface fluctuations due to small-scale pressure disturbances may
First wave (∆Tfw)r.m.s (∆Top)
Nagasaki Kami-Koshiki Makurazaki
Tim
e la
g (m
in)
-250
-200
-150
-100
-50
0
50
100
150
200
250First wave (∆Tfw)r.m.s (∆Top)
Nagasaki Kami-Koshiki Makurazaki
Tim
e la
g (m
in)
-250
-200
-150
-100
-50
0
50
100
150
200
250

7
make it quite difficult to identify sea level changes that bring about a secondary undulation. The results of this study suggest that Meshima, located west of the Okinawa Trough, could be a highly useful monitoring point for the early detection of long-period waves that can cause secondary undulations off the west coast of Kyushu. However, there are some cases where it is difficult to detect a long-period wave with high accuracy in advance due to the presence of barometric waves. Additionally, it should be noted that the lead time necessary for disaster mitigation might not necessarily fall within the range of the time lags shown in this study because the characteristics of the generated surface waves depend not only on the propagation path but also on the shape and propagation speed of the barometric waves.
4. CONCLUSIONS
In this study, the relationship between propagation paths of the barometric waves over the East China Sea and characteristics of water level fluctuations occurring in the sea area off Kyushu Island were examined by numerical analyses. The main conclusions are as follows.
1) The behavior of the water surface waves caused by the barometric wave propagation to the east of the Okinawa trough drastically changes depending on the position and angle at which the barometric wave passes through the Okinawa trough. Consequently, that brings about a great difference in the magnitude of water level fluctuations occurring along the coast of Kyushu Island.
2) The time lag between the peak time of water level fluctuations off the Kyushu Island (Meshima and Uji) and that in the coastal areas of Kyushu Island (Nagasaki, Kami-koshiki and Makurazaki) also varies greatly depending on the propagation path of the barometric wave. In particular, there might be cases where the peak of water level fluctuation Meshima is around 3-4 hours behind the coastal areas of Kyushu Island.
3) Meshima, located west of the Okinawa Trough, can be a useful monitoring site for early detection of long-period waves that cause secondary undulations on the west coast of Kyushu Island. There are cases where it is difficult to detect long-period waves with high accuracy in advance though. Therefore it is considered that it is preferable to perform monitoring not only on Meshima but also on multiple sites east of the Okinawa Trough.
ACKNOWLEDGMENTS
This work was supported by JSPS KAKENHI Grant Number JP18H01684, JP17K06584.
REFERENCES
Akamatsu, H. (1982). On Seiches in Nagasaki-Bay, Papers in Meteorology and Geophysics, 33, No.2, 95-115. (in Japanese) Blumberg, A.F. and Mellor, G.L.: A description of a three-dimensional coastal ocean cir-culation model, Three-
Dimensional Coastal Ocean Models, Vol. 4, American Geophysical Union, Washington, D.C., p.208, 1987. Gomis, D., Monserrat, S., and Tintor ́e, J. (1993). Pressure-forced seiches of large amplitude in inlets of the Balearic Islands,
Journal of Geophysical Research, 98 (C8), 14 437-14 445. Garcies, M., Gomis, D., and Monserrat, S. (1996). Pressure-forced seiches of large amplitude in inlets of the Balearic
Islands. Part II: Observational study, Journal of Geophysical Research, 101 (C3), 6453-6467. Hibiya, T. and Kajiura, K. (1982). Origin of the Abiki Phenomenon(a kind of Seiche) in Nagasaki Bay, Journal of
Oceanography, 38, 3, pp.172-182. Ikeda, N., Niihara, A., Yamashiro T., Asano, T., Saita, T., Jomoto, K. and Kako, S. (2014). Secondary undulation forecast
in the western region of Kyushu using sea level data at Meshima Island, Journal of Japan Society of Civil Engineers, B3 (Ocean Engineering), 70, 2, I_199-I_204. (in Japanese)
Kakinuma, T., Asano, T., Inoue, T., Yamashiro, T. and Yasuda, K. (2009). Survey on February 2009 Abiki Disaster in Urauchi Bay, Kamikoshiki Island,Journal of Japan Society of Civil Engineers, B2 (Coastal Engineering), 65, 1, 1391-1395. (in Japanese)
Kamiuto, M., Yamashiro, T., Saita, T., Asano, T. and Jomoto, K. (2017). Monitoring of long-period wave in the western region of Kagoshima for secondary undulation prediction, Journal of Japan Society of Civil Engineers, B3 (Ocean Engineering), 73, 2, I_731-I_736. (in Japanese)
Matsuo, S., Asano, T. (2015). Numerical analysis on wide range propagation if meteo-tsunami causing secondary undulation on the coast of Kyushu along the East China Sea, Journal of Japan Society of Civil Engineers, B2 (Coastal Engineering), 71, 2, I_133-I_138. (in Japanese)
Mercer, D., Sheng, J., Greatbatch, R. J. and Bobanović, J. (2002). Barotropic waves generated by storms moving rapidly over shallow water, Journal of Geophysical Research, 107 (C10), 16_1-16_17.
Monserrat, S., Ramis, C. and Thorpe, A.J. (1991). Large-amplitude pressure oscillations in the western Mediterranean, Geophysical Research Letters, 18 (2), 183-186.
Monserrat, S., I. Vilibić and A. B. Rabinovich (2006). Meteotsunamis: atmospherically induced destructive ocean waves in the tsunami frequency band, Natural Hazards and Earth System Science, 6, 1035-1051.
NOAA; National Oceanic and Atmospheric Administration (2014). An Examination of the June 2013 East Coast Meteotsunami Captured By NOAA Observing Systems, NOAA Technical Report, NOS CO-OPS 079, p.42.

8
Odamaki, M., Yano, Y. and Nitta, K. (1982). “Abiki”, the Large Seiche in the West Coast of Kyusyu, Report of
Hydrographic Reserches, 18, 83-104. (in Japanese) Proudman, J. (1929). The Effects on the Sea of Changes in Atmospheric Pressure, Geophysical Journal International, 2
(s4), 197-209. Rabinovich, A. B. and Monserrat, S. (1996). Meteorological tsunamis near the Balearic and Kuril Islands: Descriptive and
statistical analysis, Natural Hazards, 13 (1), 55-90. Rabinovich, A. B. and Monserrat, S. (1998). Generation of meteorological tsunamis (large amplitude seiches) near the
Balearic and Kuril Islands, Natural Hazards, 18 (1), 27-55. Renault, L., Vizoso, G., Jansá, A., Wilkin, J. and Tintoré, J. (2011). Toward the predictability of meteotsunamis in the
Balearic Sea using regional nested atmosphere and ocean models, Geophysical Research Letters, 38 (10), L10601. Saita, T. and Asano, T. (2011). Numerical Analysis on Characteristics of Secondary Undulation in Urauchi Bay caused by
Meteorological Disturbances over the East China Sea, Journal of Japan Society of Civil Engineers, B2 (Coastal Engineering), 67, 2, I_171-I_175. (in Japanese)
Tanaka, K., Higuchi, K., Muta, N. and Ishida, D. (2012). Development of forecasting method for meteotsunamis in coastal areas of the East China Sea using JMA-GSM data, Journal of Japan Society of Civil Engineers, B2 (Coastal Engineering), 68, 2, I_461-I_465. (in Japanese)
Vilibić, I. (2008). Numerical simulations of the Proudman resonance, Continental Shelf Research, 28, (4), pp.574-581. Vilibić, I. and Šepić, J. (2009). Destructive meteotsunamis along the eastern Adriatic coast: Overview, Physics and
Chemistry of the Earth, 34, 904-917. Vučetić, T., Vilibić, I., Tinti, S. and Maramai, A (2009). The Great Adriatic flood of 21 June 1978 revisited: An overview
of the reports, Physics and Chemistry of the Earth, 34, 894-903. Wang, X., Li, K., Yu, Z., and Wu, J. (1987). Statistical characteristics of seiches in Longkou Harbour, Journal of Physical
Oceanography, 17, 1963-1966.