the relationship between economic growth and electricity
TRANSCRIPT

1
Abstract—This paper applies to Sri Lanka an econometric
model named as Vector Error Correction Model (VECM) and
simple econometric model developed by H.Y. Yang (2000)
which can be used for testing the presence of the relationship
between economic growth and electricity consumption in Sri
Lanka for the period of 1985-2015. The results obtained from
the research can be used to justify the investments in electricity
sector because of the significant contribution it makes to the
economy and the macro economic planning. The research has
been separated into four scenarios in order to check the impact
to the economic growth from different sectors (Total electricity
consumption and total real GDP, Industrial sector electricity
consumption and industrial Sector real GDP, Commercial
sector electricity consumption and service sector real GDP,
[Industrial + Commercial] sector electricity consumption and
[Industrial + Service] sector real GDP). The economic output
generated from [Industrial + Commercial] sector has a strong
relationship with [Industrial + Service] sector electricity
consumption. Also, the results obtained suggests that the past
and the current electricity consumptions have a significant
impact to the economic growth in Sri Lanka.
Index Terms—Economic growth, electricity consumption,
simple econometric model, Sri Lanka, vector error correction
model.
I. INTRODUCTION
Electrical energy plays a major role in the modern society.
It is a crucial factor for both developing and developed
countries. Electricity consumption leads to the productivity
and industrial growth and it directly affects to the economic
growth.
The relationship between economic growth and electricity
consumption of a country depends on the condition of the
economy of a country and the structure of it. The causal
relationship between these two factors can be categorized
into three factors: no causality, uni-directional causality and
bi-directional causality. Also, it can be categorized as long-
term causality and short-term causality.
In the Sri Lankan context, the electric utilities are
operated as vertically integrated monopoly system. All
utilities from electricity generation to electricity sales are
managed by the government. Due to this direct ownership of
the government all investments that needs for the electricity
Manuscript received December 14, 2019; revised March 8, 2020.
K. K. C. S Kiriella, W. H. A Samarakoon, and K. T. A. B Samarasinghe
were with the University of Moratuwa, Sri Lanka; are now with private
sector, Sri Lanka (e-mail: [email protected],
W. L. T. Peiris is with Government University, Sri Lanka (e-mail:
M. P. Dias was with University of Moratuwa, Sri Lanka.
W. D. A. S Wijayapala is with University of Moratuwa, Sri Lanka.
sector are done by the government, prices are set by the
government and all the revenue goes to the government.
This paper reviews the relationship and the impact of
electricity consumption on the economic growth. The results
of this research demonstrates that the investments in
electricity sector are fully justified. Also, the direction of
causality helps the policy makers to get appropriate
decisions and results can be used for macroeconomic
planning.
II. REVIEW OF LITERATURE
Most of the researches in this area address the causality
between electricity consumption and economic growth and
marginal values to economic output. R. Morimoto and C.
Hope studied the impact of electricity supply on economic
growth in Sri Lanka from 1960 to 1998 by using the model
developed by H.Y Yang (2000) who found the bi-directional
causal relationship in Taiwan for the period of 1954 – 1997.
Morimoto et al. said that the current and past changes in
Electricity supply have a significant impact to the economic
growth in Sri Lanka. Also they predicted that for every 1
MWh increase in Electricity supply there is an extra
economic output between the ranges of 88000 to 137000 [1].
Another research carried out by Zahid Asghar named as
“Energy GDP Relationship: A causal analysis for five
countries of South Asia” investigated causal relationship
between GDP and Energy Consumption for five South
Asian Countries; Pakistan, India, Sri Lanka, Bangladesh and
Nepal by using Toda and Yamamoto (1995) approach and
Error correction model. He found that Electricity
Consumption and GDP are co integrated and there is long
run relationship uni-directional causality from GDP to
Electricity Consumption. Then he denotes that Sri Lanka has
less energy dependent economy energy conservation
policies have opposite effects. He said further in his study
“As economic growth causes expansion in industrial and
commercial activities and electricity is used as a basic input,
therefore, energy conservation policies do not harm the
economic growth [2].”
In the year of 1998 Sharmin and Mohammed conducted a
research for Sri Lanka by applying Johansen’s co-
integration tests. They found that using trivariate Vector
Error Correction Model (VECM) energy consumption to
economic growth in Sri Lanka. They used energy
consumption, income and price levels and presented that
energy consumption is relatively exogenous and it directly
influence to the income and prices [3].
The summary of other literature review on Electricity
Consumption and Economic growth is presented in the
The Relationship between Economic Growth and Electricity
Consumption in Sri Lanka
K. K. C. S. Kiriella, W. L. T. Peiris, W. H. A. Samarakoon, K. T. A. B. Samarasinghe, W. D. A. S.
Wijayapala, and M. P. Dias
Journal of Economics, Business and Management, Vol. 8, No. 3, August 2020
235doi: 10.18178/joebm.2020.8.3.643

Table I and Table II below.
TABLE I: FOR DEVELOPING COUNTRIES
Study Country
(Period)
Method Findings
Gurgul and
Lach
(2011) [4]
Poland
(2000-
2009)
Linear and
Nonlinear
Causality Tests
Bidirectional
Causality between
GDP AND Economic
Growth
Ghosh
(2002) [5]
India
(1950-
1997)
Granger
Causality
Bidirectional
causality between
Economic growth and
Electricity
Consumption
Jumbe
(2004) [6]
Malawi
(1970-
1999)
Granger
Causality, error
correction
model
Bidirectional
causality between
Economic growth and
Electricity
Consumption
Adom
(2011) [7]
Ghana
(1971-
2008)
Toda and
Yamamoto
Granger
Causality Test
Unidirectional
causality from
Economic growth to
Electricity
Consumption
Atif and
Siddiqi
(2010) [7]
Pakistan
(1971-
2007)
Granger
Causality Test
and Modified
WALD Test
Unidirectional
causality from
Electricity
Consumption to
Economic Growth
Aktas and
Yilmaz
(2008) [8]
Turkey
(1970-
2004)
Granger
Causality
Unidirectional
causality from
Economic growth to
Electricity
Consumption
Mozumder
and
Marathe
(2007) [9]
Bangladesh
(1971-
1999)
Co-integration,
vector error
correction
model
Unidirectional
causality from
Economic growth to
Electricity
Consumption
TABLE II: DEVELOPED COUNTRIES
Study Country
(Period)
Method Findings
Shiu and
Lam
(2004) [10]
China
(1971-
2000)
Error Correction
model
Unidirectional
Causality from
Electricity
Consumption to
Economic Growth
Yang
(2000) [11]
Taiwan
(1954-
1997)
Granger Causality Bidirectional causality
between Economic
growth and Electricity
Consumption
Yoo (2005)
[12]
Korea
(1970-
2002)
Error Correction
model
Bidirectional causality
between Economic
growth and Electricity
Consumption
Yoo (2006)
[11]
Malaysia,
Singapore
Granger
Causality,
Hsiao’s
Version of
Granger Causality
Bidirectional causality
between Economic
growth and Electricity
Consumption
Cheng
(1995) [13]
US (1947-
1990)
Cointegration,
Granger Causality
No causality
III. METHODOLOGY
The study was conducted using time series analysis for
the period of 1985 to 2015. Reliable data for electricity
consumption and GDP were obtained from Ceylon
Electricity Board (CEB) and Central Bank Sri Lanka (CBSL)
respectively. Analysis was carried out for four scenarios to
check the significant impact of the electricity consumption
on the economic growth in Sri Lanka. Analyzed four
scenarios are;
⚫ Total Electricity consumption and Total real GDP
⚫ Industrial Sector Electricity Consumption and
Industrial Sector real GDP
⚫ Commercial sector electricity consumption and
Service sector real GDP
⚫ (Industrial + commercial) sector electricity
consumption and (Industrial + service) sector real
GDP. Base year for all the cases has been taken as 2015.
Several econometric models have been analyzed for the Sri
Lankan context such as Auto Regressive (AR), Moving
Average (MA), Auto Regressive Moving Average (ARMA),
Auto Regressive Integrated Moving Average (ARIMA),
Auto Regressive Distributed Lag (ARDL), Vector Auto
Regressive (VAR), and Vector Error Correction Model
(VECM). Finally VECM is selected among the other
econometric models to perform the time series analysis for
the Sri Lankan data. Raw data should not be stationary and
all the data should be integrated in same order to use the
Vector Error Correction Model (VECM). It can be described
as follows:
∆𝐺𝐷𝑃𝑡 = 𝐶1(𝐺𝐷𝑃𝑡−1 + 𝛼 × 𝐸𝐿𝐸𝐶𝑇𝑡−1 + 𝛽) +
∑ 𝑎𝑖𝑛𝑖=1 × ∆𝐺𝐷𝑃𝑡−𝑖 + ∑ 𝑏𝑗
𝑛𝑗=1 × ∆𝐸𝐿𝐸𝐶𝑇𝑡−𝑗 + 𝐸𝑡 (1)
where;
∆GDPt = First differenced real GDP at time t
∆ELECTt-i = First differenced electricity consumption at time t-i
Et = Error term
𝐶1, 𝛼, 𝛽, 𝑎𝑖 , and 𝑏𝑗 = constants
A. Total Electricity Consumption and Total Real GDP
Augmented Dickey-Fuller (ADF) test was used to check
the stationarity of the ∆GDP and ∆ELECT. Data collection
should be stationary to overcome the occurrence of spurious
regression. Both data collections are significant at 5% level
and the obtained results are shown in the Table III and Table
IV respectively.
TABLE III: STATIONARY TEST RESULTS FOR ∆GDP
t - Statistic Probability
Augmented Dicky - Fuller Test
Statistic
-5.010881 0.0019
Test Critical
Values:
1% Level -4.309824
5% Level -3.574244
10% Level -3.221728
TABLE IV: STATIONARY TEST RESULTS FOR ∆ELECT
t - Statistic Probability
Augmented Dicky - Fuller Test
Statistic
-6.937821 0.0000
Test Critical
Values:
1% Level -4.339330
5% Level -3.587527
10% Level -3.229230
Johanson cointegration test has been performed
afterwards. Johanson cointegration test is used to check
whether there is long run relationship between real GDP and
electricity consumption. It is also significant at 5% level.
Results of the Johanson cointegration test for total electricity
consumption and total real GDP are illustrated in Table V.
Journal of Economics, Business and Management, Vol. 8, No. 3, August 2020
236
Statistics show that there is a long run relationship between
∆GDP and ∆ELECT.
TABLE V: RESULTS OF JOHANSON COINTEGRATION TEST
Hypothesized
No. of CE(s)
Eigen
value
Trace
Statistic
0.05
Critical
Value
Probability
**
None * 0.548329 32.52327 15.49471 0.0001
At most * 0.336193 11.06362 3.841466 0.0009
Trace test indicates 2 cointegrating eqn(s) at the 0.05 level
*denotes rejection of the hypothesis at the 0.05 level
**Mackinnon-Haug-Michelis (1999) p – values
After performing the ADF test and Johanson
cointegration test, optimum time lag for the econometric
model was obtained using Akaike information criterion
(AIC). Obtained value is illustrated in Table VI and it is
27.66. According to the results, optimum time lag for total
electricity consumption and total GDP became 5 years.
TABLE VI: ECONOMETRIC MODEL FOR THE 1ST SCENARIO
D(GDP) = C(1)*(GDP(-1)-738.17482962*ELEC(-1)-
628583.194996)+C(2)*D(GDP(-1))+C(3)*D(GDP(-2))+C(4)*D(GDP(-
3))+C(5)*D(GDP(-4))+C(6)*D(GDP(-5))+C(7)*D(ELEC(-
1))+C(8)*D(ELEC(-2))+C(9)*D(ELEC(-3))+C(10)*D(ELEC(-
4))+C(11)*D(ELEC(-5))+C(12)
Coefficient Standard
Error
t-Statistic Probability
C(1) -1.246192 0.393461 -3.167257 0.0074
C(2) 0.755413 0.353174 2.138925 0.0520
C(3) 1.616068 0.362233 4.461408 0.0006
C(4) 1.847763 0.538342 3.432322 0.0045
C(5) 1.411433 0.628181 2.246857 0.0427
C(6) 0.900467 0.563594 1.597722 0.1341
C(7) -1230.988 463.8372 -2.653923 0.0199
C(8) -1930.714 486.5903 -3.967844 0.0016
C(9) -1773.602 623.9508 -2.842535 0.0139
C(10) -733.5864 629.4578 -1.165426 0.2648
C(11) -210.8841 494.8982 -0.426116 0.6770
C(12) 355255.2 166143.6 2.138241 0.0521
R-squared 0.768404 Mean dependant var 346849.9
Adjusted R-squared
0.572439
S.D dependant var 322271.4
S.E of Regression
210727.4
Akaike info criterion 27.66059
Sum squared residual
5.77E+11
Schwarz criterion 28.24565
Log likelihood -333.7574 Hanan-Quinn criterion 27.82286
F-statistic 3.921118 Durbin Watson statistics 1.844484
Obtained Econometric model for the GDP and Electricity
consumption of the 1st scenario are as follows.
∆𝑮𝑫𝑷𝒕 = −𝟏. 𝟐𝟓(𝑮𝑫𝑷𝒕−𝟏 − 𝟕𝟑𝟖. 𝟏𝟕 × 𝑬𝑳𝑬𝑪𝑻𝒕−𝟏 −
𝟔𝟐𝟖𝟓𝟖𝟓. 𝟗𝟑) + ∑ 𝒂𝒊𝟓𝒊=𝟏 × ∆𝑮𝑫𝑷𝒕−𝒊 + ∑ 𝒃𝒋
𝟓𝒋=𝟏 × ∆𝑬𝑳𝑬𝑪𝑻𝒕−𝒋 +
𝑬𝒕(2)
After obtaining a mathematical equation from VECM,
stability of the model should be checked. Four specific
statistical tests should perform in order to check the stability
of the model. Performed statistical tests and a brief
description of those statistical tests are given below.
• Wald test
• Heteroscedasticity test
• Normality test
• Serial correlation LM(Lagrange Multiplier) test
Table VII illustrates the Wald test results between total
electricity consumption and total real GDP. Chi-square
value for the above case corresponds to 0.0001 probability.
Hence the null hypothesis can be rejected at 5% interval.
TABLE VII: RESULTS OF WALD TEST
Wald Test
Test Statistic Value df Probability
F-Statistic 5.043221 (5,13) 0.0087
Chi-Square 25.21611 5 0.0001
Null Hypothesis : C(7) = C(8) = C(9) = C(10) = C(11) = 0
TABLE VIII: RESULTS OF HETEROSCEDASTICITY TEST
Heteroskedasticity Test Breusch-Pagan-Godfrey
F-Statistic 1.616133 Prob.F(12,12) 0.2088
Obs*R-squared 15.44391 Prob.Chi-
Square(12)
0.2181
Table VIII shows the hetheroskedasticity test that was
performed for the above model. Heteroscedasticity test is
used to check whether the variance of the model is a time
function. Probability of Chi-square value shows more than 5%
significance and this reveals that the model has
homoscedasticity which is good.
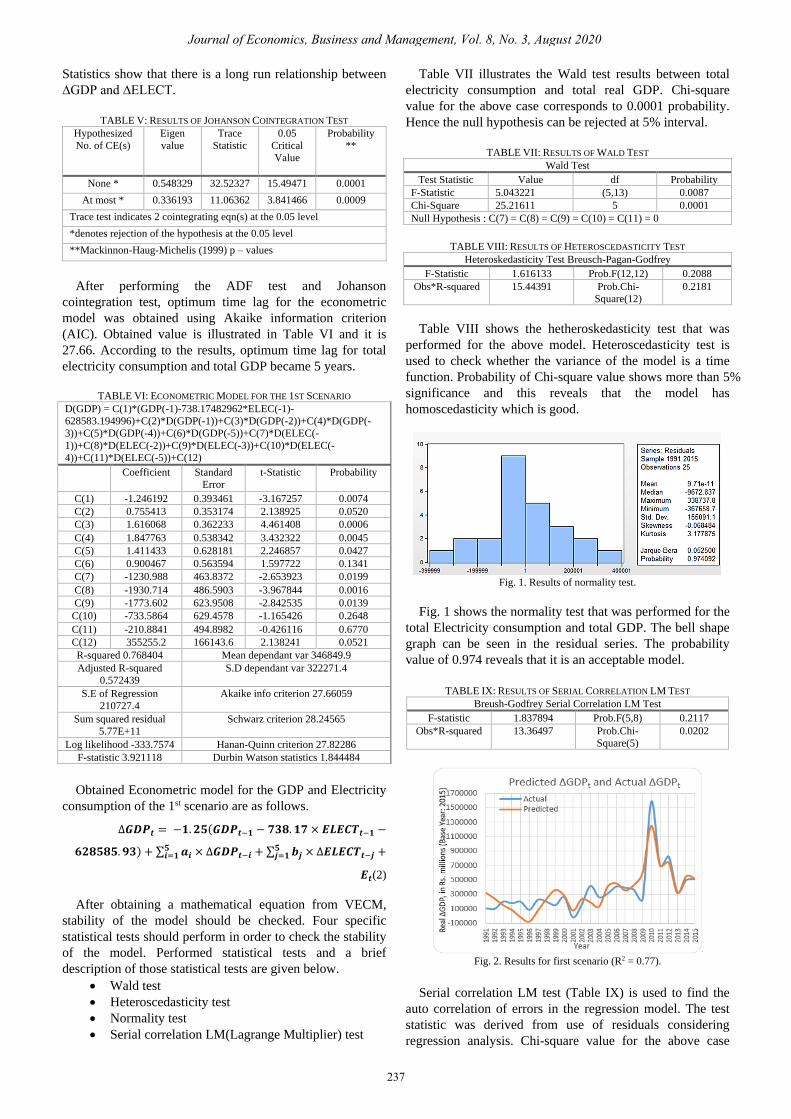
Fig. 1. Results of normality test.
Fig. 1 shows the normality test that was performed for the
total Electricity consumption and total GDP. The bell shape
graph can be seen in the residual series. The probability
value of 0.974 reveals that it is an acceptable model.
TABLE IX: RESULTS OF SERIAL CORRELATION LM TEST
Breush-Godfrey Serial Correlation LM Test
F-statistic 1.837894 Prob.F(5,8) 0.2117
Obs*R-squared 13.36497 Prob.Chi-
Square(5)
0.0202
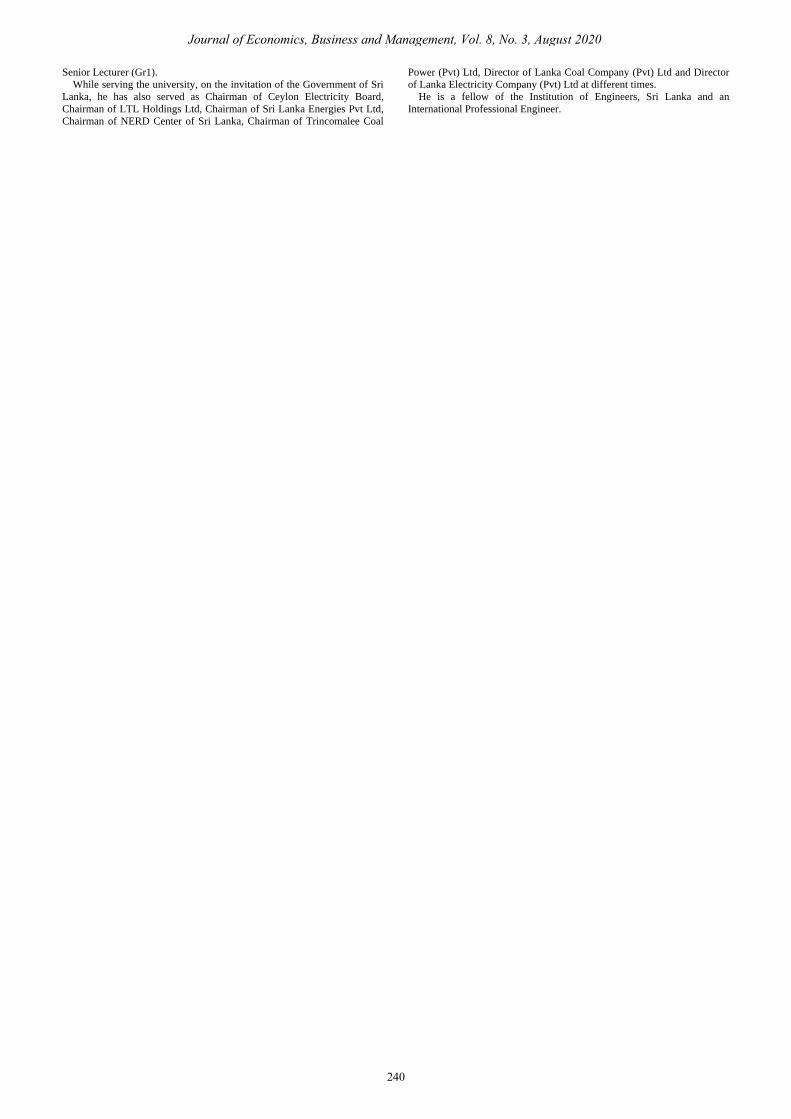
Fig. 2. Results for first scenario (R2 = 0.77).
Serial correlation LM test (Table IX) is used to find the
auto correlation of errors in the regression model. The test
statistic was derived from use of residuals considering
regression analysis. Chi-square value for the above case
Journal of Economics, Business and Management, Vol. 8, No. 3, August 2020
237

corresponds to 0.0202 probability. Hence the null hypothesis
can be rejected at 5% interval.
Durbin-Watson test statistic also suggests the less auto-
correlation of the residuals (Table VI). For satisfy the
Durbin-Watson test, the test statistic should be in the range
of 1.5 to 2.5. Obtained Durbin-Watson value for 1st scenario
is 1.84. Obtained graph for first scenario is shown in Fig. 2.
Models were developed and tested for other three
scenarios as well. Results of the model outputs (Fig. 3 to Fig.
5) are shown here.
Fig. 3. Results for second scenario (R2 = 0.68).
Fig. 4. Results for third scenario (R2 = 0.66).
Fig. 5. Results for forth scenario (R2 = 0.91).
B. Industrial Sector Electricity Consumption and
Industrial Sector GDP
∆𝐺𝐷𝑃𝑡 = 0.05(𝐺𝐷𝑃𝑡−1 + 1744.81 × 𝐸𝐿𝐸𝐶𝑇𝑡−1 −
5310230.37) + ∑ 𝑎𝑖3𝑖=1 × ∆𝐺𝐷𝑃𝑡−𝑖 + ∑ 𝑏𝑗
3𝑗=1 ×
∆𝐸𝐿𝐸𝐶𝑇𝑡−𝑗 + 𝐸𝑡 (3)
C. 3rd Scenario: Commercial Sector Electricity
Consumption and Service Sector Real GDP
∆𝐺𝐷𝑃𝑡 = −0.84(𝐺𝐷𝑃𝑡−1 − 2037.86 × 𝐸𝐿𝐸𝐶𝑇𝑡−1 + 99937.98) +
∑ 𝑎𝑖3𝑖=1 × ∆𝐺𝐷𝑃𝑡−𝑖 + ∑ 𝑏𝑗
3𝑗=1 ∆𝐸𝐿𝐸𝐶𝑇𝑡−𝑗 + 𝐸𝑡 (4)
D. (Industrial + Commercial) Sector Electricity
Consumption and (Industrial + Service) Sector GDP
∆𝐺𝐷𝑃𝑡 = −1.2(𝐺𝐷𝑃𝑡−1 − 686.68 × 𝐸𝐿𝐸𝐶𝑇𝑡−1 − 1844863.37) +
∑ 𝑎𝑖6𝑖=1 × ∆𝐺𝐷𝑃𝑡−𝑖 + ∑ 𝑏𝑗
6𝑗=1 × ∆𝐸𝐿𝐸𝐶𝑇𝑡−𝑗 + 𝐸𝑡 (5)
There was a difficulty to find a match for service sector
GDP in electricity sector. But commercial sector electricity
consumption falling under electricity sector can be
considered as the most significant variable for regression
analysis [14].
IV. RESULTS AND CONCLUSION
This paper examined the relationship between economic
growth and electricity consumption in Sri Lanka for the
period of 1985-2015. At first, four econometric models were
developed and then the feasibility of these models were
tested using statistical tests. The methodology that we have
used here is Vector Error Correction Model (VECM) which
falls under multiple time series models. The findings reflects
that (Industrial + Commercial) sector electricity
consumption and (Industrial + Service) sector GDP have a
significant relationship.
According to the Johanson cointegration test performed,
Sri Lanka has a Long run relationship between Electricity
Consumption and Real GDP for all four cases considered.
We compared our results with another model (Simple
Econometric Model) developed by H.Y. Yang (2000) [1].
Predicted ranges are approximately the same for both
models.
These findings can be used to estimate the parameter EO
(economic output) which indicates that the increase in
economic output per increase of unit electricity consumption
in Sri Lanka. Calculated extra economic outputs for every 1
GWh increase of electricity consumption for Sri Lanka are
shown in Table X.
TABLE X: FINDINGS Results of from
Simple
Econometric
Model (Rs.
Mn/GWh)
Results from
VECM model (Rs.
Mn/GWh)
Total GDP and
Electricity
559.77 to 1156.35 484.61 to 1354.92
Industrial GDP and
Electricity
21.35 to 484.18 47.284 to 125.8
(Industrial + Service)
GDP and (Industrial +
Service) Electricity
687.98 to 1376.63 578.64 to 1068.02
Some interpretations can be made on the variations of the
obtained graphs. There is a huge economic growth can be
seen in 2009-2010 period. This may have happened due to
end of the Sri Lankan civil war from 1983 to 2009. Civil
war adversely effected to the Sri Lankan economy
throughout this period.
Journal of Economics, Business and Management, Vol. 8, No. 3, August 2020
238

Decline of economy in 2008-2009 period may have
happened due to some undesirable situations in oil exporting
countries. Sri Lankan power system was governed by oil
based power plants at that time.
From 2000 to 2001, a huge decline on economic
development can be seen due to energy crisis. There were
some power cuts throughout the country for least 1 or 2
hours daily. Also agriculture and tourism sectors were
declined in this period too.
In 1996, Sri Lanka faced a severe drought season and
economy declined 3.8% from 5.5%. Decrement of paddy
and food crop production was happened due to this drought
condition. Power cuts were also occurred because Sri
Lankan power system was governed by hydro power at that
time [1].
This paper confirms the significant contribution of
electricity consumption to the economic development of Sri
Lanka. Hence, to maintain a good economic growth, power
sector should always be in a healthy condition. So that, we
can say, investments in electricity sector in Sri Lanka can be
fully justified, because of the significant contribution it
makes to the economy.
CONFLICT OF INTEREST
The authors declare no conflict of interest.
AUTHOR CONTRIBUTIONS
All the authors conducted the research. K.K.C.S. Kiriella
and W.L.T. Peiris developed the methodology and worked
on literature review. K.T.A.B. Samarasinghe and W.H.A.
Samarakoon analyzed the statistical data and worked on the
results and conclusions. W.D.A.S Wijayapala and M.P Dias
supervised the research. All authors had approved the final
version.
REFERENCES
[1] C. Hope and R. Morimoto, “The impact of electricity supply on
economic growth in Sri Lanka,” Energy Economics, vol. 26, pp. 77-
85, January 2004.
[2] Z. Asghar, “Energy - GDP relationship: A causal analysis for the five
countries of South Asia,” Applied Econometrics and International
Development, vol. 8, 2008.
[3] F. Sharmin and M. R. Khan, “A causal relationship between energy
consumption, energy prices and economic growth in Africa,”
International Journal of Energy Economics and Policy, vol. 6, pp.
477-494, no. 3, 2016.
[4] Y. Bayar and H. A. Ozel, “Electricity consumption and economic
growth in emerging economies,” Journal of Knowledge Management,
Economics and Information Technology, vol. 4, issue 2, April 2014.
[5] A. K. Tiwari, “The frequency domain causality analysis between
energy consumption and income in the United States,” Economia
Aplicada, vol. 18, no. 1, pp. 51-67, 2014.
[6] Seec.surrey.ac.uk. Cite a Website - Cite This For Me. [Online].
Available:
http://www.seec.surrey.ac.uk/Research/SEEDS/SEEDS113.pdf
[7] A. Bismark, A. Oppong, L. A. Abruquah, and E. Ashalley, “Causality
nexus of electricity consumption and economic growth: An empirical
evidence from Ghana,” Open Journal of Business and Management,
vol. 5, no. 1, January 2017.
[8] C. Aktas and Y. Veysel. Causal relationship between oil consumption
and economic growth in Turkey. [Online]. Available:
https://pdfs.semanticscholar.org/88e7/34f0c386dc862727b043b22dd1
f5958d0a97.pdf
[9] S. Ruhul, R. Shuddhasattwa, and K. Hassan, “Causality and dynamics
of energy consumption and output: Evidence from non-OECD Asian
countries,” Journal of Economic Development, vol. 33, no. 2, pp. 1-26,
2008.
[10] Isiarticles.com. Cite a Website - Cite This For Me. [Online].
Available: http://isiarticles.com/bundles/Article/pre/pdf/10975.pdf
[11] S. Hossain, “Multivariate granger causality between economic growth,
electricity consumption, exports and remittance for the panel of three
SAARC countries,” European Scientific Journal, vol. 8, no. 1, 2014.
[12] S. H. Yoo, “Electricity consumption and economic growth: Evidence
from Korea,” Energy Policy, vol. 33, no. 12, pp 1627-1632, February
2005.
[13] B. S. Cheng, “An investigation of cointegration and causality between
energy consumption and economic growth,” Journal of Energy
Finance & Development, vol. 21, no. 1, December 1995.
[14] Long Term Generation Expansion Plan 2015-2034, Ceylon
Electricity Board, 2015, p. 51.
Copyright © 2020 by the authors. This is an open access article distributed
under the Creative Commons Attribution License which permits
unrestricted use, distribution, and reproduction in any medium, provided
the original work is properly cited (CC BY 4.0).
K. K. C. S Kiriella was born in Sri Lanka, on 24th
April 1992. He received his B. Sc. Eng. (Hons)
degree specialized in Electrical Engineering from
University of Moratuwa, Sri Lanka in 2017.
Currently he is reading for his MSc degree in
electrical engineering in University of Moratuwa.
He has been working as an electrical engineer for
IPD Group Ltd (Colombo branch), Sri Lanka since
2017. Eng. Kiriella is an associate member of IESL (The Institution of
Engineers, Sri Lanka) since 2017.
W. L. T. Peiris received the B.Sc. Eng. (Hons)
degree specialized in electrical engineering from
University of Moratuwa, Sri Lanka in 2017.
Currently she is reading her MSc. degree in
University of Moratuwa, Sri Lanka.
She is now working as a lecturer (probationary) in
Sabaragamuwa University of Sri Lanka since 2018.
Her research interests are power systems protection, microgrids, smartgrids
and power economics.
W. H. A Samarakoon was born in Sri Lanka, on
29th of November 1992. He received his B. Sc. Eng.
(Hons) degree specialized in electrical engineering
from University of Moratuwa, Sri Lanka in 2017.
He has been working as an electrical engineer for
Abans Electricals PLC at Rathmalana, Sri Lanka
since 2017. Eng. Samarakoon is an associate member
of IESL (The Institution of Engineers, Sri Lanka)
since 2017.
K. T. A. B. Samarasinghe was born in Sri Lanka, on
17th of June 1992. He received his B. Sc. Eng. (Hons)
degree specialized in electrical engineering from
University of Moratuwa, Sri Lanka in 2017. Currently
he is reading for his MSc degree in electrical
installation in University of Moratuwa.
He has been working as an electrical engineer for
Dialog Axiata PLC, Sri Lanka since 2017. Eng.
K.T.A.B. Samarasinghe is an associate member of IESL (The Institution of
Engineers, Sri Lanka) since 2017.
M. P. Dias, BSc Eng (Sri Lanka), MS (USA), PhD
(USA) is a former associate professor of University of
Moratuwa, Sri Lanka. He is also a former chairman of
the Atomic Energy Authority of Sri Lanka, and a
former senior staff member of the International
Atomic Energy Agency. He is a recipient of the IAEA
Distinguished Service Award.
W. D. A. S Wijayapala graduated from University of
Moratuwa in 1991 specializing in Electrical
Engineering. He has over 25 years of experience in the
electrical engineering industry in Sri Lanka. He has
worked as a transformer design engineer and factory
manager at Lanka Transformers Ltd, diesel power
plant project engineer and plant manager at
Lakdhanavi Ltd, and Manager-Hydro Power at
Nividhu (Pvt) Ltd before joining the Department of
Electrical Engineering of the University of Moratuwa in year 2005 as a
Journal of Economics, Business and Management, Vol. 8, No. 3, August 2020
239
Senior Lecturer (Gr1).
While serving the university, on the invitation of the Government of Sri
Lanka, he has also served as Chairman of Ceylon Electricity Board,
Chairman of LTL Holdings Ltd, Chairman of Sri Lanka Energies Pvt Ltd,
Chairman of NERD Center of Sri Lanka, Chairman of Trincomalee Coal
Power (Pvt) Ltd, Director of Lanka Coal Company (Pvt) Ltd and Director
of Lanka Electricity Company (Pvt) Ltd at different times.
He is a fellow of the Institution of Engineers, Sri Lanka and an
International Professional Engineer.
Journal of Economics, Business and Management, Vol. 8, No. 3, August 2020
240