the relationship between employee turnover and customer
TRANSCRIPT

UNLV Retrospective Theses & Dissertations
1-1-2001
The relationship between employee turnover and customer The relationship between employee turnover and customer
service quality in casino restaurants service quality in casino restaurants
Karl D Brandmeir University of Nevada, Las Vegas
Follow this and additional works at: https://digitalscholarship.unlv.edu/rtds
Repository Citation Repository Citation Brandmeir, Karl D, "The relationship between employee turnover and customer service quality in casino restaurants" (2001). UNLV Retrospective Theses & Dissertations. 1272. http://dx.doi.org/10.25669/ibyh-qd7i
This Thesis is protected by copyright and/or related rights. It has been brought to you by Digital Scholarship@UNLV with permission from the rights-holder(s). You are free to use this Thesis in any way that is permitted by the copyright and related rights legislation that applies to your use. For other uses you need to obtain permission from the rights-holder(s) directly, unless additional rights are indicated by a Creative Commons license in the record and/or on the work itself. This Thesis has been accepted for inclusion in UNLV Retrospective Theses & Dissertations by an authorized administrator of Digital Scholarship@UNLV. For more information, please contact [email protected].

INFORMATION TO USERS
This manuscript has been reproduced from the microfilm master. UMI films
the text directly from the original or copy submitted. Thus, some thesis and
dissertation copies are in typewriter face, while others may be from any type of
computer printer.
The quality of this reproduction is dependent upon the quality of the
copy sutwnitted. Broken or indistinct print, colored or poor quality illustrations
and photographs, print bleedthrough, substandard margins, and improper
alignment can adversely affect reproduction.
In the unlikely event that the author did not send UMI a complete manuscript
and there are missing pages, these will be noted. Also, if unauthorized
copyright material had to be removed, a note will indicate the deletion.
Oversize materials (e.g., maps, drawings, charts) are reproduced by
sectioning the original, beginning at the upper left-hand comer and continuing
from left to right in equai sections with smaii overlaps.
Photographs included in the original manuscript have been reproduced
xerographically in this copy. Higher quality 6" x 9" black and white
photographic prints are available for any photographs or illustrations appearing
in this copy for an additional charge. Contact UMI directly to order.
ProQuest Information and Learning 300 North Zeeb Road, Ann Arbor, Ml 48106-1346 USA
800-521-0600
UMI'Reproduced with permission of the copyright owner. Further reproduction prohibited without permission.

Reproduced with permission of the copyright owner. Further reproduction prohibited without permission.
THE RELATIONSHIP BETWEEN EMPLOYEE TURNOVER
AND CUSTOMER SERVICE QUALITY
IN CASINO RESTAURANTS
By
Karl D. Brandmeir
Bachelor o f Arts Washington State University, Pullman
1969
A thesis submitted in partial fulfillment of the requirements for the
Master of Science Degree William F. Harrah College of Hotel Administration
Graduate College University of Nevada, Las Vegas
August 2001
Reproduced with permission of the copyright owner. Further reproduction prohibited without permission.

UMI Number; 1406384
Copyright 2001 by
Brandmeir, Karl D.
All rights reserved.
UMIUMI Microform 1406384
Copyright 2002 by Bell & Howell Information and Learning Company. All rights reserved. This microform edition is protected against
unauthorized copying under Title 17, Uniteid States Code.
Bell & Howell Information and Learning Company 300 North Zeeb Road
P.O. Box 1346 Ann Arbor. Ml 48106-1346
Reproduced with permission of the copyright owner. Further reproduction prohibited without permission.

UMV Thesis ApprovalThe Graduate College University of Nevada, Las Vegas
May 9 ^20_01
The Thesis prepared by
K arl D. Brandmeir
Entitled
THE RELATIONSHIP BETWEEN EMPLOYEE TURNOVER AND CUSTOMER SERVICE
QUALITY IN CASINO RESTAURANTS
is approved in partial fulfillment of the requirements for the degree of
Master o f Science in H otel Adm inistration
imination Committee Member
Examination Cojrt^itte^M enwer
■' Graduate College facu lty R e p re s e n tc ^ f i^ '^
PR/1017-53/I4W
A —Examination Committee Chair
Dean o f the Graduate College
11
Reproduced with permission of the copyright owner. Further reproduction prohibited without permission.

ABSTRACT
The Relationship between Employee Turnover and Customer Service Quality in Casino Restaurants
by
Karl D. Brandmeir
Dr. Seyhmus Baloglu, Examination Committee Chair Assistant Professor o f Tourism and Conventions
University o f Nevada, Las Vegas
This study investigates the relationship between employee turnover and perceived
service quality in casino restaurants. The restaurants were buffets, steakliouses, and
coffee shops in casinos in three geographic locations. The study uses both cross-sectional
and time-series data in a linkage model. It then analyzes the nature of this relationship on
both a concurrent and consecutive periods over ten months. The data were analyzed with
descriptive statistics, one-way ANOVA with Scheffe Post-Hoc tests, Pearson’s product
moment correlations. Hypotheses were tested by correlations and time-lagged
correlations.
The results show that steakhouses have the lowest turnover and the lowest poor
and failure ratings by customers. Buffet restaurants had the highest mean scores for wait-
time-to-be-seated. Front-of-the-House turnover has a strong correlation to customer
service quality. The correlations and time-lagged correlations showed that employee
111
Reproduced with permission of the copyright owner. Further reproduction prohibited without permission.

turnover is related to customer service quality over several time periods. This study
shows that employee turnover, particularly in the Front-of-the-House positions, has a
significant relationship with customer service quality not only in concurrent periods but
also in consecutive periods. The significant correlation in consecutive time periods has
implications for restaurant management. First, employee turnover continues to have a
negative effect on customer service quality in consecutive time periods. Second, the
continued loss of customers over several time periods could have an negative impact on
revenue as well as sales and promotional expenses.
IV
Reproduced with permission of the copyright owner. Further reproduction prohibited without permission.

TABLE OF CONTENTS
ABSTRACT................................................................................................................. iii
LIST OF FIGURES.....................................................................................................vii
LIST OF TABLES......................................................................................................viii
ACKNOWLEDGMENTS............................................................................................ ix
CHAPTER I INTRODUCTIONIntroduction........................................................................................................ 1Conceptual Framework.......................................................................................2Statement of Problem..........................................................................................3Purpose.............................................................................................................. 3Research Questions............................................................................................ 4Hypotheses.........................................................................................................4Significance of the Study.................................................................................... 8
Limitations.........................................................................................................9Definition of Terms............................................................................................ 9
CHAPTER 2 REVIEW OF LITERATUREIntroduction...................................................................................................... 12Employee Satisfaction and Turnover................................................................. 12Employee Satisfaction and Customer Satisfaction............................................. 14The Cost o f Turnover........................................................................................20
CHAPTER 3 METHODOLOGYIntroduction......................................................................................................24Research Design............................................................................................... 24Data Collection................................................................................................ 25Measurement and Data Coding......................................................................... 26Data Analysis................................................................................................... 27
CHAPTER 4 RESULTSAssumptions..................................................................................................... 29Descriptive Statistics.........................................................................................30Descriptive Statistics by Region........................................................................33
Reproduced with permission of the copyright owner. Further reproduction prohibited without permission.

VIDifferences Between Restaurant Types and Regions..........................................37Correlations by Restaurant Type........................................................................39Hypotheses Results...........................................................................................48Summary.......................................................................................................... 51
CHAPTER 5 CONCLUSIONS AND RECOMMENDATIONSConclusions and Recommendations.................................................................. 59Future Research.................................................................................................59
REFERENCES............................................................................................................ 61
APPENDIX A .............................................................................................................. 65
APPENDIX B .............................................................................................................. 6 8
APPENDIX C .............................................................................................................. 72
APPENDIX D .............................................................................................................. 79
VITA ......................................................................................................................... 94
VI
Reproduced with permission of the copyright owner. Further reproduction prohibited without permission.

LIST OF FIGURES
Figure 1 The Service Profit Chain...........................................................................2Figure 2 Customer Satisfaction and Customer Loyalty Relationship..................... 21Figure 3 Correlations and Time-lagged Correlations between Employee
Turnover and Customer Satisfaction.......................................................24
Vll
Reproduced with permission of the copyright owner. Further reproduction prohibited without permission.

LIST OF TABLES
Table 1 Descriptive Statistics for Variables (pooled data).....................................30Table 2 Descriptive Statistics for Buffet Restaurants........................................... 31Table 3 Descriptive Statistics for Steakhouse Restaurants....................................32Table 4 Descriptive Statistics for Coffee Shop Restaurants................................. 33Table 5 Descriptive Statistics for Region 1.......................................................... 34Table 6 Descriptive Statistics for Region I I ......................................................... 35Table 7 Descriptive Statistics for Region III........................................................ 36Table 8 ANOVA: Customer Experience and Employee Turnover by
Restaurant Type.................................................................................... 38Table 9 ANOVA: Customer Experience and Employee Turnover by Region....... 39Table 10 Correlations: Between Customer Experience and Employee Turnover ....40Table 11 Correlations: Between Customer Experience and Employee Turnover -
Buffet.................................................................................................... 41Table 12 Correlations: Between Customer Experience and Employee Turnover -
Steakhouse.............................................................................................42Table 13 Correlations: Between Customer Experience and Employee Turnover -
Coffee Shop...........................................................................................43Table 14 Correlations: Between Customer Experience and Employee Turnover -
Steakhouse and Coffee Shop..................................................................44Table 15 Correlations: Between Customer Experience and Employee Turnover -
Region 1.................................................................................................45Table 16 Correlations: Between Customer Experience and Employee Turnover -
Region II................................................................................................46Table 17 Correlations: Between Customer Experience and Employee Turnover -
Region I I I ..............................................................................................47
vin
Reproduced with permission of the copyright owner. Further reproduction prohibited without permission.

ACKNOWLEDGMENTS
Simple expression of gratitude does not cover the appreciation I hold for those
who guided my study. My committee (Dr. Seyhmus Baloglu, Dr. John T. Bowen, Dr.
Andrew H. Feinstein, and Dr. John A. Schibrowsky) provided valuable input that assisted
in keeping this study in perspective. The special guidance and counseling by Dr.
Seyhmus Baloglu made completion of the study possible.
None of this would have been a reality without the support of my family.
IX
Reproduced with permission of the copyright owner. Further reproduction prohibited without permission.

CHAPTER 1
INTRODUCTION
Employee turnover has been a major concern in the hospitality industry. Many
industry leaders have considered turnover as a necessary evil. Hinkin and Tracey (2000)
found that the cost of employee turnover rose nearly 400% from 1983 to 2000. Turnover
has been studied by researchers to try to understand its causes (Pizam and Thornburg,
2000; Deery, et al, 1999; Gilbert, 1998; Laker and Shimko, 1991; Hawk, 1976).
Wasmuth and Davis (1983) studied voluntary employee turnover in twenty hotels
in the United States and Europe and five departments in each hotel, and concluded that
employee turnover was primarily a result o f dissatisfaction with the current job rather
than the attraction to another job.
Woods and Macaulay (1989) examined employee turnover for six restaurant
companies and six hotel companies. Their study found nearly the same reasons for
employee turnover as the Wasmuth and Davis (1983) study. These and other studies
found that employee turnover in the hospitality industry was an accepted fact by
management.
The cost o f employee turnover has been a question o f considerable debate.
Wasmuth and Davis (1983) estimated the average turnover cost for an hourly employee
was S 1,500. By 1991, Woods and Macaulay revised the estimated cost o f turnover to be
about $2,500 for an hourly employee. A study of turnover costs by Hinkin and Tracey
1
Reproduced with permission of the copyright owner. Further reproduction prohibited without permission.

2(2000) has been the latest study to quantify employee turnover cost. Their estimate of
the turnover cost for a front desk clerk is 56,000. Their study grouped the costs into five
major categories: separation costs, recruiting and attracting costs, selection costs, hiring
costs, and low productivity costs. However, the lost revenue that results from customers
not returning because of dissatisfaction with service has not been taken into account.
Conceptual Framework
The service profit chain developed and studied by Heskett, Sasser, and
Schlesinger (1997) served as the conceptual framework for this study (Figure 1 ).
nord _ , r- , EMcmil Rl m ïu :Sm. — — Senxc Ckwh&
R ja ie l . 'n rS m ic B R D ftO n iiArm Lovaw GW, ( l%8). Biytow.SaiAamCURongljyilty.ariHniPilRifcmnig. Joinil ofSmxr Rsadi,KD.H19.
As Figure 1 clearly illustrates, employee satisfaction leads to employee loyalty, which
leads to the service quality the employees deliver. The service quality, on the other hand,
influences customer satisfaction which, then, influences customer loyalty. This study
focuses on a portion of that chain by examining the relationship between employee
loyalty and perceived service quality. Leonard Schlesinger found a direct link between
employee and customer satisfaction (Sasser and Lytle, 1987). This was the result of his
Partner/Manager Program during the time he was COO of Au Bon Pain. The link
became a part o f the book The Service Profit Chain by Heskett, et al, 1997.
Reproduced with permission of the copyright owner. Further reproduction prohibited without permission.

Statement o f Problem
Although significant research in the hospitality field has focused on employee
turnover or satisfaction and perceived service quality independently, little research has
been conducted on the nature of the relationship between employee turnover and
perceived service quality. In addition, the business and marketing literature revealed that
most studies have examined the relationship between employee satisfaction, customer
satisfaction, service quality, and business performance by using cross-sectional data
rather than longitudinal data (time series data). As suggested by Bernhardt, Donthu,
Kenneth (2000), these linkages may have been masked by many factors in a one-shot
study, and therefore time series data and time-lagged analysis are needed to uncover the
nature of relationship between employee satisfaction, customer satisfaction, and company
performance. Similar calls have been made by Wiley (1996) who has suggested that the
relationship between employee satisfaction and customer satisfaction be investigated in
both concurrent and successive time periods by time-lagged correlation analysis for a
linkage. More awareness is needed by restaurant management regarding the relationship
of employee turnover and guest experience. This study attempts to identify some
characteristics o f that relationship.
Purpose
The purpose of this study is to examine the relationship between employee
turnover and perceived service quality in casino restaurants in three regions. Specifically,
this study will examine this relationship for three restaurant concepts (steakhouse, coffee
shop, and buffet) over a lO-month period. In that respect, the links in both concurrent
Reproduced with permission of the copyright owner. Further reproduction prohibited without permission.

4and successive months will be examined to reveal short-term and long-term relationship
between the two constructs. Additionally, the study will treat employee turnover in both
disaggregated and aggregated nature by linking front-of-the-house, back-of-the-house,
and overall employee turnover to perceived service quality.
Research Questions
1. What is the nature of relationship between employee turnover and
perceived service quality in casino restaurants?
2. How does this relationship, i f any, vary in concurrent and successive time
periods?
3. To what extent does this relationship, i f any, show variations due to
different restaurant concepts such as steakhouse, coffee shop, and buffet?
Hypotheses
This study will investigate the relationship between employee turnover and
perceived service quality in three types of restaurants in the casino environment. As
pointed out before, by using time series data, the study will examine this relationship in
both concurrent [employee satisfaction(t), perceived service quality(t)] and successive
periods [employee satisfaction(t+l), perceived service quality(t+l)]. The hypotheses are
stated below;
H|: Front-of-the-House employee turnover will have a positive relationship to perceived
service quality (as measured by the percent of poor and failure scores).
Reproduced with permission of the copyright owner. Further reproduction prohibited without permission.

3HiA: Front-of-the-House employee turnover in the buffet restaurant will have a
positive relationship to perceived service quality (as measured by the percent of
poor and failure scores).
HiB: Front-of-the-House employee turnover in the steakhouse restaurant will have
a positive relationship to perceived service quality (as measured by the percent of
poor and failure scores).
Hic: Front-of-the-House employee turnover in the coffee shop restaurant will
have a positive relationship to perceived service quality (as measured by the
percent of poor and failure scores).
Hi: Back-of-the-House employee turnover will have a positive relationship to perceived
service quality (as measured by the percent of poor and failure scores).
H:a: Back-of-the-House employee turnover in the buffet restaurant will have a
positive relationship to perceived service quality (as measured by the percent of
poor and failure scores).
HzB: Back-of-the-House employee turnover in the steakhouse restaurant will have
a positive relationship to perceived service quality (as measured by the percent o f
poor and failure scores).
Hac'- Back-of-the-House employee turnover in the coffee shop restaurant will have
a positive relationship to perceived service quality (as measured by the percent o f
poor and failure scores).
H3 : Average employee turnover will have a positive relationship to perceived service
quality (as measured by the percent of poor and failure scores).
Reproduced with permission of the copyright owner. Further reproduction prohibited without permission.

6H]A: Average employee turnover in the buffet restaurant will have a positive
relationship to perceived service quality (as measured by the percent of poor and
failure scores).
Hsb: Average employee turnover in the steakhouse restaurant will have a positive
relationship to perceived service quality (as measured by the percent of poor and
failure scores).
H3c: Average employee turnover in the coffee shop restaurant will have a positive
relationship to perceived service quality (as measured by the percent of poor and
failure scores).
H4 : Front-of-the-House employee turnover in time period t will have.a positive
relationship to perceived service quality (as measured by the percent o f poor and failure
scores) in time period t+ 1.
H;A: Front-of-the-House employee turnover in the buffet restaurant in time period
t will have a positive relationship to perceived service quality (as measured by the
percent o f poor and failure scores) in time period t+1 .
H4B: Front-of-the-House employee turnover in the steakhouse restaurant in time
period t will have a positive relationship to perceived service quality (as measured
by the percent of poor and failure scores) in time period t+ 1 .
FLc: Front-of-the-House employee turnover in the coffee shop restaurant in time
period t will have a positive relationship to perceived service quality (as measured
by the percent o f poor and failure scores) in time period t+ 1 .
Reproduced with permission of the copyright owner. Further reproduction prohibited without permission.

7H): Back-of-the-House employee turnover in time period t will have a positive
relationship to perceived service quality (as measured by the percent of poor and failure
scores) in time period t+1.
Hsa: Back-of-the-House employee turnover in the buffet restaurant in time period
t will have a positive relationship to perceived service quality (as measured by the
percent of poor and failure scores) in time period t+ 1 .
Hsb: Back-of-the-House employee turnover in the steakhouse restaurant time
period t will have a positive relationship to perceived service quality (as measured
by the percent of poor and failure scores) in time period t+ 1.
H;c: Back-of-the-House employee turnover in the coffee shop restaurant in time
period t will have a positive relationship to perceived service quality (as measured
by the percent of poor and failure scores) in time period t+ 1.
He: Average employee turnover in time period t will have a positive relationship to
perceived service quality (as measured by the percent of poor and failure scores) in time
period t+1.
Hôa’ Average employee turnover in the buffet restaurant in time period t will have
a positive relationship to perceived service quality (as measured by the percent of
poor and failure scores) in time period t+1 .
HgB: Average employee turnover in the steakhouse restaurant in time period t will
have a positive relationship to perceived service quality (as measured by the
percent o f poor and failure scores) in time period t+ 1 .
Reproduced with permission of the copyright owner. Further reproduction prohibited without permission.

8Hfic: Average employee turnover in the coffee shop restaurant in time period t
w ill have a positive relationship to perceived service quality (as measured by the
percent of poor and failure scores) in time period t+ 1 .
Significance of the Study
Employee turnover is a significant problem in the restaurant industry. Measuring
the cost of employee turnover has been attempted by several studies, some of which were
noted above. Loveman (1998), by using customer loyalty and satisfaction curve,
demonstrates that dissatisfaction with service results in loss of the customer. In other
words, a company is less likely to retain the customer i f service levels fall below the
expectations. I f guest satisfaction is related to employee turnover, then the number of
guests who do not return because of service failure is also related to employee turnover.
Such a relationship could give restaurant management a more complete understanding of
the cost o f losing an employee.
The study contributes to hospitality, marketing, and management literature from
several perspectives. First, this study examines the linkage between employee turnover
and perceived service quality for casino restaurants. Second, the study examines this link
through the use of time series data in both concurrent and successive months by using
time-lagged assessment. Third, the study utilizes front-of-the-house, back-of-the-house,
and overall employee turnover to understand how they are related to perceived service
quality. Finally, this study uses actual employee turnover data rather than self-stated
employee satisfaction and/or intention to leave.
Reproduced with permission of the copyright owner. Further reproduction prohibited without permission.

Limitations
Only data from three regions was used. The generalization o f the results to other
regions is therefore limited by this restriction. All data are from a single gaming
corporation, which in turn limits the generalization of results to other companies.
The survey instrument also asks the customer about other experiences during their
visit. These other variables may have influenced the dining experience or influenced the
answers given about dining satisfaction. There may be other variables not included in the
questionnaire that influenced the dining experience and guest satisfaction. In addition,
there may be a third variable, such as operational climate, influencing both turnover rate
and dining experience. The data is also limited to what is measured by the questionnaire.
The ser\'ice quality measures are all single item measures; therefore the reliability of
measure cannot be assessed.
The study assumes that both customer satisfaction and employee turnover data
handled by the corporation have been accurately recorded and reported.
This study could not treat voluntary and involuntary turnover separately because
of the way the turnover data were reported by the corporation.
Definition of Terms
Autocorrelation: the correlation that may occur between adjacent values o f residual or
error terms in a time series (Frechtling, 1996).
Back-of-the-house: a hospitality industry term for restaurant employees that do not
usually have direct contact with the restaurant customer. These positions are: cook,
kitchen helper, pantry, dishwasher, steward, and night cleaner.
Reproduced with permission of the copyright owner. Further reproduction prohibited without permission.

10Buffet: a style of restaurant. The food is displayed in large quantities and the customer
serves their own portions. Service by the staff in the dining area is usually limited to
beverages and clearing soiled dishes and service items from the customer’s table. In the
casino setting, the meal is paid by the customer before dining. This style of restaurant in
a casino is frequently open 24 hours with short periods of closure between meal times for
changing the food selections and cleaning.
Coffee Shop: usually a casual atmosphere restaurant with a large selection of food items
that fit all meal periods. In a casino, these restaurants are usually open 24 hours a day
since the menu lends itself to all meal times.
Emplovee Turnover: the ratio of number of employees who left the restaurant to total
number of employees in each period (stated in percentages) (see Appendix II). For the
purposes of this study, voluntary and involuntary departures from employment are
included in the turnover data. However, transfers to other departments or regions are not
counted as departures since they still work for the same company.
Front-of-the-House: a hospitality industry term for restaurant employees that have direct
contact with the restaurant customer. These positions are: server, bus person, cashier,
hostess, bartender, and cocktail server.
Perceived Service Oualitv: performance of restaurants on product and service attributes
during service encounter.
Steakhouse: a table service restaurant that customarily specializes in steaks and seafood.
The beverage selection available is usually larger than in a buffet or coffee shop. This
type of restaurant is open for dinner and in some cases for lunch.
Reproduced with permission of the copyright owner. Further reproduction prohibited without permission.

11Time Lag Correlation: the correlation between variable A at time period t and variable
Bat time period t+ 1 .
Time Series: an ordered sequence of values of a variable observed at equally spaced time
intervals (Frechtling, 1996).
Reproduced with permission of the copyright owner. Further reproduction prohibited without permission.

CHAPTER 2
REVIEW OF LITERATURE
Introduction
Employee satisfaction and employee turnover have been linked in several studies.
Building on this relationship, additional studies have looked at employee satisfaction and
customer satisfaction and how that can lead to customer loyalty. Some organizations
have then assigned a lifetime value to the loyal customer, which quantifies the worth of
the loyal customer to the organization. The chapter is organized into four sections:
employee satisfaction and turnover, employee satisfaction and customer satisfaction,
customer satisfaction and customer loyalty, and cost o f employee turnover.
Employee Satisfaction and Turnover
Successful Meetings reported in 1997 that a PKF Consulting study found that
overall employee turnover had grown from 47.8 percent in 1985 to 53.2 percent in 1995.
This survey used the responses from 535 hotels that represented 53,462 employees.
Robert Mandelbaum, Director o f Research for PKF, stated that 50 percent of a hotel’s
monies are spent on employee-related costs.
Turnover rates, its causes, and strategies for employee retention have been the
subjects of many studies. Less attention has been given to the impact that high employee
12
Reproduced with permission of the copyright owner. Further reproduction prohibited without permission.

13turnover has had on the organizational culture in the hotel industry. Deery and Shaw (1999)
studied the relationship o f organizational culture and employee turnover. They suggested that
there is a turnover culture in the hotel industry. The implication from their work suggests that
hotel management must manage the work culture. They suggested that the management must
provide clear roles, job descriptions, supervisory support, the necessary equipment and less
overtime. Selecting the personalities that fit into the hotel culture is o f primary concern for a
starting point.
Organizational behavior has an impact on a managers’ behavior within the service
industry. Susskind, Borchgrevink. Brymer, and Kacmar (2000) developed a model for
measuring customer service behavior. In their model, “job satisfaction” and “supervisor
support” have an impact upon “ intent to quit” . The strong positive relationship between
standards of service, job satisfaction, and organizational commitment were perceived by the
managers as evidence that the organization had a commitment to customer service. Such a
relationship is likely to lead to increased satisfaction and commitment to their jobs.
Employee selection is a possible starting point for reducing the turnover problem. Laker
and Shimko (1991) investigated the use o f a realistic job preview experience (RJPE). They
found use of a realistic job preview (RJP). This was usually in the form of a presentation that
was verbal, a video, or even in print. They proposed that an actual experience could enhance the
organization’s ability to assess the individual and the potential employee’s ability to determine
whether the job fit their expectations. The use of a RJPE would put the applicant in a actual
work environment and therefore able to experience the work conditions. Mrs. Fields Cookies
Reproduced with permission of the copyright owner. Further reproduction prohibited without permission.

14developed such a program for managerial candidates and found that one-third of the applicants
decided not to be considered for the job after the RJPE.
Hcbee’s Franchising Corporation has developed guidelines that enhance the employee’s
self-esteem. They worked with Kathy Indermill, o f By Design, and implemented the SEEQ
System (Self-Esteem Enhancement Questionnaire). This technique was developed to influence
the feelings of alienation, frustration, and resentment. They found that this program reduced
their turnover and therefore the training investment.
Employee Satisfaction and Customer Satisfaction
The physical environment can influence the perception of service (Bitner 1992; Booms
and Bitner 1992; ZeithamI, Parasuraman, and Berry 1985). In fact, customer satisfaction may be
influenced by the environment (Bitner 1990). Bitner used the term servicescape to describe the
service environment. Not only is the perception of service by the customer influenced by the
servicescape, but also the employee perception of the work environment.
A direct link between job satisfaction and customer satisfaction was found in a study
conducted in the cruise industry (Testa, Skaruppa, and Pietrzak, 1998). The results imply that
hospitality and travel organizations can improve customer satisfaction by looking at three areas
of employee satisfaction: employee satisfaction with the company, with their supervisor, and
with their work environment. The employee perception of the company was the most significant
issue. Training and motivational programs may contribute to employee “ buy-in” to the company
vision. Leadership training for supervisors may provide the tools necessary to improve this area.
Motivational techniques, conflict resolution, moral building would enhance the supervisor’s
Reproduced with permission of the copyright owner. Further reproduction prohibited without permission.

15ability to work with employee issues that effect job satisfaction. The work environment for
the study included living conditions on ships. Similar to ships, time-off, equipment quality and
maintenance do relate to the hospitality industry in general. They suggested that further study o f
land based hospitality organizations was needed to gain a better understanding of the relationship
between the employee and the customer.
In 1985, Parasuraman, ZeithamI, and Berry proposed a Service Quality Model. This
model identified the service perception shortfalls in service organizations. They identified four
service gaps that in turn lead to a fifth gap; the difference between the customers expected
service and the perceived service. Thus the employees (of financial institutions in this case)
were providing services that did not meet the needs of the customers. The authors found that the
banking industry did not understand their customers service expectations. This same concept can
be applied to the restaurant industry. Robert Christie M ill (1996) suggested that employees
should be treated as customers. His point was that the same marketing tools could be used. The
needs and desires for customers and employees can be fulfilled. Under this concept, service
leaders should treat their employees in the same manner as they want their employees to treat the
customers.
Overall job satisfaction (which includes work, co-workers, supervision, and promotions)
is positively related to customer-orientation (Hoffman and Ingram 1992). Management should
be concerned about employee perceptions of the supervision they receive, working conditions,
company policies, as well as monetary structure and benefits. Employee satisfaction is much
more than a competitive income and perception is more determining than reality.
Reproduced with permission of the copyright owner. Further reproduction prohibited without permission.

16Spinelli and Canavos (2000) found that the top five employee satisfaction issues were
employee involvement, training, safety in speaking up, an effective manager, and attractive
benefits. These issues are similar in theme to other studies about employee satisfaction. The
authors also found that the top five issues from the customer perspective were friendly staff,
quick staff, cleanliness, responsive staff, and the hotel was recommended. Of these, staff
response and value received were predictors of guest satisfaction. O f particular interest was the
fact that the questionnaire used in their study was designed so that four of the questions were the
same for guests and employees. I f employees believe they care about the guest’s stay, then the
guest feels the same.
The interrelationship o f service quality and customer satisfaction has been accepted as
key to customer retention. The use of Guest Comment Cards (GCC) has been the usual means of
identifying customer satisfaction. However, Gilbert and Horsnell (1998) found that the surveys
currently in use do not adequately assess a customer’s poor experience. Such an assessment
needs to be both valid and reliable i f management is to use the results as a basis for decisions.
Three key areas of difficulty were identified in relation to comment cards: creation of a biased
sample; management-made decisions about service attributes without knowing i f those particular
attributes were important to the customer’s satisfaction: and, when the customer indicated
dissatisfaction, there was insufficient detail. Identifying the service attributes that effected the
dissatisfaction could affect the recovery strategies management might employ.
Customer expectations have been investigated in numerous studies involving customer
satisfaction and dissatisfaction. However, the specific nature of the expectations is still in
debate. ZeithamI, Berry, and Parasuraman (1993) proposed a conceptual model for customer
Reproduced with permission of the copyright owner. Further reproduction prohibited without permission.

17expectations of service. The model has three levels of customer expectations: desired service;
adequate service; and predicted service. They suggest that the difficulty of empirical testing of
these expectations in order to establish validity would be the wording and scales of
measurement. While their earlier studies (1985, 1988) established the general standards and
criteria used by customers to evaluate services, they felt that more work was needed in relation to
the three levels of service.
Two obstacles face the hospitality industry with regard to improving service quality: first,
knowing the aspects of a hotel experience that the customer uses for evaluation and second,
having a reliable and valid measurement instrument. Gundersen, Heide, and Olsson (1996)
tackled this problem. They chose business travelers as the target market. A survey instrument
was developed that applied only to the hotel industry. This was done because of the
inconsistencies they saw in the empirical studies using the SERVQUAL scale (Parasuraman et
al., 1988) across different service industries. Tangible and intangible aspects o f the customer
experience were included in the survey instrument. Tangible aspects of the housekeeping
department and the intangible aspects of the reception desk were the most important factors in a
customer evaluation of hotel experience. The implication for hotel management is to concentrate
on these two aspects to achieve an improvement in overall customer satisfaction.
It has been suggested that hospitality organizations should be proactive in building
relationships (Scanlan and McPhail, 2000). Personalization, social bonding, reliability and
familiarization were found to be the attributes that build guest relationships. They found that
recognition of personalization and social bonding are relatively new as important attributes.
Reproduced with permission of the copyright owner. Further reproduction prohibited without permission.

18Berry (1995) included customization and personalization in social bonding. However,
Parasuraman, ZeithamI, and Berry (1985,1988) included personalization in empathy.
The difference between a satisfied customer and a loyal customer can be quite profound.
Xerox found that a totally satisfied customer was six times more likely to repurchase a Xerox
product than a satisfied customer (Jones and Sasser, 1995). The Xerox discovery led Jones and
Sasser to conduct additional research, which confirmed the relationship between a totally
satisfied customer (loyal) and a satisfied customer. One measure of customer loyalty has three
categories: intent to repurchase, primary behavior, and secondary behavior. Intent to repurchase
is an indicator o f future behavior. Primary behavior measures the actual behavior in terms of
recency, frequency amount, retention, and longevity. Secondary behavior is associated with
customer referrals. Linking secondary behavior to actual purchases is difficult. Word of mouth
could be a positive stimulus to prospective customers (Mangold, Miller, Brockway, 1999).
Wiley (1996) found that employee satisfaction and customer satisfaction were strongly
and positively linked. He concluded that employee retention was related to the quality of service
that a customer received. He suggested that additional time-lagged correlation analysis research
would help establish cause and effect with respect to customer intentions and organizational
changes.
Wiley (1991) found that employee and customer satisfaction were not positively related
to net income of the firm. In fact, customer satisfaction was negatively related to net income.
This study was cross-sectional. However, a longitudinal analysis of customer satisfaction and
profitability has shown a significant relationship (Bernhardt, Donthu, and Kennett, 2000). The
managerial implications suggest that investments in customer service and satisfaction need to be
Reproduced with permission of the copyright owner. Further reproduction prohibited without permission.

19evaluated over time to determine their impact upon the customer and the organizations
profitability.
Benjamin Schneider (1985) proposed that people make the work organization, not the
organization structure making the people. This perspective theorized that organization structure
and process will change as the people change. The organizational environment is determined by
its member’s attributes. This grew from his earlier work (1980) with bank employees’
perception of organization ser\ ice to its customers and the customers’ perception of the same
service. Employees were sensitive to the customers’ perception of the service quality.
Schneider and Bowen (1985) extended the employee and customer service perceptions.
The intangibility of services makes the basis for service evaluation the context in which the
service was delivered and how it was delivered. Parkington and Schneider (1979) found that if
service employees felt management had a different perspective of service, then the result was
low satisfaction, strong turnover intentions and that the customer had the perception of poor
service quality. Customers received cues from the employees and used these cues to evaluate the
quality o f the service(s) received. They also found that employee turnover and customer
turnover were related.
Happy employees can lead to loyal customers (Atkins, Marshall, and Javalgi, 1996). A
strong relationship exists between employee satisfaction and the intent to return or recommend
the service to other. The recommendation was also made that marketing must work closely with
human resources to influence the work environment and job satisfaction. However, for the
organization to continue improving employee and customer satisfaction continued research into
perceptions of satisfaction w ill be necessary. Using this feedback to formulate future strategic
Reproduced with permission of the copyright owner. Further reproduction prohibited without permission.

20plans can give marketers confidence that they are heading in the direction o f increasing
employee and customer satisfaction.
The Cost o f Tumover
Heskett, Jones, Loveman, Sasser, and Schlesinger (1994) concluded that profit and
growth were the result of customer loyalty. Customer loyalty was the result o f customer
satisfaction and that was influenced by the value of the services received by the guest. Figure 2
illustrates the relationship between customer satisfaction and customer loyalty. The value
created was the product o f satisfied, loyal and productive employees. Their work on the service-
profit chain was the result from analysis of successful service companies. Customer satisfaction
was shown to be the key driver o f company growth and profitability. The direct linking of
customer satisfaction to employee productivity, loyalty, and satisfaction has given rise to internal
systems to drive the employee component o f their model. Employee retention and productivity
was the key to creating value.
Hinkin and Tracey (2000) included low-productivity costs in their study of the cost of
employee tumover. The turnover-cost categories were separation costs, recruiting and attracting
costs, selection costs, hiring costs, and low-productivity costs. In fact, low-productivity costs
were the largest of the five general categories: ranging from 55.5 percent to 69.4 percent of the
total tumover cost for a front desk associate. They also pointed out that tumover seems to be the
primary factor contributing to service quality reduction and a sense o f bumout, particularly for
front-line supervisors. The implication was that retention and development o f supervisors could
provide a competitive advantage for hotels.
Reproduced with permission of the copyright owner. Further reproduction prohibited without permission.

21
100%
8 0%
6 0%
L o y a lly
(re te n tio n )
4 0%
20%
Satisfaction
m easure
2. Customer Satisfaction and Customer Loyalty RelationshipFrom: Loveman, G.VV. , (1998). Employee Satisfaction, Customer Satisfaction, and Financial Performance, Journal of Service Research. 1(1), 26
Figure
The five major categories o f employee cost include: separation costs, recruiting
and attracting costs, selection costs, hiring costs and productivity losses (Hinkin and Tracey,
2000). Not included was the loss o f future revenue from the dissatisfied customers who had no
intention o f returning.
Absenteeism and voluntary tumover were found to be mostly work related factors versus
demographic factors in a study by Pizam and Thornburg (2000). Sixty-two central Florida hotels
had a voluntary tumover rate of 69.5 percent. While they did not attempt to estimate the total
Reproduced with permission of the copyright owner. Further reproduction prohibited without permission.

22cost o f employee tumover, lost revenue from disgruntled guests was mentioned as an indirect
cost.
The literature review did not find any research that directly studied the relationship
between employee tumover and guest satisfaction as measured by the guest’s intent to retum.
The linking of employee satisfaction and customer satisfaction has been well documented
as seen above. The linking of customer satisfaction and financial performance has mixed results.
Changes in the level of quality will change the company’s reputation over time (Anderson,
Fomell, and Lehmann, 1994). They also found that current quality and past satisfaction are
functions of current customer satisfaction. Thus, customer satisfaction in one period is carried
over into future periods. Customer satisfaction also effects the retum-on-investment (ROI) o f the
company, which also is a time-lagged variable. An increase of one point in the customer
satisfaction each year for five years (five points cumulative) represented an 11.5 percent increase
in ROI. It was felt that the calculations were modest since they were using Swedish firms in the
study and the firm size was smaller than those in the Business Week 1000.
Wiley (1996) found that in a business services setting not only were employee and
customer satisfaction positively related but also business performance. His study of a retail
chain found that employee satisfaction was not positively related to business performance.
Business performance was actually negatively related to customer satisfaction. It was suggested
that to demonstrate causality through the use of correlation analysis, that a time lag study was
needed. Correlations between employee and customer satisfaction were found to be higher in
successive periods (Ashworth, Higgs, Schneider, Shepherd, and Carr, 1995).
Reproduced with permission of the copyright owner. Further reproduction prohibited without permission.

23Loveman (1998) proposes the service profit chain as a tool for improving performance
in service organizations. However, he suggests that more large-sample studies are needed to
show generality.
Reproduced with permission of the copyright owner. Further reproduction prohibited without permission.

CHAPTER 3
METHODOLOGY
Introduction
This chapter consists o f the research design, data collection methods, data coding, and
data analysis techniques to be used in this study. A ll the data used for this study is
secondary. Data analysis techniques and constraints are covered.
Research Design
The study uses pooled cross-sectional time-series design to understand the
relationship between employee tumover and perceived service quality.
Januarym ____
February(t+1)
March(t+2)
April(t+3)
May(t+4)
June(t+5)
July(t+6)
August(t+7)
September(t+8)
October(t+9)
ET ET ETA
ET ETA ET
fes
ET
es4es es es
4es
4es
4es
4es
ti
es
Figure 3. Correlations and Time-Lagged Correlations between Employee Tumover and Customer SatisfactionET: Employee TumoverCS: Customer Satisfaction_______ Correlation between Employee Tumover (t) and Customer Satisfaction (t)------------ Time-Lagged Correlation between Employee Tumover (t) and Customer Satisfaction (t-t-1 )
24
Reproduced with permission of the copyright owner. Further reproduction prohibited without permission.

25Data Collection
The study uses secondary data for employee tumover and customer satisfaction.
The employee tumover data comes from human resource records of properties operating
in three regions. The service quality data comes from customer satisfaction surveys from
the same corporation’s marketing department.
The human resources department of the casino corporation compiles the tumover
data. It has been recorded and reported consistently across restaurants and regions on
monthly basis. Employee tumover data for each restaurant for the study came directly
from the corporation personnel records at each location. The restaurants in each of the
three locations are a buffet, steakhouse, and coffee shop. The tumover data was
separated into front-of-the-house and back-of-the-house categories.
The customer satisfaction data for this study were collected through the customer
satisfaction survey of a casino corporation for a ten-month period of January through
October. All the customers who used their frequent player card were included in the
population of possible recipients for the satisfaction survey. This data is then sent to a
contracted research company that handles the actual survey and tabulates the results. The
contracted research company filters the data. The filtering process is conducted to
remove any duplicate customer listings and removes any customers who have received a
survey in the previous twelve months. This procedure ensures that the data for each
month is a new set o f previously un-surveyed customers. This filtered list is then used
for generating a random sample for mailing of the survey instrument. The filtering
process and the random selection sampling are done electronically with no human
selection. A postage-paid retum envelope is included in the mailing. The completed
Reproduced with permission of the copyright owner. Further reproduction prohibited without permission.

26surveys are mailed directly to the research company from the customer. The sample
size for each month was about 2,700. The results are tabulated and reported back to the
casino corporation by the research company.
Measurement and Data Coding
The employee tumover has been measured and reported as the ratio of number of
employees that left to total number of employees for each month for three restaurants
(buffet, coffee shop, and steakhouse) in each region. The figures have been reported for
both back-of-the-house (BOH) and front-of-the-house (FOH) at property level in
percentages (by multiplying the ratio by 100). For the purpose of the study, an overall
tumover rate was also calculated by taking the average o f BOH and FOH ratios.
The customer satisfaction survey included six questions about each restaurant and
customers evaluated each restaurant on the same set o f six attributes: friendly/helpful
staff, food quality, price/value, waiting time to be seated, food variety, and
ambiance/décor. They were measured by using five letters: A=Excellent, B=Good,
C=Fair, D=Poor, and F=Failure. A “don’t know” option has also been provided. The
data for each month has been reported by showing percent of customers checking each
category (frequencies for each item). In other words, the data have been aggregated at
property level for each month. This study used percent o f customers who checked D
(poor) or F (failure) since the focus was on the lost customer. Also, the study focused on
first five quality attributes by excluding atmosphere/decor because it was judged not to be
related to either BOH or FOH tumover rate. In addition, an overall perceived service
quality measure was computed by averaging the five individual attributes.
Reproduced with permission of the copyright owner. Further reproduction prohibited without permission.

27surveys are mailed directly to the research company from the customer. The sample
size for each month was about 2,700. The results are tabulated and reported back to the
casino corporation by the research company.
Measurement and Data Coding
The employee tumover has been measured and reported as the ratio o f number of
employees that left to total number o f employees for each month for three restaurants
(buffet, coffee shop, and steakhouse) in each region. The figures have been reported for
both back-of-the-house (BOH) and front-of-the-house (FOH) at property level in
percentages (by multiplying the ratio by 100). For the purpose of the study, an overall
tumover rate was also calculated by taking the average of BOH and FOH ratios.
The customer satisfaction survey included six questions about each restaurant and
customers evaluated each restaurant on the same set o f six attributes; friendly/helpful
staff, food quality, price/value, waiting time to be seated, food variety, and
ambiance/décor. They were measured by using five letters: A=Excellent, B=Good,
C=Fair, D=Poor, and F=Failure. A “don’t know” option has also been provided. The
data for each month has been reported by showing percent of customers checking each
category (frequencies for each item). In other words, the data have been aggregated at
property level for each month. This study used percent o f customers who checked D
(poor) or F (failure) since the focus was on the lost customer. Also, the study focused on
first five quality attributes by excluding atmosphere/decor because it was judged not to be
related to either BOH or FOH tumover rate. In addition, an overall perceived service
quality measure was computed by averaging the five individual attributes.
Reproduced with permission of the copyright owner. Further reproduction prohibited without permission.

28Both data sets were then entered into SPSS by matching the regions,
restaurants, and months. This resulted in 90 cases pooled at region and property level
over time (3 restaurants X 3 regions X 10 months = 90). This allows the researcher to
analyze linkages by using both pooled cross-sectional time-series data and individual
restaurant data.
Data Analysis
The data analyses involve several stages. First, the data was explored for several
assumptions. The data were assessed for normality, linearity, and seasonality. The
seasonality is examined by autocorrelations. An autocorrelation was deemed significant
at the 95% confidence level i f its value falls outside of the following range (Frechtling,
1996);
-1.96/sqrt(n)<r< 1.96/sqrt(n)
where
n = number of data points or observations
r = autocorrelation value
Second, Analysis of Variance (ANOVA) was used to see i f employee tumover
and perceived service quality measures vary by regions and restaurant types. The
purpose of this was to understand the data better and help interpretation of hypotheses
testing at restaurant and region level. The Scheffe Post-Hoc tests were used since it is a
conservative method of testing for significance of differences. The alpha level was set at
0.05.
Reproduced with permission of the copyright owner. Further reproduction prohibited without permission.

CHAPTER 4
RESULTS
Assumptions
All variables met the normality and linearity assumptions except for the
price/value variable (see Appendix C). Several transformations were attempted;
however, no significant improvement in the distribution was gained. The seasonality is
examined by autocorrelations. An autocorrelation was deemed significant at the 95
percent confidence level i f its value falls outside of the following range (Frechtling,
1996);
- 1.96/sqrt (n)<K 1.96/sqrt (n)
where
n = number o f data points or observations
r = autocorrelation value
Since there are 10 months (n=10), an autocorrelation will be significant i f its value falls
outside of -0.62 and 0.62.
The autocorrelation figures at each property level are provided in Appendix D.
The horizontal lines indicate standard errors on either side of zero. The vertical bars that
do not exceed these lines are not significantly different from zero at the 0.05 level of
significance. As the figures indicate, autocorrelation is not present, suggesting that the
29
Reproduced with permission of the copyright owner. Further reproduction prohibited without permission.

30series is stationary (that is, the mean of the series is constant over time). Therefore, no
transformation of the data was needed.
Descriptive Statistics
Table 1 shows waiting time to be seated has the highest score at 5.23 percent,
while the lowest score is for friendly/helpful staff at 2.2 percent.
Table 1 Descriptive Statistics for Variables (pooled data) N=90
Variables Mean Sid. Dev. Minimum Maximum
Friendly/helpthl staff (%)' 2.20 1.04 .00 5.10
Food Quality (%)' 3.48 1.50 .80 7.90
Price/value (%)' 4.40 1.93 1.20 17.50
Waiting time to be seated (%)' 5.23 2.09 .80 13.50
Food variety (%) ‘ 3.10 1.65 .40 10.30
Overall experience (%)‘ 3.68 1.08 1.40 6.98
FOH tumover (%)^ 3.82 3.91 .00 14.75
BOH tumover ( % Ÿ 3.47 4.58 .00 28.57
Average tumover (% /
1 : Measured as the nercentaee oi resoonses that is
3.64
I or 2 on a
2.91
3-noint scale I l=failure.
.00
î=tx)or. 3=lair. 4=cood.
14.29
5~excelltfni).
2: Is an average o f the individual questions.
3: Computed - (number o f terminations divided by the number o f employees) times I (X).
4: Is the average o f FOH and BOH.
Reproduced with permission of the copyright owner. Further reproduction prohibited without permission.

31The descriptive statistics for each restaurant type (buffet, steakhouse, coffee
shop) are in Tables 2 through 4. Buffet restaurants have the highest mean score for
Waiting time to be seated (Table 2).
Table 2 Descriptive Statistics for Buffet Restaurants - n=30
Variables Mean Sid. Dev. Minimum Maximum
Friendly/fieipful staff (%)' 2.05 .81 .80 3.64
Food Quality (%)' 3.94 1.62 1.50 7.90
Price/value (% )‘ 4.40 1.35 1.20 8.00
Waiting time to be seated (% )‘ 6.32 2.22 .80 13.50
Food variety (%) ' 3.61 1.87 1.50 10.30
Overall experience (%)' 4.06 .93 2.64 6.98
FOH tumover ( % Ÿ 3.59 3.39 .00 13.16
BOH tumover ( % Ÿ 2.85 3.00 .00 10.00
Average tumover ( % Ÿ
1 ; Measured as the nercentace o f resoonses that ts
3.22
1 or 2 on a
2.44
j.Doini scale I l=tatlure.
.00
2=noor. 3=tair. 4=Bood.
8.00
5=excellentl.
2: Is an average o f the individual questions.
3; Computed - (number o f terminations divided by the number o f employees) times 100.
4: Is the average o f FOH and BOH.
Reproduced with permission of the copyright owner. Further reproduction prohibited without permission.

32The steakhouse restaurants as a category have the lowest Wait-time-to-be-
seated score of 3.50 percent (Table 3). The steakhouses also had the lowest Front-of-
the-House employee tumover with 1.36 percent. Steakhouses, however, received the
highest poor and failure scores for Price/value with 4.61 percent.
Table 3 Descriptive Statistics for Steakhouse Restaurants - n=30
Variables Mean Std. Dev. Minimum Maximum
Friendly/helpful staff (%)' 1.68 .99 .00 3.70
Food Quality (%)' 2.36 1.14 .80 5.80
Price/value (%)' 4.61 2.95 1.60 17.50
Waiting time to be seated (% )‘ 3.50 1.13 1.60 6.70
Food variety (%) ' 2.09 1.61 .40 8.90
Overall experience (% )' 2.85 1.07 1.40 6.16
FOH tumover (%)^ 1.36 2.86 .00 10.53
BOH tumover ( % Ÿ 4.19 6.01 .00 28.57
.Average tumover (%)■*
1 : Measured as the oercentaee ol resoonses that ts
2.78
1 or 2 on a
2.84
5-ootnt scale 11 =latlure.
.00
2=noor. J=!atr. 4=Eood.
14.29
5=e.xceilcntl.
2; Is an average o f the individual questions.
3: Computed - (number o f terminations divided by the number o f employees) times lOU.
4: Is the average o f FOH and BOH.
Reproduced with permission of the copyright owner. Further reproduction prohibited without permission.

33As Table 4 shows, Coffee Shops received the highest mean scores for
Friendly/helpful staff. Food quality, and FOH tumover.
Table 4 Descriptive Statistics for Coffee Shop Restaurants - n=30
Variables Mean Std. Dev. Minimum Maximum
Friendly/helpflil staff (% )‘ 2.87 .97 .60 5.10
Food Quality (%)' 4.14 1.02 2.00 6.00
Price/value (%)' 4.19 .90 2.00 6.20
Waiting time to be seated (% )‘ 5.88 1.58 2.70 8.70
Food variety (%) ' 3.60 .84 2.10 5.20
Overall experience (%)' 4.13 .70 2.16 5.54
FOH tumover (%)^ 6.49 3.69 .00 14.75
BOH tumover (%)^ 3.36 4.28 .00 15.00
Average tumover ( % f
1 : Measured as ibe Dercenlauc ol responses that is
4.93
1 or 2 on a
3.05
5-ooinl scale ( 1 =lailure.
.00
2=poor. 3=tair. 4=cood.
12.99
5=e.xceilent).
2: Is an average o f the individual questions.
3: Computed - (number o f terminations divided by the number o f employees) times 100.
4: Is the average o f FOH and BOH.
Descriptive Statistics by Region
Tables 5 through 7 contain the descriptive statistics for each of the three regions.
Wait-time*to-be-seated was the variable that received the highest score in each region,
with Region I having the highest. Region I has the highest tumover percent for Front-of-
the-House, Back-of-the-House, and Average tumover for all the regions (Table 5). This
region also has the highest score for Overall experience, with 3.81 percent. The only
Reproduced with permission of the copyright owner. Further reproduction prohibited without permission.

34category in which this region did not have the highest score was for Food quality; it
was the lowest score across the regions.
Table 5 Descriptive Statistics for Region 1 - n=30
Variables Mean Std. Dev. Minimum Maximum
Friendly/lieipfui staff (%)' 2.24 1.00 .60 4.70
Food Quality {%)' 3.05 1.07 .80 5.80
Price/value (%)' 4.93 2.87 1.20 17.50
Waiting time to be seated (%)' 5.56 1.89 2.30 9.00
Food variety (%) ‘ 3.30 1.95 1.50 10.30
Overall experience (%)‘ 3.81 .76 2.16 6.16
FOH tumover (%)^ 4.57 3.69 .00 11.11
BOH tumover ( % Ÿ 4.17 6.47 .00 28.57
Average tumover (%)*
1 ■ V Ia - ic i ii*» * /! ne rh>» i \ t pr>en/snei*e tK n t te
4.37
1 1
3.13
.n in tn f i 1 s t m l i ip n
.00 14.29
r«»»l Ir tn t 1
2: Is an average o f the individual questions.
3: Computed - (number o f terminations divided by the number of employees) limes 100.
4: Is the average o f FOH and BOH.
Reproduced with permission of the copyright owner. Further reproduction prohibited without permission.

35Region II has the highest mean for Food quality but the lowest mean for
Waiting time to be seated (Table 6).
Table 6 Descriptive Statistics for Region 11 - n=30
Variables Mean Std. Dev. Minimum Maximum
Friendly/helpful staff (%)' 2.23 1.30 .00 5.10
Food Quality (%)' 3.89 1.77 1.20 7.60
Price/value (%)' 4.19 1.01 1.60 6.70
Waiting time to be seated (%)‘ 4.90 1.85 1.60 8.70
Food variety (%) ' 3.02 1.47 .60 5.20
Overall experience (%)’ 3.64 1.21 1.56 5.54
FOH tumover ( % f 4.55 4.84 .00 14.75
BOH tumover (%)■’ 3.49 3.41 .00 11.43
Average tumover (% /
I : Measured as die oercentaee ol rcsnonscs that is
4.02
1 or 2 on a
3.25
j-ooint scale 1 Mlailurc.
.00
2=ooor. 3=tair. 4=oood.
12.99
5=e.xcellentl.
2: Is an average o f the Individual questions.
3: Computed - (number o f terminations divided by the number o f employees) times 100,
4: Is the average o f FOH and BOH.
Reproduced with permission of the copyright owner. Further reproduction prohibited without permission.

36Region III had the lowest tumover percent for all three-turnover categories
(Table 7). This region also had the lowest percent scores in the Waiting time to be
seated. Price/value, and Friendly/helpful staff categories.
Table 7 Descriptive Statistics for Region III - n=30
Variables Mean Std. Dev. Minimum .Maximum
Friendly/helpful safF(%)‘ 2.13 .80 .80 4.20
Food Quality (%)' 3.51 1.51 .80 7.90
Price/value (% )‘ 4.08 1.32 1.60 8.00
Waiting time to be seated (% )’ 5.25 2.50 .80 13.50
Food variety (%) ' 2.98 1.52 .40 6.60
Overall e.xperience (%)' 3.59 1.23 1.40 6.98
FOH tumover (%)^ 2.33 2.53 .00 8.82
BOH tumover (%)^ 2.75 3.14 .00 11.54
Average tumover (% /
1 : Measured as the oercentaee ol resoonses that is
2.54
1 or 2 on a 5-
1.92
ooint scale 11 failure.
.00
2=ooor. 3=iair. 4=eood.
6.69
S=c.'tcellcm).
2: Is an average o f the individual questions.
3: Computed - (number o f terminations divided by the number of employees) times 100.
4; Is the average o f FOH and BOH.
Reproduced with permission of the copyright owner. Further reproduction prohibited without permission.

37Differences Between Restaurant Types and Regions
Analysis of Variance bv Restaurant Tvne
One-way analysis o f variance with post hoc Scheffe test, were conducted on
tumover and service quality variables. The purpose of this is to see i f the relationship
between employee tumover and service quality should be examined at restaurant type and
region level. The letter following a score indicates the restaurant type with which it has a
significant difference: i.e.; the Friendly/helpful staff score for Buffets is followed by a
“C” , which indicates that there is a significant difference between the Buffet score and
the Coffee Shop score.
The steakhouses have a significant difference from Buffets and Coffee Shops in
five of the nine variables (Food quality. Waiting time to be seated. Food variety. Overall
experience, and FOH tumover) and differ only from Coffee Shops for the variables
Friendly/helpful staff and Average tumover (Table 8).
Back-of-the-house tumover (BOH) and Price/value do not show any significance
between restaurant types (Table 8).
Analysis of Variance bv Region
ANOVA was also calculated for the regions to test for any differences between
the regions. The results show that Region I is significantly different from Region III with
respect to average tumover (Table 9). Because of no difference between regions on the
other variables, it made sense to pool the data across regions by restaurant type.
Reproduced with permission of the copyright owner. Further reproduction prohibited without permission.

38Table 8 ANOVA: Customer experience and employee tumover bv restaurant type
Variables Buffet (B) n=30
Steakhouse (S) n=30
Coffee Shop (C) n=30
F value Significance
Fiiendly/heipful staff 2.05 (C) 1.68 (C) 2.87(B, g) 12.9 .000*
Food Quality 3.94(g) 2.36(B, C) 4.14(g) 17.0 .000*
Price/value 4.40 4.61 4.19 .3 .710
Waiting time to be seated 6.32(g) 3.50(B, C) 5.88(g) 23.6 .000*
Food variety 3.61(g) 2.09(B, C) 3.60(g) 10.1 .000*
Overall experience 4.06(g) 2.85(B, C) 4.13(g) 18.7 .000*
FOH tumover 3.59(g,C) 1.36(B,C) 6.49(B, g) 17.8 .000*
BOH tumover 2.85 4.19 3.36 .6 .525
Average tumover 3.22 2.78 (C) 4.93(g) 4.9 .009*
Note: The letters (B. S, and C) denote BuiTei. Steakhouse. and Co (Tee Shop and indicate which ones are significantly dilTerent. For
example, for fricndly/hclpful staff. Buffet and Steakhouse are significantly different from Coffee Shop.
Measured as the percentage o f responses that are I or 2 on a 5-point scalef l=tailure. 2=poor, 3=fair, 4=good.5=excellent).
Reproduced with permission of the copyright owner. Further reproduction prohibited without permission.

39Table 9 ANOVA: Customer experience and employee turnover bv region
Variables Region I (I) n=30
Region 11 (II) n=30
Region III (III) n=30
F value Significance
Friendly/helpfiil staff 2.24 2.23 2.13 .11 .899.
Food Quality 3.05 3.89 3.51 2.34 .100
Price/value 4.93 4.19 4.08 1.7 .181
Waiting time to be seated 5.56 4.90 5.25 .7 .484
Food variety 3.30 3.02 2.98 .3 .722
Overall experience 3.81 3.64 3.59 .4 .705
FOH turnover 4.57 4.55 2.33 3.4 .037*
BOH turnover 4.17 3.49 2.75 .7 .494
Average turnover
■ 1 . _: r ___ ». n nr ____u
4.37(111) 4.02 2.54(1) 3.5 .034*
Note: The letters (I. II. and III) denote Region I. Region II. and Region III and indicate which ones are significantly dilTerent.
Measured as the percentage o f responses that are I or 2 on a 5-point scalef I failure. 2=poor. 3=fair. 4=good.5=excelIent).
Correlations by Restaurant Type
The correlations used for hypotheses testing are reported in this section. Only
concurrent and consecutive periods at t+1 (LAGSl) were used to test hypotheses. The
consecutive periods t+2 (LAGS2) and t+3 (LAGS3) were reported and discussed after
hypothesis testing to explore the nature of the relationship over longer periods. As Table
10 shows, front-of-the-house (FOH) turnover has significant correlations to customer
experience. Average turnover (AVETURN) also has some significant correlations to
customer experience variables, fnendly/helpfiil staff in the concurrent time period.
Friendly/helpful staff and Food Quality in the consecutive time period as well as LAGSl.
Reproduced with permission of the copyright owner. Further reproduction prohibited without permission.

40Table 10 Correlations: between customer experience and employee turnover - Pooled
Data
Friendly/helpfulStaff
FoodQuality
Price/vaiue
Wait time to be seated
FoodVariety
OverallExperience
FOH (N=90) .405'* .2 5 0 " -.006 .170 .124 .2 4 9 "
FOH, LAGSl (N=81) .3 5 0 " .2 9 1 " .182 .184 .331" .3 5 8 "
FOH, LAGS2 (N=72) .4 5 3 " .3 6 6 " .0 3 6 " .277" .318" .390"
FOH. LAGS3 (N=63) .3 3 5 " .256' .137 .134 .345" .332"
BOH (N=90) -.061 -.084 -.015 .001 .039 -.029
BOH, LAGSl (N=81) .020 .065 -.100 -.116 -.064 -.067
BOH. LAGS2 (N=72) .198* -.027 .001 .045 -.010 .047
BOH. LAGS3 (N=63) -.054 -.066 .154 -.156 -.088 -.072
AVETURN (N=90) .224* .101 -.016 .115 .114 .145
AVETURN, LAGSl (N=81) .245' .242' .040 .029 .166 .181
AVETURN, LAGS2 (N=72) .4 4 3 " .212' .024 .211' .194 .285'
AVETURN. LAGS3 (N=63)
Ê ««M ■ S É ««MM É f k
.178
/ I
.117 .211' -.035 .158 .155
‘ ^correlation is significant at 0.05 level ( I tailed).
Note: Sample size (N ’s) is specified in parentfieses.
Measured as tfie percentage o f responses tfiat are I or 2 on a 5-point scale) 1 =failure. 2=poor, 3 -fa ir, 4=good.5=e.xcellent).
Reproduced with permission of the copyright owner. Further reproduction prohibited without permission.

41There were no significant positive correlations in buffet restaurants between
employee turnover and customer service quality variables. This was an unexpected
result.
Table 11 Correlations: between customer experience and employee turnover - Buffet
Friendly/helpfulStaff
FoodQuality
Price/value
W ait time to he seated
FoodVariety
OverallExperience
FOH (n=30) .037 -.109 -.136 -.424*' -.209 -.357*
FOH, LAGSl (n=27) -.133 -.013 -.138 -.102 -.084 -.140
FOH, LAGS2 (n=24) .264 .093 -.193 -.159 .026 -.033
FOH. LAGS3 (n=21) .160 .096 .247 -.256 .119 .047
BOH (n=30) .100 -.270 -.502* -.138 .055 -.266
BOH, LAGSl (n=27) .052 -.128 -.409* -.015 -.155 -.203
BOH. LAGS2 (n=24) -.090 -.186 -.349* .066 -.056 -.162
BOH. LAGS3(n=21) -.310 -.342 -.376* .002 -.357 -373*
AVETURN (n=30) .088 -.242 -.404* -.379' -.111' -.411*
AVETURN, LAGSl (n=27) -.064 -.088 -.350* -.083 -.156 -.225
AVETURN, LAGS2(n=24) .134 -.048 -.355* -.073 -.016 -.124
AVETURN. LAGS3(n=2I)
• ^ A#e A * A» i l i l l
-.060 -.126 -.034 -.189 -.118 -.181
*=coirelaiion is significant at 0.05 level (1 tailed).
Note: sample size (N ’s) is specified in parentheses.
.Measured as the percentage o f responses that are I or 2 on a 5-point scale) I = failure. 2=poor. 3=fair. 4=good.5=excellent).
Reproduced with permission of the copyright owner. Further reproduction prohibited without permission.

42As Table 12 illustrates, Steakhouse FOH turnover has correlation with
customer experience variables: Friendly/helpful staff and Price/value. Friendly/helpful
staff has a strong correlation with FOH in the current time period and the consecutive
time period, LAGSl.
Table 12 Correlations: between customer experience and employee turnover -
Steakhouse
Friendly/helpfulStaff
FoodQuality
Price/value
W ait time to be seated
FoodVariety
OverallExperience
FOH (n=30) .474" .163 .084 .138 .031 .207
FOH, LAGSl (n=27) .510" .298 .588" .296 .140 .518"
F0H.L.AGS2 (n=24) .343 .392' .156 .098 .215 .305
F0H.LAGS3 (n=21) .284 .053 .045 .382' .235 .244
BOH (n=30) .037 .084 .033 .377’ .113 .157
BOH, LAGSl (n=27) -.144 .476” -.106 -.367” -.122 -.074
BOH. LAGS2 (n=24) .203 -.062 .059 .266 .049 .130
BOH, LAGS3 (n=21) .097 .148 .390’ -.201 .087 .199
AVETURN (n=30) .277 .170 .077 .467” .135 .269
AVETURN, LAGSl (n=27) .113 .656” .193 -.234 -.055 .287
AVETURN, LAGS2 (n=24) .381’ .130 .138 .325 .158 .287
AVETURN, LAGS3 (n=21) .245 .180 .427’ -.013 .210 .331
•=corrclation is significam at 0.05 level ( I tailed).
Note: satnple size (N ’s) is specified in parentheses.
Measured as the percentage o f responses that are I or 2 on a 5-point scale(l=failure. 2=poor. 3=fair. 4=good.5=excellent).
Reproduced with permission of the copyright owner. Further reproduction prohibited without permission.

43Overall experience in the Coffee Shops shows correlation at the 0.05 level for
AVETURN in the concurrent time period (Table 13).
Table 13 Correlations: between customer experience and employee turnover - Coffee
Shop
Friendly/helpfulStaff
FoodQuality
Price/value
W ait time to be seated
FoodVariety
OverallExperience
FOH (n=30) .120 .010 .260 .191 -.053 .177
FOH, LAG Sl (n=27) .021 .030 .124 -.208 .309 .038
FOH, LAGS2 (n=24) .221 .071 .128 .329 -.051 .308*
FOH, LAGS3 (n=2l) -.130 -.080 .169 -.273 -.155 -.211
BOH (n=30) -.239 .036 .221 .062 .177 .072
BOH, LAG Sl (n=27) .265 -.141 .269 .141 .230 .263
BOH, LAGS2 (n=24) .393* .353* .231 -.017 .006 .451*
BOH, LAGS3 (n=21) -.266 -.197 -.083 -.333 -.149 .312*
A VETURN (n=30) -.095 .031 .312* .159 .093 .157
A VETURN, LAGSl (n=27) .204 -.085 .265 -.015 .341* .213
AVETURN, LAGS2 (n=24) .411* .299 .241 .169 -.024 .399*
AVETURN, LAGS3 (n=21) -.271 -.191 .037 -.403* -.199 .419*
*=corTclalion is significant at 0.05 level ( I tailed).
Note: sample size (N ’s) is specified in parentheses.
Measured as the percentage o f responses that are I or 2 on a 5*point scalet I failure, 2*poor, 3"(air. 4*good.2*excel[cnt).
Comparing Table 9 with Table 14 (Steakhouses and Coffee Shops only) shows
similar correlations between employee nimover and customer experiences. However, the
results arc stronger for steakhouses and coffee shops only.
Reproduced with permission of the copyright owner. Further reproduction prohibited without permission.

44
Table 14 Correlations: between customer experience and employee turnover
Steakhouse and Coffee Shop Pooled Data
Friendly/helpful
Staff
FoodQuality
Price/value
Wait time to be seated
FoodVariety
OverallExperience
FOH (n=60) .508" .444" .026 .5 1 0 " .316* .479**
FOH, LAGSl (n=54) .489" .490" .323" .4 1 1 " .543** .590**
FOH. LAGS2 (n=54) .508'* .555" .130 .5 4 6 " .475** .589**
FOH. LAGS3 (n=54) .3 8 1 " .386" .111 .4 1 3 " .480** .477"
BOH (n=60) -.107 -.002 .070 .103 .069 .057
BOH, LAGSl (n=54) -.001 .173 -.011 -.113 -.016 -.003
BOH, LAGS2 (n=48) .239 .060 .098 .102 .024 .136
BOH, LAGS3 (n=42) -.024 .038 .277* -.185 .004 .019
AVETURN (n=60) .251* .295* .076 .4 6 2 " .269* .367**
AVETURN, LAGSl (n=54) .311* .457" .197 .168 .333** .374"
AVETURN, LAGS2 (n=48) .548" .391" .161 .4 2 0 " .316* .476"
AVETURN.LAGS3 (n=42)
"*=corTclation is sicniAcant at O.Oi level
.221
> ( 1 uiiled).
.277* .305* .106 .301* .319*
‘ -correialion is significant at 0.05 level ( I tailed).
Note: sample size (N ’s) is specified in parentfieses.
Measured as the percentage o f responses that are 1 or 2 on a 5-point scalef 1 = failure, 2=poor. 3=fair. 4=good.S=e.xcellent).
Table 15 shows Front-of-the-house turnover has significant correlation to
customer experience in the consecutive time period (LAGSl). This is also true for BOH
and AVETURN.
Reproduced with permission of the copyright owner. Further reproduction prohibited without permission.

45
Table 15 Correlations: between customer experience and employee turnover - Region
Friendly/helpful
Staff
FoodQuality
Price/value
Wait time to be seated
FoodVariety
OverallExperience
FOH (n=30) .266 .277 -.157 -.043 -.085 -.035
FOH, LAGSl (n=27) .256 .187 .438* -.066 .430* .507
FOH. LAGS2 (n=24) .106 .159 -.104 -.038 .307 .124
FOH. LAGS3 (n=2l) .316 -.044 .005 -.092 .535** .267
BOH (n=30) -.055 -.172 .031 .088 .135 .073
BOH, LAGSl (n=27) -.042 .359* -.180 -.237 -.198 -.207
BOH. LAGS2 tn=24) .144 -.051 -.093 -.019 -.012 -.032
BOH. LAGS3 (n=21) -.121 .022 .344 -.004 -.114 .077
AVETURN (n=30) .100 -.015 -.060 .065 .089 .055
-WETURN, LAGSl (n=27) .108 .473" .074 -.279 .052 .088
AVETURN. LAGS2 (n=24) .204 .038 -.151 -.041 .161 .037
AVETURN. LAGS3 (n=21) .065
1 1 1 \
.000 .341 -.057 .199 .230
•=corrclaiion is significant at 0.05 level ( 1 tailed).
Note: sample size (N 's) is specified in parentheses.
Measured as the percentage o f responses that are I or 2 on a 5-point scalet I failure. 2=poor, 3=fair. 4=good,5=e.xcellcnt).
Region II has strong Front-of-the-house turnover correlation to customer service
quality variables: Friendly/helpful staff. Food quality. Wait time to be seated. Food
variety and Overall experience. This is not true with Regions 1 and Hi.
Reproduced with permission of the copyright owner. Further reproduction prohibited without permission.

46Table 16 Correlations: between customer experience and employee turnover - Region
II
Friendly/helpful
Staff
FoodQuality
Price/value
Wait time to be seated
FoodVariety
OverallExperience
FOH (n=30) .604" .447** .147 .529** .429* .522**
FOH, LAGSl (n=27) .477" .512** .015 .454** .521** .521**
FOH, L.AGS2 (n=24) .736" .611** .121 .549** .406* .639*'
FOH, LAGS3 (n=21) .438* .545** .356 .164 .406* .477*
BOH (n=30) -.040 -.040 -.222 -.037 .023 -.063
BOH, LAGSl (n=27) .022 -.012 -.100 .042 .095 .021
BOH, LAGS2 (n=24) .320 .102 .235 .126 .114 .211
BOH, LAGS3 (n=2l) -.131 -.065 -.050 -.466* -.125 -.248
AVETURN (n=30) .429** .312* -.007 .374* .331* .378*
AVETURN, LAGSl (n=27) .348* .354* -.043 .343* .419* .379*
AVETURN. LAGS2 (n=24) .683** .481** .209 .450* .344 .558*
AVETURN. LAGS3 (n=21)
• ___ _______ _________ : n ____ _ r v n i
.251 .364 .234 -.126 .230 .218
‘ -correialion is significam at 0.05 level ( I tailed).
Note: sample size (N 's) is specified in parentfieses
Measured as ilie percentage o f responses tfiat are 1 or 2 on a 5-point scale! I-fa ilure. 2 -poor. 3=fair. 4=good.5=e.xccllent).
Reproduced with permission of the copyright owner. Further reproduction prohibited without permission.

47Table 17 shows that Region III does not have any significant correlations
between employee turnover and customer service quality.
Table 17 Correlations: between customer experience and employee turnover - Region 111
Friendly/helpfulStaff
FoodQuality
Price/value
Wait time to be seated
FoodVariety
OverallExperience
FOH (n=30) .056 -.094 .019 -.021 -.065 -.036
FOH, LAGSl (n=27) .132 .040 -.104 .137 .002 .062
FOH, LAGS2 (n=24) .217 .140 -.033 .267 .213 .195
FOH, LAGS3 (n=21) .044 .062 -.007 .311 .102 .147
BOH (n=30) -.176 -.006 -.204 -.132 -.239 -.181
BOH, LAGSl (n=27) .118 -.159 -.044 -.171 -.081 -.124
BOH, LAGS2 (n=24) .146 -.130 -.194 -.053 -.081 -.120
BOH, LAGS3 (n=21) .127 -.156 -.134 .282 -.065 -.167
AVETURN (n=30) -.107 -.067 -.153 -.121 -.237 -.171
AVETURN, LAG Sl (n=27) .187 -.105 -.107 -.050 -.066 -.061
AVETURN, LAGS2 (n=24) .263 -.017 -.183 .130 -.002 .027
AVETURN, LAGS3 (n=21)
■nivj:'____ _______ .. n /ii i..,.
.135 -.090 -.117 -.033 .012 -.044
‘ -correlation is significant at 0.05 level ( I tailed).
Note: sample size (N 's) is specified in parentheses.
Measured as the percentage o f responses that are 1 or 2 on a 5-point scale( 1 -failure. 2=pcor. 3=fair, 4=good.5=excellent).
Reproduced with permission of the copyright owner. Further reproduction prohibited without permission.

48Hypotheses Results
Each o f the six hypotheses (and the respective sub-hypotheses) are summarized
below with a reference to the appropriate table; the hypotheses were tested at 0.05
significance level.
Hi: Front-of-the-House employee turnover w ill have a positive relationship to perceived
service quality (as measured by the percent o f poor and failure scores). H; has support
(Table 10).
H ia; Front-of-the-House employee turnover in the buffet restaurant w ill have a
positive relationship to perceived service quality (as measured by the percent of
poor and failure scores). H ia is not supported (Table 11 ).
H|B: Front-of-the-House employee turnover in the steakhouse restaurant w ill have
a positive relationship to perceived service quality (as measured by the percent of
poor and failure scores). Hm is supported (Table 12).
Htc: Front-of-the-House employee nimover in the coffee shop restaurant w ill
have a positive relationship to perceived service quality (as measured by the
percent o f poor and failure scores). H,c is not supported (Table 13).
H]: Back-0 f-the-House employee turnover w ill have a positive relationship to perceived
service quality (as measured by the percent o f poor and failure scores). H: is not
supported (Table 10).
HzA: Back-of-the-House employee turnover in the buffet restaurant w ill have a
positive relationship to perceived service quality (as measured by the percent o f
poor and failure scores). HzA is not supported (Table 11).
Reproduced with permission of the copyright owner. Further reproduction prohibited without permission.

49HiB: Back-of-the-House employee turnover in the steakhouse restaurant w ill
have a positive relationship to perceived service quality (as measured by the
percent o f poor and failure scores). His is supported (Table 12).
Hzc: Back-of-the-House employee turnover in the coffee shop restaurant w ill have
a positive relationship to perceived service quality (as measured by the percent of
poor and failure scores). H^c is not supported (Table 13).
H): Average employee turnover w ill have a positive relationship to perceived service
quality (as measured by the percent o f poor and failure scores). H3 is supported (Table
10).
H3a- Average employee turnover in the buffet restaurant w ill have a positive
relationship to perceived service quality (as measured by the percent of poor and
failure scores). H3A is not supported (Table 11).
H3B: Average employee turnover in the steakhouse restaurant w ill have a positive
relationship to perceived service quality (as measured by the percent of poor and
failure scores). H3B is supported (Tablel2).
H3C: Average employee nimover in the coffee shop restaurant w ill have a positive
relationship to perceived service quality (as measured by the percent o f poor and
failure scores). H3C is supported (Table 13).
H4 ; Front-of-the-House employee nimover in time period t w ill have a positive
relationship to perceived service quality (as measured by the percent o f poor and failure
scores) in time period t+ l. H4 is supported (Table 1 0 ).
Rja: Front-of-the-House employee tumover in the buffet restaurant in time period
t w ill have a positive relationship to perceived service quality (as measured by the
Reproduced with permission of the copyright owner. Further reproduction prohibited without permission.
50percent o f poor and failure scores) in time period t+ l. H^a is not supported
(Table 11).
Rib: Front-of-the-House employee tumover in the steakhouse restaurant in time
period t w ill have a positive relationship to perceived service quality (as measured
by the percent o f poor and failure scores) in time period t+ l. H4B is supported
(Table 12).
H^c: Front-of-the-House employee tumover in the coffee shop restaurant in time
period t w ill have a positive relationship to perceived service quality (as measured
by the percent o f poor and failure scores) in time period t+ 1 . Hac is not
supported.
H): Back-of-the-House employee tumover in time period t w ill have a positive
relationship to perceived service quality (as measured by the percent o f poor and failure
scores) in time period t+ l. H5 is not supported (Table 10).
Hsa: Back-of-the-House employee tumover in the buffet restaurant in time period
t w ill have a positive relationship to perceived service quality (as measured by the
percent o f poor and failure scores) in time period t+ l. Hsa is not supported (Table
1 1 ).
Hsb'. Back-of-the-House employee tumover in the steakhouse restaurant time
period t w ill have a positive relationship to perceived service quality (as measured
by the percent o f poor and failure scores) in time period t+ l. Hsb is supported
(Table 12).
Hsc: Back-of-the-House employee tumover in the coffee shop restaurant in time
period t w ill have a positive relationship to perceived service quality (as measured
Reproduced with permission of the copyright owner. Further reproduction prohibited without permission.

51by the percent o f poor and failure scores) in time period t+ l. Hsc is not
supported (Table 13).
He: Average employee nimover in time period t w ill have a positive relationship to
perceived service quality (as measured by the percent o f poor and failure scores) in time
period t+ l. He is supported (Table 10).
HeA: Average employee tumover in the buffet restaurant in time period t w ill have
a positive relationship to perceived service quality (as measured by the percent o f
poor and failure scores) in time period t+ l. Hôa is not supported (Table 11).
Hsb: Average employee tumover in the steakhouse restaurant in time period t w ill
have a positive relationship to perceived service quality (as measured by the
percent o f poor and failure scores) in time period t+ l. Hsa is supported (Table 12).
Hsc: Average employee tumover in the coffee shop restaurant in time period t w ill
have a positive relationship to perceived service quality (as measured by the
percent o f poor and failure scores) in time period t+ l. Hsc is supported (Table
13).
Summary
Four o f the six hypotheses tested on pooled data were supported:
Hi: Front-of-the-House employee tumover w ill have a positive relationship to perceived
service quality (as measured by the percent o f poor and failure scores). Hi has support
(Table 10).
Reproduced with permission of the copyright owner. Further reproduction prohibited without permission.
52H3: Average employee tumover w ill have a positive relationship to perceived service
quality (as measured by the percent o f poor and failure scores). H3 is supported (Table
10).
H4 : Front-of-the-House employee tumover in time period t w ill have a positive
relationship to perceived service quality (as measured by the percent o f poor and failure
scores) in time period t+ l. H4 is supported (Table 10).
Hs: Average employee tumover in time period t w ill have a positive relationship to
perceived service quality (as measured by the percent o f poor and failure scores) in time
period t+ l. He is supported (Table 10).
Eight o f the eighteen sub-hypotheses were supported:
H|B: Front-of-the-House employee tumover in the steakhouse restaurant w ill have a
positive relationship to perceived service quality (as measured by the percent o f poor and
failure scores). H ib is supported (Table 12).
Hig: Back-of-the-House employee tumover in the steakhouse restaurant w ill have a
positive relationship to perceived service quality (as measured by the percent o f poor and
failure scores). H^s is supported (Table 12).
H3B: Average employee nimover in the steakhouse restaurant w ill have a positive
relationship to perceived service quality (as measured by the percent o f poor and failure
scores). H3B is supported (Table 12).
H3C: Average employee tumover in the coffee shop restaurant w ill have a positive
relationship to perceived service quality (as measured by the percent o f poor and failure
scores). H3C is supported (Table 13).
Reproduced with permission of the copyright owner. Further reproduction prohibited without permission.

53H4B: Front-of-the-House employee tumover in the steakhouse restaurant in time period
t w ill have a positive relationship to perceived service quality (as measured by the percent
o f poor and failure scores) in time period t+ l. H4B is supported (Table 12).
Hsb: Back-of-the-House employee tumover in the steakhouse restaurant time period t w ill
have a positive relationship to perceived service quality (as measured by the percent o f
poor and failure scores) in time period t+ l. Hsb is supported (Table 12).
Hsb: Average employee tumover in the steakhouse restaurant in time period t w ill have a
positive relationship to perceived service quality (as measured by the percent o f poor and
failure scores) in time period t+ l. Hôb is supported (Table 12).
Hec: Average employee tumover in the coffee shop restaurant in time period t w ill have a
positive relationship to perceived service quality (as measured by the percent of poor and
failure scores) in time period t+ l. Hec is supported (Table 13).
A ll six sub-hypotheses for the steakhouses have support. Two o f the six
hypotheses about the coffee shops have support. None o f the hypotheses for the buffets
were supported.
Reproduced with permission of the copyright owner. Further reproduction prohibited without permission.

CHAPTER 5
CONCLUSIONS AND RECOMMENDATIONS
The descriptive statistics clearly show a difference between the types o f
restaurants and customer experience (Tables 2,3, and 4). The analysis o f variance (Table
8 ) confirms that there is a significant difference between customer experience and
employee tumover by restaurant type.
The steakhouse restaurants have the lowest mean in seven o f the nine variables.
The steakhouses in this study are positioned in their casinos as a restaurant that provides
a service level and food quality generally considered above buffets and coffee shops.
This study provides empirical support for steakhouses providing a level o f service quality
that results in less poor and failure scores.
Buffet BOH is the lowest mean among restaurant types (Table 2), while Coffee
Shops have the highest mean scores for Friendly/helpful staff, Food quality. Overall
experience, and FOH tumover. Table 2 shows Wait-time-to-be-seated as the highest
mean for buffets. This variable has the highest mean for poor and failure scores for all
variables in the study. Casual observation o f a buffet in a casino w ill confirm that long
lines are frequent.
54
Reproduced with permission of the copyright owner. Further reproduction prohibited without permission.

55Indeed, the findings o f hypothesis testing suggest that there are differences in
the relationship o f customer service quality and employee tumover between types o f
restaurants. The buffets do not show a positive relationship for any tumover category. In
fact, several
correlations were negative (Table 10): Waiting-time-to-be-seated, Price/value, Food
quality, and Overall experience. Perhaps the time frame used in this study was wrong
(one month). Maybe the time frame should be quarterly. The nature o f buffet operations
may influence this result. Buffets are not service oriented in the same manner as
steakhouses and coffee shops where table service is provided. The scope o f this study
does not address these negative relationships. However, the steakhouses have significant
correlation with Front-of-the-house tumover and customer service quality (Table 11).
The customer may feel that the FOH employee has more influence on their dining
experience since there is more interaction during the service encounter. Coffee Shops do
not have the same level o f interaction with the guest, while the buffets have very little
due to the self-service nature o f the operation.
Steakhouse BOH shows a relationship with customer perceptions o f service
quality, even when FOH did not have a significant relationship (see Table 12 under Food
quality and Wait-time). Buffets and Coffee Shops do not have this same relationship.
The correlation o f employee tumover and customer service quality in steakhouses is
much more significant.
Bernhardt, et al (1999) found that customer satisfaction influenced employee
satisfaction and financial results in future time periods. A time-series approach was also
Reproduced with permission of the copyright owner. Further reproduction prohibited without permission.

56advocated by Loveman (1998). Table 9 shows a pattern o f employee tumover
influence on customer experience in future time periods.
FOH, BOH, and AVETURN all have strong correlations in time period t+2
(LAGS2). Generally, there is an increase between period t+ l and t+2, while there is a
decrease from period t+2 to period t+3. This pattern in FOH implies that employee
nimover continues to influence customer experience in consecutive time periods..
Further study would be necessary to see if the correlation remains significant beyond
time period t+3.
Even BOH, which overall showed little correlation to customer experience, shows
increasing correlation for the variable Friendly/helpful staff from time period t through
time period t+2, followed by a decrease in time period t+3. BOH also influences the
average tumover (AVETURN). While the customer may give most of the credit for poor
service to the FOH, the BOH does share the results as evidenced by the AVETURN
correlations.
The fact that this pattem o f the correlation changes and is significant over time
periods has some practical implications for managers. First, employee tumover in the
concurrent time period is related to future performance results. Future customer
satisfaction w ill be affected. Second, the type o f restaurant w ill make a difference in the
customer’s perceived service quality. Steakhouse tumover has a strong correlation to
perceived service quality. This relationship is not present in the buffets. Perhaps the
newest, or least experienced, servers should begin working in the buffet since they w ill
have the least effect on customer perceptions in that type o f restaurant. The study results
suggest that servers start their service expenence in a buffet, then move into the coffee
Reproduced with permission of the copyright owner. Further reproduction prohibited without permission.

57shop, and finally, when they have learned customer interaction skills, they move to the
steakhouse. Such a progression o f experience allows the employee to learn service skills
while having the least potential effect on customer dining experience due to nimover.
Third, the geographic location o f the restaurant may have an effect on employee selection
and retention. Region 111 (Table 17) did not show any correlation between employee
tumover and customer service quality. However, Region II has strong correlations
between employee tumover and customer experience. The loss o f a FOH employee in
Region II is going have an effect on customer experience for several consecutive time
periods. Whereas, the same loss in Region III w ill not have the same effect since the
relationship is different.
Table 13 shows the correlations for steakhouses and coffee shops without the
buffet data. The correlations in Table 10 are stronger than those in Table 9, which
included the buffet restaurants. The correlation o f employee tumover and customer
experience shows the same pattem identified earlier: the correlation peaks in time period
t+2 and remains significant in time period t+3. The correlation for Wait-time-to-be-
seated is significant in Table 13 whereas it is not when the buffet data are included in
Table 9. The strength o f the correlations increased when the buffet data was not
included. Intuitively, this would seem reasonable since buffets are self-service to a great
extent and steakhouses and coffee shops are service oriented.
Correlations may decrease as the time lag is increased due to the loss o f statistical
power. Such a decrease did not occur in this case. It is also possible for correlation
changes due to decreasing sample size o f tumover data when lagged. However, i f that
Reproduced with permission of the copyright owner. Further reproduction prohibited without permission.

58was the case, there would be a decreasing correlation as the time period increases. But
this was not observed, the correlation increased over time.
It is generally accepted that obtaining a new customer costs more than retaining a
current customer. Thus the dissatisfied customers that decide not to return could have an
impact on the costs of doing business; increasing the expenditures for obtaining new
customers to replace the lost customers.
However, there is another potential effect o f lost customers: lost revenue. Casinos
calculate the theoretical worth o f their customers. This theoretical win by the casino is
calculated using proprietary formulas and information based on the customers gaming
history or projected play. Therefore, the loss o f a customer has a theoretical lost revenue
value to the casino. When assessing the cost o f employee tumover. the amount o f lost
revenue from poor dining experiences should be included. This study shows that
employee tumover has a correlation to customer service perception for several
consecutive time periods. Loosing restaurant customers obviously has a dollar value to
the restaurant but if the casino lost the customers as a gamblers, the loss is much more
significant.
This study suggests that casino restaurants should effectively manage employee
tumover. The financial implications may be a good incentive for management to find
ways to reduce employee tumover; not only from a replacement cost viewpoint but also
from a lost revenue viewpoint. The S6000 tumover cost per employee that Hinkin and
Tracey (2000) estimated is low if the lifetime value o f lost customers is added into the
cost equation. Each casino can estimate the cost based on their individual theoretical
worth calculations. Let’s use a hypothetical example. A restaurant serves three hundred
Reproduced with permission of the copyright owner. Further reproduction prohibited without permission.

59people a day and a customer comes twice a year and spends S20 each time. A 3
percent loss o f customers each month (this study implies it is larger than 3 percent) would
then cost the restaurant SI 29,600 per year in lost revenue. However, i f the casino looses
those same customers as gamblers (that spend $500 per trip), the loss escalates to
S1,620,000. The average check in a restaurant or the theoretical win for the casino w ill
have a large influence on the calculations for lost revenue. However, it easy to see that
the revenue lost from dissatisfied customers can have a financial implication.
Future Research
Past research has suggested that service quality should be studied over a time
series to best understand the financial impact. This study shows that employee tumover
influences service quality in consecutive time periods. Further study w ill be needed to
see if that relationship remains significant beyond the consecutive time periods in this
study.
More empirical evidence is needed on the role that dining plays on the customer’s
gambling location decision. The current and future customers may look at dining
differently than how it was viewed in the past. Such a change in perspective may
necessitate a change in thinking about how to provide quality service in casino
restaurants. The type o f restaurants may also be a factor.
While the hypothetical case for lost revenue presented above is an example o f the
potential impact on a casino, further study is needed to quantify the cost in such a
scenario.
Reproduced with permission of the copyright owner. Further reproduction prohibited without permission.

60The tumover data in this study included voluntary and involuntary tumover. It
is possible that each type o f turnover may have a different effect on the customer service
quality experience. This study was unable to explore that possible aspect since the
separate tumover data were not available.
Employee loyalty was not measured or investigated in this study. Employee
loyalty may have a relationship to guest service quality. Using employee loyalty
measures, employee tumover, and guest service quality in the same study could provide
empirical evidence to support additional links in the service profit chain.
The fair and poor customer service scores were used in this study. However, the
fair customer service scores (3 on a scale o f 1 thru 5) may not be considered a satisfied
customer. Additional insight may be gained if such a score were to be included with the
fair and poor ratings.
The results o f the study show differences in the relationship o f tumover and
service perception by restaurant type. The buffets in particular showed a negative
relationship. This needs further investigation to understand the nature o f perceived
service quality in buffets. Further study o f each restaurant type w ill help define the
unique relationship between employee tumover and customer perceived service quality.
While the three types o f restaurants in each region are very similar in operational
style, the results show a difference between regions (Tables 15, 16,17). Why is there a
difference? Additional investigation w ill be needed to understand why there is a
difference between locations.
Reproduced with permission of the copyright owner. Further reproduction prohibited without permission.

REFERENCES
Anderson, E , Fomell, C , Lehman, D. (1994). Customer satisfaction, market
share, and profitability; Findings from Sweden. Journal o f Marketing 58(3). 129-146.
Antolik, C. (1993, September 6 ). Retaining employees. Hotel and Motel
Management 208(15). 21.
Atkins, P., Marshall, B., and Javalgi, R. ( 1996, Winter). Happy employees lead
to loyal patients; Survey o f nurses and patients shows a strong link between employee
satisfaction and patient loyalty. Journal o f Health Care Marketing. 15-23.
Bernhardt, K. Donthu, N., and Kennett, P. (2(X)0, February). A longitudinal
analysis o f satisfaction and profitability. Journal o f Business Research 47(2). 161-171.
Berry, L. (1995). Relationship marketing o f services-growing interest, emerging
perspectives. Journal o f the Academv o f Marketing Science 23(4). 236-245.
Berry, L , Bennett, D , and Brown, C. (1998). Service Qualitv. Dow-Jones-
Irwin.
Bimer, B. (1992). Servicescape: The impact o f physical surroundings on
customers and employees. Journal o f Marketing 56(2). 57-72.
Booms, B. and Bitner, M. (1992, May). Marketing services by managing the
environment. Cornell Hotel and Restaurant Administration Ouarterlv. 35-39.
61
Reproduced with permission of the copyright owner. Further reproduction prohibited without permission.

62Deery, M., and Shaw, R. ( 1999, November). An investigation o f the
relationship between employee tumover and organizational culture. Journal of
Hospitalitv & Tourism Research 23(4). 387-400.
Donoho, R. (1997, February). Hotel survey . Staff tumover rate rising.
Successful Meetings 46(2). 11-12.
Frechtling, D. (1996). Practical Tourism Forecasting. Oxford: Butterworth-
Heineman.
Gilbert, D., and Homell, S. (1998). Customer satisfaction measurement practice
in the United Kingdom hotels. Joumal o f Hospitality & Tourism Research 22(4 ). 450-
464.
Gunderson, M., Heide, M , and Olsson, U. (1996, April). Hotel guest satisfaction
among business travelers. Comell Hotel and Restaurant Administration Ouarterlv 37(2).
72-82.
Hawk, D. (1976, June). Absenteeism and tumover. Personnel Joumal 55(6).
293.
Heskett, J., Jones, E., Loveman, G., Sasser, E., and Schlesinger, L. (1994, March-
April). Putting the service-profit chain to work. Harvard Business Review. 164-175.
Heskett, J., Sasser, E., and Schlesinger, L. (1997). The Service Profit Chain.
The Free Press: New York.
Hinkin, T., and Tracey, B. (2000, June). The cost o f tumover. Putting a price on
the leaming curve. Comell Hotel and Restaurant Administration Ouarterlv. 14-21.
Reproduced with permission of the copyright owner. Further reproduction prohibited without permission.

63Hoffman, D , and Ingram, T (1992, Spring). Service provider job satisfaction
and customer-oriented performance. The Joumal o f Services Marketing 6(2). 68-79.
Indermill, K. (1991), August). Terminating tumover. Restaurant Hospitalitv
75(8). 48-50.
Jones, T., and Sasser, E. (1995, November/December). Why satisfied customers
defect. Harvard Business Review 73(6). 88-100.
Laker, D., and Shimko, B. (1991). Controlling the tumover problem; The use o f
the realistic job preview “experience” . Hospitalitv Research Joumal. 57-62.
Loveman, G. (1998). Employee satisfaction, customer loyalty, and financial
performance; An empirical exanimation o f the service profit chain in retail banking.
Joumal o f Service Research K IL 18-31.
Mangold, G., Miller, F , and Brockway, G. (1999). Word-of-mouth
communication in the service marketplace. The Joumal o f Service Marketing 13( 1 ), 73-
89.
M ill, B. (1996, March 18). How to treat your employees like customers.
Nation’s Restaurant News 30( 11 ), 56-57.
Pizam, A., and Thomburg, S. (2000). Absenteeism and voluntary tumover in
Central Florida hotels; a pilot study. International Joumal o f Hospitalitv Management 19.
211-217.
Scanlan, L., and McPhail, J. (2000, November). Forming service relationships
with hotel business travelers; The critical attributes to improve retention. Joumal o f
Hospitalitv & Tourism Research 24(4L 491-513.
Reproduced with permission of the copyright owner. Further reproduction prohibited without permission.

64Schneider, B. (1987). The people make the place. Personnel Psychology
# 3 ) , 437454.
Schneider, B., and Bowen, D ( 1985). Employee and customer perceptions of
service in banks. Replication and extension. Journal o f Applied Psychology 70(31.423-
433.
Schneider, B., Parkington, J. and Buxton, V. (1980). Employee and customer
perceptions o f service in banks. Administration Science Quarterly 25.252-267.
Spinelli, M. and Canavos, G. (2000, December). Investigating the relationship
between employee satisfaction and guest satisfaction. Cornell Hotel and Restaurant
Administration Quarterly. 29-33.
Susskind, A., Borchgrevink, C , Brymer, R , and Kacmar, M. (2000, August).
Customer service behavior and attitudes among hotel managers; A look at perceived
support functions, standards o f service and service process outcomes. Journal o f
Hospitality & Tourism Research 24(3). 373-397.
Wiley, J. (1991). Customer satisfaction: a supportive work environment and its
financial costs. Human Resource Planning 14.117-127.
Wiley, J. (1996). Linking survey results to customer satisfaction and business
performance. In A. I. Kravi (Ed ), Organization surveys: tools and assessment and
change (pp. 330-359). San Francisco: Jossey-Bass.
Testa, M., Skaruppa, C., and Pietrzak, D. (1998). Linking job satisfaction and
customer satisfaction in the cruise industry: Implications for hospitality and travel
orgamzations. Journal o f Hospitality & Tourism Research 22( 1 ). 4-14.
Reproduced with permission of the copyright owner. Further reproduction prohibited without permission.

65Zeithaml, V , Berry, L , and Parasuraman, A. (1993). The nature and
determinants o f customer expectations o f service. Journal o f the Academy o f Marketing
Science 21(1). 1-12.
Zikmund, W. (2000). Business Research Methods(6‘** Ed ). Orlando, FL; The
Dryden Press.
Reproduced with permission of the copyright owner. Further reproduction prohibited without permission.

APPENDIX A
66
Reproduced with permission of the copyright owner. Further reproduction prohibited without permission.

67
C U S T O M E R S A T I S F A C T I O N S U R V E Y
WWW ###*#.Hw*y«k>«wlm.W kM(iliW HM|wMww ■««■««■«
SAMPLE
^ QOS.
CD W W III n i t w w w »
Hmmtt’tiÊin.OwnlCWwtnWw
& iMWiinraC3 "WW O •••MC3 C«H» a D«Wr O r«Mn
& mww»#»#C 3*«lw * CD Ê’ tÊÊta c*Nt a o«fMt a > « M M
4 Oawwwmwm*. W4w#w##w«ww#C3MMW<C3mw*#
M OrOW a
C3 0#m#*ww1 WWW
C3 Ww -q a ,'
4 m»»ÊW#m«#Mwwwaw«wwwMwrnrninSmSSiamtmMm^mm. fm m m ^uW*#WW»fW,w#«, ■WMtOi-aW
a • c • *w w - o a CD o c n a o a C 3 C3Meawr-O a a C 3 a
? _______ a C 3 C 3 CD a5 S T * ^ r ~ t a C3 CD a CD a d CD a
.a CD CD a CD- S H S H S
T. la a a M llia a n liW a M U ka W a a ttrw M H k ia a il
a I e ■ a.CD CD CD CD CD
CD CD CD CD CD CD CD CD
. CD CD CD CD CD
.CD CD CD CD CD
. d CD CD d CD
ggwaieaa •MWana)— . d d d d d . d d d d d
14 WaMianMW waad HMWMMa d —a i—WM
d warn dO M Ia l
4 maaaaWmaaW ra*Maa*<àijMiBWI
MWraaaaiW M M W .
•wkpwaaaaow#wi#wmaiw
e * ad d d d
d d d d
d d d dd d d d
d d idd
d d d d
d d d d
d d d d
d d d d
d d d d
Reproduced with permission of the copyright owner. Further reproduction prohibited without permission.
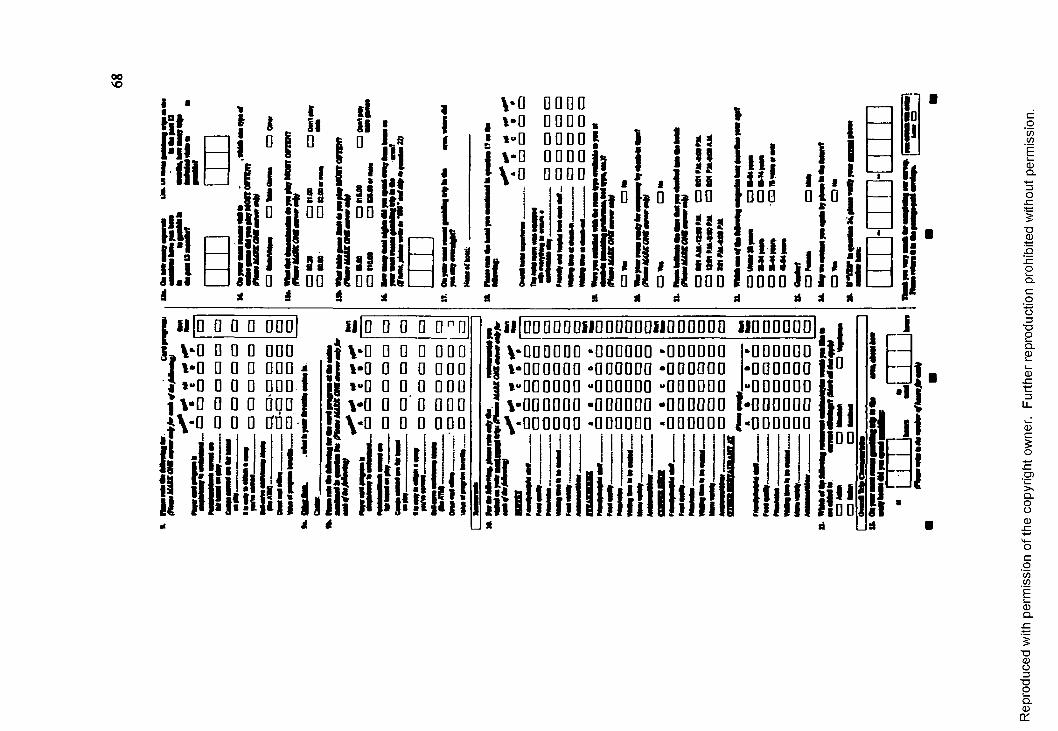
00VO
Ü!
Ë i l l i l ! I l l
IIeIMt
{
VO
• »"G I VD
1I
V.I ]
iI0 0 0 0 0 0 0 0 0 0 0 0 0 0 0 0 #5 o o o o f i - ,
l i i i r r
i iIII I
If 00111!f 00 0
III!{«[L O O P pool i i |P P 0 P P ^P
5 0 0 0 0 0 0 0 0 0 0 0 0
I V P 0 0 P i \ " P O O P
I illlll-"g
If VO 0 0 0 0 0 0 l[ %-0 0 0 0 000H »«o 0 0 0 00011 V O P O P OPP j | V o 0 p 0 POP
1 , 1 1 1 9 !WI,mi é
OPOPODiJPPDOPOMOPPPDD i lDDPDOO|,000000 ‘ 000000 ‘ 000000
•000000 -000000 -000000 '000000 “000000 “000000 •OPPPQO -POPOPP - 0 0 0 0 0 0 ■000000 ‘ 000000 ‘ 000000
000000 000000
. 000000 I -OOOPOP | ‘ 000000
(/)(/)
CDQ .
TDCD
2Q .co
3TD2Q .2o5
. ct:
CD
Q .
8
COCO
CDQ .
83TD2Q .CDq:

APPENDIX B
69
Reproduced with permission of the copyright owner. Further reproduction prohibited without permission.

Region I70
FOOD & BEVERAGE TURNOVER1 Jan Feb Mar April May June July Aug Sept Oct Nov
Coffee Shop - FOH 8.33 2.62 10.00 6.11 6.56 9.65 16.94 5.71 11.11 4.64 5.06$ of Employees 72 71 70 74 76 71 72 70 63 62 59 !# of Terminatiotw 6 2 7 6 5 7 5 4 7 3 3 'Coffee Shop - BOH 4.55 0 0 6.33 6.33 0 0 15.00 0 0 5.00e of Employees 22 21 21 24 24 24 24 20 20 20 20 ;i of Terminations 1 0 0 2 2 0 0 3 0 0 1Steakhouse - FOH 0 5.00 0 0 9.52 10.53 0 0 5.56 0 5.66 !i of Employees 20 20 19 20 21 19 19 19 18 18 17 1i of Terminations 0 1 0 0 2 2 0 0 1 0 1 1Steakhouse - BOH 0 0 26.57 0 0 0 0 12.55 0 12.50126.701# of Employees 8 8 7 8 8 9 9 8 8 8 7i of Terminations 0 0 2 0 0 0 0 0 2 iBuffet-FOH 1.72 3.64 3.77 0 5.76 1.96 0 7.55 3.92 3.92 ! 6.25» of Employees 58 55 53 54 52 51 53 53 51 51 48i of Terminations 1 2 2 0 3 1 0 4 2 2 3 1Buffet - BOH 6.67 10.00 3.23 3.03 3.03 6.45 I2.94 0 0 I 0 3.03• of Employees 30 30 31 33 33 31 34 33 33 33 33 1• of Terminations 2 3 1 1 1 2 1 0 0 0 1 1
Reproduced with permission of the copyright owner. Further reproduction prohibited without permission.

Region II71
FOOD & BEVERAGE TURNOVER-
Jan Feb Mar April May June July Aug Septi Oct Nov iCoffee Shop - FOH 14.55 5.56 9.46 4.29 8.57 3.95 7.5 11.591 2.941 14.751 3.45 !• of EmployMS 55 72 74 70 70 76 80 89 68 61 ; 58i of Terminations 8 4 7 3 6 3 6 8 2 9 ! 2 1Coffee Shop - BOH 11.43 2.70 0 0 4.32 2.38 0 6.98 0 2.33 2.44• of Employees 35 37 40 41 41 42 43 43 44 43 ! 41 1• of Terminations 4 1 0 0 3 1 0 3 0 1 1
Steakhouse - FOH 3.33 0 0 0 0 0 0 0 0 0 0• of Employees 30 30 30 30 30 30 30 30 30 30 30 1• ofTerminationa 1 0 0 0 0 0 0 0 0 0 0 1Steakhouse - BOH 0 3.33 6.25 0 0 6.25 6.67 0 6.67 6.25 0 I• of Employees 16 30 16 15 17 16 15 14 15 16 15 !• of Terminations 0 1 1 0 0 1 1 0 1 1 0 !Buffet-FOH 7.69 2.50 0 9.76 0 4.76 13.16 5. 0 7.41 13.04 j• of Employees 39 40 43 41 41 42 38 40 43 27 23 j• of Terminations 3 1 0 4 0 2 5 2 0 2 3 1Buffet-BOH 0 0 0 16.25 3.85 5.66 1.85 9.62 1.82 7.14 0 :• of Employees 55 55 51 48 52 53 54 52 55 56 70 1• of Terminations 0 0 0 1 3 2 3 1 5 1 4 0 i
Reproduced with permission of the copyright owner. Further reproduction prohibited without permission.

Region HI72
FOOD & BEVERAGE TURNOVER
1 Jan Feb Mar April May Jun Jul Aug Sept Oct NovICoffM Shop • FOH 1.54 3.13 3.13 6.82 3.45 6.35 4.55 0 3.17 3.33 3.231# of Employees 65 64 64 68 58 63 66 64 63 60 62 :W of Terminations 1 2 2 6 2 4 3 0 2 2 2piffee Shop • BOH 11.54 1.96 7.64 4.55 0 3.77 0 0 0 1.92 12.00# of Employees 52 51 51 44 51 53 47 48 53 52 50Y of Terminations 6 1 4 2 0 2 0 0 0 1 6Buffet-FOH 1.61 0 0 0 1.56 3.45 7.94 1.47 6.15 3.23 1.75m of Employees 62 55 56 59 64 58 63 68 65 62 57
m of Terminations 1 0 0 0 1 2 5 1 4 2r - ' - '
1Buffet-BOH 0 0 2.44 0 0 0 1.75 1.79 3.39 4.84 3.45p of Employees 39 45 41 36 32 41 57 56 59 62
-----------------------1
581# of Terminations 0 0 1 0 0 0 1 1 2 3
—2
ISteakhouM • FOH 0 0 0 3.45 0 3.70 0 0 0 0 0i# of Employees 29 29 29 29 27 27 26 27 28 26 28p of Terminations 0 0 0 1 0 1 0 0 0 0 0Isteakhouse - BOH 6.67 7.14 0 0 6.67 0 5. 5.88 5.56 0 0p of Employees 15 14 13 15 15 16 20 17 18 17 181# of Terminations 1 1 0 0 1 0 1 1 1 0 0
Reproduced with permission of the copyright owner. Further reproduction prohibited without permission.

APPENDIX c
73
Reproduced with permission of the copyright owner. Further reproduction prohibited without permission.

74
Descriptive StatisticsN Mean Std. Skewnees
Stabeiic StadMic Stadttic Statistic Std. ErrorPFH percent ftiendly/fielpftjl
90 2.2027 1.0472 212 254
PFQ percent food quaMy 90 3.4856 1.5075 414 254
PPV percent price/velue 90 4.4033 1.9327 3.611 254
PWT percent wait erne 90 5.2378 20967 651 254
PFV percent food variety 90 3.1033 1.6538 1 369 254
Tests at NormalityKolmogorov-Smimov *
StatBtic df Sl9PFH percent fnendly/helpful
059 90 200"
PFQ percent food quality 071 90 200"
PPV percent pnce/vakie 170 90 000
PWT percent wait «me 076 90 200"
PFV percent food variety 066 90 200"
’ T b it « • lOMir bound O f th 8 t ru f f «gnAcM in.
*• U W o t* Signdicsnc» Cofmction
Reproduced with permission of the copyright owner. Further reproduction prohibited without permission.

75
Histogram
iT 00 0 0 1 00 2.00 3 00 4 00 S X
SO 1 . x Z X 3 X 4 X
p#fC#n*Wmd*yWp#ul
Normal Q-Q Plot of percent friendly/helpful
IUJ
Reproduced with permission of the copyright owner. Further reproduction prohibited without permission.

76
Histogram
to o 2.00 1 0 0 * 00 1 0 0 COO 700 COO
t U 1 0 0 IS O 4 3 0 5 30 C 50 7 30
p#fc**#oodqum%
Normal Q-Q Plot of percent food quality
2
0
UJ «3
O bM w td Vaiw
Reproduced with permission of the copyright owner. Further reproduction prohibited without permission.

77
Histogram
m 0#*' 193
10 30 s o 70 9 0 110 130 ISO 17 02 0 40 60 80 100 120 140 160 180
p w c a n l p n c t / v i t M
Normal Q-Q Plot of percent price/value
I
UJ0 10
O bM iytdV ihM
Reproduced with permission of the copyright owner. Further reproduction prohibited without permission.

78
Histogram
t o 1 0 SO 7 0 9 0 110 130
2 0 4 0 0 0 a o 100 120 140
p e f e e m w * t t m e
Normal Q-Q Plot of percent wait time3
2
0
ObwrmdVWu#
Reproduced with permission of the copyright owner. Further reproduction prohibited without permission.

79
Histogram
0 0 t o ZO 3 0 4 0 9 0 6 0 7 0 6 0 9 0 100
p e ie e n l fo o d W i n y
Normal Q-Q Plot of percent food variety
2
0
•2
0 2 4 6 8 10 12
ObtmdVtkit
Reproduced with permission of the copyright owner. Further reproduction prohibited without permission.

APPENDIX D
80
Reproduced with permission of the copyright owner. Further reproduction prohibited without permission.

81
AUTO CORRELATION -REGION 1FOH
10
LagNumbar
C ofifoanc* L iT tt i
Hcaffftam
W -'0
1I I " ” i ' r
LaQNumMr
AVETURN
Reproduced with permission of the copyright owner. Further reproduction prohibited without permission.

82
REGION I BUFFET
FOH1 0
5
00
S
C«nfiaine» L m t i
60H1 0
s
0 0
5
10
L iO N u m b tr
AVETURN
C oM ttvnc* i jm tB
LigNuffltar
Reproduced with permission of the copyright owner. Further reproduction prohibited without permission.

83
REGION I STEAKHOUSE
FOH
0
C o fr fn n c a L > n o
LagNumtar
BOH
i2 S3 « 8
Lag Number
AVETURN
00
ConfMnc* Uffia
Leg Number
Reproduced with permission of the copyright owner. Further reproduction prohibited without permission.

84
REGION I COFFEE SHOPFOH
Lag Numb#
BOH10
5
0 0 '
9ConfMnoumB
Lag Numb#
AVETURN10
5
00
s
■to
C a n m tn c t U fn a
UaNuntar
Reproduced with permission of the copyright owner. Further reproduction prohibited without permission.

85
REGION n BUFFET
FOH10
9
00
9
■1 0
3 9 6
Conftone»L«nd
Caemc#
LjgNumbtr
BON10
9
00
9
•10
C onfidanct L « n a
Lag Number
AVETURN
i2 3 5 a a
Lag Numb#
Reproduced with permission of the copyright owner. Further reproduction prohibited without permission.

86
REGION n STEAKHOUSE
FOH
.10
L ig N u n s t r
BOH
U g N u f f lb t r
AVETURN1 0 '
9
00
9
102 3 9 6 T a
Conflaano» L f M i
LJONumtar
Reproduced with permission of the copyright owner. Further reproduction prohibited without permission.

87
REGION U COFFEE SHOP
FOH
00
ConWBfm Lvna
LagNumbir
BOH
00
LfQNuRM
AVETURN
0 0 '
C a n tM n c * L i r ia
UgNumbv
Reproduced with permission of the copyright owner. Further reproduction prohibited without permission.

88
REGION n COFFEE SHOP
FOH
00
LaoNufib»
BOH
00
Lag Number
AVETURN10
ft
0 0
ft
•10
C onfk iine» u m tt
LigNutMnr
Reproduced with permission of the copyright owner. Further reproduction prohibited without permission.

89
REGION m BUFFET
FOH1 0
5
0 0
i'C orfto inca l i n t t
LmgNwmW
BOH1 0 '
i
00
.10
ConAOMKtuna
LagNumbf
AVETURN
00
2 3 5 « 8
LmgNumWf
Reproduced with permission of the copyright owner. Further reproduction prohibited without permission.

90
REGION III STEAKHOUSE
FOH
0
Connomea u n o
Lag Numb#
BOH
00
Caneoenc» t n e
LagNuntttr
AVETURN
00
C o n fto rw j L ir m
UaNunttw
Reproduced with permission of the copyright owner. Further reproduction prohibited without permission.

91
REGION n COFFEE SHOP
FOH
00
2 ii 6 S
LjQNumb»
BOH
§
9
0 0
9
I
Conttomca u n t t
LagNumfeH
AVETURN
00
Hcotffnnt
UoNunttw
Reproduced with permission of the copyright owner. Further reproduction prohibited without permission.

92
REGION m BUFFET
FOH
00
i2 3 6 8
CtfAawKaifno
HcMAeam
Lag Numb*
BOH
00
Lag Numb*
AVETURN10
s
00
9
•to2 3 9 6
Lag Numb*
Reproduced with permission of the copyright owner. Further reproduction prohibited without permission.

REGION m STEAKHOUSE
FOH10
00
i
10
LagNuM
ConAOine* l < n o
93
BOH
C o n A a m ca u m a
L igN uffltnc
AVETURN1 0 '
3
00
3
ï -to2 3 5 6 8
Conftom ca u n i t
IjgNun**
Reproduced with permission of the copyright owner. Further reproduction prohibited without permission.

94
REGION in COFFEE SHOP
FOH
2 3 e 8
LtgNutntar
BOH10
5
00
.1 0
UgNumtar
AVETURN1 0
5
00
s
-10
L iO N u n te
Reproduced with permission of the copyright owner. Further reproduction prohibited without permission.

VITA
Graduate College University o f Nevada, Las Vegas
Karl D Brandmeir
Home Address;512 Cnunpler Place Henderson, NV 89052
Degrees:Bachelor o f Arts, Hotel Administration Washington State University, 1969
Thesis Title:The Relationship between Employee Turnover and Customer Service Quality in Casino Restaurants
Thesis Examination Conunittee:Chairperson, Dr. Seyhmus Baloglu Committee Member, Dr. John T. Bowen Committee Member, Dr. Andrew H. Feinstein Graduate Faculty Representative, Dr. John A. Schibrowsky
95
Reproduced with permission of the copyright owner. Further reproduction prohibited without permission.