the report on apec’s 2010 economies’ progress … foreword 1 chapter 1: the bogor goals and the...
TRANSCRIPT

The Report on APEC’s 2010 Economies’ Progress Towards the Bogor Goals
14 November 2010


CONTENTS Foreword 1 Chapter 1: The Bogor Goals and the Changing Trade Policy Environment 3 1. The Bogor Goals ............................................................................................................ 3 2. The Bogor Goals and the Evolving Trade Policy Environment .............................. 6 Chapter 2: APEC Economic, Trade, and Investment Outcomes since the Bogor
Declaration in 1994 16 1. Trade in Goods and Services ..................................................................................... 16 2. Foreign Direct Investment ........................................................................................ 20 3. Economic Growth and Improving Social Outcomes .............................................. 23 Chapter 3: Trade and Investment Liberalization and Facilitation since the Bogor
Declaration 27 1. Overview ..................................................................................................................... 27 2. Assessment of Specific Areas .................................................................................... 28 (1) Tariffs ...................................................................................................................... 28 (2) Non-Tariff Measures ............................................................................................. 35 (3) Services .................................................................................................................. 41
(i) WTO Commitments .................................................................................... 42 (ii) RTAs/FTAs .................................................................................................... 47 (iii) Domestic Measures and Other Liberalization Initiatives ...................... 55
(4) Investment ............................................................................................................. 61 (5) Trade Facilitation .................................................................................................. 67
(i) Standards and Conformance ...................................................................... 69 (ii) Customs Procedures .................................................................................... 71 (iii) Mobility of Business People ........................................................................ 72 (iv) Rules of Origin (ROOs) ............................................................................... 73
(6) Other Measures .................................................................................................... 74 (i) Intellectual Property Rights (IPR) ............................................................. 74 (ii) Competition Policy ....................................................................................... 76 (iii) Government Procurement .......................................................................... 76 (iv) Deregulation/ Regulatory reform ............................................................... 78 (v) WTO Obligation ........................................................................................... 79

(7) Other Efforts Reported Voluntarily .................................................................... 79 (i) Supporting multilateral trading system ................................................... 80 (ii) Environment ................................................................................................ 80 (iii) Labor ............................................................................................................. 81 (iv) E-commerce .................................................................................................. 82 (v) Services and investment ............................................................................. 83 (vi) Ease of Doing Business ............................................................................... 84
Chapter 4: Conclusion 85 1. Progress to Date ......................................................................................................... 86 2. More to Be Done ......................................................................................................... 88 List of Abbreviations 90 References 91

1
Foreword This Report assesses the performance of 13 APEC economies (hereinafter referred to as the “2010 economies”) toward the Bogor Goals. This includes APEC’s five industrialized economies (Australia, Canada, Japan, New Zealand and the United States, referred to as the “APEC5”), as well as the group of developing member economies which volunteered to be part of the 2010 assessment (Chile; Hong Kong, China; Korea; Malaysia; Mexico; Peru; Singapore and Chinese Taipei, referred to as the “APEC8”). The decision of the APEC8 to participate in the 2010 assessment in no way prejudices their status as “developing economies”. The report consists of four chapters that provide an analysis of the progress toward the Bogor Goals by the 2010 economies. Chapter 1 provides an overview of the origin of the Bogor Goals and how the trade policy environment in the APEC’s region has changed since the Bogor Goals were articulated in 1994; Chapter 2 documents trade and investment outcomes in the region since the Bogor Goals were formulated; Chapter 3 provides an analysis of liberalization and facilitation in specific areas that have taken place among the 2010 economies and more generally in APEC as a whole; and Chapter 4 concludes the report by assessing the progress made toward the Bogor Goals by the 2010 economies and highlighting the areas where more work remains to be done. The stages involved in undertaking this assessment, and their timing, as agreed by APEC economies, are presented in Annex 1. Analysis contained in the report is drawn from several sources, including detailed fact sheets1 submitted by the 2010 economies, as well as additional information provided by member economies. The report also draws from the APEC Policy Support Unit (PSU) which undertook a separate detailed assessment report “Progressing towards the APEC Bogor Goals Perspectives of the APEC Policy Support Unit” (hereinafter called “PSU Report”).1 Data and analysis from independent reports commissioned from other relevant international organizations1 including the World Trade Organization (WTO), the Organisation for Economic Cooperation and Development (OECD), the United
1 These documents are available on the APEC website (http://www.apec.org/bogor_goals_2010_report.html)
2
Nations Commission for Trade and Development (UNCTAD), the World Bank, the Asian Development Bank (ADB) and Inter-American Development Bank (IDB) also contributed to this report as references where appropriate. Views were also sought from the APEC Business Advisory Council (ABAC), Pacific Economic Cooperation Council (PECC) and other bodies and individuals, including those expressed during the 2010 APEC Symposium held on December 9th and 10th, 2009, in Tokyo, Japan.

3
Chapter 1 - The Bogor Goals and the Changing Trade Policy Environment 1. The Bogor Goals In 1994, APEC Leaders, gathering in Bogor, Indonesia at their second meeting, issued a Declaration of Common Resolve (the Bogor Declaration) which was intended to strengthen the multilateral trading system, enhance trade and investment liberalization and facilitation in the Asia-Pacific region and to intensify Asia-Pacific development cooperation. In the declaration Leaders also committed the region to achieving free and open trade and investment in the Asia-Pacific by no later than the year 2020. This reflected a strong, shared belief that free and open trade and investment were necessary to fully realize growth and prosperity in the Asia-Pacific region. Leaders nominated 2010 as the target year for APEC industrialized economies to achieve the goal of free and open trade and investment in the Asia-Pacific. Taking account of the differing levels of economic development among APEC economies, Leaders agreed that developing economies were to achieve this goal by no later than 2020. Leaders also recognized the importance of intensifying Asia-Pacific development cooperation through APEC as an important means of attaining sustainable growth and equitable development of APEC economies to meet these commitments. The objective of APEC members to enhance trade and investment liberalization in the Asia-Pacific region was stated in the Bogor Declaration as follows:
“With respect to our objective of enhancing trade and investment in the Asia-Pacific, we agree to adopt the long-term goal of free and open trade and investment in the Asia-Pacific. This goal will be pursued promptly by further reducing barriers to trade and investment and by promoting the free flow of goods, services and capital among our economies. We will achieve this goal in a GATT-consistent manner and believe our actions will be a powerful impetus for further liberalization at the multilateral level to which we remain fully committed.
“We further agree to announce our commitment to complete the achievement of our goal of free and open trade and investment in the Asia-Pacific no later than the year 2020. The pace of implementation will take into account differing levels of economic development among APEC economies, with the industrialized economies achieving the goal of free and open trade and
4
investment no later than the year 2010 and developing economies no later than the year 2020.
“We wish to emphasize our strong opposition to the creation of an inward-looking trading bloc that would divert from the pursuit of global free trade. We are determined to pursue free and open trade and investment in the Asia-Pacific in a manner that will encourage and strengthen trade and investment liberalization in the world as a whole. Thus, the outcome of trade and investment liberalization in the Asia-Pacific will not only be the actual reduction of barriers among APEC economies but also between APEC economies and non-APEC economies. In this respect we will give particular attention to our trade with non-APEC developing countries to ensure that they will also benefit from our trade and investment liberalization, in conformity with GATT/WTO provisions.”
The Bogor Declaration provided guidance on how to achieve economic cooperation and growth within APEC and throughout the world rather than a precise definition of the long-term goal of free and open trade and investment. First, it stated that there should be prompt actions in reducing barriers with a view to promoting the free flow of goods, services and capital. Second, the Declaration stated that the goal should be achieved in a GATT/WTO-consistent approach, which meant that it should follow the rules and principles in force under the WTO. Consistent with this, Leaders committed to the principle of non-discrimination, according to which any APEC member trade policy measures would benefit all WTO members in the same manner. This approach of “open regionalism” remains a hallmark of APEC, the first international grouping to endorse such a principle, and helped to prevent trade diversion as the region liberalized2. In reality, APEC liberalization has occurred through a variety of means, including implementation of economies’ existing Uruguay Round and other WTO commitments, unilateral market opening measures as economies sought to enhance their competitiveness and reduce costs, and through the growing number of regional and bilateral free trade agreements (RTAs/FTAs) involving APEC economies.
2 Refer to the following two documents: 1) Armstrong, S. and P. Drysdale (2009), The influence of economics and politics on the structure of world trade and investment flows, Crawford School of Economics and Government; Australian National University. Paper presented at the 33rd Pacific Trade and Development Conference, The Politics and the Economics of Integration in Asia and the Pacific, 6-8 October 2009, Chinese Taipei; and 2) APEC Policy Support Unit (H. Lee and J. Hur, 2009), Trade Creation in the APEC Region: Measures of the Magnitude of and Changes in Intra-Regional Trade since APEC’s Inception.

5
APEC is a unique international forum in that it is consensus based and non- binding. The adoption of this approach suited the fact that APEC comprises economies of varying sizes, at various stages of development. Viewed against this background, the vision of an open and highly integrated region under the Bogor Goals is all the more impressive. The Bogor Goals have provided APEC with a clear vision that encourages economies to pursue individually and, through coordinated measures, collectively trade and investment liberalization and facilitation underpinned by economic and technical cooperation. This began with the 1995 Osaka Action Agenda (OAA), later updated in 2002, which was designed as the underlying framework for moving APEC toward the Bogor Goals. As part of this framework, a set of general principles (comprehensiveness; WTO consistency; comparability; non-discrimination; transparency; standstill; simultaneous start, continuous process, and differentiated time tables; flexibility; cooperation; and relevance, progressiveness and effectiveness) have been defined for member economies as they proceed through the APEC liberalization and facilitation process. The OAA also identified fifteen specific areas where actions were to be undertaken: tariffs; non-tariff measures; services; investment; standards and conformance; customs procedures; intellectual property; competition policy; government procurement; deregulation/regulatory reform; implementation of WTO obligations including rules of origin; dispute mediation; mobility of business people; information gathering and analysis; and strengthening economic legal infrastructure. In 1996, APEC adopted Individual Action Plans (IAPs) to track individual economies’ progress toward the Bogor Goals. In 1997, this was supplemented with a program of peer reviews to review the individual progress toward the Bogor Goals. In 2005, APEC conducted a major stocktake of economies’ progress in meeting the Bogor Goals (see Box 1.1). BOX 1.1: MID-TERM STOCKTAKE OF THE BOGOR GOALS3 A Mid-Term Stocktake of Progress Towards the Bogor Goals (MTST) was endorsed by APEC during the 17th APEC Ministerial Meeting in Busan, Korea, in November 2005. The MTST report recognized the importance of the commitment of the Bogor Goals. It stressed the fact that the goal of free and open trade and investment should not be interpreted in a finite or static manner. In this regard, the MTST made clear that, in terms of the achievement of the
3 PSU Report, p7-8.

6
Bogor Goals, the trade facilitation and behind-the-border issues are as important as the issues related to trade and investment liberalization. The report identified significant liberalization and facilitation of trade and investment since 1994 in progress towards the Bogor Goals. In this sense, many trade and investment barriers fell substantially and efforts in facilitation started to be implemented in APEC during that period. According to the MTST report: · Average applied tariff rates of APEC economies went down by 11.4 percentage points; · A number of non-tariff barriers were either removed or converted into tariffs, which caused a
reduction in the levels of overall protection; · Efforts in the APEC region took place to reduce barriers to trade in services by eliminating
restrictions on market access, extend national and Most Favored Nation (MFN) treatment; · The APEC region became more open to Foreign Direct Investment (FDI) by eliminating
restrictions, improving investment promotion measures and reducing administrative procedures;
· APEC started to show more willingness to work on initiatives in order to improve performance in areas related to trade and investment facilitation.
· A correlation existed between the reduction of trade and investment barriers and the increase of trade in goods, services and investment flows. Moreover, variables such as real Gross Domestic Production (GDP), real GDP per capita and employment levels grew substantially across the APEC region.
The MTST report also referred to the important role played by WTO-consistent and high quality RTA/FTAs in contributing towards the Bogor Goals. The MTST recognized that these agreements can be helpful in opening markets and show the positive effects of trade liberalization. 2. The Bogor Goals and the Evolving Trade Policy Environment The trade and investment landscape in the APEC region has changed considerably since APEC’s creation in 1989. Non-tariff barriers have become more significant in terms of their proportionate impact on trade flows in the region. This has led APEC economies to focus on factors, including regulations, physical infrastructure and the quality of domestic markets and institutions; and to a growing appreciation of the role of regional supply chains in connecting the region’s economies.

7
In addition, APEC economies have broadly entered into RTAs/FTAs, as a way to supplement the work being done in the multilateral trading regime. Slower than expected progress in multilateral trade negotiations, has led APEC economies to undertake RTAs/FTAs in order to further liberalize trade and investment. These developments coupled with rapid technological and social change, and the need to deal with the stresses of financial crises, including most recently the global financial crisis have had a significant impact on economies’ trade and investment policies, and how they pursued the Bogor Goals. While APEC has needed to adapt its priorities and actions in light of these trends and challenges, meeting the Bogor Goals has always been its major objective. APEC and the Multilateral Trading System According to the WTO4, APEC economies have been at the forefront of efforts to liberalize trade multilaterally through the GATT and the WTO and to strengthen the rules-based multilateral trading system, and played a valuable role in forging the political consensus that allowed for a successful conclusion of the Uruguay Round negotiations in 1994. Consistent with their pledge to pursue open regionalism, economies have been committed to strengthening the open multilateral trading system as their first priority. Through the Bogor Declaration, APEC economies agreed to “accelerate the implementation of our Uruguay Round commitments and to undertake work aimed at deepening and broadening the outcome of the Uruguay Round”. The 2010 economies have successfully implemented their Uruguay Round commitments. In November 2001, a new round of multilateral trade negotiations was launched at the fourth Ministerial Conference in Doha, called the Doha Development Agenda (DDA). APEC economies have been active in all areas of the current negotiations under the DDA.5 Despite the progress made to date, the DDA remains unfinished. APEC Leaders continue to press for a successful conclusion to the DDA, and in November 2009 reaffirmed their support for “an ambitious and balanced conclusion 4 WTO Secretariat (2010), WTO Secretariat’s Note: “APEC: The Bogor Goals” (hereinafter referred to as “WTO Secretariat’s Note”), p1. 5 WTO Secretariat’s Note, p1.
8
to the Doha Development Agenda”. In response, like many WTO members, APEC economies have also sought additional ways to liberalize and facilitate trade and investment, including by pursuing regional RTAs/FTAs. RTAs/FTAs within the APEC Region Since the Bogor Declaration, the number of RTAs/FTAs involving APEC economies has increased sharply as a way to encourage trade and investment liberalization. The agreements involving the 2010 economies generally sought to be consistent with WTO rules, which require elimination of duties on substantially all trade and of substantially all discrimination in services sectors with substantial sectoral coverage, often including services and investment commitments, as well as requiring that new barriers not be erected against parties not included in the agreements. According to the WTO Secretariat’s Note6, only three agreements involving APEC economies were in place in 1994, when the Bogor Goals were announced.7 By the time the MTST of the Bogor Goals was conducted in 2005, “approximately 45 RTAs (many of them covering both goods and services) involving APEC economies were in force. Today, the 13 APEC economies have almost 100 RTAs in force and all APEC economies are involved in RTA negotiations”. The WTO Secretariat reports that “the 13 APEC economies currently have 40 RTAs in force with APEC members and an estimated 59 with non-APEC members.”8 It also reported that Singapore, Japan and Chile have negotiated the most intra-APEC RTAs/FTAs with 13, 10 and 9 intra-APEC RTAs/FTAs in force, followed by Australia with 7 intra-APEC agreements, Malaysia, New Zealand and Peru with 6 each and the United States with 5 agreements in force. A large number of additional intra-APEC agreements are under negotiation by these economies. Korea for example currently has 7 agreements that are either being negotiated or are yet to enter into force. In terms of RTAs with non-APEC economies, the WTO Secretariat’s Note states that Mexico and Chile are particularly active with 19 and 11 RTAs in force, followed by Peru with
6 WTO Secretariat’s Note, p.1-2. 7 These include the Australia New Zealand Closer Economic Relations Trade Agreement (ANZCERTA); the ASEAN Free Trade Agreement (AFTA); and the North American Free Trade Agreement (NAFTA). 8 The figures on RTAs in force include those that have been notified to the WTO as well as those that have not.

9
7 agreements and Singapore and the United States with 6 each.9 As RTAs/FTAs increased in popularity, the percentage of trade of APEC members with FTA partners worldwide increased significantly, in most cases for both exports and imports (Table 1.1).
Table 1.1 Percentage of trade with FTA partners
%1996 2009 1996 2009
Weighted averageAPEC5 28.2 37.3 26.4 31.1APEC8 19.0 45.5 16.0 44.42010 economies 24.8 40.9 22.7 36.0APEC 22.6 36.5 21.0 33.0
Export Import
Note: This table presents how much of each APEC economy’s exports/imports are destined to/originated from its
RTA/FTA partners in 1996 and 2009. For the numbers in 1996, FTAs enforced before 31 December 1996 are
considered; for numbers in 2009, FTAs enforced before 31 December 2009 are considered.
Source: Data calculated by the PSU (Original source: International Monetary Fund (IMF), Direction of Trade Statistics
online database; Chinese Taipei's Bureau of Foreign Trade.)
APEC has conducted important work to encourage its members to negotiate WTO consistent and high-quality trade agreements, which are open to accession from third parties on a negotiated basis.10 In 2004, economies agreed to APEC Best Practices for RTAs and FTAs11, which, inter alia call for consistency of RTAs with APEC and WTO principles and rules; agreements that build upon existing WTO commitments and explore commitments in additional areas not covered by WTO rules; comprehensive coverage including liberalization in all sectors including elimination of tariff and non-tariff barriers to trade and investment as well as minimum phase out periods for protection of sensitive products; transparency; efforts to improve trade facilitation; and simple rules of origin.12 In addition, since
9 A number of the extra-APEC RTAs, especially those involving Mexico and Chile, are partial scope agreements under the umbrella of the Latin American Integration Association (LAIA/ALADI) agreement. 10 WTO Secretariat’s Note, p 2. 11 http://www.apec.org/apec/apec_groups/other_apec_groups/FTA_RTA.MedialibDownload.v1.html?url=/etc/medialib/apec_media_library/downloads/ministerial/annual/2004.Par.0004.File.v1.1 12 WTO Secretariat’s Note”, p 2.

10
2005, APEC economies have developed APEC Model Measures for RTAs/FTAs13 based on these principles, covering the fifteen chapters most commonly found in RTAs, for guiding APEC members when negotiating agreements14, 15 And in 2009, APEC Trade Ministers agreed to accelerate work on identifying convergence and divergence across APEC member RTAs and expand this work to include an analysis of electronic commerce and cooperation provisions. In turn, these developments set in train a growing willingness to discuss more ambitious ways for achieving convergences among economies’ RTAs/FTAs, including possible pathways toward a Free Trade Area of the Asia-Pacific (FTAAP). A Growing Emphasis on Trade and Investment Facilitation While trade and investment facilitation were from the beginning a major pillar of APEC’s approach to meeting the Bogor Goals, their importance has grown as economies have come to better appreciate the impact of non-tariff barriers on trade and investment flows, particularly given the growing importance of international supply chains throughout the region (see Box 1.2). It also became clearer that with substantial reductions in tariffs, greater trade and investment gains were more likely to flow from reducing and eliminating non-tariff barriers. According to the World Bank, even modest improvements in APEC’s performance in port logistics, standards harmonization, administrative transparency, and other areas related to trade facilitation, could result in a further 10% increase in intra-APEC exports, worth roughly US$280 billion. Similarly, the sharp increase in regional movement of people owing to the rapid growth in business mobility, international education, and tourism, over time placed a greater emphasis on facilitation measures. This facilitation agenda continues to provide a natural forum for business to provide its perspectives when identifying barriers in the operation of regulations, customs, 13 http://www.apec.org/apec/apec_groups/other_apec_groups/FTA_RTA.MedialibDownload.v1.html?url=/etc/medialib/apec_media_library/downloads/committees/cti/pubs/2008.Par.0013.File.v1.1 14 These are: trade facilitation (endorsed in 2005); cooperation, dispute settlement, government procurement, technical barriers to trade, trade in goods and transparency (endorsed in 2006); electronic commerce, rules of origin and SPS measures (endorsed in 2007); and competition policy, customs administration and trade facilitation, environment, safeguards and temporary entry for business persons (endorsed in 2008). 15 WTO Secretariat’s Note, p 2.
11
infrastructure and other elements which impacted on commerce in the region. Box 1.2: Trade and Investment Facilitation in APEC In 2001, APEC endorsed its first Trade Facilitation Action Plan (TFAP), which was in place from 2002-2006 and resulted in an APEC-wide reduction in trade transaction costs of 5%. Based on the success of TFAP I, a second plan (TFAP II) was introduced for 2007-2010. Both plans consist of initiatives for reducing the obstacles to trade associated with customs procedures, standards and conformance, business mobility and business regulation. An interim review of TFAP II showed excellent progress toward the TFAP II goal of an additional 5% reduction in trade transaction costs. The final assessment of TFAP II is underway now and will be completed in 2011. In 2008, APEC endorsed its first Investment Facilitation Action Plan (IFAP) for 2008-2010. In 2009, Leaders recognized the importance of the development of supply chains to regional economic linkages, endorsing the Supply-Chain Connectivity Framework that identifies eight priority logistics-related chokepoints and directs future work to reduce or eliminate the chokepoints. These initiatives have already borne fruit, with container shipping fees among the lowest in the world16. The Role of Technology Similarly, the rapid changes in technology, particularly the rise of information and communications technologies (ICTs), have played a critical role in the expansion of trade, investment, and economic growth within APEC and throughout the world, which has contributed to the increased focus on the inclusion of electronic commerce provisions in RTAs/FTAs. The development of new technologies has spurred economic growth through the formation of new industries, services, and markets, which in turn has led to increased efficiencies and economies of scale for business, job creation, and the wider dissemination of services and goods for consumers. For example, the development of electronic commerce has provided small and medium enterprises (SMEs) with access to potential customers across the world. New technologies have also encouraged the trade in components that make up finished goods through the development of sophisticated regional supply chains. ICTs have also significantly impacted how trade is conducted in APEC through improvements
16 OECD (2010), Progress Towards Trade and Investment Liberalisation by Industrialised APEC Economies (hereinafter called “OECD report”), p 7.

12
in trade facilitation and transparency, which has led to lower transactions costs for business.17 The increased use of electronic formats to exchange and manage information in real time has facilitated the use of single window systems and paperless trading within APEC. ICTs have also improved the transparency of customs procedures by improving the accessibility of customs related information, which can increase certainty and predictability for business. Impact of the Global Financial Crisis on APEC The Asia-Pacific region experienced two major financial and economic shocks in 1997 and 2008, with regional and global consequences that have severely disrupted economic growth. Following the 1997 Asian financial crisis, there were even arguments that APEC could not respond to it appropriately, undermining its credibility as an advocate for free and open trade and investment. These concerns proved unfounded, however, as APEC continued to pursue trade and investment liberalization and facilitation. In the wake of the 2007 Global Financial Crisis, APEC economies responded quickly and decisively by implementing robust economic and financial measures. At a time when those measures were producing tangible outcomes in mitigating the impact of the crisis, APEC Ministers and Leaders in Lima, 2008 and Singapore, 2009 not only reaffirmed their commitment to free and open trade and investment, but also continued to exercise leadership in seeking to restore financial systems, in tandem with G-20 and other international fora, sending strong messages to resist protectionism. In 2008 and 2009, APEC Leaders committed to opposing all forms of protectionism and keeping markets open, and refraining from raising new barriers to investment or to trade in goods and services. At the 21st APEC Ministerial Meeting in Singapore 2009, APEC Ministers pledged “to continue to exercise maximum restraint in implementing measures that may be considered to be WTO consistent if they have a significant protectionist effect and promptly rectify such measures where implemented”18. 17 Helbe, Shepherd, and Wilson (2007), Transparency and Trade Facilitation in the Asia Pacific: Estimating the Gains from Reform, World Bank. 18 21st APEC Ministerial Meeting, Joint Statement

13
During the crisis, APEC sought to address the deterioration in trade finance situation in the region, supporting the economic recovery. In 2009, APEC Ministers Responsible for Trade welcomed the establishment of the Asia-Pacific Trade Insurance Network, including the establishment of additional bilateral re-insurance agreements among some APEC member economies following the APEC Leaders’ meeting in Lima in 2008. At that time, it was also recognized that the sharing of experience among APEC economies had helped strengthen their capabilities in this area. An Emerging Focus on Structural Reform and Promoting Economic Growth In 2004, APEC adopted the Leaders’ Agenda to Implement Structural Reform (LAISR), which endorsed a new agenda focused on regulatory reform, public sector governance, competition policy, corporate governance and strengthening economic and legal infrastructure. Partly motivated by the Global Financial Crisis, which had highlighted weakness in some economies’ regulatory and institutional settings, APEC economies have increasingly recognized the importance of structural reform to economies realizing fully the gains from trade and investment liberalization and facilitation. In this way structural reform is seen as an important element in its own right of supporting the achievement of the Bogor Goals by promoting stable and efficient economies. APEC economies have also needed to respond to new challenges which posed risks to the promotion of free and open trade and investment, including the Global Financial Crisis. In order to maintain momentum and spread the benefits of continued trade and investment liberalization and facilitation, APEC Leaders recognized the necessity to formulate a comprehensive long-term growth strategy that supports more balanced growth within and across economies, achieves greater inclusiveness across societies, sustains the environment, builds economies’ resilience to and preparation for disruptions caused by natural disasters, pandemics, terrorism or the scarcity of food and raises economies’ growth potential through promoting innovation and a knowledge-based economy. Structural reform will play an essential role in achieving sustained economic growth and advancing regional economic integration, and vice versa.

14
Economic and Technical Cooperation (ECOTECH) APEC members firmly believe that capacity building or implementation of ECOTECH activities facilitate trade and investment liberalization and facilitation at a faster pace. Since 1996, ECOTECH activities have helped to reduce technological gaps between its members, improve regulatory coherence and convergence, foster sustainable development and achieve greater common prosperity. Between 1996 and 2010, APEC implemented or approved 1274 ECOTECH projects totaling US$58 million 19 . Since the recommendations of the mid-term stock take of 2005, ECOTECH capacity building activities have been incorporated into the full range of APEC activities and have been tailored to accommodate the needs of member economies. APEC can make a significant contribution through efficient and demand-driven ECOTECH activities, in particular its capacity building activities to the progress of liberalization and facilitation and in turn to promoting sustainable economic growth and welfare improvements.
Table 1.2 ECOTECH projects
Self-fund***Total budget forapprovedprojects (US$)
No ofECOTECHprojects
Total budget forECOTECHprojects (US$)
Total budget(contribution)(US$)
No ofECOTECHprojects
Total budgetfor ECOTECHprojects (US$)
Total budget(contribution)(US$)
No ofECOTECHprojects
Total budgetfor ECOTECHprojects (US$)
No ofECOTECHprojects
1993 977,395.00 28 685,540.00 71994 1,119,301.00 29 916,501.00 81995 2,001,607.00 43 1,229,917.00 111996 1,423,466.00 38 1,169,556.00 111997 1,788,354.00 36 1,522,679.00 4,274,388.78 18 2,101,164.00 91998 2,063,727.00 34 1,620,154.00 3,757,703.30 11 1,538,850.00 91999 2,436,932.00 40 1,856,999.00 4,201,327.63 10 922,758.00 1612000 2,318,633.00 40 1,864,778.00 4,599,924.91 13 1,235,200.00 132001 1,880,484.00 37 1,623,169.00 4,186,125.95 28 2,690,816.00 222002 1,988,123.00 37 1,575,968.00 4,221,469.25 14 1,304,945.00 242003 2,021,226.00 43 1,693,276.00 2,755,742.10 23 1,908,776.00 152004 1,998,502.00 37 1,576,017.00 2,936,904.45 25 1,867,948.70 152005 2,109,237.00 40 1,961,067.00 2,051,656.31 20 1,686,740.00 779,000.00 0 0.00 382006 2,059,410.00 35 1,813,794.00 1,753,109.90 25 1,765,354.00 1,770,100.00 13 828,387.00 122007 2,452,116.00 32 2,166,323.00 2,552,541.00 15 1,233,380.00 4,959,300.00 31 840,454.00 52008 1,797,279.00 26 1,707,941.00 2,275,125.97 7 482,190.00 4,046,865.00 51 4,513,864.00 172009 2,686,150.00 30 2,499,315.00 1,586,480.00 10 634,117.00 4,822,161.53 70 6,133,650.00 14
2010**** 128,081.00 2 128,081.00 NA 2 91,500.00 2,320,300.00 10 971,716.00 6Total 33,250,023.00 607 27,611,075.00 41,152,499.55 221 19,463,738.70 18,697,726.53 175 13,288,071.00 397
OA TILF ASF**
Total Number of ECOTECH Projects: 1400, Total Number of ECOTECH Projects (1996-2010) 1274
Total Budget for ECOTECH Projects: US$60,362,884.70, Total Budget for ECOTECH Projects (1996-2010):
US$57,530,926.70
19 For 2010, projects approved at Session 1 (in March) are only included.

15
*In 2006, SCE agreed to consider "ECOTECH projects" as projects proposed by working groups and taskforces and all
ASF projects (no matter proposed by which fora). For the purpose of this list, projects prior to 2006 have been
categorized in the same manner. Projects proposed by SCE (and ESC) and Ad-Hoc Policy Level Group on SMEs
(SMEWG since 2000) are also counted.
** Includes General Fund and all Sub-Funds.
*** Based on PDB and SCE reports (where available). Number could be larger than listed. However, it is difficult to
find exact numbers of projects since not all information of self-funded projects are uploaded on PDB.
****Those approved at Session 1 only.
Source: APEC Secretariat

16
Chapter 2 - APEC Economic, Trade, and Investment Outcomes since the Bogor Declaration in 1994 Since the Bogor Declaration in 1994, the Asia-Pacific region has undergone a significant transformation, to become the world’s fastest growing and most economically open region. Average economic growth in APEC economies has exceeded that for other regions, and intra-regional trade among APEC economies is higher than for the European Union, which has the advantage of a common currency.20 The Bogor Declaration has played an important role in driving these outcomes, by fostering a consensus among regional policy makers in favour of more open trade and investment policies, as well as by encouraging closer cooperation in the formulation of sound economic policies. This policy leadership supported efforts by the region’s business community to tap new opportunities through trade and investment. The acceleration in trade and investment liberalization and facilitation has contributed to faster growth and improved social outcomes, with levels of poverty falling sharply across the region. 1. Trade in Goods and Services21 The nominal value of goods exported collectively by the APEC economies has risen substantially from US$2.0 trillion in 199422 to US$5.6 trillion in 2009 (Chart 2.1). Similarly, the nominal value of imports rose from US$2.1 trillion to US$5.8 trillion over the same period (Chart 2.2). Since 1994, the value of APEC’s trade in goods with the world has increased at an annualized rate of 7.1% (for both exports and imports). With respect to APEC’s bilateral trade, the value of intra-APEC trade in goods was 2.8 times larger in 2009 than in 1994. Furthermore, during this period, the value of APEC’s trade in goods with the rest of the world grew faster than intra-APEC. 20 APEC Policy Support Unit (H. Lee and J. Hur, 2009) 21 The information in this section was taken from PSU Report, p. 17-23. 22 1994 is generally used as the benchmark year to be compared with the most recent data in order to assess progress made since the Bogor Declaration. However, different time periods may be used in the report due to data availability.

17
From 1994 to 2009, APEC’s share of trade in goods with the rest of the world rose from 28% to 33%.
Chart 2.1 Exports of goods
72%68%
76%76% 73%
72%
72%
67%89%
181%
120%
181%
0%
50%
100%
150%
200%
250%
300%
350%
0
1,000
2,000
3,000
4,000
5,000
6,000
1994 2009 1994 2009 1994 2009 1994 2009
APEC5 APEC8 2010 ecconomies APEC
% growth
USD billions
With Rest of WorldWithin APEC% growth (1994-2009)
Note: Levels in 1994 and 2009 are shown by the columns against the left-hand axis. Simple growth rates between
1994 and 2009 are shown by the triangles against the right-hand scale; intra-regional APEC exports as a percentage of
total exports are shown inside each column.
Source: Compiled based on PSU Report (Original source: International Monetary Fund (IMF), Direction of Trade
Statistics online database; Chinese Taipei’s Bureau of Foreign Trade.)
The value of APEC’s imports from the rest of the world also grew faster than intra-regional imports. APEC’s share of imports of goods from the rest of the world grew from 26% to 33% from 1994 to 2009.
Chart 2.2 Imports of goods
70%67%
78% 74% 73%69%
72%
67%
126%153%
135%
180%
0%
50%
100%
150%
200%
250%
300%
0
1,0002,000
3,0004,000
5,0006,000
7,000
1994 2009 1994 2009 1994 2009 1994 2009
APEC5 APEC8 2010 economies APEC
% growth
USD billions
With Rest of WorldWithin APEC% growth (1994-2009)

18
Note: Levels in 1994 and 2009 are shown by the columns against the left-hand axis. Simple growth rates between
1994 and 2009 are shown by the triangles against the right-hand scale; intra-regional APEC imports as a percentage of
total imports are shown inside each column.
Source: Compiled based on PSU Report (Original source: International Monetary Fund (IMF), Direction of Trade
Statistics online database.)
Trade in commercial services is becoming increasingly important across the APEC region. The nominal value of commercial services exported by the APEC region increased significantly from US$432.4 billion in 1994 to over US$1.2 trillion in 2009, an annualized growth rate of 7.2% (Chart 2.3). Similarly, the nominal value of commercial services imported by the APEC region increased from US$439.7 billion in 1994 to nearly US$1.2 trillion in 2009, an annualized growth rate of 6.8% (Chart 2.4).
Chart 2.3 Commercial services exports
151%
184%160%
185%
0%
50%
100%
150%
200%
250%
300%
0
200
400
600
800
1,000
1,200
1,400
APEC5 APEC8 2010 economies APEC
% growth
USD billions
19942009% growth
Note: Levels in 1994 and 2009 are shown by the columns against the left-hand axis. Simple growth rates between
1994 and 2009 are shown by the triangles against the right-hand scale.
Source: Complied based on PSU Report (Original source: APEC, StatsAPEC – Key Indicators Database; World Bank,
World Development Indicators online database; World Trade Organization (WTO), Time Series on International Trade
online database.)

19
Chart 2.4 Commercial services imports
117%
185%
135%
169%
0%
50%
100%
150%
200%
250%
300%
0
200
400
600
800
1,000
1,200
1,400
APEC5 APEC8 2010 economies APEC
% growth
USD billions
19942009% growth
Note: Levels in 1994 and 2009 are shown by the columns against the left-hand axis. Simple growth rates between
1994 and 2009 are shown by the triangles against the right-hand scale.
Source: Compiled based on PSU Report (Original source: APEC, StatsAPEC – Key Indicators Database; World Bank,
World Development Indicators online database; World Trade Organization (WTO), Time Series on International Trade
online database.)
Chart 2.5 Exports of goods and services as a proportion of GDP
11.1
46.0
14.8 15.716.3
70.2
23.4 26.5
0
10
20
30
40
50
60
70
80
APEC5 APEC8 2010 economies APEC
19942008
ProportionofGDP
Note: Percentage of GDP values are shown at the top of each column.
Source: PSU Report (Original source: StatsAPEC - Key Indicators Database; World Trade Organization (WTO), Time
Series on International Trade )

20
Chart 2.6 Imports of goods and services as a proportion of GDP
11.5
48.4
15.3 16.219.7
68.9
26.2 27.4
0
10
20
30
40
50
60
70
80
APEC5 APEC8 2010 economies APEC
19942008
ProportionofGDP(%)
Note: Percentage of GDP values are shown at the top of each column.
Source: PSU Report (Original source: APEC, StatsAPEC - Key Indicators Database; World Trade Organization
(WTO), Time Series on International Trade. )
As a percentage of GDP, total exports of goods and services from APEC economies increased from 15.7% in 1994 to 26.5% in 2008 (Chart 2.5). For the APEC5, the share increased from 11.1% in 1994 to 16.3% in 2008. Exports as a share of GDP in the APEC8 economies has been especially strong, rising from 46.0% in 1994 to 70.2% in 2008. Similarly, total imports of goods and services as a percentage of GDP in the APEC region has increased from 16% in 1994 to 27.4% in 2008 (Chart 2.6). 2. Foreign Direct Investment23 APEC’s FDI inflows and outflows have shown an upward trend since 1994 despite volatility in the early 2000s. FDI inflows to the APEC region increased more than four-fold from 1994 to 2008, growing at an annualized rate of 13.0% per year and reaching nearly US$791 billion in 2008 (Chart 2.7). For the APEC5, FDI inflows increased at an annualized rate of 14.9% over this period, slightly above the world growth rate of 14.4% per year. FDI 23 The information in this section was taken from PSU Report, p.23-26.

21
inflows to the APEC8, however, grew at a slower rate of 9.9%. FDI outflows from APEC economies also grew substantially from 1994 to 2008, increasing at an annualized rate of 12.7% and reaching a peak of US$782 billion in 2008. While outflows from the APEC5 grew at an annualized rate of 12.6% over this period, outflows from the APEC8 increased 8.7% per year and reached US$114 billion in 2008.
Chart 2.7 APEC’s FDI inflows and outflows
<Inflows>
0
100
200
300
400
500
600
700
800
900
1994 1995 1996 1997 1998 1999 2000 2001 2002 2003 2004 2005 2006 2007 2008
APEC8 APEC5 APEC
USDbillions
<Outflows>
0
100
200
300
400
500
600
700
800
900
1994 1995 1996 1997 1998 1999 2000 2001 2002 2003 2004 2005 2006 2007 2008
APEC8 APEC5 APEC
USDbillions
Note: FDI outflows data for Viet Nam are not available until 2005.
Source: PSU calculations (Original source: Asia-Pacific Economic Cooperation (APEC), StatsAPEC - Key Indicators
Database; United Nations Conference on Trade and Development (UNCTAD), Foreign Direct Investment Statistics
online database.)

22
Although inward FDI stocks in the region have increased, APEC’s share of world inward FDI stocks decreased from 48% in 1994 to 39% in 2008. Inward FDI stocks in the APEC region grew at an annualized rate of 11.8% over this period, reaching US$6 trillion in 2008 (Chart 2.8). In 1994, 59% of inward FDI stocks in the APEC region were in theAPEC5. In 2008, this share had fallen to 55% as a greater proportion was in the developing APEC economies. While inward stocks in the APEC5 grew at 11.2% per year, FDI stocks in the APEC8 increased at an annualized rate of 11.7%, compared with a world growth rate of 13.4% per year.
Chart 2.8 Inward FDI stocks
0
1,000
2,000
3,000
4,000
5,000
6,000
7,000
1994 1995 1996 1997 1998 1999 2000 2001 2002 2003 2004 2005 2006 2007 2008
APEC8 APEC5
APEC
USDbillions
Source: PSU calculations (Original source: Asia-Pacific Economic Cooperation (APEC), StatsAPEC - Key Indicators
Database; United Nations Conference on Trade and Development (UNCTAD), Foreign Direct Investment Statistics
online database.)
APEC’s share of world outward FDI stocks decreased from 47% in 1994 to 39% in 2008. Outward FDI stocks from the APEC region grew at an annualized rate of 12.5% during this period, reaching US$6 trillion in 2008 (Chart 2.9). In 1994, 86% of outward FDI stocks from the APEC region were from the APEC5. In 2008, this share had fallen to 72% as a greater proportion came from the developing APEC economies. Outward FDI stocks from the APEC5 increased at 11.1% per year, while outward stocks from the APEC8 grew at an annualized rate of 17.7%, compared with a world growth rate of 14.0% per year.

23
Chart 2.9 Outward FDI stocks
0
1,000
2,000
3,000
4,000
5,000
6,000
7,000
1994 1995 1996 1997 1998 1999 2000 2001 2002 2003 2004 2005 2006 2007 2008
APEC8 APEC5
APEC
USDbillions
Note: Outward FDI stocks data for Viet Nam are not available.
Source: PSU calculations (Original source: Asia-Pacific Economic Cooperation (APEC), StatsAPEC - Key Indicators
Database; United Nations Conference on Trade and Development.) 3. Economic Growth and Improving Social Outcomes24 APEC economies have grown steadily since the Bogor Declaration in 1994, contributing 62% of world growth from 1994 to 2008. Real GDP in the APEC region grew by 54% between 1994 and 2008 (Chart 2.10).
Chart 2.10 Real GDP
40%
76%
43%54% 49%
0%
20%
40%
60%
80%
100%
120%
140%
0
5,000
10,000
15,000
20,000
25,000
30,000
APEC5 APEC8 2010 economies APEC Rest of World
% growth
USD billions
19942008% growth
24 The information in this section is based on PSU Report, p.67-73.

24
Note: Levels in 1994 and 2008 are shown by the columns against the left-hand axis. Simple growth rates between
1994 and 2008 are shown by the triangles against the right-hand scale.
Source: Compiled based on PSU Report (Original source: APEC, StatsAPEC - Key Indicators Database; World Bank,
World Development Indicators online database; Chinese Taipei’s Directorate-General of Budget, Accounting and
Statistics (DGBAS).)
Real GDP per capita in the APEC region increased 37% from 1994 to 2008 (an annualized rate of 2.3%), outperforming the rest of the world, which grew at a rate of 1.3% per year (Chart 2.11). The Real GDP per capita of the APEC5 increased at an annualized rate of 1.6%, while APEC8 economies grew at a rate of 2.9% per year.
Chart 2.11 Real GDP per capita
25%
49%
26%37%
20%
0%
20%
40%
60%
80%
100%
120%
0
5,000
10,000
15,000
20,000
25,000
30,000
35,000
40,000
APEC5 APEC8 2010 economies APEC Rest of World
% growth
USD
19942008% growth
Note: Levels in 1994 and 2008 are shown by the columns against the left-hand axis. Simple growth rates between
1994 and 2008 are shown by the triangles against the right-hand scale.
Source: Compiled based on PSU Report (Original source: APEC, StatsAPEC - Key Indicators Database; World Bank,
World Development Indicators online database; Chinese Taipei’s Directorate-General of Budget, Accounting and
Statistics (DGBAS)).
The employed labor force in the APEC region increased by 14% between 1996 and 2007. In addition, unemployment in the region has steadily declined since 2003. The unemployment rate declined to 4.5% for APEC5 and 3.8% for APEC8 in 2007, falling below 1996 levels.

25
Chart 2.12 Unemployment
5.2
4.0
4.94.64.5
3.8
4.3
5.0
3
4
5
6
APEC5 APEC8 2010 economies APEC
1996
2007
Unemploymentrate(%)
Note: Unemployment rates are shown at the top of each column.
Source: Complied based on PSU Report (Original source: APEC, StatsAPEC – Key Indicators Database; International
Labour Organization (ILO), Key Indicators of the Labour Market (KILM) 6th Edition online database.)
At a region wide level, improvements in educational performance contributed to increased opportunities for employment and an enhanced workforce across the APEC region. The adult literacy rate increased to almost 94% in 2008 from 82% in 199025. For women in the APEC region, the literacy rate increased from 74% in 1990 to 91% in 2008. Large gains were also made in other areas of educational performance, including secondary schooling, with the gross enrolment ratio increasing from 56% in 1990 to 82% in 2008. For girls, the ratio went from 54% to 84% over the same period. Since APEC’s inception, indicators on human development and poverty reduction have shown good progress, a sign of better living conditions in the region. The UNDP’s Human Development Index is a composite measure of the average achievements in an economy in three basic dimensions of human development: a long and healthy life, access to knowledge, and a decent standard of living. According to the index, significant gains to human development have occurred in the APEC region, with the aggregate index for APEC increasing by 11% from 1995 to 2007 (lower panel, Chart 2.13). 25 1990 is used since there are no data available for the adult literacy rate within two years of 1994.

26
Chart 2.13 Human Development Index
2.4%
8.8%
4.0%
10.9%
0%
2%
4%
6%
8%
10%
12%
14%
16%
0.5
0.6
0.7
0.8
0.9
1.0
APEC5 APEC8 2010 economies APEC
% change
19952007% change
HumanDevelopmentIndexvalue
Note: 1.0 is the maximum value. Index values in 1995 and 2007 are shown by the columns against the left-hand axis.
Simple growth rates between 1995 and 2007 are shown by the triangles against the right-hand scale.
Source: Compiled based on PSU Report (Original source: APEC, StatsAPEC – Key Indicators Database; United
Nations Development Programme (UNDP), HDI trends and indicators (1980-2007).)
Chart 2.14 Poverty indicators
820.3
1,240.3
323.9
718.0
0
10
20
30
40
50
60
USD1.25 a day USD2 a day
1994
2007
PercentageofAPECpopulation
Note: Absolute number of people (in millions) is shown at the top of each column. Percentage of population living on
less than $1.25 a day and $2 a day are at purchasing power parity (PPP) using 2005 international prices. As a result of
revisions in PPP exchange rates, poverty rates for individual economies are not strictly comparable with poverty rates
reported in earlier years.
Source: PSU Report (Original source: World Bank, World Development Indicators online database.)

27
Chapter 3 - Trade and Investment Liberalization and Facilitation Since the Bogor Declaration 1. Overview This chapter assesses the progress that has been made by the 2010 economies in trade and investment liberalization and facilitation, key pillars of the Bogor Goals. Recognizing that the 2010 economy grouping consists of both industrialized (the APEC5) and those developing economies that have volunteered to be assessed alongside APEC’s industrialized economies (the APEC8), this chapter provides in depth analysis of both the APEC5 and the APEC8 as well as looking at the trade and investment liberalization and facilitation measures of the 2010 economies as a whole. The Bogor Goals had a direct and immediate impact on trade and investment policy in APEC. The strong commitment to liberalization which the Bogor Goals embodied helped to set in train a significant reduction in barriers to trade and investment. The Bogor Goals also clearly articulated the importance of reducing non-tariff barriers to the expansion of trade and investment in APEC, which contributed to a growing emphasis by policy makers in the region on trade and investment facilitation. This chapter assesses the progress toward the Bogor Goals made by the 2010 economies and APEC as a whole in promoting trade and investment liberalization and facilitation since 1994. In guiding this part of the analysis, emphasis is given to the Osaka Action Agenda (OAA), which Leaders endorsed in 1995 as a framework for APEC’s efforts to achieve the Bogor Goals on a sectoral basis, as reported by each economy annually through Individual Action Plans (IAPs) and fact sheets submitted by the 2010 economies for this assessment. Areas and sectors assessed in the next section are essentially those which are referred to in the OAA and/or IAPs. First, where available and appropriate, numerical data, most of which are based on the information in the fact sheets and/or the PSU Report and/or contributions from relevant international organizations, are used to measure the progress that has been made by the 2010 economies since the years immediately following the announcement of the Bogor Goals comparing
28
outcomes to world averages/standards. Second, the adoption of relevant international agreements by the 2010 economies is noted. Third, examples of initiatives undertaken by individual economies are referred to as appropriate, in particular in cases where numerical data for collective assessment are not available. Finally, each section refers to major relevant initiatives by APEC in the relevant area. 2. Assessment of Specific Areas (1) Tariffs Under the OAA, APEC economies committed to reduce tariffs progressively and transparently until the Bogor Goals are fully achieved. Since 1994, APEC economies have reduced tariffs through a combination of multilateral and unilateral processes, as well as concluding RTAs/FTAs. In particular, APEC economies’ implementation of WTO Uruguay Round agreements, and additional multilateral commitments post-Uruguay Round for some industrial goods, have significantly reduced tariffs. But APEC economies have done more to liberalize trade than required as a result of multilateral trade negotiations. APEC economies’ collective pledge to achieve the Bogor Goals, and their acceptance of the OAA as the roadmap for getting there, created an environment conducive to unilateral tariff reduction as a means to improve the competitiveness of domestic industries and allow businesses to benefit from the globalization of supply chains. In combination, tariff liberalization through multilateral and unilateral means has led to impressive declines in applied tariffs across the APEC region. Since 1996, the simple average Most Favored Nation (MFN) applied tariffs for the APEC region fell from 10.8% to 6.6% in 200826. In contrast, the global MFN applied tariff average in 2008 was 10.4%27. Among the APEC5, the simple average applied tariff rate fell from 7.0% in 1996 to 3.9% in 2008. Similarly, for the APEC8, the simple average applied tariff fell from 8.9% to 6.4% over the same period. For the 2010 economies, the simple average applied tariff rate fell from 8.2% to 5.4% over the same period28 26 PSU Report, p.29. 27 PSU Report, p.26 and PSU calculation. 28 PSU Report, p.26 and the PSU calculation based on data from WTO, Tariff Download Facility online database;

29
(Chart 3.1 <Simple Average>). When tariffs are weighted by the proportion of imports entering under that tariff, trade-weighted average tariffs were 2.7% for the APEC5 and 4.5% for the APEC8 in 200829 (Chart 3.1 <Weighted Average>). The concept of “average effective tariff” helps to illustrate the important and beneficial impact of RTAs/FTAs, the Generalized System of Preferences (GSP) and other unilateral measures. The average effective tariff can be considered a holistic measure of tariff liberalization – both through MFN and other preferential trade arrangements – and can be estimated by dividing total import tariff revenue by total import value. For instance, preferential access accorded to developing economies, particularly the least-developed, under the GSP reduces the average tariff imposed on a particular good at the border thereby improving market access conditions for such economies. The average effective tariff for the APEC5 was 1.4% and 1.1% for the APEC8 in 2009 (Chart 3.2).30
Chart 3.1 MFN applied tariffs – 1996 and 2008
<Simple Average>
7.0
8.98.2
10.8
3.9
6.45.4
6.6
0
2
4
6
8
10
12
APEC5 APEC8 2010 economies APEC
Simple avg. 1996 Simple avg. 2008
World simple average appliedtariff in 2008: 10.4%
(%)
UNCTAD, TRade Analysis and INformation System (TRAINS) online database; WTO simple average data from World Tariff Profiles 2009. 29 PSU Report, p26 30 Average effective tariff is calculated by averaging the relevant APEC economies’ average tariffs, based on their import tariff revenue (average tariff = Value of total import tariff revenue / Value of total import * 100) submitted by the each 2010 economy. Data are unavailable for two economies for 1996 and for one economy for 2009.

30
<Weighted Average>
4.8
6.05.2
6.4
2.7
4.5
3.33.8
0
2
4
6
8
10
12
APEC5 APEC8 2010 economies APEC
Weighted avg. 1996 Weighted avg. 2008
(%)
Note: For 2008 data, all tariffs are as reported in 2008, except for Indonesia; Malaysia; Papua New Guinea; Thailand;
and Viet Nam, which are as reported in 2007. For 1996 data, all tariffs are as reported in 1996, except for Thailand
(1995); Papua New Guinea (1997); Indonesia (1998); Mexico (1998); Peru (1998); Malaysia (1999); and Viet Nam
(1999). The MNF applied tariff values are shown at the top of each column.
Source: PSU calculations (reproduced in Japan) based on data from WTO, Tariff Download Facility online database;
UNCTAD, TRade Analysis and INformation System (TRAINS) online database; WTO simple average data from
World Tariff Profiles 2009.
Chart 3.2 Average effective tariffs – 1996 and 2009
2.8
5.54.3
1.4 1.1 1.2
0
2
4
6
8
10
12
APEC5 APEC8 2010 economies
1996 2009
(%)
Note: Data unavailable for Chile in 1996, and Malaysia in 1996 and 2009. For Japan and Korea, data in Fiscal Year
2008 and 2008 respectively used for calculation of the figure in 2009.
Source: Calculated based on factsheets submitted by the 2010 economies.

31
While APEC’s overall progress on tariff reduction is impressive as revealed by declines in average applied tariffs, simple or trade-weighted, and average effective tariffs, average tariffs do not reveal detail on sectoral variation in tariffs across all traded products (tariff lines). Some sectors retain higher levels of tariffs than others reflecting domestic sensitivities.
Chart 3.3 Simple average MFN applied tariffs by sector – the 2010 economies
13.0
8.6
5.8
6.2
1.6
3.7
1.9
1.8
2.0
1.4
2.1
1.8
1.0
12.3
15.0
7.3
6.9
8.4
6.1
4.8
4.6
4.4
4.5
3.5
3.3
2.7
12.6
12.5
6.7
6.6
5.8
5.2
3.7
3.5
3.5
3.3
3.0
2.7
2.0
0.0 2.0 4.0 6.0 8.0 10.0 12.0 14.0 16.0
Clothing
Agricultural products
Textiles
Leather, footwear, etc.
Fish & fish products
Transport equipment
Manufactures, n.e.s.
Minerals & metals
Electrical machinery
Wood, paper etc.
Chemicals
Non-electrical machinery
Petroleum
APEC5 APEC8 2010 economies
Simple average applied tariff across the APEC economies : 6.6%
Source: WTO Tariff Profile 2009.
Chart 3.3 reveals the variations in simple average applied tariffs across all sectors for the 2010 economies. Average MFN applied tariffs are higher for clothing, agricultural products and textiles than the overall average MFN applied tariff across the APEC economies. In contrast, average applied tariffs are comparatively small

32
for petroleum, non-electrical machinery and chemicals. In this light, and considering that the APEC 2010 economies maintain simple average applied tariff of 5.4%, it is a fair assessment that the APEC 2010 economies have some way to go to achieve free and open trade in goods in the region. In terms of the tariff frequency distribution within APEC, the share of tariff lines with MFN applied tariff rates above 10% in 2008 in the APEC5 was 7% of all tariff lines (at the HS 6 digit level), down from over 10% in 199631. The PSU Report found that more than 80% of tariff lines in the APEC5 had duties of 5% or less (Chart 3.4)32.
Chart 3.4 Tariff Frequency Distribution by Duty Ranges – HS 6-digit Level – APEC5
Source: PSU report (Original source: WTO, Tariff Download Facility online database; UNCTAD TRAINS online
database.)
The same general pattern is also evident for the APEC8 (Chart 3.5), where there has also been a shift toward lower tariffs across the board from 1996 to 2008. For these economies, however, the frequency distribution is distinctly bimodal, with the peak at 10-20% tariffs for 1996 shifting to 5-10% for 2008, and the second, duty-free peak becoming more pronounced in 2008. The bimodal nature of the distribution reflects inclusion of the zero-tariff economies Singapore and Hong Kong, China in the APEC8 and the efforts of the other economies of APEC8 to continue reducing their
31 Based on the data provided by the PSU. 32 PSU Report, p.32

33
tariffs across the time. In 2008, more than 50% of tariff lines had applied tariffs of 5% or less.
Chart 3.5 Tariff Frequency Distribution by Duty Ranges – HS 6-digit Level – APEC8
Source: PSU Report (Original source: WTO, Tariff Download Facility online database; UNCTAD TRAINS online
database.)
For the 2010 economies, the shift in average tariff profiles toward lower tariffs has had a tangible effect on trade. The percentage of imports entering the 2010 economies on a duty-free basis grew markedly from 35 to 50% between 1996 and 2008. Over the same period the percentage of dutiable imports fell regardless of the size of the tariff (Chart 3.6).
Chart 3.6 Percentage of imports by applied tariff – 2010 economies

34
Source: PSU calculation based on WTO, Tariff Download Facility online database; UNCTAD TRAINS online
database.
In order to provide an additional perspective, the Fraser Institute’s Economic Freedom of the World Index, 2009 (Gwartney, James et al) also includes a rating indicator of the mean tariff rate around the world that is based on tariff data from the World Trade Organization’s World Tariff Profiles. The Fraser Institute’s index reinforces the conclusion that the mean tariff rate in the APEC region has fallen between 1995 and 2007 including for the 2010 economies.33 (Chart 3.7)
Chart 3.7 Fraser Institute’s Economic Freedom of the World Index - mean tariff rate
8.448.15 8.26
7.31
9.18
8.618.83
8.58
5
6
7
8
9
10
APEC5 APEC8 2010 economies APEC
19952007
lessfreedom
morefreedom World average in 2007: 8.14
Note: Ratings are on a 0-to-10 scale, with 10 being allocated to economies that do not impose tariffs. As the simple
mean tariff rate approaches 50%, the rating assigned to the economy declines toward zero. Simple average aggregate
index ratings are shown at the top of each column.
Source: Compiled based on data provided by the PSU (Original source: Gwartney, James, et al (2009))
Transparency in tariff regimes in APEC has been enhanced through a number of initiatives. In 2003, APEC adopted the APEC Transparency Standards, which inter alia, provided guidance on making tariff information widely available for interested parties, with the majority of APEC economies making their tariff schedules available on the Internet. Additionally, APEC continues to work on improving the transparency of customs-related information through initiatives like
33 Source: Gwartney, James, et al (2009). (reproduced in PSU)

35
the APEC Transparency Initiative on Tariffs and Rules of Origin (ROOs)34. (2) Non-Tariff Measures Under the OAA, economies committed to progressively reduce Non-Tariff Measures (NTMs) to the maximum extent possible to minimize possible distortion to trade; eliminate any measures inconsistent with WTO agreements; comply fully with WTO agreements in accordance with WTO commitments; and ensure the transparency of APEC economies’ respective non-tariff measures.
Box 3.1: Defining Non-Tariff Measures35 There are different definitions of Non Tariff Measures (NTM36). Pasadilla and Liao (2006) of the Organization of Economic Cooperation and Development (OECD) defined NTM as “any measure other than a tariff that distorts trade”.37 Pasadilla and Liao also found that Baldwin (1970) defined NTM as “any measure (public or private) that causes internationally traded goods and services, or resources devoted to the production of these goods and services, to be allocated in such a way as to reduce potential real world income”. Additionally, UNCTAD Secretary-General’s Group of Eminent Persons on Non-tariff barriers (NTBs) and the Multi-Agency Task Force is working on identifying, classifying, and quantifying NTBs, including border and behind border measures, with a special focus on issues and problems faced by developing countries, in particular LDCs, so that they can be effectively addressed in trade negotiations.38 Besides the variety of definitions, the typology of NTMs also varied. According to Pasadilla and Liao, UNCTAD classified NTMs as the following39:
non-tariff charges, quantitative restrictions, government participation in trade and similar restrictive policies,
34 http://www.apec.org/webtr.html 35 Part of the information in this box was taken from PSU Report, p33 36 In general, scholars used NTMs and NTBs interchangeably. World Bank (2008a) noted that if the measure is imposed explicitly to protect domestic industry by restricting import demand, it is also known as non-tariff barrier or NTB. Other definitions imply that NTBs are measures which are inconsistent with WTO rules. 37 Deardorff and Stern (1997) noted that the difficulty in identifying NTMs or NTBs is because they are defined by what they are not. 38 UNCTAD, http://www.unctad.org/en/docs/c1l34_en.pdf 39 UNCTAD excluded measures applied to exports and production (CIE 2006).
36
customs procedures and administrative policies, and technical standards: SPS (Sanitary and phytosanitary standards), technical barriers to trade (TBT).
Due to the difficulties in gathering information on the variety of measures, it is difficult to conduct a quantitative analysis of NTMs within APEC. Previous efforts to address this lack of information, such as UNCTAD’s TRAINS, only reported NTM data until 2001 for some 2010 economies40. Despite this, some previous studies have reported interesting findings based on the frequency of occurrence of such measures. Pasadilla and Liao (2006) found that of the categories of NTMs, Technical Barriers to Trade (with 530 NTM entries) constituted almost half of all barriers; Customs and Administrative Procedures (with 380 entries) were second; and Sanitary and Phytosanitary Measures (with 137 entries), third.41 Some NTMs, such as standards-related measures, including technical regulations and conformity assessment procedures, have a legitimate basis which can improve consumers’ well-being.42 These standards-related measures can benefit consumers by ensuring product quality and protection from damaged or dangerous goods, but when outdated, overly burdensome, discriminatory or otherwise inappropriate, they may also become unnecessary barriers to trade. A good illustration, which also demonstrates why NTMs are a more complicated and less straight forward issue compared with tariffs, is when technical requirements are unnecessarily more stringent than those that are internationally accepted. Resulting compliance burdens, especially for SMEs can be costly and act as a significant barrier to trade.43 Also worth noting is that there are many legitimate reasons why requirements may need to be more stringent than those that are internationally accepted; one example is ensuring that standards reflect geographic, climatic, or other differences.
40 PSU Report, p.36 41 Pasadilla O. and C. Liao (2006), Non-Tariff Measures Faced by Philippine Agricultural Exports, East Asian Journal of Agriculture and Development, vol. 3, No. 1& 2. (Reproduced in PSU Report, p.37) 42 PSU Report, p.38 43 Ibid

37
The WTO Secretariat’s Note identified that some APEC member economies have implemented trade-opening and facilitation measures despite the global financial crisis. Australia, Canada, Malaysia and Mexico have reduced import duties, fees and surcharges as well as removed NTMs in several products. In addition, based on the information reported in the fact sheets submitted by the 2010 economies, for the most part, they do not make use of NTMs, except for legitimate health, security, safety and environment reasons. In addition, perceptions regarding the application of NTMs and their effects have improved across APEC. The Fraser Institute’s Economic Freedom of the World Index shows that the business sector’s perception of the incidence of non-tariff barriers on trade in the APEC region has improved between 1995 and 2007 for the 2010 economies 44 (see Chart 3.8). Actions by the 2010 economies to reduce or eliminate NTMs have contributed to the trade openness of the 2010 economies, which is underscored by the 176% growth in imports from 1994 to 2007.
Chart 3.8 Fraser Institute’s Economic Freedom of the World Index - non-tariff trade barriers
6.737.12 6.97
6.32
7.16 7.30 7.246.73
5
6
7
8
9
10
APEC5 APEC8 2010 economies APEC
1995
2007
lessfreedom
morefreedom
World average in 2007: 6.18
Note: Ratings are on a 0-to-10 scale, with 10 being the highest possible rating, indicating the perception that there is a
low incidence of non-tariff trade barriers. Simple average aggregate index ratings are shown at the top of each column.
Source: Compiled based on PSU Report (Original source: StatsAPEC – Key Indicators Database; Gwartney, James, et
al. Economic Freedom of the World, The Fraser Institute (2009).)
44 PSU Report, p.36

38
In 2008, University of Southern California Marshall School of Business conducted a research on non-tariff measures commissioned by ABAC45 and it found that while some NTMs are “born” as intentional restrictive and protectionist NTBs46, most are not; the absence of commonly agreed upon standards for the development of NTMs has resulted in a world where “plus and different”47 is the norm; and developed economies are accused of lacking a sense of urgency to change, to adopt new protocols, and/or share and collaborate with other economies on developing region-wide standards. And it also found that important emerging issues, unless tackled early and in a collaborative way, will only serve to compound the existing NTB problem with new and increasingly complex NTBs and called for following four elements for seeking solution of NTBs: accessibility, transparency48, standards and regulations, and consistent implementation. As reported in documents including IAP and IAP Peer Review, progress of the 2010 economies is evident in reducing NTM/NTBs. Australia implemented key reforms to its import risk analysis (IRA) process in September 2007. Key features of the new process include a more transparent and timely process; regulation of the key elements of the process; greater opportunity for scientific issues to be independently reviewed; and improved consultation with stakeholders.49 Canada reports that it does not maintain any measures that are inconsistent with WTO rules. Canada’s decision to unilaterally eliminate its MFN applied tariffs on 1,750 tariff items in its Budgets 2009 and 2010 has also contributed to the substantial reduction of customs compliances costs for traders, by eliminating the
45 “Non-Tariff Barriers to Trade in the APEC Region: When Non-Tariff Measures Become Non-Tariff Barriers – Insight from Agriculture and Accounting”(Nov. 2008), submitted by University of Southern California Marshal School of Business 46 Under the document,” An NTM is a regulatory tool used to ensure health, safety, nutrition, environmental protection, security, quality assurance, animal welfare, and/or religious compliance. These are reliable and necessary, and they serve an important purpose in preserving the safety and integrity of individual economies. An NTB, however, is a non-tariff measure that causes an unfair impediment to trade.” 47 The report said that the "plus and different" are caused by the consequence of every economy selectively adopting, or modifying global guidelines, and/or developing their own standards 48 In terms of transparency, an OECD document by Czaga (2004) on prohibitions and quotas also found that it is apparent that the level of transparency of quantitative restriction measures is low compared to many other aspects of the trade regime. Czaga, P. (2004), “Analysis of Non-Tariff Measures: The Case of Prohibitions and Quotas”, OECD Trade Policy Working Papers, No.6, OECD Publishing. doi: 10.1787/650468803072 49 Australia APEC 2008 IAP (reproduced in PSU Report, p34)

39
need for importers to comply with rules of origin regulations for these products. In addition, the rules of origin that Canada applies to least developed countries (LDC) imports under its Least-Developed Country Tariff (LDCT) program are among the most liberal in the world. For example, under the LDCT apparel products produced in an LDC can use textile inputs from any developing country and still be accorded duty-free access to Canada. These rules of origin make it easier for products of least-developed and developing countries to access the Canadian market. There has also been a sharp reduction in Canada's use of contingency measures; Canada had 48 anti-dumping (AD) measures in force at the end of June 2006, compared with 91 measures in 2003.50 Japan reports that it does not maintain any measures that are inconsistent with WTO rules. Japan’s efforts include upgrading a Single Window for import/export procedures and port related procedures in February 2010. The new system enables traders to submit declaration and gain permission by single transaction through common Portal system operated by Nippon Automated Cargo And Port Consolidated System Inc. (NACCS Center), which covers customs procedures, port/airport procedures, immigration procedures, food sanitation and the plant and animal quarantine procedures, and trade control procedures. New Zealand has eliminated all global import licensing protection (since 1992), and does not maintain export subsidies51. New Zealand reports that it does not maintain any measures that are inconsistent with WTO rules. The United States reports that it does not maintain any measures that are inconsistent with WTO rules. Further, the United States maintains a robust system to support implementation of trade obligations on standards-related measures through strong central management of its regulatory regime, an effective interagency trade policy mechanism and a transparent system of public consultation. Additionally, the U.S. Trade Representative has a standing request with the independent International Trade Commission to report publicly every two years on the economic effects of remaining significant U.S. import restrictions. 50 WTO Secretariat (2007), Trade Policy Review – Report by the Secretariat – Canada, WT/TPR/S/179/Rev.1, 4 June 2007, p.25 51 New Zealand APEC 2006 IAP (reproduced in PSU Report, p34)

40
Among the APEC8, Chile reports that it does not maintain any measures that are inconsistent with WTO rules. Further, Chile removed three export subsidy programs in 2003 and no longer applies market access, quantitative restrictions of national treatment limitations with the exception to some used motor vehicles.52 Hong Kong, China revamped and simplified its textiles export control system after the abolition of textile quotas as a result of the implementation of the WTO Agreement of Textiles and Clothing. It also removed the licensing requirements for left hand drive vehicles and outboard engines and for exports of TV sets and VCRs/players. Non-tariff border measures are also almost absent.53 Korea abolished import levies on salt and removed all quantitative restrictions on textiles and clothing in accordance of the Agreement on Textiles and Clothing54. Moreover, Korea reported the elimination of all export subsidies, as well as quantitative export restrictions or voluntary export restraints that were not WTO-consistent55. Malaysia does not impose import levies nor maintain any export subsidies. It has removed import licensing requirements on 48 tariff lines for machinery and equipment, electrical and electronic products in the year 2008. In 2009, import licenses on port cranes such as gantry cranes, hydraulic loading cranes and crawler cranes and heavy machinery such as bulldozers and road rollers were abolished as well56. Mexico has also removed import licensing requirements for a number of products. For example, in 2008, Mexico excluded from this requirement certain health care products, vehicles under franchise for certain purposes and goods temporarily exported for processing, transforming or repairing under the terms of Article 117 of the Customs Law (including mineral fuels, mineral oils, and vehicles, among others)57. 52 Chile APEC IAP Peer Review (2008) (reproduced in PSU Report, p34) 53 Hong Kong, China APEC IAP Study Report (2007) (reproduced in PSU Report, p34-35) 54 Korea APEC IAP Peer Review (2007) (reproduced in PSU Report, p35) 55 Korea APEC 2006 IAP. (reproduced in PSU Report, p35) 56 Malaysia APEC IAP Peer Review (2009) (reproduced in PSU Report, p35) 57 Mexico APEC 2009 IAP (reproduced in PSU Report, p35)
41
Peru does not maintain import/export levies, import/export licensing, voluntary export restraints or export subsidies and only keep restrictions to protect cultural heritage, biodiversity or for safety and sanitary and phytosanitary reasons.58 Singapore reported that it has regularly reviewed NTMs in light of technical, medical and other advances, with a view to streamline unnecessary measures, licensing requirements and certification procedures.59 In 2005, Singapore abolished its long standing prohibition of gambling and has allowed casinos to operate. In 2007 the postal sector was liberalized, ending a 15-year monopoly in the basic mail services market by SingPost.60 Chinese Taipei removed many NTMs after its accession to WTO in 2002, which consisted mostly of import bans on a number of products, as well as quantitative import restrictions61. All quantitative import restrictions have been abolished and the number of import prohibitions went down from 252 to 63 between January 2002 and September 200962. (3) Services Under the OAA, APEC member economies committed to reduce progressively restrictions on market access for trade in services; provide for inter-alia most favored nation (MFN) treatment and national treatment for trade in services; and provide, in regulated sectors, for the fair and transparent development, adoption and application of regulations and regulatory procedures for trade in services.
In light of the objective above, the 2010 economies have progressively broadened market access and/or national treatment for trade in services. 58 Peru APEC IAP Peer Review (2008) (reproduced in PSU Report, p35) 59 Singapore APEC 2009 IAP(reproduced in PSU Report, p35) 60 WTO Secretariat (2009), Trade Policy Review, – Report by the Secretariat- Singapore, WT/TPR/S/202/Rev.1, 26 September 2009, p.x.(reproduced in PSU Report, p35) 61 Chinese Taipei APEC IAP Peer Review (2007) (reproduced in PSU Report, p35) 62 Chinese Taipei APEC 2009 IAP (reproduced in PSU Report, p35)

42
Box 3.2: GATS 1994 Commitments According to the World Bank’s World Trade Indicators 2009 database, the average of the GATS Commitments Indexes on market access and on national treatment of the 2010 economies are 36.37 and 40.44 respectively, surpassing the world averages of 24.08 and 26.76, respectively.
Table: The average of the GATS Commitments Indexes
on market access and national treatment GATS Commitments Index
- Market Access -
GATS Commitments Index
- National Treatment -
Ave. of APEC5 55.44 55.07
Ave. of APEC8 22.74 30.00
Ave. of the 2010 economies 36.37 40.44
Ave. of the world* 24.08 26.76 * “World” here consists of 211 economies of the WTO members, observers and other selected economies. Note: Data unavailable for one economy. Source: World Bank (http://info.worldbank.org/etools/wti/3a.asp)
Evaluating the progress made by APEC member economies since the conclusion of the Uruguay Round is not an easy task. The Doha Round has not yet concluded and most of the APEC member economies have not yet made public their current offers on the commitment on trade in service, which makes it difficult to compare the commitments in force with economies’ current degree of willingness to deepen their existing commitments. However, an examination of the declassified Revised Offers presented in the current WTO Doha Round Negotiations by APEC members63, the commitments assumed by economies in recent FTAs, and the unilateral domestic reforms in services undertaken by member economies provides a perspective on how much the APEC economies are willing to further liberalize trade in services.
(i) WTO Commitments64 The Schedule of Commitment (1994) sets the starting point of service trade liberalization for each economy even though the commitments under GATS do not always reflect actual liberalization or openness of its service sectors. A great level of 63 The Revised Offers were made public in 2005. 64 The descriptions and information in this section are mainly based on PSU Report, p 39-44.

43
variation can be seen in the initial services commitments within APEC.
Chart3.9 GATS commitments Index (1994 Schedule of Commitments)
37.3
20.3
26.823.0
0
10
20
30
40
APEC5 APEC8 2010 economies APEC
%
Source: Complied based on PSU Report (Original source: PSU calculation based on the WTO Schedule of
Commitments from APEC member economies.)
Technical note: The calculations were conducted using the methodology reported by Hoeckman (1995), “Tentative
First Steps: An Assessment of the Uruguay Round Agreement on Services”, World Bank Policy Research Working
Paper WPS 1455. Each entry of the economy’s commitments in WTO is assigned a score to reflect the intrinsic
restrictiveness. Full commitment (no restriction, declared as “None”) is scored to be 1; zero commitment (any
restriction can be applied, declared as “Unbound”) is scored to be 0; an in-between situation is scored to be 0.5. The
overall score for each economy is the proportion of the sum of the scores against the full score of 1240. Data for
Russia are not available. For Chinese Taipei, the Schedule of Commitments was made in 2002, and for Viet Nam, the
Schedule of Commitments was made in 2007.
The 1994 data indicates that the APEC5 offered more commitments on services liberalization compared with APEC as a whole.
Table 3.1 GATS Commitments Index by sectors (1994 Schedule of Commitments) %
APEC5 APEC82010
economies APEC
1. Business Services 46.0 24.4 32.7 26.32. Communication Services 35.5 23.5 28.1 24.13.Construction And Related Engineering Services 59.5 30.6 41.7 34.64. Distribution Services 46.5 13.6 26.3 19.45. Education Services 22.3 7.3 13.1 11.46. Environmental Services 47.8 13.9 26.9 22.27. Financial Services 51.1 29.0 37.5 36.38. Health Related And Social Services 9.4 8.2 8.7 7.39. Tourism And Travel Related Services 58.8 33.4 43.1 37.310. Recreational, Cultural And Sporting Services 28.8 7.0 15.4 11.311.Transportation Services 19.8 6.0 11.3 11.1

44
Source: Complied based on PSU Report (Original source: PSU calculation based on the WTO Schedule of
Commitments from APEC member economies.)
Technical note: The calculations were conducted using the methodology reported by Hoeckman (1995), “Tentative
First Steps: An Assessment of the Uruguay Round Agreement on Services”, World Bank Policy Research Working
Paper WPS 1455. Each entry of the economy’s commitments in WTO is assigned a score to reflect the intrinsic
restrictiveness. Full commitment (no restriction, declared as “None”) is scored to be 1; zero commitment (any
restriction can be applied, declared as “Unbound”) is scored to be 0; an in-between situation is scored to be 0.5. The
overall score for each economy is the proportion of the sum of the scores against the full score of 1240. Data for
Russia are not available. For Chinese Taipei, the Schedule of Commitments was made in 2002, and for Viet Nam, the
Schedule of Commitments was made in 2007.
The sectoral analysis indicates that the health related and social services category was the least committed sector within APEC, with only 6 out of 20 APEC member economies in WTO making partial commitments in this sector. Tourism and travel related services (37%), financial services (36%) and construction and related engineering services (35%) are the most committed sectors across APEC members. The average level of commitments were the lowest on health and social services (7%), recreational, cultural and sporting services (11%), and transportation services (11%). Comparing the 1994 Schedule of Commitment as a baseline, the 2005 Revised Offers reflect the willingness of member economies to bind themselves to greater openness in the current Doha Round Negotiations. The difference between the index on Schedule of Commitment and index on the Revised Offers can be taken as a proxy for the progress made by member economies to liberalize their trade in services. However, it is important to clarify that the Revised Offers do not represent the final position of the WTO members in the Doha Round, nor do they represent the actual practice of members with respect to services measures. The Revised Offers provide a reference on the level of concessions commitments WTO members are willing to make given the state of the multilateral negotiations at the time of their release.

45
Chart 3.10 GATS Commitments Index comparison
9.4%
11.6%
0
10
20
30
40
50
APEC5 APEC-with disclosed revised offers
1994 Schedule of Com m itm ents 2005 Revised Offers
%
Note: The differences between the 1994 Schedule of Commitments and the 2005 Revised Offer liberalization levels are
shown at the top of the 2005 Revised Offers columns. This index only includes eight of the 2010 economies that
disclosed their corresponding 2005 Revised Offers (Australia, Canada, Chile, Japan, Korea, New Zealand, Peru and the
United States).
Source: Compiled based on PSU Report (PSU calculation based on the WTO 1994 Schedule of Commitments and
2005 Revised Offers from APEC member economies).
In general, an average of almost 10% of further liberalization has been offered by those economies, and among them, Peru, Japan and Korea offered the greatest improvement in services commitments with 23, 14 and 13% improvement, respectively. Making of offers shows the willingness to make progress on broadened sector/mode coverage and degree of liberalization. Among the APEC5, the United States has the highest level of GATS commitments and the deepest revised offer. According to the United States’ 2007 Individual Action Plan Study Report, its most recent Doha Development Agenda Services Offer improves its GATS commitments in telecommunications, business services, higher education, transportation and energy services.65 At the sectoral level, the most apparent progress is shown in communication services, business services and environmental services for those economies that have publicly disclosed their 2005 Revised Offers (Chart 3.11).
65 United States APEC IAP Peer Review (2008).

46
Chart 3.11 GATS Commitments Index: comparison by sector (1994 Schedule of Commitments and 2005 Revised Offers)
Note: The difference between the 1994 Schedule of Commitments and the 2005 Revised Offer liberalization level is
shown at the top of the 2005 Revised Offers column. This index only includes the APEC ind & vol economies that
disclosed their corresponding 2005 Revised Offers (Australia, Canada, Chile, Japan, Korea, New Zealand, Peru; United
States).
Source: Compiled based on PSU calculation based on the WTO 1994 Schedule of Commitments and 2005 Revised
Offers from APEC member economies.
By modes of service supply, compared to their existing 1994 Schedule of Commitments, Australia and Peru have expressed the greatest willingness to move forward (16%) in the current negotiations for mode 1; Japan; Korea and Peru are the most willing to go further for mode 2 (18%); and Japan is the economy of the APEC5 most willing to go further for mode 3 (19%); whilst Peru stands out among the APEC8 (31%). For mode 4, all APEC5 express a more conservative approach compared to the other modes of supply but have nevertheless offered enhanced commitments relative to existing schedules.

47
Chart 3.12 GATS Commitments Index: comparison by mode of supply
(1994 Schedule of Commitments and 2005 Revised Offers)
Note: The difference between the 1994 Schedule of Commitments and the 2005 Revised Offer liberalization level is
shown at the top of the 2005 Revised Offers column. This index only includes the APEC ind & vol economies that
disclosed their corresponding 2005 Revised Offers (Australia, Canada, Chile, Japan, Korea, New Zealand, Peru; United
States).
Source: Compiled PSU Report (PSU calculation based on the WTO 1994 Schedule of Commitments and 2005
Revised Offers from APEC member economies.)
It is important to note, however, that the extent of the GATS commitments does not necessarily reflect the actual levels of liberalization on trade in services. In general, the depth of liberalization on trade in services in many economies tends to be deeper than the GATS commitments.
(ii) RTAs/FTAs66 The WTO services commitments approach understates the degree of services liberalization since APEC member economies increasingly use RTAs/FTAs to improve their degree of openness in trade in services at the regional or bilateral levels. The agreed commitments in the RTAs/FTAs tend to be deeper than those in GATS/WTO. A number of studies that explore these two facts have been released
66 Unless otherwise specifically indicated, the descriptions and information in this part are based on the PSU Report p 44-50.

48
in recent years. Some of the findings from those studies are summarized below. The World Bank (2008) noted that among the reporting economies, Korea, Japan and Singapore have made extensive use of RTAs/FTAs to subscribe to greater openness in services. Singapore stands out with 86% of sub-sectors and modes showing improved or new commitments across its 12 FTAs, while for Korea and Japan this share stands at 76% and 71%, respectively.67
In addition, a WTO paper by Roy, Marchetti and Lim (2006) identified the types of new/improved RTAs/FTAs commitments across key APEC economies:
· Australia: Binding commitments going beyond GATS in its RTAs/FTAs cover the following sectors (for example): improved commitments on legal services, on retailing (no limitation with regard to the dispensing of pharmaceuticals), on tourism (through the removal of a commercial presence requirement for travel agencies/tour operators services), and on financial services (in particular through permitting branching for life insurance); new commitments on courier services and audiovisual services; and improved and new commitments in relation to rail transport services. Several of these improvements over GATS were contracted in Australia's FTA with the United States, but not others.
· Chile: In general, Chile's commitments in its RTAs/FTAs go beyond its GATS
commitments in sectors including professional services, courier services, telecommunications, construction services, financial services, maritime services, and services auxiliary to all modes of transport. Chile's FTA commitments go even further than its offer submitted to the WTO in some professional and business services (particularly with regard to mode 1). The commitments undertaken by Chile in its FTA with the United States go further than the others in key sectors such as telecommunications, by allowing access to its local market; and financial services, by allowing more services to be supplied on a cross-border basis, and by allowing US insurance companies to establish as branches.
67 World Bank (2008), East Asia Preferential Trade Agreements in Services: Liberalization Content and WTO Rules, World Trade Review, 7:4, p.641-673. (reproduced in PSU Report)

49
· Japan: Improvements on the FTA commitments advance beyond GATS in
transport services, business services, as well as in the expansion of product coverage in distribution services. Japan’s FTAs with Mexico and Malaysia tend to have more services commitments than those signed with Singapore. This should be interpreted as a sign of Japan’s increasing willingness to open its services market, since Japan’s agreement with Singapore was signed in 2002, while those with Mexico and Malaysia were signed in 2004 and 2005, respectively.
· Peru: In the FTA with the United States, Peru binds full openness under
mode 1, which was unbound in GATS, and undertakes new commitments on commission agents’ services, with the exception of handicrafts. Also, Peru undertook deeper commitments in education, including all education sub-sectors, in comparison to GATS68.
· United States: FTA commitments go beyond the U.S. GATS schedule/offer in
a number of sectors. In financial services, new commitments are undertaken under mode 1 for insurance intermediation and with respect to certain portfolio management services. Other GATS-plus commitments include new commitments on repair and maintenance of vessels, on certain port-related activities, as well certain improvements in relation to air, road, rail, and auxiliary transport services. U.S. FTAs also provide, among other things, for new commitments on R&D services.
The Inter-American Development Bank (IADB) also released a study by Estevadeordeal, Shearer and Suominen (2008)69 which analyzed the liberalization of trade in services in the Americas through various RTAs/FTAs. It noted that more than 60% of the RTAs/FTAs covering the Americas included a large number of specific services provisions on modes 1 and 2. The Service Chapters in NAFTA (Canada, Mexico and United States) and United States’ FTAs with Australia, Chile,
68 These commitments in education services are subject to a reservation that allows keeping existing restrictions or undertake new restrictions in relation to public education. 69 Estevadeordal, A, M. Shearer and K. Suominen (2008), Multilateralizing RTAs in the Americas: State of Play and the Way Forward, Inter-American Development Bank, p.36-40.

50
Peru and Singapore have comprehensive coverage70. For the Investment Chapters, those FTAs involving the United States cover a wider array of disciplines compared to other RTAs/FTAs. A comparative analysis on several RTAs/FTAs by Heldon and Woolcock (2009)71 shows that Japan’s agreements are GATS-plus in a large number of sub-sectors and modes, but that the depth of additional liberalization in its RTAs/FTAs is more modest, in part because of Japan’s already extensive GATS commitments. In addition, this study mentions some examples where Japan’s RTAs/FTAs commitments are GATS-plus. For example, its agreement with Singapore contains provisions that go beyond the GATS Annex on Telecommunications. Similarly, Japan’s agreement with Thailand includes provisions in sectors where no specific commitments were undertaken under the GATS. On Singapore’s agreements, Heydon and Woolcock (2009)72 consider that they follow GATS-plus commitments in services, as well as comprehensive provisions in investment. To illustrate, the study mentions that the FTAs with Korea and Australia are GATS-plus in many aspects. For example, both agreements advance beyond GATS in telecommunications and financial services. In addition, the agreement with Korea includes further commitments in maritime transport and the development of professional standards73. Progress on the liberalization of services through RTAs/FTAs in APEC economies has also been reported by several Trade Policy Reviews undertaken by the WTO Secretariat. The findings are summarized as follows:
· Australia74: Free trade in services in the Australia–New Zealand Closer Economic Relations Trade Agreement (ANZCERTA). Within ANZCERTA, Australia only has reservations in air services, coastal shipping, broadcasting
70 The United States International Trade Commission produced a series of reports to analyze the sectoral effects of the FTAs signed by the United States with Australia, Chile, Peru and Singapore. Those reports identified potential benefits from these agreements, one of them being the deeper coverage of several commitments beyond those in GATS. (See http://www.usitc.gov/research_and_analysis/commission_publications_yearly.htm) 71 Heydon, K. and S. Woolcock (2009), The Rise of Bilateralism: Comparing American, European and Asian Approaches to Preferential Trade Agreements, United Nations University Press, p. 100-104. 72 Ibid 73 Ibid. 74 WTO Secretariat (2007), Trade Policy Review - Report by the Secretariat - Australia – Revision, WT/TPR/S/178/Rev.1, 1 May 2007, p. 91-92.

51
and television, third-party insurance and certain postal services. Also, Australia has undertaken commitments beyond GATS in its revised offer in the agreement with the United States, particularly in sectors such as financial, legal, travel agencies and tour operator services. The Australia-Thailand FTA shows some GATS-plus commitments undertaken by Australia as well, especially with regards to e-commerce and temporary entry of business persons.
· Chile75: Most of Chile’s RTAs/FTAs contain provisions on trade in services and cover important areas, such as telecommunications, professional services and temporary entry of business persons.
· Hong Kong, China76 : The Mainland and Hong Kong Closer Economic
Partnership Arrangement (CEPA) includes liberalization measures in 27 service sectors77 (the number of services sectors has increased to 4278 in 2009 and will expand to 4479 in 2011). This agreement is reciprocal and Hong Kong, China has committed not to impose any new discriminatory measure on China’s services and services suppliers in the areas that China is offering liberalization measures to Hong Kong, China. This goes beyond Hong Kong, China’s GATS commitments, both in terms of sectoral coverage and the extent of liberalization.
· Korea80: All of Korea’s RTAs/FTAs include commitments in services that go
beyond GATS. This includes the RTAs/FTAs already in force with ASEAN, 75 WTO Secretariat (2009), Trade Policy Review - Report by the Secretariat - Chile – Revision, WT/TPR/S/220/Rev.1, 5 November 2009, p. 108. 76 WTO Secretariat (2007), Trade Policy Review - Report by the Secretariat – Hong Kong, China – Revision, WT/TPR/S/173/Rev.1, 13 March 2007, p. 80. 77 The following services sectors are included in CEPA: accounting, advertising, air transport, audiovisual, banking, convention and exhibition, cultural, distribution, freight forwarding agency, individually owned stores, information technology, insurance, job intermediary, job referral agency, legal, logistics, management consulting, medical and dental, patent agency, professional qualification examinations, real estate and construction, securities and futures, storage and warehousing, telecommunications, tourism, trademark agency, and transport (including road freight/passenger transportation and maritime transport). 78 The additional 15 service sectors are: building-cleaning, computer and related services, environmental, market research, photographic, printing, public utility, rail transport, related scientific and technical consulting services, research and development, services incidental to mining, services related to management consulting, social services, sporting, and translation and interpretation. 79 The two new service sectors are specialty design, as well as technical testing, analysis and product testing. 80 WTO Secretariat (2008), Trade Policy Review - Report by the Secretariat – Republic of Korea – Revision,

52
Chile and Singapore. In the case of the agreement with ASEAN, the number of sectors and sub-sectors open to foreign suppliers increased, and limitations on both market access and national treatment in certain sectors and sub-sectors decreased. The agreement with Singapore has few exceptions in terms of coverage and prohibition to require local presence.
· Malaysia81: The FTA with Japan includes commitments on trade in services
beyond its GATS commitments. In this FTA, the four modes of supply are included and cover sectors such as communication services, financial services, tourism and travel-related services, computer-related services, construction and related engineering services, educational services, hospital services, other business services and professional services.
· Mexico82: Preferential agreements concluded by Mexico are more liberal than
its commitments in GATS. The coverage is comprehensive in substance. There is more flexibility in foreign participation for some activities in financial, health and business professional services.
· New Zealand83: New Zealand seeks that the liberalization of trade in services
and disciplines on domestic regulation are more robust than existing GATS disciplines in the RTA/FTA negotiations. The Trans-Pacific Strategic Economic Partnership Agreement (TransPac) is more comprehensive than GATS commitments. Similarly, the bilateral agreement with Singapore has an increased coverage in business services, communication services, distribution services, financial services, health related and social services, tourism and travel related services, and transport services.
New Zealand’s FTA with China also includes a series of understandings beyond GATS commitments in sectors such as other education services, environmental services, computer services (maintenance and repair of office
WT/TPR/S/204/Rev.1, 4 December 2008, p. 26-28. 81 WTO Secretariat (2010), Trade Policy Review - Report by the Secretariat – Malaysia – Revision, WT/TPR/S/225/Rev.1, 15 February 2010, p. 19. 82 WTO Secretariat (2008), Trade Policy Review - Report by the Secretariat – Mexico – Revision, WT/TPR/S/195/Rev.1, 2 May 2008, p. x. 83 WTO Secretariat (2009), Trade Policy Review - Report by the Secretariat – New Zealand – Revision, WT/TPR/S/216/Rev.1, 10 July 2009, p. 24-30, 84.

53
machinery and equipment, including computers; and other computer services), photographic and duplicating services and construction services (consultancy related to construction services).
· Peru: The FTA with Chile includes provisions on cross-border trade in services and temporary entry of business people; investment; and a future commitment to negotiate the mutual recognition of diplomas. The FTA with United States covers investment, cross-border services, financial services, telecommunications and e-commerce84. The FTA with Singapore covers investment, cross-border trade, temporary entry of business people and e-commerce. The FTA with Canada covers Investment, Temporary entry of business people, e-commerce, competition policy, monopolies and state enterprises, cross-border trade, telecommunications and financial services. The FTA with China covers investment, temporary entry of business people and cross-border trade.
· Singapore: Singapore’s commitments under its bilateral FTAs are deeper than those in GATS, including in financial services, business and professional services, telecommunications, education and transport services. The FTAs with New Zealand, Japan, Australia and the United States are good examples of this further commitment85.
Information from official websites also report benefits for the services sectors in terms of comprehensive coverage in RTAs/FTAs. For example, New Zealand’s Ministry of Foreign Affairs and Trade states that New Zealand only keeps reservations in two sectors (airway services and coastal shipping) in the ANZCERTA. Moreover, it specifies that a person who is registered to practice an occupation in one of the parties is entitled to do the same in the other party (with medical practitioners the only exception)86. In the same way, Australia’s Department of Foreign Affairs and Trade identifies 84 WTO Secretariat (2007), Trade Policy Review - Report by the Secretariat – Peru – Revision, WT/TPR/S/189/Rev.1, 17 December 2007, p. 21-22. 85 WTO Secretariat (2008), Trade Policy Review - Report by the Secretariat – Singapore – Revision, WT/TPR/S/202/Rev.1, 26 September 2008, p. 30, 81-82. 86 See http://www.mfat.govt.nz/Trade-and-Economic-Relations/0--Trade-archive/0--Trade-agreements/Australia/0-cer.php.

54
some benefits for Australian services providers in the FTA with the United States. The agreement allows Australia to enjoy WTO-plus privileges in sectors such as educational, financial and professional services, among others87. Likewise, it also recognizes WTO-plus benefits in the FTA with Chile. In particular, Australian providers enjoy these benefits in engineering and consulting, franchising, education and training, information technology, tourism and infrastructure88. Similarly, Canada’s Department of Foreign Affairs and International Trade details the benefits in trade in services obtained in the Canada-Peru FTA. Through this FTA, Canada has obtained enhanced market access, well beyond Peru’s GATS commitments, in key service sectors of interest, including mining, energy and professional services (engineering, architectural, environmental, distribution, financial and information technology). Canada and Peru have also agreed on comprehensive disciplines in the FTA for the financial services sector, including banking, insurance and securities. The financial services chapter of the FTA will enshrine access to markets for both cross-border financial service providers and financial institutions established in each jurisdiction.89 Moreover, Hong Kong, China has recently signed a Closer Economic Partnership Agreement (CEP Agreement) with New Zealand, under which both Hong Kong, China and New Zealand have made broad commitments covering a wide range of services including maritime transport services, logistics and related services, audiovisual services and various business services, and computer and related services. Many of the commitments go beyond not only their existing commitments in the WTO, but also their offers in the current WTO service negotiations90. In the United States, the Office of the United States Trade Representative highlights the benefits of the U.S.-Peru FTA, which is the latest U.S. FTA to enter into force. In this FTA, Peru agreed to exceed its commitments made in the WTO, and to dismantle significant services and investment barriers, such as measures relating to the hiring of local nationals and measures requiring the purchase of local goods. These commitments and improvements in Peru’s services and investment regimes
87 See http://www.dfat.gov.au/trade/negotiations/us_fta/outcomes/05_services.html. 88 See http://www.dfat.gov.au/geo/chile/fta/deal_at_a_glance.pdf. 89 See http://www.international.gc.ca/trade-agreements-accords-commerciaux/assets/pdfs/fs-services-en.pdf 90 See http://www.tid.gov.hk/english/trade_relations/hknzcep/index.html.

55
allow U.S. firms to take full advantage of the benefits of the agreement across all sectors, including but not limited to telecommunications services, financial services, distribution services, express delivery services, computer and related services, audiovisual and entertainment services, energy services, transport services, construction and engineering services, tourism, advertising services, professional services, and environmental services.91
(iii) Domestic Measures and Other Liberalization Initiatives92 Besides the measures implemented by APEC member economies based on the understandings reached in trade negotiations at the multilateral, regional or bilateral level, APEC member economies have also advanced toward the liberalization of cross-border trade in services and investment through the accomplishment of unilateral domestic reforms or through the implementation of specific international sectoral agreements. In terms of unilateral domestic reforms, APEC member economies have reported good progress. In the case of the APEC5, overall, the level of openness has already been high for many years. Nevertheless, as shown in the APEC Individual Action Plans and WTO documents, these economies have still found room for improvement in a number of sectors. Some examples are listed as follows: Market access to Australia’s services sector is relatively unrestricted. Australia recorded notable developments in telecommunications liberalization and competition, passing new legislation that includes the improvement of the investment certainty in relation to telecommunications infrastructure, the operational separation of Telstra, the privatization of Telstra, and removal of price regulation from services provided to large business customers.93 Similarly, Australia has introduced further reforms to its business and real estate investment regimes in the second half of 2009, which provide a clearer pathway for foreign investors and generally allows unrestricted investment in Australian companies below an indexed threshold of AUD 231 million94. 91 http://www.ustr.gov/sites/default/files/uploads/factsheets/2007/asset_upload_file672_13066.pdf 92 The descriptions and information in this part are mainly based on the PSU Report p 50-53. 93 Australia APEC IAP Peer Review (2007) 94 See http://www.treasurer.gov.au/DisplayDocs.aspx?doc=pressreleases/2009/089.htm&pageID=003&min=wms&Year=2009&DocType=0.

56
Canada’s market access in services is relatively liberal, but has been further enhanced since 199895. According to Canada’s IAP Peer Review (2008), it was noted that market access improvements in services trade were achieved through GATS, with some movement on national treatment under NAFTA, and reduction in discriminatory provincial requirements affecting the provision of professional, business, and tourism and transport services. Canada also highlighted the elimination of citizenship requirements with respect to engineering services, integrated engineering services, and related scientific and technical consulting services in the Energy Services sector. The WTO Secretariat noted that Japan has continued to promote structural reforms, especially those pertaining to energy, financial services, and air transport, among others. Japan has further liberalized its gas sector to promote competition. Recent improvements for services liberalization include the audio-visual communication services, with improvements on foreign entry, as well as the transport and energy services, with improvements on operational, licensing and qualification requirements of services providers96. New Zealand’s services sector has remained relatively liberal and competitive, with low barriers to entry97. In recent years, there have been important reforms in the energy sector. Amendments were made to the Electricity Industry Reform Act 1998 to relax the rules restricting cross-involvement between electricity lines businesses and supply businesses. Also, in accounting services, changes were made in order to reduce compliance costs for businesses by removing filing requirements for non-large companies with 25% or more overseas ownership98. The United States has long maintained a policy of national treatment of foreign investment, subject to sector-specific considerations, prudential concerns, and national security as mentioned in a report by the WTO Secretariat99. This report 95 WTO Secretariat (2000), Trade Policy Review - Report by the Secretariat – Canada – Revision, WT/TPR/S/78, 15 November 2010, p. vii. 96 Japan APEC IAP Peer Review (2007). 97 WTO Secretariat (2009), Trade Policy Review - Report by the Secretariat – New Zealand – Revision, WT/TPR/S/216/Rev.1, 10 July 2009, p. x. 98 New Zealand, 2007-2009 APEC IAP Update. 99 WTO Secretariat (2008), Trade Policy Review - Report by the Secretariat – United States – Revision, WT/TPR/S/200/Rev.1, 12 August 2008, p. vii.

57
stresses the fact that the telecommunications market is open to foreign participation and highly competitive. Some measures have been implemented in this sector to improve incentives for facilities-based investment, such as the elimination of certain unbundling requirements and the facilitation of new entry in the domestic pay-television services market100. Efforts at the state level have taken place as well. For example, in the area of professional services, the State of Virginia became the most recent U.S. state to adopt rules for licensing of foreign legal consultants (FLC), raising the total number of states with FLC rules to 30101. The APEC8 have achieved considerable progress in the implementation of domestic measures to liberalize cross-border services and investments. A study by Dihel and Shepherd (2007)102 to assess barriers and the effects of liberalization in services showed considerable progress in the liberalization of insurance and fixed telecommunications services in Chile, distribution services in Mexico, and insurance, banking and telecommunications services in Peru. In their APEC Individual Action Plans, the APEC8 have also reported a comprehensive list of measures in their efforts to liberalize cross-border services and investments. These efforts are also stressed by the WTO Secretariat in their Trade Policy Review reports. Some illustrative examples from these sources are described below. In Chile, telecommunications services, including domestic and international phone services, mobile telephones and value-added network services are completely open to competition from both national and foreign providers. In general, Chile does not have foreign ownership restrictions in the telecommunications sector103. Hong Kong, China has in place a liberal regime for trade in services. Subject to the FTAs, MFN treatment is applied across all services and service providers. With the exception of residency requirements being maintained in a few services sectors, foreign service providers generally are afforded national treatment. Markets have been progressively deregulated and liberalized, and are generally contestable, 100 Ibid, p. xi. 101 United States APEC IAP 2009. 102 Dihel, N. and B. Shepherd (2007), Modal Estimates of Services Barriers, OECD Trade Policy Working Papers, No. 51, OECD Publishing, p. 20-27. 103 Chile APEC IAP 2009.

58
primarily without import or export barriers and with appropriate regulatory structure in place. There are no numerical quotas, foreign equity caps, etc. in Hong Kong, China’s services trade regime. Domestic regulations are maintained for legitimate policy objectives or prudential reasons and are not more restrictive than necessary. Hong Kong, China remains receptive to foreign investment and does not discriminate between foreign and domestic investors. The presence of international banks in Hong Kong, China's highly external-oriented banking sector is among the largest in the world (69 of the world's 100 largest banks are established in Hong Kong, China) 104 . In the telecommunications services, the market has been progressively deregulated. Fixed line telecommunication network services were fully liberalized at the beginning of 2003, while market entry requirements for wireless networks were substantially reduced105. Korea has unilaterally liberalized foreign ownership in telecommunications beyond GATS commitments. Measures to open the banking sector to foreign direct investment have increased competition and labor productivity106. In terms of educational services, Korea has decided to make the participation of foreigners to establish or operate cyber universities more flexible in certain cases107. According to the WTO Secretariat, since April 2009, Malaysia has been unilaterally liberalizing its services sector and is intending to improve its offers in areas where domestic services suppliers are ready to compete with foreign suppliers108. Foreign equity restrictions were eliminated on 27 services sub-sectors involving health and social services, tourism, transport, business services, and computer and related services. Foreign investment guidelines on the acquisition of interest, mergers and takeovers have been repealed. Progress to open the market to foreign competition has been evident in financial services, particularly in Islamic banking, insurance and capital market109.
104 WTO Secretariat (2007), Trade Policy Review - Report by the Secretariat – Hong Kong, China – Revision, WT/TPR/S/173/Rev.1, 13 March 2007, p. viii, 80. 105 Hong Kong, China APEC IAP Peer Review (2007). 106 WTO Secretariat (2008), Trade Policy Review - Report by the Secretariat – Republic of Korea – Revision, WT/TPR/S/204/Rev.1, 4 December 2008, p. xi. 107 Korea APEC IAP 2009. 108 WTO Secretariat (2010), Trade Policy Review - Report by the Secretariat – Malaysia – Revision, WT/TPR/S/225/Rev.1, 15 February 2010, p. 17. 109 Malaysia APEC IAP Peer Review (2009).

59
Mexico’s market access provisions in its domestic legislation and preferential agreements are more liberal than the commitments undertaken in GATS110 . Mexico’s APEC IAP Peer Review (2008) noted that improvements have been implemented in telecommunications, broadcasting, tourism and travel-related services, financial services, and natural gas services, all of which are very sensitive sectors. Reform was also undertaken in financial services. Further improvements targeted toward telecommunications and natural gas services were planned. The Mexico 2009 IAP also noted that Mexico is the first Latin American economy accepting number portability. This scheme has become an important element in competition and convergence in telecommunications, since it enables service providers to compete fairly. Peru generally does not apply limitations on national treatment in banking, insurance and private pension funds111. In telecommunications, the liberalization of the sector has made progress since 2000 and the sector’s regulatory framework has seen changes with the objective of reducing the barriers to the entry of new operators in the market112. In general, Singapore keeps open FDI policies and is becoming more open for utilities and services. For instance, in the electricity sector, restructuring and privatization has begun with the three leading power-generation companies. Deregulation has continued in the gas sector with the approval of non-discriminatory terms and conditions for gas transportation throughout the Singapore network. Furthermore, a significant degree of liberalization in the financial and telecommunications sectors has been achieved. Regarding professional services, Singapore has increased market access for certain kinds of foreign professionals, notably lawyers. The postal sector was liberalized in April 2007113. Chinese Taipei passed the Service Industry Development Plan in July 2008, whose aim is to lay firm foundations for the holistic development of domestic service 110 WTO Secretariat (2008), Trade Policy Review - Report by the Secretariat – Mexico – Revision, WT/TPR/S/195/Rev.1, 2 May 2008, p. x. 111 Peru APEC IAP Peer Review (2008). 112 Ibid 113 WTO Secretariat (2008), Trade Policy Review - Report by the Secretariat – Singapore – Revision, WT/TPR/S/202/Rev.1, 26 September 2008, p. viii-x.

60
industries, by means of measures to encourage R&D and innovation, promote regulatory reforms, enhance the competitiveness of service exports, strengthen human resources cultivation, etc. To spur on the implementation of this plan, Chinese Taipei in December 2009 established a Special Task Force for Service Industry Promotion. The task force is charged with coordinating the removal of barriers to service industry investment and operation, helping build an environment conducive to service industry development, and monitoring the implementation of the plan and related measures. Chinese Taipei has pursued liberalization measures to facilitate domestic structural reform and provide better market access for non-Chinese Taipei firms. For example, reforms in telecommunications include the liberalization of mobile communication services; opening of satellite communications market; easing of licensing conditions and issuing licenses for fixed network services and 3G mobile communication services; liberalization of domestic leased circuit services; among others. In this context, the public-owned dominant carrier (Chunghwa Telecom) was privatized in August 2005. Liberalization in some sectors can also be achieved through the implementation of sectoral agreements. Air transport services are a clear example. Grosso and Shepherd (2009)114 noted that although restrictions to air cargo services remain in place in many bilateral trade agreements, there has been some progress in easing them by APEC economies. 56 air service agreements (ASAs) have incorporated open route schedules for cargo, representing about 20% of the agreements for which data on this component are available. Open 3rd and 4th freedom rights are in general as common as 5th freedom, even though restrictions to the latter remain widespread (106 ASAs, over 50% of the total). Notably, 25 bilateral ASAs grant 7th freedom rights for cargo services115. In addition, tariff restrictions for freight transport have been liberalized in almost 50 bilateral agreements. Also significant is the headway achieved in introducing domestic competition in the provision of ground handling services (over 60% of ASAs) and on self-handling, allowed by as many as 73 agreements. Although the level of openness in the APEC5 is already high and efforts including the above mentioned have been made, there still remain restrictions in services 114 Grosso, M. and B. Shepherd (2009), Liberalising Air Cargo Services in APEC, Working Paper, The Groupe d’Economie Mondiale (GEM) at Sciences Po. (reproduced in PSU Report) 115 See http://www.icao.int/icao/en/trivia/freedoms_air.htm for a description of all the air freedom rights.

61
sectors. According to the summary of the WTO Secretariat’s reports for WTO Trade Policy Reviews (TPR) in the WTO Secretariat’s Note, such services sectors in which the 2010 economies still maintain some restrictions include, but are not limited to financial services, telecommunications services, transportation services (including maritime and air transport); and audiovisual services (including radio and television broadcasting). Also, among the four different modes of service supply, Mode 4 is the least liberalized one in APEC as a whole and the 2010 economies116, and the difference between the 1994 Schedule of Commitments and the 2005 Revised Offer liberalization level on Mode 4 of APEC5 is the smallest among four different modes of supply117. While data allowing quantitative analysis of services liberalization is limited, and while restrictions in certain areas may remain, major progress has been made by APEC member economies in liberalizing their trade in services. The willingness toward more liberalized trade in services through GATS commitments, RTAs/FTAs progress, and other unilateral domestic initiatives demonstrates that APEC member economies are moving in the direction of the Bogor Goals. (4) Investment There is international consensus that investment is crucial to delivering the economic growth needed to reduce poverty and improve welfare. The movement of international capital helps the economic growth of economies, as it finances domestic investment in the destination economies, while it helps maximize the efficient use of capital in the source economies. FDI can be a vehicle of technological progress in the destination economies through the use and dissemination of advanced production techniques. APEC has been instrumental on this front by adopting, in 1994, the APEC Non-Binding Investment Principles, with the ultimate goal to improve and to further liberalize investment regimes.118 Under the OAA, economies have continued to prove their strong commitment to liberalization of their investment regimes, by progressively providing MFN and national treatment, and ensuring transparency. They also undertook to facilitate 116 PSU Report, p.41. 117 PSU Report, p.44. 118 PSU Report, p65

62
investment through, inter alia technical assistance and cooperation, including information exchange on investment opportunities.
The 2010 economies have continued to liberalize the investment environment by engaging in proactive policy actions, such as easing prior screening/approval requirements that some economies had imposed upon investment proposals of foreign entities. Six of the 2010 economies reported that their investment regimes are consistent with all of the APEC Non-Binding Investment Principles and others reported “most”. In addition, almost all the 2010 economies no longer retain restrictive measures such as offset requirements or transfer of capital restrictions with regard to foreign direct investment; and even where such measures remain, the scope of their application is very limited. Furthermore, the number of bilateral investment treaties (BITs) and/or RTAs/FTAs in which the 2010 economies have ensured MFN and national treatment to foreign investment has increased in the past years at both the intra-APEC and extra-APEC levels from 160 in 1996 to 340 in 2009. Since there is no multilateral agreement on investment, bilateral agreements play a central role of making international rules. These agreements exempt parties from applying commitments under FTAs concluded with the third parties. Therefore, high-level commitments are not automatically applied on an equal basis. Furthermore, provisions on state-investor dispute settlement are also exempted often from MFN treatment. The 2010 economies have undertaken a total of 242 investment-related measures in the period from 1996-2008, according to UNCTAD’s database on investment policy measures. Out of these, a total of 224 measures (i.e. 93%) made the investment environment more favorable to foreign investors. The highest number of more favorable measures was taken in Korea (34), followed by Malaysia (31), Chinese Taipei (25), Singapore (24), Australia (21), Canada (20) and Japan (18). During 2006-2008, a total of 32 measures have been undertaken, out of which 24 (i.e. 75 %) were more favorable to foreign investors119.
119 UNCTAD (2010), Assessment of Liberalization and Facilitation of FDI in Thirteen APEC Economies. (hereinafter called “UNCTAD report”).

63
Since adoption of the Bogor Goals, Australia, for example, has removed entries to the reservation to direct investment by non-residents in mass circulation and ethnic newspapers and broadcasting (including television); Canada has narrowed entries to the reservation to direct investment by non-residents in relation to the review requirement under the Investment Canada Act, as well as in the area of telecommunications and energy; Japan has removed the entry to the reservation to direct investment abroad by residents in relation to investments in an enterprise engaged in: banking and/or securities business by banks and/or securities companies established under Japanese laws; and the cultivation of pearls; and New Zealand and the United States have removed no entry to the reservation to direct investment by non-residents. This is due to the fact that the bulk of liberalization measures in these economies had already been taken by the mid-1990s, and the number of restrictions remaining was thus very limited.120 For the APEC8, Chile allows foreign investors to reinvest up to 100% of their profits, as opposed to the previous limit121 of 65%, and offer the possibility to reinvest their profits in any company other than that generating those profits; Hong Kong, China grants MFN treatment to all WTO members and its investment regime has no restrictions on inward or outward investments, no foreign exchange controls and no nationality restrictions on corporate or sectoral ownership; Korea partially lifted sectoral FDI restrictions in fishing (inshore and coastal), cattle raising, wholesale meat and news agencies in 2000 and 2001, and in 2006 fully opened the theatrical animation market; and Malaysia decided in April 2009 to implement further liberalization measures in the services sectors, such as health and social services, tourism services, business services and computer and related services, and has relaxed foreign investment restrictions in some financial services as well. Since its enactment in 1993, Mexico’s Foreign Investment Law (FIL) established as a general rule that all activities not specifically mentioned in the law are completely deregulated in terms of allowing up to 100% of foreign investment in most economic sectors (article 4). The FIL was amended in 1995, 1996, 1998, 1999, 2001, 2006 and 2008 in order to liberalize the investment regime and provide the foreign investor with greater certainty and transparency. In Peru, major privatizations which were followed by initiatives to attract foreign investment were completed in the 1990s,
120 OECD report, Appendix and p.52. 121 Only for Decree Law 600 investors

64
specifically in mining, electric/power generation and distribution, and telecommunications sectors, and in July 2004, the Peruvian Government extended foreign investment participation in television and radio companies through the Law of Radio and Television. Since early 2000's Peru has been promoting private investment in infrastructure and public services. Road network, airports and ports has been improved and expanded with the participation of foreign investment. Foreign and domestic investors are called to participate in international bidding for the building up, maintain and operate new or expanded infrastructure. Singapore and Chinese Taipei also have removed foreign ownership restrictions. For example, Singapore removed ownership restrictions on domestic banks and telecommunications sectors; while Chinese Taipei removed ownership restrictions on listed companies in the securities and futures markets, on air cargo forwarder and terminals, on power plants, and on local banks. 122 These efforts by the 2010 economies can be regarded as having substantially contributed to investment liberalization in the region which, along with behind-the-border measures, political and economic stability and growth, have contributed to the significant growth of FDI flow in the region. Although a majority of the 2010 economies still retain areas where foreign investments are subject to some forms of restriction, these are limited in scope. The OECD also evaluated the progress of the 2010 economies in achieving the Bogor Goals with respect to investment.123 The OECD concluded that all 2010 economies had open investment regimes, to varying degrees. According to the OECD FDI Regulatory Restrictiveness Index, the level of FDI restrictiveness in most 2010 economies is low. It noted that most 2010 economies made the most significant progress toward investment liberalization during the 80s and mid 90s, and today, most of them maintain only limited restrictions on direct inward investment. Further progress in investment liberalization has been achieved over recent years, notably through reducing restrictions to foreign ownership and limiting the scope of review requirements for foreign investment. The 2010 economies have also made progress in granting national treatment to foreign-controlled enterprises. Exceptions to national treatment in most 2010 economies are typically limited to
122 PSU Report, p56-59. 123 OECD report.

65
certain sectors, notably mining, transport, fisheries, broadcasting and telecommunications. A key driver for continuous progress in investment liberalization in most 2010 economies has been a strong commitment toward progressive liberalization through implementation of key principles, such as non-discrimination and standstill, which discourage governments from maintaining restrictions to foreign investment or adding new ones. The 2010 economies are committed to the principle of transparency in investment. Most 2010 economies have undertaken legally binding reporting requirements under OECD investment instruments.124 An UNCTAD report assessing liberalization and facilitation of FDI in the 2010 economies concluded that considerable progress in liberalization and facilitation of the investments regimes by member economies has been achieved. 125 It also states that the 2010 economies have reached a high level of investment liberalization and have established transparent and conducive investment regimes. However, all 2010 economies still maintain, to various degrees, sectoral investment restrictions in the form of prohibitions or capital ceilings, and some economies also continue to apply a general screening system for FDI126. All 2010 economies are also actively engaged in investment promotion and facilitation (e.g. through investment incentives and the work of national investment promotion agencies).127 UNCTAD suggests this progress has been largely achieved through unilateral efforts undertaken by the 2010 economies, with some requiring major policy changes reflected in the domestic investment regimes. In addition, international commitments as laid down in the numerous international investment agreements (IIAs), particularly RTAs/FTAs that these economies have concluded among themselves and with other APEC economies or non-APEC countries over the years, helped lock in unilateral progress, providing for an open, stable and predictable investment climate in the region. In addition to the two driving forces of autonomous liberalization and IIA-driven liberalization, the peer pressure generated 124 OECD report, p7. 125 UNCTAD report, p4. 126 The PSU Report (p.83) also notes that the factsheets submitted by the 2010 economies show the existence of certain restrictions faced by foreign investment. However, they are mostly limited to strategic interests regarded as sensitive. 127 UNCTAD report, p4.
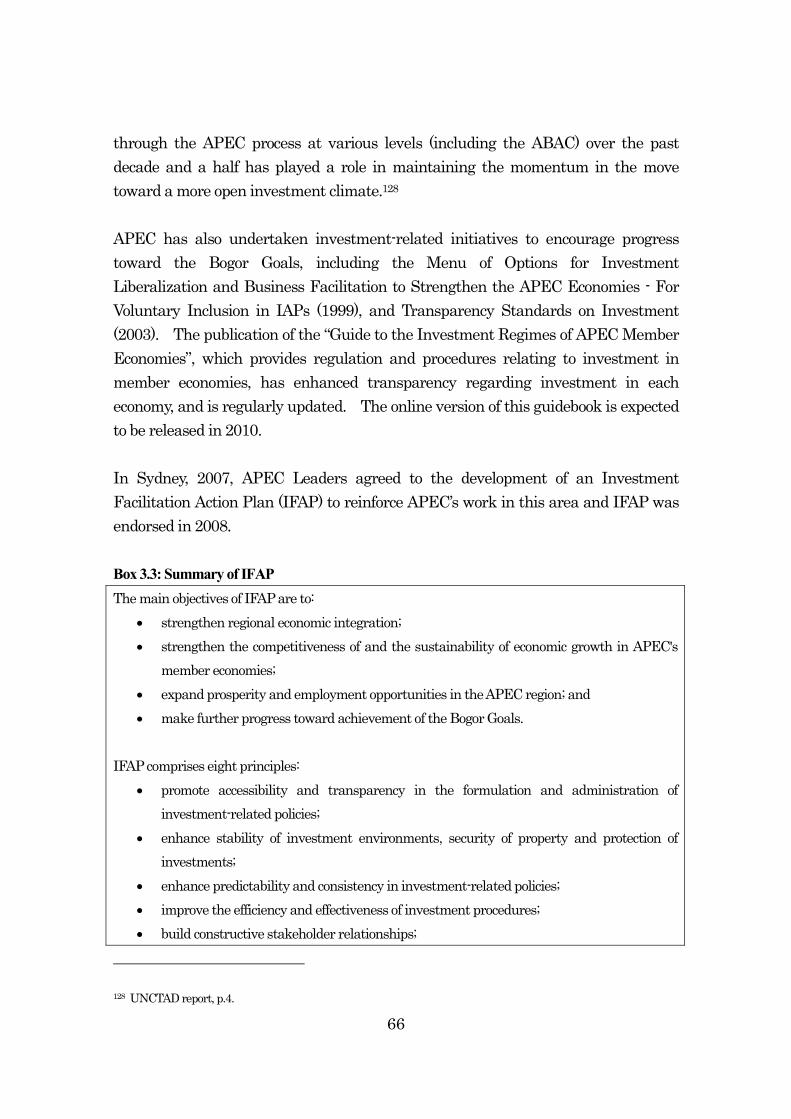
66
through the APEC process at various levels (including the ABAC) over the past decade and a half has played a role in maintaining the momentum in the move toward a more open investment climate.128 APEC has also undertaken investment-related initiatives to encourage progress toward the Bogor Goals, including the Menu of Options for Investment Liberalization and Business Facilitation to Strengthen the APEC Economies - For Voluntary Inclusion in IAPs (1999), and Transparency Standards on Investment (2003). The publication of the “Guide to the Investment Regimes of APEC Member Economies”, which provides regulation and procedures relating to investment in member economies, has enhanced transparency regarding investment in each economy, and is regularly updated. The online version of this guidebook is expected to be released in 2010. In Sydney, 2007, APEC Leaders agreed to the development of an Investment Facilitation Action Plan (IFAP) to reinforce APEC’s work in this area and IFAP was endorsed in 2008. Box 3.3: Summary of IFAP The main objectives of IFAP are to:
· strengthen regional economic integration; · strengthen the competitiveness of and the sustainability of economic growth in APEC's
member economies; · expand prosperity and employment opportunities in the APEC region; and · make further progress toward achievement of the Bogor Goals.
IFAP comprises eight principles:
· promote accessibility and transparency in the formulation and administration of investment-related policies;
· enhance stability of investment environments, security of property and protection of investments;
· enhance predictability and consistency in investment-related policies; · improve the efficiency and effectiveness of investment procedures; · build constructive stakeholder relationships;
128 UNCTAD report, p.4.

67
· utilize new technology to improve investment environments; · establish monitoring and review mechanisms for investment policies; and · enhance international cooperation.
To assist APEC member economies develop better investment facilitation strategies the IFAP includes a menu of collective actions under each of the eight investment facilitation principles.129 To measure progress in the implementation of IFAP, APEC is working, with help of the PSU, to identify a set of key performance indicators (KPIs) and establish a methodology for measuring performances. (5) Trade Facilitation Trade facilitation incorporates measures aimed at reducing the costs to business of operating in, and especially between, markets. It refers to the removal of administrative burdens which hamper the smooth flow of goods and services across borders; for example, through streamlining of customs procedures, harmonization of standards and adoption of paperless procedures. As tariff rates have fallen, the relative importance of trade facilitation has increased. APEC economies’ adoption of the first and second Trade Facilitation Action Plans in 2002 and 2007 (TFAP I and TFAP II) represent a strong collective effort to facilitate trade across the region. Between 2002 and 2006, TFAP I met its target of a 5% reduction in trade transaction costs to business to trade in our region. Similarly, TFAP II, which called for a further 5% reduction between 2007 and 2010, has had a strong and measureable effect. The APEC Policy Support Unit recently completed an interim assessment of TFAP II, which indicated that trade transaction costs in the APEC region went down over the 2007-2008 period, in comparison to the levels in 2006, which were used as a baseline for the study. Under both TFAPs, the 2010 economies have made significant progress. By the end of 2009, these economies had implemented 906 actions aimed at facilitating trade through improvements to customs procedures, standards and conformance, 129 For more information, see APEC 2008/MRT/R/004
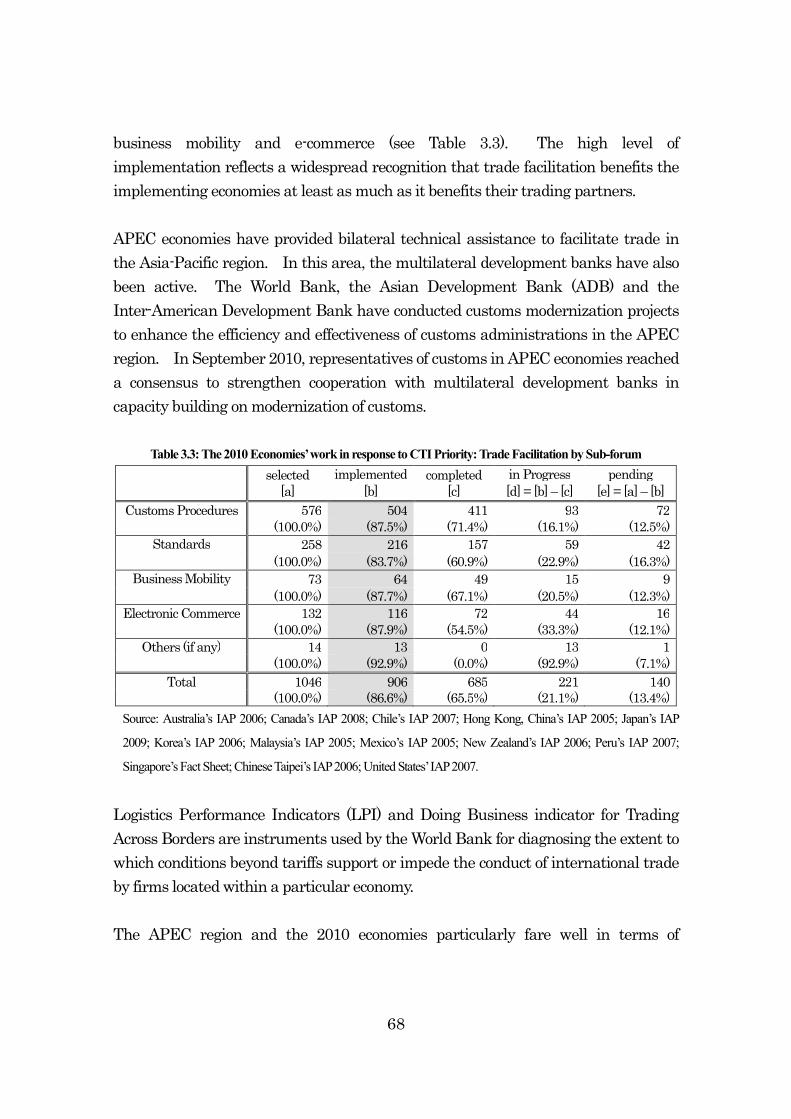
68
business mobility and e-commerce (see Table 3.3). The high level of implementation reflects a widespread recognition that trade facilitation benefits the implementing economies at least as much as it benefits their trading partners. APEC economies have provided bilateral technical assistance to facilitate trade in the Asia-Pacific region. In this area, the multilateral development banks have also been active. The World Bank, the Asian Development Bank (ADB) and the Inter-American Development Bank have conducted customs modernization projects to enhance the efficiency and effectiveness of customs administrations in the APEC region. In September 2010, representatives of customs in APEC economies reached a consensus to strengthen cooperation with multilateral development banks in capacity building on modernization of customs.
Table 3.3: The 2010 Economies’ work in response to CTI Priority: Trade Facilitation by Sub-forum selected implemented completed in Progress pending [a] [b] [c] [d] = [b] – [c] [e] = [a] – [b]
Customs Procedures 576 504 411 93 72 (100.0%) (87.5%) (71.4%) (16.1%) (12.5%)
Standards 258 216 157 59 42 (100.0%) (83.7%) (60.9%) (22.9%) (16.3%)
Business Mobility 73 64 49 15 9 (100.0%) (87.7%) (67.1%) (20.5%) (12.3%)
Electronic Commerce 132 116 72 44 16 (100.0%) (87.9%) (54.5%) (33.3%) (12.1%)
Others (if any) 14 13 0 13 1 (100.0%) (92.9%) (0.0%) (92.9%) (7.1%)
Total 1046 906 685 221 140 (100.0%) (86.6%) (65.5%) (21.1%) (13.4%)
Source: Australia’s IAP 2006; Canada’s IAP 2008; Chile’s IAP 2007; Hong Kong, China’s IAP 2005; Japan’s IAP
2009; Korea’s IAP 2006; Malaysia’s IAP 2005; Mexico’s IAP 2005; New Zealand’s IAP 2006; Peru’s IAP 2007;
Singapore’s Fact Sheet; Chinese Taipei’s IAP 2006; United States’ IAP 2007. Logistics Performance Indicators (LPI) and Doing Business indicator for Trading Across Borders are instruments used by the World Bank for diagnosing the extent to which conditions beyond tariffs support or impede the conduct of international trade by firms located within a particular economy. The APEC region and the 2010 economies particularly fare well in terms of

69
international comparison under the LPI. Based on the analysis in the OECD report130, it can be said that the 2010 economies as well as APEC as a whole ranked above all other regions based on World Bank groupings.
Chart 3.13 World Bank LPI: regional comparisons
Note: The LPI index and hence the “APEC Average” does not contain data for one economy.
Source: World Bank, Logistics Performance Indicators. (reproduced in OECD and Japan)
(i) Standards and Conformance
Overall, standards and conformance work in APEC has concentrated on promoting better alignment of divergent approaches to standards and conformance in the region, including through alignment to international standards and mutual acceptance of testing and certification results. These efforts have focused on building technical expertise and infrastructure, sharing information on specific standards, enhancing transparency and promoting regulatory cooperation including developing mutual recognition agreements (MRAs). The 2010 economies have achieved high levels of alignment with international standards in specific areas, including through participation in the International Organization for Standardization (ISO), International Electrotechnical Commission (IEC), and the Codex Alimentarius. Alignment occurs as national standards bodies, regulators or market participants adopt and use international standards that are relevant and effective in meeting specific commercial and policy objectives. 130 OECD report, p28-29

70
Regarding the number of domestic standards aligned with the target international standards, the APEC5 show considerable progress. By 2009, Japan had aligned 254 domestic standards out of 268 (compared with only 1 out of 38 in 1996). New Zealand had 1,333 standards out of 3,036 aligned by 2009, compared with 620 out of 2,159 in 1996. Australia’s alignment ratio rose from 25% of 6,000 standards in 1996 to 43% of 6,500 standards in 2009. For the year 2009, Canada has 120 out of 167 standards adopted from international standards (72%) compared with 50% in 1996 based on ISO/IEC standards. The United States, one of the largest users of ISO and IEC standards, does not have a mandatory adoption policy for voluntary standards and relies on the users’ determination of the relevance and effectiveness of specific standards. For the APEC8, Chile achieved a 100% alignment of their technical regulations with respect to 168 target IEC standards. Korea’s national standards are fully aligned with the 168 target IEC standards for VAP. Hong Kong, China has achieved 100% alignment of the 168 target IEC standards. From 1996 to 2009, Malaysia developed 3,376 additional standards and the cumulative alignment to international standards rose from 21.6% to 60.1%. Similar progress was seen with Mexico, which registered 765 technical regulations aligned with international standards by 2009 (138 in 1996) and 4,291 for standards (58 in 1996). Peru had aligned 43 technical regulations out of 81 by the year 2009 (compared with 3 out of 9 in 1996). Singapore has fully aligned domestic standards to international standards. Chinese Taipei raised the number of domestic standards aligned with international standards from 35 to 94 between 1996 and 2009.131 APEC has increased understanding of the factors that influence the success of MRAs, helping to lift the average number of bilateral/multilateral MRA arrangements across the 2010 economies, Australia participates in 18 arrangements, Mexico does in 11 arrangements, New Zealand has implemented 10 bilateral MRAs, Hong Kong, China has participated in or notified its intention to participate in 10 MRAs, and Chile participates in two MRAs. The United States participates in or is progressing 7 MRAs and also participates in an additional 9 MRAs that are not government-to-government. Regulatory cooperation among the APEC economies in specific sectors has also steadily increased, and in 2010 included inter alia 131 PSU Report, p83 and factsheets
71
chemicals, electrical and electronic equipment, energy, food, medical devices and toys. Regarding efforts to raise the transparency and objectivity of international standards, most 2010 economies reported their compliance with the WTO Agreement on Technical Barriers to Trade in the setting up of a notification and enquiry point in respect of technical regulations, standards and conformity assessment measures. Some of the 2010 economies have also notified the implementation of similar clauses in their RTAs/FTAs.132
The OECD concludes that alignment of national with international standards has taken place in many 2010 economies, and multilateral trade rules/good regulatory practices promoting the use of international standards have become embedded in national standardization and regulatory systems. Most 2010 economies are engaged in a growing number of mutual recognition agreements of conformity assessment results, helping to reduce trade costs resulting from differences in national regulatory regimes. 133
(ii) Customs Procedures Since adoption of the Bogor Goals, there have been substantial improvements in the speed, transparency and predictability of customs procedures across the APEC region. In particular, the 2010 economies have made significant progress. As at 2009, all 2010 economies had adopted the Harmonized Commodity Description and Coding System (HS) 2007 Nomenclature134, and 7 of the 2010 economies had acceded to the International Convention on the simplification and harmonization of Customs procedures (as amended) (the Revised Kyoto Convention) adopted by the World Customs Organization, though non-accession has not been an impediment in order that certain economies could adopt customs practices of the RKC. The large majority of 2010 economies have enhanced the transparency of their customs procedures by publishing customs information via website, and setting up channels for public consultations, appeals and complaints, stakeholder forums and enquiry
132 PSU Report, p.84 133 OECD report, p.7. 134 PSU Report, p.84
72
points amongst others. All the 2010 economies have established computerized customs clearance systems for import and export procedures and most also have introduced or begun to introduce Single Window systems in collaboration with trade-related government agencies. In addition, all the 2010 economies have introduced compliance program and/or risk management system to secure and facilitate global trade. To further optimize security and facilitation, many economies have introduced Authorized Economic Operator (AEO) programs and others are working for their implementation. International conventions, agreements and best practice customs procedures have been adopted by member economies to facilitate trade, which include Advance Ruling Systems, the Agreement on Implementation of Article VII of the General Agreement on Tariffs and Trade 1994 (WTO Customs Valuation Agreement), the Customs Convention on the ATA carnet for the Temporary Admission of Goods Admission Temporaire/Temporary Admission (ATA Convention) and the Guidelines for the Immediate Release of Consignments by Customs. The OECD report concludes that customs procedures and operations in the 2010 economies have become more transparent, and the introduction of Single Window systems have simplified customs clearance, as have initiatives to coordinate and integrate border-related activities. These measures have made these economies among the most efficient in clearing goods through customs. Fees associated with readying a container to cross the economies’ borders are among the lowest in the world.135 In addition, most 2010 economies receive high grades on the issue of “transparency of border administration.”136
(iii) Mobility of Business People APEC member economies have made significant progress in facilitating the mobility of business people. The APEC Business Travel Card (ABTC) scheme has been one of APEC’s most successful activities. In March 2009, the number of cardholders had risen to around 57,000. In addition to their participation in the ABTC scheme, economies
135 OECD report, p7. 136 OECD report, p20.

73
have made efforts to make crossing borders easier for business travelers by reducing procedural and administrative burdens. In relation to the movement of specific professionals, APEC also developed the APEC Engineer and the APEC Architect schemes to facilitate mobility of people with qualifications based on mutual recognition. 9 of 13 economies participating in the APEC Engineer scheme and 8 of 12 economies participating in the APEC Architect scheme are the 2010 economies. In terms of visas, the number of visa free arrangements reported by the 2010 economies ranges from zero to about 170. Hong Kong, China leads with around 170 visa free or visa waiver arrangements, followed by Korea (90), Chile (87), Japan (63), New Zealand (58), Mexico (55), Canada (54) and Chinese Taipei (39). Malaysia imposes visa on visitors from only 38 countries. Although the United States reported only two Visa Free Programs, its Visa Waiver Program has 35 participants. Similarly, Peru reported only two visa free arrangements for business purposes, including one with an APEC member economy. However, its system allows foreigners to change their status from tourist to business visitor once they have arrived in Peruvian territory and it does not require tourist visas for passport holders of 19 APEC member economies. Likewise, although Australia does not have visa free arrangements due to its universal visa system, it allows citizens from 34 economies, including 7 APEC economies, to apply online for an Electronic Travel Authority (ETA), which usually provides immediate confirmation and provides many of the same benefits as visa free travel. In addition, the amount of time required to obtain a visa has steadily been cut from 1996 to 2009. In most of the 2010 economies, the average time to approve a short term business visit visa is currently no more than five days.
(iv) Rules of Origin (ROOs) Rules of Origin determine the country of origin of goods and as such determine which items enjoy preferential treatment in the importing economy. In the Asia-Pacific region, ROOs are potentially the most challenging aspect of FTAs. Some studies on FTAs argue that complex ROOs raise transaction costs for firms, while restrictive ROOs deter the use of FTA preferences.

74
Nine APEC economies have joined the APEC Pathfinder Initiative for Self-Certification which aims at exploring options to cut compliance costs for businesses while promoting the use of high-quality RTAs/FTAs. In addition, Trade Ministers have endorsed the APEC Transparency Initiative on Tariffs and ROOs to increase the transparency and availability of ROOs information for trading businesses. Economies are to provide public access to up-to-date tariff and ROOs information on their respective economy websites, and through the APEC Website on Tariff and ROOs (WebTR). (6) Other Measures
(i) Intellectual Property Rights (IPR) In relation to intellectual property rights (IPR), APEC as a whole has facilitated valuable policy exchanges on IP matters, and has encouraged region-wide implementation of commitments under the WTO Agreement on Trade-Related Aspects of Intellectual Property Rights (TRIPS Agreement) and wider adoption of the multilateral agreements concluded under the auspices of the World Intellectual Property Organization (WIPO) and other multilateral IPR treaties. The 2010 economies have made significant efforts to improve their IPR systems by amending or enacting new laws and regulations and adopting measures with a view to accelerating the granting of IPR, harmonizing intellectual property systems in the APEC region and developing more effective ways to enforce them.137 Many of the 2010 economies have concluded the Patent Cooperation Treaty (PCT) (12 economies), the WIPO Copyright Treaty (WCT) (10 economies), the WIPO Performances and Phonograms Treaty (WPPT) (10 economies), the International Convention for the Protection of New Varieties of Plants (the UPOV) (9 economies) and as WTO members, the TRIPS Agreement (all economies), in addition to other international instruments like the Paris Convention and the Berne Convention to which all 2010 economies have acceded. APEC’s Intellectual Property Expert Group (IPEG) has been engaged in active discussion on important topics including IP asset management and utilization, enhancing cooperation in the patent field, improving IP enforcement at the border, 137 PSU Report, p85

75
enhancing IP training and capacity building in the region and promoting education and public awareness of IP among SMEs. APEC has developed a series of IPR Model Guidelines, including six under the APEC Anti-Counterfeiting and Piracy Initiative: to reduce trade in counterfeit and pirated goods; protect against unauthorized copies; prevent the sale of counterfeit and pirated goods over the internet; provide effective public awareness campaigns on IPR; secure supply chains against counterfeit and pirated goods; and strengthen IPR capacity building. Additionally, the APEC Cooperation Initiative on Patent Acquisition Procedures will contribute to ensuring adequate and effective patent protection for rights holders in the region by improving and enhancing cooperation among IP offices in the areas of IP office administration, human resources, and patent examination. Increases in patent applications and in PCT (Patent Cooperation Treaty) filings by patent offices of the 2010 economies (see Tables 3.4 and 3.5) provide some indication of the effectiveness of the measures APEC economies have implemented.
Table 3.4: Patent applications by patent office, broken down by resident and non-resident (1996, 2004-2008)
Patent Office Applicant Type 1996 2004 2005 2006 2007 2008
Total of Resident 520,874 674,898 709,865 707,065 715,337 697,629 the 2010 economies
Non resident 232,126 353,726 384,733 416,914 428,439 414,912
Total 753,000 1,028,624 1,094,598 1,123,979 1,143,776 1,112,541 Source: WIPO Statistics Database, December 2009
Note: Counts are based on the patent filing date. Resident filing refers to an application filed at an Office of or acting
for the State in which the first-named applicant in the application concerned has residence. Non-resident filing refers to
an application filed at an Office of or acting for the State in which the first-named applicant in the application concerned
does not have residence.
Data unavailable: 2 economies in 1996 and 2007, 3 economies in 2008.
Table 3.5: Number of PCT Filings by Receiving Office (2004-2009) 2004 2005 2006 2007 2008 2009*
Total of the 2010 economies 71,670 81,070 89,295 94,053 93,439 79,690 Source: WIPO Statistics Database, December 2009
Note: Data unavailable: 3 economies. 2009 data are provisional and incomplete (as of November 2009). Counts are
based on the international filing date.

76
(ii) Competition Policy
In 1996, about half of all APEC member economies had neither competition laws nor competition agencies. Since that time, APEC has contributed significantly to enhancing economies’ capacity to understand, design and implement competition policy138. The 2010 economies have made significant efforts to enhance the effectiveness and transparency of their competition policy regimes. Some economies have made significant amendments to their existing competition regimes in light of evolving enforcement practices and case laws, and in pursuance of the APEC Principles to Enhance Competition and Regulatory Reform. APEC has maintained a strong commitment to providing developing economies with the technical assistance necessary to implement effective competition policy regimes. APEC economies have been actively pursuing cooperative ties in competition related issues, as evidenced by the number of bilateral/multilateral cooperation agreements on competition enforcement among member economies. Among intra-APEC RTAs/FTAS, nineteen agreements include a chapter on competition.
(iii) Government Procurement
In 1999, APEC developed a set of APEC Non-Binding Principles on Government Procurement (“NBPs”)139. The 2010 economies have made strong efforts to remove barriers in governmental procurement, including through disclosure of governmental procurement information, providing guidelines for contracting policies and publishing notices of domestic procuring opportunities. By 2009, all 2010 economies had implemented systems for participation in government procurement processes through electronic means, further improving accessibility and transparency in their respective government procurement processes. Most of the 2010 economies have established domestic regimes to enhance transparency in government procurement through increased transparency in laws, regulations, and bidding systems. And while significant progress has been made in
138 APEC Economic Committee (2008), APEC Economic Policy Report 2008, p. 4. 139 NBPs consist of comprising transparency, value for money, open and effective competition, fair dealing, accountability and due process, and non-discrimination.

77
eliminating restrictions on foreign goods, services, and suppliers in government procurement, some restrictions remain in place and some preferences for domestic suppliers also remain. Most of the 2010 economies report no use of reciprocity requirements.
Table 3.6 Progress between 1996 and 2009 in the 2010 economies
Number of economies Increasing transparency of laws, regulations, bidding system, and how to determine bidding qualifications and bid winners (Economies reporting new legislation and amendment of relevant laws and regulations or conclusion on FTAs containing chapter of government procurement)
13
Restrictions on foreign goods, services or suppliers, or preferences to domestic suppliers:
- No discrimination due to improvement: 2 - No discrimination since 1996: 3 - Some exceptional discrimination despite
improvement: 2 - No improvement and some discrimination: 5 - No report: 1
Reciprocity requirements in providing access to government procurement markets
- No requirements despite formerly applied: 1 - No requirements: 7 - Formerly and currently apply requirements: 3 - No requirements formerly but currently apply
requirements: 1 - No report: 1
Consistency with the APEC Non-binding Principles on Government Procurement:
- completely consistent due to improvement: 4 - completely consistent since 1996: 4 - completely consistent but status in 1996 is not
reported: 2 - mostly consistent due to improvement: 2 - mostly consistent since 1996: 1
Introduction of electronic means for government procurement
- Had introduced as of 1996: 3 - Newly introduced: 10
Source: Fact sheets
78
7 of the 2010 economies are parties to the WTO Plurilateral Agreement on Government Procurement (GPA), four of which ratified the Agreement after 1997. In the bilateral context, there are 17 FTAs concluded by APEC economies which contain a government procurement chapter, and 14 of them provide legally-binding commitments on government procurement though one party to the FTA is not a party to the GPA.
(iv) Deregulation/ Regulatory reform The 2010 economies have undertaken consistent efforts toward deregulation and regulatory reform. APEC economies have played an active role by conducting reviews of their regulatory frameworks as a way to improve policy effectiveness and market efficiency. With regard to the regulatory reform component, seven of the 2010 economies reported that they have fulfilled all of the APEC Principles to Enhance Competition and Regulatory Reform. Some 2010 economies reported progress in implementing “some” or “most” of the principles. Several economies have adopted regulatory tools, systems and processes to improve the quality of new regulations. For example, the United States conducts a regulatory impact study before implementing significant regulatory reforms including cost/benefit analyses and/or Regulatory Impact Analysis (RIA). Also, Australia has adopted an RIA framework, especially through the use of Best Practice Regulation. These studies also act as a tool for policymakers to review existing regulations and procedures affecting businesses and other key stakeholders, and to select between alternative regulatory or non-regulatory approaches that could be implemented to address a particular policy challenge. By providing objective, evidence-based and credible analyses, impact studies can help achieve maximum public awareness and thus garner support for the proposed regulatory changes140. As a collective undertaking, APEC, in collaboration with the OECD, developed the APEC-OECD Integrated Checklist on Regulatory Reform, which was endorsed by these respective organizations in 2005 to provide instructions on a range of public sector reforms that include regulations, competition policy and market openness. 140 APEC Economic Committee (2009), APEC Economic Policy Report 2009, p. 55.

79
Six economies, including one non-2010 economy, had conducted self-reviews using the Checklist by February 2010. APEC’s efforts on regulatory reform have been accelerated since the endorsement of the Leaders’ Agenda to Implement Structural Reform (LAISR) in 2004, which established five priority areas that form the basis of its structural reform agenda of regulatory reform, public sector governance, competition policy, corporate governance, and strengthening economic and legal infrastructure. Progress has been made including in the development of institutional frameworks for regulatory reform, (e.g. appointment of a minister responsible for regulatory reform, establishment of new governmental institutions that oversee regulatory reform), reform of procedures for creating regulation (e.g. reviews and reforms on existing regulatory regimes/areas, strengthening RIA), and strengthening of consultation with the public or stakeholders such as business community. Recognizing that the regulatory environment can be a significant impediment for business, APEC’s Small and Medium-sized Enterprises Working Group established in 2006 the Private Sector Development agenda to undertake a multi-year effort to support business development through removing unnecessary impediments. In 2009, APEC commenced an initiative to improve the business environment through regulatory reform by focusing on five of the World Bank’s “Ease of Doing Business (EoDB)” indicators (starting a business, getting credit, enforcing contracts, dealing with permits and trading across borders). APEC has set an aspirational goal of improving APEC’s collective ranking in these five areas by a total of 25% by 2015 with an interim improvement of 5% by 2011 through a program of capacity building and implementation of improvements to the regulatory environment affecting business.
(v) WTO Obligation All 2010 economies reported the successful implementation of their obligations as WTO Members. (7) Other Efforts Reported Voluntarily Economies chose on a voluntary basis to provide information on additional measures that they believe are relevant to their progress toward the Bogor Goals.

80
The measures they reported include: supporting the multilateral trading system, environment, labor, e-commerce, services and investment, and Ease of Doing Business.
(i) Supporting multilateral trading system Some 2010 economies emphasized that they had supported the multilateral trading system by maintaining a liberal trade and investment regime. For example, Hong Kong, China informs that it currently applies no tariffs at all on imported products, impose no quantitative restrictions, and licensing schemes only apply to a handful of items to protect public health, safety, security and the environment and to fulfill international obligations only.
(ii) Environment Some 2010 economies reported they have taken actions to enhance the protection of the environment in their trade policy regimes. Seven of the 2010 economies reported the use of bilateral cooperative agreements or the inclusion of measures in their RTAs/FTAs to enhance the protection of the environment. Some of the common elements include promoting environmental cooperation between trading partners, encouraging the enforcement of domestic laws to protect the environment, and transparency and public participation in the development of new domestic laws or regulations impacting the environment. Although Environmental Goods and Services (EGS) is a fairly recent topic on the APEC agenda, efforts from member economies to liberalize trade and investment in EGS have been taking hold. In addition to participating in the WTO Doha environmental goods and services negotiations, member economies also expressed their willingness to further liberalize in their Doha Round Revised Offers. In addition, environment related provisions were included in RTAs/FTAs or their side agreements concluded by some of the 2010 economies141. The United States has indicated that after the passage of the 2002 Trade Promotion Act, all RTAs/FTAs contain provisions requiring each Party to effectively enforce its
141 PSU Report, p.91

81
environmental laws142. In order to promote mutually supportive trade and environmental policies, Canada has negotiated environment agreements in parallel to its FTAs which contain provisions requiring each Party to effectively enforce its environmental laws and to strive to continue to improve those laws. Since the endorsement of APEC EGS Program Framework in 2008, this new platform has been well exploited to promote an open dialogue on environmental policies and relevant regulatory development on EGS. Under the Framework, Canada, New Zealand and the United States have collaborated to organize workshops and launch the APEC EGS Information Exchange web tool143. Regarding domestic policies and regulations, economies have adopted unilateral measures to facilitate investment and trade in EGS. Australia lowered tariffs on EGS; Mexico consults with stakeholders on EGS issues; and Peru has laid out programs and strategies for environment-related sectors under the Environmental General Law.
(iii) Labor144 Several of the 2010 economies have included fundamental labor rights as one of the key aspects of the development of trade policy. Some have introduced legislation and other initiatives to ensure and enforce fundamental labor rights. Good examples are Australia’s Fair Work Act 2009, Japan’s Labor Standards Law and Employment Contracts Act, and Peru’s Mandatory Workers Registry initiative. In addition, reporting economies such as Peru, which enacted a new Labor Procedure Law in early 2010 making its labor judicial procedures more oral oriented and faster, have implemented measures to improve procedural guarantees and transparency for relevant judicial proceedings. As reported, economies have also promoted public awareness about fundamental labor rights through various educational programs and strategies. For example,
142 Ibid 143 Ibid. 144 The information in this section is mostly based on PSU Report, p.90-91, drafted according to the fact sheets submitted by the 2010 economies.

82
Australia has implemented the Fair Work Education and Information Program, Japan has more focused on vocational training and human resource development, and Peru utilizes mass media as a channel to increase publicity regarding fundamental labor rights. The United States’ RTAs/FTAs require parties to promote awareness of labor rights by ensuring that information concerning those rights is publicly available. New Zealand has reported the inclusion of similar provisions in its RTAs/FTAs. As reported, most 2010 economies are signatories to RTAs/FTAs with labor chapters, and in the case of the United States, its RTAs/FTAs require parties to enforce their labor laws with more recent agreements further requiring parties to adhere to the fundamental principles and rights of the International Labor Organization (ILO). In addition, many 2010 economies have concluded bilateral or multilateral Labor Cooperation Agreements (LCAs), which help to establish cooperation mechanisms that reflect the ILO rights and principles. Canada negotiates LCAs in parallel to most of its Free Trade Agreements to improve working conditions in the signatory countries, through a commitment to effectively enforce their own labor legislation, respect internationally-recognized labor rights and principles, and cooperate on labor matters.
(iv) E-commerce145 Technological developments have played an important role in the changing trade policy environment since the Bogor Goals were established in 1994. Electronic commerce (e-commerce) is widely seen as a key facilitator of international trade. Some of the 2010 economies have included a chapter on e-commerce in their FTAs. Since 2004, the United States has included a chapter on e-commerce in its FTAs in recognition of the economic growth and opportunity provided by e-commerce and the importance of avoiding unnecessary barriers to its use and development. In addition, the United States’ FTAs include chapters on e-commerce, which incorporate clauses to foster these activities, such as those related to electronic authentication and electronic signatures; the promotion of online consumer protection, including cooperation to enforce laws against fraudulent and deceptive
145 The information in this section is mostly based on PSU Report, p.91-92 drafted according to the fact sheets submitted by the 2010 economies.

83
commercial practices in e-commerce; paperless trading; and transparency by publishing or otherwise making available its laws, regulations and other measures pertaining to e-commerce. Japan also has increased its efforts in creating opportunities for e-commerce. In the Japan-Switzerland EPA, provisions have aimed to achieve non-discriminatory treatment of digital products and services, rules on market access, protection of online consumers, and paperless trade administration. Peru has included an e-commerce chapter in its FTAs as well. In particular, the e-commerce chapters of the FTAs between Peru and Canada, and Peru and United States contain the following disciplines that are included in Model Measures on E-Commerce: Authentication, Customs Duties, Transparency, Consumer Protection, Paperless Trade, Protection of Personal Information, and Cooperation. In Japan, domestic laws, regulations and guidelines have also promoted e-commerce. Some of these regulations include the Basic Act on the Formation of Advanced Information and Telecommunications Network Society; the Act on Specified Commercial Transactions; and the Interpretative Guidelines for Electronic Commerce, among others. The United States has participated actively in multilateral initiatives within APEC, OECD and WTO related to e-commerce. The United States has been a strong supporter in the WTO of the moratorium on e-commerce customs duties.
(v) Services and investment In Singapore, taxi industry, telecommunications market, postal services market and insurance and securities sectors of financial services were fully liberalized. With regard to investment, Singapore places no restrictions on foreign ownership of local operations with exceptions for national security purposes and in certain industries. Singapore has an “open-door” policy for foreign talent. Various entry schemes to meet business needs have been developed. For example, foreign entrepreneurs who are ready to start a new company/business and will be actively involved in the operation of the business can be given an employment pass with an initial validity period of up to 2 years under the EntrePass Scheme.

84
(vi) Ease of Doing Business146 In line with the APEC EoDB Action Plan, Chinese Taipei has simplified the procedures required to start a business. As a result, the number of steps required has been reduced by 25% (from 8 to 6 steps) and the amount of time needed has been reduced by 45% (from 42 to 23 days). In addition, minimum capital requirements have been eliminated, which has greatly reduced the cost of applying for and starting a business.
146 The information in this section was taken from PSU Report, p.92, based on the fact sheet submitted by Chinese Taipei.

85
Chapter 4 – Conclusion The data and analyses presented in this report reveal the significant progress made by the 2010 economies toward free and open trade and investment. But to fully and objectively evaluate APEC economies’ success in meeting their Bogor commitments, it is important to establish an appropriate context for this assessment. Since 1994, the year of the Bogor Declaration, APEC’s regional economic landscape has undergone profound transformation. Economies in our region, and across the world, are now more tightly interconnected than ever before. Businesses are more multinational in scope, tapping into supply chains that transcend traditional economic and geographic boundaries. The rise of the digital economy has also had a dramatic impact on international trade, allowing companies of all sizes access to global markets. As tariff rates and other border measures have fallen, global efforts to further liberalize trade and investment have increasingly focused not only on border measures but also on trade and investment facilitation and the reduction of non-tariff barriers. This trend is reflected in APEC’s evolving trade and investment agenda. In the past 15 years, financial crises, natural disasters and human conflict have had a disruptive effect on markets and in some cases interrupted trade and investment flows, even in areas geographically remote from the incidents themselves. To maintain its relevance without deviating from its core mission of trade and investment liberalization and facilitation, APEC has to respond to these events in a way that encourages openness without limiting opportunities to benefit from globalization. In this context, and taking into account the various developments in global circumstances, the evidence contained in this report supports the view that while more work remains to be done, the 2010 economies have made significant progress toward achieving the Bogor Goals.

86
1. Progress to Date Trade has Grown Since the Bogor Declaration, the overall growth in trade for all APEC economies has outstripped the rest of the world. From 1994 to 2009, APEC’s trade in goods with the world increased at an annualized rate of 7.1%, reaching US$5.6 trillion in exports and US$5.8 trillion in imports in 2009. Intra-APEC trade in goods nearly tripled in value over this period. Furthermore, the share of APEC’s trade with the rest of the world grew from 28% in 1994 to 33% in 2009. As well, the nominal value of commercial services of the APEC region increased at an annualized rate of about 7%, reaching a total of US$1.2 trillion in imports and exports in 2009. As a percentage of GDP in the APEC region, total exports of goods and services increased from 15.7% in 1994 to 26.5% in 2008. The Asia-Pacific is now the world’s fastest growing and most economically open region. Tariffs have Fallen In setting the Bogor Goals, APEC economies resolved to go further than WTO Uruguay Round commitments, reflecting their shared belief that open regionalism was the key to long-term growth. Since 1994, the 2010 economies have reduced their tariffs considerably. The simple average applied tariff rate for the 2010 economies fell from 8.2% in 1996 to 5.4% in 2008, well below the world average of 10.4 % in 2008. In 2008, 50% of imports by the 2010 economies entered duty free. Another important factor contributing to the tariff reduction has been the rapid growth in the number of bilateral and regional RTAs/FTAs in the Asia-Pacific region, meaning the effective tariff on all imports would be less than the overall average MFN applied rate. Services have Become Increasingly Important Since the Bogor Declaration in 1994, services have become a much more significant component of regional and global trade. APEC economies continue to make important progress to liberalize trade in services in ways that are consistent with the Osaka Action Agenda and commitments under the WTO General Agreement on Trade in Services (GATS). In addition, most of the 2010 economies have signed RTAs/FTAs with services chapters that go beyond GATS commitments. The 2010 economies have also opened up services markets through unilateral reforms of domestic policy and the implementation of international sectoral agreements.

87
Investment Links are Vital Despite volatility in the early 2000s, inflows of foreign direct investment (FDI) in the APEC region have increased by 13.0% per year since 1994 and outflows have grown by 12.7% annually. A key driver of this growth and continued investment liberalization in APEC has been the strong collective commitment to maintaining liberalized investment regimes. Indeed, the OECD reports that the 2010 economies all have “open” investment regimes, at varying degrees of liberalization. The number of bilateral investment treaties (BITs) and/or RTAs/FTAs in which the 2010 economies have ensured MFN and national treatment to foreign investment has increased from 160 in 1996 to 340 in 2009. Trade Facilitation Offers Great Benefits As tariffs have fallen, the relative potential gains from trade facilitation have increased. In this area, APEC economies have taken significant steps to streamline customs procedures, introduce paperless administration, facilitate cross-border movement of business people, and align standards and conformance procedures. In addition, APEC economies, under the APEC Trade Facilitation Action Plan, reduced trade transaction costs in the region by 5% from 2002 to 2006. APEC is also heading toward achieving an additional 5% reduction under the second Trade Facilitation Action Plan to be completed this year. Furthermore, APEC has started to collaborate with multilateral development banks in capacity building to promote trade facilitation and further contribution from them is welcomed. Economic and Technical Cooperation (ECOTECH) Since 1996, ECOTECH activities have helped to reduce technological gaps among its members, foster sustainable development, build institutional and human resource capacity, and achieve greater common prosperity through more than 1,200 ECOTECH projects totaling US$58 million. ECOTECH activities will continue to play an important role in assisting developing economies to achieve the Bogor Goals in 2020 and should be carried out in a strategic, demand-driven and goal-orientated manner.

88
2. More to Be Done The significant progress made by the 2010 economies toward free and open trade and investment do not mean their work is complete. As the international economy evolves to incorporate new technologies and modes of business, and responds to new economic opportunities and risks, APEC must continue to rise to this challenge. Important to meeting this continuing challenge is to explore, in 2011, an appropriate process to review APEC economies’ progress by APEC members towards the Bogor Goals of free and open trade and investment. With regard to tariffs, progress in lowering and eliminating tariffs has not been uniform across sectors. Tariffs on clothing, agricultural products, and textiles remain higher than the APEC's overall average tariff across all goods. As for services, there remain restrictions in sectors including, but not limited to, financial, telecommunications, transportation (including maritime and air transport); and audiovisual services (including radio and television broadcasting). Also, among the four different modes of service supply, more attention can be paid to the movement of business people (mode 4), which is the least liberalized. With regard to investment, almost all the 2010 economies still maintain, to varying degrees, sectoral investment restrictions in the form of prohibitions or capital ceilings in certain sectors, and some economies continue to apply, in addition to sectoral limitations, a general screening system for FDI. Stronger efforts are also needed to reduce the impact of non-tariff measures on trade. Areas for further work include standards and conformance, customs procedures, intellectual property rights, rules of origin and government procurement, along with other issues. APEC will also further address “behind-the-border” issues by facilitating structural reform including through the Ease of Doing Business (EoDB) initiative. With the above in mind, it is a fair statement to say that the 2010 economies have some way to go toward achieving free and open trade and investment and that the challenges laid out in the Bogor Goals in 1994 remain relevant today. APEC has achieved much since its inception and has evolved to become the paramount economic forum in the Asia-Pacific, the world’s most dynamic and open

89
economic region. Looking back at the past 15 years, the progress made by APEC in pursuing free and open trade and investment has reinforced the fact that the Bogor Goals should continue to provide direction for APEC’s work on trade and investment liberalization and facilitation. All APEC economies must maintain their individual and collective commitment to further liberalize and facilitate trade and investment by reducing or eliminating tariffs, restrictions on trade in services, and restrictions on investment, and promoting improvement in other areas including non-tariff measures.

90
LIST OF ABBREVIATIONS
ADB Asia Development Bank
CAP(s) Collective Action Plan(s)
DDA Doha Development Agenda
ECOTECH economic and technical cooperation
FDI foreign direct investment
GATS WTO General Agreement on Trade in Services
GATT WTO General Agreement on Tariffs and Trade
GDP gross domestic production
IAP(s) Individual Action Plan(s)
IFAP Investment Facilitation Action Plan
MFN most-favored-nation
MTST Mid-Term Stocktake of Progress Towards the Bogor Goals
OAA Osaka Action Agenda
OECD Organisation for Economic Cooperation and Development
PSU APEC Policy Support Unit
RTAs/FTAs regional trade agreements and free trade agreements (or regional and
bilateral free trade agreements)
TFAP Trade Facilitation Action Plan
UNCTAD United Nations Commission for Trade and Development
WTO World Trade Organization

91
REFERENCES Asia Development Bank (ADB), Office of Regional Economic Integration (2010), Assessing Progress Made Toward Bogor Goals- Business Perspectives on FTAs among East Asian APEC Members. APEC, StatsAPEC – Key Indicators Database. (reproduced in APEC PSU (2010)) APEC (1994), APEC Economic Leaders’ Declaration of Common Resolve. APEC, The Osaka Action Agenda: Implementation of the Bogor Declaration (updated in 2002). APEC (2005), A Mid-Term Stocktake of Progress Towards the Bogor Goals: Busan Roadmap to the Bogor Goals. APEC (2009), The 21st APEC Ministerial Meeting Joint Statement. APEC Economic Committee (2008), APEC Economic Policy Report 2008. APEC Economic Committee (2009), APEC Economic Policy Report 2009. APEC Individual Action Plan: Australia (2008), Canada (2003, 2007, 2009), Japan (2009), Korea (2006), Mexico (2008, 2009), New Zealand (2006), Peru (2007), Singapore (2009), Chinese Taipei (2009) and United States (2009). (reproduced in APEC PSU (2010)) APEC Individual Action Plan Peer Review Reports: Australia (2007), Canada (2008), Chile (2008), Hong Kong, China (2007), Japan (2007), Korea (2007), Malaysia (2009), Mexico (2008), Peru (2008), Singapore (2008), Chinese Taipei (2007), United States (2007, 2008). (reproduced in APEC PSU (2010)) APEC Policy Support Unit (PSU) (H. Lee and J. Hur, 2009), Trade Creation in the APEC Region: Measures of the Magnitude of and Changes in Intra-Regional Trade since APEC’s Inception. (reproduced in APEC PSU (2010))

92
APEC Policy Support Unit (PSU) (2010), Progressing towards the APEC Bogor Goals –Perspectives of the APEC Policy Support Unit. Armstrong, S. and P. Drysdale (2009), The influence of economics and politics on the structure of world trade and investment flows, Crawford School of Economics and Government; Australian National University. Baldwin R. E. (1970), Non-Tariff Distortions of International Trade. Washington, DC: The Brookings Institution. (reproduced in Pasadila and Liao (2006), and APEC PSU (2010)) Chinese Taipei, Bureau of Foreign Trade, online database. (reproduced in APEC PSU (2010)) Chinese Taipei, Directorate-General of Budget, Accounting and Statistics (DGBAS). (reproduced in APEC PSU (2010)) Czaga, P. (2004), Analysis of Non-Tariff Measures: The Case of Prohibitions and Quotas, OECD Trade Policy Working Papers, No.6, OECD Publishing. Deardorff A. and R. Stern (1997), Measurement of Non-Tariff Barriers, OECD. (reproduced in APEC PSU (2010)) Dihel, N. and B. Shepherd (2007), Modal Estimates of Services Barriers, OECD Trade Policy Working Papers, No. 51, OECD Publishing. (reproduced in APEC PSU (2010)) Estevadeordal A. and M. Shearer (2010), APEC and Progress Toward Bogor Goals, Integration and Trade Sector of the Inter-American Development Bank. Estevadeordal A., M. Shearer, and K. Suominen (2008), Multilateralizing RTAs in the Americas: State of Play and the Way Forward, Inter-American Development Bank. (reproduced in APEC PSU (2010)). Grosso, M. and B. Shepherd (2009), Liberalising Air Cargo Services in APEC, Working Paper, The Groupe d’Economie Mondiale (GEM) at Sciences Po.

93
(reproduced in APEC PSU (2010)) Gwartney J., R. Lawson, H. Grubel, J. De Haan, J. Sturm, and E. Zandberg (2009), Economic Freedom of the World: 2009 Annual Report, Vancouver, BC: The Fraser Institute. 2009 dataset retrieved from www.freetheworld.com. Helbe, Shepherd, and Wilson (2007), Transparency and Trade Facilitation in the Asia Pacific: Estimating the Gains from Reform, World Bank. Heydon, K. and S. Woolcock (2009), The Rise of Bilateralism: Comparing American, European and Asian Approaches to Preferential Trade Agreements, United Nations University Press. (reproduced in APEC PSU (2010)) International Labour Organisation (ILO), Key Indicators of the Labour Market (KILM) 6th Edition online database. (reproduced in APEC PSU (2010)) International Monetary Fund (IMF), Direction of Trade Statistics (DOTS) database. (reproduced in APEC PSU (2010)) Oragnisation for Economic Co-operation and Development (OECD) (2010), Progress Towards Trade and Investment Liberalisation by Industrialised APEC Economies. Pasadilla G. and C. Liao (2006), Non-Tariff Measures Faced by Philippine Agricultural Exports, East Asian Journal of Agriculture and Development, Vol. 3, No. 1 & 2, January/December. (reproduced in APEC PSU (2010)) Roy, M., J. Marchetti, and H. Lim (2006), Services Liberalization in the New Generation of Preferential Trade Agreements (PTAs): How Much Further than the GATS?, World Trade Organization, Economic Research and Statistics Division, Staff Working Paper ERSD-2006-07. (reproduced in APEC PSU (2010)) United Nations Conference on Trade and Development (UNCTAD), Foreign Direct Investment Statistics online database. (reproduced in APEC PSU (2010)) United Nations Conference on Trade and Development (UNCTAD), Trade Analysis Information System (TRAINS) online database. (reproduced in APEC PSU (2010))

94
United Nations Conference on Trade and Development (UNCTAD) (2010), Assessment of Liberalization and Facilitation of FDI in Thirteen APEC Economies. United Nations Development Programme (UNDP), Human Development Index (HDI) trends and indicators (1980-2007) online data file. (reproduced in APEC PSU (2010)) University of Southern California Marshal School of Business (2008), Non-Tariff Barriers to Trade in the APEC Region: When Non-Tariff Measures Become Non-Tariff Barriers – Insight from Agriculture and Accounting (commissioned by ABAC). World Intellectual Property Organization (WIPO), WIPO Statistics Database, December 2009. World Bank, Logistics Performance Indicators (reproduced in OECD (2010)) World Bank, World Development Indicators (WDI) online database. (reproduced in APEC PSU (2010)) World Bank, World Trade Indicators 2009/2010. World Bank (2008), East Asia Preferential Trade Agreements in Services: Liberalization Content and WTO Rules, World Trade Review, 7:4, p.641-673. (reproduced in APEC PSU (2010)) World Bank (2008a), A Survey of Non-tariff Measures in the East Asia and Pacific Region: Policy Research Report. (reproduced in APEC PSU (2010)) World Trade Organization (WTO), Tariff Download Facility online database. (reproduced in APEC PSU (2010)) World Trade Organization (WTO), Time Series on International Trade database. (reproduced in APEC PSU (2010))

95
World Trade Organization (WTO) (2009), World Tariff Profiles 2009. WTO Secretariat (2010), WTO Secretariat’s Note: “APEC: The Bogor Goals”. WTO Secretariat, Trade Policy Review, Revision on Australia (2007), Canada (2000, 2007), Chile (2009), Hong Kong, China (2007), Republic of Korea (2008), Malaysia (2010), Mexico (2008), New Zealand (2009), Peru (2007), Singapore (2008) and United States (2008). (reproduced in APEC PSU (2010))

Annex 1 The 2010 Bogor Assessment has been conducted basically in accordance with the outline below and consistent with the “Work Plan of the Assessment on Achievement of the Bogor Goals by the APEC industrialized Economies” (2009/AMM/012). This Work Plan was endorsed at the AMM in Singapore, although occasional adjustments were needed mainly to seek a consensus among APEC economies.
Timeline Tasks By the end of January, 2010
- Japan, in consultation and coordination with the PSU (Policy Support Unit) and APEC economies, to develop template of the fact sheet to be submitted by the industrialized economies.
- PSU to distribute fact sheet templates. - The industrialized economies to fill in the templates of the fact sheets on their
trade and investment liberalization and facilitation efforts as they relate to the achievement of the Bogor Goals, drawing from their recent IAPs and annual updates, as well as the MTST Reports.
- The PSU to compile the fact sheets submitted by the industrialized economies
and provide them to Japan and other economies and submit the PSU Report.
2009 AELM - 2010 SOM (Senior Officials’ Meeting) 1
- In conjunction with the ISOM, Japan to hold an open seminar to involve non-governmental experts, and SOM to engage in a dedicated dialogue with the ABAC on progress towards the Bogor Goals.
- Experts from ABAC, the Pacific Economic Cooperation Council (PECC), and the
APEC Study Centers Consortium to the open seminar to participate in the open seminar. Experts from multilateral agencies such as the Asian Development Bank, the Inter-American Development Bank, the World Bank, and the United Nations Conference on Trade and Development also to participate.
- Japan to draft an assessment report on the achievement of the Bogor Goals
based on the documents submitted by the PSU and the results of the open seminar and dialogue with ABAC.
2010 SOM1 – SOM2 - Japan to present the first draft of the assessment report for discussion.
- Based on the discussion at the SOM 1 and the following comments from APEC
economies, Japan to further develop the assessment report, while considering inputs from relevant international agencies, ABAC and PECC as well as non-governmental experts.
2010 SOM2 and MRT (Meeting of Ministers Responsible for Trade)
- After reaching a consensus, SOM to submit the assessment report to MRT for their review and possible consensus.
2010 MRT – 2010 CSOM - SOM to update the assessment report as appropriate.
2010 AMM/AELM - The assessment report to be submitted to APEC Ministers and Leaders for their
review and endorsement.

Annex 2 Actions Taken toward Achievement of the Bogor Goals
1. Osaka Action Agenda in 1995 and Manila Action Plan for APEC in 1996
(including Individual Action Plans (IAPs) and Collective Action Plans (CAPs)) In order to meet APEC's Bogor Goals for free and open trade and investment in Asia-Pacific, APEC member economies has followed the strategic roadmap as agreed by APEC Economic Leaders in Osaka, Japan in 1995 and updated in 2001 and 2002. This roadmap is known as the Osaka Action Agenda (OAA).1 The OAA provides a framework for meeting the Bogor Goals through trade and investment liberalization, business facilitation and sectoral activities, underpinned by policy dialogues and economic and technical cooperation. As part of this framework, a set of general principles (comprehensiveness; WTO consistency; comparability; non-discrimination; transparency; standstill; simultaneous start, continuous process, and differentiated time tables; flexibility; cooperation; and relevance, progressiveness and effectiveness) have been defined for member economies as they proceed through the APEC liberalization and facilitation process.2 In accordance with these general principles, the OAA also provides objectives and actions to be taken to achieve the objectives in fifteen specific areas: tariffs; non-tariff measures; services; investment; standards and conformance; customs procedures; intellectual property; competition policy; government procurement; deregulation/regulatory review; implementation of WTO obligations including rules of origin; dispute mediation; mobility of business people; information gathering and analysis; and strengthening economic legal infrastructure. In 1996, APEC Economic Leaders endorsed the Manila Action Plan for APEC (MAPA) containing the individual and collective initiatives in fulfillment of the voluntary commitment to implement the OAA. The MAPA contains the first steps of an evolutionary process of progressive and comprehensive trade and investment liberalization and facilitation toward achieving the Bogor Goals by 2010/2020, in accordance with the OAA. It consists of three parts: individual action plans; collective action plans; and joint activities on economic and technical cooperation.
1 APEC website (http://www.apec.org/content/apec/about_apec/how_apec_operates/action_plans_.html) 2 The Osaka Action Agenda (2002 update), 2002

APEC member economies report progress toward achieving free and open trade and investment goals through IAPs and CAPs, submitted to APEC on an annual basis. IAP is a record of actions taken to meet its stated goals for free and open trade and investment. APEC member economies set their own timelines and goals, and undertake these actions on a voluntary and non-binding basis. Reporting is based on fifteen areas specified in the OAA and additional four areas: Free Trade Agreements (FTAs) and Regional Trade Agreements (RTAs); transparency; APEC food system; and trade facilitation. CAPs detail the collective actions of all APEC member economies in the fifteen issue areas outlined in the OAA and are intended to progress activity in each area, as well as to provide a means of monitoring and reporting the achievement of objectives.3 Each year, several APEC member economies volunteer to have their IAPs reviewed through a Peer Reviews process. In 2002, a more objective and transparent Peer Review process was introduced, which is essentially consultations between APEC member economies to continually improve IAPs. New elements such as formal review teams for peer review exercises, experts conducting independent in-economy research and analysis and the involvement of an independent private sector body, ABAC, were introduced into the process that was first introduced in 1997.4 2. Shanghai Accord in 2001 While struggling with difficulties caused by the Asian financial crisis that broke out in late 1997, APEC consistently continued its efforts to achieve the Bogor Goals with its increasing awareness of necessity of responding and adapting to changes in the global and regional economy. A highlight was the Shanghai APEC Economic Leaders’ meeting in 2001 where they gathered to recognize that as APEC entered its second decade since its inception in 1989, it needed to enrich, update and sharpen its vision for the future and, in this respect, Leaders envisioned that APEC's objectives in the second decade were to make continuous progress in achieving the Bogor Goals; deepen the spirit of community by sharing the benefits of growth more widely and equitably; and build APEC into a closer, stronger partnership for regional economic cooperation.
3 Manila Action Plan for APEC, 1996 4 APEC Electronic Individual Action Plan (e-IAP) (http://www.apec-iap.org/peerReview/)

To this end, Leaders announced the Shanghai Accord in 2001 as a strategic, forward looking agenda for the development of APEC in the subsequent years. The Accord was committed to broadening APEC’s vision for the future by identifying a conceptual and policy framework to guide APEC in the new century; clarifying APEC's roadmap for achieving the Bogor Goals on schedule with a mid-term stocktake of the overall progress in 2005, including by broadening and updating the OAA, adopting a pathfinder approach in advancing selected APEC initiatives toward achieving the Bogor Goals, promoting the adoption of appropriate trade policies for the New Economy, following up on the APEC Trade Facilitation Principles, pursuing greater transparency in economic governance; and strengthening APEC’s implementation mechanism by strengthening the IAP Peer Review process, reinforcing ECOTECH and capacity building efforts.5 3. Update of the OAA Taking into account developments and changes since 1995, a comprehensive approach in reviewing and building upon the OAA guidelines was adopted at MRT in 2000. In accordance with the approach, the revision of the OAA was carried out several times during 2000 through 2002 and then the broadened OAA, which reflects the strong commitment to the achievement of the Bogor Goals, was endorsed by Leaders in 2002, while responding to changes in the global and regional economy. 4. Mid-Term Stocktake and Busan Roadmap in 2005 and Ha Noi Action Plan in
2006 In 2001, APEC Leaders commissioned an assessment to measure progress toward achieving the Bogor Goals and to reveal actions necessary to assist economies in reaching their target. To this end, “The Mid-term Stocktake of Progress Towards the Bogor Goals” (MTST) report endorsed by Ministers in 2005 was based on input provided by all of 21 APEC member economies and analyzed by independent trade and economic experts. The report found that the Bogor Goals remain as relevant today as when first agreed by APEC Leaders in 1994, with member economies having achieved significant progress in trade and investment liberalization and facilitation.6 5 APEC Economic Leaders’ Declaration, Shanghai, China, 21 October 2001 6 APEC website (http://www.apec.org/content/apec/news_media/fact_sheets/200908fs_midterm_stocktake.html)

The MTST recognized the importance of the commitment of the Bogor Goals. It stressed the fact that the goal of free and open trade and investment should not be interpreted in a finite or static manner. In this regard, the MTST made clear that in terms of the achievement of the Bogor Goals, the facilitation and behind-the-border issues are as important as the issues related to trade and investment liberalization. The MTST also referred to the constructive role played by WTO-consistent and high-quality RTAs/FTAs in contributing toward the Bogor Goals, noting they can have a positive effect on trade liberalization by demonstrating the advantages of opening markets. Based on the outcomes of the MTST, APEC Economic Leaders endorsed the Busan Roadmap to the Bogor Goals in order to respond to new challenges that emerged from the evolving international trade environment and to reach the Bogor Goals by the declared timelines. It stressed “The Stocktake has demonstrated that for APEC to remain relevant, it must be prepared to evolve in a dynamic and responsive way to today’s more complex and integrated business environment and the changing trade and investment landscape. APEC will continue to support trade and investment liberalization through multilateral, regional and bilateral trade agreements. … In addition, it sees significant benefit in devoting increased attention to comprehensive business facilitation with particular focus on behind-the-border issues.” The Busan Roadmap emphasizes the support for the multilateral trading system; the strengthening collective and individual actions; the promotion of high-quality RTAs /FTAs; the Busan Business Agenda; a strategic approach to capacity building; and the pathfinder approach.7 To implement the Busan Roadmap toward the Bogor Goals, Leaders endorsed the Hanoi Action Plan in 2006, which is comprised of specific measures, schedules, and capacity building initiatives.8
5. TFAP I (2002-2006), TFAP II (2007-2010) and IFAP (2008-2010)
7 APEC Economic Leaders’ Declaration, Busan, Korea, 18-19 November 2005 8 APEC Economic Leaders’ Declaration, Ha Noi, Viet Nam 18-19 November 2006

The Bogor Declaration also refers to the importance of implementing facilitation programs to complement efforts in trade and investment liberalization. In this context, APEC has been encouraging member economies to put into practice trade and investment facilitation measures. The endorsement of the APEC Trade Facilitation Action Plans (TFAP I and II) and the Investment Facilitation Action Plan (IFAP) represent important pillars toward the achievement of the Bogor Goals. TFAP I was an attempt to better focus and coordinate the APEC’s trade facilitation work. Based on APEC’s Trade Facilitation principles, the plan formally responded to a call by Leaders in Shanghai in 2001 for member economies to achieve a reduction in trade transaction costs by 5% across the APEC region between 2002 and 2006 as a contribution to the Bogor Goals. TFAP I consisted of a menu of actions and measures to reduce transaction costs and simplify administrative and procedural requirements over a specified time. At the completion of TFAP I, APEC economies had selected over 1,400 actions and measures in total, of which over 62% had been completed and APEC Leaders welcomed the achievement of the 5% reduction target at their meeting in Hanoi in 2006.9 TFAP II responded to a call by APEC Leaders at their Meeting in Busan 2005 for a further reduction of trade transaction costs by 5% in the period 2007-2010. A major component of the plan was an updated and revised menu of actions and measures for member economies’ consideration from the four areas of Customs Procedures, Business Mobility, Standards and Conformance and Electronic Commerce as developed for TFAP I. The APEC Policy Support Unit recently completed an interim assessment on TFAP II, however, the initial estimations of the changes in trade transaction costs are currently under review in light of the revisions to the underlying and detailed Trading Across Borders data from the World Bank. This section is going to be updated after this review is finalized. The IFAP was endorsed by MRT in 2008 to improve the investment environment in the region. The main aims of the IFAP are to strengthen regional economic integration, strengthen the competitiveness and sustainability of economic growth of APEC’s member economies, expand prosperity and employment opportunities in the
9 APEC 2007/MRT/004

APEC region, and make further progress toward achievement of the Bogor Goals.10 Currently, Key Performance Indicators (KPIs) for measuring progress in the effectiveness of implementing IFAP are under discussion. In this sense, the outcomes of the actions listed in IFAP will be assessed with the assistance of the KPIs. 6. Structural Reform In 2003, APEC Economic Leaders agreed to accelerate structural reform in the APEC region and reiterated APEC’s strong political commitment to continued structural reform to ensure sustainable economic growth and development in the Asia-Pacific region. To reaffirm the political commitment and demonstrate leadership to further promote structural reform in the APEC region, APEC Economic Leaders adopted the Leaders’ Agenda to Implement Structural Reform (LAISR) in 2004 and the APEC Work Plan on Leaders’ Agenda to Implement Structural Reform toward 2010 (LAISR 2010) in 2005. The agenda covers five areas for structural policy reform: regulatory reform, competition policy, public sector governance, corporate governance, and strengthening economic and legal infrastructure. In 2007, APEC Economic Committee (EC) developed a detailed and ambitious forward work program covering each of the five themes. In 2008, the first APEC Ministerial Meeting on Structural Reform was held in furtherance of the LAISR. In 2010, the EC conducted a stock-take exercise of the LAISR activities which identified progress in APEC and member economies (see also “Taking Stock of the Progress in the LAISR Initiative and Structural Policies in APEC Economies” for more details). Also, with the aim of better facilitating structural reform in the current context, the EC adopted a new set of reformulated priority areas, namely, competition policy, corporate law and governance, EoDB (Ease of Doing Business), public sector governance, and regulatory reform. The Competition Policy and Law Group was retained as an expert group. Furthermore, based on the significant progress of the LAISR, APEC decided in 2010 to extend the range of the structural reform agenda and implement, under the leadership of Senior Officials, the “APEC New Strategy for Structural Reform 10 APEC 2008/MRT/R/004

(ANSSR)” which encompass the following areas: more open, well-functioning, transparent and competitive markets as pursued under the LAISR; better functioning and effectively regulated financial markets; labor market opportunities, training and education; sustained SME development and enhanced opportunities for women and for vulnerable populations; and effective and fiscally sustainable social safety net programs.