the republic of uganda...local currency unit = ugandan shilling (ugx) 1 pound = 4,368 ugx, march,...
TRANSCRIPT
UGANDA PUBLIC EXPENDITURE AND FINANCIAL ACCOUNTABILITY (PEFA)
ASSESSMENT 2016
30th December 2017
THE REPUBLIC OF UGANDA
UGANDA PUBLIC EXPENDITURE AND FINANCIAL ACCOUNTABILITY(PEFA) ASSESSMENT 2016
i
UGANDA PUBLIC EXPENDITURE AND FINANCIAL
ACCOUNTABILITY (PEFA) ASSESSMENT 2016
30th December 2017
Currency and indicative exchange ratesLocal currency unit = Ugandan Shilling (UGX)
1 Pound = 4,368 UGX, March, 2017)
1 EURO = 3,793 UGX (March, 2017)
1 US dollar = 3,595 UGX (March 2017)
Fiscal Year: 1 July to 30 June
THE REPUBLIC OF UGANDA
UGANDA PUBLIC EXPENDITURE AND FINANCIAL ACCOUNTABILITY(PEFA) ASSESSMENT 2016
ii
PEFA assessment report of the Republic of Uganda, December 2017
The quality assurance process followed in the production of this report satisfies all the requirements of the PEFA Secretariat and hence receives the ‘PEFA CHECK’.
PEFA Secretariat
January 23, 2018
UGANDA PUBLIC EXPENDITURE AND FINANCIAL ACCOUNTABILITY(PEFA) ASSESSMENT 2016
iii
Table of Contents Abbreviations and Acronyms..................................................................................................................vPreface...................................................................................................................................................viiExecutive Summary..............................................................................................................................viii
1. Introduction......................................................................................................................11.1 Rationale and purpose................................................................................................11.2 Assessment management and quality assurance........................................................21.3 Assessment methodology..........................................................................................2
2. Country Background information...........................................................................................42.1 Fiscal and budgetary trends........................................................................................52.3 Legal and regulatory arrangements for PFM................................................................72.4 Institutional arrangements for PFM............................................................................82.5 Other important features of PFM and its operating environment..............................13
3. Assessment of PFM performance..........................................................................................143.1 Budget Reliability......................................................................................................15
PI-1 Aggregate expenditure out-turn..................................................................................15PI-2 Expenditurecompositionout-turn................................................................................15PI-3 Revenue out-turn..........................................................................................................17
3.2 Transparency of public finances................................................................................17PI-4 Budget classification...................................................................................................19PI–5 Budget documentation................................................................................................20PI–6 Centralgovernmentoperationsoutsidefinancialreports............................................22PI–7 Transferstosub-nationalgovernments........................................................................24PI–8 Performanceinformationforservicedelivery...............................................................26PI-9 Publicaccesstofiscalinformation................................................................................29
3.3 Management of assets and liabilities........................................................................30PI-10Fiscalriskreporting.......................................................................................................31PI-11 Public investment management..................................................................................33PI-12 Public asset management.............................................................................................34PI-13 Debt management.......................................................................................................36
3.4 Policy-based fiscal strategy and budgeting..................................................................37PI-14Macroeconomicandfiscalforecasting........................................................................38PI-15Fiscal strategy..............................................................................................................40PI-16Mediumtermperspectiveinexpenditurebudgeting..................................................41PI-17Budget preparationprocess........................................................................................43PI-18Legislativescrutinyofbudgets......................................................................................45
UGANDA PUBLIC EXPENDITURE AND FINANCIAL ACCOUNTABILITY(PEFA) ASSESSMENT 2016
iv
3.5 Predictability and control in budget execution...........................................................45PI-19 Revenue Administration..............................................................................................51PI-20 Accounting for Revenue..............................................................................................53PI-21 Predictability of in-year resource allocation..............................................................55PI-22 Expenditure arrears......................................................................................................57PI-23 Payroll controls............................................................................................................60PI-24 Procurement management.........................................................................................63PI-25 Internal controls on non-salary expenditure.............................................................65
3.6 Accounting and reporting.........................................................................................65PI-26 Internal Audit...............................................................................................................67PI-27Financialdataintegrity.................................................................................................68PI-28 In-yearbudgetreports..................................................................................................71PI-29Annual financial reports..............................................................................................73
3.7 External Scrutiny and audit......................................................................................73PI-30ExternalAudit...............................................................................................................76PI-31Legislative scrutiny of audit reports...........................................................................77
4 Conclusions on the analysis of PFM systems.........................................................................794.1 Integrated assessment across the performance indicators.........................................794.2 Effectiveness of the internal control framework........................................................824.3 Strengths and weaknesses of PFM.............................................................................834.4 Performance changes since previous assessment.....................................................84
5 Government PFM reform process.........................................................................................855.1 Overall approach to PFM reform...............................................................................855.2 Recent and on-going reform actions.........................................................................855.3 Institutional considerations.......................................................................................86
Annex 1 Performance Indicator Summary........................................................................................88Annex 2 Summary of findings on the internal control framework.................................................95Annex 3A Source of information..........................................................................................................97Annex 3B People consulted.................................................................................................................99Annex 3C List of documents/reports and departments consulted...................................................102Annex 3D Dimension PI-2 and PI-3 calculations..............................................................................106Annex 4 Comparison of PEFA Scores 2012 and 2016...................................................................114Annex 5 Disclosure of quality assurance arrangements.................................................................120
UGANDA PUBLIC EXPENDITURE AND FINANCIAL ACCOUNTABILITY(PEFA) ASSESSMENT 2016
v
Abbreviations and AcronymsAFS Annual Financial StatementsAG Accountant GeneralAGA Autonomous Government AgencyAGD Accountant General’s DepartmentASYCUDA Automated System for Customs DataBCC Budget Call CircularBoU Bank of UgandaC&E Customs and ExciseCF Contingencies FundCoA Chart of AccountsCOFOG Classification of the Functions of GovernmentCPA Country Poverty AssessmentCSBAG Civil Society Budget Advocacy GroupDFID UK Department for International DevelopmentDMS Debt Management StrategyEC European CommissionEPR Economic Performance ReportFS Financial SecretaryFY Fiscal YearGDP Gross Domestic ProductGFS Government Finance StatisticsGFSM Government Financial Statistics ManualGoU Government of UgandaGPRS Growth and Poverty Reduction StrategyGSPS Growth and Social Protection StrategyIFMS Integrated Financial Management SystemIMC Internal Monitoring CommitteeINTOSAI International Organisation of Supreme Audit InstitutionsIPPS Integrated Personnel and Payroll SystemIPSAS International Public Sector Accounting StandardsIRD Internal Revenue DepartmentIT Information TechnologyKCCA Kampala Capital City AuthorityKPI Key Performance IndicatorsLMTP Large Medium Tax PayersMDA Ministry, Department, AgencyMoES Ministry of Education and SportsMoH Ministry of HealthMoFPED Ministry of Finance, Planning and Economic DevelopmentMoP Ministry of Public ServiceMTEFO Medium Term Macroeconomic and Fiscal Outlook Framework
UGANDA PUBLIC EXPENDITURE AND FINANCIAL ACCOUNTABILITY(PEFA) ASSESSMENT 2016
vi
NDP National Development PlanNSSF National Social Security FundOBT Output Based Budgeting ToolOAG Office of the Auditor General PAC Public Accounts CommitteePBB Performance Based BudgetingPE Public Enterprise PEFA Public Expenditure and Financial AccountabilityPEMCOM Public Expenditure Management Committee PFM Public Finance ManagementPPDA Public Procurement and Disposal of Public Assets AuthorityPPP Public Private PartnershipPRAM Priority Reform Action Matrix PS/ST Permanent Secretary/Secretary to the TreasuryPSC Public Service CommissionPSIP Public Sector Investment ProgramSNG Sub-National GovernmentSO Standing OrderSOE State Owned EnterpriseTA Technical AssistanceTSA Treasury Single AccountURA Uganda Revenue Authority
UGANDA PUBLIC EXPENDITURE AND FINANCIAL ACCOUNTABILITY(PEFA) ASSESSMENT 2016
vii
PrefaceIn response to a request from the Government of Uganda, a DFID consultancy team comprising Mr. Paul Harnett (international lead), Ms. Sharon Hanson-Cooper (international), Mr. David Nsubuga (local) and Mr. Evarist Mwesigye (local)1, carried out a PEFA assessment during the period October 2016 to January 2017.
Between 10th and 14th October 2016, Paul Harnett delivered training on the PEFA methodology to a wide range of stakeholders, both at executive and technical levels. The main fieldwork was carried out by the full assessment team between 7th and 18th November. During the assessment, the mission team met with officials from the Ministry of Finance, Planning and Economic Development (MoFPED) as well as a number of Ministries, Departments and Agencies (MDAs), the External Auditor (Office of the Auditor General) and a number of independent bodies. The mission also conversed with representatives of the Public Accounts Committee and Finance Committee. A full list of the persons consulted is provided in Appendix 3 of this report. The assessment also benefited from substantial docu 0mentary review and evidence. A full list of documents reviewed is provided in Annex 3C.2
The mission expresses its gratitude to the authorities, led by Keith Muhakanizi, the Permanent Secretary/Secretary to the Treasury, and managed by Lawrence Semakula, the Accountant General. The mission recognizes Ms. Bernadette Nakabuye Kizito, Senior Financial Management Specialist, Accountant General’s Office, and FINMAP III secretariat, for her assistance in the preparation and conduct of the assessment; the highly appreciated support in the day-to-day organization and logistical requirements of the mission; and, for her assistance in data generation.
The mission would also like to thank all staff of the GoU who provided access to data, documentation and answered our many questions, in particular, the Accountant General’s Office, the Budget Department, the Macro Policy Department, the Debt Unit, and the Uganda Revenue Authority.
1. Contact details of the Assessment Team: Paul Harnett ([email protected]), Sharon Hanson-Cooper ([email protected]), David S. Nsubuga, and ([email protected]) Evarist Mwesigye ([email protected]).
2. An initial draft was sent to the authorities and donor group and a draft including the response to comments was sent to the PEFA Secretariat who supplied further comments. These comments were addressed by requesting additional data where required from the authorities. A matrix of comments and responses was also provided to the Oversight Team.
UGANDA PUBLIC EXPENDITURE AND FINANCIAL ACCOUNTABILITY(PEFA) ASSESSMENT 2016
viii
Executive Summary The purpose of this PEFA assessment is to provide an objective analysis of the present performance of the PFM system in Uganda against the PEFA indicators. This PEFA provides an update of progress in PFM in Uganda since the last PEFA in 2012 and establishes a new PEFA baseline using the 2016 PEFA methodology. As Uganda has been the recipient of significant technical assistance to support enhancement of many elements of its PFM system, it is now an appropriate time to take stock of overall progress.
The assessment covered expenditures by central government, budgetary units and revenues collected by government. Revenue collected by the Uganda Revenue Authority and National Social Security Fund (NSSF) was included in the examination of revenue administration. Extra-budgetary units and local government were included in terms of indicators 6 and 7 relating to central government operations outside financial reports and transfers to local government. The full assessment team was together in Uganda from November 7th to 18th 2016 (time of fieldwork for the assessment). The financial years covered for indicators that required assessing over three years are 2013-14 to 2015-16. 2015-16 is the latest completed financial year.
Overall, the results of the PEFA show that public financial management systems in Uganda are strong and reforms have improved systems as the PFM Reform Action Plan has been operationalized. However, there are notable weaknesses in aspects of risk management and sectors’ strategies linked to multi-year budgeting. The budget process, which has evolved with macro-economic and fiscal forecasting and strategy, and strong budget preparation processes with a fiscal framework, are a positive start. Aggregate revenue forecasting has improved significantly since the previous PEFA in 2012 and the revenue agencies have developed effective processes and procedures, which impact on the execution of the budget, though estimates for each revenue category are not completely accurate. On the expenditure side, Government has made efforts to clear expenditure arrears, such as use of prepayments for utilities, a commitment control system now embedded in the IFMS, as well as additional budget provisions to clear the stock of arrears in government. Nevertheless, arrears continue to grow and are high as a percentage of expenditure, indicating the need for even greater controls.
Good information on budget execution is readily available to decision makers. A key lesson from the recent global financial crisis is that risks in the PE, AGA and SNG sectors require careful management. Monitoring the operations, finances, and thus risks, associated with the statutory bodies and SOEs has improved, and is essential for managing such risks in Uganda. A performance management framework for SOEs is yet to be developed and would be essential in driving internal efficiency and supporting accountability.
External audit is an area of significant strength. The Office of the Auditor General is active in carrying out financial and compliance audits. It adopts auditing standards to govern its work with audit plans and strong staff development programs. External scrutiny of audit reports by the Public Accounts Committee is not up-to-date, implying the accountability cycle remains incomplete with a number of Treasury Memorandums unissued.
UGANDA PUBLIC EXPENDITURE AND FINANCIAL ACCOUNTABILITY(PEFA) ASSESSMENT 2016
ix
Aggregate Fiscal DisciplineAggregate fiscal discipline is achieved through control over spending during budget execution, as well as realistic revenue forecasts. Strong revenue administration ensures that revenues are efficiently collected. The planned budget on an aggregate basis is not unduly circumvented by the use of virement and supplementary budgets though there are weaknesses revealed by the large number of in-year transfers between sectors and economic categories, revealed by the supplementary budget reallocations. Treasury operations and cash management enables expenditures to be managed within the available resources but there are arrears. However, control of contractual commitments is not sufficiently effective, creating a risk of generating further expenditure arrears. The strong external audit function (monitoring past performance) enhances fiscal discipline, with some follow up by the executive.
Strategic allocation of resourcesThere is a strong emphasis on the overall fiscal framework. The Chart of Accounts caters for a multi-dimensional analysis of expenditure. However, the link between the medium term perspective in expenditure budgeting and strategic plans such as the NPA and sector strategies needs to be further developed to improve the strategic allocation of resources.
Efficient use of resources for service deliveryThe current weaknesses in competitive bidding in the procurement system could have adverse implications for the efficiency in service delivery. The strengths in the accountability mechanisms – such as the comprehensiveness and issuing of annual financial statements - make external audits effective as counter checks on inefficient use of resources. Publishing performance targets and outcomes also assists with efficient use of resources, though lack of systematic program evaluation and data on resources available at service delivery units can undermine accountability. Such information would help management decision making to support improved service delivery. On the revenue side, operational efficiency is compromised by the accumulation of tax arrears. Lack of effective tax debt collection undermines credibility of tax assessments and the principle of equal treatment of taxpayers. The introduction of arrears write-off legislation would afford the opportunity to clean up tax arrears and make them current.
Performance changes since previous assessmentWhile the PEFA has been carried out using the 2016 methodology, it has been possible to score against the 2011 PEFA methodology, which was used in the previous PEFA assessment of Uganda. Across the 71 individual indicator dimensions compared, there has been an improvement in 21 dimensions, deterioration in 6, and no change identifiable in 44 dimensions.
The comparison of the assessments indicates that between the two PEFAs credibility has improved as revenues are now well in line with budget estimates. There have also been improvements in the orderliness and participation in the budget process, as well as multi-year fiscal forecasts and functional allocation. Debt recording and reporting has also improved as has payroll functions and elements of procurement. Internal control and internal audit have also advanced somewhat, despite resource constraints. The main area of backsliding is in arrears, tax audits and reconciliation of assets.
UGANDA PUBLIC EXPENDITURE AND FINANCIAL ACCOUNTABILITY(PEFA) ASSESSMENT 2016
x
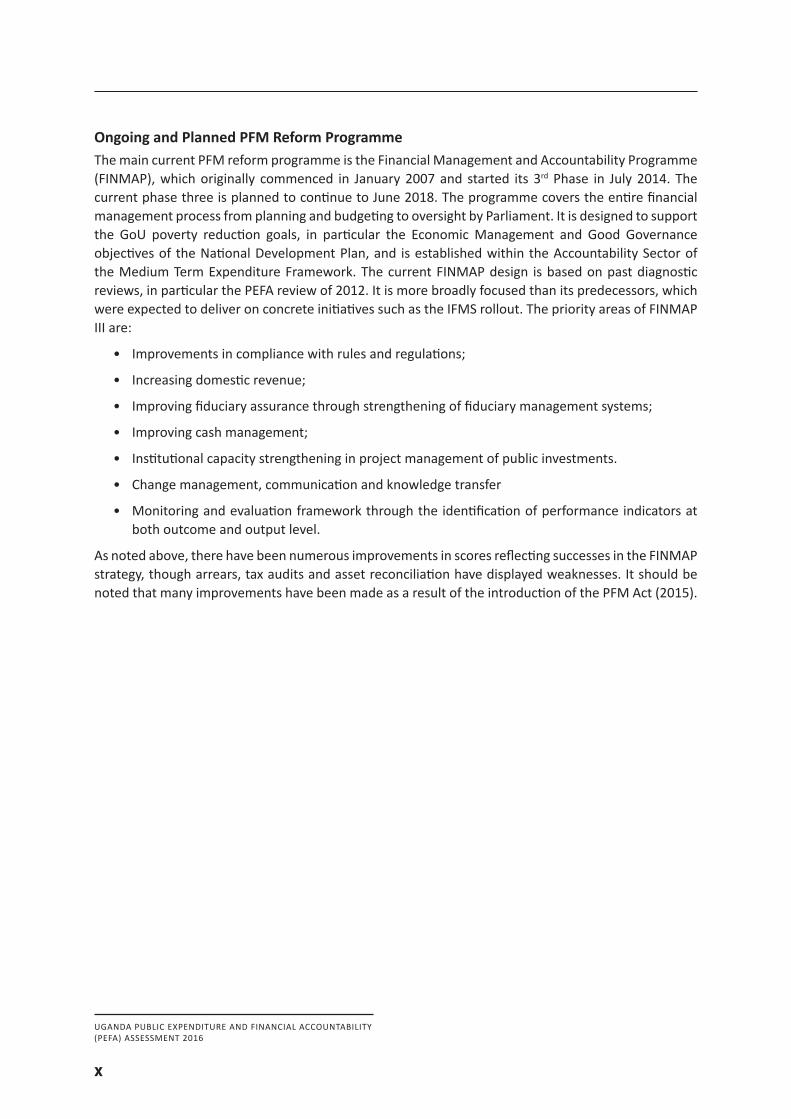
Ongoing and Planned PFM Reform ProgrammeThe main current PFM reform programme is the Financial Management and Accountability Programme (FINMAP), which originally commenced in January 2007 and started its 3rd Phase in July 2014. The current phase three is planned to continue to June 2018. The programme covers the entire financial management process from planning and budgeting to oversight by Parliament. It is designed to support the GoU poverty reduction goals, in particular the Economic Management and Good Governance objectives of the National Development Plan, and is established within the Accountability Sector of the Medium Term Expenditure Framework. The current FINMAP design is based on past diagnostic reviews, in particular the PEFA review of 2012. It is more broadly focused than its predecessors, which were expected to deliver on concrete initiatives such as the IFMS rollout. The priority areas of FINMAP III are:
• Improvements in compliance with rules and regulations;
• Increasing domestic revenue;
• Improving fiduciary assurance through strengthening of fiduciary management systems;
• Improving cash management;
• Institutional capacity strengthening in project management of public investments.
• Change management, communication and knowledge transfer
• Monitoring and evaluation framework through the identification of performance indicators at both outcome and output level.
As noted above, there have been numerous improvements in scores reflecting successes in the FINMAP strategy, though arrears, tax audits and asset reconciliation have displayed weaknesses. It should be noted that many improvements have been made as a result of the introduction of the PFM Act (2015).
UGANDA PUBLIC EXPENDITURE AND FINANCIAL ACCOUNTABILITY(PEFA) ASSESSMENT 2016
xi
PFM Performance IndicatorScoring
Method
Dimension Ratings
i. ii. iii. iv. Score
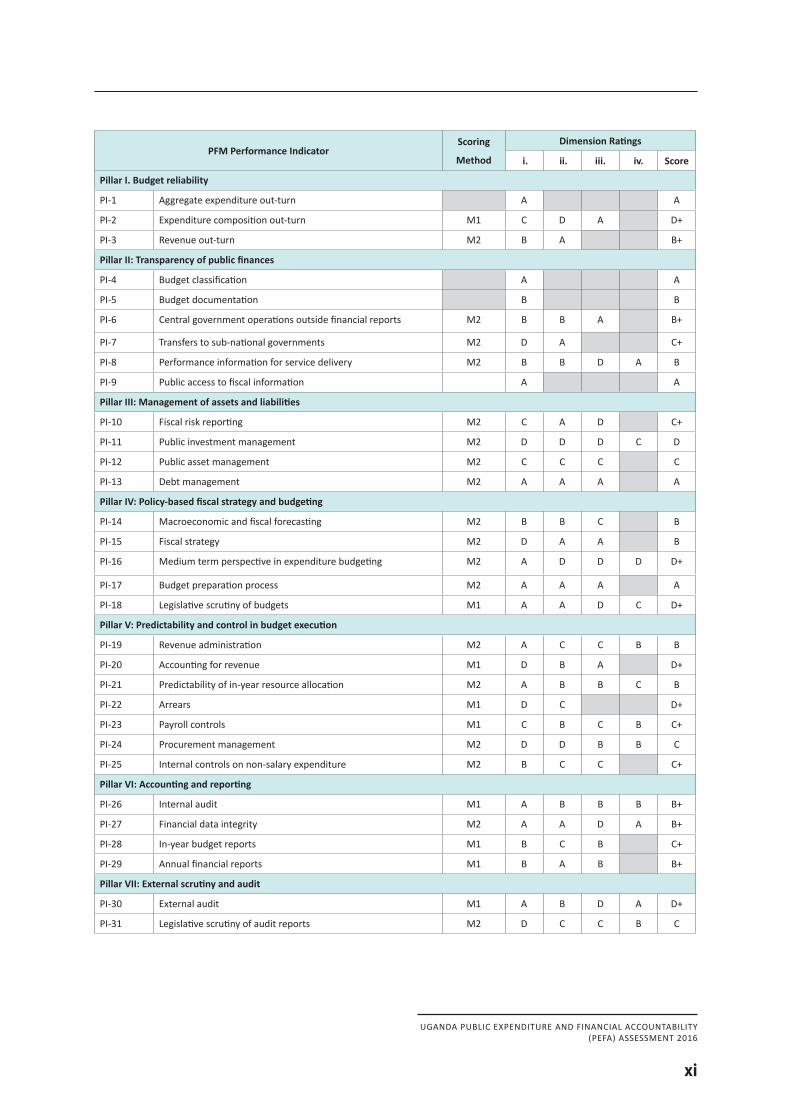
Pillar I. Budget reliability
PI-1 Aggregate expenditure out-turn A A
PI-2 Expenditure composition out-turn M1 C D A D+
PI-3 Revenue out-turn M2 B A B+
Pillar II: Transparency of public finances
PI-4 Budget classification A A
PI-5 Budget documentation B B
PI-6 Central government operations outside financial reports M2 B B A B+
PI-7 Transfers to sub-national governments M2 D A C+
PI-8 Performance information for service delivery M2 B B D A B
PI-9 Public access to fiscal information A A
Pillar III: Management of assets and liabilities
PI-10 Fiscal risk reporting M2 C A D C+
PI-11 Public investment management M2 D D D C D
PI-12 Public asset management M2 C C C C
PI-13 Debt management M2 A A A A
Pillar IV: Policy-based fiscal strategy and budgeting
PI-14 Macroeconomic and fiscal forecasting M2 B B C B
PI-15 Fiscal strategy M2 D A A B
PI-16 Medium term perspective in expenditure budgeting M2 A D D D D+
PI-17 Budget preparation process M2 A A A A
PI-18 Legislative scrutiny of budgets M1 A A D C D+
Pillar V: Predictability and control in budget execution
PI-19 Revenue administration M2 A C C B B
PI-20 Accounting for revenue M1 D B A D+
PI-21 Predictability of in-year resource allocation M2 A B B C B
PI-22 Arrears M1 D C D+
PI-23 Payroll controls M1 C B C B C+
PI-24 Procurement management M2 D D B B C
PI-25 Internal controls on non-salary expenditure M2 B C C C+
Pillar VI: Accounting and reporting
PI-26 Internal audit M1 A B B B B+
PI-27 Financial data integrity M2 A A D A B+
PI-28 In-year budget reports M1 B C B C+
PI-29 Annual financial reports M1 B A B B+
Pillar VII: External scrutiny and audit
PI-30 External audit M1 A B D A D+
PI-31 Legislative scrutiny of audit reports M2 D C C B C

UGANDA PUBLIC EXPENDITURE AND FINANCIAL ACCOUNTABILITY(PEFA) ASSESSMENT 2016
xii
UGANDA PUBLIC EXPENDITURE AND FINANCIAL ACCOUNTABILITY(PEFA) ASSESSMENT 2016
1
1. Introduction1.1 Rationale and purpose
1. The overall purpose of this PEFA assessment is fourfold;a) To undertake an independent assessment of the quality and performance of PFM
systems in Uganda for the financial years ended 2013/2014/2015 and conduct related training on the revised PEFA framework for 2016
b) Assess progress made and impact of implemented and /or on-going PFM reforms since the last PEFA in 2012
c) In its final form, provide a primary source of diagnostic analysis and basis of dialogue on PFM reforms to inform future update and design work on the PFM reform strategy and subsequent action plans. Additionally, this work will inform the Monitoring and Evaluation Framework for Government, Development Partners and other key stakeholders on PFM in the country
d) In a separate report make summary recommendations for improvement of PFM systems in Uganda.
UGANDA PUBLIC EXPENDITURE AND FINANCIAL ACCOUNTABILITY(PEFA) ASSESSMENT 2016
2
1.2 Assessment management and quality assurance
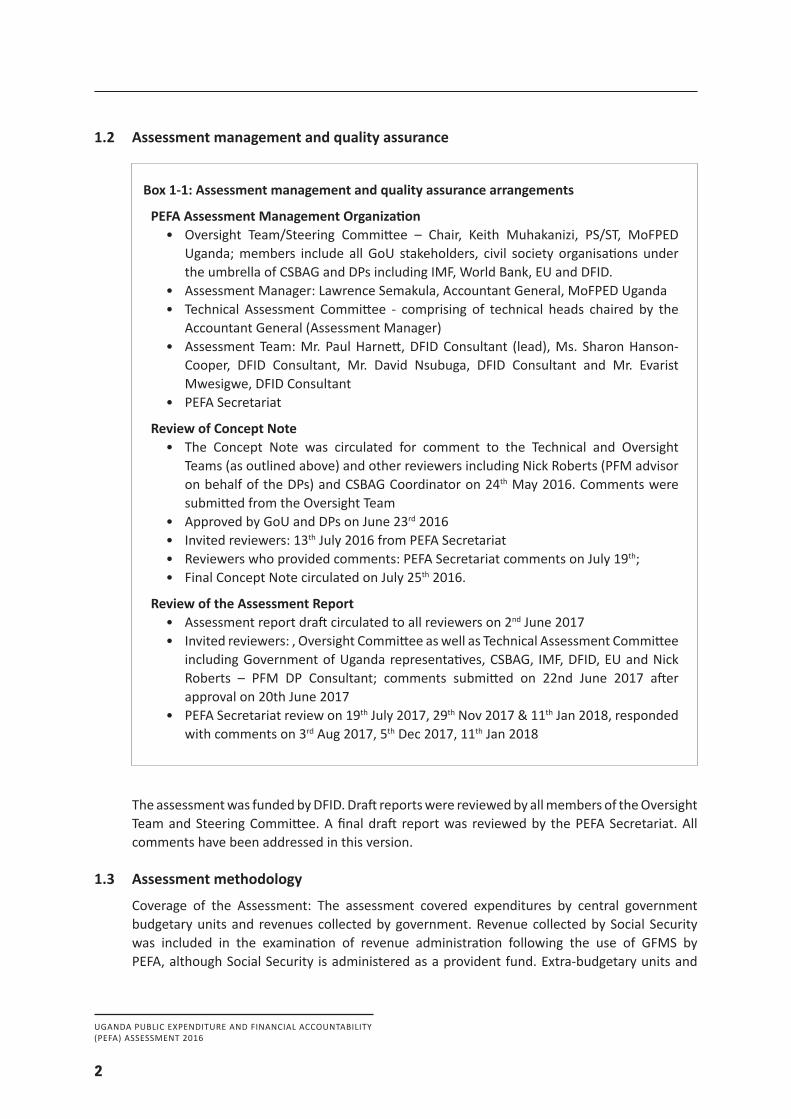
Box 1-1: Assessment management and quality assurance arrangements
PEFA Assessment Management Organization• Oversight Team/Steering Committee – Chair, Keith Muhakanizi, PS/ST, MoFPED
Uganda; members include all GoU stakeholders, civil society organisations under the umbrella of CSBAG and DPs including IMF, World Bank, EU and DFID.
• Assessment Manager: Lawrence Semakula, Accountant General, MoFPED Uganda• Technical Assessment Committee - comprising of technical heads chaired by the
Accountant General (Assessment Manager) • Assessment Team: Mr. Paul Harnett, DFID Consultant (lead), Ms. Sharon Hanson-
Cooper, DFID Consultant, Mr. David Nsubuga, DFID Consultant and Mr. Evarist Mwesigwe, DFID Consultant
• PEFA Secretariat
Review of Concept Note• The Concept Note was circulated for comment to the Technical and Oversight
Teams (as outlined above) and other reviewers including Nick Roberts (PFM advisor on behalf of the DPs) and CSBAG Coordinator on 24th May 2016. Comments were submitted from the Oversight Team
• Approved by GoU and DPs on June 23rd 2016• Invited reviewers: 13th July 2016 from PEFA Secretariat• Reviewers who provided comments: PEFA Secretariat comments on July 19th; • Final Concept Note circulated on July 25th 2016.
Review of the Assessment Report• Assessment report draft circulated to all reviewers on 2nd June 2017• Invited reviewers: , Oversight Committee as well as Technical Assessment Committee
including Government of Uganda representatives, CSBAG, IMF, DFID, EU and Nick Roberts – PFM DP Consultant; comments submitted on 22nd June 2017 after approval on 20th June 2017
• PEFA Secretariat review on 19th July 2017, 29th Nov 2017 & 11th Jan 2018, responded with comments on 3rd Aug 2017, 5th Dec 2017, 11th Jan 2018
The assessment was funded by DFID. Draft reports were reviewed by all members of the Oversight Team and Steering Committee. A final draft report was reviewed by the PEFA Secretariat. All comments have been addressed in this version.
1.3 Assessment methodology
Coverage of the Assessment: The assessment covered expenditures by central government budgetary units and revenues collected by government. Revenue collected by Social Security was included in the examination of revenue administration following the use of GFMS by PEFA, although Social Security is administered as a provident fund. Extra-budgetary units and
UGANDA PUBLIC EXPENDITURE AND FINANCIAL ACCOUNTABILITY(PEFA) ASSESSMENT 2016
3
local government were included in terms of indicators 6 and 7, relating to central government operations outside financial reports and transfers to local government.
The assessment team visited Uganda from November 7th to 18th 2016 for the assessment fieldwork. Financial years covered for indicators that required assessing over three years are 2013-14 to 2015-16 (which is the latest financial year). The time of assessment was when the team was in Uganda.
The list of sources of information for each of the indicators is listed in Annex 3. There is also a full list of persons met and bibliography in the annexes.
The assessment was carried out using the 2016 PEFA Framework. All 31 indicators were assessed and followed the methodology without any deviation in terms of coverage and application. The assessment team also scored using the 2011 PEFA methodology so that a comparison could be made with the results for the government indicators scored in the 2012 PEFA, which used that methodology. A comparison between 2012 and 2016 is included as Annex 4.
UGANDA PUBLIC EXPENDITURE AND FINANCIAL ACCOUNTABILITY(PEFA) ASSESSMENT 2016
4
2. Country Background Information
Country economic situation
The total population of Uganda in 2014 was 34.6 million according to the national census that year. Estimates for 2016 indicate a growth to over 40 million. GDP per capita more than tripled from US$253 in FY1999/2000 to US$817 in FY2013/14, and the national poverty headcount ratio (at US$1 per day) fell from 33.8 percent in FY1999 to 19.7 percent in FY2012/13. The 2016 National Household Survey showed an increase in those above the poverty line to 27%. The rates of inequality and vulnerability remain high, particularly in eastern and northern areas. The improvements have resulted from a number of factors including a sustained period of economic growth and a small business boom, resulting in migration of labour from low-productivity rural agriculture to low productivity services in urban areas. Uganda’s economy is estimated to have grown by 4.8 percent in FY 2015/16, slightly lower than 5 percent registered in FY2014/15 but higher than 3.2 percent for world economies and 3.4 percent for Sub-Saharan Africa economies. Over 50 percent of the registered growth in Uganda was contributed by the services sector, which grew by 6.5 per cent in FY2015/16 from 4.8 percent registered in FY2014/15. Other key sectors such as agriculture are projected to have grown at 3.2 percent, while the industrial sector grew at 4 percent. This economic slow-down is mainly attributed to both external and domestic shocks, which saw the strengthening of the United States dollar against the Uganda shilling, which in turn brought about inflationary pressures observed in increased domestic prices.
The headline inflation was, however, reduced to 6.4 percent in April 2016 from 8.5 percent registered in December 2015, while core inflation was reduced to 6.7 per cent from 7.6 percent over the same period in line with Bank of Uganda’s medium-term target.
At the beginning of the financial Year 2015/16, the Government of Uganda launched the Second National Development Plan (NDP II FY2015/16 - 2019/2020) that lays a roadmap for the social-economic transformation of the country into middle income status by 2020. Economic diversification remains central in the NDP II plan. The NDPII has 4 strategic objectives: (i) increasing sustainable production, productivity, and value addition in key growth opportunities; (ii) increasing the stock and quality of strategic infrastructure to accelerate the country’s competitiveness; (iii) enhancing human capital development; and (iv) improved mechanisms for quality, effectiveness, and efficiency of service delivery. NDP II prioritizes three productive sectors (agriculture, mineral, oil and gas, and tourism) and two social sectors (infrastructure and human and social Capital). The NDP aims to support business to create jobs particularly for the youth, by way of the educational systems as well as rebuilding the health service to lower the burden of disease and improve service delivery.
In this regard, the ongoing public finance management reforms being undertaken by Government following the enactment of the Public Finance Management Act 2015 and establishment of PFM strategy (2014-18) are expected to greatly improve the environment for public finance management in Uganda.
UGANDA PUBLIC EXPENDITURE AND FINANCIAL ACCOUNTABILITY(PEFA) ASSESSMENT 2016
5
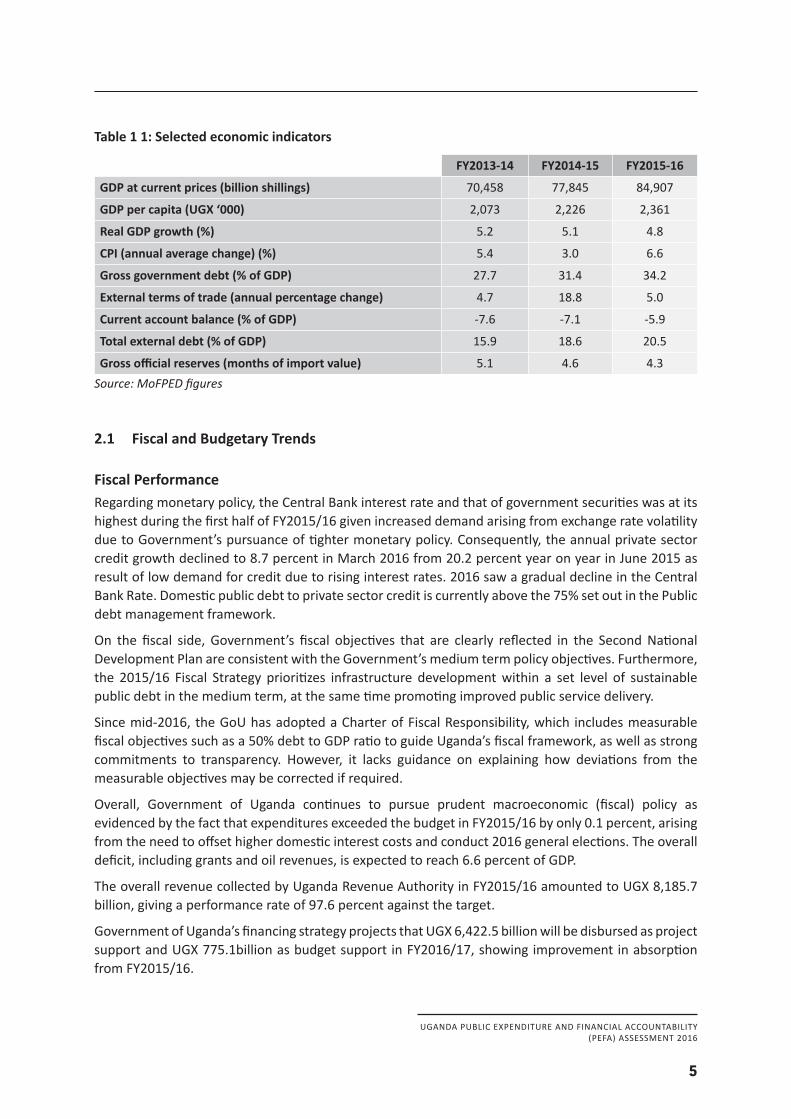
Table 1 1: Selected economic indicators
FY2013-14 FY2014-15 FY2015-16
GDP at current prices (billion shillings) 70,458 77,845 84,907
GDP per capita (UGX ‘000) 2,073 2,226 2,361
Real GDP growth (%) 5.2 5.1 4.8
CPI (annual average change) (%) 5.4 3.0 6.6
Gross government debt (% of GDP) 27.7 31.4 34.2
External terms of trade (annual percentage change) 4.7 18.8 5.0
Current account balance (% of GDP) -7.6 -7.1 -5.9
Total external debt (% of GDP) 15.9 18.6 20.5
Gross official reserves (months of import value) 5.1 4.6 4.3Source:MoFPEDfigures
2.1 Fiscal and Budgetary Trends
Fiscal PerformanceRegarding monetary policy, the Central Bank interest rate and that of government securities was at its highest during the first half of FY2015/16 given increased demand arising from exchange rate volatility due to Government’s pursuance of tighter monetary policy. Consequently, the annual private sector credit growth declined to 8.7 percent in March 2016 from 20.2 percent year on year in June 2015 as result of low demand for credit due to rising interest rates. 2016 saw a gradual decline in the Central Bank Rate. Domestic public debt to private sector credit is currently above the 75% set out in the Public debt management framework.
On the fiscal side, Government’s fiscal objectives that are clearly reflected in the Second National Development Plan are consistent with the Government’s medium term policy objectives. Furthermore, the 2015/16 Fiscal Strategy prioritizes infrastructure development within a set level of sustainable public debt in the medium term, at the same time promoting improved public service delivery.
Since mid-2016, the GoU has adopted a Charter of Fiscal Responsibility, which includes measurable fiscal objectives such as a 50% debt to GDP ratio to guide Uganda’s fiscal framework, as well as strong commitments to transparency. However, it lacks guidance on explaining how deviations from the measurable objectives may be corrected if required.
Overall, Government of Uganda continues to pursue prudent macroeconomic (fiscal) policy as evidenced by the fact that expenditures exceeded the budget in FY2015/16 by only 0.1 percent, arising from the need to offset higher domestic interest costs and conduct 2016 general elections. The overall deficit, including grants and oil revenues, is expected to reach 6.6 percent of GDP.
The overall revenue collected by Uganda Revenue Authority in FY2015/16 amounted to UGX 8,185.7 billion, giving a performance rate of 97.6 percent against the target.
Government of Uganda’s financing strategy projects that UGX 6,422.5 billion will be disbursed as project support and UGX 775.1billion as budget support in FY2016/17, showing improvement in absorption from FY2015/16.
UGANDA PUBLIC EXPENDITURE AND FINANCIAL ACCOUNTABILITY(PEFA) ASSESSMENT 2016
6
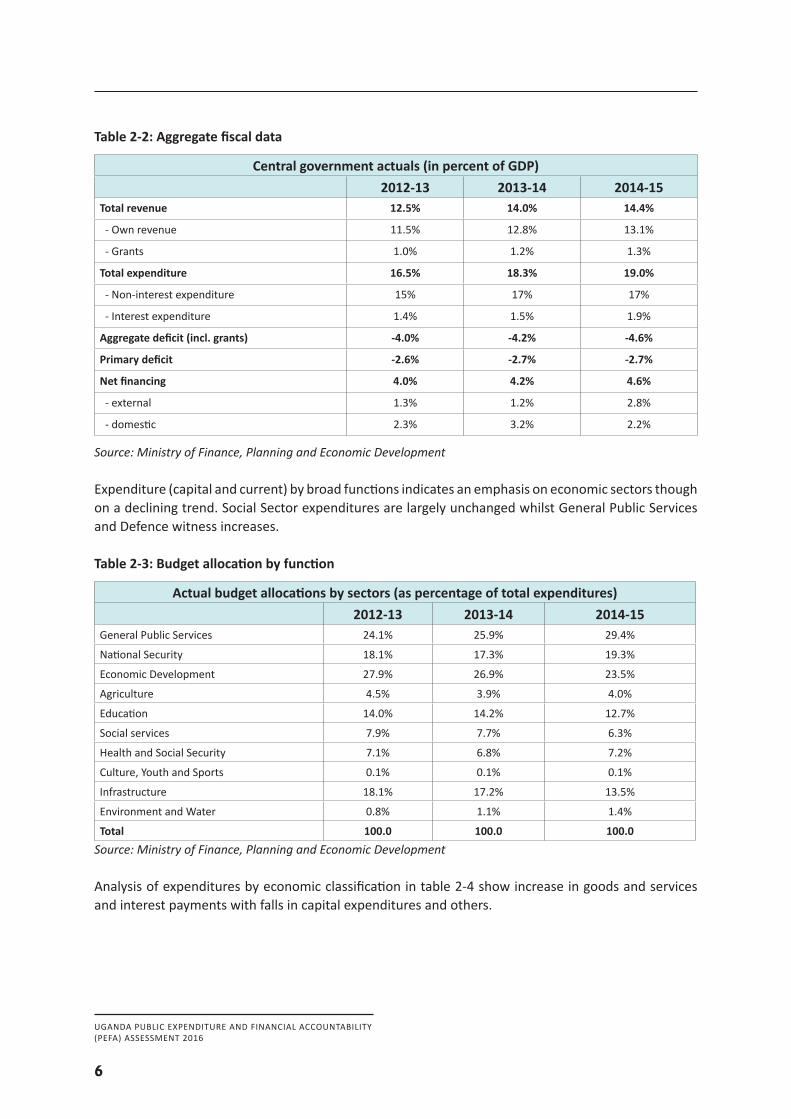
Table 2-2: Aggregate fiscal data
Central government actuals (in percent of GDP)2012-13 2013-14 2014-15
Total revenue 12.5% 14.0% 14.4%
- Own revenue 11.5% 12.8% 13.1%
- Grants 1.0% 1.2% 1.3%
Total expenditure 16.5% 18.3% 19.0%
- Non-interest expenditure 15% 17% 17%
- Interest expenditure 1.4% 1.5% 1.9%
Aggregate deficit (incl. grants) -4.0% -4.2% -4.6%
Primary deficit -2.6% -2.7% -2.7%
Net financing 4.0% 4.2% 4.6%
- external 1.3% 1.2% 2.8%
- domestic 2.3% 3.2% 2.2%
Source:MinistryofFinance,PlanningandEconomicDevelopment
Expenditure (capital and current) by broad functions indicates an emphasis on economic sectors though on a declining trend. Social Sector expenditures are largely unchanged whilst General Public Services and Defence witness increases.
Table 2-3: Budget allocation by function
Actual budget allocations by sectors (as percentage of total expenditures)2012-13 2013-14 2014-15
General Public Services 24.1% 25.9% 29.4%
National Security 18.1% 17.3% 19.3%
Economic Development 27.9% 26.9% 23.5%
Agriculture 4.5% 3.9% 4.0%
Education 14.0% 14.2% 12.7%
Social services 7.9% 7.7% 6.3%
Health and Social Security 7.1% 6.8% 7.2%
Culture, Youth and Sports 0.1% 0.1% 0.1%
Infrastructure 18.1% 17.2% 13.5%
Environment and Water 0.8% 1.1% 1.4%
Total 100.0 100.0 100.0Source:MinistryofFinance,PlanningandEconomicDevelopment
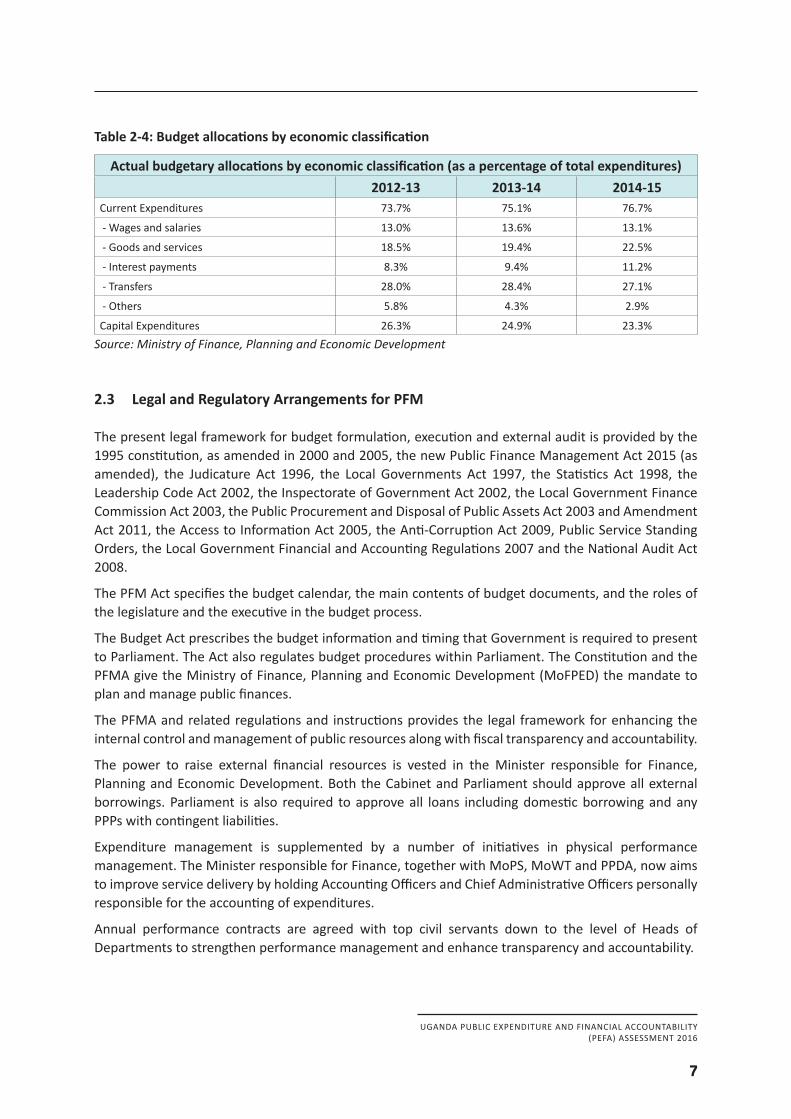
Analysis of expenditures by economic classification in table 2-4 show increase in goods and services and interest payments with falls in capital expenditures and others.
UGANDA PUBLIC EXPENDITURE AND FINANCIAL ACCOUNTABILITY(PEFA) ASSESSMENT 2016
7
Table 2-4: Budget allocations by economic classification
Actual budgetary allocations by economic classification (as a percentage of total expenditures)2012-13 2013-14 2014-15
Current Expenditures 73.7% 75.1% 76.7%
- Wages and salaries 13.0% 13.6% 13.1%
- Goods and services 18.5% 19.4% 22.5%
- Interest payments 8.3% 9.4% 11.2%
- Transfers 28.0% 28.4% 27.1%
- Others 5.8% 4.3% 2.9%
Capital Expenditures 26.3% 24.9% 23.3%Source:MinistryofFinance,PlanningandEconomicDevelopment
2.3 Legal and Regulatory Arrangements for PFM
The present legal framework for budget formulation, execution and external audit is provided by the 1995 constitution, as amended in 2000 and 2005, the new Public Finance Management Act 2015 (as amended), the Judicature Act 1996, the Local Governments Act 1997, the Statistics Act 1998, the Leadership Code Act 2002, the Inspectorate of Government Act 2002, the Local Government Finance Commission Act 2003, the Public Procurement and Disposal of Public Assets Act 2003 and Amendment Act 2011, the Access to Information Act 2005, the Anti-Corruption Act 2009, Public Service Standing Orders, the Local Government Financial and Accounting Regulations 2007 and the National Audit Act 2008.
The PFM Act specifies the budget calendar, the main contents of budget documents, and the roles of the legislature and the executive in the budget process.
The Budget Act prescribes the budget information and timing that Government is required to present to Parliament. The Act also regulates budget procedures within Parliament. The Constitution and the PFMA give the Ministry of Finance, Planning and Economic Development (MoFPED) the mandate to plan and manage public finances.
The PFMA and related regulations and instructions provides the legal framework for enhancing the internal control and management of public resources along with fiscal transparency and accountability.
The power to raise external financial resources is vested in the Minister responsible for Finance, Planning and Economic Development. Both the Cabinet and Parliament should approve all external borrowings. Parliament is also required to approve all loans including domestic borrowing and any PPPs with contingent liabilities.
Expenditure management is supplemented by a number of initiatives in physical performance management. The Minister responsible for Finance, together with MoPS, MoWT and PPDA, now aims to improve service delivery by holding Accounting Officers and Chief Administrative Officers personally responsible for the accounting of expenditures.
Annual performance contracts are agreed with top civil servants down to the level of Heads of Departments to strengthen performance management and enhance transparency and accountability.
UGANDA PUBLIC EXPENDITURE AND FINANCIAL ACCOUNTABILITY(PEFA) ASSESSMENT 2016
8
The legal framework for records management is contained in the Records and Archives Act, 2001. The framework provides for the transformation of the Records Management Department of the Ministry of Public Service (MoPS) into a Records Management & Information Technology Agency. The legislation also provides for regulations for elaboration of policies, definition of records management activities, instructions, monitoring and compliance. A National Information Technology Agency Uganda (NITA-U) was established by Act in 2009.
Principles for the prevention and detection of corruption have been agreed and an Anti-Corruption Act was passed in 2009 and a Whistle-blower Protection Act in 2010. The Inspectorate of Government Act, 2002 is the enabling legislation for the Inspector General to carry out his/her functions.
2.4 Institutional Arrangements for PFM
The central government comprises 135 budgetary agencies - 23 ministries, 61 agencies including various commissions, universities and research institutions, 16 referral hospitals and 35 foreign embassies/missions and a social security fund. There are a further 73 statutory corporations and other public sector entities, comprising 43 extra-budgetary corporations (autonomous government agencies (AGAs)), and 30 public corporations (27 nonfinancial and 3 financial institutions). The AGAs constitute a part of central government for GFS reporting to IMF, but are included in PEFA assessments only in indicators 7 (i), 9 (i), 18, 19, 26 and 28. There are also over 200 tertiary educational institutions, which are governed by the Universities and Other Tertiary Institutions Act.
One of the commissions is the Local Government Finance Commission (LGFC). The LGFC advises the President and Parliamentary Committees on all revenue matters concerning LGs, in particular CG grants to LGs; advises on financial disputes between LGs; analyses annual budgets of LGs with regard to their compliance with the law; supports PFM capacity building in higher-level LGs; and collects data on LG revenue, expenditure and arrears.
Local government is structured in four levels. The higher-level (Level I) LGs to which transfers are made by MoFPED comprise 115 district councils and 41 municipal councils. This number has seen a significant increase over recent years. As per the Kampala Capital City Authority Act, KCCA is no longer a part of local government. As at July 2016, Level II comprises 182 town councils, 1,163 sub-counties (of districts) and 118 divisions of the municipalities. These receive allocations from the higher-level LGs. Level III comprises over 7,469 Parish Councils (rural) and Wards (urban). Level IV consists of over 58,124 village council and urban cells/zones. Councillors are elected at all levels, but expenditure at levels III and IV is very small and is supervised by level II LGs. In accordance with the PEFA Framework for central government (PI-7), this assessment is concerned with the transparency of relationships between CG and higher-level LGs only.
UGANDA PUBLIC EXPENDITURE AND FINANCIAL ACCOUNTABILITY(PEFA) ASSESSMENT 2016
9
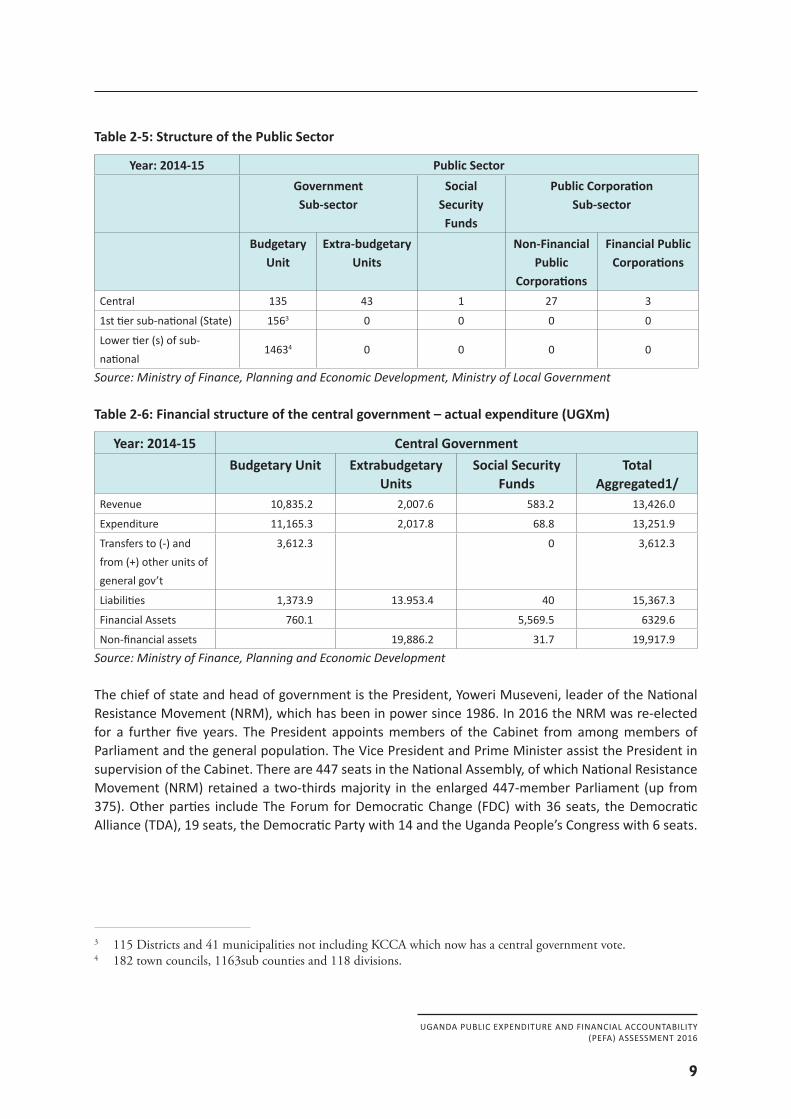
Table 2-5: Structure of the Public Sector
Year: 2014-15 Public Sector Government
Sub-sectorSocial
Security Funds
Public CorporationSub-sector
Budgetary Unit
Extra-budgetary Units
Non-Financial Public
Corporations
Financial Public Corporations
Central 135 43 1 27 3
1st tier sub-national (State) 1563 0 0 0 0
Lower tier (s) of sub-national
14634 0 0 0 0
Source:MinistryofFinance,PlanningandEconomicDevelopment,MinistryofLocalGovernment
Table 2-6: Financial structure of the central government – actual expenditure (UGXm)
Year: 2014-15 Central GovernmentBudgetary Unit Extrabudgetary
UnitsSocial Security
FundsTotal
Aggregated1/Revenue 10,835.2 2,007.6 583.2 13,426.0
Expenditure 11,165.3 2,017.8 68.8 13,251.9
Transfers to (-) and from (+) other units of general gov’t
3,612.3 0 3,612.3
Liabilities 1,373.9 13.953.4 40 15,367.3
Financial Assets 760.1 5,569.5 6329.6
Non-financial assets 19,886.2 31.7 19,917.9Source:MinistryofFinance,PlanningandEconomicDevelopment
The chief of state and head of government is the President, Yoweri Museveni, leader of the National Resistance Movement (NRM), which has been in power since 1986. In 2016 the NRM was re-elected for a further five years. The President appoints members of the Cabinet from among members of Parliament and the general population. The Vice President and Prime Minister assist the President in supervision of the Cabinet. There are 447 seats in the National Assembly, of which National Resistance Movement (NRM) retained a two-thirds majority in the enlarged 447-member Parliament (up from 375). Other parties include The Forum for Democratic Change (FDC) with 36 seats, the Democratic Alliance (TDA), 19 seats, the Democratic Party with 14 and the Uganda People’s Congress with 6 seats.
3 115 Districts and 41 municipalities not including KCCA which now has a central government vote. 4 182 town councils, 1163sub counties and 118 divisions.
UGANDA PUBLIC EXPENDITURE AND FINANCIAL ACCOUNTABILITY(PEFA) ASSESSMENT 2016
10
The judiciary mainly comprises 29 Magistrate Courts, which can hear criminal offences and civil claims within certain financial limits within their respective jurisdictions. Appeals are presented to the High Court, which includes a Commercial Division (or Commercial Court) for commercial disputes, and a Circuit Division that hears cases in 7 regional centres. In the districts there are also Local Council Courts and Land Tribunals that hear simple cases and land disputes. Above the High Court, there is a Court of Appeal and a Supreme Court. A Corruption Court has been set up as a division of the High Court.
Article 163 of the 1995 Constitution sets out provisions for the mandate, scope of work, appointment and removal of the Auditor General. A recent Constitutional amendment removed the requirement that the OAG be a public office, and the National Audit Act, 2008 (NAA) made the Auditor General financially and operationally independent of the executive. The OAG estimates are now examined and approved by the Parliamentary Finance Committee, and become a statutory charge on the Consolidated Fund (instead of only the Auditor General’s salary as was the situation prior to the Act). Under the Public Enterprise Reform and Divestiture Act, Cap 98 the Auditor General is responsible for auditing the accounts of Class I and II public enterprises. The NAA details the scope of the Auditor General’s work to include any public body that has received more than half its income from public funds. The PFMA requires the Accounting Officer of a vote whose money is appropriated for classified expenditure to prepare and submit to the Minister, the Accountant General and the Auditor General, the annual financial statements for the classified expenditure.
Under the Constitution, the PFMA 2015, National Audit Act 2008 and other enabling legislation, the Auditor General has a statutory responsibility to report to Parliament on the propriety and regularity of the spending of government/ taxpayers’ monies. In particular the Constitution requires the Auditor General to “audit and report on the public accounts of Uganda and all public offices and any public corporation or other bodies or organisations established by an Act of Parliament”.
At the Parliamentary level, there are 12 Standing Committees, of which five are directly concerned with financial matters: (i) Budget Committee; (ii) Public Accounts Committee (PAC); (iii) the Committee on Commissions, Statutory Authorities and State Enterprises (COSASE); (iv) the Local Government Accounts Committee (LGAC); and (v) Committee on the National Economy, which deals with issues relating to the national economy including scrutiny of loan agreements. Each Standing Committee has 15 members, except for the PAC that has 30 members, who are nominated and subsequently elected by MPs. In addition to the elected members, all chairpersons of the other committees are ex-officio members of the Committee on Budget. There is also a Sessional Committee for finance, planning and economic development and for each other sector/ministry that examines policy, budgets and proposed legislation coming from each ministry.
UGANDA PUBLIC EXPENDITURE AND FINANCIAL ACCOUNTABILITY(PEFA) ASSESSMENT 2016
11
Structure and Functions of MoFPEDMoFPED is headed by the Minister of Finance, Planning and Economic Development, assisted by four Ministers of State for: General Duties, Planning, Privatization and Investment, and Microfinance. The Permanent Secretary/Secretary to the Treasury (PS/ST) is the Chief Executive assisted by the Deputy Secretary to the Treasury. The Ministry comprises of five Directorates namely; Budget, Economic Affairs, Accountant General, Internal Audit and Cash and Debt Management. The Ministry is supported by the Finance and Administration Department headed by the Under Secretary who is also assigned the responsibility of an Accounting Officer.
The roles and functions of the Directorates are briefly outlined below:-
Directorate of Economic AffairsThe Directorate is mandated to formulate and make recommendations on implementing economic and financial policies for sustainable growth and development. The objectives of the Directorate are effective management of resource inflows, maintaining a stable macroeconomic framework, and economic development planning. The functions of the DEA include: formulation of tax policies aimed at generating domestic revenue; development of appropriate fiscal and monetary policies; preparation of medium and long term development plans in association with the National Planning Authority; coordination of policies that promote institutional capacity and development of the public and private sector; mobilization of domestic and external resources; formulation of strategies for appropriate external and internal public debt management; facilitation of trade and regional integration initiatives within the East African Community and the COMESA region.
It has four departments: Macroeconomic Policy, Tax Policy, Economic Development Policy, and Research and Financial Services
Directorate of BudgetThe Directorate is mandated to coordinate budget preparation by Ministries, Departments and Agencies. It is also responsible for development of policies and strategies that guide annual and medium term expenditure planning; preparing the Annual National Budget and medium term expenditure allocations; formulation, review and appraisal of projects and programs in liaison with line MDAs; reviewing and updating the Public Investment Plan; executing and monitoring the budget; and coordinating releases of funds for both recurrent and development activities in central and local governments.
The Directorate consists of four Departments, namely: Budget Policy and Evaluation, Infrastructure and Social Services, Public Administration, Project Analysis and Public Investment. Accountant General’s OfficeThe Accountant General’s Office initiates, formulates and coordinates the implementation of policies in regard to the management of public funds and provides guidance in the interpretation of government policy decisions on control of public funds. The functions include: production of timely, accurate and reliable financial management information that meets professional standards and conforms to internationally accepted best practices; overseeing and implementing the Integrated Financial Management System (IFMS); ensuring the appropriateness of internal control systems throughout
UGANDA PUBLIC EXPENDITURE AND FINANCIAL ACCOUNTABILITY(PEFA) ASSESSMENT 2016
12
government; providing the overall framework for control of public resources and expenditure; ensuring that Accounting Officers observe the PFMA 2015 and associated PFM Regulations 2016; setting professional standards for Accounts Cadres; ensuring that provision is made for the security of government’s financial and non-financial assets; maintaining a register of public debt; managing fiscal data for MDAs; providing information technology related support services to MDAs; processing and reporting financial transactions. The Directorate is also responsible for the initiation, formulation and monitoring of National Public Procurement Policy.
The Accountant General’s office comprises of two directorates. The Directorate of Financial Management Services comprises of three departments namely: Financial Management Services, Management Information Systems, and Public Sector Accounts. The Directorate of Treasury Services and Asset Management is comprised of three departments namely: Treasury Services, Asset Management and Public Procurement Management . The Office of the Accountant General is also supported by the Treasury Inspection and Policy Department.
Directorate of Debt and Cash PolicyThe Directorate is mandated to manage debt issuance for domestic debt for fiscal purposes and management of all government debt, grants and guarantees in accordance with the Ministry’s Economic Policies. It coordinates and advises on negotiations for external debt and manages bilateral and multilateral negotiations, regional and international cooperation and protocols. It is also responsible for the development and coordination of cash policies in consultation with Accountant General. It prepares and develops strategy for managing cash surpluses and preparation of regular cash flow forecasts.
The Directorate consists of three Departments namely; Debt Policy and Issuance, Cash Policy, and Development Assistance and Regional Cooperation Departments.
Directorate of Internal AuditThe Directorate is mandated to formulate, implement policies and carry out internal audit for all public resources. The Directorate is mandated to: develop the internal audit strategy and supervise its implementation; develop internal audit policies, rules, standards, manuals, circulars and guidelines; review and consolidate audit reports from the votes and externally financed projects; liaise with the Auditor General, Accountant General, Accounting Officers and internal auditors on audit matters; consolidate the reports of all the audit committees on the respective votes; periodically evaluate the effectiveness of audit committees of the respective votes; facilitate the development of the internal audit cadres; and provide evidence to the relevant parliamentary oversight committees when requested to do so.
The Internal Auditor General is responsible to the Secretary to the Treasury in the performance of his or her duties
The Directorate consists of three Departments namely; Internal Audit Management, IT and Performance Audit, and Forensic and Risk Advisory Departments.
UGANDA PUBLIC EXPENDITURE AND FINANCIAL ACCOUNTABILITY(PEFA) ASSESSMENT 2016
13
Finance and Administration DepartmentThe key function of the Department is to support the entire structure and functions of the Ministry. It consists of nine divisions/sections namely; Administration, Human Resource, Accounts, Planning, Procurement, Resource Centre, Internal Audit, Communications and Legal.
2.5 Other important features of PFM and its operating environment
The central government budgetary units dominate the public finances of Uganda as demonstrated in table 2-6. The level of decentralization to local government is small and transfers to extra budgetary units are also dwarfed by MDA transfers. There are no earmarked revenues as all revenues collected by URA are transferred directly into the Treasury Single Account.
External oversight of public finances by the Auditor General is strong though parliamentary scrutiny displays weaknesses in timing for both budgets and audit reports, which also would benefit from improved follow-up. External Audit involves itself with audits of extra budgetary units.
There is active CSO involvement in the budget process as well as MoFPED meetings throughout the budget cycle. There is also regular contact with the PFM Donor Working Group and PEMCOM forum which have assisted in the preparation and monitoring of PFM reforms in Uganda. Public access to documentation is good at the MoFPED level, though in some MDAs it is only available internally.
There has been a significant amount of work in passing a new and modern PFM Law which has already impacted on many areas of PFM.
UGANDA PUBLIC EXPENDITURE AND FINANCIAL ACCOUNTABILITY(PEFA) ASSESSMENT 2016
14
3. Assessment of PFM Performance
3.1 Budget Reliability
PI-1 Aggregate expenditure out-turn
Minimum Requirements (Scoring Method M1)2016 Explanation
PI-1 Aggregate expenditure out-turn
1.1 Aggregate expenditure out-turn
A
Aggregate expenditure outturn was between 95% and 105% of the approved aggregate budgeted expenditure in at least two of the last three years.
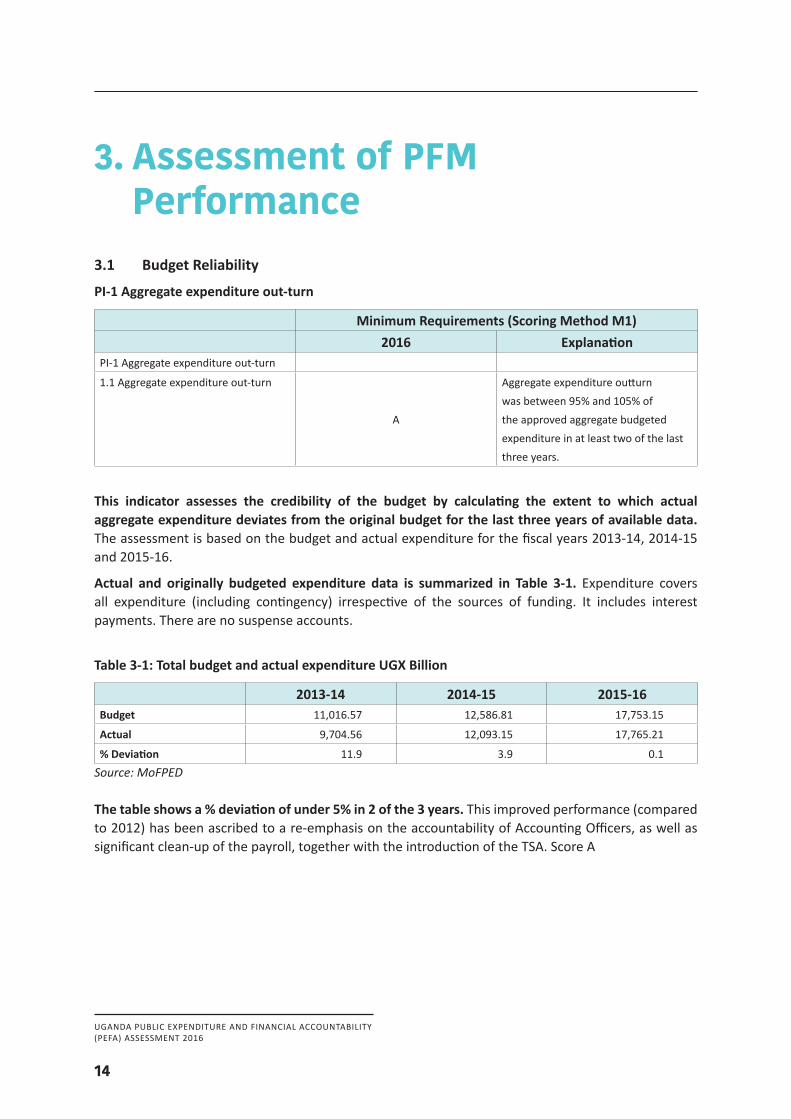
This indicator assesses the credibility of the budget by calculating the extent to which actual aggregate expenditure deviates from the original budget for the last three years of available data. The assessment is based on the budget and actual expenditure for the fiscal years 2013-14, 2014-15 and 2015-16.
Actual and originally budgeted expenditure data is summarized in Table 3-1. Expenditure covers all expenditure (including contingency) irrespective of the sources of funding. It includes interest payments. There are no suspense accounts.
Table 3-1: Total budget and actual expenditure UGX Billion
2013-14 2014-15 2015-16Budget 11,016.57 12,586.81 17,753.15
Actual 9,704.56 12,093.15 17,765.21
% Deviation 11.9 3.9 0.1Source:MoFPED
The table shows a % deviation of under 5% in 2 of the 3 years. This improved performance (compared to 2012) has been ascribed to a re-emphasis on the accountability of Accounting Officers, as well as significant clean-up of the payroll, together with the introduction of the TSA. Score A
UGANDA PUBLIC EXPENDITURE AND FINANCIAL ACCOUNTABILITY(PEFA) ASSESSMENT 2016
15
PI-2 Expenditure composition out-turn
Minimum Requirements (Scoring Method M1)2016 Explanation
PI-2 Expenditure composition out-turn D+
2.1 Expenditure composition out-turn by function C Variance in expenditure composition by program, administrative or functional classification was less than 15% in at least two of the last three years.
2.2 Expenditure composition out-turn by economic type
D Variance in expenditure composition by economic classification was 15% or more in at least two of the last three years.
2.3 Expenditure from contingency reserves A The contingency reserve in Uganda is 0.5% of the annual budget
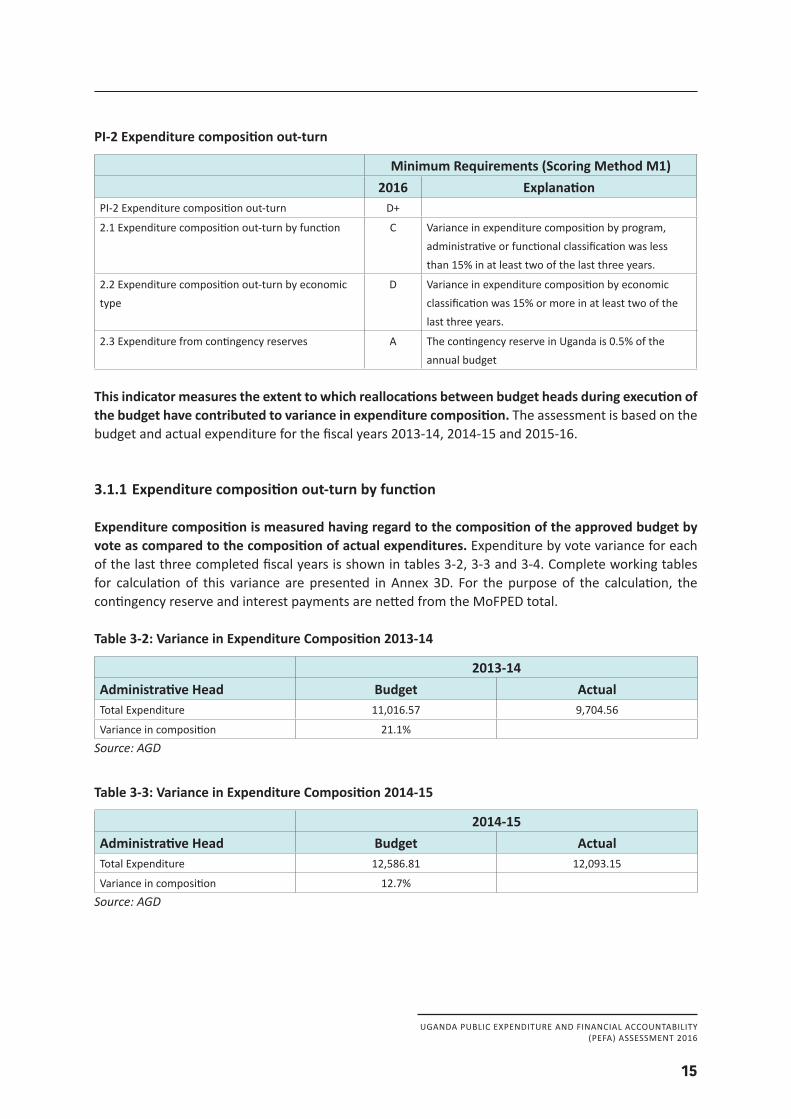
This indicator measures the extent to which reallocations between budget heads during execution of the budget have contributed to variance in expenditure composition. The assessment is based on the budget and actual expenditure for the fiscal years 2013-14, 2014-15 and 2015-16.
3.1.1 Expenditure composition out-turn by function
Expenditure composition is measured having regard to the composition of the approved budget by vote as compared to the composition of actual expenditures. Expenditure by vote variance for each of the last three completed fiscal years is shown in tables 3-2, 3-3 and 3-4. Complete working tables for calculation of this variance are presented in Annex 3D. For the purpose of the calculation, the contingency reserve and interest payments are netted from the MoFPED total.
Table 3-2: Variance in Expenditure Composition 2013-14
2013-14Administrative Head Budget ActualTotal Expenditure 11,016.57 9,704.56
Variance in composition 21.1%Source:AGD
Table 3-3: Variance in Expenditure Composition 2014-15
2014-15Administrative Head Budget ActualTotal Expenditure 12,586.81 12,093.15
Variance in composition 12.7%Source:AGD
UGANDA PUBLIC EXPENDITURE AND FINANCIAL ACCOUNTABILITY(PEFA) ASSESSMENT 2016
16
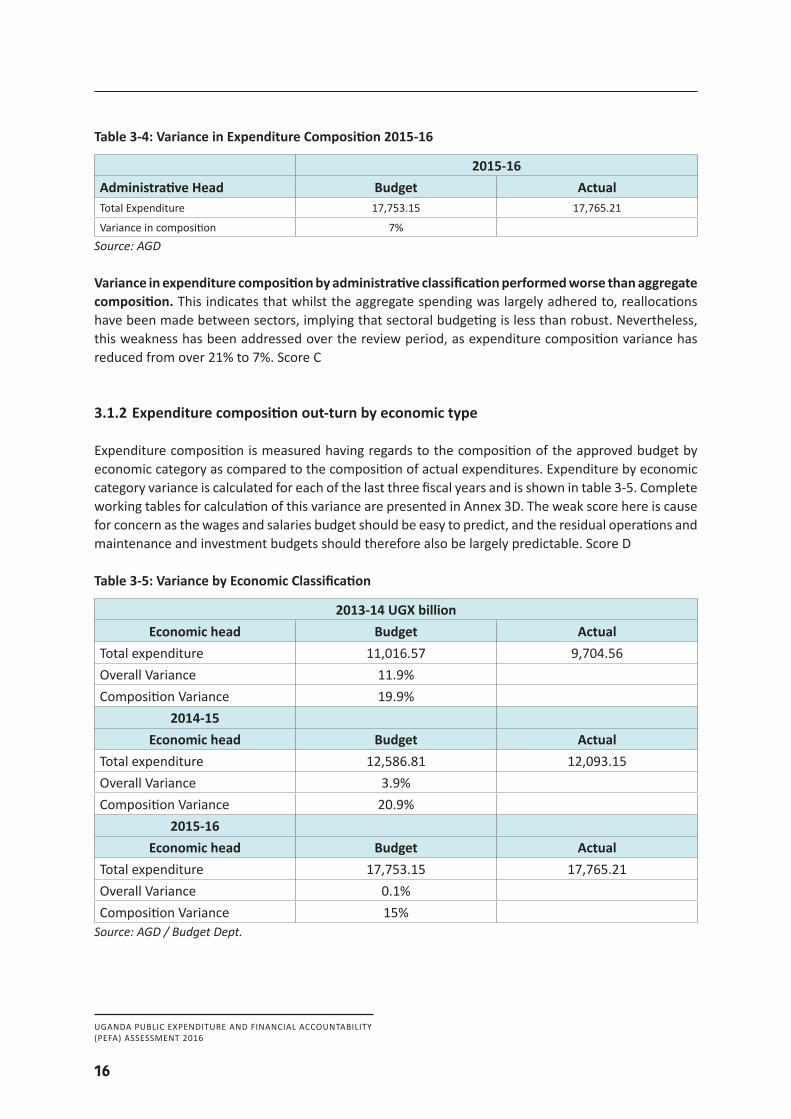
Table 3-4: Variance in Expenditure Composition 2015-16
2015-16Administrative Head Budget ActualTotal Expenditure 17,753.15 17,765.21
Variance in composition 7%Source:AGD
Variance in expenditure composition by administrative classification performed worse than aggregate composition. This indicates that whilst the aggregate spending was largely adhered to, reallocations have been made between sectors, implying that sectoral budgeting is less than robust. Nevertheless, this weakness has been addressed over the review period, as expenditure composition variance has reduced from over 21% to 7%. Score C
3.1.2 Expenditure composition out-turn by economic type
Expenditure composition is measured having regards to the composition of the approved budget by economic category as compared to the composition of actual expenditures. Expenditure by economic category variance is calculated for each of the last three fiscal years and is shown in table 3-5. Complete working tables for calculation of this variance are presented in Annex 3D. The weak score here is cause for concern as the wages and salaries budget should be easy to predict, and the residual operations and maintenance and investment budgets should therefore also be largely predictable. Score D
Table 3-5: Variance by Economic Classification
2013-14 UGX billionEconomic head Budget Actual
Total expenditure 11,016.57 9,704.56Overall Variance 11.9%Composition Variance 19.9%
2014-15Economic head Budget Actual
Total expenditure 12,586.81 12,093.15Overall Variance 3.9%Composition Variance 20.9%
2015-16Economic head Budget Actual
Total expenditure 17,753.15 17,765.21Overall Variance 0.1%Composition Variance 15%Source:AGD/BudgetDept.
UGANDA PUBLIC EXPENDITURE AND FINANCIAL ACCOUNTABILITY(PEFA) ASSESSMENT 2016
17
3.1.3 Expenditure from contingency reserves
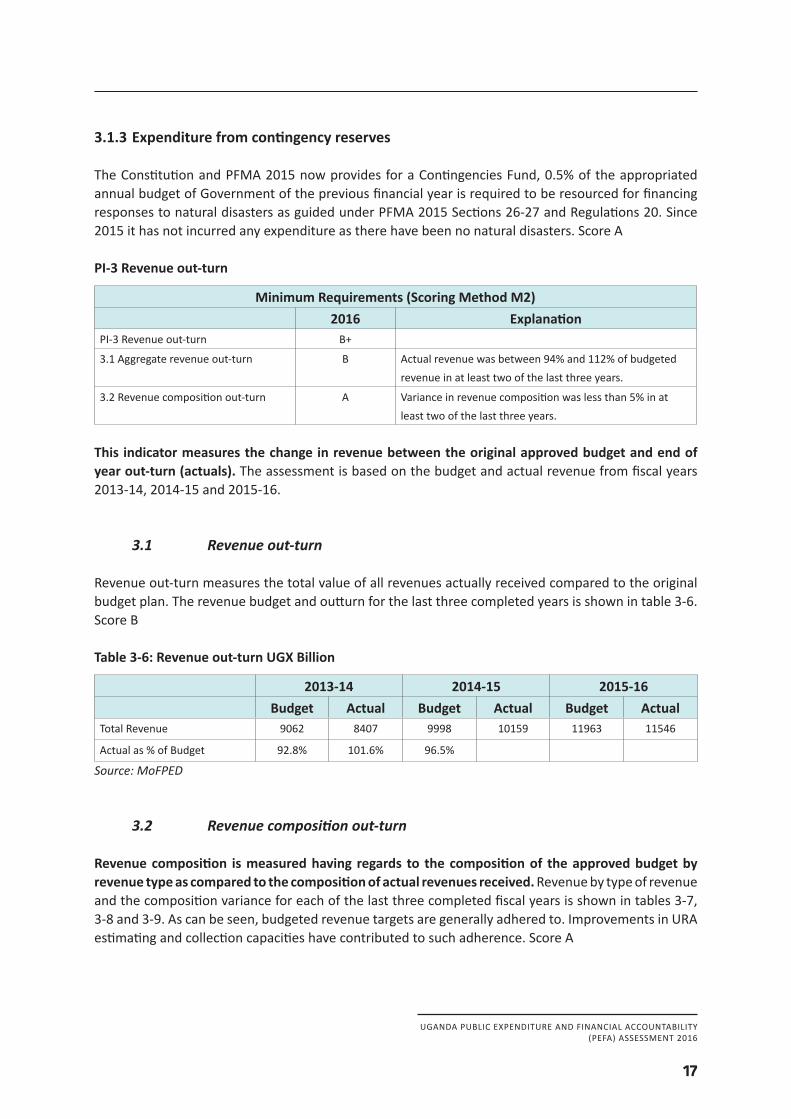
The Constitution and PFMA 2015 now provides for a Contingencies Fund, 0.5% of the appropriated annual budget of Government of the previous financial year is required to be resourced for financing responses to natural disasters as guided under PFMA 2015 Sections 26-27 and Regulations 20. Since 2015 it has not incurred any expenditure as there have been no natural disasters. Score A
PI-3 Revenue out-turn
Minimum Requirements (Scoring Method M2)2016 Explanation
PI-3 Revenue out-turn B+
3.1 Aggregate revenue out-turn B Actual revenue was between 94% and 112% of budgeted revenue in at least two of the last three years.
3.2 Revenue composition out-turn A Variance in revenue composition was less than 5% in at least two of the last three years.
This indicator measures the change in revenue between the original approved budget and end of year out-turn (actuals). The assessment is based on the budget and actual revenue from fiscal years 2013-14, 2014-15 and 2015-16.
3.1 Revenue out-turn
Revenue out-turn measures the total value of all revenues actually received compared to the original budget plan. The revenue budget and outturn for the last three completed years is shown in table 3-6. Score B
Table 3-6: Revenue out-turn UGX Billion
2013-14 2014-15 2015-16Budget Actual Budget Actual Budget Actual
Total Revenue 9062 8407 9998 10159 11963 11546
Actual as % of Budget 92.8% 101.6% 96.5%
Source:MoFPED
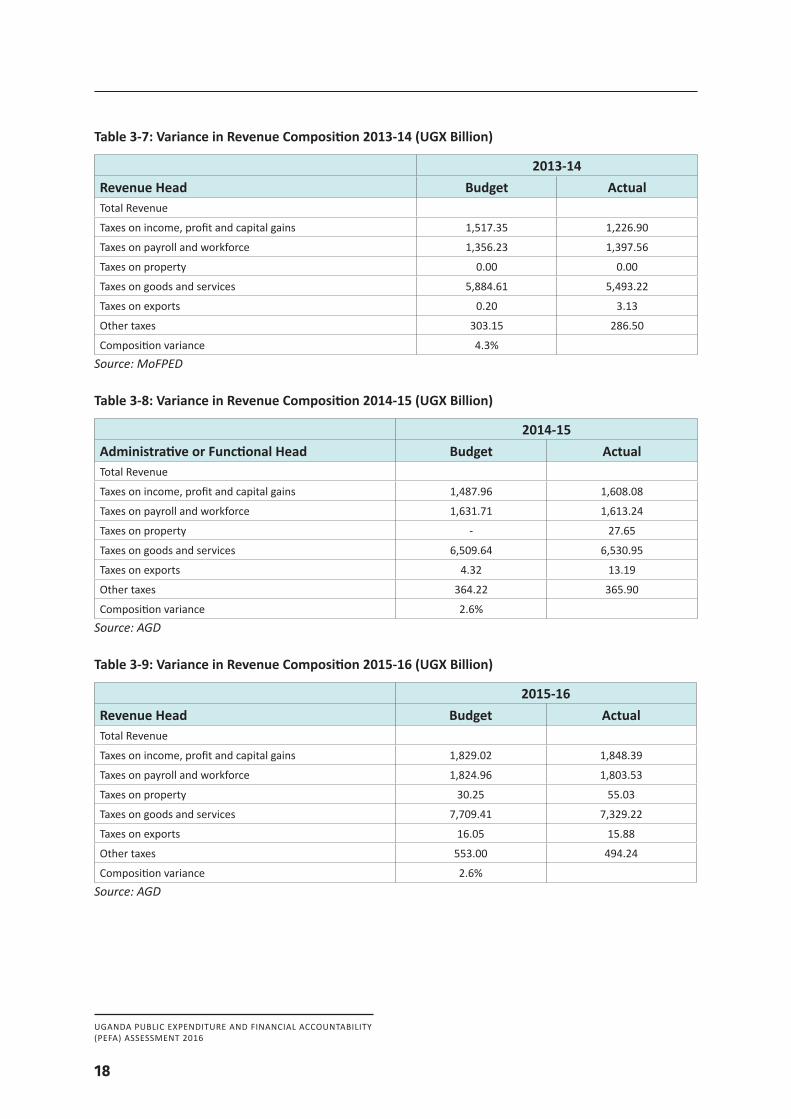
3.2 Revenue composition out-turn
Revenue composition is measured having regards to the composition of the approved budget by revenue type as compared to the composition of actual revenues received. Revenue by type of revenue and the composition variance for each of the last three completed fiscal years is shown in tables 3-7, 3-8 and 3-9. As can be seen, budgeted revenue targets are generally adhered to. Improvements in URA estimating and collection capacities have contributed to such adherence. Score A
UGANDA PUBLIC EXPENDITURE AND FINANCIAL ACCOUNTABILITY(PEFA) ASSESSMENT 2016
18
Table 3-7: Variance in Revenue Composition 2013-14 (UGX Billion)
2013-14Revenue Head Budget ActualTotal Revenue
Taxes on income, profit and capital gains 1,517.35 1,226.90
Taxes on payroll and workforce 1,356.23 1,397.56
Taxes on property 0.00 0.00
Taxes on goods and services 5,884.61 5,493.22
Taxes on exports 0.20 3.13
Other taxes 303.15 286.50
Composition variance 4.3%Source:MoFPED
Table 3-8: Variance in Revenue Composition 2014-15 (UGX Billion)
2014-15Administrative or Functional Head Budget ActualTotal Revenue
Taxes on income, profit and capital gains 1,487.96 1,608.08
Taxes on payroll and workforce 1,631.71 1,613.24
Taxes on property - 27.65
Taxes on goods and services 6,509.64 6,530.95
Taxes on exports 4.32 13.19
Other taxes 364.22 365.90
Composition variance 2.6%Source:AGD
Table 3-9: Variance in Revenue Composition 2015-16 (UGX Billion)
2015-16Revenue Head Budget ActualTotal Revenue
Taxes on income, profit and capital gains 1,829.02 1,848.39
Taxes on payroll and workforce 1,824.96 1,803.53
Taxes on property 30.25 55.03
Taxes on goods and services 7,709.41 7,329.22
Taxes on exports 16.05 15.88
Other taxes 553.00 494.24
Composition variance 2.6%Source:AGD
UGANDA PUBLIC EXPENDITURE AND FINANCIAL ACCOUNTABILITY(PEFA) ASSESSMENT 2016
19
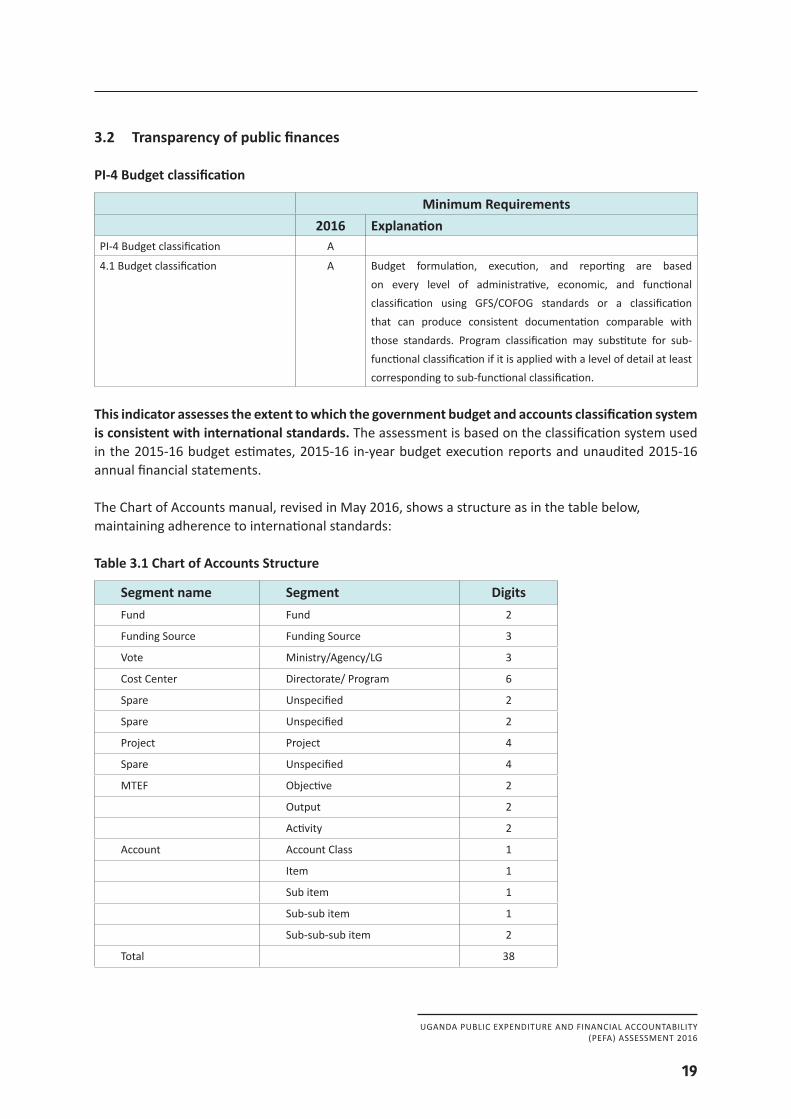
3.2 Transparency of public finances
PI-4 Budget classification
Minimum Requirements2016 Explanation
PI-4 Budget classification A
4.1 Budget classification A Budget formulation, execution, and reporting are based on every level of administrative, economic, and functional classification using GFS/COFOG standards or a classification that can produce consistent documentation comparable with those standards. Program classification may substitute for sub-functional classification if it is applied with a level of detail at least corresponding to sub-functional classification.
This indicator assesses the extent to which the government budget and accounts classification system is consistent with international standards. The assessment is based on the classification system used in the 2015-16 budget estimates, 2015-16 in-year budget execution reports and unaudited 2015-16 annual financial statements.
The Chart of Accounts manual, revised in May 2016, shows a structure as in the table below, maintaining adherence to international standards:
Table 3.1 Chart of Accounts Structure
Segment name Segment DigitsFund Fund 2
Funding Source Funding Source 3
Vote Ministry/Agency/LG 3
Cost Center Directorate/ Program 6
Spare Unspecified 2
Spare Unspecified 2
Project Project 4
Spare Unspecified 4
MTEF Objective 2
Output 2
Activity 2
Account Account Class 1
Item 1
Sub item 1
Sub-sub item 1
Sub-sub-sub item 2
Total 38
UGANDA PUBLIC EXPENDITURE AND FINANCIAL ACCOUNTABILITY(PEFA) ASSESSMENT 2016
20
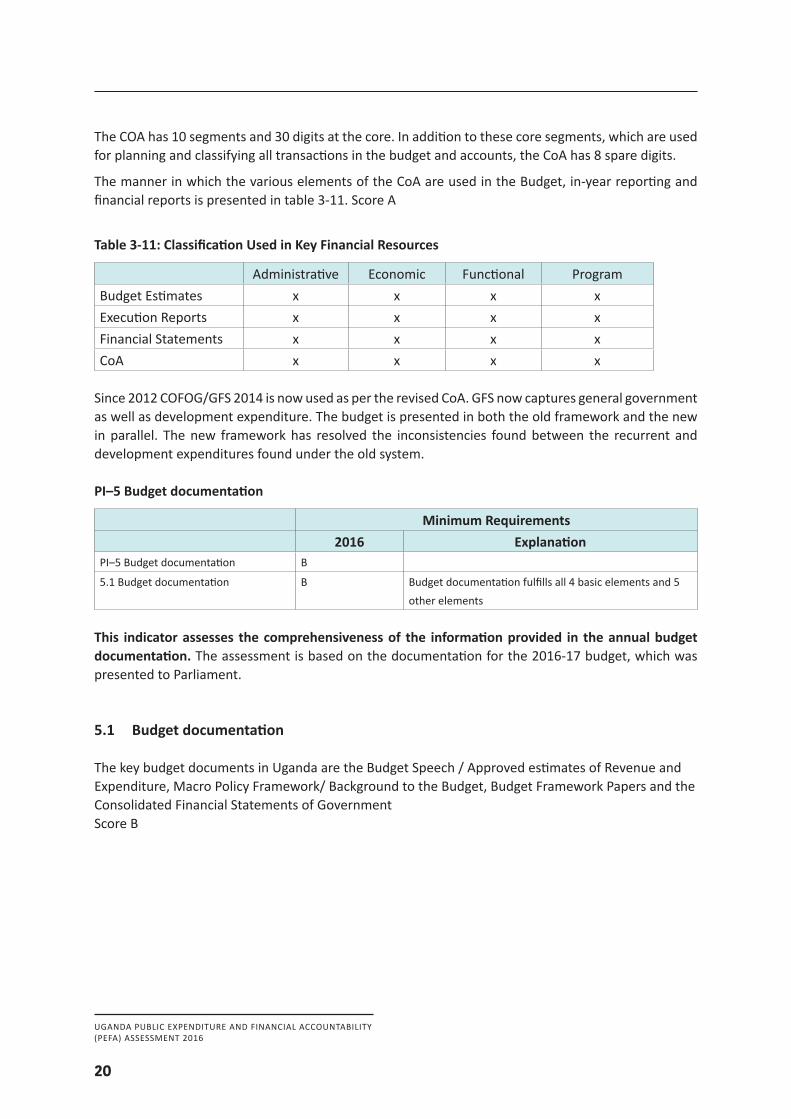
The COA has 10 segments and 30 digits at the core. In addition to these core segments, which are used for planning and classifying all transactions in the budget and accounts, the CoA has 8 spare digits.
The manner in which the various elements of the CoA are used in the Budget, in-year reporting and financial reports is presented in table 3-11. Score A
Table 3-11: Classification Used in Key Financial Resources
Administrative Economic Functional ProgramBudget Estimates x x x xExecution Reports x x x xFinancial Statements x x x xCoA x x x x
Since 2012 COFOG/GFS 2014 is now used as per the revised CoA. GFS now captures general government as well as development expenditure. The budget is presented in both the old framework and the new in parallel. The new framework has resolved the inconsistencies found between the recurrent and development expenditures found under the old system.
PI–5 Budget documentation
Minimum Requirements2016 Explanation
PI–5 Budget documentation B
5.1 Budget documentation B Budget documentation fulfills all 4 basic elements and 5 other elements
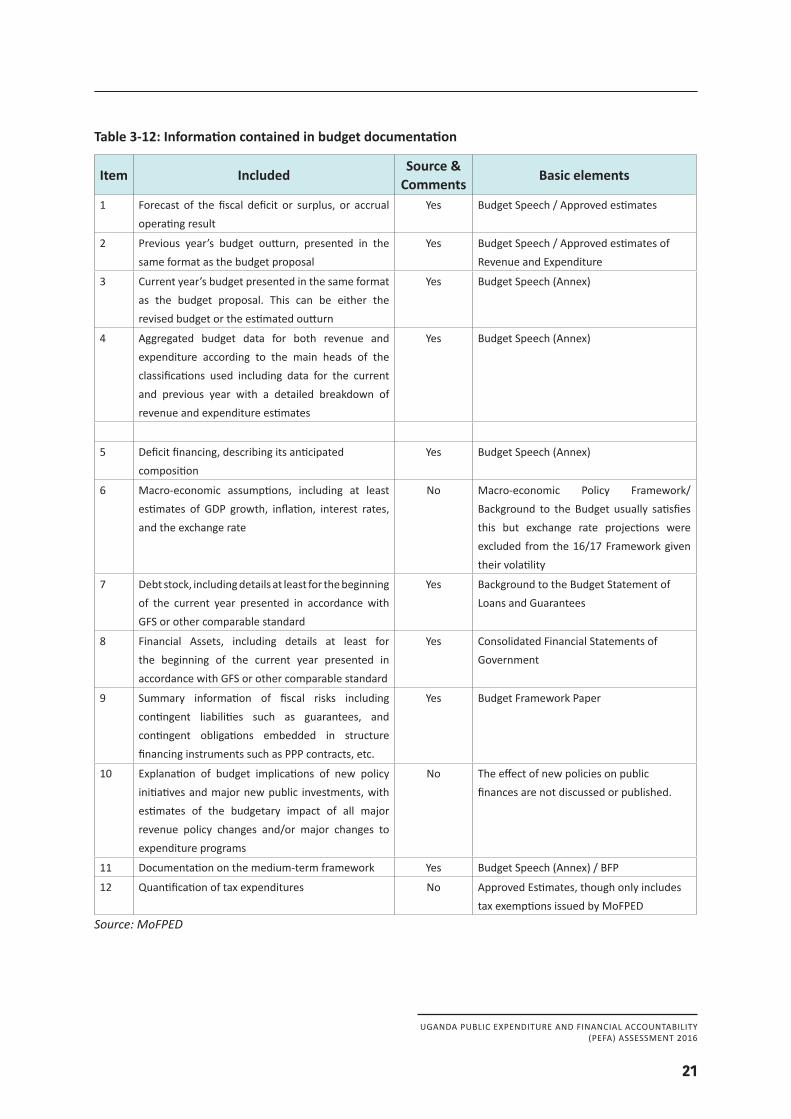
This indicator assesses the comprehensiveness of the information provided in the annual budget documentation. The assessment is based on the documentation for the 2016-17 budget, which was presented to Parliament.
5.1 Budget documentation
The key budget documents in Uganda are the Budget Speech / Approved estimates of Revenue and Expenditure, Macro Policy Framework/ Background to the Budget, Budget Framework Papers and the Consolidated Financial Statements of GovernmentScore B
UGANDA PUBLIC EXPENDITURE AND FINANCIAL ACCOUNTABILITY(PEFA) ASSESSMENT 2016
21
Table 3-12: Information contained in budget documentation
Item IncludedSource &
CommentsBasic elements
1 Forecast of the fiscal deficit or surplus, or accrual operating result
Yes Budget Speech / Approved estimates
2 Previous year’s budget outturn, presented in the same format as the budget proposal
Yes Budget Speech / Approved estimates of Revenue and Expenditure
3 Current year’s budget presented in the same format as the budget proposal. This can be either the revised budget or the estimated outturn
Yes Budget Speech (Annex)
4 Aggregated budget data for both revenue and expenditure according to the main heads of the classifications used including data for the current and previous year with a detailed breakdown of revenue and expenditure estimates
Yes Budget Speech (Annex)
5 Deficit financing, describing its anticipated composition
Yes Budget Speech (Annex)
6 Macro-economic assumptions, including at least estimates of GDP growth, inflation, interest rates, and the exchange rate
No Macro-economic Policy Framework/ Background to the Budget usually satisfies this but exchange rate projections were excluded from the 16/17 Framework given their volatility
7 Debt stock, including details at least for the beginning of the current year presented in accordance with GFS or other comparable standard
Yes Background to the Budget Statement of Loans and Guarantees
8 Financial Assets, including details at least for the beginning of the current year presented in accordance with GFS or other comparable standard
Yes Consolidated Financial Statements of Government
9 Summary information of fiscal risks including contingent liabilities such as guarantees, and contingent obligations embedded in structure financing instruments such as PPP contracts, etc.
Yes Budget Framework Paper
10 Explanation of budget implications of new policy initiatives and major new public investments, with estimates of the budgetary impact of all major revenue policy changes and/or major changes to expenditure programs
No The effect of new policies on public finances are not discussed or published.
11 Documentation on the medium-term framework Yes Budget Speech (Annex) / BFP
12 Quantification of tax expenditures No Approved Estimates, though only includes tax exemptions issued by MoFPED
Source:MoFPED
UGANDA PUBLIC EXPENDITURE AND FINANCIAL ACCOUNTABILITY(PEFA) ASSESSMENT 2016
22
PI–6 Central government operations outside financial reports
Minimum Requirements (Scoring Method M2)2016 Explanation
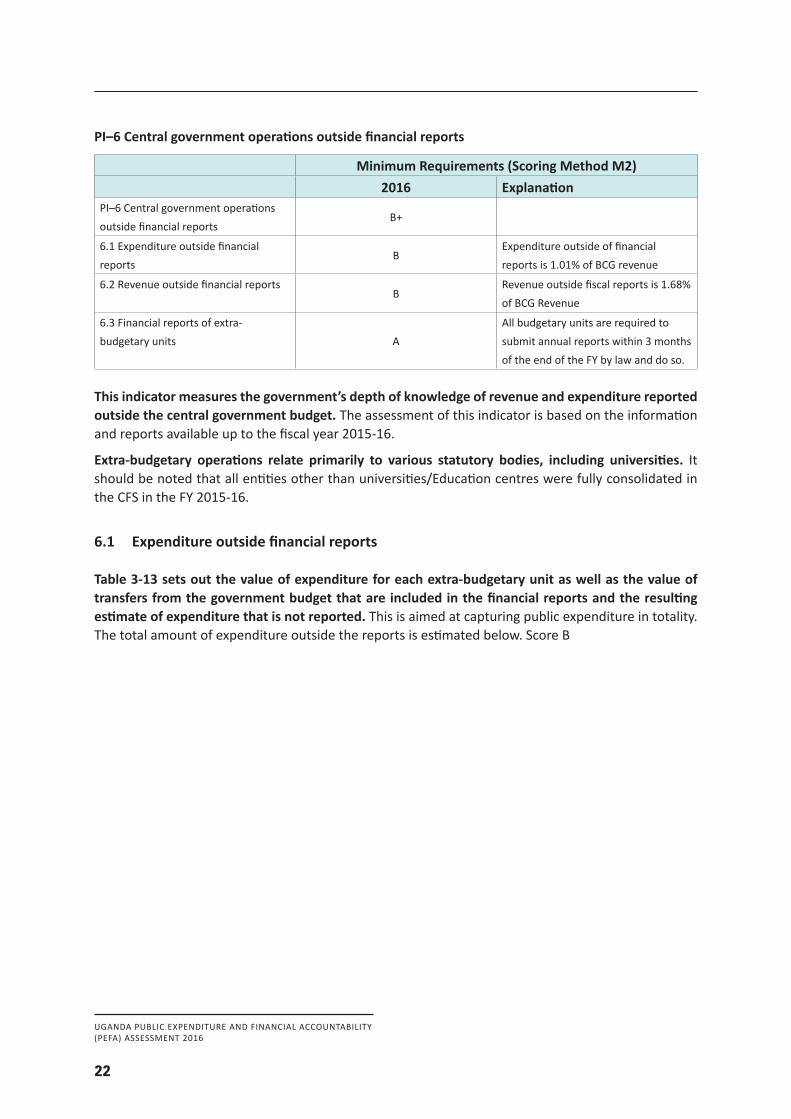
PI–6 Central government operations outside financial reports
B+
6.1 Expenditure outside financial reports
BExpenditure outside of financial reports is 1.01% of BCG revenue
6.2 Revenue outside financial reportsB
Revenue outside fiscal reports is 1.68% of BCG Revenue
6.3 Financial reports of extra-budgetary units A
All budgetary units are required to submit annual reports within 3 months of the end of the FY by law and do so.
This indicator measures the government’s depth of knowledge of revenue and expenditure reported outside the central government budget. The assessment of this indicator is based on the information and reports available up to the fiscal year 2015-16.
Extra-budgetary operations relate primarily to various statutory bodies, including universities. It should be noted that all entities other than universities/Education centres were fully consolidated in the CFS in the FY 2015-16.
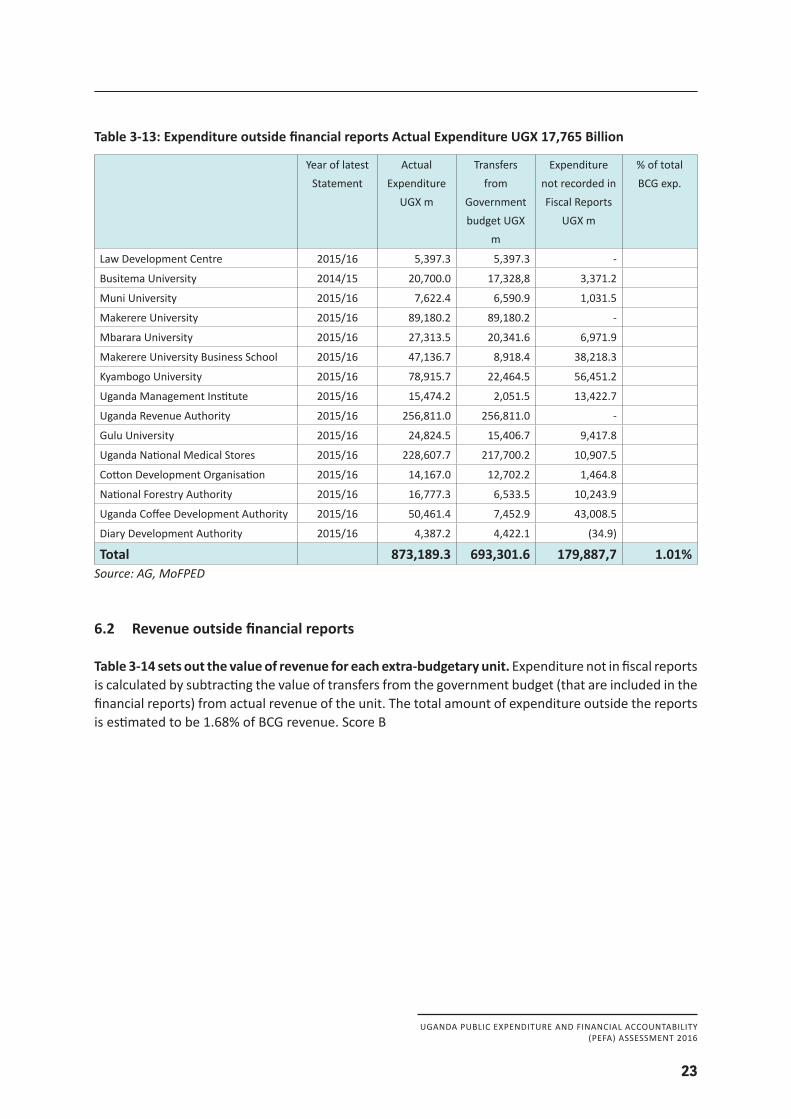
6.1 Expenditure outside financial reports
Table 3-13 sets out the value of expenditure for each extra-budgetary unit as well as the value of transfers from the government budget that are included in the financial reports and the resulting estimate of expenditure that is not reported. This is aimed at capturing public expenditure in totality. The total amount of expenditure outside the reports is estimated below. Score B
UGANDA PUBLIC EXPENDITURE AND FINANCIAL ACCOUNTABILITY(PEFA) ASSESSMENT 2016
23
Table 3-13: Expenditure outside financial reports Actual Expenditure UGX 17,765 Billion
Year of latest Statement
Actual Expenditure
UGX m
Transfers from
Government budget UGX
m
Expenditure not recorded in Fiscal Reports
UGX m
% of total BCG exp.
Law Development Centre 2015/16 5,397.3 5,397.3 -
Busitema University 2014/15 20,700.0 17,328,8 3,371.2
Muni University 2015/16 7,622.4 6,590.9 1,031.5
Makerere University 2015/16 89,180.2 89,180.2 -
Mbarara University 2015/16 27,313.5 20,341.6 6,971.9
Makerere University Business School 2015/16 47,136.7 8,918.4 38,218.3
Kyambogo University 2015/16 78,915.7 22,464.5 56,451.2
Uganda Management Institute 2015/16 15,474.2 2,051.5 13,422.7
Uganda Revenue Authority 2015/16 256,811.0 256,811.0 -
Gulu University 2015/16 24,824.5 15,406.7 9,417.8
Uganda National Medical Stores 2015/16 228,607.7 217,700.2 10,907.5
Cotton Development Organisation 2015/16 14,167.0 12,702.2 1,464.8
National Forestry Authority 2015/16 16,777.3 6,533.5 10,243.9
Uganda Coffee Development Authority 2015/16 50,461.4 7,452.9 43,008.5
Diary Development Authority 2015/16 4,387.2 4,422.1 (34.9)
Total 873,189.3 693,301.6 179,887,7 1.01%Source:AG,MoFPED
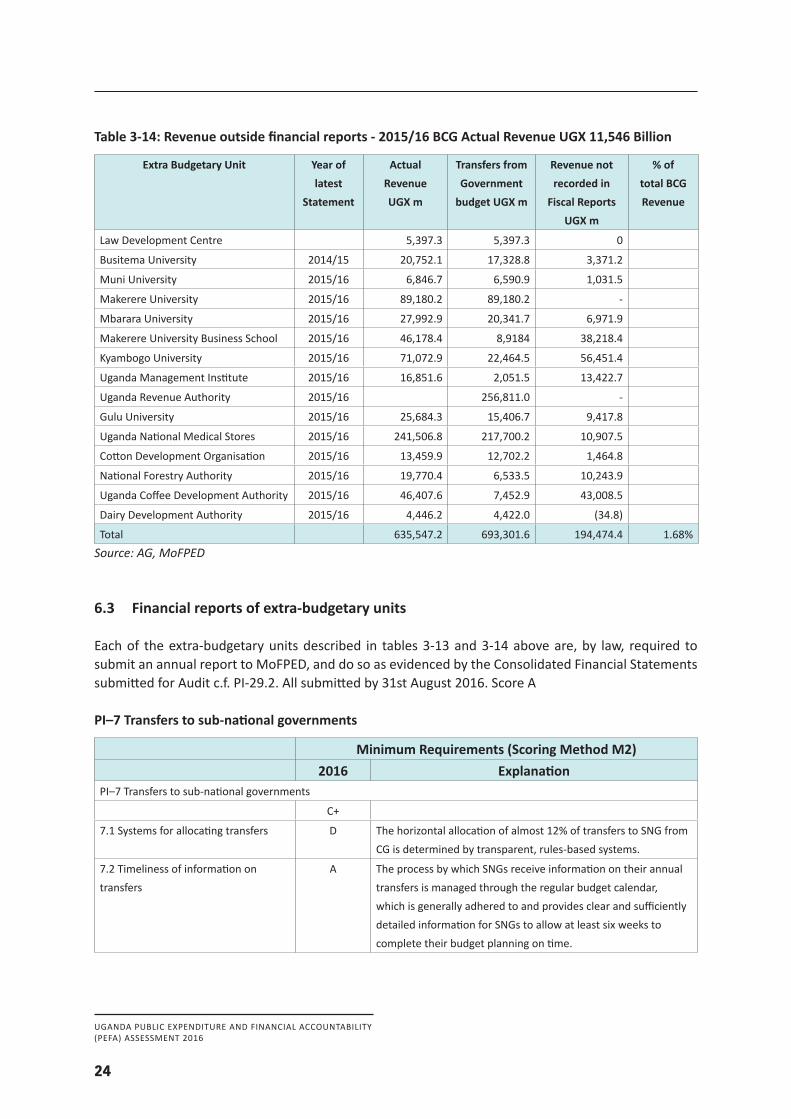
6.2 Revenue outside financial reports
Table 3-14 sets out the value of revenue for each extra-budgetary unit. Expenditure not in fiscal reports is calculated by subtracting the value of transfers from the government budget (that are included in the financial reports) from actual revenue of the unit. The total amount of expenditure outside the reports is estimated to be 1.68% of BCG revenue. Score B
UGANDA PUBLIC EXPENDITURE AND FINANCIAL ACCOUNTABILITY(PEFA) ASSESSMENT 2016
24
Table 3-14: Revenue outside financial reports - 2015/16 BCG Actual Revenue UGX 11,546 Billion
Extra Budgetary Unit Year of latest
Statement
Actual RevenueUGX m
Transfers from Government
budget UGX m
Revenue not recorded in
Fiscal Reports UGX m
% of total BCG Revenue
Law Development Centre 5,397.3 5,397.3 0
Busitema University 2014/15 20,752.1 17,328.8 3,371.2
Muni University 2015/16 6,846.7 6,590.9 1,031.5
Makerere University 2015/16 89,180.2 89,180.2 -
Mbarara University 2015/16 27,992.9 20,341.7 6,971.9
Makerere University Business School 2015/16 46,178.4 8,9184 38,218.4
Kyambogo University 2015/16 71,072.9 22,464.5 56,451.4
Uganda Management Institute 2015/16 16,851.6 2,051.5 13,422.7
Uganda Revenue Authority 2015/16 256,811.0 -
Gulu University 2015/16 25,684.3 15,406.7 9,417.8
Uganda National Medical Stores 2015/16 241,506.8 217,700.2 10,907.5
Cotton Development Organisation 2015/16 13,459.9 12,702.2 1,464.8
National Forestry Authority 2015/16 19,770.4 6,533.5 10,243.9
Uganda Coffee Development Authority 2015/16 46,407.6 7,452.9 43,008.5
Dairy Development Authority 2015/16 4,446.2 4,422.0 (34.8)
Total 635,547.2 693,301.6 194,474.4 1.68%Source:AG,MoFPED
6.3 Financial reports of extra-budgetary units
Each of the extra-budgetary units described in tables 3-13 and 3-14 above are, by law, required to submit an annual report to MoFPED, and do so as evidenced by the Consolidated Financial Statements submitted for Audit c.f. PI-29.2. All submitted by 31st August 2016. Score A
PI–7 Transfers to sub-national governments
Minimum Requirements (Scoring Method M2)2016 Explanation
PI–7 Transfers to sub-national governments
C+
7.1 Systems for allocating transfers D The horizontal allocation of almost 12% of transfers to SNG from CG is determined by transparent, rules-based systems.
7.2 Timeliness of information on transfers
A The process by which SNGs receive information on their annual transfers is managed through the regular budget calendar, which is generally adhered to and provides clear and sufficiently detailed information for SNGs to allow at least six weeks to complete their budget planning on time.
UGANDA PUBLIC EXPENDITURE AND FINANCIAL ACCOUNTABILITY(PEFA) ASSESSMENT 2016
25
This indicator assesses the transparency and timeliness of transfers from central government to sub-national governments with a direct financial relationship. It considers the basis for transfers from central government and whether sub-national governments receive information on their allocations in time to facilitate budget planning. The assessment of this indicator is based on fiscal year 2015-16.
7.1 Systems for allocating transfers
There are 130 Districts, 25 municipalities and Kampala Capital City Authority (KCCA) in Uganda constituting the higher level of local government. Over 90 new districts have been created in the past 30 years. Chairpersons/mayors and councillors of districts, municipalities and KCCA are elected.
Unconditional grants are published on the MoFPED website. There is a formula which is specified in the Constitution of Uganda – Schedule 7, Art 193. The unconditional grant is the minimum amount to be paid to the local governments to run the decentralised services. For a given fiscal year, this amount is equal to the amount paid to local governments in the preceding fiscal year for the same items adjusted for general price changes plus or minus the budgeted cost of running added or subtracted services; calculated in accordance with the following formula—
Y1 = Yo + b Yo + X1 = (1+b)Yo + X1Where—
Y1 is the minimum unconditional grant for the current fiscal year;Yo is the minimum unconditional grant in the preceding fiscal year;b is the percentage change, if any, in the general price levels in the preceding fiscal year;
andX1 is the net change in the budgeted cost of running added and subtracted services in the
current year.
The unconditional grant is equal to the sum of wage and nonwage components. Therefore, the wage components should be adjusted for the wage increase, if any, while the nonwage component is adjusted for the changes in the general price levels.
A revised formula is to be introduced in FY 2017/18.
Equalisation grants are also formula driven with weighting given to population, education and health needs and poverty levels. They are now a negligible part of transfers, as can be seen in the table below.
Conditional grants are numerous (though recently reduced from 56 to 13). They are overwhelmingly the majority of transfers to LG, as can be seen from the table below. This is determined through an elaborate consultative process between line ministries and the Local Government Finance Commission, which represents the Local Governments in a transparent and orderly manner with proceedings published5. Line ministries argue that the requirements of the NDP mean that they should determine levels of grants in their sectors.
5 Sector conditional grant negotiations between local governments (UNAT) and sector ministries for FY 2017/18 - a report on the negotiation proceedings 7th to 11th November 2016 Piato conference center, Kampala.
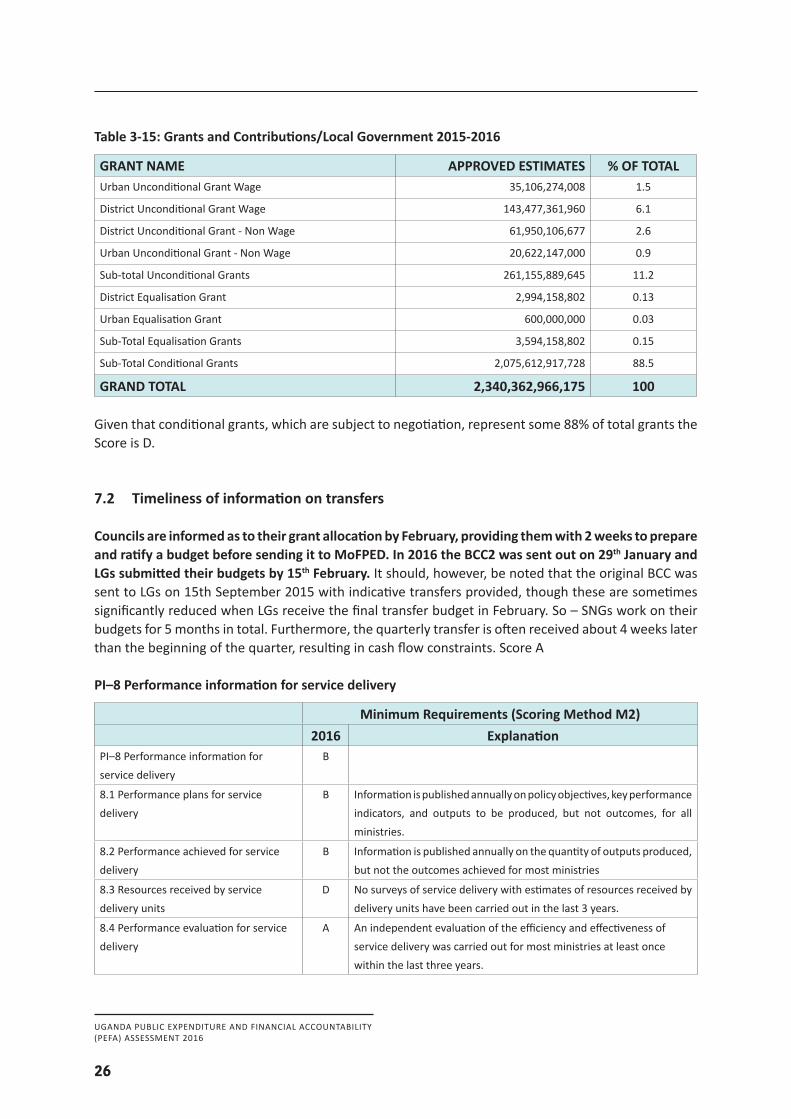
UGANDA PUBLIC EXPENDITURE AND FINANCIAL ACCOUNTABILITY(PEFA) ASSESSMENT 2016
26
Table 3-15: Grants and Contributions/Local Government 2015-2016
GRANT NAME APPROVED ESTIMATES % OF TOTALUrban Unconditional Grant Wage 35,106,274,008 1.5
District Unconditional Grant Wage 143,477,361,960 6.1
District Unconditional Grant - Non Wage 61,950,106,677 2.6
Urban Unconditional Grant - Non Wage 20,622,147,000 0.9
Sub-total Unconditional Grants 261,155,889,645 11.2
District Equalisation Grant 2,994,158,802 0.13
Urban Equalisation Grant 600,000,000 0.03
Sub-Total Equalisation Grants 3,594,158,802 0.15
Sub-Total Conditional Grants 2,075,612,917,728 88.5
GRAND TOTAL 2,340,362,966,175 100
Given that conditional grants, which are subject to negotiation, represent some 88% of total grants the Score is D.
7.2 Timeliness of information on transfers
Councils are informed as to their grant allocation by February, providing them with 2 weeks to prepare and ratify a budget before sending it to MoFPED. In 2016 the BCC2 was sent out on 29th January and LGs submitted their budgets by 15th February. It should, however, be noted that the original BCC was sent to LGs on 15th September 2015 with indicative transfers provided, though these are sometimes significantly reduced when LGs receive the final transfer budget in February. So – SNGs work on their budgets for 5 months in total. Furthermore, the quarterly transfer is often received about 4 weeks later than the beginning of the quarter, resulting in cash flow constraints. Score A
PI–8 Performance information for service delivery
Minimum Requirements (Scoring Method M2)2016 Explanation
PI–8 Performance information for service delivery
B
8.1 Performance plans for service delivery
B Information is published annually on policy objectives, key performance indicators, and outputs to be produced, but not outcomes, for all ministries.
8.2 Performance achieved for service delivery
B Information is published annually on the quantity of outputs produced, but not the outcomes achieved for most ministries
8.3 Resources received by service delivery units
D No surveys of service delivery with estimates of resources received by delivery units have been carried out in the last 3 years.
8.4 Performance evaluation for service delivery
A An independent evaluation of the efficiency and effectiveness of service delivery was carried out for most ministries at least once within the last three years.
UGANDA PUBLIC EXPENDITURE AND FINANCIAL ACCOUNTABILITY(PEFA) ASSESSMENT 2016
27
This indicator examines the service delivery performance information in the executive’s budget proposal or its supporting documentation, in year-end reports, and in audit reports or performance evaluation reports. It also measures the extent to which service delivery units receive and spend resources allocated in the budget. The assessment is based, for dimension 8.1, on the plans for the next fiscal year, 2016-17. For dimension 8.2, the last completed fiscal year, 2015-16 and for dimension 8.3 and 8.4, the last three completed fiscal years, 2013-14, 2014-15 and 2015-16.
8.1 Performance plans for service delivery
Information on performance is planned and published on the MoFPED website under the Output Based Budgeting Tool. All MDAs prepare a work plan, which includes information on performance. The data from these plans are then uploaded to the Output Based Budget Tool (OBT) software. The work plans include policy objectives in line with the NDP, key performance indicators and outputs to be produced.6 Outcomes appear to be included in plans but on inspection are closer to outputs than outcomes. However, this is set to change as GoU moves from the current Output Based Budgeting Tool (OBT) to Programme Based Budgeting (PBB). Score B
8.2 Performance achieved for service delivery
All ministries produce information on outputs achieved and are currently moving towards detailing outcomes.7
The Budget Monitoring and Accountability Unit (BMAU) was established in FY2008/09 in MoFPED to provide comprehensive information for removing key implementation bottlenecks. It has over 40 staff including various types of engineers. BMAU is charged with tracking implementation of selected government programmes or projects and observing how values of different financial and physical indicators change over time against stated goals and targets (how things are working). This is achieved through semi-annual and annual field monitoring exercises to verify receipt and application of funds by the user entities. Where applicable, beneficiaries are sampled to establish their level of satisfaction with the public service, often organised as community monitoring teams. BMAU prepares semi-annual and annual monitoring reports of selected government programmes and projects. The monitoring is confined to levels of inputs, outputs and intermediate outcomes in the following areas:
6 http://budget.go.ug/budget/national-budget-performance-reports7 http://budget.go.ug/budget/national-budget-performance-reports
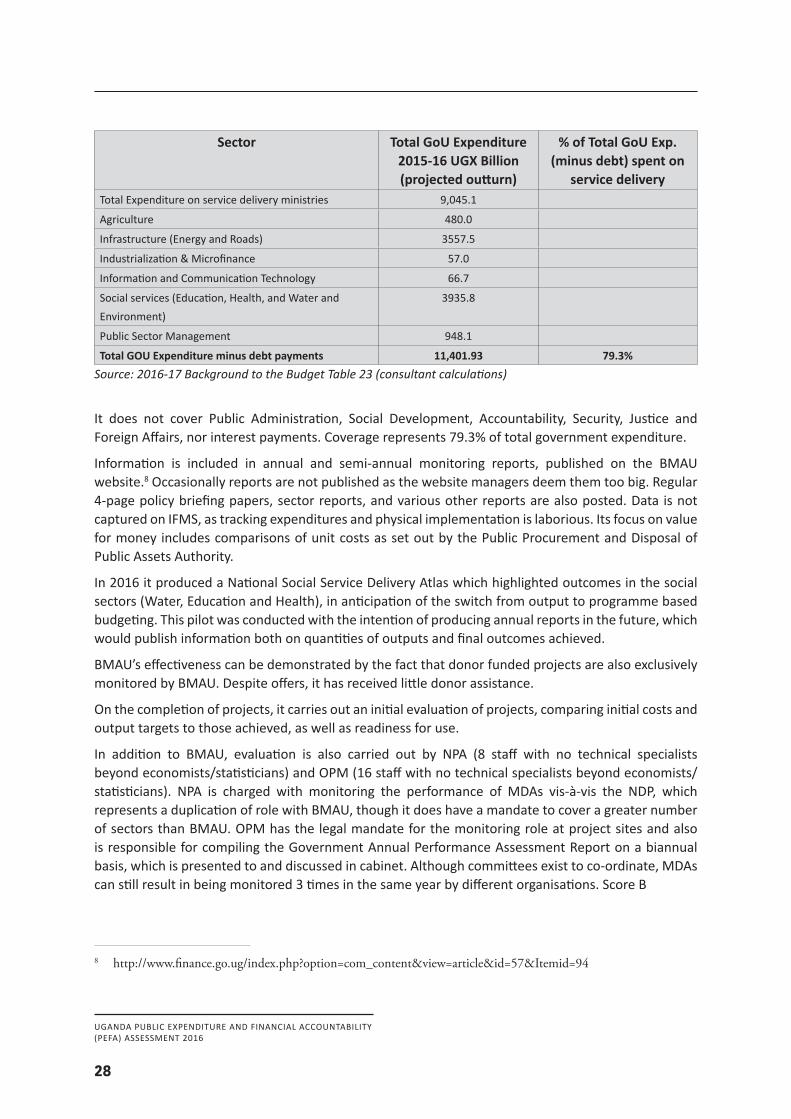
UGANDA PUBLIC EXPENDITURE AND FINANCIAL ACCOUNTABILITY(PEFA) ASSESSMENT 2016
28
Sector Total GoU Expenditure 2015-16 UGX Billion (projected outturn)
% of Total GoU Exp. (minus debt) spent on
service deliveryTotal Expenditure on service delivery ministries 9,045.1
Agriculture 480.0
Infrastructure (Energy and Roads) 3557.5
Industrialization & Microfinance 57.0
Information and Communication Technology 66.7
Social services (Education, Health, and Water and Environment)
3935.8
Public Sector Management 948.1
Total GOU Expenditure minus debt payments 11,401.93 79.3%Source:2016-17BackgroundtotheBudgetTable23(consultantcalculations)
It does not cover Public Administration, Social Development, Accountability, Security, Justice and Foreign Affairs, nor interest payments. Coverage represents 79.3% of total government expenditure.
Information is included in annual and semi-annual monitoring reports, published on the BMAU website.8 Occasionally reports are not published as the website managers deem them too big. Regular 4-page policy briefing papers, sector reports, and various other reports are also posted. Data is not captured on IFMS, as tracking expenditures and physical implementation is laborious. Its focus on value for money includes comparisons of unit costs as set out by the Public Procurement and Disposal of Public Assets Authority.
In 2016 it produced a National Social Service Delivery Atlas which highlighted outcomes in the social sectors (Water, Education and Health), in anticipation of the switch from output to programme based budgeting. This pilot was conducted with the intention of producing annual reports in the future, which would publish information both on quantities of outputs and final outcomes achieved.
BMAU’s effectiveness can be demonstrated by the fact that donor funded projects are also exclusively monitored by BMAU. Despite offers, it has received little donor assistance.
On the completion of projects, it carries out an initial evaluation of projects, comparing initial costs and output targets to those achieved, as well as readiness for use.
In addition to BMAU, evaluation is also carried out by NPA (8 staff with no technical specialists beyond economists/statisticians) and OPM (16 staff with no technical specialists beyond economists/statisticians). NPA is charged with monitoring the performance of MDAs vis-à-vis the NDP, which represents a duplication of role with BMAU, though it does have a mandate to cover a greater number of sectors than BMAU. OPM has the legal mandate for the monitoring role at project sites and also is responsible for compiling the Government Annual Performance Assessment Report on a biannual basis, which is presented to and discussed in cabinet. Although committees exist to co-ordinate, MDAs can still result in being monitored 3 times in the same year by different organisations. Score B
8 http://www.finance.go.ug/index.php?option=com_content&view=article&id=57&Itemid=94
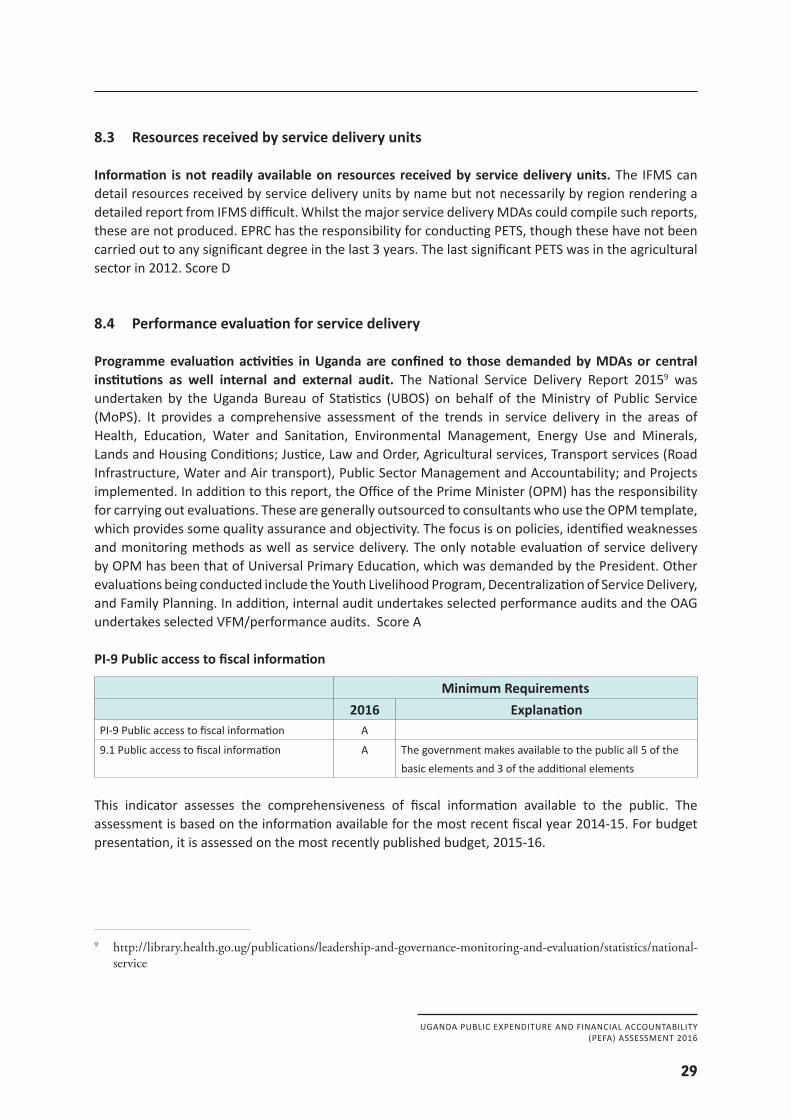
UGANDA PUBLIC EXPENDITURE AND FINANCIAL ACCOUNTABILITY(PEFA) ASSESSMENT 2016
29
8.3 Resources received by service delivery units
Information is not readily available on resources received by service delivery units. The IFMS can detail resources received by service delivery units by name but not necessarily by region rendering a detailed report from IFMS difficult. Whilst the major service delivery MDAs could compile such reports, these are not produced. EPRC has the responsibility for conducting PETS, though these have not been carried out to any significant degree in the last 3 years. The last significant PETS was in the agricultural sector in 2012. Score D
8.4 Performance evaluation for service delivery
Programme evaluation activities in Uganda are confined to those demanded by MDAs or central institutions as well internal and external audit. The National Service Delivery Report 20159 was undertaken by the Uganda Bureau of Statistics (UBOS) on behalf of the Ministry of Public Service (MoPS). It provides a comprehensive assessment of the trends in service delivery in the areas of Health, Education, Water and Sanitation, Environmental Management, Energy Use and Minerals, Lands and Housing Conditions; Justice, Law and Order, Agricultural services, Transport services (Road Infrastructure, Water and Air transport), Public Sector Management and Accountability; and Projects implemented. In addition to this report, the Office of the Prime Minister (OPM) has the responsibility for carrying out evaluations. These are generally outsourced to consultants who use the OPM template, which provides some quality assurance and objectivity. The focus is on policies, identified weaknesses and monitoring methods as well as service delivery. The only notable evaluation of service delivery by OPM has been that of Universal Primary Education, which was demanded by the President. Other evaluations being conducted include the Youth Livelihood Program, Decentralization of Service Delivery, and Family Planning. In addition, internal audit undertakes selected performance audits and the OAG undertakes selected VFM/performance audits. Score A
PI-9 Public access to fiscal information
Minimum Requirements2016 Explanation
PI-9 Public access to fiscal information A
9.1 Public access to fiscal information A The government makes available to the public all 5 of the basic elements and 3 of the additional elements
This indicator assesses the comprehensiveness of fiscal information available to the public. The assessment is based on the information available for the most recent fiscal year 2014-15. For budget presentation, it is assessed on the most recently published budget, 2015-16.
9 http://library.health.go.ug/publications/leadership-and-governance-monitoring-and-evaluation/statistics/national-service
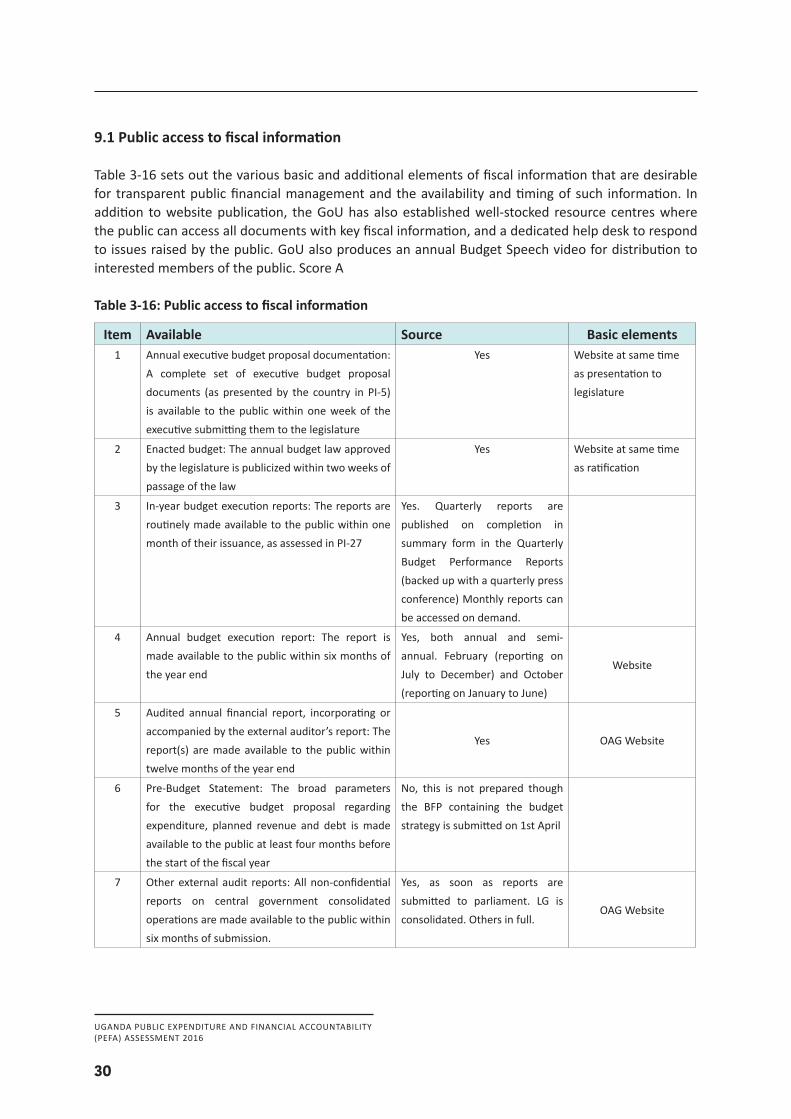
UGANDA PUBLIC EXPENDITURE AND FINANCIAL ACCOUNTABILITY(PEFA) ASSESSMENT 2016
30
9.1 Public access to fiscal information
Table 3-16 sets out the various basic and additional elements of fiscal information that are desirable for transparent public financial management and the availability and timing of such information. In addition to website publication, the GoU has also established well-stocked resource centres where the public can access all documents with key fiscal information, and a dedicated help desk to respond to issues raised by the public. GoU also produces an annual Budget Speech video for distribution to interested members of the public. Score A
Table 3-16: Public access to fiscal information
Item Available Source Basic elements1 Annual executive budget proposal documentation:
A complete set of executive budget proposal documents (as presented by the country in PI-5) is available to the public within one week of the executive submitting them to the legislature
Yes Website at same time as presentation to legislature
2 Enacted budget: The annual budget law approved by the legislature is publicized within two weeks of passage of the law
Yes Website at same time as ratification
3 In-year budget execution reports: The reports are routinely made available to the public within one month of their issuance, as assessed in PI-27
Yes. Quarterly reports are published on completion in summary form in the Quarterly Budget Performance Reports (backed up with a quarterly press conference) Monthly reports can be accessed on demand.
4 Annual budget execution report: The report is made available to the public within six months of the year end
Yes, both annual and semi-annual. February (reporting on July to December) and October (reporting on January to June)
Website
5 Audited annual financial report, incorporating or accompanied by the external auditor’s report: The report(s) are made available to the public within twelve months of the year end
Yes OAG Website
6 Pre-Budget Statement: The broad parameters for the executive budget proposal regarding expenditure, planned revenue and debt is made available to the public at least four months before the start of the fiscal year
No, this is not prepared though the BFP containing the budget strategy is submitted on 1st April
7 Other external audit reports: All non-confidential reports on central government consolidated operations are made available to the public within six months of submission.
Yes, as soon as reports are submitted to parliament. LG is consolidated. Others in full.
OAG Website
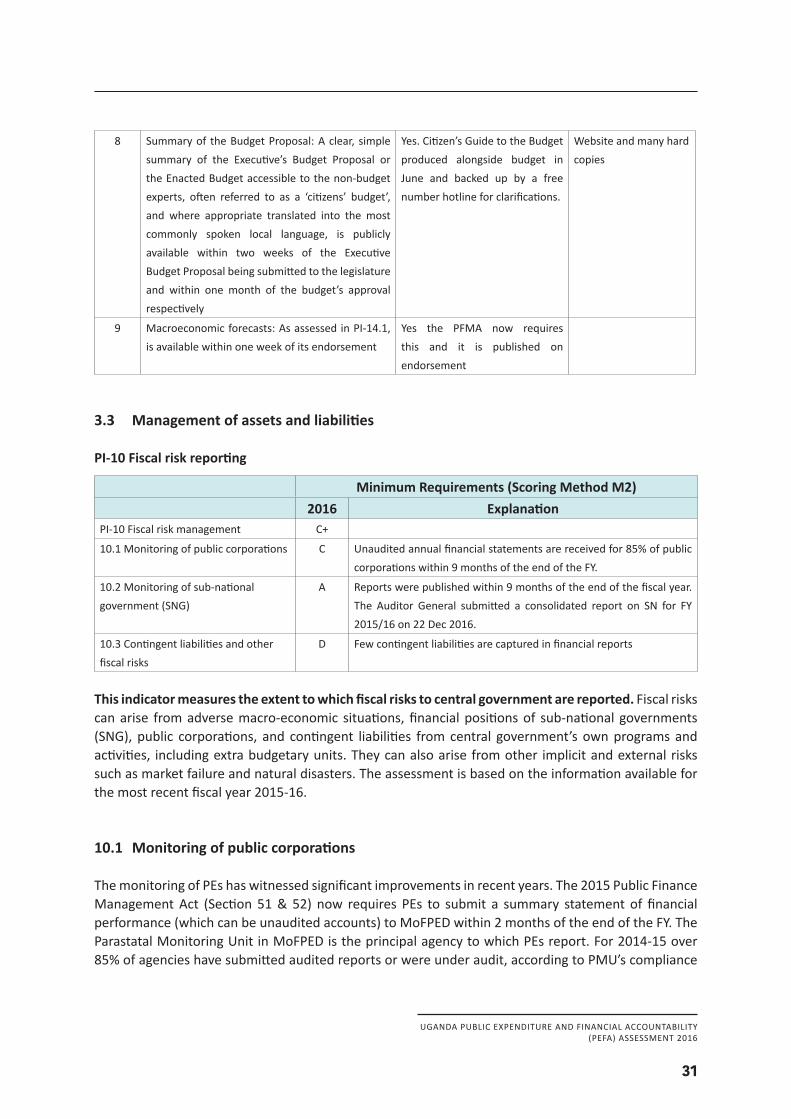
UGANDA PUBLIC EXPENDITURE AND FINANCIAL ACCOUNTABILITY(PEFA) ASSESSMENT 2016
31
8 Summary of the Budget Proposal: A clear, simple summary of the Executive’s Budget Proposal or the Enacted Budget accessible to the non-budget experts, often referred to as a ‘citizens’ budget’, and where appropriate translated into the most commonly spoken local language, is publicly available within two weeks of the Executive Budget Proposal being submitted to the legislature and within one month of the budget’s approval respectively
Yes. Citizen’s Guide to the Budget produced alongside budget in June and backed up by a free number hotline for clarifications.
Website and many hard copies
9 Macroeconomic forecasts: As assessed in PI-14.1, is available within one week of its endorsement
Yes the PFMA now requires this and it is published on endorsement
3.3 Management of assets and liabilities
PI-10 Fiscal risk reporting
Minimum Requirements (Scoring Method M2)2016 Explanation
PI-10 Fiscal risk management C+
10.1 Monitoring of public corporations C Unaudited annual financial statements are received for 85% of public corporations within 9 months of the end of the FY.
10.2 Monitoring of sub-national government (SNG)
A Reports were published within 9 months of the end of the fiscal year. The Auditor General submitted a consolidated report on SN for FY 2015/16 on 22 Dec 2016.
10.3 Contingent liabilities and other fiscal risks
D Few contingent liabilities are captured in financial reports
This indicator measures the extent to which fiscal risks to central government are reported. Fiscal risks can arise from adverse macro-economic situations, financial positions of sub-national governments (SNG), public corporations, and contingent liabilities from central government’s own programs and activities, including extra budgetary units. They can also arise from other implicit and external risks such as market failure and natural disasters. The assessment is based on the information available for the most recent fiscal year 2015-16.
10.1 Monitoring of public corporations
The monitoring of PEs has witnessed significant improvements in recent years. The 2015 Public Finance Management Act (Section 51 & 52) now requires PEs to submit a summary statement of financial performance (which can be unaudited accounts) to MoFPED within 2 months of the end of the FY. The Parastatal Monitoring Unit in MoFPED is the principal agency to which PEs report. For 2014-15 over 85% of agencies have submitted audited reports or were under audit, according to PMU’s compliance
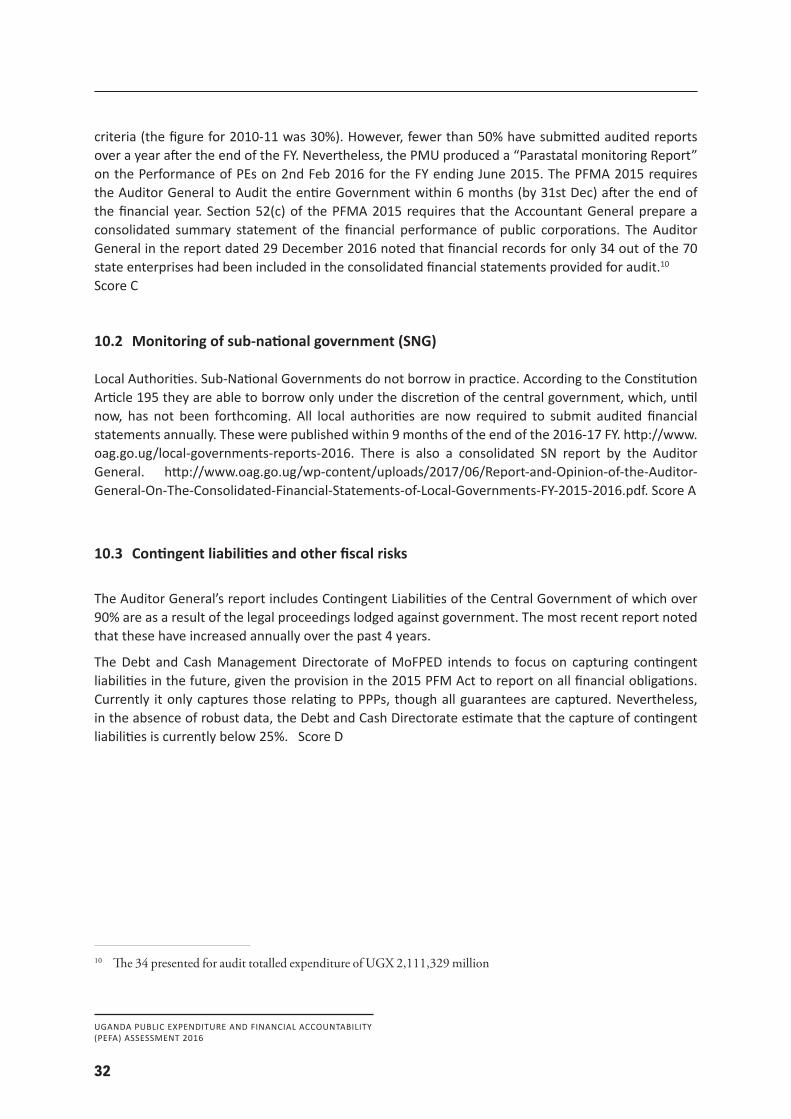
UGANDA PUBLIC EXPENDITURE AND FINANCIAL ACCOUNTABILITY(PEFA) ASSESSMENT 2016
32
criteria (the figure for 2010-11 was 30%). However, fewer than 50% have submitted audited reports over a year after the end of the FY. Nevertheless, the PMU produced a “Parastatal monitoring Report” on the Performance of PEs on 2nd Feb 2016 for the FY ending June 2015. The PFMA 2015 requires the Auditor General to Audit the entire Government within 6 months (by 31st Dec) after the end of the financial year. Section 52(c) of the PFMA 2015 requires that the Accountant General prepare a consolidated summary statement of the financial performance of public corporations. The Auditor General in the report dated 29 December 2016 noted that financial records for only 34 out of the 70 state enterprises had been included in the consolidated financial statements provided for audit.10
Score C
10.2 Monitoring of sub-national government (SNG)
Local Authorities. Sub-National Governments do not borrow in practice. According to the Constitution Article 195 they are able to borrow only under the discretion of the central government, which, until now, has not been forthcoming. All local authorities are now required to submit audited financial statements annually. These were published within 9 months of the end of the 2016-17 FY. http://www.oag.go.ug/local-governments-reports-2016. There is also a consolidated SN report by the Auditor General. http://www.oag.go.ug/wp-content/uploads/2017/06/Report-and-Opinion-of-the-Auditor-General-On-The-Consolidated-Financial-Statements-of-Local-Governments-FY-2015-2016.pdf. Score A
10.3 Contingent liabilities and other fiscal risks
The Auditor General’s report includes Contingent Liabilities of the Central Government of which over 90% are as a result of the legal proceedings lodged against government. The most recent report noted that these have increased annually over the past 4 years.
The Debt and Cash Management Directorate of MoFPED intends to focus on capturing contingent liabilities in the future, given the provision in the 2015 PFM Act to report on all financial obligations. Currently it only captures those relating to PPPs, though all guarantees are captured. Nevertheless, in the absence of robust data, the Debt and Cash Directorate estimate that the capture of contingent liabilities is currently below 25%. Score D
10 The 34 presented for audit totalled expenditure of UGX 2,111,329 million
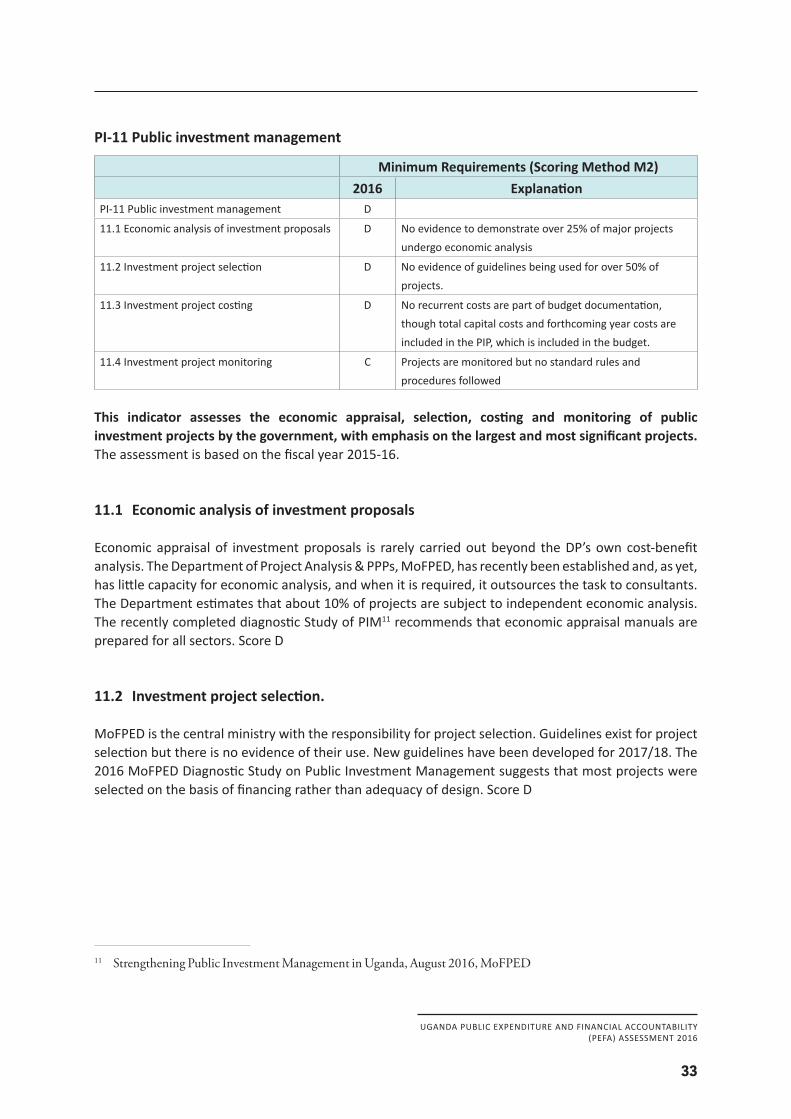
UGANDA PUBLIC EXPENDITURE AND FINANCIAL ACCOUNTABILITY(PEFA) ASSESSMENT 2016
33
PI-11 Public investment management
Minimum Requirements (Scoring Method M2)2016 Explanation
PI-11 Public investment management D
11.1 Economic analysis of investment proposals D No evidence to demonstrate over 25% of major projects undergo economic analysis
11.2 Investment project selection D No evidence of guidelines being used for over 50% of projects.
11.3 Investment project costing D No recurrent costs are part of budget documentation, though total capital costs and forthcoming year costs are included in the PIP, which is included in the budget.
11.4 Investment project monitoring C Projects are monitored but no standard rules and procedures followed
This indicator assesses the economic appraisal, selection, costing and monitoring of public investment projects by the government, with emphasis on the largest and most significant projects. The assessment is based on the fiscal year 2015-16.
11.1 Economic analysis of investment proposals
Economic appraisal of investment proposals is rarely carried out beyond the DP’s own cost-benefit analysis. The Department of Project Analysis & PPPs, MoFPED, has recently been established and, as yet, has little capacity for economic analysis, and when it is required, it outsources the task to consultants. The Department estimates that about 10% of projects are subject to independent economic analysis. The recently completed diagnostic Study of PIM11 recommends that economic appraisal manuals are prepared for all sectors. Score D
11.2 Investment project selection.
MoFPED is the central ministry with the responsibility for project selection. Guidelines exist for project selection but there is no evidence of their use. New guidelines have been developed for 2017/18. The 2016 MoFPED Diagnostic Study on Public Investment Management suggests that most projects were selected on the basis of financing rather than adequacy of design. Score D
11 Strengthening Public Investment Management in Uganda, August 2016, MoFPED
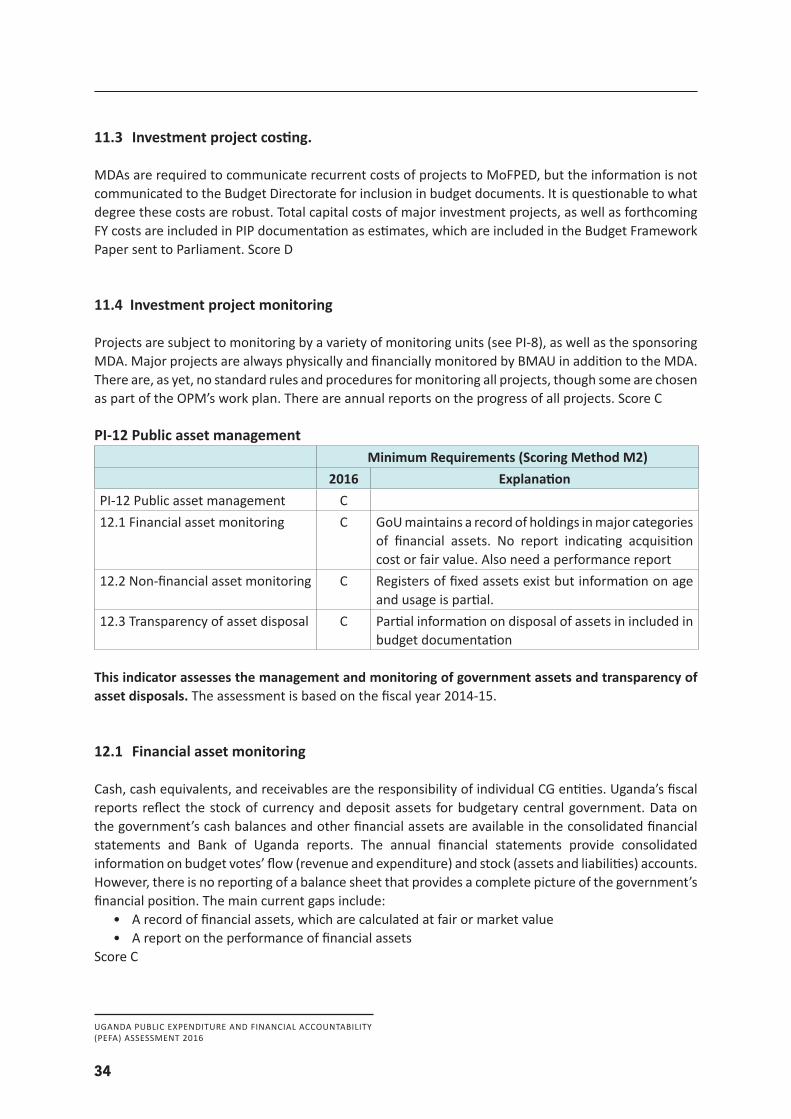
UGANDA PUBLIC EXPENDITURE AND FINANCIAL ACCOUNTABILITY(PEFA) ASSESSMENT 2016
34
11.3 Investment project costing.
MDAs are required to communicate recurrent costs of projects to MoFPED, but the information is not communicated to the Budget Directorate for inclusion in budget documents. It is questionable to what degree these costs are robust. Total capital costs of major investment projects, as well as forthcoming FY costs are included in PIP documentation as estimates, which are included in the Budget Framework Paper sent to Parliament. Score D
11.4 Investment project monitoring
Projects are subject to monitoring by a variety of monitoring units (see PI-8), as well as the sponsoring MDA. Major projects are always physically and financially monitored by BMAU in addition to the MDA. There are, as yet, no standard rules and procedures for monitoring all projects, though some are chosen as part of the OPM’s work plan. There are annual reports on the progress of all projects. Score C
PI-12 Public asset managementMinimum Requirements (Scoring Method M2)
2016 ExplanationPI-12 Public asset management C12.1 Financial asset monitoring C GoU maintains a record of holdings in major categories
of financial assets. No report indicating acquisition cost or fair value. Also need a performance report
12.2 Non-financial asset monitoring C Registers of fixed assets exist but information on age and usage is partial.
12.3 Transparency of asset disposal C Partial information on disposal of assets in included in budget documentation
This indicator assesses the management and monitoring of government assets and transparency of asset disposals. The assessment is based on the fiscal year 2014-15.
12.1 Financial asset monitoring
Cash, cash equivalents, and receivables are the responsibility of individual CG entities. Uganda’s fiscal reports reflect the stock of currency and deposit assets for budgetary central government. Data on the government’s cash balances and other financial assets are available in the consolidated financial statements and Bank of Uganda reports. The annual financial statements provide consolidated information on budget votes’ flow (revenue and expenditure) and stock (assets and liabilities) accounts. However, there is no reporting of a balance sheet that provides a complete picture of the government’s financial position. The main current gaps include:
• A record of financial assets, which are calculated at fair or market value• A report on the performance of financial assets
Score C
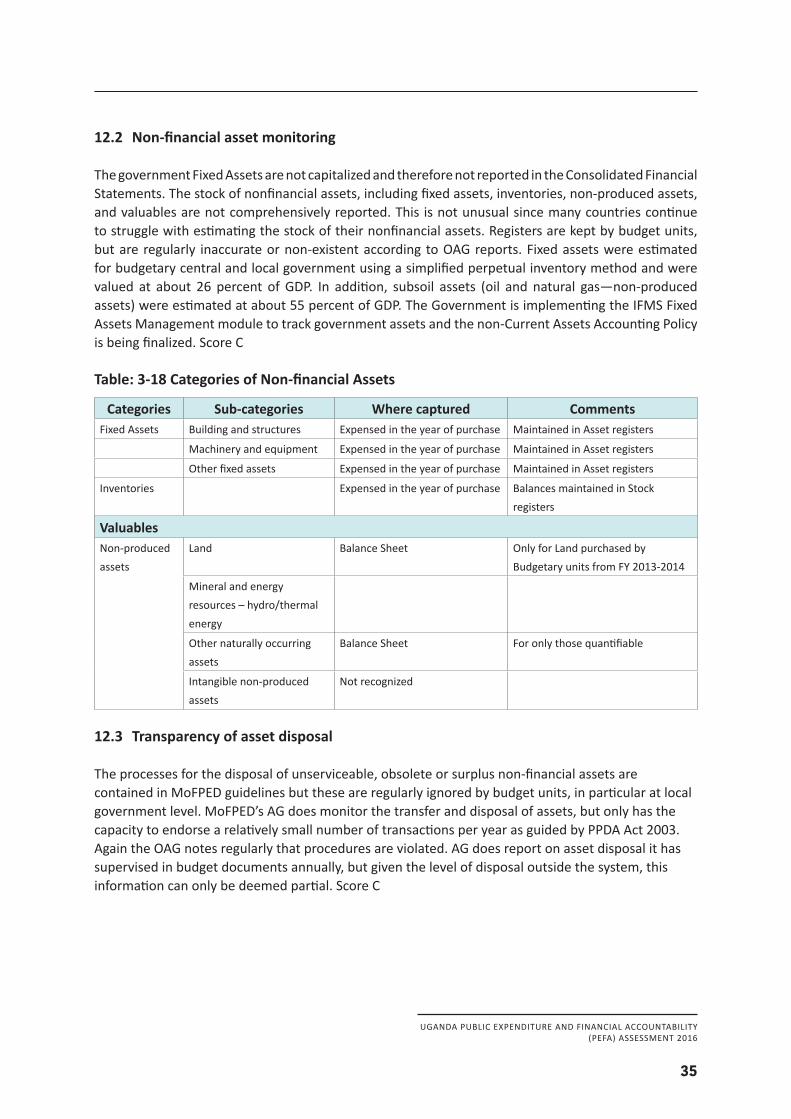
UGANDA PUBLIC EXPENDITURE AND FINANCIAL ACCOUNTABILITY(PEFA) ASSESSMENT 2016
35
12.2 Non-financial asset monitoring
The government Fixed Assets are not capitalized and therefore not reported in the Consolidated Financial Statements. The stock of nonfinancial assets, including fixed assets, inventories, non-produced assets, and valuables are not comprehensively reported. This is not unusual since many countries continue to struggle with estimating the stock of their nonfinancial assets. Registers are kept by budget units, but are regularly inaccurate or non-existent according to OAG reports. Fixed assets were estimated for budgetary central and local government using a simplified perpetual inventory method and were valued at about 26 percent of GDP. In addition, subsoil assets (oil and natural gas—non-produced assets) were estimated at about 55 percent of GDP. The Government is implementing the IFMS Fixed Assets Management module to track government assets and the non-Current Assets Accounting Policy is being finalized. Score C
Table: 3-18 Categories of Non-financial Assets
Categories Sub-categories Where captured CommentsFixed Assets Building and structures Expensed in the year of purchase Maintained in Asset registers
Machinery and equipment Expensed in the year of purchase Maintained in Asset registers
Other fixed assets Expensed in the year of purchase Maintained in Asset registers
Inventories Expensed in the year of purchase Balances maintained in Stock registers
ValuablesNon-produced assets
Land Balance Sheet Only for Land purchased by Budgetary units from FY 2013-2014
Mineral and energy resources – hydro/thermal energy
Other naturally occurring assets
Balance Sheet For only those quantifiable
Intangible non-produced assets
Not recognized
12.3 Transparency of asset disposal
The processes for the disposal of unserviceable, obsolete or surplus non-financial assets are contained in MoFPED guidelines but these are regularly ignored by budget units, in particular at local government level. MoFPED’s AG does monitor the transfer and disposal of assets, but only has the capacity to endorse a relatively small number of transactions per year as guided by PPDA Act 2003. Again the OAG notes regularly that procedures are violated. AG does report on asset disposal it has supervised in budget documents annually, but given the level of disposal outside the system, this information can only be deemed partial. Score C
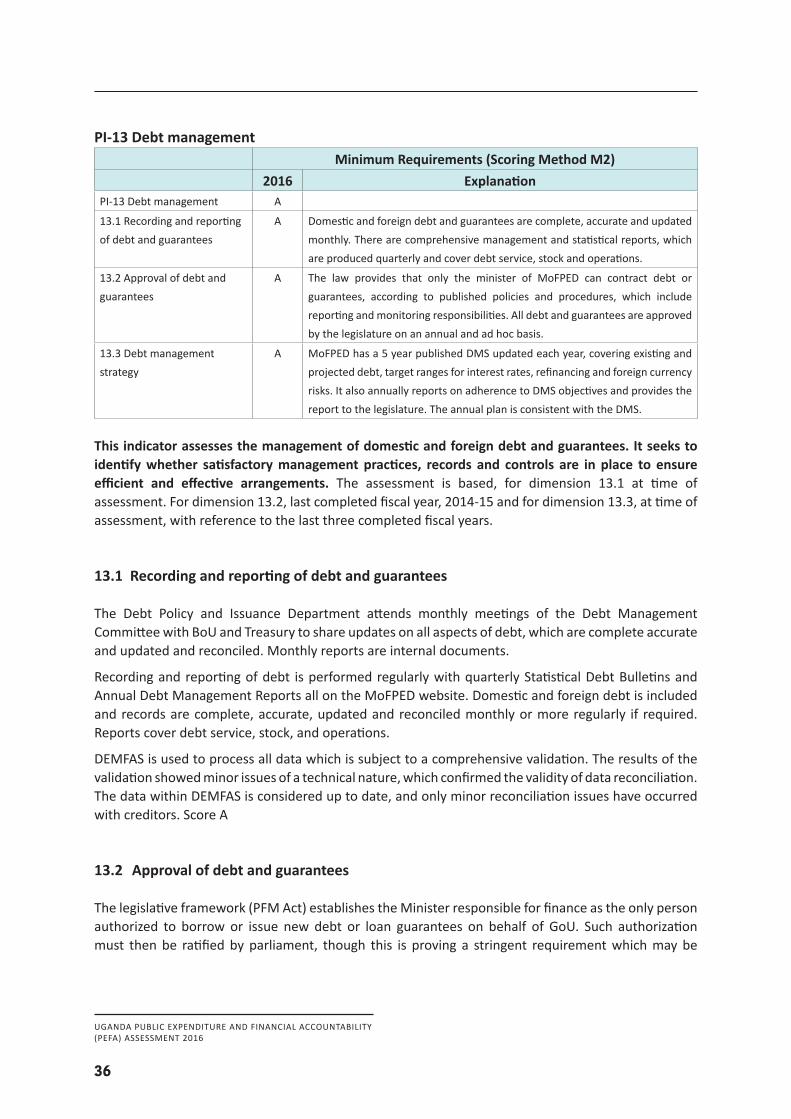
UGANDA PUBLIC EXPENDITURE AND FINANCIAL ACCOUNTABILITY(PEFA) ASSESSMENT 2016
36
PI-13 Debt managementMinimum Requirements (Scoring Method M2)
2016 ExplanationPI-13 Debt management A
13.1 Recording and reporting of debt and guarantees
A Domestic and foreign debt and guarantees are complete, accurate and updated monthly. There are comprehensive management and statistical reports, which are produced quarterly and cover debt service, stock and operations.
13.2 Approval of debt and guarantees
A The law provides that only the minister of MoFPED can contract debt or guarantees, according to published policies and procedures, which include reporting and monitoring responsibilities. All debt and guarantees are approved by the legislature on an annual and ad hoc basis.
13.3 Debt management strategy
A MoFPED has a 5 year published DMS updated each year, covering existing and projected debt, target ranges for interest rates, refinancing and foreign currency risks. It also annually reports on adherence to DMS objectives and provides the report to the legislature. The annual plan is consistent with the DMS.
This indicator assesses the management of domestic and foreign debt and guarantees. It seeks to identify whether satisfactory management practices, records and controls are in place to ensure efficient and effective arrangements. The assessment is based, for dimension 13.1 at time of assessment. For dimension 13.2, last completed fiscal year, 2014-15 and for dimension 13.3, at time of assessment, with reference to the last three completed fiscal years.
13.1 Recording and reporting of debt and guarantees
The Debt Policy and Issuance Department attends monthly meetings of the Debt Management Committee with BoU and Treasury to share updates on all aspects of debt, which are complete accurate and updated and reconciled. Monthly reports are internal documents.
Recording and reporting of debt is performed regularly with quarterly Statistical Debt Bulletins and Annual Debt Management Reports all on the MoFPED website. Domestic and foreign debt is included and records are complete, accurate, updated and reconciled monthly or more regularly if required. Reports cover debt service, stock, and operations.
DEMFAS is used to process all data which is subject to a comprehensive validation. The results of the validation showed minor issues of a technical nature, which confirmed the validity of data reconciliation. The data within DEMFAS is considered up to date, and only minor reconciliation issues have occurred with creditors. Score A
13.2 Approval of debt and guarantees
The legislative framework (PFM Act) establishes the Minister responsible for finance as the only person authorized to borrow or issue new debt or loan guarantees on behalf of GoU. Such authorization must then be ratified by parliament, though this is proving a stringent requirement which may be
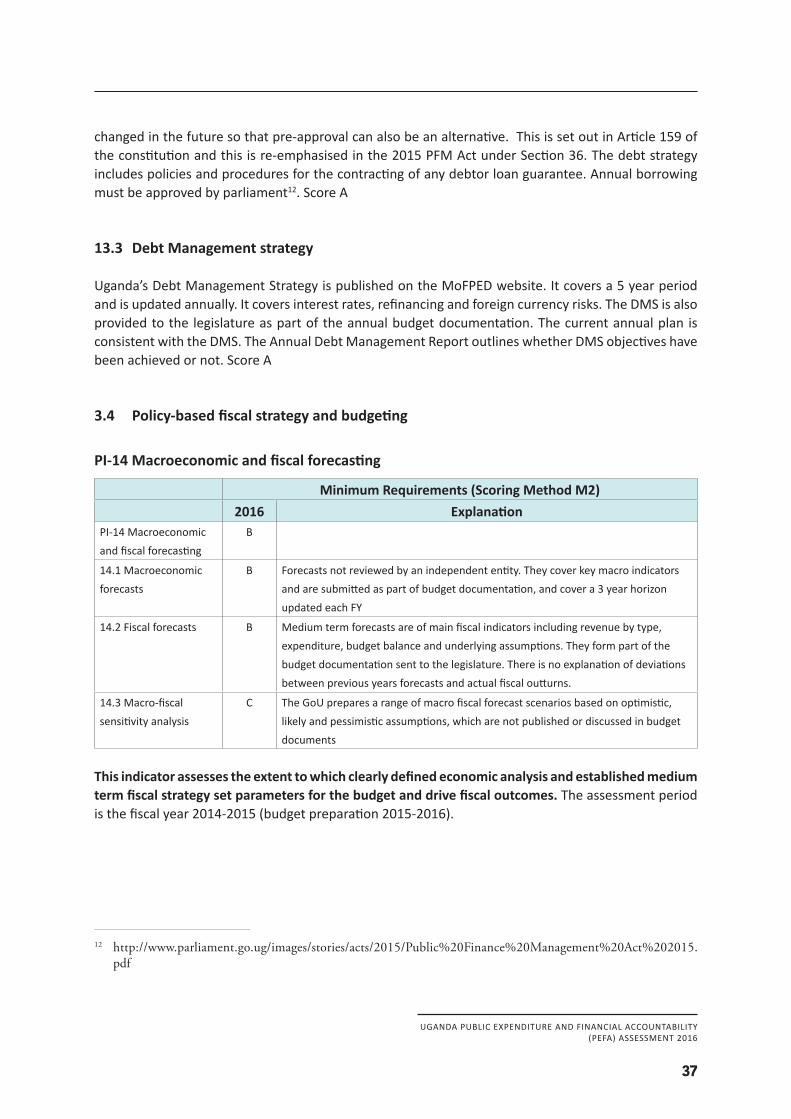
UGANDA PUBLIC EXPENDITURE AND FINANCIAL ACCOUNTABILITY(PEFA) ASSESSMENT 2016
37
changed in the future so that pre-approval can also be an alternative. This is set out in Article 159 of the constitution and this is re-emphasised in the 2015 PFM Act under Section 36. The debt strategy includes policies and procedures for the contracting of any debtor loan guarantee. Annual borrowing must be approved by parliament12. Score A
13.3 Debt Management strategy
Uganda’s Debt Management Strategy is published on the MoFPED website. It covers a 5 year period and is updated annually. It covers interest rates, refinancing and foreign currency risks. The DMS is also provided to the legislature as part of the annual budget documentation. The current annual plan is consistent with the DMS. The Annual Debt Management Report outlines whether DMS objectives have been achieved or not. Score A
3.4 Policy-based fiscal strategy and budgeting
PI-14 Macroeconomic and fiscal forecasting
Minimum Requirements (Scoring Method M2)2016 Explanation
PI-14 Macroeconomic and fiscal forecasting
B
14.1 Macroeconomic forecasts
B Forecasts not reviewed by an independent entity. They cover key macro indicators and are submitted as part of budget documentation, and cover a 3 year horizon updated each FY
14.2 Fiscal forecasts B Medium term forecasts are of main fiscal indicators including revenue by type, expenditure, budget balance and underlying assumptions. They form part of the budget documentation sent to the legislature. There is no explanation of deviations between previous years forecasts and actual fiscal outturns.
14.3 Macro-fiscal sensitivity analysis
C The GoU prepares a range of macro fiscal forecast scenarios based on optimistic, likely and pessimistic assumptions, which are not published or discussed in budget documents
This indicator assesses the extent to which clearly defined economic analysis and established medium term fiscal strategy set parameters for the budget and drive fiscal outcomes. The assessment period is the fiscal year 2014-2015 (budget preparation 2015-2016).
12 http://www.parliament.go.ug/images/stories/acts/2015/Public%20Finance%20Management%20Act%202015.pdf
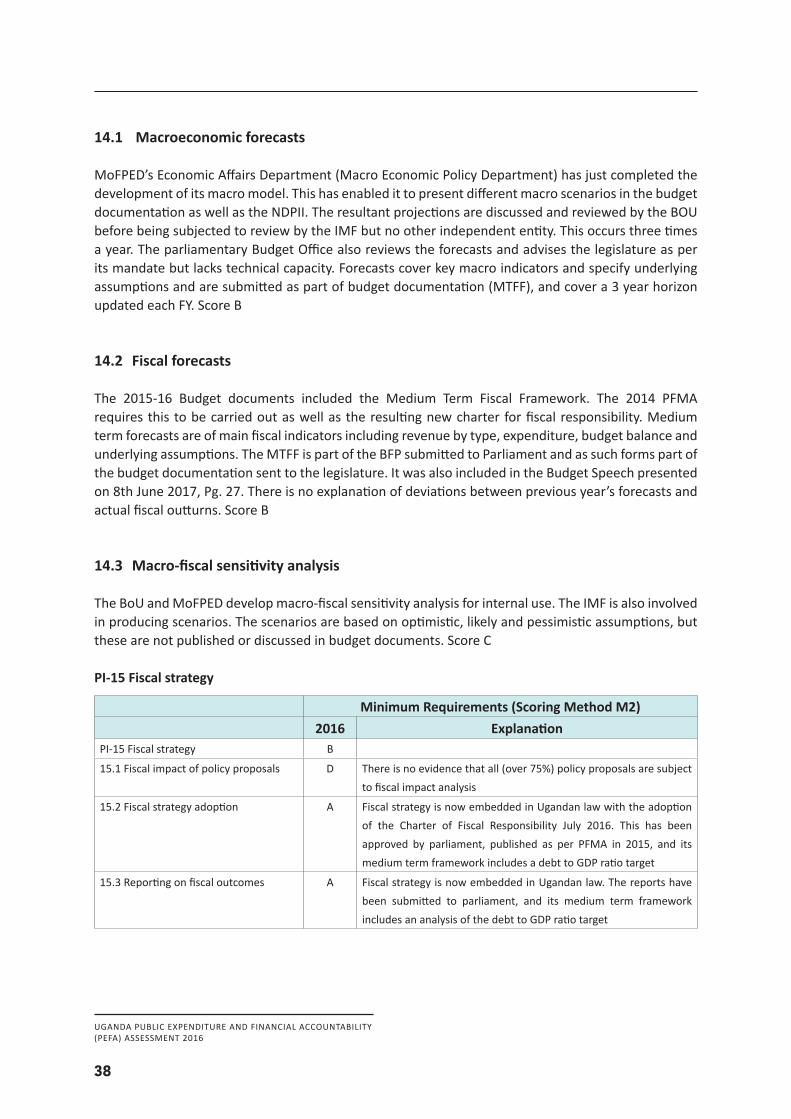
UGANDA PUBLIC EXPENDITURE AND FINANCIAL ACCOUNTABILITY(PEFA) ASSESSMENT 2016
38
14.1 Macroeconomic forecasts
MoFPED’s Economic Affairs Department (Macro Economic Policy Department) has just completed the development of its macro model. This has enabled it to present different macro scenarios in the budget documentation as well as the NDPII. The resultant projections are discussed and reviewed by the BOU before being subjected to review by the IMF but no other independent entity. This occurs three times a year. The parliamentary Budget Office also reviews the forecasts and advises the legislature as per its mandate but lacks technical capacity. Forecasts cover key macro indicators and specify underlying assumptions and are submitted as part of budget documentation (MTFF), and cover a 3 year horizon updated each FY. Score B
14.2 Fiscal forecasts
The 2015-16 Budget documents included the Medium Term Fiscal Framework. The 2014 PFMA requires this to be carried out as well as the resulting new charter for fiscal responsibility. Medium term forecasts are of main fiscal indicators including revenue by type, expenditure, budget balance and underlying assumptions. The MTFF is part of the BFP submitted to Parliament and as such forms part of the budget documentation sent to the legislature. It was also included in the Budget Speech presented on 8th June 2017, Pg. 27. There is no explanation of deviations between previous year’s forecasts and actual fiscal outturns. Score B
14.3 Macro-fiscal sensitivity analysis
The BoU and MoFPED develop macro-fiscal sensitivity analysis for internal use. The IMF is also involved in producing scenarios. The scenarios are based on optimistic, likely and pessimistic assumptions, but these are not published or discussed in budget documents. Score C
PI-15 Fiscal strategy
Minimum Requirements (Scoring Method M2)2016 Explanation
PI-15 Fiscal strategy B
15.1 Fiscal impact of policy proposals D There is no evidence that all (over 75%) policy proposals are subject to fiscal impact analysis
15.2 Fiscal strategy adoption A Fiscal strategy is now embedded in Ugandan law with the adoption of the Charter of Fiscal Responsibility July 2016. This has been approved by parliament, published as per PFMA in 2015, and its medium term framework includes a debt to GDP ratio target
15.3 Reporting on fiscal outcomes A Fiscal strategy is now embedded in Ugandan law. The reports have been submitted to parliament, and its medium term framework includes an analysis of the debt to GDP ratio target
UGANDA PUBLIC EXPENDITURE AND FINANCIAL ACCOUNTABILITY(PEFA) ASSESSMENT 2016
39
This indicator provides an analysis of the capacity to develop and implement a clear fiscal strategy. It also measures the ability to develop and assess the fiscal impact of revenue and expenditure policy proposals that support the achievement of the government’s fiscal goals. The assessment is based on, for dimension 15.1, last three completed fiscal years, 2012-13, 2013-14 and 2014-15. For dimensions 15.2 and 15.3, last completed fiscal year, 2014-15.
15.1 Fiscal impact of policy proposals
Assessing the fiscal impact of some new policy proposals (particularly taxation and other revenue proposals and salaries) is carried out as part of the budget speech and in the Budge Framework Paper. However, there is no evidence that this is carried out systematically for all policy proposals, despite the requirement that all policies proposals be accompanied by a certificate of financial implication before approval by cabinet. Score D
15.2 Fiscal strategy adoption
Fiscal strategy is now embedded in Ugandan law with the adoption of the Charter of Fiscal Responsibility July 2016. It ccontains Government’s measurable objectives for fiscal policy over the medium term and demonstrates their consistency with the principles for the development of fiscal policy required by Section 4(2) of the PFM Act. This has been approved by parliament, and its medium term framework includes a debt to GDP ratio target of 50% (NPV) in line with the other members of the EAC. It also includes a ceiling of the fiscal balance (including grants) of 3% of GDP. It is published on the MoFPED13 website. Score A
15.3 Reporting on fiscal outcomes
The Government is now obliged to report on fiscal outcomes as part of the budget documentation twice a year according to the PFMA 2015. The first report was published in August 2016 followed up by another with budget documentation in October 2016 and the next in February 201714. It describes progress against fiscal targets and explains deviations with potential remedial actions. Key elements are included in the Budget Speech. Score A
13 http://budget.go.ug/budget/sites/default/files/National%20Budget%20docs/Charter%20for%20Fiscal%20Responsibility.pdf
14 http://www.finance.go.ug/half-year-macroeconomic-fiscal-performance-report-fy-201617/
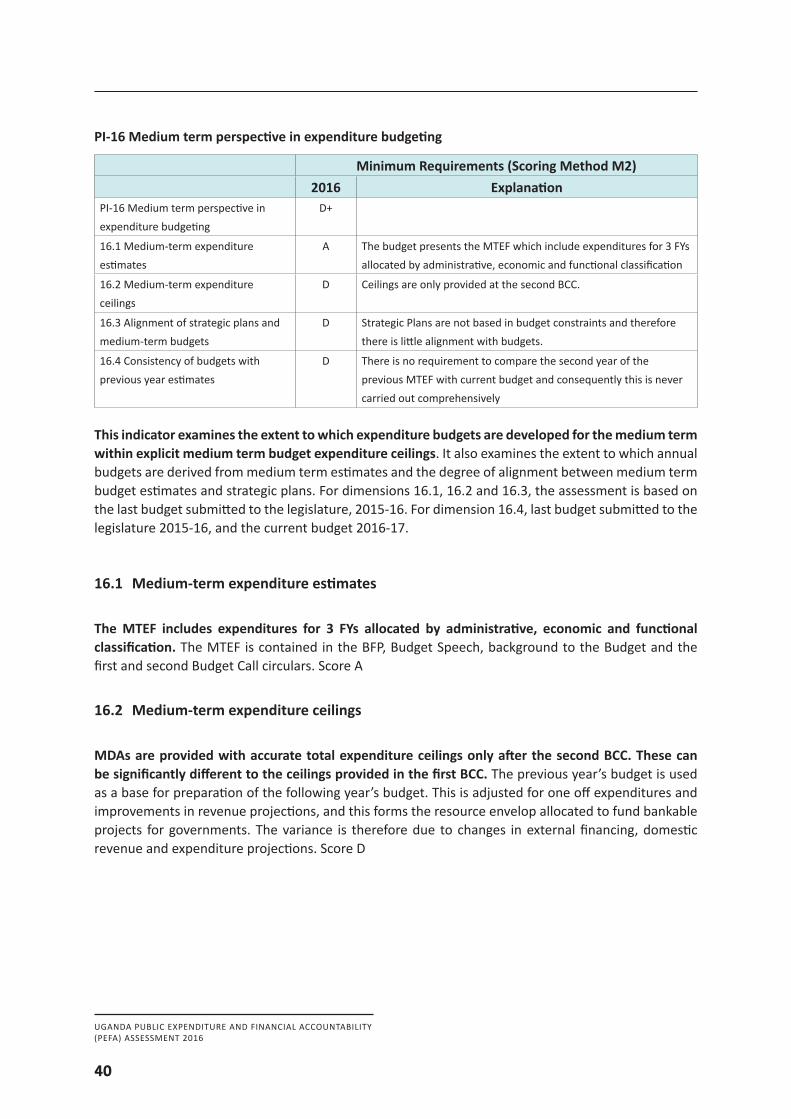
UGANDA PUBLIC EXPENDITURE AND FINANCIAL ACCOUNTABILITY(PEFA) ASSESSMENT 2016
40
PI-16 Medium term perspective in expenditure budgeting
Minimum Requirements (Scoring Method M2)2016 Explanation
PI-16 Medium term perspective in expenditure budgeting
D+
16.1 Medium-term expenditure estimates
A The budget presents the MTEF which include expenditures for 3 FYs allocated by administrative, economic and functional classification
16.2 Medium-term expenditure ceilings
D Ceilings are only provided at the second BCC.
16.3 Alignment of strategic plans and medium-term budgets
D Strategic Plans are not based in budget constraints and therefore there is little alignment with budgets.
16.4 Consistency of budgets with previous year estimates
D There is no requirement to compare the second year of the previous MTEF with current budget and consequently this is never carried out comprehensively
This indicator examines the extent to which expenditure budgets are developed for the medium term within explicit medium term budget expenditure ceilings. It also examines the extent to which annual budgets are derived from medium term estimates and the degree of alignment between medium term budget estimates and strategic plans. For dimensions 16.1, 16.2 and 16.3, the assessment is based on the last budget submitted to the legislature, 2015-16. For dimension 16.4, last budget submitted to the legislature 2015-16, and the current budget 2016-17.
16.1 Medium-term expenditure estimates
The MTEF includes expenditures for 3 FYs allocated by administrative, economic and functional classification. The MTEF is contained in the BFP, Budget Speech, background to the Budget and the first and second Budget Call circulars. Score A
16.2 Medium-term expenditure ceilings
MDAs are provided with accurate total expenditure ceilings only after the second BCC. These can be significantly different to the ceilings provided in the first BCC. The previous year’s budget is used as a base for preparation of the following year’s budget. This is adjusted for one off expenditures and improvements in revenue projections, and this forms the resource envelop allocated to fund bankable projects for governments. The variance is therefore due to changes in external financing, domestic revenue and expenditure projections. Score D
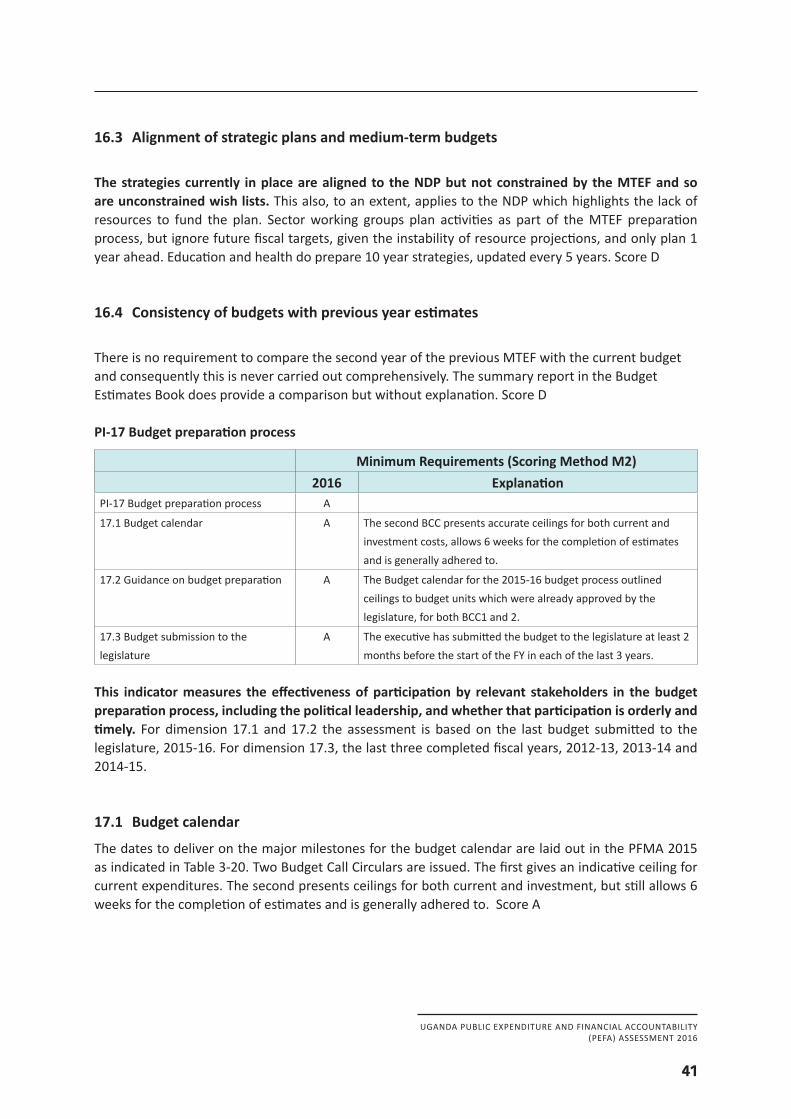
UGANDA PUBLIC EXPENDITURE AND FINANCIAL ACCOUNTABILITY(PEFA) ASSESSMENT 2016
41
16.3 Alignment of strategic plans and medium-term budgets
The strategies currently in place are aligned to the NDP but not constrained by the MTEF and so are unconstrained wish lists. This also, to an extent, applies to the NDP which highlights the lack of resources to fund the plan. Sector working groups plan activities as part of the MTEF preparation process, but ignore future fiscal targets, given the instability of resource projections, and only plan 1 year ahead. Education and health do prepare 10 year strategies, updated every 5 years. Score D
16.4 Consistency of budgets with previous year estimates
There is no requirement to compare the second year of the previous MTEF with the current budget and consequently this is never carried out comprehensively. The summary report in the Budget Estimates Book does provide a comparison but without explanation. Score D
PI-17 Budget preparation process
Minimum Requirements (Scoring Method M2)2016 Explanation
PI-17 Budget preparation process A
17.1 Budget calendar A The second BCC presents accurate ceilings for both current and investment costs, allows 6 weeks for the completion of estimates and is generally adhered to.
17.2 Guidance on budget preparation A The Budget calendar for the 2015-16 budget process outlined ceilings to budget units which were already approved by the legislature, for both BCC1 and 2.
17.3 Budget submission to the legislature
A The executive has submitted the budget to the legislature at least 2 months before the start of the FY in each of the last 3 years.
This indicator measures the effectiveness of participation by relevant stakeholders in the budget preparation process, including the political leadership, and whether that participation is orderly and timely. For dimension 17.1 and 17.2 the assessment is based on the last budget submitted to the legislature, 2015-16. For dimension 17.3, the last three completed fiscal years, 2012-13, 2013-14 and 2014-15.
17.1 Budget calendar
The dates to deliver on the major milestones for the budget calendar are laid out in the PFMA 2015 as indicated in Table 3-20. Two Budget Call Circulars are issued. The first gives an indicative ceiling for current expenditures. The second presents ceilings for both current and investment, but still allows 6 weeks for the completion of estimates and is generally adhered to. Score A
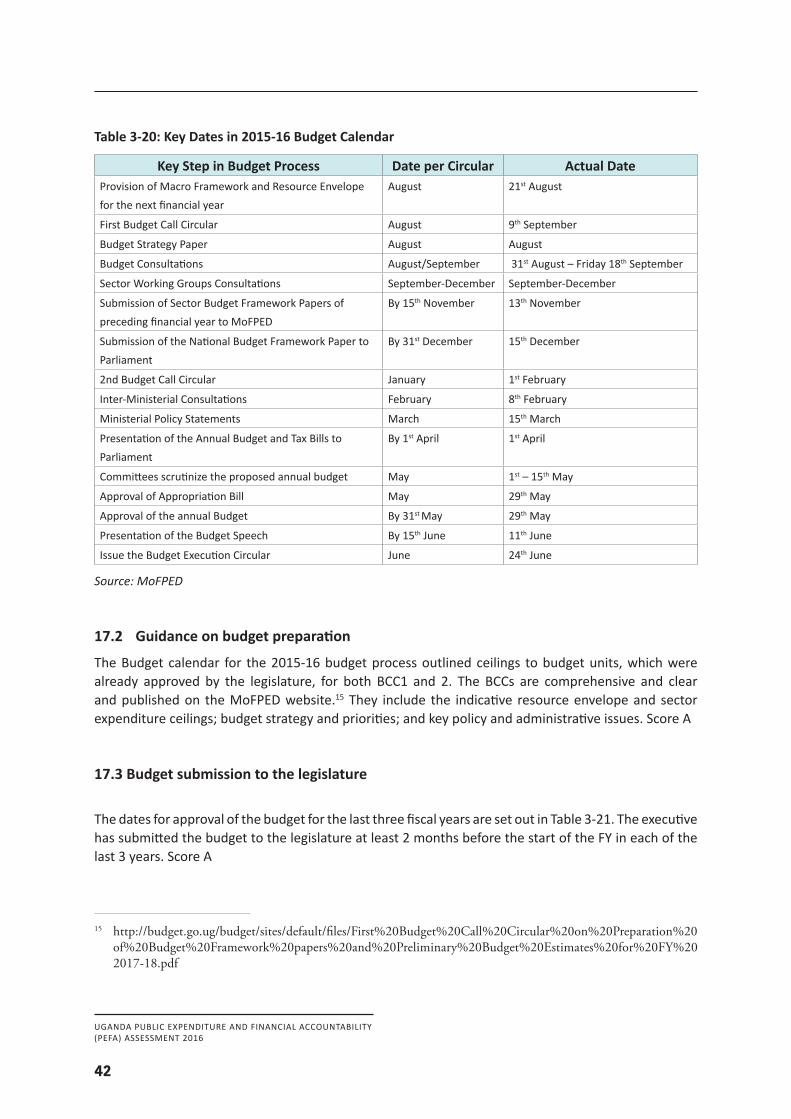
UGANDA PUBLIC EXPENDITURE AND FINANCIAL ACCOUNTABILITY(PEFA) ASSESSMENT 2016
42
Table 3-20: Key Dates in 2015-16 Budget Calendar
Key Step in Budget Process Date per Circular Actual DateProvision of Macro Framework and Resource Envelope for the next financial year
August 21st August
First Budget Call Circular August 9th September
Budget Strategy Paper August August
Budget Consultations August/September 31st August – Friday 18th September
Sector Working Groups Consultations September-December September-December
Submission of Sector Budget Framework Papers of preceding financial year to MoFPED
By 15th November 13th November
Submission of the National Budget Framework Paper to Parliament
By 31st December 15th December
2nd Budget Call Circular January 1st February
Inter-Ministerial Consultations February 8th February
Ministerial Policy Statements March 15th March
Presentation of the Annual Budget and Tax Bills to Parliament
By 1st April 1st April
Committees scrutinize the proposed annual budget May 1st – 15th May
Approval of Appropriation Bill May 29th May
Approval of the annual Budget By 31st May 29th May
Presentation of the Budget Speech By 15th June 11th June
Issue the Budget Execution Circular June 24th June
Source:MoFPED
17.2 Guidance on budget preparation
The Budget calendar for the 2015-16 budget process outlined ceilings to budget units, which were already approved by the legislature, for both BCC1 and 2. The BCCs are comprehensive and clear and published on the MoFPED website.15 They include the indicative resource envelope and sector expenditure ceilings; budget strategy and priorities; and key policy and administrative issues. Score A
17.3 Budget submission to the legislature
The dates for approval of the budget for the last three fiscal years are set out in Table 3-21. The executive has submitted the budget to the legislature at least 2 months before the start of the FY in each of the last 3 years. Score A
15 http://budget.go.ug/budget/sites/default/files/First%20Budget%20Call%20Circular%20on%20Preparation%20of%20Budget%20Framework%20papers%20and%20Preliminary%20Budget%20Estimates%20for%20FY%202017-18.pdf
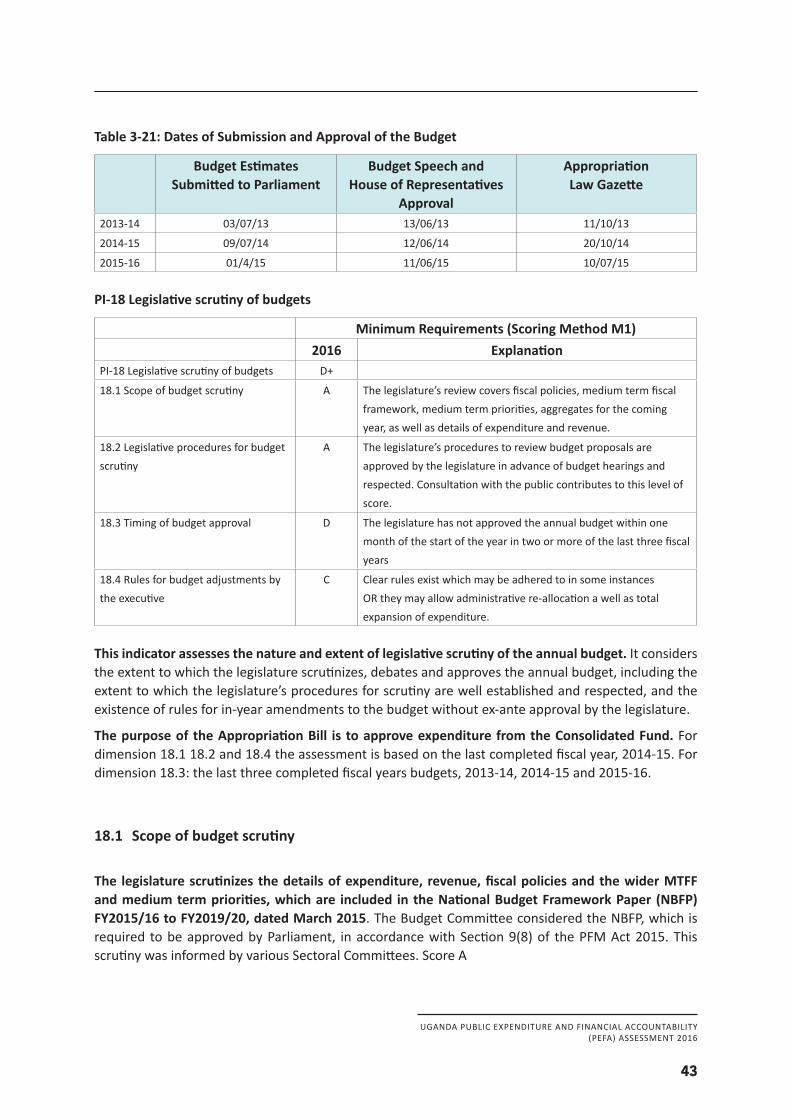
UGANDA PUBLIC EXPENDITURE AND FINANCIAL ACCOUNTABILITY(PEFA) ASSESSMENT 2016
43
Table 3-21: Dates of Submission and Approval of the Budget
Budget Estimates Submitted to Parliament
Budget Speech and House of Representatives
Approval
AppropriationLaw Gazette
2013-14 03/07/13 13/06/13 11/10/13
2014-15 09/07/14 12/06/14 20/10/14
2015-16 01/4/15 11/06/15 10/07/15 PI-18 Legislative scrutiny of budgets
Minimum Requirements (Scoring Method M1)2016 Explanation
PI-18 Legislative scrutiny of budgets D+
18.1 Scope of budget scrutiny A The legislature’s review covers fiscal policies, medium term fiscal framework, medium term priorities, aggregates for the coming year, as well as details of expenditure and revenue.
18.2 Legislative procedures for budget scrutiny
A The legislature’s procedures to review budget proposals are approved by the legislature in advance of budget hearings and respected. Consultation with the public contributes to this level of score.
18.3 Timing of budget approval D The legislature has not approved the annual budget within one month of the start of the year in two or more of the last three fiscal years
18.4 Rules for budget adjustments by the executive
C Clear rules exist which may be adhered to in some instances OR they may allow administrative re-allocation a well as total expansion of expenditure.
This indicator assesses the nature and extent of legislative scrutiny of the annual budget. It considers the extent to which the legislature scrutinizes, debates and approves the annual budget, including the extent to which the legislature’s procedures for scrutiny are well established and respected, and the existence of rules for in-year amendments to the budget without ex-ante approval by the legislature.
The purpose of the Appropriation Bill is to approve expenditure from the Consolidated Fund. For dimension 18.1 18.2 and 18.4 the assessment is based on the last completed fiscal year, 2014-15. For dimension 18.3: the last three completed fiscal years budgets, 2013-14, 2014-15 and 2015-16.
18.1 Scope of budget scrutiny
The legislature scrutinizes the details of expenditure, revenue, fiscal policies and the wider MTFF and medium term priorities, which are included in the National Budget Framework Paper (NBFP) FY2015/16 to FY2019/20, dated March 2015. The Budget Committee considered the NBFP, which is required to be approved by Parliament, in accordance with Section 9(8) of the PFM Act 2015. This scrutiny was informed by various Sectoral Committees. Score A
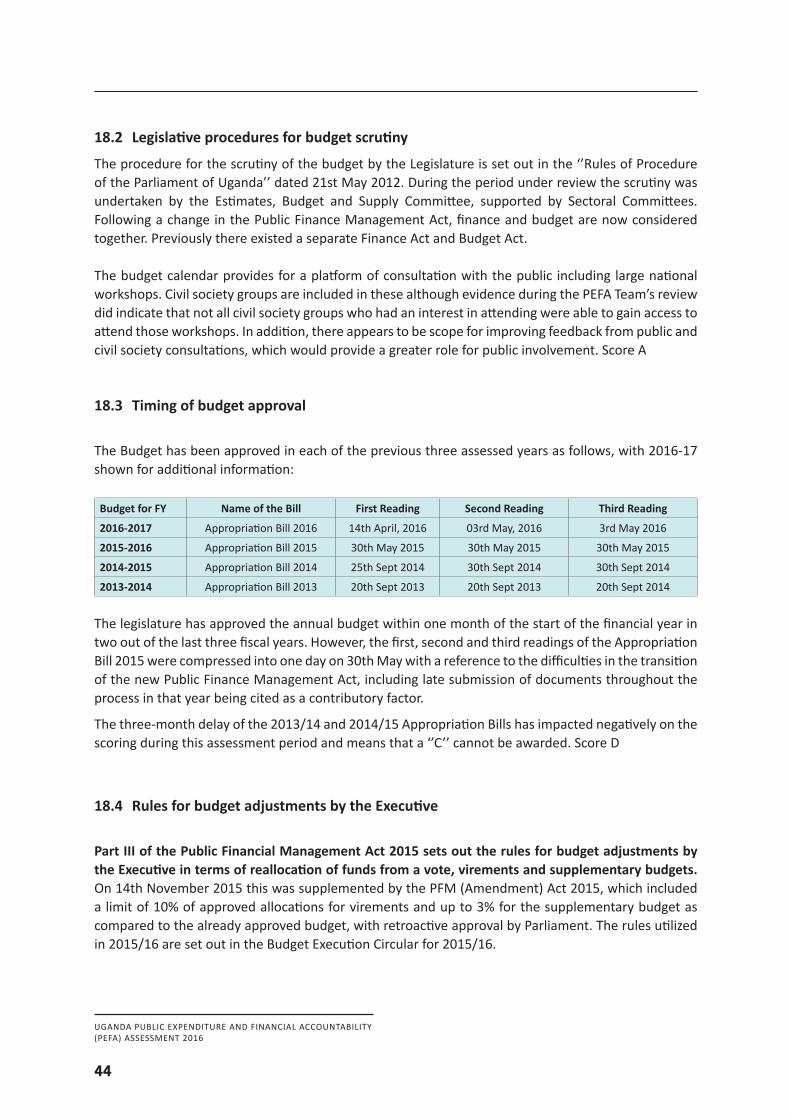
UGANDA PUBLIC EXPENDITURE AND FINANCIAL ACCOUNTABILITY(PEFA) ASSESSMENT 2016
44
18.2 Legislative procedures for budget scrutiny
The procedure for the scrutiny of the budget by the Legislature is set out in the ‘’Rules of Procedure of the Parliament of Uganda’’ dated 21st May 2012. During the period under review the scrutiny was undertaken by the Estimates, Budget and Supply Committee, supported by Sectoral Committees. Following a change in the Public Finance Management Act, finance and budget are now considered together. Previously there existed a separate Finance Act and Budget Act.
The budget calendar provides for a platform of consultation with the public including large national workshops. Civil society groups are included in these although evidence during the PEFA Team’s review did indicate that not all civil society groups who had an interest in attending were able to gain access to attend those workshops. In addition, there appears to be scope for improving feedback from public and civil society consultations, which would provide a greater role for public involvement. Score A
18.3 Timing of budget approval
The Budget has been approved in each of the previous three assessed years as follows, with 2016-17 shown for additional information:
Budget for FY Name of the Bill First Reading Second Reading Third Reading
2016-2017 Appropriation Bill 2016 14th April, 2016 03rd May, 2016 3rd May 2016
2015-2016 Appropriation Bill 2015 30th May 2015 30th May 2015 30th May 2015
2014-2015 Appropriation Bill 2014 25th Sept 2014 30th Sept 2014 30th Sept 2014
2013-2014 Appropriation Bill 2013 20th Sept 2013 20th Sept 2013 20th Sept 2014
The legislature has approved the annual budget within one month of the start of the financial year in two out of the last three fiscal years. However, the first, second and third readings of the Appropriation Bill 2015 were compressed into one day on 30th May with a reference to the difficulties in the transition of the new Public Finance Management Act, including late submission of documents throughout the process in that year being cited as a contributory factor.
The three-month delay of the 2013/14 and 2014/15 Appropriation Bills has impacted negatively on the scoring during this assessment period and means that a ‘’C’’ cannot be awarded. Score D
18.4 Rules for budget adjustments by the Executive
Part III of the Public Financial Management Act 2015 sets out the rules for budget adjustments by the Executive in terms of reallocation of funds from a vote, virements and supplementary budgets. On 14th November 2015 this was supplemented by the PFM (Amendment) Act 2015, which included a limit of 10% of approved allocations for virements and up to 3% for the supplementary budget as compared to the already approved budget, with retroactive approval by Parliament. The rules utilized in 2015/16 are set out in the Budget Execution Circular for 2015/16.
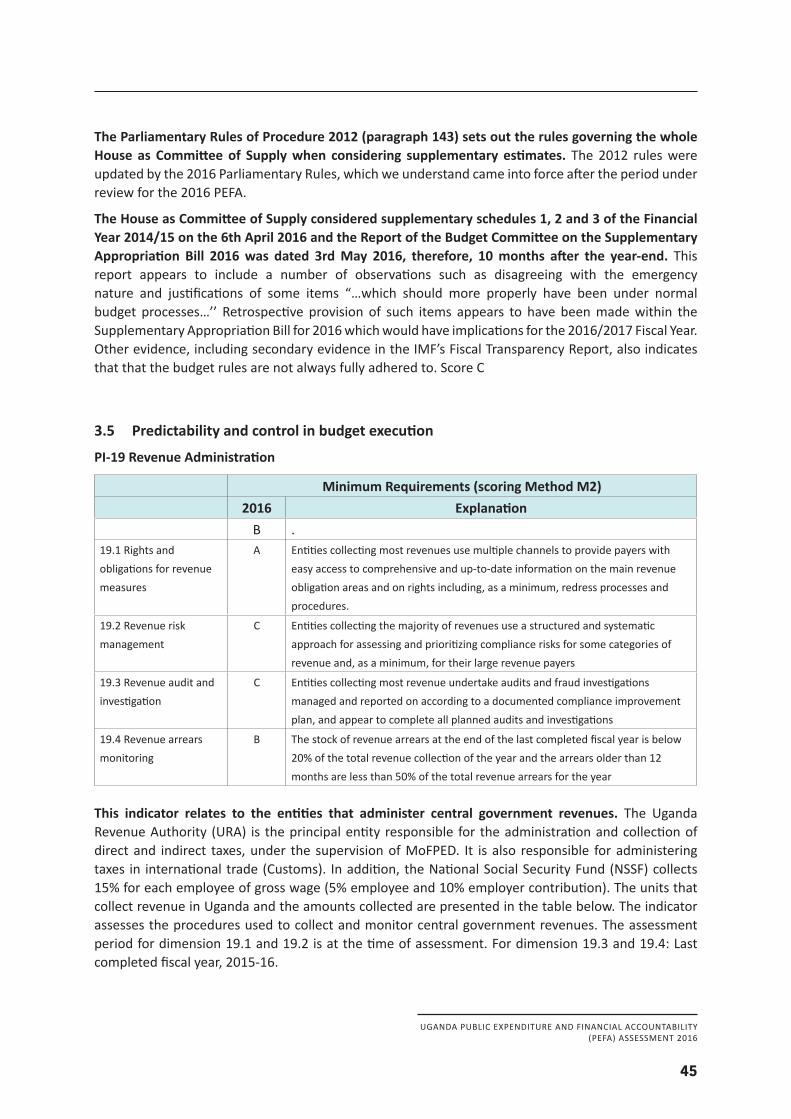
UGANDA PUBLIC EXPENDITURE AND FINANCIAL ACCOUNTABILITY(PEFA) ASSESSMENT 2016
45
The Parliamentary Rules of Procedure 2012 (paragraph 143) sets out the rules governing the whole House as Committee of Supply when considering supplementary estimates. The 2012 rules were updated by the 2016 Parliamentary Rules, which we understand came into force after the period under review for the 2016 PEFA.
The House as Committee of Supply considered supplementary schedules 1, 2 and 3 of the Financial Year 2014/15 on the 6th April 2016 and the Report of the Budget Committee on the Supplementary Appropriation Bill 2016 was dated 3rd May 2016, therefore, 10 months after the year-end. This report appears to include a number of observations such as disagreeing with the emergency nature and justifications of some items “…which should more properly have been under normal budget processes…’’ Retrospective provision of such items appears to have been made within the Supplementary Appropriation Bill for 2016 which would have implications for the 2016/2017 Fiscal Year. Other evidence, including secondary evidence in the IMF’s Fiscal Transparency Report, also indicates that that the budget rules are not always fully adhered to. Score C
3.5 Predictability and control in budget execution
PI-19 Revenue Administration
Minimum Requirements (scoring Method M2)2016 Explanation
B .19.1 Rights and obligations for revenue measures
A Entities collecting most revenues use multiple channels to provide payers with easy access to comprehensive and up-to-date information on the main revenue obligation areas and on rights including, as a minimum, redress processes and procedures.
19.2 Revenue risk management
C Entities collecting the majority of revenues use a structured and systematic approach for assessing and prioritizing compliance risks for some categories of revenue and, as a minimum, for their large revenue payers
19.3 Revenue audit and investigation
C Entities collecting most revenue undertake audits and fraud investigations managed and reported on according to a documented compliance improvement plan, and appear to complete all planned audits and investigations
19.4 Revenue arrears monitoring
B The stock of revenue arrears at the end of the last completed fiscal year is below 20% of the total revenue collection of the year and the arrears older than 12 months are less than 50% of the total revenue arrears for the year
This indicator relates to the entities that administer central government revenues. The Uganda Revenue Authority (URA) is the principal entity responsible for the administration and collection of direct and indirect taxes, under the supervision of MoFPED. It is also responsible for administering taxes in international trade (Customs). In addition, the National Social Security Fund (NSSF) collects 15% for each employee of gross wage (5% employee and 10% employer contribution). The units that collect revenue in Uganda and the amounts collected are presented in the table below. The indicator assesses the procedures used to collect and monitor central government revenues. The assessment period for dimension 19.1 and 19.2 is at the time of assessment. For dimension 19.3 and 19.4: Last completed fiscal year, 2015-16.
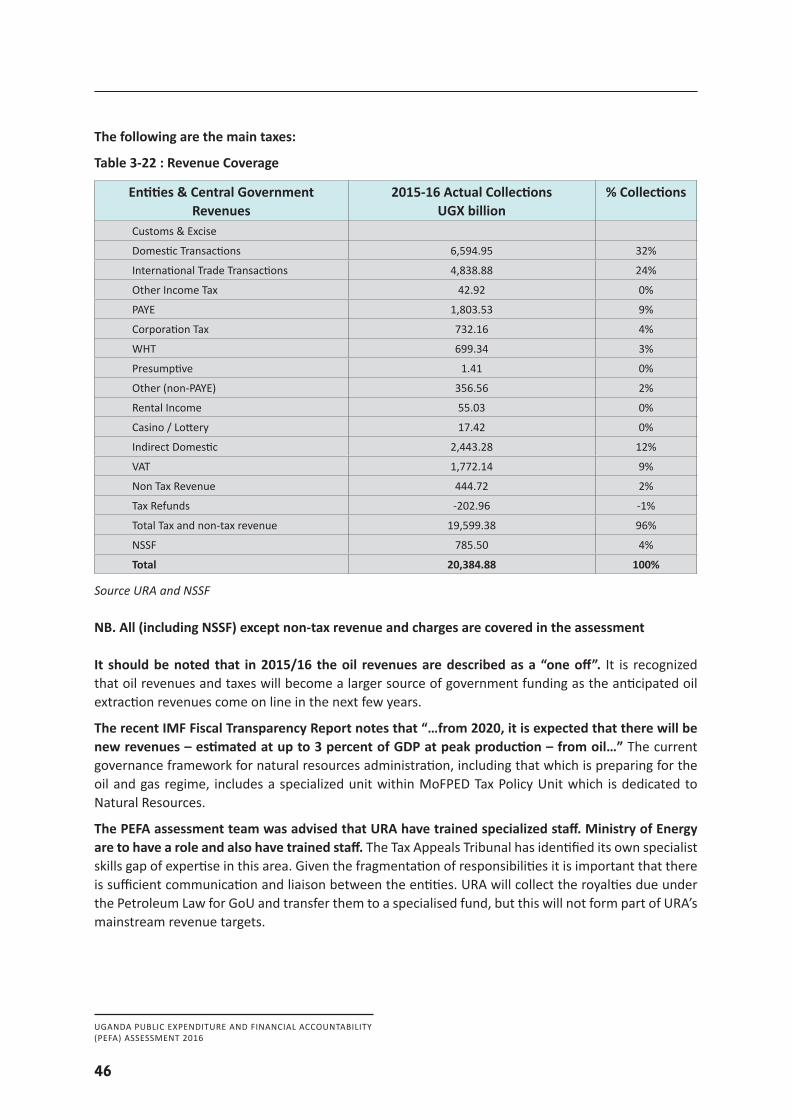
UGANDA PUBLIC EXPENDITURE AND FINANCIAL ACCOUNTABILITY(PEFA) ASSESSMENT 2016
46
The following are the main taxes:
Table 3-22 : Revenue Coverage
Entities & Central Government Revenues
2015-16 Actual Collections UGX billion
% Collections
Customs & Excise
Domestic Transactions 6,594.95 32%
International Trade Transactions 4,838.88 24%
Other Income Tax 42.92 0%
PAYE 1,803.53 9%
Corporation Tax 732.16 4%
WHT 699.34 3%
Presumptive 1.41 0%
Other (non-PAYE) 356.56 2%
Rental Income 55.03 0%
Casino / Lottery 17.42 0%
Indirect Domestic 2,443.28 12%
VAT 1,772.14 9%
Non Tax Revenue 444.72 2%
Tax Refunds -202.96 -1%
Total Tax and non-tax revenue 19,599.38 96%
NSSF 785.50 4%
Total 20,384.88 100%
SourceURAandNSSF
NB. All (including NSSF) except non-tax revenue and charges are covered in the assessment
It should be noted that in 2015/16 the oil revenues are described as a “one off”. It is recognized that oil revenues and taxes will become a larger source of government funding as the anticipated oil extraction revenues come on line in the next few years.
The recent IMF Fiscal Transparency Report notes that “…from 2020, it is expected that there will be new revenues – estimated at up to 3 percent of GDP at peak production – from oil…” The current governance framework for natural resources administration, including that which is preparing for the oil and gas regime, includes a specialized unit within MoFPED Tax Policy Unit which is dedicated to Natural Resources.
The PEFA assessment team was advised that URA have trained specialized staff. Ministry of Energy are to have a role and also have trained staff. The Tax Appeals Tribunal has identified its own specialist skills gap of expertise in this area. Given the fragmentation of responsibilities it is important that there is sufficient communication and liaison between the entities. URA will collect the royalties due under the Petroleum Law for GoU and transfer them to a specialised fund, but this will not form part of URA’s mainstream revenue targets.
UGANDA PUBLIC EXPENDITURE AND FINANCIAL ACCOUNTABILITY(PEFA) ASSESSMENT 2016
47
19.1 Rights and obligations for revenue measures
All laws pertaining to revenue collection are available on the URA website (www.ura.go.ug) – the main ones being the Income Tax/Inland Revenue Act 2015, VAT Statute, EAC and Customs Management. Those laws and regulations pertaining to non-tax revenues - are on the relevant revenue department and Government websites. URA publishes a taxpayer charter, which sets out the rights and obligation of the URA and the taxpayer.
Guidance leaflets are available for the main taxes, together with information on the appeals processes. These are in hard copy and also in soft copy on the URA website. Overall, URA provides taxpayers with extensive information using a variety of channels, and tailored to the needs of each taxpayer segment. The information is current and includes leaflets, exhibitions and radio coverage in different languages. Support to individuals, on a face-to-face basis, with the on-line process is available at URA’s 70 district offices countrywide, in addition to mobile clinics. There is a client support unit and a call centre staffed by 20 phone operators.
In terms of redress for the taxpayer, Uganda operates a Tax Tribunal. As at 1st November 2016, 456 (187 in 2012) disputes had been filed with the Tribunal. Of these only 22 were pending resolution. The tribunal has also handled 95 miscellaneous applications during this period. The disputes by tax head are as follows: VAT (54%), Income Tax (36%), Customs (8%), and Others (2%). About 19% of the Tribunal’s decisions have been appealed to the High Court only on points of law. Appeals are mostly VAT related disputes.
There is a NSSF Act, which includes provision for appeals and recourse to a Tribunal. The NSSF website has a Frequently Asked Questions page which provides guidance on the operations of the Act. Score A
19.2 Revenue risk management
URA has adopted a risk-based approach to administering revenues. URA stratifies taxpayers based on turnover into large, medium and small. Significant challenges will, however, require URA’s continued attention, especially with regard to building a stronger compliance culture across all segments of the taxpayer population, through a more developed approach to risk management, as well as a judicious balance of audit, compliance and taxpayer service initiatives. URA has a compliance section to address risk, but it is not systematic. These initiatives are guided by the URA Corporate Plan 2016/17 - 2019/20 and the URA Business Model Handbook16, June 2016.
A fundamental step in the administration of taxes is taxpayer registration and numbering within a complete database of those citizens and business required by law to register. This will include individuals and citizens in their own right but also others such as employers with withholding responsibilities. The registration and unique taxpayer numbering underpins the key administrative processes associated with filing, payment, assessment and collection. The number of taxpayers in Uganda is VAT (16,600), Income Tax (130,000), PAYE (180,000), Excise (135). There does not appear to be a systematic and complete approach to the verification of this data with third party sources.
16 Theme “Client-focused for optimal compliance”
UGANDA PUBLIC EXPENDITURE AND FINANCIAL ACCOUNTABILITY(PEFA) ASSESSMENT 2016
48
As a result, although the registration process is basically sound and has been on-line since 2009, there are significant challenges to ensuring the completeness and accuracy of the information in the database. Since the last PEFA the business analytical Data Warehouse tool was introduced in 2013/14 and the first phase to migrate domestic taxpayers’ data on to this database is complete. Phase 2 will include Customs and Excise. URA has undertaken an exercise to clean data before it is included on the analytical database and this should yield future improvements in this area.
In addition, to the potential for non-registration of any LTO’s, MTO’s and businesses, a significant further challenge appears to be in the area of Presumptive Tax. This covers those with a turnover of less than UGX 150 million and encompasses the bulk of taxpayers in number. This has major implications for revenue loss to Government and the tone it sets over the domestic culture of tax registration and payment, which does not appear to be well embedded across much of the population.
Additionally, there does not appear to have been a strong focus on pursuing high value and high wealth taxpayers. The recent TADAT review concluded “…initiatives to detect businesses and individuals who fail to register are weak and fall short of international good practice…” In terms of the potential for future improvements, during 2015, URA initiated a mass registration program for small businesses and in the current year the targeting of high wealth individuals is underway.
Tax Clearance Certificates are required for certain transactions. Persons (tax payers) who require TCCs include those: a) Providing passenger transport services; b) Providing freight transport service where the goods vehicle used has a load capacity of more than 2 tons; c) Providing warehousing or clearing and forwarding services; d) Supplying goods or services to the Government; and, e) Transferring funds in excess of 2,500 currency points from Uganda to a place outside Uganda. There are two types of TCCs namely: a) Annual Tax Clearance Certificate: issued once during the year of income to taxpayers who have complied with all their tax obligations. b) Transactional Tax clearance: issued to a taxpayer upon application if the approving authority is satisfied that the taxpayer is complying with their obligations. It is addressed to the entity for which the facility was applied for; and once submitted by the taxpayer to the third party (Addressee), the Transactional Tax Clearance Certificate expires.
NSSF also provides a user ID and issues a compliance letter to support transactions. The Fund has constituted a fully-fledged section in the Operations Department to reduce and manage defaulters. The standard procedure now ends with prosecution of defaulters. NSSF has entered into an arrangement with URA to access URA data on PAYE, which is eliminating under-declaring of number of employees and their salaries. The NSSF also has a whistleblowers section on its website and a facility to report fraud. URA similarly has a reporting noncompliance page on its website.
There are penalties for non-compliance – such as late filing and non-payment, as well as for miss-declaration and interest is charged on outstanding balances of 2 per cent per month. The law also provides for imprisonment if payment is not resolved. URA also issues a public notice on defaulters: “This is to remind the under listed taxpayers and guarantors to pay their overdue tax arrears under the Memoranda of Understanding which they respectively signed and/or guaranteed with the Uganda Revenue Authority. URA shall upon expiry of the aforesaid notice period commence vigorous enforcement actions against all the listed defaulters and/or their respective guarantors for the entire outstanding liabilities plus any accumulated interests thereon without any further notice at the defaulters’ own costs and unnecessary embarrassment”.
General on-going tax-related reforms include URA’s continued roll-out of the Integrated Tax System (ITAS) which uses the e-Tax module.
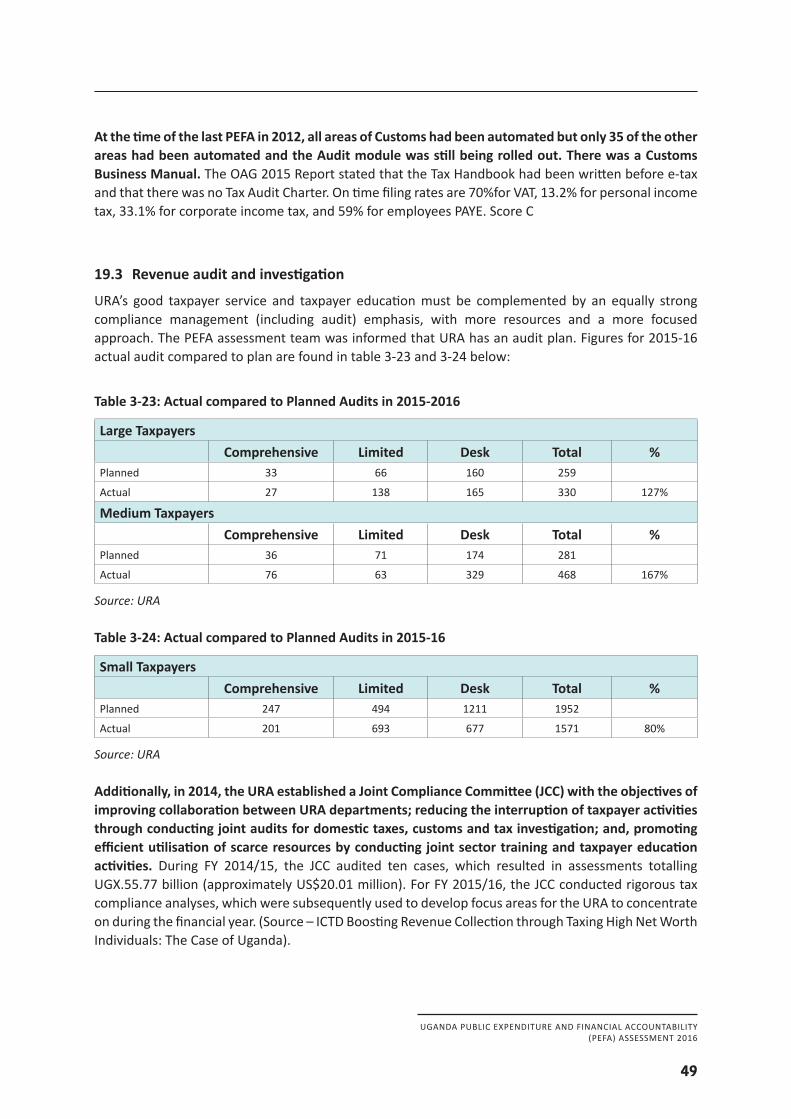
UGANDA PUBLIC EXPENDITURE AND FINANCIAL ACCOUNTABILITY(PEFA) ASSESSMENT 2016
49
At the time of the last PEFA in 2012, all areas of Customs had been automated but only 35 of the other areas had been automated and the Audit module was still being rolled out. There was a Customs Business Manual. The OAG 2015 Report stated that the Tax Handbook had been written before e-tax and that there was no Tax Audit Charter. On time filing rates are 70%for VAT, 13.2% for personal income tax, 33.1% for corporate income tax, and 59% for employees PAYE. Score C
19.3 Revenue audit and investigation
URA’s good taxpayer service and taxpayer education must be complemented by an equally strong compliance management (including audit) emphasis, with more resources and a more focused approach. The PEFA assessment team was informed that URA has an audit plan. Figures for 2015-16 actual audit compared to plan are found in table 3-23 and 3-24 below:
Table 3-23: Actual compared to Planned Audits in 2015-2016
Large TaxpayersComprehensive Limited Desk Total %
Planned 33 66 160 259
Actual 27 138 165 330 127%
Medium TaxpayersComprehensive Limited Desk Total %
Planned 36 71 174 281
Actual 76 63 329 468 167%
Source: URA
Table 3-24: Actual compared to Planned Audits in 2015-16
Small TaxpayersComprehensive Limited Desk Total %
Planned 247 494 1211 1952
Actual 201 693 677 1571 80%
Source: URA
Additionally, in 2014, the URA established a Joint Compliance Committee (JCC) with the objectives of improving collaboration between URA departments; reducing the interruption of taxpayer activities through conducting joint audits for domestic taxes, customs and tax investigation; and, promoting efficient utilisation of scarce resources by conducting joint sector training and taxpayer education activities. During FY 2014/15, the JCC audited ten cases, which resulted in assessments totalling UGX.55.77 billion (approximately US$20.01 million). For FY 2015/16, the JCC conducted rigorous tax compliance analyses, which were subsequently used to develop focus areas for the URA to concentrate on during the financial year. (Source – ICTD Boosting Revenue Collection through Taxing High Net Worth Individuals: The Case of Uganda).
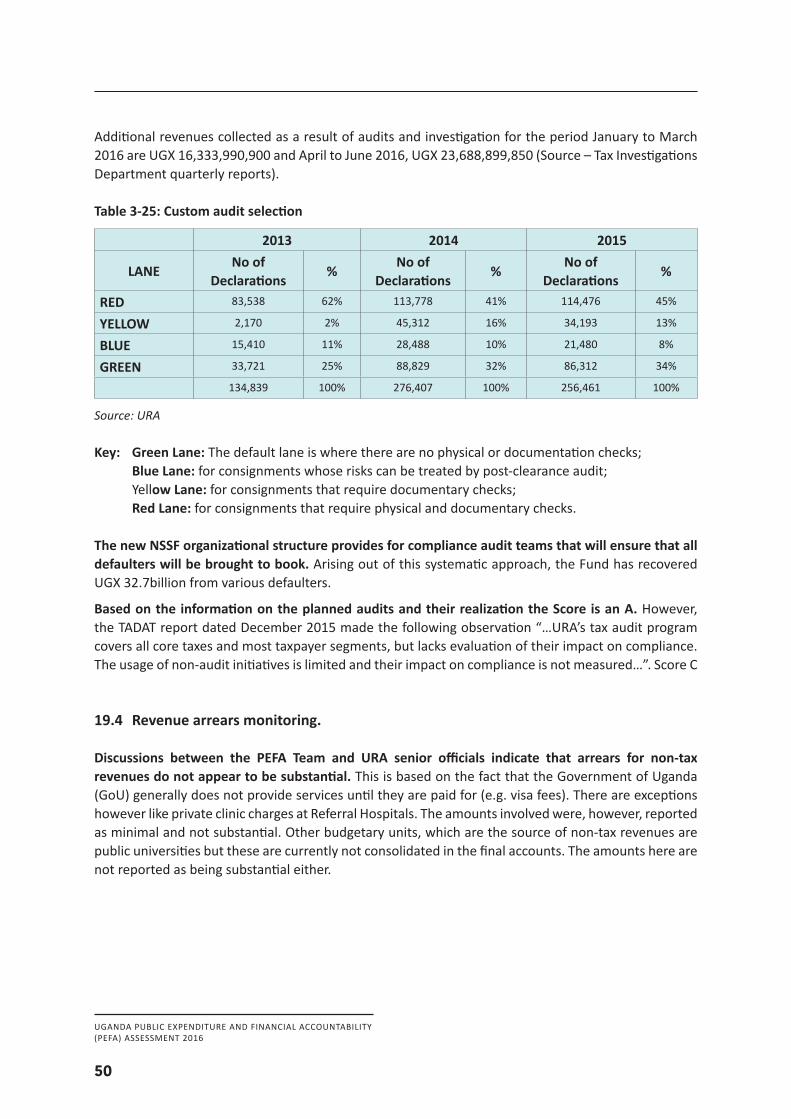
UGANDA PUBLIC EXPENDITURE AND FINANCIAL ACCOUNTABILITY(PEFA) ASSESSMENT 2016
50
Additional revenues collected as a result of audits and investigation for the period January to March 2016 are UGX 16,333,990,900 and April to June 2016, UGX 23,688,899,850 (Source – Tax Investigations Department quarterly reports).
Table 3-25: Custom audit selection
2013 2014 2015
LANENo of
Declarations%
No of Declarations
%No of
Declarations%
RED 83,538 62% 113,778 41% 114,476 45%
YELLOW 2,170 2% 45,312 16% 34,193 13%
BLUE 15,410 11% 28,488 10% 21,480 8%
GREEN 33,721 25% 88,829 32% 86,312 34%
134,839 100% 276,407 100% 256,461 100%
Source: URA
Key: Green Lane: The default lane is where there are no physical or documentation checks; Blue Lane: for consignments whose risks can be treated by post-clearance audit; Yellow Lane: for consignments that require documentary checks; Red Lane: for consignments that require physical and documentary checks.
The new NSSF organizational structure provides for compliance audit teams that will ensure that all defaulters will be brought to book. Arising out of this systematic approach, the Fund has recovered UGX 32.7billion from various defaulters.
Based on the information on the planned audits and their realization the Score is an A. However, the TADAT report dated December 2015 made the following observation “…URA’s tax audit program covers all core taxes and most taxpayer segments, but lacks evaluation of their impact on compliance. The usage of non-audit initiatives is limited and their impact on compliance is not measured…”. Score C
19.4 Revenue arrears monitoring.
Discussions between the PEFA Team and URA senior officials indicate that arrears for non-tax revenues do not appear to be substantial. This is based on the fact that the Government of Uganda (GoU) generally does not provide services until they are paid for (e.g. visa fees). There are exceptions however like private clinic charges at Referral Hospitals. The amounts involved were, however, reported as minimal and not substantial. Other budgetary units, which are the source of non-tax revenues are public universities but these are currently not consolidated in the final accounts. The amounts here are not reported as being substantial either.
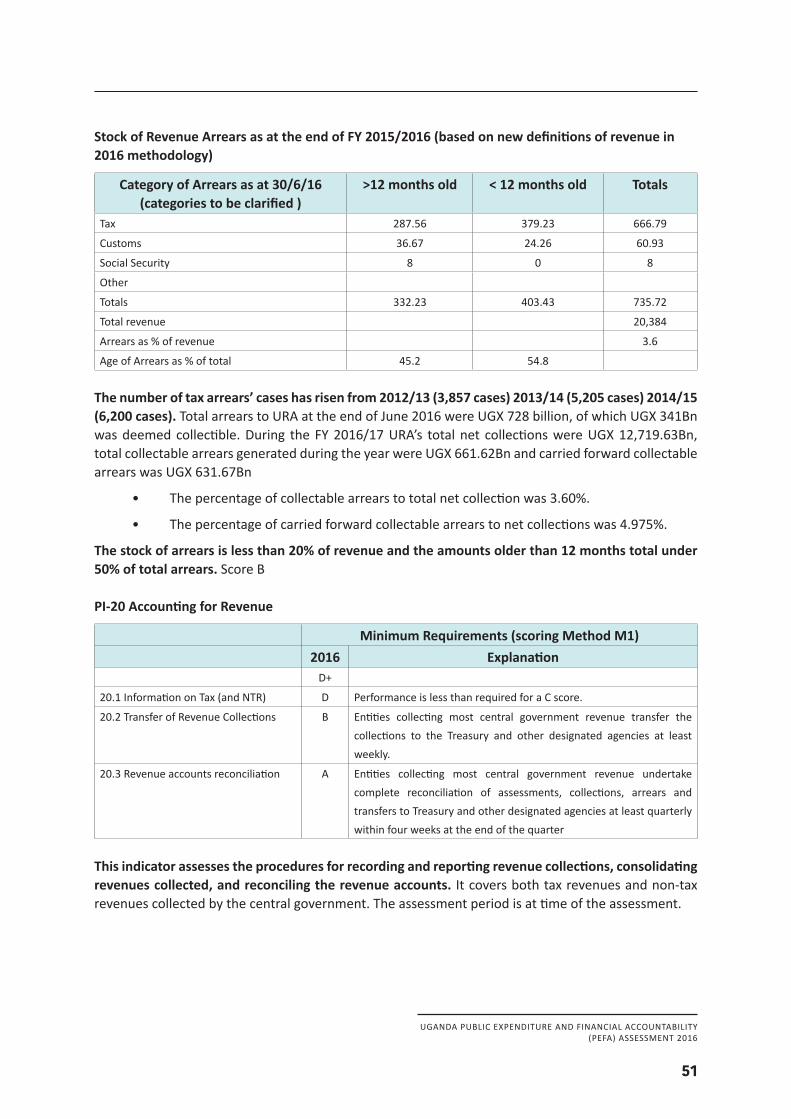
UGANDA PUBLIC EXPENDITURE AND FINANCIAL ACCOUNTABILITY(PEFA) ASSESSMENT 2016
51
Stock of Revenue Arrears as at the end of FY 2015/2016 (based on new definitions of revenue in 2016 methodology)
Category of Arrears as at 30/6/16 (categories to be clarified )
>12 months old < 12 months old Totals
Tax 287.56 379.23 666.79
Customs 36.67 24.26 60.93
Social Security 8 0 8
Other
Totals 332.23 403.43 735.72
Total revenue 20,384
Arrears as % of revenue 3.6
Age of Arrears as % of total 45.2 54.8
The number of tax arrears’ cases has risen from 2012/13 (3,857 cases) 2013/14 (5,205 cases) 2014/15 (6,200 cases). Total arrears to URA at the end of June 2016 were UGX 728 billion, of which UGX 341Bn was deemed collectible. During the FY 2016/17 URA’s total net collections were UGX 12,719.63Bn, total collectable arrears generated during the year were UGX 661.62Bn and carried forward collectable arrears was UGX 631.67Bn
• The percentage of collectable arrears to total net collection was 3.60%.
• The percentage of carried forward collectable arrears to net collections was 4.975%.
The stock of arrears is less than 20% of revenue and the amounts older than 12 months total under 50% of total arrears. Score B PI-20 Accounting for Revenue
Minimum Requirements (scoring Method M1)2016 Explanation
D+
20.1 Information on Tax (and NTR) D Performance is less than required for a C score.
20.2 Transfer of Revenue Collections B Entities collecting most central government revenue transfer the collections to the Treasury and other designated agencies at least weekly.
20.3 Revenue accounts reconciliation A Entities collecting most central government revenue undertake complete reconciliation of assessments, collections, arrears and transfers to Treasury and other designated agencies at least quarterly within four weeks at the end of the quarter
This indicator assesses the procedures for recording and reporting revenue collections, consolidating revenues collected, and reconciling the revenue accounts. It covers both tax revenues and non-tax revenues collected by the central government. The assessment period is at time of the assessment.
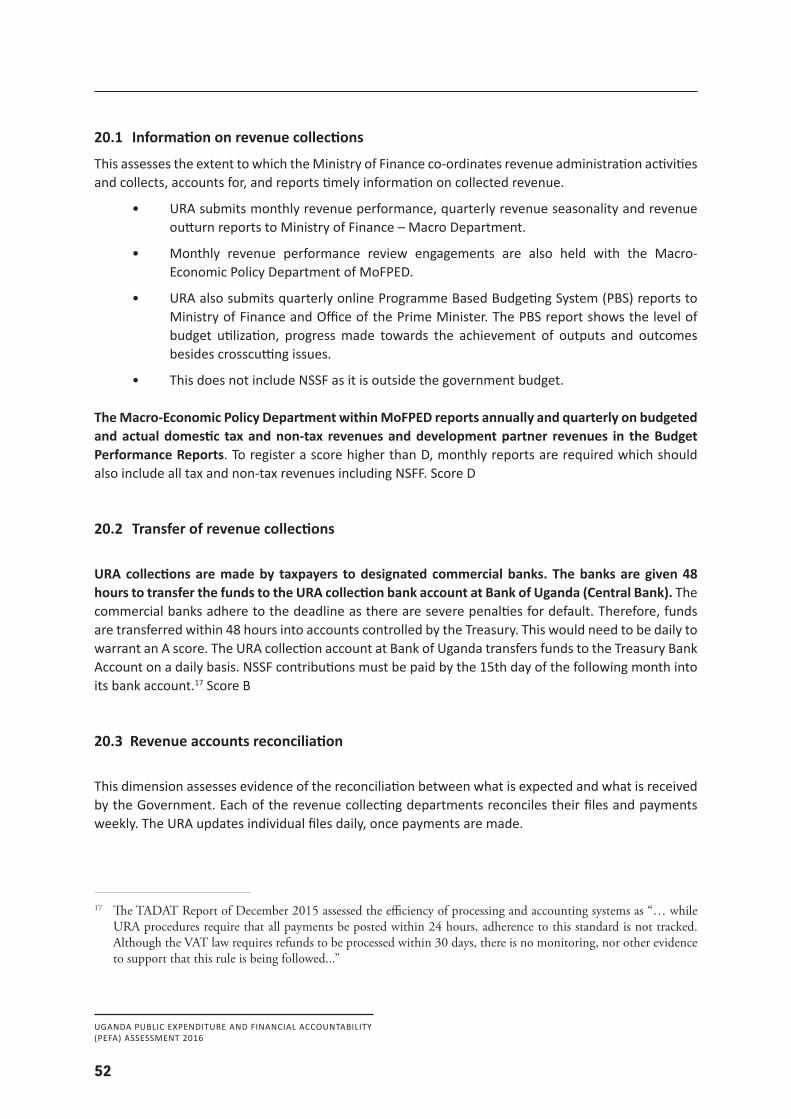
UGANDA PUBLIC EXPENDITURE AND FINANCIAL ACCOUNTABILITY(PEFA) ASSESSMENT 2016
52
20.1 Information on revenue collections
This assesses the extent to which the Ministry of Finance co-ordinates revenue administration activities and collects, accounts for, and reports timely information on collected revenue.
• URA submits monthly revenue performance, quarterly revenue seasonality and revenue outturn reports to Ministry of Finance – Macro Department.
• Monthly revenue performance review engagements are also held with the Macro-Economic Policy Department of MoFPED.
• URA also submits quarterly online Programme Based Budgeting System (PBS) reports to Ministry of Finance and Office of the Prime Minister. The PBS report shows the level of budget utilization, progress made towards the achievement of outputs and outcomes besides crosscutting issues.
• This does not include NSSF as it is outside the government budget.
The Macro-Economic Policy Department within MoFPED reports annually and quarterly on budgeted and actual domestic tax and non-tax revenues and development partner revenues in the Budget Performance Reports. To register a score higher than D, monthly reports are required which should also include all tax and non-tax revenues including NSFF. Score D
20.2 Transfer of revenue collections
URA collections are made by taxpayers to designated commercial banks. The banks are given 48 hours to transfer the funds to the URA collection bank account at Bank of Uganda (Central Bank). The commercial banks adhere to the deadline as there are severe penalties for default. Therefore, funds are transferred within 48 hours into accounts controlled by the Treasury. This would need to be daily to warrant an A score. The URA collection account at Bank of Uganda transfers funds to the Treasury Bank Account on a daily basis. NSSF contributions must be paid by the 15th day of the following month into its bank account.17 Score B
20.3 Revenue accounts reconciliation
This dimension assesses evidence of the reconciliation between what is expected and what is received by the Government. Each of the revenue collecting departments reconciles their files and payments weekly. The URA updates individual files daily, once payments are made.
17 The TADAT Report of December 2015 assessed the efficiency of processing and accounting systems as “… while URA procedures require that all payments be posted within 24 hours, adherence to this standard is not tracked. Although the VAT law requires refunds to be processed within 30 days, there is no monitoring, nor other evidence to support that this rule is being followed...”
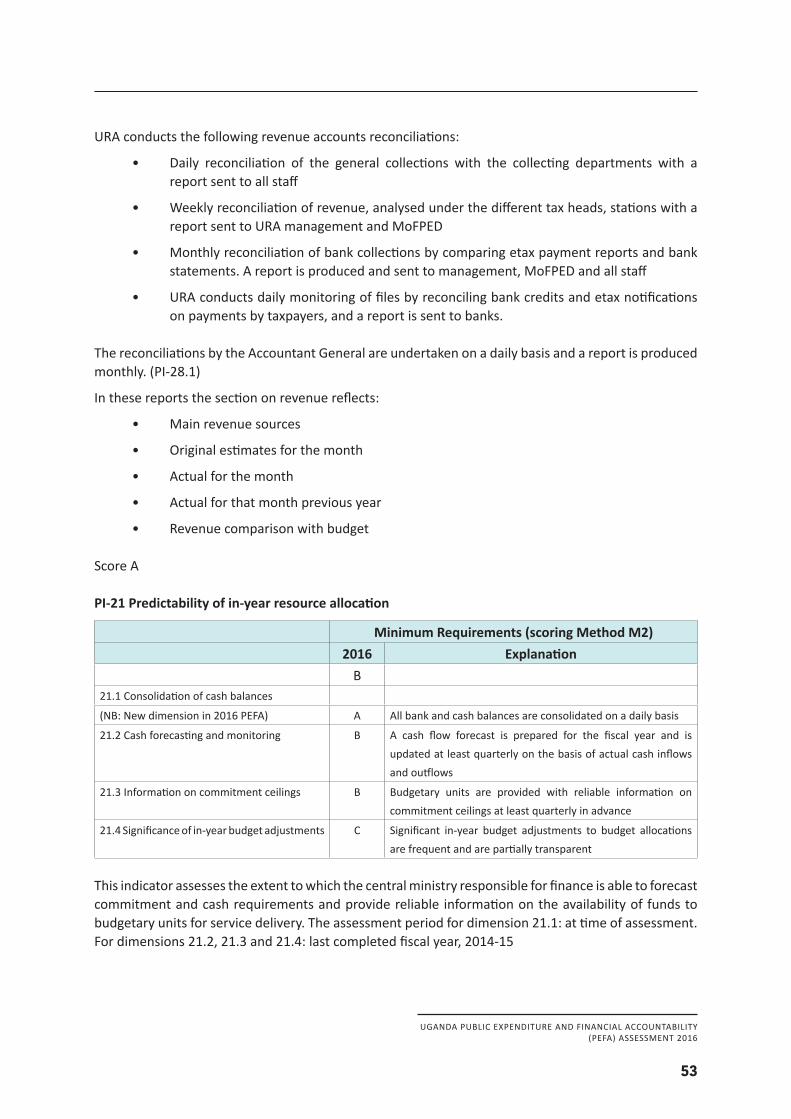
UGANDA PUBLIC EXPENDITURE AND FINANCIAL ACCOUNTABILITY(PEFA) ASSESSMENT 2016
53
URA conducts the following revenue accounts reconciliations:
• Daily reconciliation of the general collections with the collecting departments with a report sent to all staff
• Weekly reconciliation of revenue, analysed under the different tax heads, stations with a report sent to URA management and MoFPED
• Monthly reconciliation of bank collections by comparing etax payment reports and bank statements. A report is produced and sent to management, MoFPED and all staff
• URA conducts daily monitoring of files by reconciling bank credits and etax notifications on payments by taxpayers, and a report is sent to banks.
The reconciliations by the Accountant General are undertaken on a daily basis and a report is produced monthly. (PI-28.1)
In these reports the section on revenue reflects:
• Main revenue sources
• Original estimates for the month
• Actual for the month
• Actual for that month previous year
• Revenue comparison with budget
Score A
PI-21 Predictability of in-year resource allocation
Minimum Requirements (scoring Method M2)2016 Explanation
B21.1 Consolidation of cash balances
(NB: New dimension in 2016 PEFA) A All bank and cash balances are consolidated on a daily basis
21.2 Cash forecasting and monitoring B A cash flow forecast is prepared for the fiscal year and is updated at least quarterly on the basis of actual cash inflows and outflows
21.3 Information on commitment ceilings B Budgetary units are provided with reliable information on commitment ceilings at least quarterly in advance
21.4 Significance of in-year budget adjustments C Significant in-year budget adjustments to budget allocations are frequent and are partially transparent
This indicator assesses the extent to which the central ministry responsible for finance is able to forecast commitment and cash requirements and provide reliable information on the availability of funds to budgetary units for service delivery. The assessment period for dimension 21.1: at time of assessment. For dimensions 21.2, 21.3 and 21.4: last completed fiscal year, 2014-15
UGANDA PUBLIC EXPENDITURE AND FINANCIAL ACCOUNTABILITY(PEFA) ASSESSMENT 2016
54
21.1 Extent and frequency of consolidation of the central government’s cash balances
The Treasury Single Account (TSA) held at the Bank of Uganda was introduced two years ago. All of Central Government now operates on the TSA and this has involved closing individual ministry accounts. There is a phased approach to increasing the number of government entities, which operate under TSA with an estimate of 110 using TSA by December 2016, and for the entire government over the next two years covering externally financed and other public funds.
The TSA is managed by the Accountant General’s Office (AGO). All unused cash balances at the MDAs’ TEA sub-accounts are swept into the TSA at the end of each day. The aggregated cash requirement for each MDA is automatically generated from IFMS approved payments and the specific cash required for these transactions on a particular day is transferred from the TSA main holding account to the TSA sub-accounts (MDAs’ virtual bank accounts) at the Bank of Uganda. Any unused balance at the MDA’s bank account is swept back into the TSA at the end of the day. The TSA provides the AGO with information on the total GoU cash position on any particular day. Score A
21.2 Cash forecasting and monitoring
The Cash Flow Committee produces an annual cash flow forecast. The forecast is updated on a quarterly basis as part of the exercise to determine the releases to be made to the budgetary units. However, the cash forecasting capacity both at the level of MDAs and the MoFPED continues to be weak, rendering forecasts to be weak. Score B
21.3 Information on commitment ceilings
MDAs and the budgetary units are given information on commitments on a quarterly basis through the quarterly budget ceiling advisories. This is an improvement on the previous situation when information was provided on a monthly basis, which was insufficient for effective management at a budget execution at the operational level by accounting officers. Score B
21.4 Significance of in-year budget adjustments
There are clear guidelines on in-year budget adjustments. These are specified in the budget execution circular (BEC) that is issued at the beginning of each financial year. The rules are not adhered to by some of the votes as set out in the BEC and as evidenced by numerous Auditor General reports. In year budget adjustments are frequent throughout the year and are processed as and when they are received from spending agencies (a list was provided in the Annual Budget Performance Report 2015/16). The adjustments appear to be done in a transparent manner. Score C
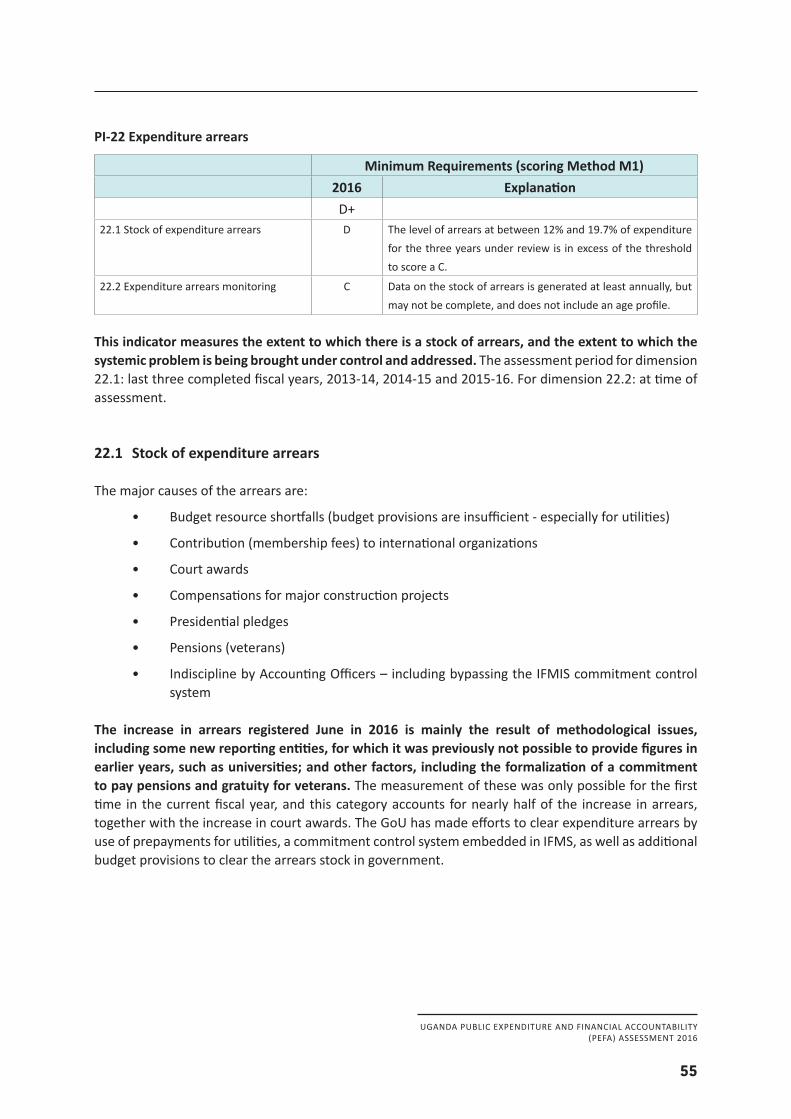
UGANDA PUBLIC EXPENDITURE AND FINANCIAL ACCOUNTABILITY(PEFA) ASSESSMENT 2016
55
PI-22 Expenditure arrears
Minimum Requirements (scoring Method M1)2016 Explanation
D+22.1 Stock of expenditure arrears D The level of arrears at between 12% and 19.7% of expenditure
for the three years under review is in excess of the threshold to score a C.
22.2 Expenditure arrears monitoring C Data on the stock of arrears is generated at least annually, but may not be complete, and does not include an age profile.
This indicator measures the extent to which there is a stock of arrears, and the extent to which the systemic problem is being brought under control and addressed. The assessment period for dimension 22.1: last three completed fiscal years, 2013-14, 2014-15 and 2015-16. For dimension 22.2: at time of assessment.
22.1 Stock of expenditure arrears
The major causes of the arrears are:
• Budget resource shortfalls (budget provisions are insufficient - especially for utilities)
• Contribution (membership fees) to international organizations
• Court awards
• Compensations for major construction projects
• Presidential pledges
• Pensions (veterans)
• Indiscipline by Accounting Officers – including bypassing the IFMIS commitment control system
The increase in arrears registered June in 2016 is mainly the result of methodological issues, including some new reporting entities, for which it was previously not possible to provide figures in earlier years, such as universities; and other factors, including the formalization of a commitment to pay pensions and gratuity for veterans. The measurement of these was only possible for the first time in the current fiscal year, and this category accounts for nearly half of the increase in arrears, together with the increase in court awards. The GoU has made efforts to clear expenditure arrears by use of prepayments for utilities, a commitment control system embedded in IFMS, as well as additional budget provisions to clear the arrears stock in government.
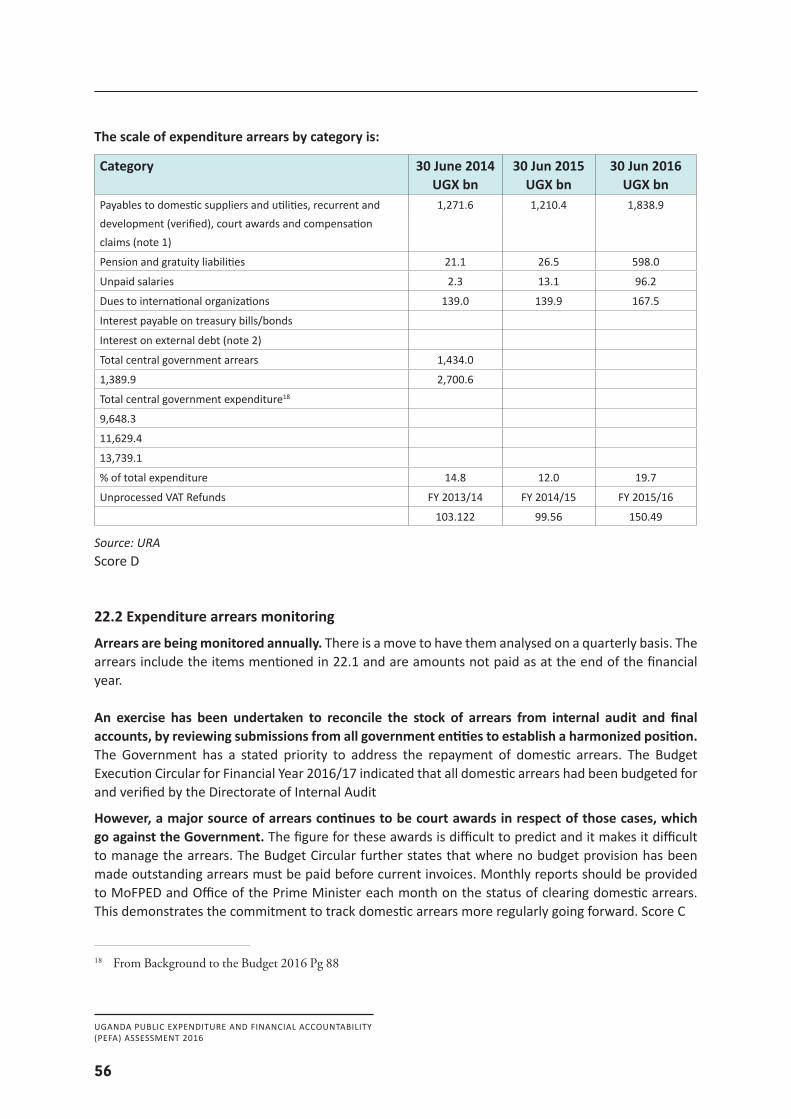
UGANDA PUBLIC EXPENDITURE AND FINANCIAL ACCOUNTABILITY(PEFA) ASSESSMENT 2016
56
The scale of expenditure arrears by category is:
Category 30 June 2014UGX bn
30 Jun 2015UGX bn
30 Jun 2016UGX bn
Payables to domestic suppliers and utilities, recurrent and development (verified), court awards and compensation claims (note 1)
1,271.6 1,210.4 1,838.9
Pension and gratuity liabilities 21.1 26.5 598.0
Unpaid salaries 2.3 13.1 96.2
Dues to international organizations 139.0 139.9 167.5
Interest payable on treasury bills/bonds
Interest on external debt (note 2)
Total central government arrears 1,434.0
1,389.9 2,700.6
Total central government expenditure18
9,648.3
11,629.4
13,739.1
% of total expenditure 14.8 12.0 19.7
Unprocessed VAT Refunds FY 2013/14 FY 2014/15 FY 2015/16
103.122 99.56 150.49
Source: URAScore D
22.2 Expenditure arrears monitoring
Arrears are being monitored annually. There is a move to have them analysed on a quarterly basis. The arrears include the items mentioned in 22.1 and are amounts not paid as at the end of the financial year.
An exercise has been undertaken to reconcile the stock of arrears from internal audit and final accounts, by reviewing submissions from all government entities to establish a harmonized position. The Government has a stated priority to address the repayment of domestic arrears. The Budget Execution Circular for Financial Year 2016/17 indicated that all domestic arrears had been budgeted for and verified by the Directorate of Internal Audit
However, a major source of arrears continues to be court awards in respect of those cases, which go against the Government. The figure for these awards is difficult to predict and it makes it difficult to manage the arrears. The Budget Circular further states that where no budget provision has been made outstanding arrears must be paid before current invoices. Monthly reports should be provided to MoFPED and Office of the Prime Minister each month on the status of clearing domestic arrears. This demonstrates the commitment to track domestic arrears more regularly going forward. Score C
18 From Background to the Budget 2016 Pg 88
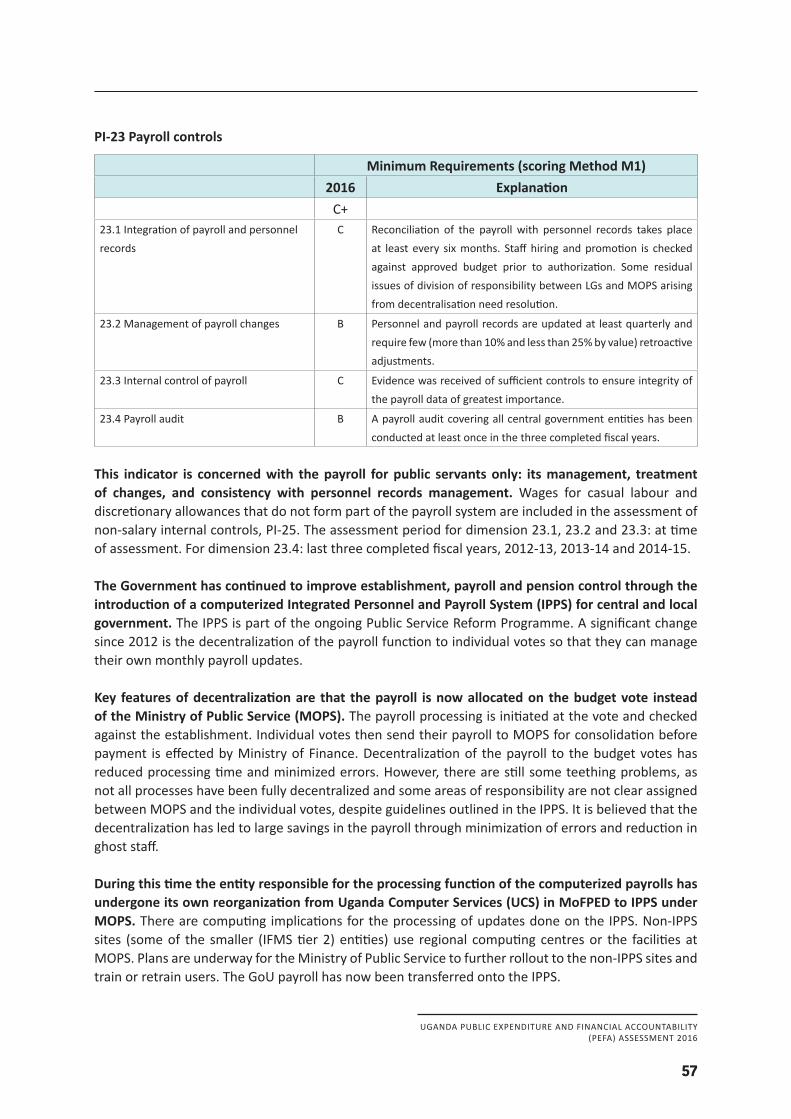
UGANDA PUBLIC EXPENDITURE AND FINANCIAL ACCOUNTABILITY(PEFA) ASSESSMENT 2016
57
PI-23 Payroll controls
Minimum Requirements (scoring Method M1)2016 Explanation
C+23.1 Integration of payroll and personnel records
C Reconciliation of the payroll with personnel records takes place at least every six months. Staff hiring and promotion is checked against approved budget prior to authorization. Some residual issues of division of responsibility between LGs and MOPS arising from decentralisation need resolution.
23.2 Management of payroll changes B Personnel and payroll records are updated at least quarterly and require few (more than 10% and less than 25% by value) retroactive adjustments.
23.3 Internal control of payroll C Evidence was received of sufficient controls to ensure integrity of the payroll data of greatest importance.
23.4 Payroll audit B A payroll audit covering all central government entities has been conducted at least once in the three completed fiscal years.
This indicator is concerned with the payroll for public servants only: its management, treatment of changes, and consistency with personnel records management. Wages for casual labour and discretionary allowances that do not form part of the payroll system are included in the assessment of non-salary internal controls, PI-25. The assessment period for dimension 23.1, 23.2 and 23.3: at time of assessment. For dimension 23.4: last three completed fiscal years, 2012-13, 2013-14 and 2014-15.
The Government has continued to improve establishment, payroll and pension control through the introduction of a computerized Integrated Personnel and Payroll System (IPPS) for central and local government. The IPPS is part of the ongoing Public Service Reform Programme. A significant change since 2012 is the decentralization of the payroll function to individual votes so that they can manage their own monthly payroll updates.
Key features of decentralization are that the payroll is now allocated on the budget vote instead of the Ministry of Public Service (MOPS). The payroll processing is initiated at the vote and checked against the establishment. Individual votes then send their payroll to MOPS for consolidation before payment is effected by Ministry of Finance. Decentralization of the payroll to the budget votes has reduced processing time and minimized errors. However, there are still some teething problems, as not all processes have been fully decentralized and some areas of responsibility are not clear assigned between MOPS and the individual votes, despite guidelines outlined in the IPPS. It is believed that the decentralization has led to large savings in the payroll through minimization of errors and reduction in ghost staff.
During this time the entity responsible for the processing function of the computerized payrolls has undergone its own reorganization from Uganda Computer Services (UCS) in MoFPED to IPPS under MOPS. There are computing implications for the processing of updates done on the IPPS. Non-IPPS sites (some of the smaller (IFMS tier 2) entities) use regional computing centres or the facilities at MOPS. Plans are underway for the Ministry of Public Service to further rollout to the non-IPPS sites and train or retrain users. The GoU payroll has now been transferred onto the IPPS.
UGANDA PUBLIC EXPENDITURE AND FINANCIAL ACCOUNTABILITY(PEFA) ASSESSMENT 2016
58
One of the benefits and intentions of the payroll decentralization is that there is more local (vote) ownership of the payroll and the resultant increase in accountability, which also has the added control advantage of reducing the likelihood of fraud.
23.1 Integration of payroll and personnel records
The government now maintains an IPPS. The last PEFA in 2012 noted challenges for MOPS in managing the transition to the new integrated system, including scanning of records and migration of personnel and payroll data. There are still some of these legacy issues, including the need for greater clarity on the division of responsibilities clearly identifying those, which have been decentralised, and those, which still require central supervision.
All public servants, even those on contract, are on the payroll with the exception of the armed forces. A significant number of those on the payroll are teachers, along with a large number of health workers. This has posed challenges for coverage for this PEFA due to the decentralization of responsibilities since the previous PEFA review.
Personnel data and payroll data are reconciled. The updating of the payroll structure is managed by MOPS and decentralized units only fill positions already created by the centre, and for which there is an approved budget. There are monthly reconciliation and internal audit reports at each unit to ensure payrolls are validated, but full (automatic) integration with IFMS has not yet been achieved. Nevertheless, reconciliation for most of the payroll is performed within a month and for the whole payroll certainly within 6 months. IFMIS is interfaced with IPPS – with the risk of data manipulation or errors during the upload. Full integration would be required for a higher score. Reconciliations are currently undertaken to minimize errors. Plans are underway to integrate IPPS and IFMS through procurement of a new HR/Payroll system. Score C
23.2 Management of payroll changes
The GoU payroll is processed monthly. Every month each budget vote prepares its own payroll change request to reflect staff payment changes during the month. The human resource department at the vote prepares the payroll change request, which is checked against establishment, and validates all proposed changes. The payroll is then authorized for payment by the accounting officer. Thereafter the payroll is forwarded electronically through the IPPS to MOPS where all the reports for the budget votes are consolidated and then submitted to MoFPED where they are uploaded onto the IFMS. MoFPED prepares salary payments, which are sent directly from the Consolidated Fund to the bank accounts of individual staff. Payroll payment reports are then prepared and sent to the budget votes. The reports are checked at the budget vote and reconciliations made with the original submissions. Any errors detected in the reconciliation are corrected in the subsequent month. There are challenges relating to the upload of data from IPPS to the IFMIS.
There have been challenges with processing payroll as a result of the transition from a centralized to a decentralized payroll. Efforts are underway to address the challenges. For example, a guideline for a decentralized salary payment processing has been produced and disseminated. Score B
UGANDA PUBLIC EXPENDITURE AND FINANCIAL ACCOUNTABILITY(PEFA) ASSESSMENT 2016
59
23.3 Internal control of payroll
The processing of salaries is the responsibility of the budget vote. New guidelines and procedures for decentralised salary payment processing dated October 2016 have been produced as a practical guide to Accounting Officers and their staff. There are also guidelines for performance agreements for directors, heads of department, deputy chief administrative officers and deputy town clerks.
The integrity of the system is supported by these guidelines, which details the processes to update the payroll. The Performance Contracts for all Accounting Officers have clauses for proper financial and human resource management, and those who do not adhere to the regulations are personally liable for any mismanagement. The system also has an audit trail with the names of each person making changes on the system. This also applies to the pensions payroll.
The Accounting Officer has powers to put staff onto or off the payroll. Staff entered on the payroll have their particulars checked against the biometric data that is kept at the National Identification and Registration Authority (NIRA). This ensures that staff really do exist. Before staff are put on the payroll the establishment is checked to ensure the existence of the staff position. Processing of the payroll is carried out by the human resource department at the budget vote. The internal auditor at the budget vote carries out regular checks to ensure that the payroll functions are working properly. Checks on the payroll are also undertaken by MoFPED and MOPS.
The decentralization of the payroll has been effected recently and there are still challenges in implementing the new system. Sometimes on the ground, roles and responsibilities are not well understood, resulting in late payment or non-payment of staff salaries and pensions.
In some entities there are compromises in the segregation of duties with the Accounting Officer having combined Human Resource, accounting and control responsibilities for payroll. However, the two sample Ministries visited did have these roles properly separated.
Both internal audit and external audit assessments report some control weaknesses in payroll. There has been a significant payroll / pensions fraud case recently settled, providing evidence of Government’s readiness to take action to ensure accountability. The 2016 Report of the Auditor General notes “Although the decentralized salary payment system introduced by government resulted in positive results including timely salary payments, reduction of ghosts, prompt inclusion on the payroll of newly appointed staff and fully assigning payroll responsibility to Accounting Officers; the continued manual interface between the IPPS and the IFMS was again manipulated by some fraudulent individuals at several MDAs, to fraudulently effect changes on the payrolls released from the IPPS before payment through the IFMS. This practice continues to lead to loss of public funds.
Management explained that under the decentralized payroll system, any changes to payment files after upload into the IFMS is the responsibility of the Accounting Officer, and where these changes result into fraud, government has taken action, including interdiction and investigation with the view of prosecution.
Effective this financial year, all sites are using the interface for payroll transactions and management is also working on the full integration of the IPPS and the IFMS. Government needs to consider undertaking a review of the decentralized salary payment system, with the aim of further enhancing its effectiveness and addressing the weaknesses that have led to the fraudulent practices by some MDAs and Local Governments.
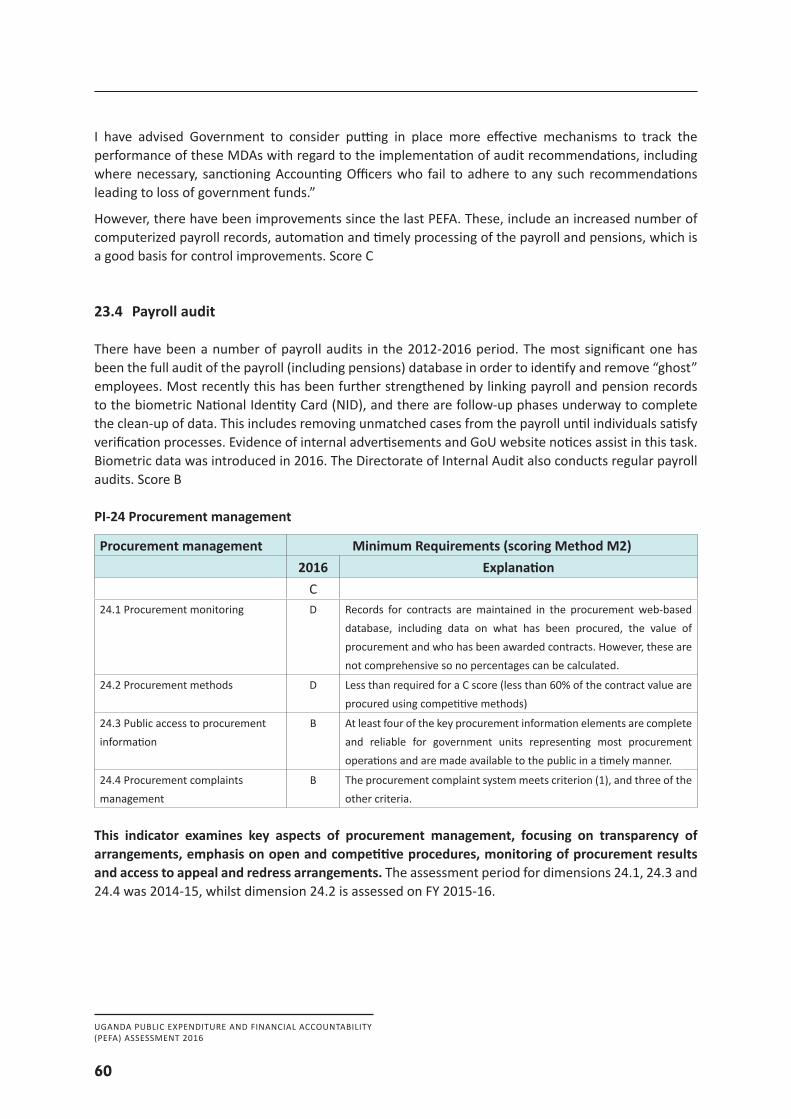
UGANDA PUBLIC EXPENDITURE AND FINANCIAL ACCOUNTABILITY(PEFA) ASSESSMENT 2016
60
I have advised Government to consider putting in place more effective mechanisms to track the performance of these MDAs with regard to the implementation of audit recommendations, including where necessary, sanctioning Accounting Officers who fail to adhere to any such recommendations leading to loss of government funds.”
However, there have been improvements since the last PEFA. These, include an increased number of computerized payroll records, automation and timely processing of the payroll and pensions, which is a good basis for control improvements. Score C
23.4 Payroll audit
There have been a number of payroll audits in the 2012-2016 period. The most significant one has been the full audit of the payroll (including pensions) database in order to identify and remove “ghost” employees. Most recently this has been further strengthened by linking payroll and pension records to the biometric National Identity Card (NID), and there are follow-up phases underway to complete the clean-up of data. This includes removing unmatched cases from the payroll until individuals satisfy verification processes. Evidence of internal advertisements and GoU website notices assist in this task. Biometric data was introduced in 2016. The Directorate of Internal Audit also conducts regular payroll audits. Score B
PI-24 Procurement management
Procurement management Minimum Requirements (scoring Method M2)2016 Explanation
C24.1 Procurement monitoring D Records for contracts are maintained in the procurement web-based
database, including data on what has been procured, the value of procurement and who has been awarded contracts. However, these are not comprehensive so no percentages can be calculated.
24.2 Procurement methods D Less than required for a C score (less than 60% of the contract value are procured using competitive methods)
24.3 Public access to procurement information
B At least four of the key procurement information elements are complete and reliable for government units representing most procurement operations and are made available to the public in a timely manner.
24.4 Procurement complaints management
B The procurement complaint system meets criterion (1), and three of the other criteria.
This indicator examines key aspects of procurement management, focusing on transparency of arrangements, emphasis on open and competitive procedures, monitoring of procurement results and access to appeal and redress arrangements. The assessment period for dimensions 24.1, 24.3 and 24.4 was 2014-15, whilst dimension 24.2 is assessed on FY 2015-16.
UGANDA PUBLIC EXPENDITURE AND FINANCIAL ACCOUNTABILITY(PEFA) ASSESSMENT 2016
61
24.1 Procurement monitoring
The Government passed new amendments to the procurement legislation in 2014. An overview of the current procurement system in Uganda, which is increasingly de-centralised, is as follows:
• The Public Procurement Authority in the de-centralised system is the principal regulatory body for public procurement and disposal of public assets in Uganda. It does this through setting standards; ensuring application of the rules is fair, transparent, non-discriminatory and provides value for money; harmonizing procurement and disposal policy systems and practices in central government, local governments and statutory bodies; monitoring compliance of procuring and disposal entities; and, building procurement and disposal capacities in Uganda.
• The role of the MDA’s is to implement the procurement and disposal laws, rules and regulations in carrying out its procurement and disposal functions. Each MDA has an Accounting Officer that oversees the procurement function and is aided by a Procurement Committee. The Committee is responsible for inviting bids, evaluating them and contract supervision.
• The decentralized system allows procurement and disposal of assets to be carried out more effectively and efficiently through avoidance of lengthy bureaucratic practices. This should result in more efficient utilization of resources and improved public services delivery. The challenges include weak procurement and disposal entities that are unable to comply with the laws, rules and regulations due to untrained staff and high staff turnover; poor record keeping; poor procurement planning and budgeting; use of wrong procurement methods; non adherence to procurement methods; and, poor contract supervision and management.
• The reforms since 2014 include streamlining and improving procurement and disposal of assets by eliminating challenges that had emerged in applying the amended laws; introducing e-procurement; increasing procurement thresholds; and the establishment of a Procurement Tribunal
• Nevertheless, the information available on the procurement website is not comprehensive and cannot be used to calculate a definite figure for the percentage of contracts monitored.
Score D
24.2 Procurement methods
There appears to have been a fall in the level of competitive tendering processes since the new law was passed. In addition, the procurement system in Uganda is increasingly de-centralised, which introduces different control challenges.
UGANDA PUBLIC EXPENDITURE AND FINANCIAL ACCOUNTABILITY(PEFA) ASSESSMENT 2016
62
The role of PPDA in the de-centralised system is to regulate and guide procurement and disposal processes by offering support and building capacity in the entities. PPDA also keeps a database of procurements and disposals that happen at the decentralized procuring and disposal units. The information is publicly available on the PPDA website. The information is up to date and appears to be relatively comprehensive.
There was a significant fall in the value of procurements made through open competition in the FY 2014/15. The value of open and competitive tenders as a percentage of all procurements dropped from 88% to 50% as revealed by the PPDA performance measurement systems report for FY 2014/15. While the drop may be partially attributed to the raising of thresholds for open competition for central government, the performance report confirms that not all major projects have been contracted via open and competitive tender. There are however, instances where the financing conditions of creditors or donors restrict the bidding to companies domiciled in specified countries. According to the Draft Report on the Performance of the Public Procurement System for FY 2015/16 only 45.5% of the value of the awarded contracts went through competitive bidding. Score D
24.3 Public access to procurement information
The information available to the public on procurement includes:
• The procurement laws and regulations, which are on the PPDA website.
• The Government procurement plans for central government are also on the PPDA website.
• The PPDA website has details of bidding opportunities. Current CG tenders are available on the website.
• Information on contract awards (purpose, contractor and value) is posted on the PPDA website, but does not include values. The information includes the best evaluated bidder and particulars of signed contracts.
• The PPDA website has a section on complaints procedures and guides the public on how to launch complaints, and the actions and the redress to expect, but no data on resolved complaints.
• The PPDA posts various reports on its website with annual procurement statistics in form of the corporate, audit and investigative reports.
Elements 4 and 5 are therefore not completely covered. Score B
24.4 Procurement complaints management
Complaints on procurement processes are the responsibility of the Accounting Officer at the first level. A small fee is charged for lodging a procurement or disposal complaint with the Accounting Officer. The second level of complaint is the PPDA, where no additional fee is charged. The next level of complaint is the PPDA Appeals Tribunal. The final level of complaint is with the courts of law.
UGANDA PUBLIC EXPENDITURE AND FINANCIAL ACCOUNTABILITY(PEFA) ASSESSMENT 2016
63
The PPDA Tribunal started functioning in August 2014. For the financial year 2014/15 it handled nine applications and two references. All following elements are met by the complaints body. However, there is no evidence that it has the power to suspend the procurement processes.
Complaints are reviewed by a body which:
• is not involved in any capacity in procurement transactions or in the process leading to contract award decisions - YES
• does not charge fees that prohibit access by concerned parties - YES
• follows processes for submission and resolution of complaints that are clearly defined and publicly available - YES
• exercises the authority to suspend the procurement process - NO
• issues decisions within the timeframe specified in the rules/regulations - YES, and
• issues decisions that are binding on every party (without precluding subsequent access to an external higher authority - YES
Score B PI-25 Internal controls on non-salary expenditure
Indicator and Dimensions Minimum Requirements (Scoring Method M2(AV))2016 Explanation
C+25.1 Segregation of duties B Segregation of duties is prescribed throughout the expenditure
process. Responsibilities are clearly laid down for most key steps while further details may be needed in a few areas.
25.2 Effectiveness of expenditure commitment controls
C Expenditure commitment controls exist, which provide partial coverage.
25.3 Compliance with payment rules and procedures
C The majority of payments are compliant with regular payment procedures. The majority of exceptions are properly authorized and justified.
This indicator measures the effectiveness of general internal controls for non-salary expenditure. Internal control processes ensure that fiscal discipline is maintained at the micro as well as the macro level, and that resources are allocated as intended and properly authorized. The controls should ensure that service delivery has access to, and uses the resources provided under legal and regulatory authority, and only for defined purposes.
25.1 Segregation of duties
Segregation of duties is prescribed throughout the expenditure process as set out in key regulations, such as the Public Procurement and Disposal of Assets Act, Public Financial Management Act and the associated regulations. The primary issue is one of implementation and how these operated\ in practice.
UGANDA PUBLIC EXPENDITURE AND FINANCIAL ACCOUNTABILITY(PEFA) ASSESSMENT 2016
64
It is clear from both internal and external audit reports that control weaknesses (in practice) do still exist, even though the documented controls framework in law and regulation provides for an adequate controls environment.
Overall, segregation of duties is specified in the financial regulations and treasury instructions. This is reinforced by several layers of approval that are built into the IFMS. External audit reports also indicate that authorisation, recording, custody of assets and reconciliation of audit have well defined segregation of duties, though custody of assets seems to have been a problem particularly at local government level. Score B
25.2. Effectiveness of expenditure commitment controls
A commitment control system (CCS) is in existence. The roll-out of IFMS to all central government entities has strengthened the operation of the CCS. Whilst there have been some improvements since the last PEFA, and the CCS offers the potential for further improvement, there is also evidence in the OAG’s reports that these do not always ensure that the government’s payment obligations remain within the limits of annual budget allocations. Score C
25.3 Compliance with payment rules and procedures
Internal audit, external audit and BMAU reports indicate instances of non-compliance with payment rules and regulations.
At a strategic management level, new rules are now in place in terms of Accounting Officers’ responsibilities and their being held accountable for controls under new performance contracts. At the time of assessment this has been in operation since the passing of the Public Finance Management Act 2015.
The evidence for this dimension is on a sampling basis using the five major budgetary units as measured by gross expenditure for the last fiscal year being 2015/2016. For those entities, the extent of compliance with payment control rules and procedures is assessed as follows:
• Works & Transport - majority• Energy & Minerals - majority• Health - majority• Education - majority• Justice, Law and Order - majority
We made reference to the Internal Audit Report for 2014/15 and the Annual Audit Report for the year 2014/15. In both reports out of the five ministries the Ministries of Health and Education had payment issues.
Given that IFMS has in built payment controls and procedures as well as Commitment control systems, which should ensure that those on the system are compliant. All CG entities are on IFMS and use it for payment processing including all salary, pension and gratuity payments as well as non-salary payments. However, there are reports of commitments being made outside the system.
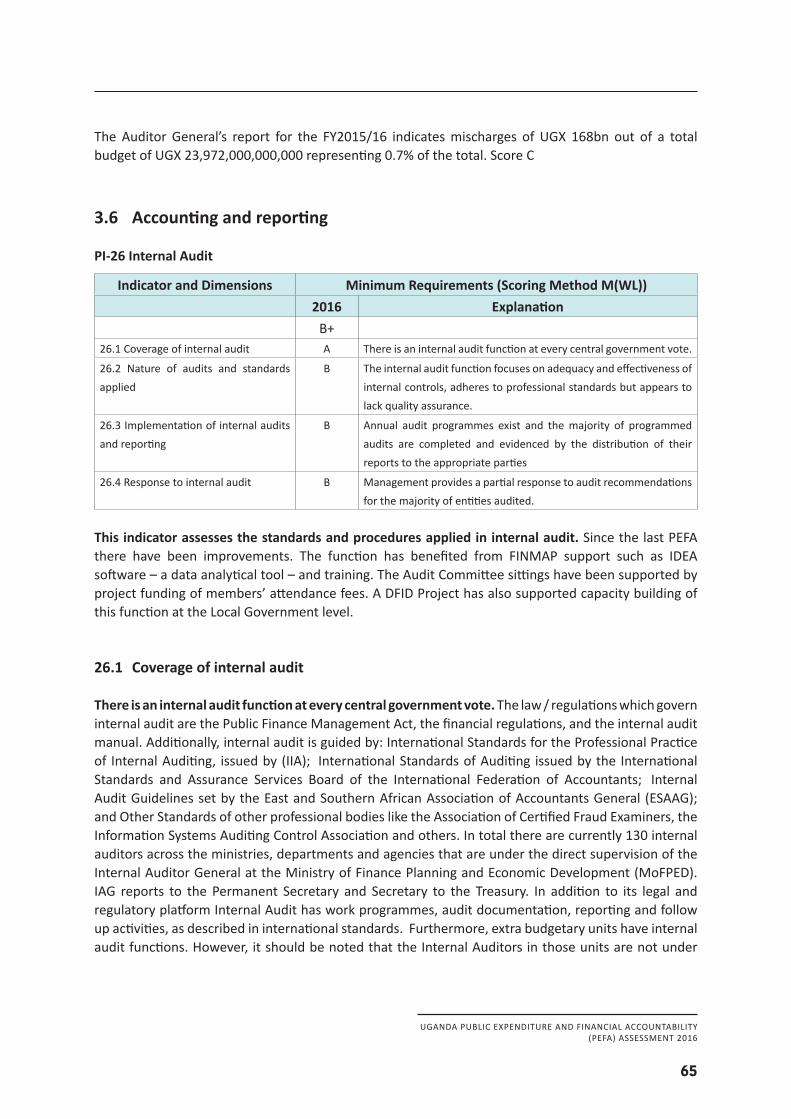
UGANDA PUBLIC EXPENDITURE AND FINANCIAL ACCOUNTABILITY(PEFA) ASSESSMENT 2016
65
The Auditor General’s report for the FY2015/16 indicates mischarges of UGX 168bn out of a total budget of UGX 23,972,000,000,000 representing 0.7% of the total. Score C
3.6 Accounting and reporting
PI-26 Internal Audit
Indicator and Dimensions Minimum Requirements (Scoring Method M(WL))2016 Explanation
B+26.1 Coverage of internal audit A There is an internal audit function at every central government vote.
26.2 Nature of audits and standards applied
B The internal audit function focuses on adequacy and effectiveness of internal controls, adheres to professional standards but appears to lack quality assurance.
26.3 Implementation of internal audits and reporting
B Annual audit programmes exist and the majority of programmed audits are completed and evidenced by the distribution of their reports to the appropriate parties
26.4 Response to internal audit B Management provides a partial response to audit recommendations for the majority of entities audited.
This indicator assesses the standards and procedures applied in internal audit. Since the last PEFA there have been improvements. The function has benefited from FINMAP support such as IDEA software – a data analytical tool – and training. The Audit Committee sittings have been supported by project funding of members’ attendance fees. A DFID Project has also supported capacity building of this function at the Local Government level.
26.1 Coverage of internal audit
There is an internal audit function at every central government vote. The law / regulations which govern internal audit are the Public Finance Management Act, the financial regulations, and the internal audit manual. Additionally, internal audit is guided by: International Standards for the Professional Practice of Internal Auditing, issued by (IIA); International Standards of Auditing issued by the International Standards and Assurance Services Board of the International Federation of Accountants; Internal Audit Guidelines set by the East and Southern African Association of Accountants General (ESAAG); and Other Standards of other professional bodies like the Association of Certified Fraud Examiners, the Information Systems Auditing Control Association and others. In total there are currently 130 internal auditors across the ministries, departments and agencies that are under the direct supervision of the Internal Auditor General at the Ministry of Finance Planning and Economic Development (MoFPED). IAG reports to the Permanent Secretary and Secretary to the Treasury. In addition to its legal and regulatory platform Internal Audit has work programmes, audit documentation, reporting and follow up activities, as described in international standards. Furthermore, extra budgetary units have internal audit functions. However, it should be noted that the Internal Auditors in those units are not under
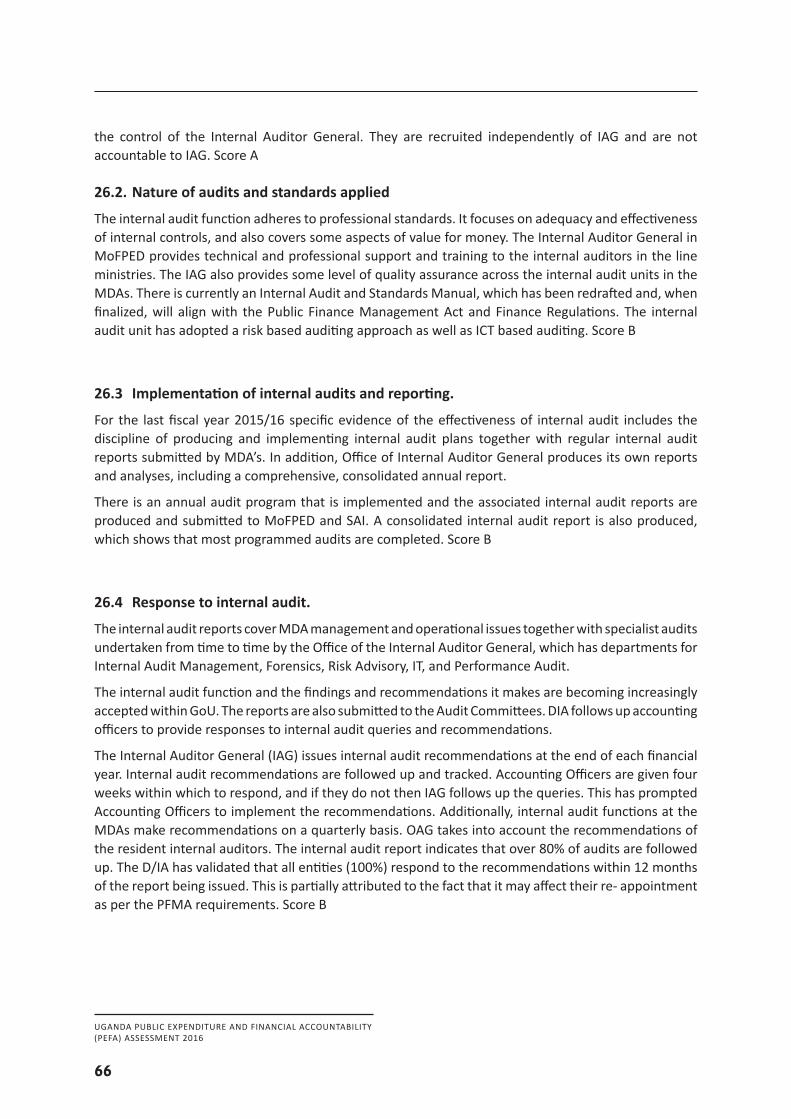
UGANDA PUBLIC EXPENDITURE AND FINANCIAL ACCOUNTABILITY(PEFA) ASSESSMENT 2016
66
the control of the Internal Auditor General. They are recruited independently of IAG and are not accountable to IAG. Score A
26.2. Nature of audits and standards applied
The internal audit function adheres to professional standards. It focuses on adequacy and effectiveness of internal controls, and also covers some aspects of value for money. The Internal Auditor General in MoFPED provides technical and professional support and training to the internal auditors in the line ministries. The IAG also provides some level of quality assurance across the internal audit units in the MDAs. There is currently an Internal Audit and Standards Manual, which has been redrafted and, when finalized, will align with the Public Finance Management Act and Finance Regulations. The internal audit unit has adopted a risk based auditing approach as well as ICT based auditing. Score B
26.3 Implementation of internal audits and reporting.
For the last fiscal year 2015/16 specific evidence of the effectiveness of internal audit includes the discipline of producing and implementing internal audit plans together with regular internal audit reports submitted by MDA’s. In addition, Office of Internal Auditor General produces its own reports and analyses, including a comprehensive, consolidated annual report.
There is an annual audit program that is implemented and the associated internal audit reports are produced and submitted to MoFPED and SAI. A consolidated internal audit report is also produced, which shows that most programmed audits are completed. Score B
26.4 Response to internal audit.
The internal audit reports cover MDA management and operational issues together with specialist audits undertaken from time to time by the Office of the Internal Auditor General, which has departments for Internal Audit Management, Forensics, Risk Advisory, IT, and Performance Audit.
The internal audit function and the findings and recommendations it makes are becoming increasingly accepted within GoU. The reports are also submitted to the Audit Committees. DIA follows up accounting officers to provide responses to internal audit queries and recommendations.
The Internal Auditor General (IAG) issues internal audit recommendations at the end of each financial year. Internal audit recommendations are followed up and tracked. Accounting Officers are given four weeks within which to respond, and if they do not then IAG follows up the queries. This has prompted Accounting Officers to implement the recommendations. Additionally, internal audit functions at the MDAs make recommendations on a quarterly basis. OAG takes into account the recommendations of the resident internal auditors. The internal audit report indicates that over 80% of audits are followed up. The D/IA has validated that all entities (100%) respond to the recommendations within 12 months of the report being issued. This is partially attributed to the fact that it may affect their re- appointment as per the PFMA requirements. Score B
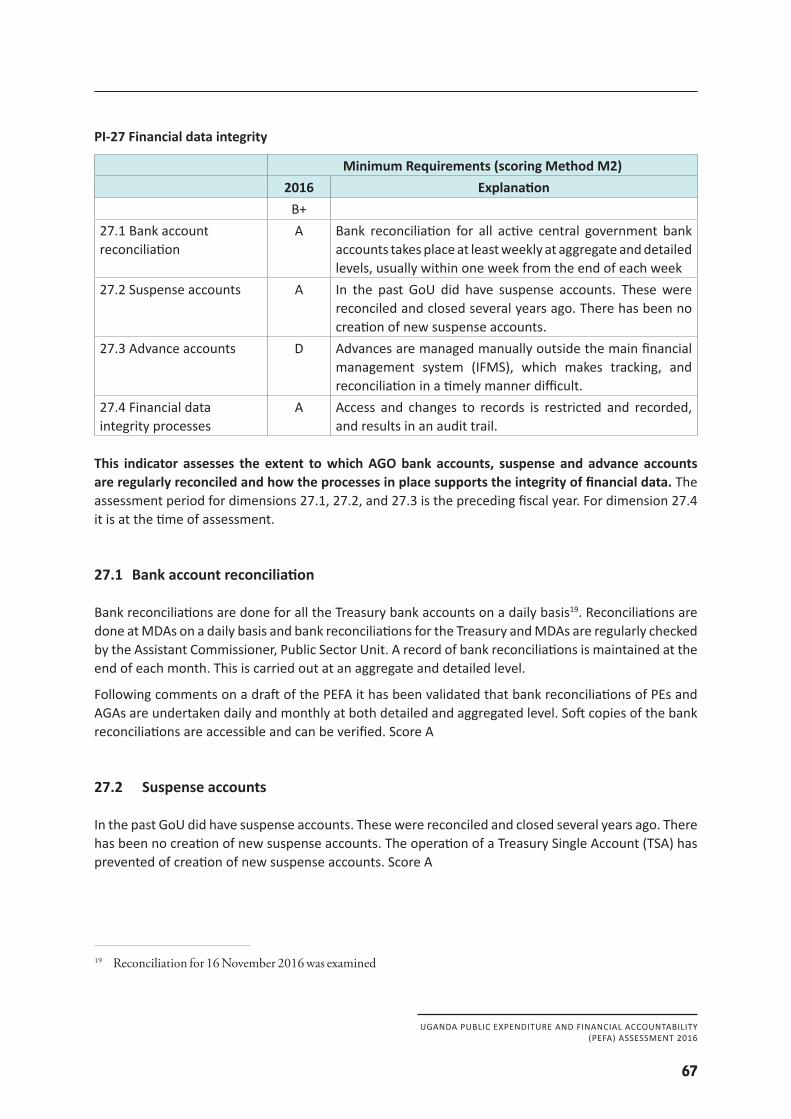
UGANDA PUBLIC EXPENDITURE AND FINANCIAL ACCOUNTABILITY(PEFA) ASSESSMENT 2016
67
PI-27 Financial data integrity
Minimum Requirements (scoring Method M2)2016 Explanation
B+27.1 Bank account reconciliation
A Bank reconciliation for all active central government bank accounts takes place at least weekly at aggregate and detailed levels, usually within one week from the end of each week
27.2 Suspense accounts A In the past GoU did have suspense accounts. These were reconciled and closed several years ago. There has been no creation of new suspense accounts.
27.3 Advance accounts D Advances are managed manually outside the main financial management system (IFMS), which makes tracking, and reconciliation in a timely manner difficult.
27.4 Financial data integrity processes
A Access and changes to records is restricted and recorded, and results in an audit trail.
This indicator assesses the extent to which AGO bank accounts, suspense and advance accounts are regularly reconciled and how the processes in place supports the integrity of financial data. The assessment period for dimensions 27.1, 27.2, and 27.3 is the preceding fiscal year. For dimension 27.4 it is at the time of assessment.
27.1 Bank account reconciliation
Bank reconciliations are done for all the Treasury bank accounts on a daily basis19. Reconciliations are done at MDAs on a daily basis and bank reconciliations for the Treasury and MDAs are regularly checked by the Assistant Commissioner, Public Sector Unit. A record of bank reconciliations is maintained at the end of each month. This is carried out at an aggregate and detailed level.
Following comments on a draft of the PEFA it has been validated that bank reconciliations of PEs and AGAs are undertaken daily and monthly at both detailed and aggregated level. Soft copies of the bank reconciliations are accessible and can be verified. Score A
27.2 Suspense accounts
In the past GoU did have suspense accounts. These were reconciled and closed several years ago. There has been no creation of new suspense accounts. The operation of a Treasury Single Account (TSA) has prevented of creation of new suspense accounts. Score A
19 Reconciliation for 16 November 2016 was examined
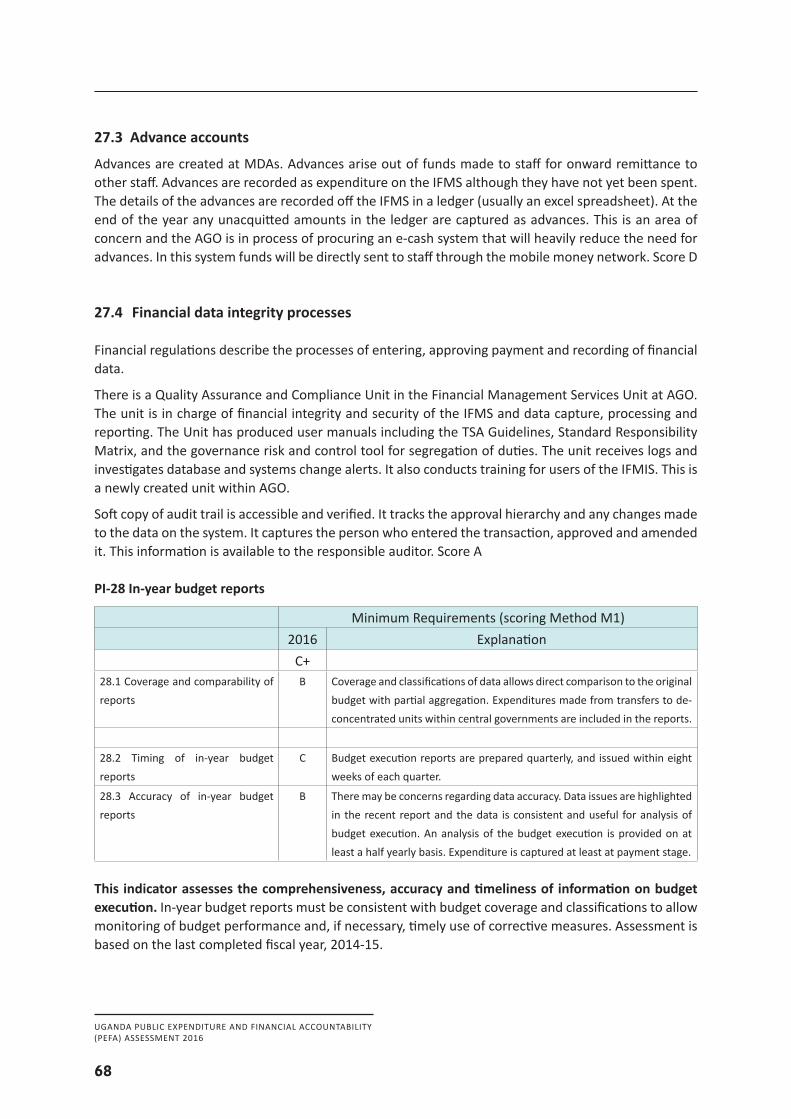
UGANDA PUBLIC EXPENDITURE AND FINANCIAL ACCOUNTABILITY(PEFA) ASSESSMENT 2016
68
27.3 Advance accounts
Advances are created at MDAs. Advances arise out of funds made to staff for onward remittance to other staff. Advances are recorded as expenditure on the IFMS although they have not yet been spent. The details of the advances are recorded off the IFMS in a ledger (usually an excel spreadsheet). At the end of the year any unacquitted amounts in the ledger are captured as advances. This is an area of concern and the AGO is in process of procuring an e-cash system that will heavily reduce the need for advances. In this system funds will be directly sent to staff through the mobile money network. Score D
27.4 Financial data integrity processes
Financial regulations describe the processes of entering, approving payment and recording of financial data.
There is a Quality Assurance and Compliance Unit in the Financial Management Services Unit at AGO. The unit is in charge of financial integrity and security of the IFMS and data capture, processing and reporting. The Unit has produced user manuals including the TSA Guidelines, Standard Responsibility Matrix, and the governance risk and control tool for segregation of duties. The unit receives logs and investigates database and systems change alerts. It also conducts training for users of the IFMIS. This is a newly created unit within AGO.
Soft copy of audit trail is accessible and verified. It tracks the approval hierarchy and any changes made to the data on the system. It captures the person who entered the transaction, approved and amended it. This information is available to the responsible auditor. Score A
PI-28 In-year budget reports
Minimum Requirements (scoring Method M1)2016 Explanation
C+28.1 Coverage and comparability of reports
B Coverage and classifications of data allows direct comparison to the original budget with partial aggregation. Expenditures made from transfers to de-concentrated units within central governments are included in the reports.
28.2 Timing of in-year budget reports
C Budget execution reports are prepared quarterly, and issued within eight weeks of each quarter.
28.3 Accuracy of in-year budget reports
B There may be concerns regarding data accuracy. Data issues are highlighted in the recent report and the data is consistent and useful for analysis of budget execution. An analysis of the budget execution is provided on at least a half yearly basis. Expenditure is captured at least at payment stage.
This indicator assesses the comprehensiveness, accuracy and timeliness of information on budget execution. In-year budget reports must be consistent with budget coverage and classifications to allow monitoring of budget performance and, if necessary, timely use of corrective measures. Assessment is based on the last completed fiscal year, 2014-15.
UGANDA PUBLIC EXPENDITURE AND FINANCIAL ACCOUNTABILITY(PEFA) ASSESSMENT 2016
69
In terms of the scope for future improvements “…. The new Public Finance Management Act provides a good foundation for addressing some of these concerns. The Act defines the frequency and coverage of in-year fiscal reports, and has amended the timelines for submission and audit of financial statements. In addition, Uganda’s current PFM Reform Strategy (2014-18)20 includes components related to enhancing the monitoring and oversight across government entities: expanding the coverage of IFMS to extra budgetary units, donor funded projects, and local governments; integrating IFMS and the budgeting system to improve the timeliness and integrity of fiscal reports; sharpening the monitoring and reporting of arrears, and the accounting and reporting of assets; and, extending the coverage of the treasury single account arrangements…” IMF
28.1 Coverage and comparability of reports
The recent IMF Fiscal Transparency Evaluation report identified the following
“…Fiscal reports do not provide a complete picture of the government’s finances. The budget and semi-annual budget execution reports only cover about 77 per cent of the expenditure of the public sector, as they exclude the full revenues and expenditure of around 63 central government extra-budgetary units, and 32 public corporations. The list of tax exemptions does not cover a complete range of tax expenditures. It is difficult to track in-year changes to the budget. Regularly produced fiscal reports cover only the budgetary central government and local government….”
“…Fiscal reports cover cash, revenue, expenditures and financing. The budget execution reports record actual transactions in receipts and expenditures on a modified cash basis. Revenue includes tax and non-tax revenue, but does not include local government own-source revenue, which is not sizeable. Budgetary central government to extra-budgetary units, local governments, and projects outside of Uganda’s Integrated Financial Management System (IFMS), are recorded as expenditure when the funds are disbursed…”
The IMF Report was used as proxy/secondary evidence base given fieldwork time constraints. However, the veracity of the report as applied at the time of the assessment has been confirmed by the Accountant General’s Office. Score B
28.2 Timing of in-year budget reports
Evidence obtained from the IMF Fiscal Transparency Report indicates “… In-year fiscal reports are produced in a regular and timely manner. Ministry of Finance publishes monthly fiscal statistics on its website for budgetary central government within four-to-six weeks of the reporting period. Budget execution is reported through the Semi-Annual Budget Performance Report that is published with a lag of around one quarter, and contains detailed information on financial and nonfinancial performance
20 Uganda PFM Reform Strategy 2014-2018,Ministry of Finance
UGANDA PUBLIC EXPENDITURE AND FINANCIAL ACCOUNTABILITY(PEFA) ASSESSMENT 2016
70
at sector and vote levels. Quarterly budget execution data are published for each vote on the Uganda Budget Information website with a lag of 6-8 weeks, but these reports are not consolidated. Ministry of Finance has started publishing semi-annually a new Debt Statistical Bulletin covering public sector debt and private sector external debt.21 The information published by vote on quarterly expenditure limits set by Ministry of Finance adds transparency to the budget execution process, and can be further improved by including information on cumulative limits against total appropriations for the year...”
The IFMS produces internal reports, which help MoFPED and MDAs to monitor budget execution. The reports are produced from the database on the IFMS and can be configured to suit the needs of management. These reports provide information on authorized budget, expenditure and balance available. Accounting officers and other users of the IFMS can access the reports online in real time.
“…Budget execution reports are prepared on the same basis and institutional coverage as the budget, but they are not reconciled with fiscal statistics or annual financial statements. The reports present and compare final outturns by administrative, economic, and functional classification, but they do not reflect the in-year revisions made to the budget. The monthly GFS reports that are produced for budgetary central government are consistent with the budget and the outturn, but these fiscal reports are not reconciled. The consolidated financial statement is prepared on the same basis as the budget, but does not provide a clear reconciliation with budget outturns or fiscal statistics. However, the on-going initiative to produce general government financial statements as required under the PFM Act 2015 and as envisaged under the East African Monetary Union (EAMU) Protocol will require clear reconciliations between budget outturns, annual financial statements, and fiscal statistics to provide assurance of the integrity of fiscal reports…” IMF. Score C
28.3 Accuracy of in-year budget reports
The in-year budget reports are produced from the IFMS database. The reports include information on commitments and payments. They also provide information on available funding as well. The reports are accurate. Revisions and amendments are entered so that subsequent versions of reports have correct data.
“…Classification (Good) Fiscal reports, which are classified (by IMF) as ‘good’ in Uganda include administrative, economic and functional classifications. The administrative classification is based on the existing accountability and budget administration arrangements within government. The economic classification is broadly aligned with GFSM 2014. The functional analysis set out in the Classification of Functions of Government (COFOG) has been adjusted to match the structure of the National Development Plan. The IFMS chart of accounts and bridging tables produce reports that are consistent with the GFSM and COFOG standards. The reporting structure is harmonized across budget and accounting systems, and has been implemented across budgetary central government, local government, and some extra-budgetary units since March 2011…”
21 There are plans to accelerate to quarterly the publishing of this information.
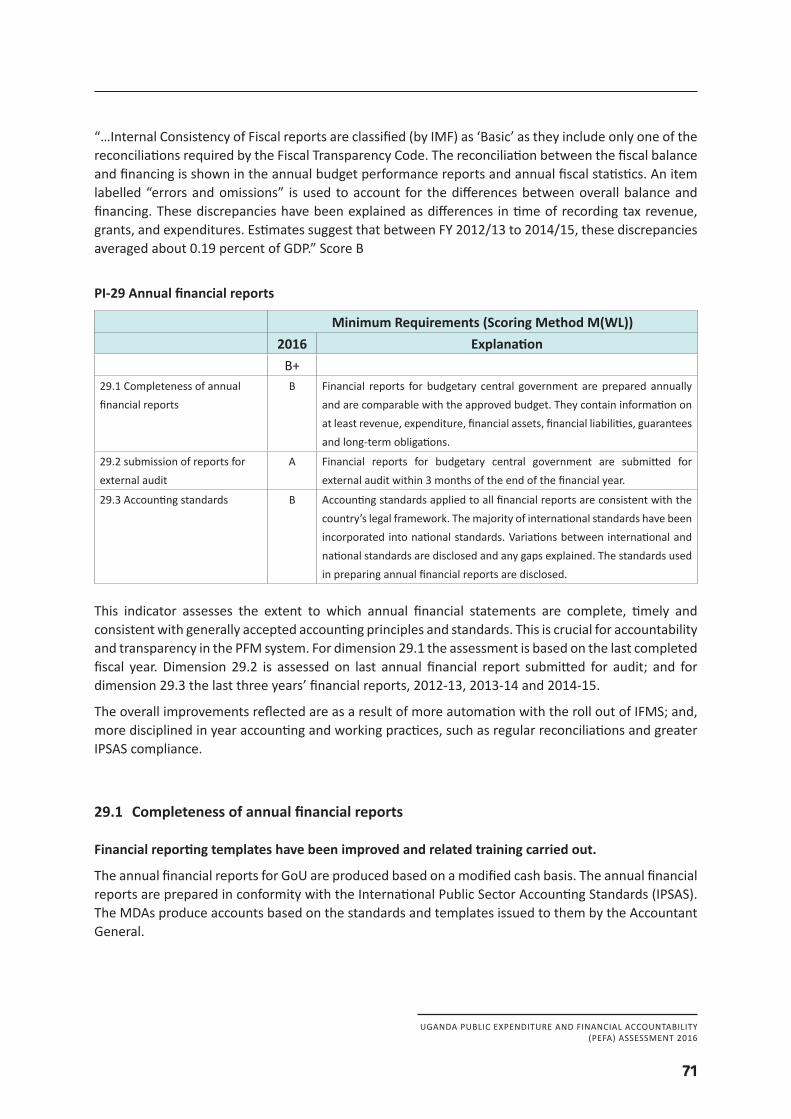
UGANDA PUBLIC EXPENDITURE AND FINANCIAL ACCOUNTABILITY(PEFA) ASSESSMENT 2016
71
“…Internal Consistency of Fiscal reports are classified (by IMF) as ‘Basic’ as they include only one of the reconciliations required by the Fiscal Transparency Code. The reconciliation between the fiscal balance and financing is shown in the annual budget performance reports and annual fiscal statistics. An item labelled “errors and omissions” is used to account for the differences between overall balance and financing. These discrepancies have been explained as differences in time of recording tax revenue, grants, and expenditures. Estimates suggest that between FY 2012/13 to 2014/15, these discrepancies averaged about 0.19 percent of GDP.” Score B
PI-29 Annual financial reports
Minimum Requirements (Scoring Method M(WL))2016 Explanation
B+29.1 Completeness of annual financial reports
B Financial reports for budgetary central government are prepared annually and are comparable with the approved budget. They contain information on at least revenue, expenditure, financial assets, financial liabilities, guarantees and long-term obligations.
29.2 submission of reports for external audit
A Financial reports for budgetary central government are submitted for external audit within 3 months of the end of the financial year.
29.3 Accounting standards B Accounting standards applied to all financial reports are consistent with the country’s legal framework. The majority of international standards have been incorporated into national standards. Variations between international and national standards are disclosed and any gaps explained. The standards used in preparing annual financial reports are disclosed.
This indicator assesses the extent to which annual financial statements are complete, timely and consistent with generally accepted accounting principles and standards. This is crucial for accountability and transparency in the PFM system. For dimension 29.1 the assessment is based on the last completed fiscal year. Dimension 29.2 is assessed on last annual financial report submitted for audit; and for dimension 29.3 the last three years’ financial reports, 2012-13, 2013-14 and 2014-15.
The overall improvements reflected are as a result of more automation with the roll out of IFMS; and, more disciplined in year accounting and working practices, such as regular reconciliations and greater IPSAS compliance.
29.1 Completeness of annual financial reports
Financial reporting templates have been improved and related training carried out.
The annual financial reports for GoU are produced based on a modified cash basis. The annual financial reports are prepared in conformity with the International Public Sector Accounting Standards (IPSAS). The MDAs produce accounts based on the standards and templates issued to them by the Accountant General.
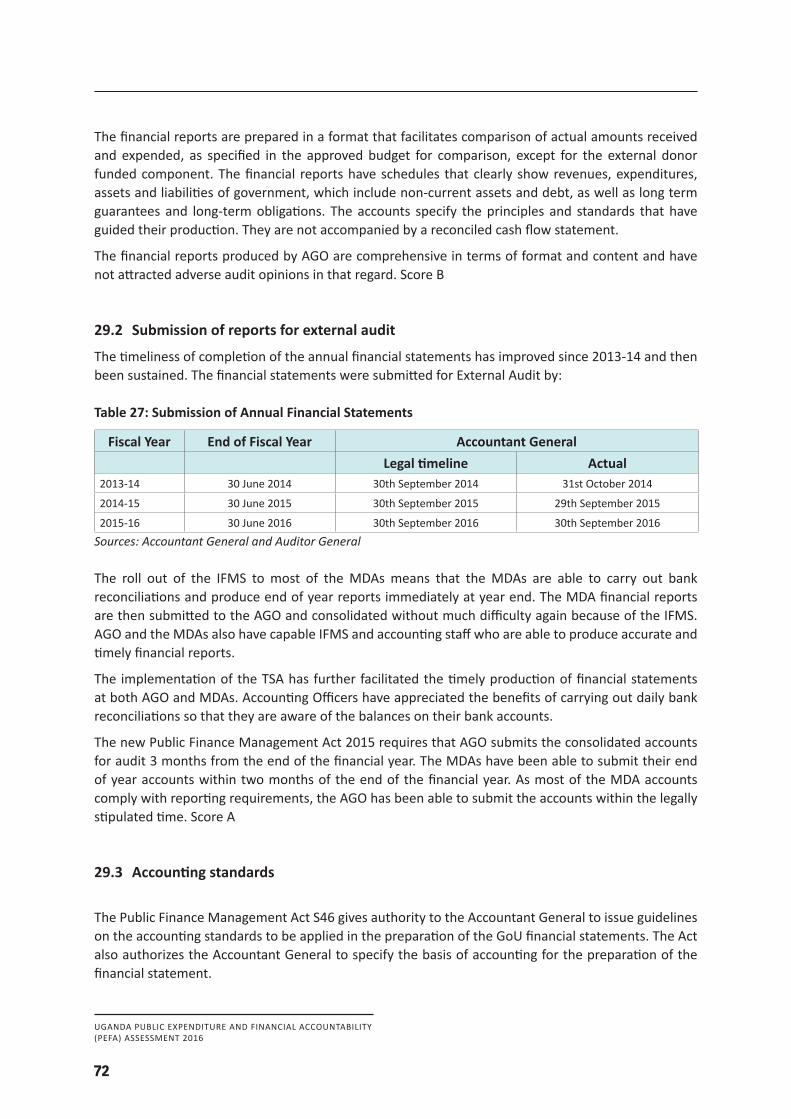
UGANDA PUBLIC EXPENDITURE AND FINANCIAL ACCOUNTABILITY(PEFA) ASSESSMENT 2016
72
The financial reports are prepared in a format that facilitates comparison of actual amounts received and expended, as specified in the approved budget for comparison, except for the external donor funded component. The financial reports have schedules that clearly show revenues, expenditures, assets and liabilities of government, which include non-current assets and debt, as well as long term guarantees and long-term obligations. The accounts specify the principles and standards that have guided their production. They are not accompanied by a reconciled cash flow statement.
The financial reports produced by AGO are comprehensive in terms of format and content and have not attracted adverse audit opinions in that regard. Score B
29.2 Submission of reports for external audit
The timeliness of completion of the annual financial statements has improved since 2013-14 and then been sustained. The financial statements were submitted for External Audit by:
Table 27: Submission of Annual Financial Statements
Fiscal Year End of Fiscal Year Accountant GeneralLegal timeline Actual
2013-14 30 June 2014 30th September 2014 31st October 2014
2014-15 30 June 2015 30th September 2015 29th September 2015
2015-16 30 June 2016 30th September 2016 30th September 2016Sources:AccountantGeneralandAuditorGeneral The roll out of the IFMS to most of the MDAs means that the MDAs are able to carry out bank reconciliations and produce end of year reports immediately at year end. The MDA financial reports are then submitted to the AGO and consolidated without much difficulty again because of the IFMS. AGO and the MDAs also have capable IFMS and accounting staff who are able to produce accurate and timely financial reports.
The implementation of the TSA has further facilitated the timely production of financial statements at both AGO and MDAs. Accounting Officers have appreciated the benefits of carrying out daily bank reconciliations so that they are aware of the balances on their bank accounts.
The new Public Finance Management Act 2015 requires that AGO submits the consolidated accounts for audit 3 months from the end of the financial year. The MDAs have been able to submit their end of year accounts within two months of the end of the financial year. As most of the MDA accounts comply with reporting requirements, the AGO has been able to submit the accounts within the legally stipulated time. Score A
29.3 Accounting standards
The Public Finance Management Act S46 gives authority to the Accountant General to issue guidelines on the accounting standards to be applied in the preparation of the GoU financial statements. The Act also authorizes the Accountant General to specify the basis of accounting for the preparation of the financial statement.
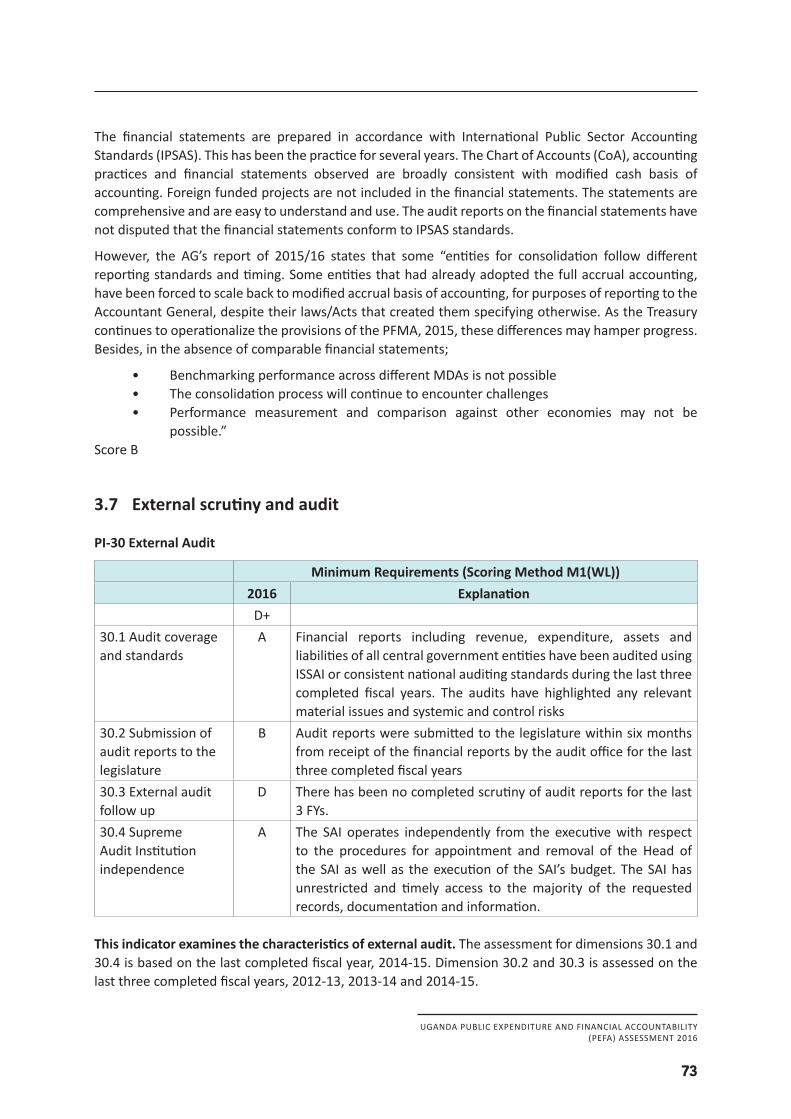
UGANDA PUBLIC EXPENDITURE AND FINANCIAL ACCOUNTABILITY(PEFA) ASSESSMENT 2016
73
The financial statements are prepared in accordance with International Public Sector Accounting Standards (IPSAS). This has been the practice for several years. The Chart of Accounts (CoA), accounting practices and financial statements observed are broadly consistent with modified cash basis of accounting. Foreign funded projects are not included in the financial statements. The statements are comprehensive and are easy to understand and use. The audit reports on the financial statements have not disputed that the financial statements conform to IPSAS standards.
However, the AG’s report of 2015/16 states that some “entities for consolidation follow different reporting standards and timing. Some entities that had already adopted the full accrual accounting, have been forced to scale back to modified accrual basis of accounting, for purposes of reporting to the Accountant General, despite their laws/Acts that created them specifying otherwise. As the Treasury continues to operationalize the provisions of the PFMA, 2015, these differences may hamper progress. Besides, in the absence of comparable financial statements;
• Benchmarking performance across different MDAs is not possible• The consolidation process will continue to encounter challenges • Performance measurement and comparison against other economies may not be
possible.”Score B
3.7 External scrutiny and audit
PI-30 External Audit
Minimum Requirements (Scoring Method M1(WL))2016 Explanation
D+30.1 Audit coverage and standards
A Financial reports including revenue, expenditure, assets and liabilities of all central government entities have been audited using ISSAI or consistent national auditing standards during the last three completed fiscal years. The audits have highlighted any relevant material issues and systemic and control risks
30.2 Submission of audit reports to the legislature
B Audit reports were submitted to the legislature within six months from receipt of the financial reports by the audit office for the last three completed fiscal years
30.3 External audit follow up
D There has been no completed scrutiny of audit reports for the last 3 FYs.
30.4 Supreme Audit Institution independence
A The SAI operates independently from the executive with respect to the procedures for appointment and removal of the Head of the SAI as well as the execution of the SAI’s budget. The SAI has unrestricted and timely access to the majority of the requested records, documentation and information.
This indicator examines the characteristics of external audit. The assessment for dimensions 30.1 and 30.4 is based on the last completed fiscal year, 2014-15. Dimension 30.2 and 30.3 is assessed on the last three completed fiscal years, 2012-13, 2013-14 and 2014-15.
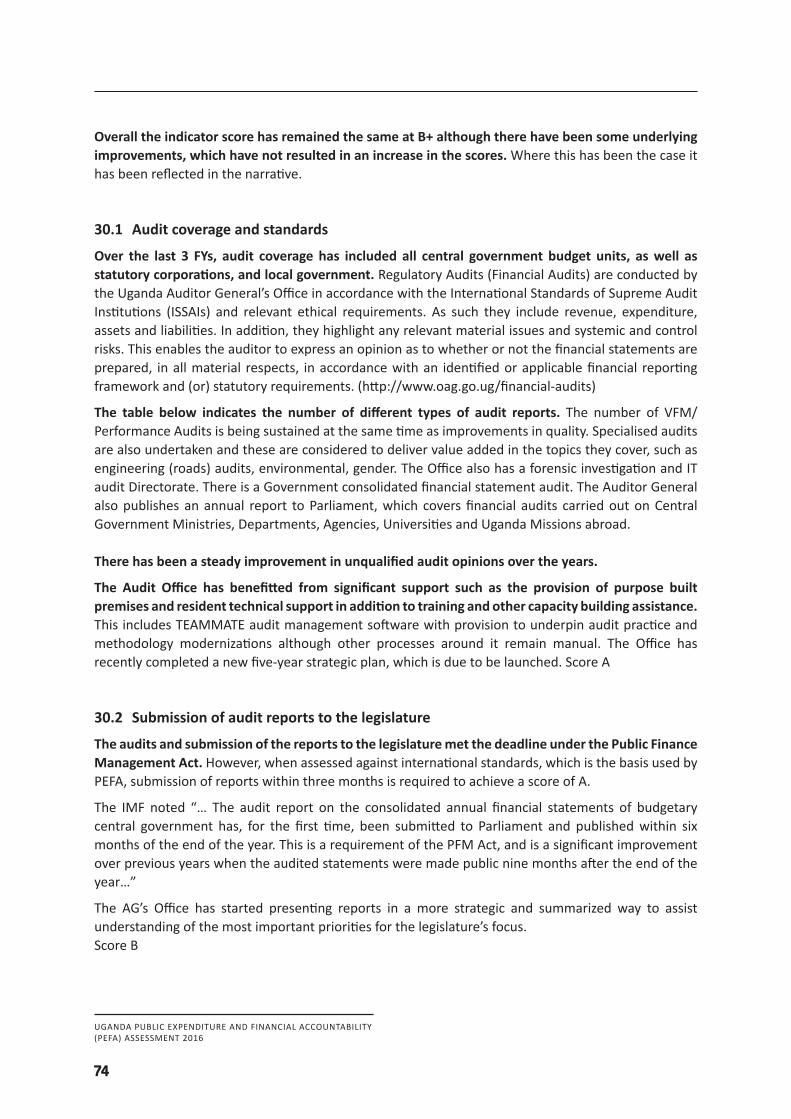
UGANDA PUBLIC EXPENDITURE AND FINANCIAL ACCOUNTABILITY(PEFA) ASSESSMENT 2016
74
Overall the indicator score has remained the same at B+ although there have been some underlying improvements, which have not resulted in an increase in the scores. Where this has been the case it has been reflected in the narrative.
30.1 Audit coverage and standards
Over the last 3 FYs, audit coverage has included all central government budget units, as well as statutory corporations, and local government. Regulatory Audits (Financial Audits) are conducted by the Uganda Auditor General’s Office in accordance with the International Standards of Supreme Audit Institutions (ISSAIs) and relevant ethical requirements. As such they include revenue, expenditure, assets and liabilities. In addition, they highlight any relevant material issues and systemic and control risks. This enables the auditor to express an opinion as to whether or not the financial statements are prepared, in all material respects, in accordance with an identified or applicable financial reporting framework and (or) statutory requirements. (http://www.oag.go.ug/financial-audits)
The table below indicates the number of different types of audit reports. The number of VFM/ Performance Audits is being sustained at the same time as improvements in quality. Specialised audits are also undertaken and these are considered to deliver value added in the topics they cover, such as engineering (roads) audits, environmental, gender. The Office also has a forensic investigation and IT audit Directorate. There is a Government consolidated financial statement audit. The Auditor General also publishes an annual report to Parliament, which covers financial audits carried out on Central Government Ministries, Departments, Agencies, Universities and Uganda Missions abroad. There has been a steady improvement in unqualified audit opinions over the years.
The Audit Office has benefitted from significant support such as the provision of purpose built premises and resident technical support in addition to training and other capacity building assistance. This includes TEAMMATE audit management software with provision to underpin audit practice and methodology modernizations although other processes around it remain manual. The Office has recently completed a new five-year strategic plan, which is due to be launched. Score A
30.2 Submission of audit reports to the legislature
The audits and submission of the reports to the legislature met the deadline under the Public Finance Management Act. However, when assessed against international standards, which is the basis used by PEFA, submission of reports within three months is required to achieve a score of A.
The IMF noted “… The audit report on the consolidated annual financial statements of budgetary central government has, for the first time, been submitted to Parliament and published within six months of the end of the year. This is a requirement of the PFM Act, and is a significant improvement over previous years when the audited statements were made public nine months after the end of the year…”
The AG’s Office has started presenting reports in a more strategic and summarized way to assist understanding of the most important priorities for the legislature’s focus. Score B
UGANDA PUBLIC EXPENDITURE AND FINANCIAL ACCOUNTABILITY(PEFA) ASSESSMENT 2016
75
30.3 External audit follow up
The follow up of the external audit findings and recommendations has been improving. The Auditor General in drawing up his audit programmes incorporates review of the implementation of the previous period’s recommendations. If those recommendations have not been followed this will be stated in the current audit report. Before the audit is concluded an exit meeting is held with an Accounting Officer where the audit findings and recommendations are discussed. Most of the recommendations are resolved at the meeting. Those that are not resolved are included in the management letter. Due to the delay in reviewing OAG reports by parliament, there has been no comprehensive report on actions by the executive. Despite this, progress has been made in following up some of the most critical and high risk issues.
It is hoped that with the new PFM Act Accounting Officers will be more responsive to audit recommendations, because non-compliance with the new Act carries serious sanctions on the part of the Accounting Officers.Score D
30.4 Supreme Audit Institution independence
The 1995 Constitution (as amended) and the 2008 National Audit Act provide for the independence of the Auditor General22. The Auditor General is appointed by the Head of State and ratified by Parliament. The National Audit Act 2008 provides the mandate for the OAG as follows:
Section 4 - the appointment of the Auditor General is in line with the Art. 163 of the Constitution - appointed by the President with the approval of Parliament.
Section 9 - Staff of Office of Auditor General: The Auditor General shall in consultation with the Public Service Commission, appoint, promote and discipline his or her own staff.
Section 14 - Independence of Auditor General: The Auditor General, in performing his or her functions under the Act shall not be under the direction or control of any person or authority.
Section 24 - Powers of Auditor General grants unrestricted access and timely access to all records, documentation and information
Section 29 - Expenses of the OAG – are a direct charge to the Consolidated Fund.
The Auditor General has confirmed that these are fully operational. Score A
22 http://intosaiitaudit.org/mandates/writeups/uganda.htm
UGANDA PUBLIC EXPENDITURE AND FINANCIAL ACCOUNTABILITY(PEFA) ASSESSMENT 2016
76
PI-31 Legislative scrutiny of audit reports
Minimum Requirements (Scoring Method M2(AV))2016 Explanation
C31.1 Timing of audit report scrutiny
D Parliament has not yet completed scrutiny of the audit report for the financial year 2012/13 and is reviewing 2013/14 and 2014/15 concurrently. Does not meet the requirement for a C score.
31.2 Hearings of audit findings C In-depth hearings of key findings of audit reports take place occasionally, covering a few audited entities or may take place with ministry of finance officials only.
31.3 Recommendations on audit by the legislature
C The legislature issues recommendations on actions to be implemented by the executive.
31.4 Transparency of legislative scrutiny of audit reports
B Hearings conducted in public with a few exceptions in addition to national security or similar sensitive discussions. Committee reports are provided to the full chamber of the legislature and published on an official website or by any other means easily accessible to the public.
This indicator focuses on scrutiny of the audited financial reports by central government, including institutional units, to the extent that either (a) they are required by law to submit audit reports to the legislature or (b) their parent or controlling unit must answer questions and take action on their behalf. The assessment covers the last three fiscal years, 2012-13, 2013-14 and 2014-15.
31.1 Timing of audit report scrutiny
The Public Accounts Committee is tasked with scrutinizing the audit report. However, the legislative process is slow and there are backlogs from previous years’ Auditor General’s reports. The Auditor General has recognized that the reports from his Office have over the years “…continued to expand … in quantity and size…” In response the AG has reduced the size of reports to assist PAC to focus on key higher risk issues. A notable improvement has been the scrutiny of a full audit report for districts, town councils and municipalities for 2013/14 adopted in January 2017.23 Parliament has not yet completed scrutiny of the audit report for the financial year 2012/13 and is reviewing 2013/14 and 2014/15 concurrently. Score D
23 Report of The Committee on Local Government Accounts on The Auditor General’s Report for Financial Year 2014/15 on District Local Governments and Municipal Councils.
UGANDA PUBLIC EXPENDITURE AND FINANCIAL ACCOUNTABILITY(PEFA) ASSESSMENT 2016
77
31.2 Hearings on audit findings
There is an acknowledged backlog in the scrutiny and hearings of the Auditor General’s reports. In an election year it was stated that the report does not get considered by the PAC members in the field. At the present time PAC is working concurrently on the Auditor General’s reports for the financial years 2013/14 and 2014/15, alongside 2012/13 of which approximately 50% of the work has been completed. PAC has approached this review as two teams, with one focusing on adverse and qualified audit opinions, and the second team on unqualified audit opinions.
Some induction training has been given to Accounting Officers regarding the PAC hearings they are required to attend. This training has started with local government.
PAC issues a Treasury Memorandum on the findings of the Auditor General’s Report. The subsequent year’s Auditor General’s report should have a section on this.
In-depth hearings on key findings of audit reports take place with responsible officers from some audited entities, which received a qualified, adverse or disclaimer opinion. The National Oversight Report indicates that between 10% and 25% of qualified audits result in such hearings. Score C
31.3 Recommendations on audit by the legislature
This remains a weak link in oversight at the end of the oversight / scrutiny cycle. It negates a number of benefits of the improvements elsewhere. For example, there are demonstrable improvements in accounts preparation and the Auditor General’s reports are being submitted to Parliament more quickly. The indication in meetings was that “Parliament was the problem”, though it should be noted that there has been some recent progress in Parliament reviewing audit committee reports on selected institutions and producing Treasury Memoranda. Parliamentary Committees do scrutinize audit reports, but with a time lag. The executive issues a Treasury Memorandum in response to Parliament’s reports. Furthermore, the Auditor General is required to audit the Treasury Memorandum under Section 13 (1)(f) of the National Audit Act 2008. Recommendations were made in 2014 and 2015. However, much more needs to be done to ensure timely follow up of the OAG’s reports.
Recommendations are being issued but with a time lag. The following Treasury Memoranda were prepared and submitted to Parliament:
1. Treasury memorandum on Financial Statements vol. II Central Government – Qualified Opinion Vol. II 2012/13
2. Treasury Memorandum on Financial Statements vol. II Central Government – Disclaimer Opinion 2012/13
3. Treasury memorandum on Regional Referral Hospitals 2009/104. Treasury Memorandum on the Financial Statements vol. II Central Government – Qualified
opinion vol. III 2012/135. Treasury Memorandum on Financial Statements Central Government- vol. II Central
Government – vol. I6. COSASE report on Uganda Nurses and Midwifery Council, The Uganda Medical and Dental
Practitioners Council and the Allied Health Professionals Council 2002-2012
UGANDA PUBLIC EXPENDITURE AND FINANCIAL ACCOUNTABILITY(PEFA) ASSESSMENT 2016
78
7. COSASE report on the audited accounts of Public Enterprises 2011 – 20138. Prepared a Treasury Memoranda for selected statutory corporations; REA, NFA, URC,
UNRA, UHCCL and UBC.
Preparations also commenced on the following Treasury Memoranda:1. PAC report on Health Sector for FY 2014/152. LGAC report on III DLGs and 22 Municipalities for FY 2014/15
In line with sec.19(4) of the National Audit Act 2008, Parliament has passed a resolution that any Committee that does not submit its report within six (6) months’ timeline, the OAG report will be adopted as is.
The system for tracking responses to and implementation of the audit recommendations remains a manual one. Parliament issues recommendations but does not systematically follow them up. Score C
31.4 Transparency of legislative scrutiny of audit reports
Committees of Parliament operate on a delegated mandate of the whole Parliament. The Rules of Procedure require committees to table committee reports for debate and adoption for the recommendations to be binding. This has been and still is the practice with accountability committees handling audit reports.
There were public hearings during the assessment period. The indicator is focused on whether there is some general form of public access and not whether the public are invited to speak. Radio, TV, the printed media and websites are also used as a means of providing transparency to the legislative scrutiny of audit reports. Accountability committees hold hearings openly and transparently at committee level and during plenary debates with live coverage by various media houses.Score B
UGANDA PUBLIC EXPENDITURE AND FINANCIAL ACCOUNTABILITY(PEFA) ASSESSMENT 2016
79
4 Conclusions on the analysis of PFM systems
4.1 Integrated assessment across the performance indicators
Budget reliabilityThe challenges in producing accurate revenue projections have been met in recent years, as demonstrated by the high scores, indicating that revenue actuals were close to both overall and aggregate estimates. As a result, the expenditure side of the budget has also scored A, although this has been dampened by the expenditure composition both by administrative type (score C) and by economic type (score D). This overall result has been achieved in the context of weaknesses in virement (score C) and the existence of supplementary budgets (score C) that have been reflected in composition scores. The process of controlling budget allocations to match the availability of cash has been supported by reasonable cash forecasting (score B) with budgetary units having certainty in the availability of funds to execute their budgets as planned (score B).
However, the stock of arrears is high (score D) with only annual monitoring (score C) which reflect weakness in controls.
Transparency of public financesUganda has an impressive array of information regarding the finances of the budgetary central government. The CoA, which underpins budget preparation, execution and reporting, is comprehensive and consistent with GFS standards (score A). However, the transfers to sub-national government are not transparently determined (score D) though information is included in the budget on a timely basis (score A). As a result, the budget documents include most of the basic, and much of the supplementary information, required to support a transparent budget process (score B).
There is almost complete data regarding extra-budgetary operations for public bodies. Taken together with Estimates of Revenue and Expenditure for MDAs and their supported agencies, there is good coverage of the whole of government in the budget documents. Information on performance plans and achievements in service delivery outputs and outcomes across the government sectors is good (score B). Nevertheless, improvements in tracking resources to service delivery units and evaluation can be improved.
Public access to fiscal information is strong (score A).
Management of assets and liabilitiesA comprehensive and inclusive process is lacking in managing the public investment program though this is being currently addressed as Uganda scales up public investment in the expectation of future oil revenues. All but one element of public investment management assessed in the PEFA currently scores a D. Reporting of risks associated with public corporations (score C), and local government authorities
UGANDA PUBLIC EXPENDITURE AND FINANCIAL ACCOUNTABILITY(PEFA) ASSESSMENT 2016
80
(score D) are also currently weak, though PE risks are improving rapidly and LG represents a low risk given the lack of borrowing in the sector. All aspects of debt management score A, which indicates a strong focus on managing debt.
Policy-based fiscal strategy and budgetingGood progress has been made towards a comprehensive medium term expenditure framework. Fiscal strategy setting is strong and well elaborated, particularly in the published budget documents.
A medium term approach is taken to expenditure budgeting, with baseline multi-year ceilings based on the forward estimates of the most recently approved prior budget. The budget is presented for the up-coming year and two following fiscal years (score A). Nevertheless, there are weaknesses in determining medium term ceiling, alignment of strategic plans and medium term budgets, and explaining any changes with previous estimates (all score D)
Both the budget preparation process and scrutiny process score A, although timely budget approval has been weaker (score C)
Predictability and control in budget executionRevenue administration is relatively strong, but some constraints remain, particularly with respect to risk management, audit and the stock of arrears. The taxation system is based on comprehensive legislation providing information on the tax liabilities of taxpayers. This is supported by information leaflets that can be accessed on-line and at departmental offices, as well as media broadcasts, training and awareness events. The appeals mechanisms are clearly defined by law, with an Independent Tax tribunal in place (score A). URA is now beginning to adopt a risk-based approach to administering revenues. URA stratifies taxpayers based on turnover into large, medium and small. Significant challenges will, however, require URA’s continued attention, especially with regard to building a stronger compliance culture across all segments of the taxpayer population, through a more developed approach to risk management, as well as a judicious balance of audit, compliance and taxpayer service initiatives. URA has a compliance section to address risk but it is not systematic (Score C). URA’s tax audit program covers all core taxes and most taxpayer segments, but lacks evaluation of their impact on compliance. The use of non-audit initiatives is limited and their impact on compliance is not measured (Score C).
Revenue collected is relatively well managed in terms of the flow of funds to the Treasury and recording of transactions. All revenues are transferred into the URA account in the Bank of Uganda by 48 hours from the receiving from commercial banks and then transferred daily to the Treasury account. (Score B). These accounts are reconciled on a timely basis (score A). The Macro-Economic Policy Department within the Ministry responsible for Finance reports annually and quarterly on budgeted and actual domestic tax and non-tax revenues, and development partner revenues in the Budget Performance Reports. The reconciliations by the Accountant General are undertaken on a daily basis and a report is produced monthly (score B).
All unused cash balances at the MDAs’ bank accounts are swept into the TSA at the end of each day. Cash available is consolidated daily (score A). The Cash Flow Committee produces an annual cash flow forecast. The forecast is updated on a quarterly basis as part of the exercise to determine the releases to be made to the budgetary units. (Score B) MDAs and the budgetary units are given information on
UGANDA PUBLIC EXPENDITURE AND FINANCIAL ACCOUNTABILITY(PEFA) ASSESSMENT 2016
81
commitments on a quarterly basis through the quarterly budget ceiling advice. Although there are clear guidelines on in-year budget adjustments, the rules are not adhered to by some of the votes as evidenced by Auditor General reports. Nonetheless, management of budget releases has not been successful in controlling arrears (score D) and arrears are not always adequately monitored (score C).
Most elements of the payroll system score a B. Personnel data and payroll data are reconciled but full (automatic) integration has not yet been achieved. The GoU payroll is processed monthly. Every month each budget vote prepares its own payroll change request that will reflect staff pay changes during the month. The personnel department at the vote prepares the payroll change request, which is checked against establishment, and validates all proposed changes. The payroll is then authorized for payment by the accounting officer. The processing of salaries is the responsibility of the budget vote. The Accounting Officer has powers to put staff onto or off the payroll. Staff entered on the payroll have their particulars checked against the biometric data that is kept at the National Identification and Registration Authority (NIRA). Before being put on the payroll the establishment is checked to ensure the existence of the position. Processing of the payroll is carried out by the personnel department at the budget vote. The internal auditor at the budget vote carries out regular checks to ensure that the payroll functions are working properly. There have been a number of payroll audits in the 2012-2016 period. The most significant one has been the full audit of the payroll (including pensions) database.
The Government passed new amendments to the procurement legislation in 2014 and implementation is still to be realised, so this is scored D with respect to both procurement monitoring and the use of competitive methods. However public access to information is good as is the procurement complaints mechanism (both score B). Internal controls on non-salary expenditures indicates good segregation of duties (score B), but weaker commitment controls and compliance with payment rules and procedures (both score C). These in turn show up in the arrears position.
The internal audit function is still strengthening and includes coverage for all of central government, though capacity and managerial acceptance is weak in some budget units, especially at local government (score A). IA focuses on the adequacy and effectiveness of internal controls systems and internal controls (score B) and has both good implementation of internal audits and reporting and response to them (both score B).
Accounting and reportingAccounts reconciliation and financial data integrity are areas of strengths (score B+). Bank account reconciliation is timely (score A). There are no suspense accounts (score A) Advances are managed manually outside the main financial management system (IFMS), which makes tracking and reconciliation in a timely manner difficult (score D). However, data integrity is good (score A), due to oversight of the Quality Assurance and Compliance Unit in the Financial Management Services Unit at AGO.
Fiscal reports cover cash revenue, expenditures and financing. The budget execution reports record actual transactions in receipts and expenditures on a modified cash basis. Revenue includes tax and non-tax revenue, but does not include local government own-source revenue, which is not sizeable (score B). In-year fiscal reports are produced in a regular and timely manner. Ministry of Finance publishes monthly fiscal statistics on its website for budgetary central government within four-to-six weeks of the reporting period. The BMAU, under MoFPED, prepares and publishes a semi-annual and annual Budget Performance Report, which feeds into the preparation of the Government Annual Performance
UGANDA PUBLIC EXPENDITURE AND FINANCIAL ACCOUNTABILITY(PEFA) ASSESSMENT 2016
82
Report (GAPR), produced and published by the OPM. This informs the budget preparation process, (Score B). Fiscal reports in Uganda include administrative, economic and functional classifications and are consistent with international standards (Score A). Annual reporting is timely (Score A) and is comparable with the budget (score B) and complies with the majority of international standards (Score B).
External scrutiny and auditExternal audit is an area of significant strength, though legislative scrutiny less so (Score C). The Auditor General’s Department is active in carrying out financial and compliance audits (score A). The audits and submission of the reports to the legislature met the deadline under the Public Finance Management Act (score B). The follow up of external audit findings and recommendations has been improving. Before the audit is concluded an exit meeting is held with an Accounting Officer where the audit findings and recommendations are discussed. Most of the recommendations are resolved at the meeting. Those that are not resolved are included in the management letter. The Constitution and the National Audit Act provide for the independence of the Auditor General. The Auditor General’s budget is a direct charge on the consolidated fund, which gives him adequate financial and operational independence (score A).
The Public Accounts Committee is tasked with scrutinizing the audit report. However, the legislative process is slow and there are backlogs from previous years’ Auditor General’s reports (score D). Given this delay, PAC has approach audit reports reviews as two teams with one focusing on adverse and qualified audit opinions and the second team on unqualified audit opinions. Some induction training has been given to Accounting Officers regarding the PAC hearings they are required to attend. This training has started with local government. PAC issues a report on the findings of the Auditor General’s Report, which must be approved by Parliament and submitted to MoFPED, which is required to issue Treasury Memorandum on actions taken (score C). Recommendations on audit by the legislature remain a weak link in oversight at the end of the oversight cycle (score C). There were public hearings during the assessment period. Radio, TV, the printed media and websites are also used to provide transparency to the legislative scrutiny of audit reports. (Score B)
4.2 Effectiveness of the internal control framework
An effective internal control system plays a vital role across every pillar in addressing risks and providing reasonable assurance that operations meet the control objectives. The objectives of the internal control framework are: a budget executed in an orderly, ethical, economical, efficient and effective manner; accountability for results; compliance with applicable laws and regulations; and, safeguarding of resources against loss, misuse and damage.
The internal control environment, as set out in annex 2, is generally sound. The scores in related indicators and dimensions reinforce that controls associated with the day-to-day transaction of the budgetary central government are functioning and result in good data integrity regarding the activities of these entities. The laws and regulations provide the legal framework, and allow for specific roles and responsibilities, segregation of duties, and operating processes. The system embeds access controls and audit trails that support the internal control framework.
UGANDA PUBLIC EXPENDITURE AND FINANCIAL ACCOUNTABILITY(PEFA) ASSESSMENT 2016
83
However, the current compliance based approach does not support continuous improvement in the control environment. There is weakness in commitment controls and associated compliance with rules and procedures.
There is a risk based approach supported by a strong internal and external audit and oversight function. Risk assessment is an important part of the control framework that applies to internal audit and analysis. Similarly, certain activities, such as advances, payroll, and pension payments receive a level of attention in the ex-ante control process. However, a broader examination of risk focused on control and governance arrangements in public entities such as public corporations and extra-budgetary units is required, as well as for some high value taxpayers.
Control activities are generally strong, in particular segregation of duties, (though the decentralized payroll is still working on improvements), and reconciliation of accounts (though advances are a weakness). Furthermore, budget rules for supplementary estimates are not always met.
Information and communication of internal control awareness is continuously promoted through targeted and cross-cutting training.
Monitoring is strong through the processes of internal and external audit, with follow-up improving.
4.3 Strengths and weaknesses of PFM
Aggregate Fiscal DisciplineAggregate fiscal discipline is achieved due to control over spending during budget execution, as well as realistic revenue forecasts. Strong revenue administration ensures that revenues are efficiently collected. The planned budget on an aggregate basis is not unduly circumvented by the use of virement and supplementary budgets. Treasury operations and cash management enables expenditures to be managed within the available resources but there are arrears. However, control of contractual commitments is not sufficiently effective, creating a risk of generating further expenditure arrears. The strong external audit function enhances fiscal discipline.
Strategic allocation of resourcesThere is a strong emphasis on the overall fiscal framework. The Chart of Accounts caters for a multi-dimensional analysis of expenditure. However, the link between the medium term perspective in expenditure budgeting and strategic plans needs to be developed to improve the strategic allocation of resources.
Efficient use of resources for service deliveryThe current weaknesses in competitive bidding in the procurement system could have adverse implications for the efficiency in service delivery. The strengths in the accountability mechanisms – such as the comprehensiveness and production of annual financial statements - make external audits effective as counter checks on inefficient use of resources. Publishing of performance targets and outcomes also assists the efficient use of resources, though lack of systematic program evaluation and data on resources available at service delivery units can undermine accountability. Such information
UGANDA PUBLIC EXPENDITURE AND FINANCIAL ACCOUNTABILITY(PEFA) ASSESSMENT 2016
84
would help management decision-making to support improved service delivery. On the revenue side, operational efficiency is compromised by the accumulation of tax arrears. Lack of effective tax debt collection undermines credibility of tax assessments and the principle of equal treatment of taxpayers. The introduction of arrears write-off legislation would afford the opportunity to clean up tax arrears and make them current.
4.4 Performance changes since previous assessment
While the PEFA has been carried out using the 2016 methodology, it has been possible to score against the 2011 PEFA methodology, which was used in the previous PEFA assessment of Uganda. Across the 71 individual indicator dimensions compared, there has been an improvement in 21 dimensions, deterioration in 6 and no change identifiable in 44 dimensions.
The comparison of the assessments indicates that between the two PEFAs credibility has improved as revenues are now well in line with budget estimates. There have also been improvements in the orderliness and participation in the budget process as well as multi-year fiscal forecasts and functional allocation. Debt recording and reporting has also improved as has payroll functions and elements of procurement. Payroll and procurement have achieved this despite an ambitious decentralization policy. Internal control and internal audit have also advanced. The main area of backsliding is arrears, tax audits and reconciliation of arrears.
Many of these improvements can be attributed to strong management of the PFM reform programme as well as the enactment of the new PFM Act (2015). Some improvements have already been made as a result of the Act and its legal requirements, whilst others are still being developed.
UGANDA PUBLIC EXPENDITURE AND FINANCIAL ACCOUNTABILITY(PEFA) ASSESSMENT 2016
85
5 Government PFM reform process
5.1 Overall approach to PFM reform
The Permanent Secretary /Secretary to the Treasury (PS/ST) provides overall leadership to the PFM reform agenda and coordinates, at a strategic level, reforms across the revenue agencies, macroeconomic issues including the PE sector, AGD and Budget. The MoFPED has also established its own Public Expenditure Management Committee (PEMCOM),, which meets under the Chair of the PS/ST. The committee is guided by a Priority Reform Action Matrix (PRAM) which is updated periodically. Updates are shared with development partners.
5.2 Recent and on-going reform actions
The Government of Uganda (GoU) has over the past two decades pursued strategic reforms in Public Financial Management (PFM) geared towards improvement in efficiency, accountability and transparency in the management of public resources. A Public Financial Management (PFM) Reform Strategy was launched on 28 August 2014. It provides strategic guidance for PFM reforms over the four-year period, July 2014 – June 2018. The strategy was informed by the findings of various PFM studies that noted among others, that while the previous PFM strategy was aligned with the National Development Plan (FY 10/11-14/15) and remained relevant on the whole, weaknesses still existed particularly in the areas of compliance with set rules and regulations, as well as budget credibility and control. A number of recommendations were proposed for addressing the gaps, and were adopted in the strategy.
The main current PFM reform programme is the Financial Management and Accountability Programme (FINMAP), which originally commenced in January 2007 and started it 3rd Phase in July 2014 and is expected to last until June 2018. The programme covers the entire financial management process from planning and budgeting to oversight by Parliament. It is designed to support the GoU poverty reduction goals, in particular the Economic Management and Good Governance objectives of the National Development Plan, and is established within the Accountability Sector of the Medium Term Expenditure Framework. The current FINMAP design is based on past diagnostic reviews, in particular the PEFA review of 2012. It is more broadly focussed than its predecessors, which were expected to deliver on concrete initiatives such as IFMS rollout.
FINMAP is financed by GoU and DPs partly through a basket fund established by a Memorandum of Understanding between GoU and DPs including, Norway, Denmark, DFID (UK), KfW (Germany) and the EU. IDA previously supported specific FINMAP activities.
UGANDA PUBLIC EXPENDITURE AND FINANCIAL ACCOUNTABILITY(PEFA) ASSESSMENT 2016
86
The priority areas of FINMAP III are:
• Improvements in compliance with rules and regulations; • Increasing domestic revenue;• Improving fiduciary assurance through strengthening of fiduciary management systems; • Improving cash management;• Institutional capacity strengthening in project management of public investments.• Change Management, communication and knowledge transfer • Monitoring and evaluation framework through the identification of performance indicators
at both outcome and output level.
There are other PFM reform projects outside the FINMAP, such as Swedish support to the OAG, and UNDP and DFID/USAID support to PFM at Local Government Level (Governance Accountability, Participation Programme). The DFID/EU SUGAR programme provides targeted technical support for the fight against corruption, which includes internal and external audit, and assistance in strengthening the sanctions regime.
5.3 Institutional considerations
Uganda’s institutional structure for PFM reform is as follows:
The Ministry of Finance, Planning and Economic Development is responsible for coordinating the implementation of the reform programme under the stewardship of the Deputy Secretary to the Treasury (DST) who is the FINMAP III Task Manager.
The Public Expenditure Management Committee (PEMCOM): The PEMCOM provides a high-level forum for strategic policy guidance and control specifically for Public Financial Management Reforms. It is chaired by the Permanent Secretary/Secretary to the Treasury (PS/ST) and comprises a broad spectrum of stakeholders engaged in PFM, including Heads of MDAs and programmes/projects in the Accountability Sector, CSO representatives and the Development Partners. Any emerging reforms are forwarded to the PEMCOM for consideration and approval based on the objectives of the PFM Reform strategy. The MSU serves as Secretariat to PEMCOM and the Programme Technical Committee (PTC). It meets monthly and/or on demand. FINMAP provides the secretariat to PEMCOM.
Programme Technical Committee (PTC): Each FINMAP III Component has a Component Manager who is a senior mainstream GoU Head of Department. The Component Manager is responsible for identification and validation of reform actions, coordination and management of the programme activities at component level, and monitoring and reporting on performance of the component as guided by the FINMAP III M& E framework.
Component Management: Each Component holds monthly progress review meetings chaired by the Component managers. They address the pacing of the reform effort with line ministries and LGs (where applicable), ensuring that newly introduced changes are being taken up, securing necessary training, online information and support.
UGANDA PUBLIC EXPENDITURE AND FINANCIAL ACCOUNTABILITY(PEFA) ASSESSMENT 2016
87
Component Coordinators: Each Component nominates a Technical officer who serves as Component Coordinators to assist the Component Managers in monitoring and reporting on programme activities as well as providing day-to-day technical support and operations within the component. A Coordinators’ meeting comprising of FINMAP III Component Coordinators meets quarterly to review progress of programme implementation and related matters. This Committee is chaired by the Programme Coordinator/FINMAP III.
The PFM Development Partners Working Group (PFM DPWG): Forum where Development Partners periodically meet to review progress in the implementation of the programme. They prepare for PTC and PEMCOM meetings by way of in-put into the agenda and other topical issues. As members of the National Partnership forum under the aegis of the OPM, they contribute to agenda setting in the PFM arena.
Management Support Unit (MSU): The Management Support Unit coordinates the programme under the leadership of a Programme Coordinator who reports to the DST/Task Manager. The Programme Coordinator is supported by the Finance & Administration, Procurement Operations, Monitoring, Planning and Evaluation and Change Management and communication functions in the day-to-day management of the programme. The MSU serves as a liaison for all PFM reform efforts in the country on behalf of the DST/Task Manager.
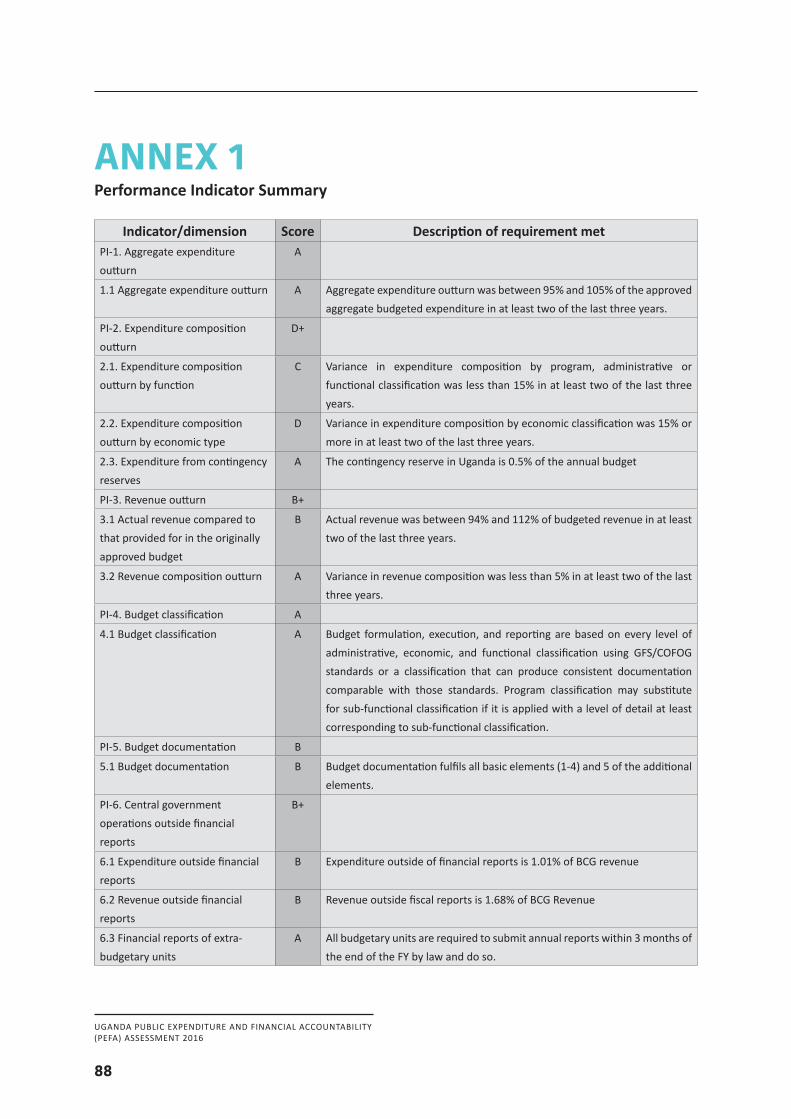
UGANDA PUBLIC EXPENDITURE AND FINANCIAL ACCOUNTABILITY(PEFA) ASSESSMENT 2016
88
ANNEX 1Performance Indicator Summary
Indicator/dimension Score Description of requirement metPI-1. Aggregate expenditure outturn
A
1.1 Aggregate expenditure outturn A Aggregate expenditure outturn was between 95% and 105% of the approved aggregate budgeted expenditure in at least two of the last three years.
PI-2. Expenditure composition outturn
D+
2.1. Expenditure composition outturn by function
C Variance in expenditure composition by program, administrative or functional classification was less than 15% in at least two of the last three years.
2.2. Expenditure composition outturn by economic type
D Variance in expenditure composition by economic classification was 15% or more in at least two of the last three years.
2.3. Expenditure from contingency reserves
A The contingency reserve in Uganda is 0.5% of the annual budget
PI-3. Revenue outturn B+
3.1 Actual revenue compared to that provided for in the originally approved budget
B Actual revenue was between 94% and 112% of budgeted revenue in at least two of the last three years.
3.2 Revenue composition outturn A Variance in revenue composition was less than 5% in at least two of the last three years.
PI-4. Budget classification A
4.1 Budget classification A Budget formulation, execution, and reporting are based on every level of administrative, economic, and functional classification using GFS/COFOG standards or a classification that can produce consistent documentation comparable with those standards. Program classification may substitute for sub-functional classification if it is applied with a level of detail at least corresponding to sub-functional classification.
PI-5. Budget documentation B
5.1 Budget documentation B Budget documentation fulfils all basic elements (1-4) and 5 of the additional elements.
PI-6. Central government operations outside financial reports
B+
6.1 Expenditure outside financial reports
B Expenditure outside of financial reports is 1.01% of BCG revenue
6.2 Revenue outside financial reports
B Revenue outside fiscal reports is 1.68% of BCG Revenue
6.3 Financial reports of extra-budgetary units
A All budgetary units are required to submit annual reports within 3 months of the end of the FY by law and do so.
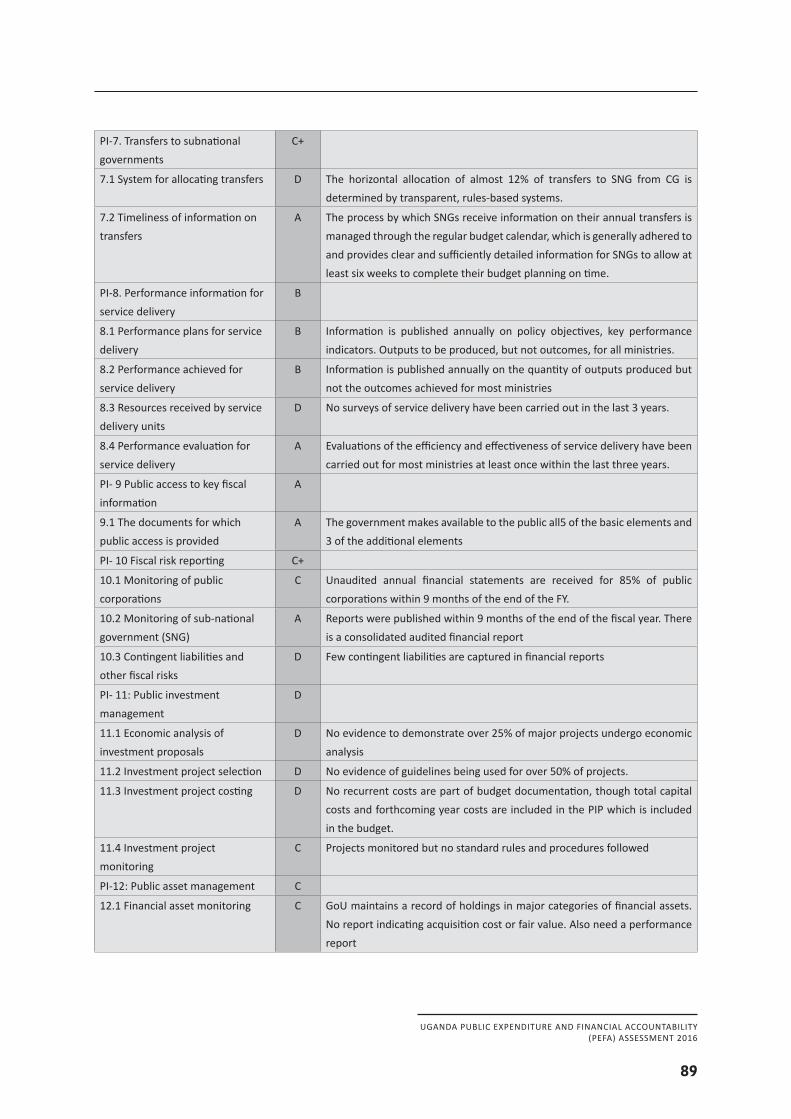
UGANDA PUBLIC EXPENDITURE AND FINANCIAL ACCOUNTABILITY(PEFA) ASSESSMENT 2016
89
PI-7. Transfers to subnational governments
C+
7.1 System for allocating transfers D The horizontal allocation of almost 12% of transfers to SNG from CG is determined by transparent, rules-based systems.
7.2 Timeliness of information on transfers
A The process by which SNGs receive information on their annual transfers is managed through the regular budget calendar, which is generally adhered to and provides clear and sufficiently detailed information for SNGs to allow at least six weeks to complete their budget planning on time.
PI-8. Performance information for service delivery
B
8.1 Performance plans for service delivery
B Information is published annually on policy objectives, key performance indicators. Outputs to be produced, but not outcomes, for all ministries.
8.2 Performance achieved for service delivery
B Information is published annually on the quantity of outputs produced but not the outcomes achieved for most ministries
8.3 Resources received by service delivery units
D No surveys of service delivery have been carried out in the last 3 years.
8.4 Performance evaluation for service delivery
A Evaluations of the efficiency and effectiveness of service delivery have been carried out for most ministries at least once within the last three years.
PI- 9 Public access to key fiscal information
A
9.1 The documents for which public access is provided
A The government makes available to the public all5 of the basic elements and 3 of the additional elements
PI- 10 Fiscal risk reporting C+
10.1 Monitoring of public corporations
C Unaudited annual financial statements are received for 85% of public corporations within 9 months of the end of the FY.
10.2 Monitoring of sub-national government (SNG)
A Reports were published within 9 months of the end of the fiscal year. There is a consolidated audited financial report
10.3 Contingent liabilities and other fiscal risks
D Few contingent liabilities are captured in financial reports
PI- 11: Public investment management
D
11.1 Economic analysis of investment proposals
D No evidence to demonstrate over 25% of major projects undergo economic analysis
11.2 Investment project selection D No evidence of guidelines being used for over 50% of projects.
11.3 Investment project costing D No recurrent costs are part of budget documentation, though total capital costs and forthcoming year costs are included in the PIP which is included in the budget.
11.4 Investment project monitoring
C Projects monitored but no standard rules and procedures followed
PI-12: Public asset management C
12.1 Financial asset monitoring C GoU maintains a record of holdings in major categories of financial assets. No report indicating acquisition cost or fair value. Also need a performance report
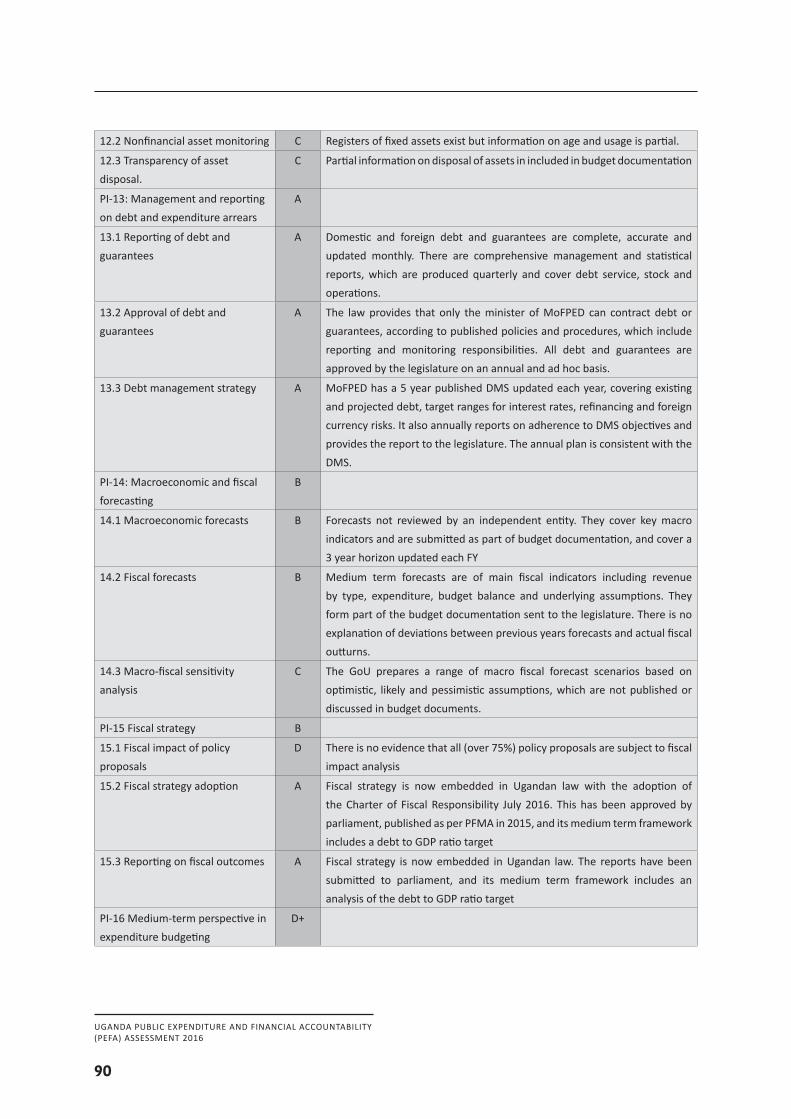
UGANDA PUBLIC EXPENDITURE AND FINANCIAL ACCOUNTABILITY(PEFA) ASSESSMENT 2016
90
12.2 Nonfinancial asset monitoring C Registers of fixed assets exist but information on age and usage is partial.
12.3 Transparency of asset disposal.
C Partial information on disposal of assets in included in budget documentation
PI-13: Management and reporting on debt and expenditure arrears
A
13.1 Reporting of debt and guarantees
A Domestic and foreign debt and guarantees are complete, accurate and updated monthly. There are comprehensive management and statistical reports, which are produced quarterly and cover debt service, stock and operations.
13.2 Approval of debt and guarantees
A The law provides that only the minister of MoFPED can contract debt or guarantees, according to published policies and procedures, which include reporting and monitoring responsibilities. All debt and guarantees are approved by the legislature on an annual and ad hoc basis.
13.3 Debt management strategy A MoFPED has a 5 year published DMS updated each year, covering existing and projected debt, target ranges for interest rates, refinancing and foreign currency risks. It also annually reports on adherence to DMS objectives and provides the report to the legislature. The annual plan is consistent with the DMS.
PI-14: Macroeconomic and fiscal forecasting
B
14.1 Macroeconomic forecasts B Forecasts not reviewed by an independent entity. They cover key macro indicators and are submitted as part of budget documentation, and cover a 3 year horizon updated each FY
14.2 Fiscal forecasts B Medium term forecasts are of main fiscal indicators including revenue by type, expenditure, budget balance and underlying assumptions. They form part of the budget documentation sent to the legislature. There is no explanation of deviations between previous years forecasts and actual fiscal outturns.
14.3 Macro-fiscal sensitivity analysis
C The GoU prepares a range of macro fiscal forecast scenarios based on optimistic, likely and pessimistic assumptions, which are not published or discussed in budget documents.
PI-15 Fiscal strategy B
15.1 Fiscal impact of policy proposals
D There is no evidence that all (over 75%) policy proposals are subject to fiscal impact analysis
15.2 Fiscal strategy adoption A Fiscal strategy is now embedded in Ugandan law with the adoption of the Charter of Fiscal Responsibility July 2016. This has been approved by parliament, published as per PFMA in 2015, and its medium term framework includes a debt to GDP ratio target
15.3 Reporting on fiscal outcomes A Fiscal strategy is now embedded in Ugandan law. The reports have been submitted to parliament, and its medium term framework includes an analysis of the debt to GDP ratio target
PI-16 Medium-term perspective in expenditure budgeting
D+
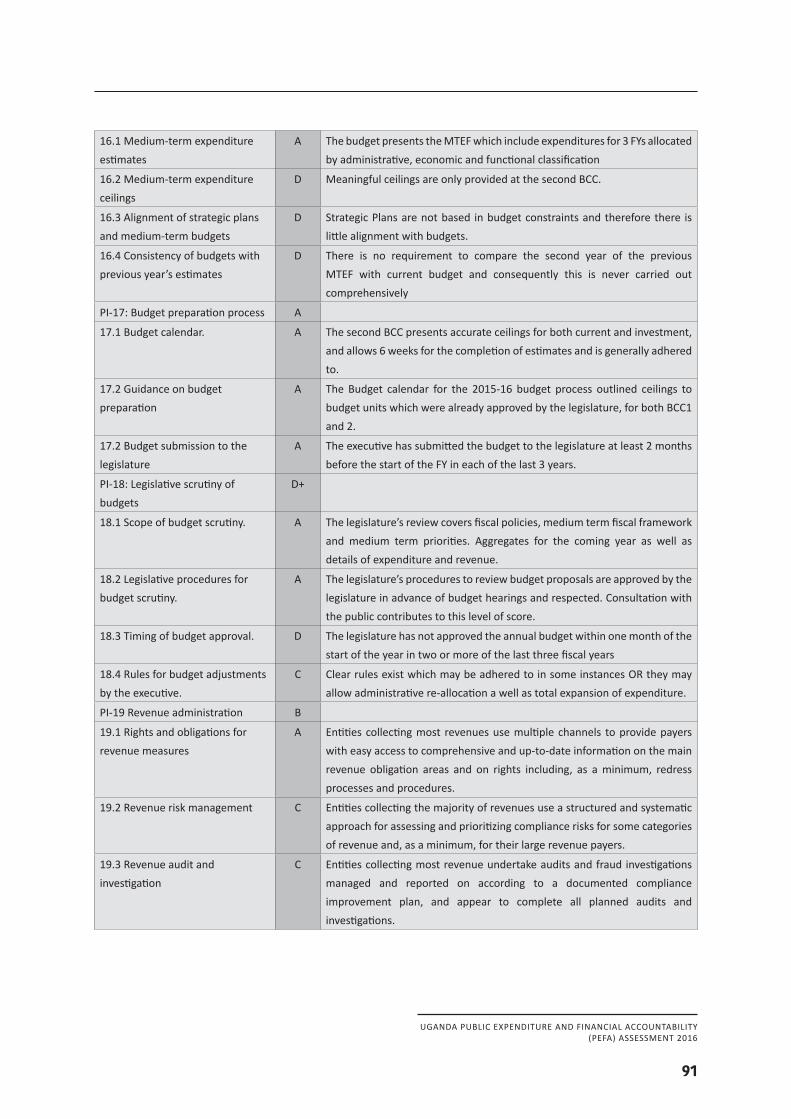
UGANDA PUBLIC EXPENDITURE AND FINANCIAL ACCOUNTABILITY(PEFA) ASSESSMENT 2016
91
16.1 Medium-term expenditure estimates
A The budget presents the MTEF which include expenditures for 3 FYs allocated by administrative, economic and functional classification
16.2 Medium-term expenditure ceilings
D Meaningful ceilings are only provided at the second BCC.
16.3 Alignment of strategic plans and medium-term budgets
D Strategic Plans are not based in budget constraints and therefore there is little alignment with budgets.
16.4 Consistency of budgets with previous year’s estimates
D There is no requirement to compare the second year of the previous MTEF with current budget and consequently this is never carried out comprehensively
PI-17: Budget preparation process A
17.1 Budget calendar. A The second BCC presents accurate ceilings for both current and investment, and allows 6 weeks for the completion of estimates and is generally adhered to.
17.2 Guidance on budget preparation
A The Budget calendar for the 2015-16 budget process outlined ceilings to budget units which were already approved by the legislature, for both BCC1 and 2.
17.2 Budget submission to the legislature
A The executive has submitted the budget to the legislature at least 2 months before the start of the FY in each of the last 3 years.
PI-18: Legislative scrutiny of budgets
D+
18.1 Scope of budget scrutiny. A The legislature’s review covers fiscal policies, medium term fiscal framework and medium term priorities. Aggregates for the coming year as well as details of expenditure and revenue.
18.2 Legislative procedures for budget scrutiny.
A The legislature’s procedures to review budget proposals are approved by the legislature in advance of budget hearings and respected. Consultation with the public contributes to this level of score.
18.3 Timing of budget approval. D The legislature has not approved the annual budget within one month of the start of the year in two or more of the last three fiscal years
18.4 Rules for budget adjustments by the executive.
C Clear rules exist which may be adhered to in some instances OR they may allow administrative re-allocation a well as total expansion of expenditure.
PI-19 Revenue administration B
19.1 Rights and obligations for revenue measures
A Entities collecting most revenues use multiple channels to provide payers with easy access to comprehensive and up-to-date information on the main revenue obligation areas and on rights including, as a minimum, redress processes and procedures.
19.2 Revenue risk management C Entities collecting the majority of revenues use a structured and systematic approach for assessing and prioritizing compliance risks for some categories of revenue and, as a minimum, for their large revenue payers.
19.3 Revenue audit and investigation
C Entities collecting most revenue undertake audits and fraud investigations managed and reported on according to a documented compliance improvement plan, and appear to complete all planned audits and investigations.
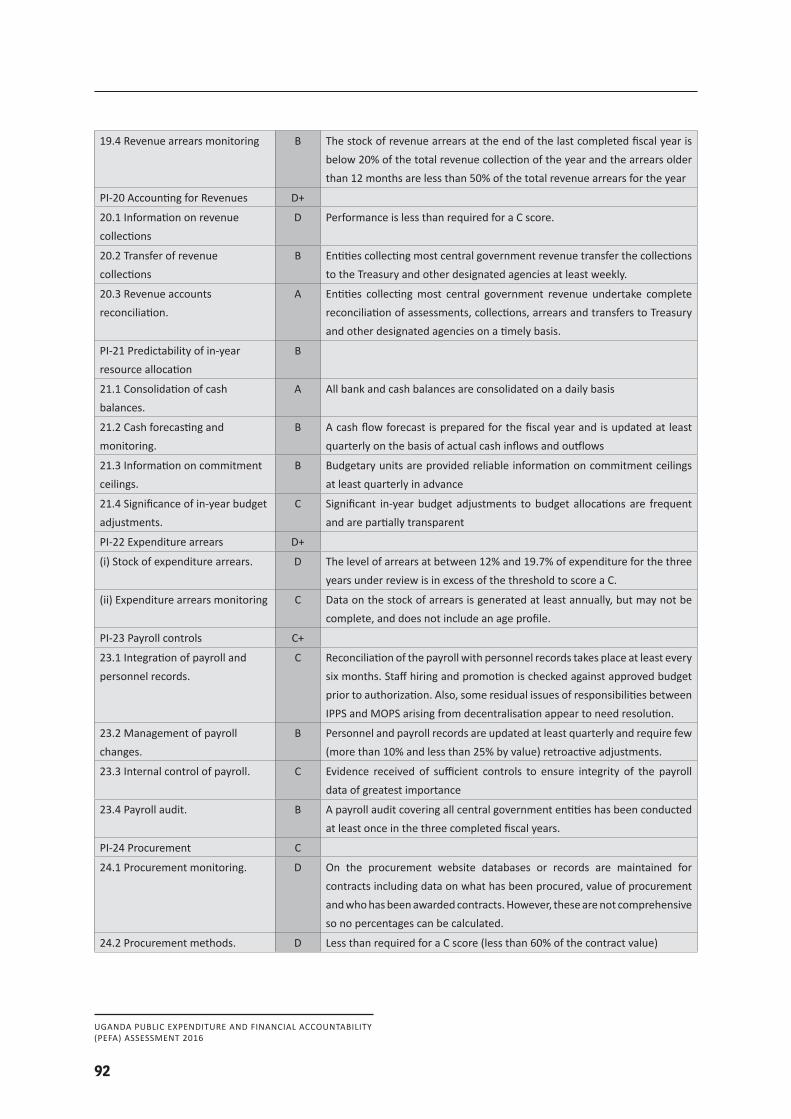
UGANDA PUBLIC EXPENDITURE AND FINANCIAL ACCOUNTABILITY(PEFA) ASSESSMENT 2016
92
19.4 Revenue arrears monitoring B The stock of revenue arrears at the end of the last completed fiscal year is below 20% of the total revenue collection of the year and the arrears older than 12 months are less than 50% of the total revenue arrears for the year
PI-20 Accounting for Revenues D+
20.1 Information on revenue collections
D Performance is less than required for a C score.
20.2 Transfer of revenue collections
B Entities collecting most central government revenue transfer the collections to the Treasury and other designated agencies at least weekly.
20.3 Revenue accounts reconciliation.
A Entities collecting most central government revenue undertake complete reconciliation of assessments, collections, arrears and transfers to Treasury and other designated agencies on a timely basis.
PI-21 Predictability of in-year resource allocation
B
21.1 Consolidation of cash balances.
A All bank and cash balances are consolidated on a daily basis
21.2 Cash forecasting and monitoring.
B A cash flow forecast is prepared for the fiscal year and is updated at least quarterly on the basis of actual cash inflows and outflows
21.3 Information on commitment ceilings.
B Budgetary units are provided reliable information on commitment ceilings at least quarterly in advance
21.4 Significance of in-year budget adjustments.
C Significant in-year budget adjustments to budget allocations are frequent and are partially transparent
PI-22 Expenditure arrears D+
(i) Stock of expenditure arrears. D The level of arrears at between 12% and 19.7% of expenditure for the three years under review is in excess of the threshold to score a C.
(ii) Expenditure arrears monitoring C Data on the stock of arrears is generated at least annually, but may not be complete, and does not include an age profile.
PI-23 Payroll controls C+
23.1 Integration of payroll and personnel records.
C Reconciliation of the payroll with personnel records takes place at least every six months. Staff hiring and promotion is checked against approved budget prior to authorization. Also, some residual issues of responsibilities between IPPS and MOPS arising from decentralisation appear to need resolution.
23.2 Management of payroll changes.
B Personnel and payroll records are updated at least quarterly and require few (more than 10% and less than 25% by value) retroactive adjustments.
23.3 Internal control of payroll. C Evidence received of sufficient controls to ensure integrity of the payroll data of greatest importance
23.4 Payroll audit. B A payroll audit covering all central government entities has been conducted at least once in the three completed fiscal years.
PI-24 Procurement C
24.1 Procurement monitoring. D On the procurement website databases or records are maintained for contracts including data on what has been procured, value of procurement and who has been awarded contracts. However, these are not comprehensive so no percentages can be calculated.
24.2 Procurement methods. D Less than required for a C score (less than 60% of the contract value)
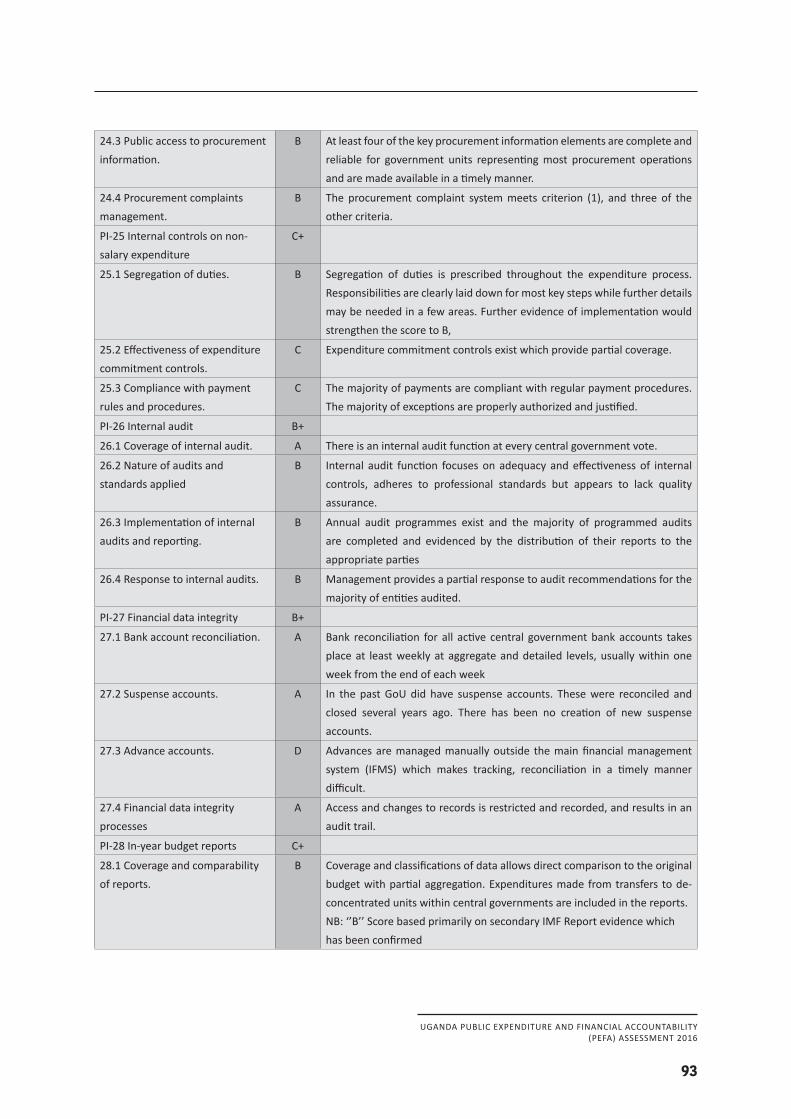
UGANDA PUBLIC EXPENDITURE AND FINANCIAL ACCOUNTABILITY(PEFA) ASSESSMENT 2016
93
24.3 Public access to procurement information.
B At least four of the key procurement information elements are complete and reliable for government units representing most procurement operations and are made available in a timely manner.
24.4 Procurement complaints management.
B The procurement complaint system meets criterion (1), and three of the other criteria.
PI-25 Internal controls on non-salary expenditure
C+
25.1 Segregation of duties. B Segregation of duties is prescribed throughout the expenditure process. Responsibilities are clearly laid down for most key steps while further details may be needed in a few areas. Further evidence of implementation would strengthen the score to B,
25.2 Effectiveness of expenditure commitment controls.
C Expenditure commitment controls exist which provide partial coverage.
25.3 Compliance with payment rules and procedures.
C The majority of payments are compliant with regular payment procedures. The majority of exceptions are properly authorized and justified.
PI-26 Internal audit B+
26.1 Coverage of internal audit. A There is an internal audit function at every central government vote.
26.2 Nature of audits and standards applied
B Internal audit function focuses on adequacy and effectiveness of internal controls, adheres to professional standards but appears to lack quality assurance.
26.3 Implementation of internal audits and reporting.
B Annual audit programmes exist and the majority of programmed audits are completed and evidenced by the distribution of their reports to the appropriate parties
26.4 Response to internal audits. B Management provides a partial response to audit recommendations for the majority of entities audited.
PI-27 Financial data integrity B+
27.1 Bank account reconciliation. A Bank reconciliation for all active central government bank accounts takes place at least weekly at aggregate and detailed levels, usually within one week from the end of each week
27.2 Suspense accounts. A In the past GoU did have suspense accounts. These were reconciled and closed several years ago. There has been no creation of new suspense accounts.
27.3 Advance accounts. D Advances are managed manually outside the main financial management system (IFMS) which makes tracking, reconciliation in a timely manner difficult.
27.4 Financial data integrity processes
A Access and changes to records is restricted and recorded, and results in an audit trail.
PI-28 In-year budget reports C+
28.1 Coverage and comparability of reports.
B Coverage and classifications of data allows direct comparison to the original budget with partial aggregation. Expenditures made from transfers to de-concentrated units within central governments are included in the reports.NB: ‘’B’’ Score based primarily on secondary IMF Report evidence which has been confirmed
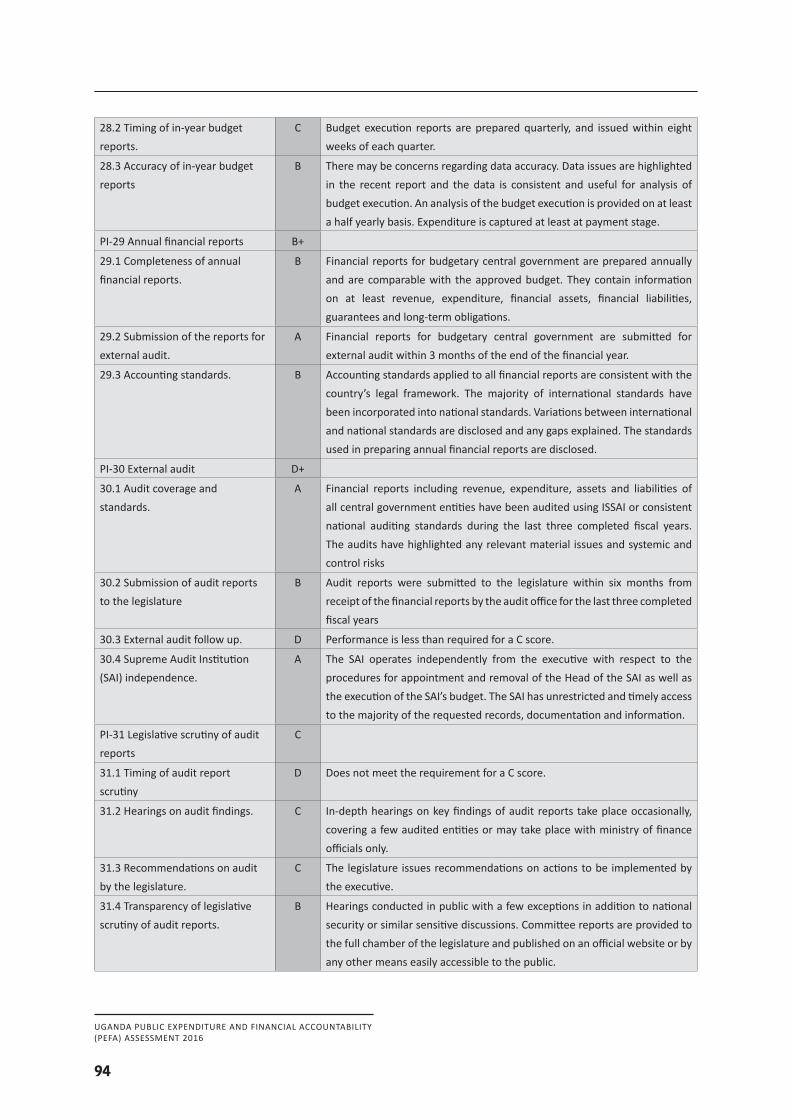
UGANDA PUBLIC EXPENDITURE AND FINANCIAL ACCOUNTABILITY(PEFA) ASSESSMENT 2016
94
28.2 Timing of in-year budget reports.
C Budget execution reports are prepared quarterly, and issued within eight weeks of each quarter.
28.3 Accuracy of in-year budget reports
B There may be concerns regarding data accuracy. Data issues are highlighted in the recent report and the data is consistent and useful for analysis of budget execution. An analysis of the budget execution is provided on at least a half yearly basis. Expenditure is captured at least at payment stage.
PI-29 Annual financial reports B+
29.1 Completeness of annual financial reports.
B Financial reports for budgetary central government are prepared annually and are comparable with the approved budget. They contain information on at least revenue, expenditure, financial assets, financial liabilities, guarantees and long-term obligations.
29.2 Submission of the reports for external audit.
A Financial reports for budgetary central government are submitted for external audit within 3 months of the end of the financial year.
29.3 Accounting standards. B Accounting standards applied to all financial reports are consistent with the country’s legal framework. The majority of international standards have been incorporated into national standards. Variations between international and national standards are disclosed and any gaps explained. The standards used in preparing annual financial reports are disclosed.
PI-30 External audit D+
30.1 Audit coverage and standards.
A Financial reports including revenue, expenditure, assets and liabilities of all central government entities have been audited using ISSAI or consistent national auditing standards during the last three completed fiscal years. The audits have highlighted any relevant material issues and systemic and control risks
30.2 Submission of audit reports to the legislature
B Audit reports were submitted to the legislature within six months from receipt of the financial reports by the audit office for the last three completed fiscal years
30.3 External audit follow up. D Performance is less than required for a C score.
30.4 Supreme Audit Institution (SAI) independence.
A The SAI operates independently from the executive with respect to the procedures for appointment and removal of the Head of the SAI as well as the execution of the SAI’s budget. The SAI has unrestricted and timely access to the majority of the requested records, documentation and information.
PI-31 Legislative scrutiny of audit reports
C
31.1 Timing of audit report scrutiny
D Does not meet the requirement for a C score.
31.2 Hearings on audit findings. C In-depth hearings on key findings of audit reports take place occasionally, covering a few audited entities or may take place with ministry of finance officials only.
31.3 Recommendations on audit by the legislature.
C The legislature issues recommendations on actions to be implemented by the executive.
31.4 Transparency of legislative scrutiny of audit reports.
B Hearings conducted in public with a few exceptions in addition to national security or similar sensitive discussions. Committee reports are provided to the full chamber of the legislature and published on an official website or by any other means easily accessible to the public.
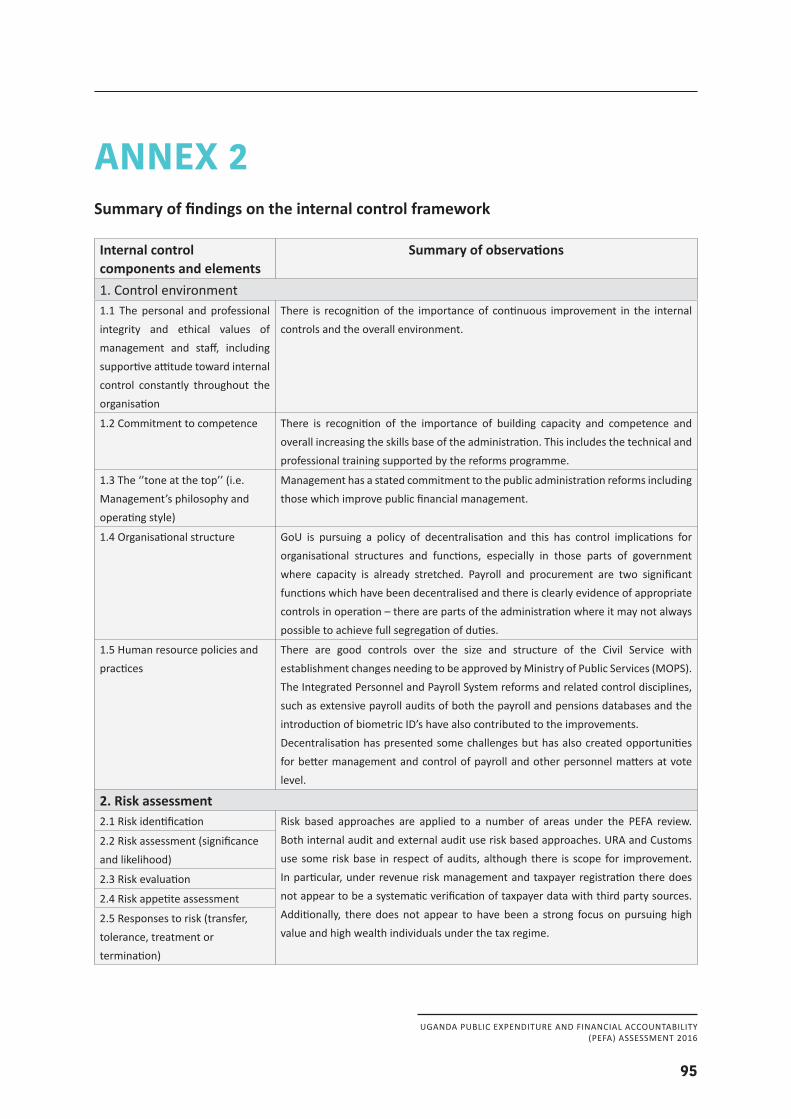
UGANDA PUBLIC EXPENDITURE AND FINANCIAL ACCOUNTABILITY(PEFA) ASSESSMENT 2016
95
ANNEX 2Summary of findings on the internal control framework
Internal control components and elements
Summary of observations
1. Control environment1.1 The personal and professional integrity and ethical values of management and staff, including supportive attitude toward internal control constantly throughout the organisation
There is recognition of the importance of continuous improvement in the internal controls and the overall environment.
1.2 Commitment to competence There is recognition of the importance of building capacity and competence and overall increasing the skills base of the administration. This includes the technical and professional training supported by the reforms programme.
1.3 The ‘’tone at the top’’ (i.e. Management’s philosophy and operating style)
Management has a stated commitment to the public administration reforms including those which improve public financial management.
1.4 Organisational structure GoU is pursuing a policy of decentralisation and this has control implications for organisational structures and functions, especially in those parts of government where capacity is already stretched. Payroll and procurement are two significant functions which have been decentralised and there is clearly evidence of appropriate controls in operation – there are parts of the administration where it may not always possible to achieve full segregation of duties.
1.5 Human resource policies and practices
There are good controls over the size and structure of the Civil Service with establishment changes needing to be approved by Ministry of Public Services (MOPS). The Integrated Personnel and Payroll System reforms and related control disciplines, such as extensive payroll audits of both the payroll and pensions databases and the introduction of biometric ID’s have also contributed to the improvements.Decentralisation has presented some challenges but has also created opportunities for better management and control of payroll and other personnel matters at vote level.
2. Risk assessment 2.1 Risk identification Risk based approaches are applied to a number of areas under the PEFA review.
Both internal audit and external audit use risk based approaches. URA and Customs use some risk base in respect of audits, although there is scope for improvement. In particular, under revenue risk management and taxpayer registration there does not appear to be a systematic verification of taxpayer data with third party sources. Additionally, there does not appear to have been a strong focus on pursuing high value and high wealth individuals under the tax regime.
2.2 Risk assessment (significance and likelihood)
2.3 Risk evaluation
2.4 Risk appetite assessment
2.5 Responses to risk (transfer, tolerance, treatment or termination)
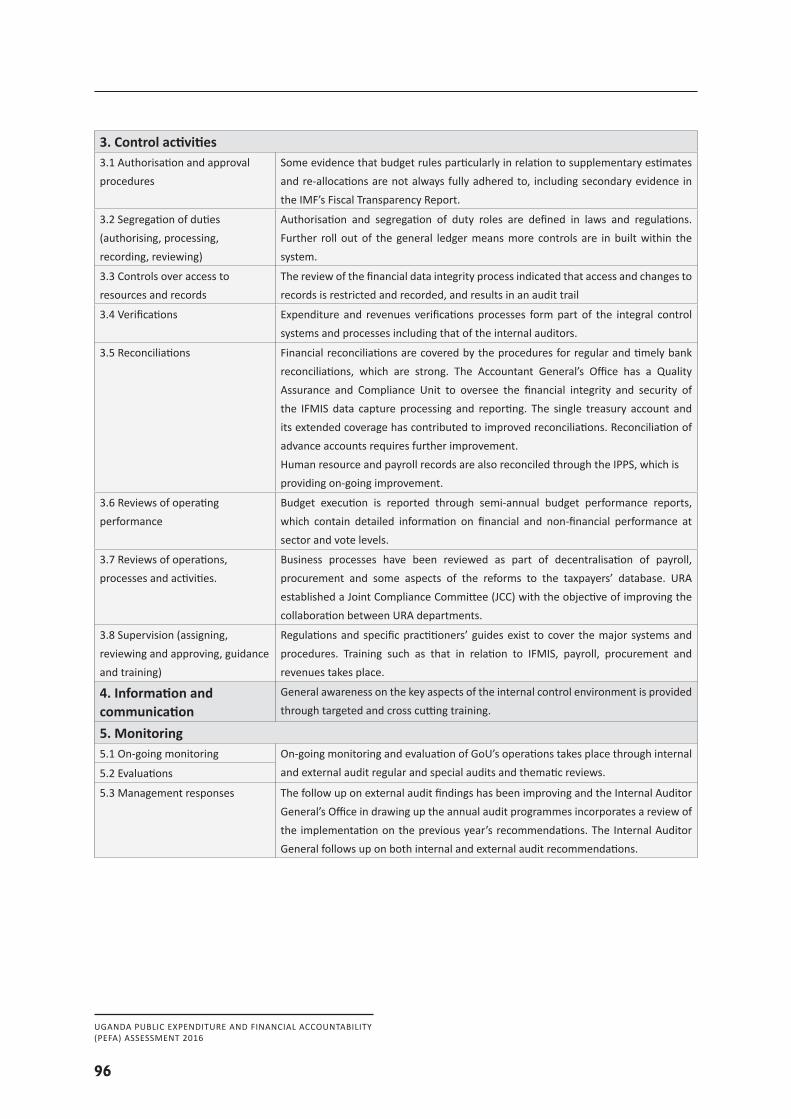
UGANDA PUBLIC EXPENDITURE AND FINANCIAL ACCOUNTABILITY(PEFA) ASSESSMENT 2016
96
3. Control activities 3.1 Authorisation and approval procedures
Some evidence that budget rules particularly in relation to supplementary estimates and re-allocations are not always fully adhered to, including secondary evidence in the IMF’s Fiscal Transparency Report.
3.2 Segregation of duties (authorising, processing, recording, reviewing)
Authorisation and segregation of duty roles are defined in laws and regulations. Further roll out of the general ledger means more controls are in built within the system.
3.3 Controls over access to resources and records
The review of the financial data integrity process indicated that access and changes to records is restricted and recorded, and results in an audit trail
3.4 Verifications Expenditure and revenues verifications processes form part of the integral control systems and processes including that of the internal auditors.
3.5 Reconciliations Financial reconciliations are covered by the procedures for regular and timely bank reconciliations, which are strong. The Accountant General’s Office has a Quality Assurance and Compliance Unit to oversee the financial integrity and security of the IFMIS data capture processing and reporting. The single treasury account and its extended coverage has contributed to improved reconciliations. Reconciliation of advance accounts requires further improvement.Human resource and payroll records are also reconciled through the IPPS, which is providing on-going improvement.
3.6 Reviews of operating performance
Budget execution is reported through semi-annual budget performance reports, which contain detailed information on financial and non-financial performance at sector and vote levels.
3.7 Reviews of operations, processes and activities.
Business processes have been reviewed as part of decentralisation of payroll, procurement and some aspects of the reforms to the taxpayers’ database. URA established a Joint Compliance Committee (JCC) with the objective of improving the collaboration between URA departments.
3.8 Supervision (assigning, reviewing and approving, guidance and training)
Regulations and specific practitioners’ guides exist to cover the major systems and procedures. Training such as that in relation to IFMIS, payroll, procurement and revenues takes place.
4. Information and communication
General awareness on the key aspects of the internal control environment is provided through targeted and cross cutting training.
5. Monitoring 5.1 On-going monitoring On-going monitoring and evaluation of GoU’s operations takes place through internal
and external audit regular and special audits and thematic reviews.5.2 Evaluations
5.3 Management responses The follow up on external audit findings has been improving and the Internal Auditor General’s Office in drawing up the annual audit programmes incorporates a review of the implementation on the previous year’s recommendations. The Internal Auditor General follows up on both internal and external audit recommendations.
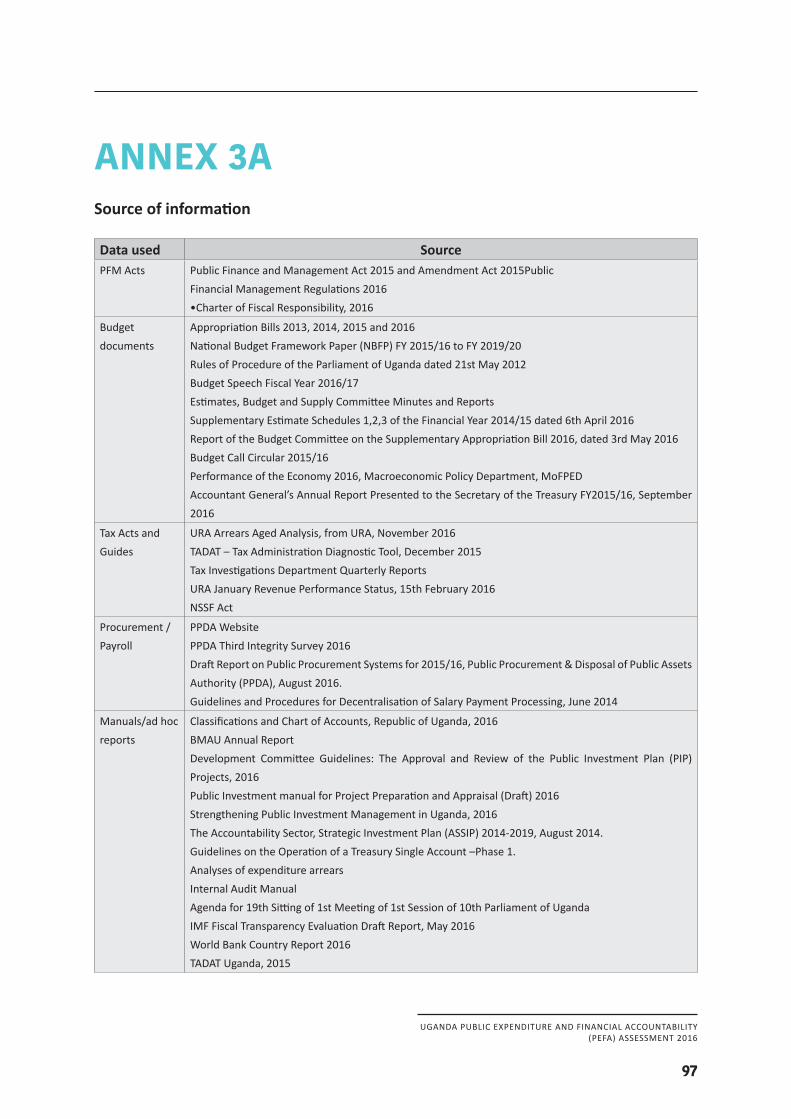
UGANDA PUBLIC EXPENDITURE AND FINANCIAL ACCOUNTABILITY(PEFA) ASSESSMENT 2016
97
ANNEX 3ASource of information
Data used SourcePFM Acts Public Finance and Management Act 2015 and Amendment Act 2015Public
Financial Management Regulations 2016•Charter of Fiscal Responsibility, 2016
Budget documents
Appropriation Bills 2013, 2014, 2015 and 2016National Budget Framework Paper (NBFP) FY 2015/16 to FY 2019/20Rules of Procedure of the Parliament of Uganda dated 21st May 2012Budget Speech Fiscal Year 2016/17Estimates, Budget and Supply Committee Minutes and ReportsSupplementary Estimate Schedules 1,2,3 of the Financial Year 2014/15 dated 6th April 2016Report of the Budget Committee on the Supplementary Appropriation Bill 2016, dated 3rd May 2016Budget Call Circular 2015/16Performance of the Economy 2016, Macroeconomic Policy Department, MoFPEDAccountant General’s Annual Report Presented to the Secretary of the Treasury FY2015/16, September 2016
Tax Acts and Guides
URA Arrears Aged Analysis, from URA, November 2016TADAT – Tax Administration Diagnostic Tool, December 2015Tax Investigations Department Quarterly ReportsURA January Revenue Performance Status, 15th February 2016NSSF Act
Procurement / Payroll
PPDA WebsitePPDA Third Integrity Survey 2016Draft Report on Public Procurement Systems for 2015/16, Public Procurement & Disposal of Public Assets Authority (PPDA), August 2016.Guidelines and Procedures for Decentralisation of Salary Payment Processing, June 2014
Manuals/ad hoc reports
Classifications and Chart of Accounts, Republic of Uganda, 2016BMAU Annual ReportDevelopment Committee Guidelines: The Approval and Review of the Public Investment Plan (PIP) Projects, 2016Public Investment manual for Project Preparation and Appraisal (Draft) 2016Strengthening Public Investment Management in Uganda, 2016The Accountability Sector, Strategic Investment Plan (ASSIP) 2014-2019, August 2014.Guidelines on the Operation of a Treasury Single Account –Phase 1.Analyses of expenditure arrearsInternal Audit ManualAgenda for 19th Sitting of 1st Meeting of 1st Session of 10th Parliament of UgandaIMF Fiscal Transparency Evaluation Draft Report, May 2016World Bank Country Report 2016TADAT Uganda, 2015
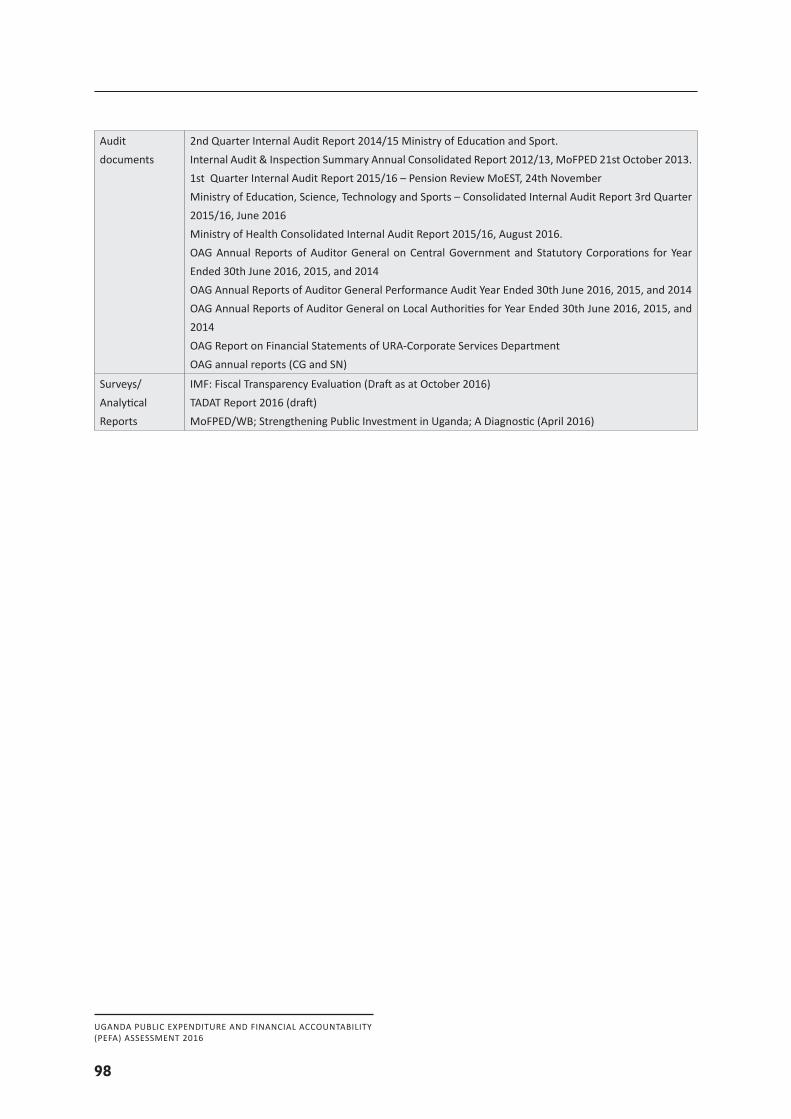
UGANDA PUBLIC EXPENDITURE AND FINANCIAL ACCOUNTABILITY(PEFA) ASSESSMENT 2016
98
Audit documents
2nd Quarter Internal Audit Report 2014/15 Ministry of Education and Sport.Internal Audit & Inspection Summary Annual Consolidated Report 2012/13, MoFPED 21st October 2013.1st Quarter Internal Audit Report 2015/16 – Pension Review MoEST, 24th NovemberMinistry of Education, Science, Technology and Sports – Consolidated Internal Audit Report 3rd Quarter 2015/16, June 2016Ministry of Health Consolidated Internal Audit Report 2015/16, August 2016.OAG Annual Reports of Auditor General on Central Government and Statutory Corporations for Year Ended 30th June 2016, 2015, and 2014OAG Annual Reports of Auditor General Performance Audit Year Ended 30th June 2016, 2015, and 2014OAG Annual Reports of Auditor General on Local Authorities for Year Ended 30th June 2016, 2015, and 2014OAG Report on Financial Statements of URA-Corporate Services DepartmentOAG annual reports (CG and SN)
Surveys/Analytical Reports
IMF: Fiscal Transparency Evaluation (Draft as at October 2016)TADAT Report 2016 (draft)MoFPED/WB; Strengthening Public Investment in Uganda; A Diagnostic (April 2016)
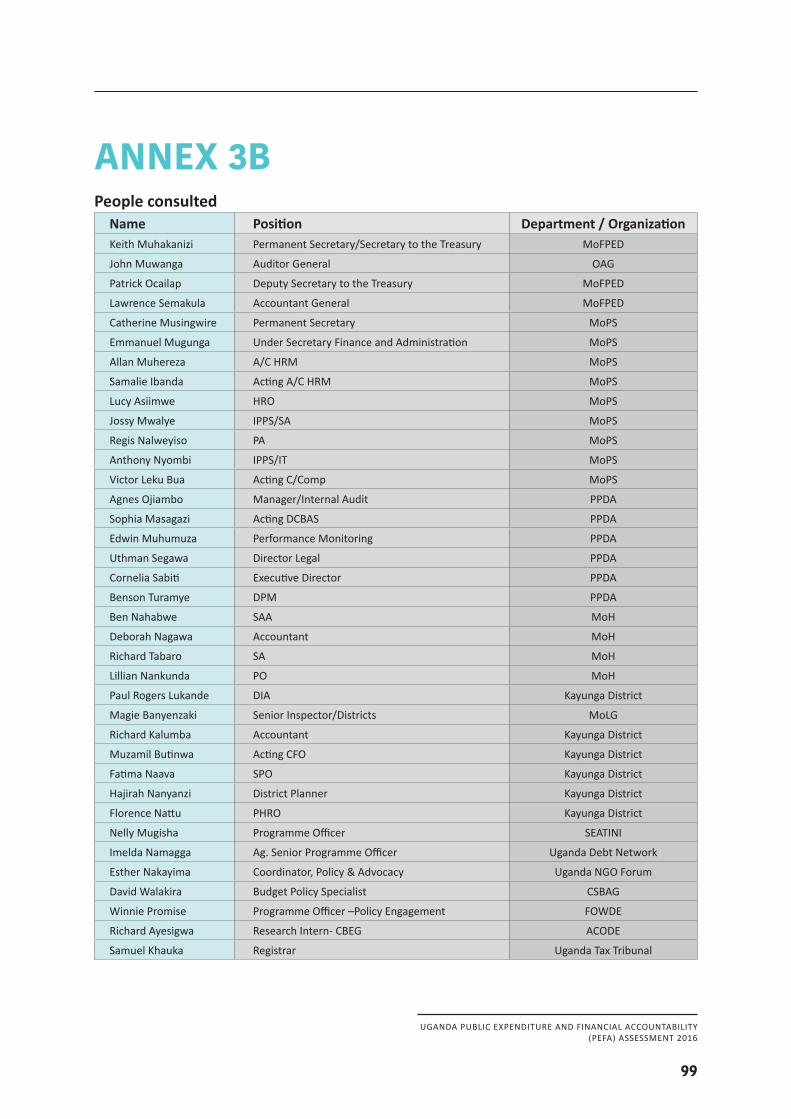
UGANDA PUBLIC EXPENDITURE AND FINANCIAL ACCOUNTABILITY(PEFA) ASSESSMENT 2016
99
ANNEX 3BPeople consulted
Name Position Department / OrganizationKeith Muhakanizi Permanent Secretary/Secretary to the Treasury MoFPED
John Muwanga Auditor General OAG
Patrick Ocailap Deputy Secretary to the Treasury MoFPED
Lawrence Semakula Accountant General MoFPED
Catherine Musingwire Permanent Secretary MoPS
Emmanuel Mugunga Under Secretary Finance and Administration MoPS
Allan Muhereza A/C HRM MoPS
Samalie Ibanda Acting A/C HRM MoPS
Lucy Asiimwe HRO MoPS
Jossy Mwalye IPPS/SA MoPS
Regis Nalweyiso PA MoPS
Anthony Nyombi IPPS/IT MoPS
Victor Leku Bua Acting C/Comp MoPS
Agnes Ojiambo Manager/Internal Audit PPDA
Sophia Masagazi Acting DCBAS PPDA
Edwin Muhumuza Performance Monitoring PPDA
Uthman Segawa Director Legal PPDA
Cornelia Sabiti Executive Director PPDA
Benson Turamye DPM PPDA
Ben Nahabwe SAA MoH
Deborah Nagawa Accountant MoH
Richard Tabaro SA MoH
Lillian Nankunda PO MoH
Paul Rogers Lukande DIA Kayunga District
Magie Banyenzaki Senior Inspector/Districts MoLG
Richard Kalumba Accountant Kayunga District
Muzamil Butinwa Acting CFO Kayunga District
Fatima Naava SPO Kayunga District
Hajirah Nanyanzi District Planner Kayunga District
Florence Nattu PHRO Kayunga District
Nelly Mugisha Programme Officer SEATINI
Imelda Namagga Ag. Senior Programme Officer Uganda Debt Network
Esther Nakayima Coordinator, Policy & Advocacy Uganda NGO Forum
David Walakira Budget Policy Specialist CSBAG
Winnie Promise Programme Officer –Policy Engagement FOWDE
Richard Ayesigwa Research Intern- CBEG ACODE
Samuel Khauka Registrar Uganda Tax Tribunal
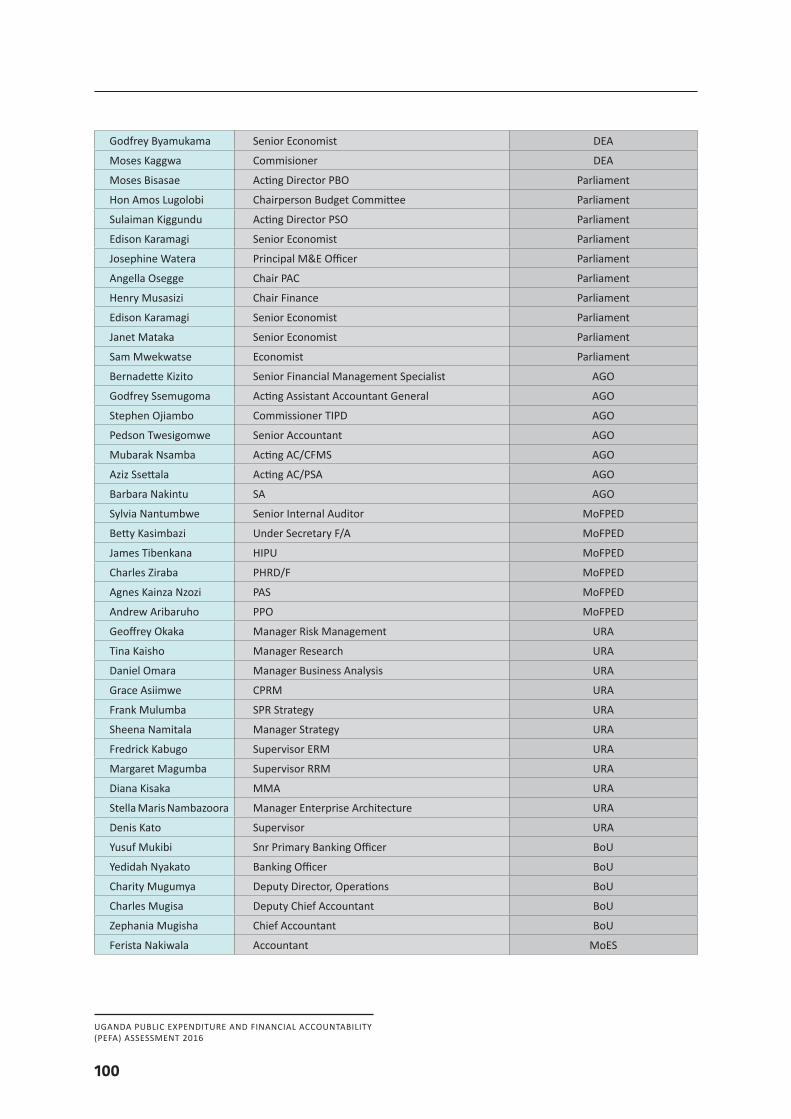
UGANDA PUBLIC EXPENDITURE AND FINANCIAL ACCOUNTABILITY(PEFA) ASSESSMENT 2016
100
Godfrey Byamukama Senior Economist DEA
Moses Kaggwa Commisioner DEA
Moses Bisasae Acting Director PBO Parliament
Hon Amos Lugolobi Chairperson Budget Committee Parliament
Sulaiman Kiggundu Acting Director PSO Parliament
Edison Karamagi Senior Economist Parliament
Josephine Watera Principal M&E Officer Parliament
Angella Osegge Chair PAC Parliament
Henry Musasizi Chair Finance Parliament
Edison Karamagi Senior Economist Parliament
Janet Mataka Senior Economist Parliament
Sam Mwekwatse Economist Parliament
Bernadette Kizito Senior Financial Management Specialist AGO
Godfrey Ssemugoma Acting Assistant Accountant General AGO
Stephen Ojiambo Commissioner TIPD AGO
Pedson Twesigomwe Senior Accountant AGO
Mubarak Nsamba Acting AC/CFMS AGO
Aziz Ssettala Acting AC/PSA AGO
Barbara Nakintu SA AGO
Sylvia Nantumbwe Senior Internal Auditor MoFPED
Betty Kasimbazi Under Secretary F/A MoFPED
James Tibenkana HIPU MoFPED
Charles Ziraba PHRD/F MoFPED
Agnes Kainza Nzozi PAS MoFPED
Andrew Aribaruho PPO MoFPED
Geoffrey Okaka Manager Risk Management URA
Tina Kaisho Manager Research URA
Daniel Omara Manager Business Analysis URA
Grace Asiimwe CPRM URA
Frank Mulumba SPR Strategy URA
Sheena Namitala Manager Strategy URA
Fredrick Kabugo Supervisor ERM URA
Margaret Magumba Supervisor RRM URA
Diana Kisaka MMA URA
Stella Maris Nambazoora Manager Enterprise Architecture URA
Denis Kato Supervisor URA
Yusuf Mukibi Snr Primary Banking Officer BoU
Yedidah Nyakato Banking Officer BoU
Charity Mugumya Deputy Director, Operations BoU
Charles Mugisa Deputy Chief Accountant BoU
Zephania Mugisha Chief Accountant BoU
Ferista Nakiwala Accountant MoES
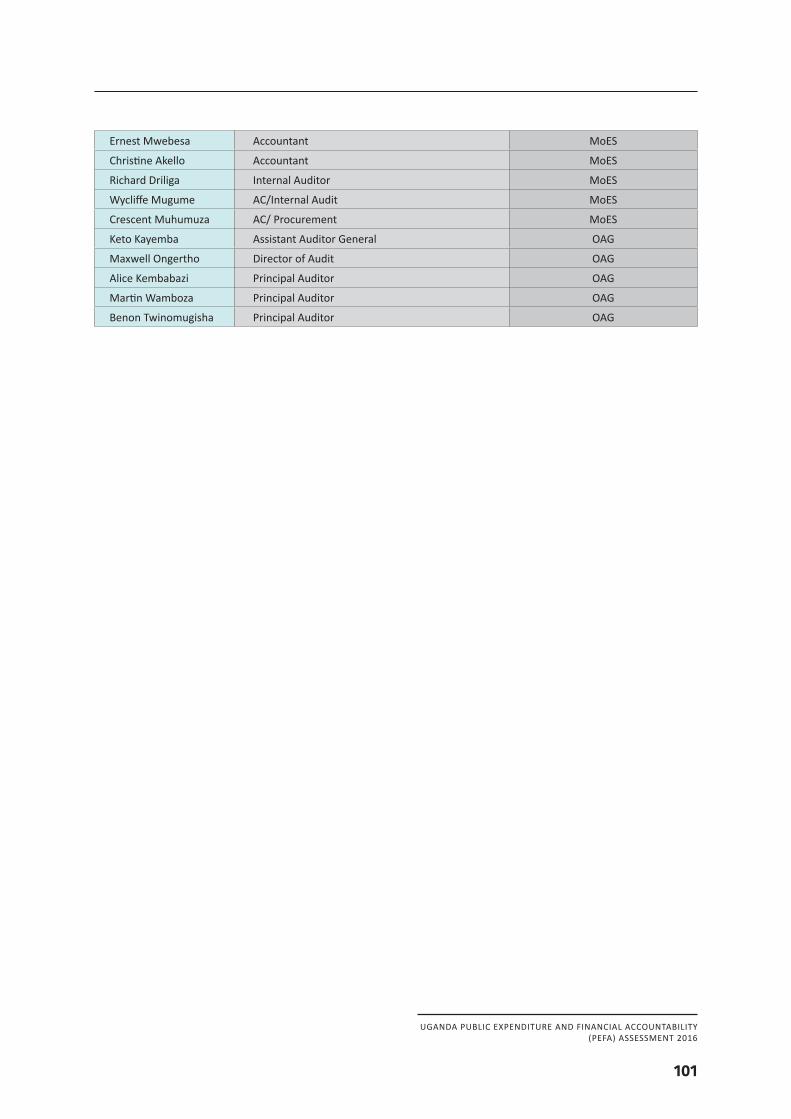
UGANDA PUBLIC EXPENDITURE AND FINANCIAL ACCOUNTABILITY(PEFA) ASSESSMENT 2016
101
Ernest Mwebesa Accountant MoES
Christine Akello Accountant MoES
Richard Driliga Internal Auditor MoES
Wycliffe Mugume AC/Internal Audit MoES
Crescent Muhumuza AC/ Procurement MoES
Keto Kayemba Assistant Auditor General OAG
Maxwell Ongertho Director of Audit OAG
Alice Kembabazi Principal Auditor OAG
Martin Wamboza Principal Auditor OAG
Benon Twinomugisha Principal Auditor OAG
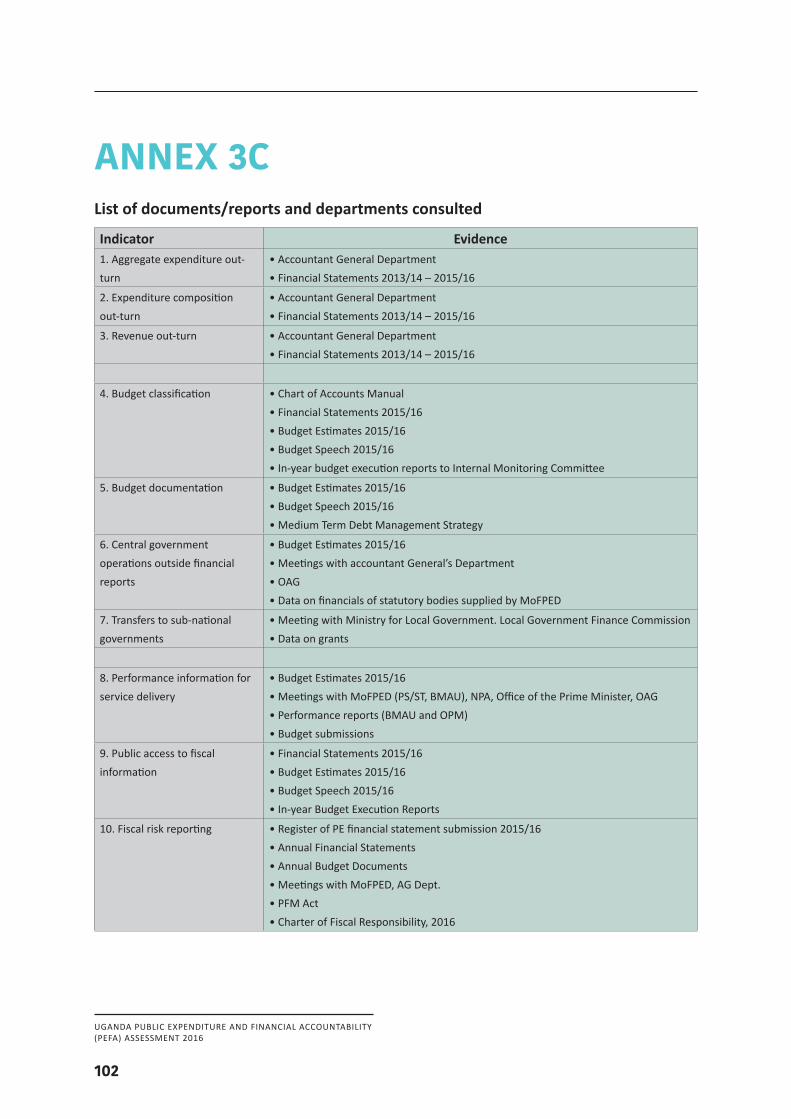
UGANDA PUBLIC EXPENDITURE AND FINANCIAL ACCOUNTABILITY(PEFA) ASSESSMENT 2016
102
ANNEX 3CList of documents/reports and departments consulted
Indicator Evidence1. Aggregate expenditure out-turn
• Accountant General Department• Financial Statements 2013/14 – 2015/16
2. Expenditure composition out-turn
• Accountant General Department• Financial Statements 2013/14 – 2015/16
3. Revenue out-turn • Accountant General Department• Financial Statements 2013/14 – 2015/16
4. Budget classification • Chart of Accounts Manual• Financial Statements 2015/16• Budget Estimates 2015/16• Budget Speech 2015/16• In-year budget execution reports to Internal Monitoring Committee
5. Budget documentation • Budget Estimates 2015/16• Budget Speech 2015/16• Medium Term Debt Management Strategy
6. Central government operations outside financial reports
• Budget Estimates 2015/16• Meetings with accountant General’s Department• OAG• Data on financials of statutory bodies supplied by MoFPED
7. Transfers to sub-national governments
• Meeting with Ministry for Local Government. Local Government Finance Commission• Data on grants
8. Performance information for service delivery
• Budget Estimates 2015/16• Meetings with MoFPED (PS/ST, BMAU), NPA, Office of the Prime Minister, OAG• Performance reports (BMAU and OPM)• Budget submissions
9. Public access to fiscal information
• Financial Statements 2015/16• Budget Estimates 2015/16• Budget Speech 2015/16• In-year Budget Execution Reports
10. Fiscal risk reporting • Register of PE financial statement submission 2015/16• Annual Financial Statements• Annual Budget Documents• Meetings with MoFPED, AG Dept.• PFM Act• Charter of Fiscal Responsibility, 2016
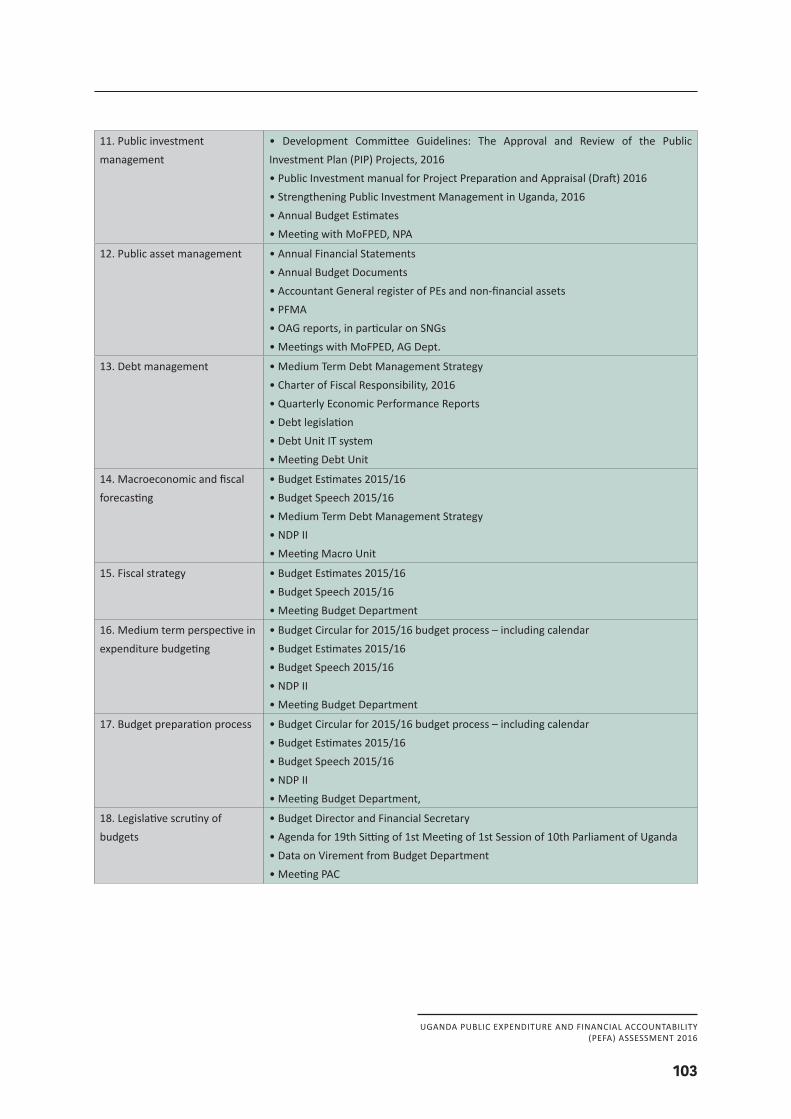
UGANDA PUBLIC EXPENDITURE AND FINANCIAL ACCOUNTABILITY(PEFA) ASSESSMENT 2016
103
11. Public investment management
• Development Committee Guidelines: The Approval and Review of the Public Investment Plan (PIP) Projects, 2016• Public Investment manual for Project Preparation and Appraisal (Draft) 2016• Strengthening Public Investment Management in Uganda, 2016• Annual Budget Estimates• Meeting with MoFPED, NPA
12. Public asset management • Annual Financial Statements• Annual Budget Documents• Accountant General register of PEs and non-financial assets• PFMA• OAG reports, in particular on SNGs• Meetings with MoFPED, AG Dept.
13. Debt management • Medium Term Debt Management Strategy• Charter of Fiscal Responsibility, 2016• Quarterly Economic Performance Reports• Debt legislation• Debt Unit IT system• Meeting Debt Unit
14. Macroeconomic and fiscal forecasting
• Budget Estimates 2015/16• Budget Speech 2015/16• Medium Term Debt Management Strategy• NDP II• Meeting Macro Unit
15. Fiscal strategy • Budget Estimates 2015/16• Budget Speech 2015/16• Meeting Budget Department
16. Medium term perspective in expenditure budgeting
• Budget Circular for 2015/16 budget process – including calendar• Budget Estimates 2015/16• Budget Speech 2015/16• NDP II• Meeting Budget Department
17. Budget preparation process • Budget Circular for 2015/16 budget process – including calendar• Budget Estimates 2015/16• Budget Speech 2015/16• NDP II• Meeting Budget Department,
18. Legislative scrutiny of budgets
• Budget Director and Financial Secretary• Agenda for 19th Sitting of 1st Meeting of 1st Session of 10th Parliament of Uganda• Data on Virement from Budget Department• Meeting PAC
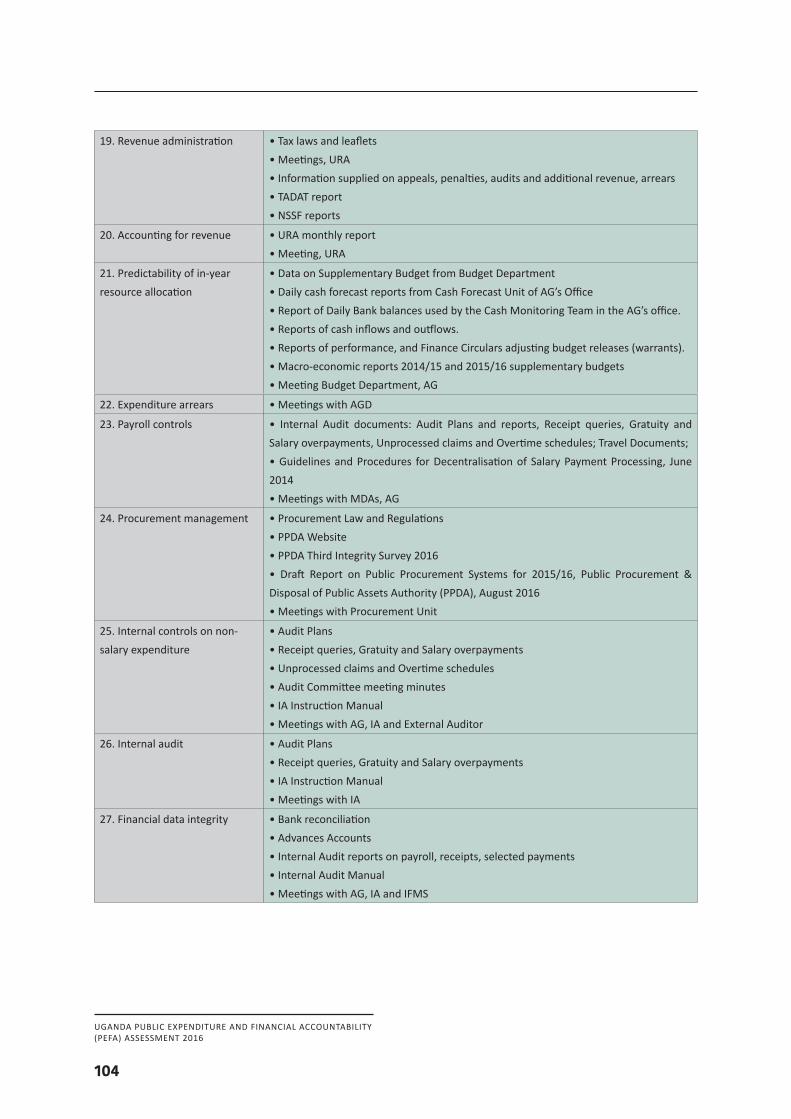
UGANDA PUBLIC EXPENDITURE AND FINANCIAL ACCOUNTABILITY(PEFA) ASSESSMENT 2016
104
19. Revenue administration • Tax laws and leaflets• Meetings, URA• Information supplied on appeals, penalties, audits and additional revenue, arrears• TADAT report• NSSF reports
20. Accounting for revenue • URA monthly report• Meeting, URA
21. Predictability of in-year resource allocation
• Data on Supplementary Budget from Budget Department• Daily cash forecast reports from Cash Forecast Unit of AG’s Office• Report of Daily Bank balances used by the Cash Monitoring Team in the AG’s office.• Reports of cash inflows and outflows.• Reports of performance, and Finance Circulars adjusting budget releases (warrants).• Macro-economic reports 2014/15 and 2015/16 supplementary budgets• Meeting Budget Department, AG
22. Expenditure arrears • Meetings with AGD
23. Payroll controls • Internal Audit documents: Audit Plans and reports, Receipt queries, Gratuity and Salary overpayments, Unprocessed claims and Overtime schedules; Travel Documents;• Guidelines and Procedures for Decentralisation of Salary Payment Processing, June 2014• Meetings with MDAs, AG
24. Procurement management • Procurement Law and Regulations• PPDA Website• PPDA Third Integrity Survey 2016• Draft Report on Public Procurement Systems for 2015/16, Public Procurement & Disposal of Public Assets Authority (PPDA), August 2016• Meetings with Procurement Unit
25. Internal controls on non-salary expenditure
• Audit Plans• Receipt queries, Gratuity and Salary overpayments• Unprocessed claims and Overtime schedules• Audit Committee meeting minutes• IA Instruction Manual• Meetings with AG, IA and External Auditor
26. Internal audit • Audit Plans• Receipt queries, Gratuity and Salary overpayments• IA Instruction Manual• Meetings with IA
27. Financial data integrity • Bank reconciliation • Advances Accounts• Internal Audit reports on payroll, receipts, selected payments• Internal Audit Manual• Meetings with AG, IA and IFMS
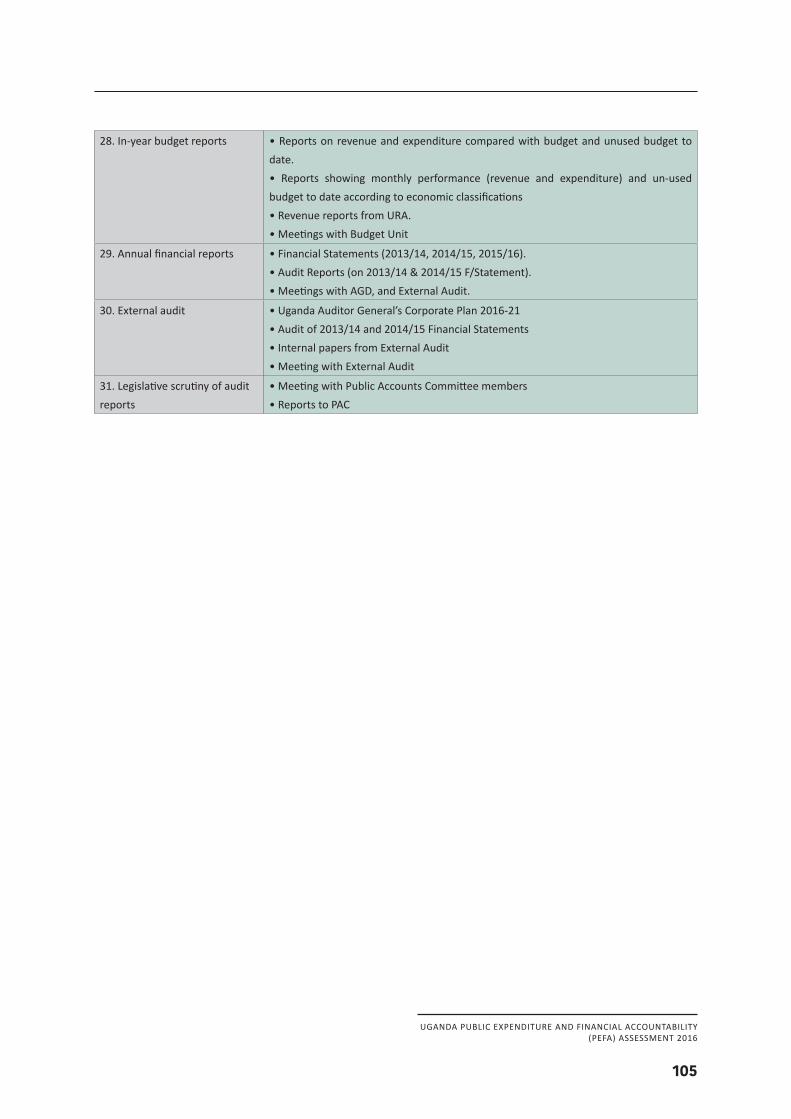
UGANDA PUBLIC EXPENDITURE AND FINANCIAL ACCOUNTABILITY(PEFA) ASSESSMENT 2016
105
28. In-year budget reports • Reports on revenue and expenditure compared with budget and unused budget to date.• Reports showing monthly performance (revenue and expenditure) and un-used budget to date according to economic classifications• Revenue reports from URA.• Meetings with Budget Unit
29. Annual financial reports • Financial Statements (2013/14, 2014/15, 2015/16).• Audit Reports (on 2013/14 & 2014/15 F/Statement).• Meetings with AGD, and External Audit.
30. External audit • Uganda Auditor General’s Corporate Plan 2016-21• Audit of 2013/14 and 2014/15 Financial Statements• Internal papers from External Audit• Meeting with External Audit
31. Legislative scrutiny of audit reports
• Meeting with Public Accounts Committee members• Reports to PAC
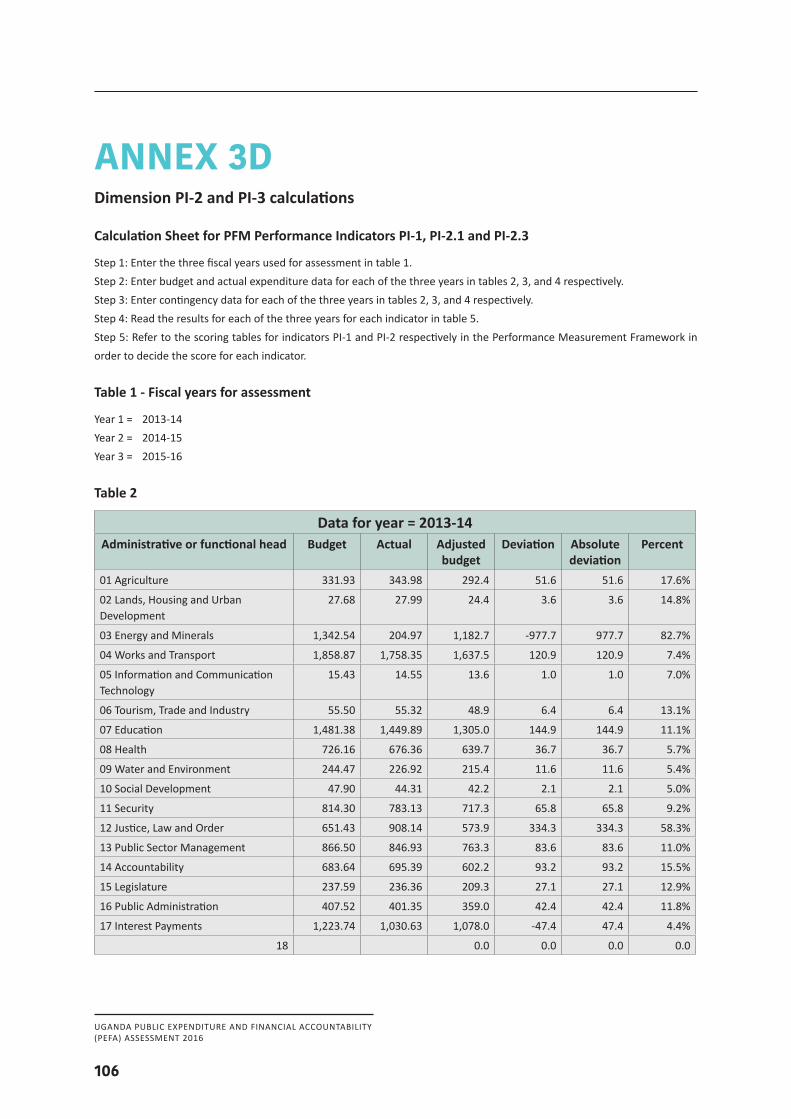
UGANDA PUBLIC EXPENDITURE AND FINANCIAL ACCOUNTABILITY(PEFA) ASSESSMENT 2016
106
ANNEX 3DDimension PI-2 and PI-3 calculations
Calculation Sheet for PFM Performance Indicators PI-1, PI-2.1 and PI-2.3
Step 1: Enter the three fiscal years used for assessment in table 1. Step 2: Enter budget and actual expenditure data for each of the three years in tables 2, 3, and 4 respectively.Step 3: Enter contingency data for each of the three years in tables 2, 3, and 4 respectively.Step 4: Read the results for each of the three years for each indicator in table 5.Step 5: Refer to the scoring tables for indicators PI-1 and PI-2 respectively in the Performance Measurement Framework in order to decide the score for each indicator. Table 1 - Fiscal years for assessment
Year 1 = 2013-14 Year 2 = 2014-15 Year 3 = 2015-16 Table 2
Data for year = 2013-14 Administrative or functional head Budget Actual Adjusted
budgetDeviation Absolute
deviationPercent
01 Agriculture 331.93 343.98 292.4 51.6 51.6 17.6%
02 Lands, Housing and Urban Development
27.68 27.99 24.4 3.6 3.6 14.8%
03 Energy and Minerals 1,342.54 204.97 1,182.7 -977.7 977.7 82.7%
04 Works and Transport 1,858.87 1,758.35 1,637.5 120.9 120.9 7.4%
05 Information and Communication Technology
15.43 14.55 13.6 1.0 1.0 7.0%
06 Tourism, Trade and Industry 55.50 55.32 48.9 6.4 6.4 13.1%
07 Education 1,481.38 1,449.89 1,305.0 144.9 144.9 11.1%
08 Health 726.16 676.36 639.7 36.7 36.7 5.7%
09 Water and Environment 244.47 226.92 215.4 11.6 11.6 5.4%
10 Social Development 47.90 44.31 42.2 2.1 2.1 5.0%
11 Security 814.30 783.13 717.3 65.8 65.8 9.2%
12 Justice, Law and Order 651.43 908.14 573.9 334.3 334.3 58.3%
13 Public Sector Management 866.50 846.93 763.3 83.6 83.6 11.0%
14 Accountability 683.64 695.39 602.2 93.2 93.2 15.5%
15 Legislature 237.59 236.36 209.3 27.1 27.1 12.9%
16 Public Administration 407.52 401.35 359.0 42.4 42.4 11.8%
17 Interest Payments 1,223.74 1,030.63 1,078.0 -47.4 47.4 4.4%
18 0.0 0.0 0.0 0.0
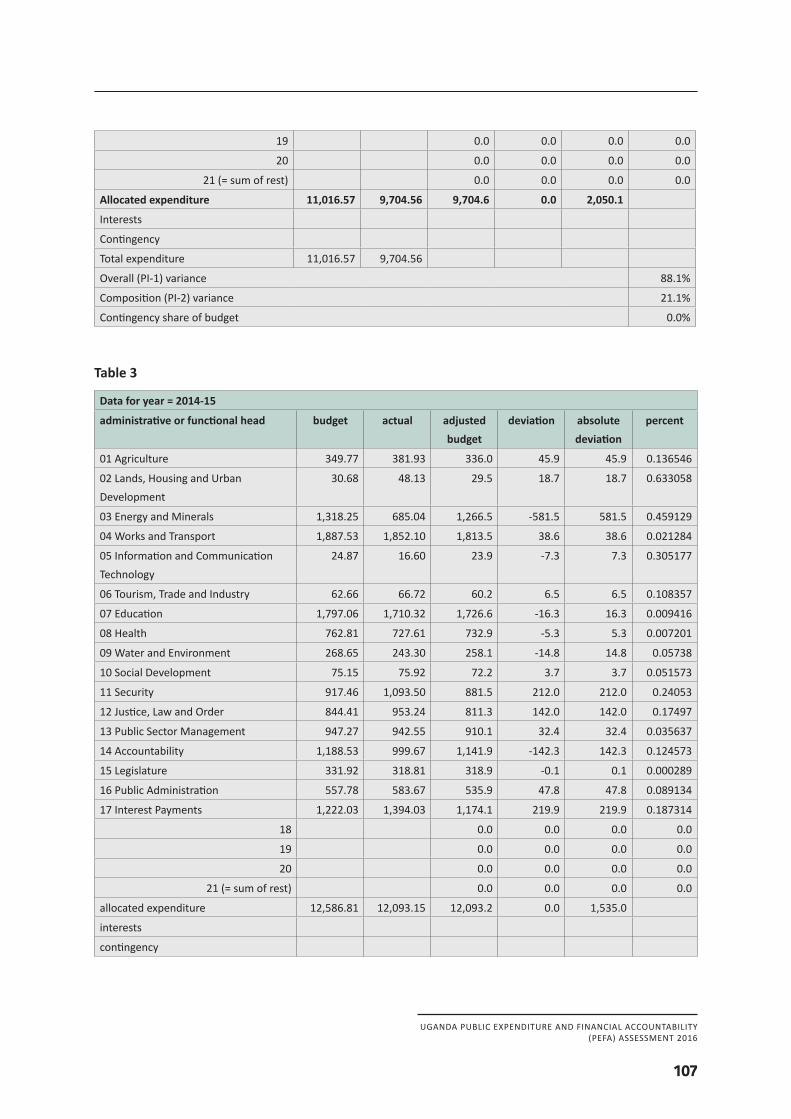
UGANDA PUBLIC EXPENDITURE AND FINANCIAL ACCOUNTABILITY(PEFA) ASSESSMENT 2016
107
19 0.0 0.0 0.0 0.0
20 0.0 0.0 0.0 0.0
21 (= sum of rest) 0.0 0.0 0.0 0.0
Allocated expenditure 11,016.57 9,704.56 9,704.6 0.0 2,050.1
Interests
Contingency
Total expenditure 11,016.57 9,704.56
Overall (PI-1) variance 88.1%
Composition (PI-2) variance 21.1%
Contingency share of budget 0.0%
Table 3
Data for year = 2014-15
administrative or functional head budget actual adjusted budget
deviation absolute deviation
percent
01 Agriculture 349.77 381.93 336.0 45.9 45.9 0.136546
02 Lands, Housing and Urban Development
30.68 48.13 29.5 18.7 18.7 0.633058
03 Energy and Minerals 1,318.25 685.04 1,266.5 -581.5 581.5 0.459129
04 Works and Transport 1,887.53 1,852.10 1,813.5 38.6 38.6 0.021284
05 Information and Communication Technology
24.87 16.60 23.9 -7.3 7.3 0.305177
06 Tourism, Trade and Industry 62.66 66.72 60.2 6.5 6.5 0.108357
07 Education 1,797.06 1,710.32 1,726.6 -16.3 16.3 0.009416
08 Health 762.81 727.61 732.9 -5.3 5.3 0.007201
09 Water and Environment 268.65 243.30 258.1 -14.8 14.8 0.05738
10 Social Development 75.15 75.92 72.2 3.7 3.7 0.051573
11 Security 917.46 1,093.50 881.5 212.0 212.0 0.24053
12 Justice, Law and Order 844.41 953.24 811.3 142.0 142.0 0.17497
13 Public Sector Management 947.27 942.55 910.1 32.4 32.4 0.035637
14 Accountability 1,188.53 999.67 1,141.9 -142.3 142.3 0.124573
15 Legislature 331.92 318.81 318.9 -0.1 0.1 0.000289
16 Public Administration 557.78 583.67 535.9 47.8 47.8 0.089134
17 Interest Payments 1,222.03 1,394.03 1,174.1 219.9 219.9 0.187314
18 0.0 0.0 0.0 0.0
19 0.0 0.0 0.0 0.0
20 0.0 0.0 0.0 0.0
21 (= sum of rest) 0.0 0.0 0.0 0.0
allocated expenditure 12,586.81 12,093.15 12,093.2 0.0 1,535.0
interests
contingency
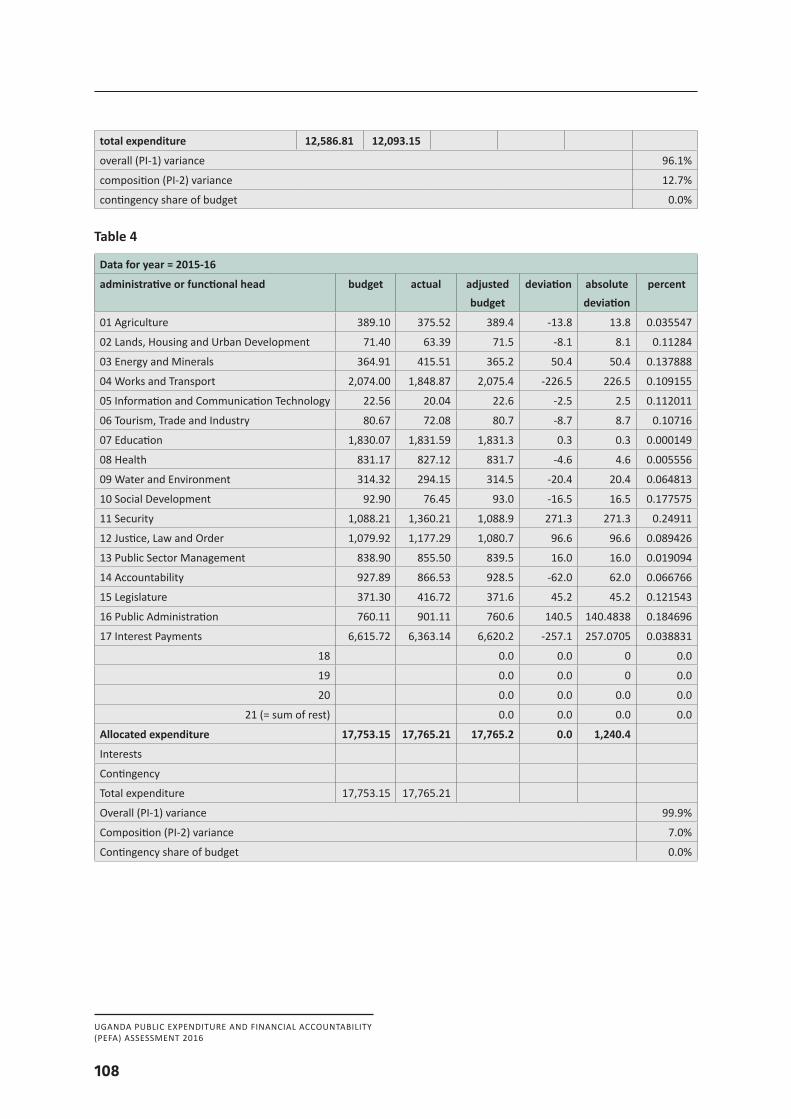
UGANDA PUBLIC EXPENDITURE AND FINANCIAL ACCOUNTABILITY(PEFA) ASSESSMENT 2016
108
total expenditure 12,586.81 12,093.15
overall (PI-1) variance 96.1%
composition (PI-2) variance 12.7%
contingency share of budget 0.0% Table 4
Data for year = 2015-16
administrative or functional head budget actual adjusted budget
deviation absolute deviation
percent
01 Agriculture 389.10 375.52 389.4 -13.8 13.8 0.035547
02 Lands, Housing and Urban Development 71.40 63.39 71.5 -8.1 8.1 0.11284
03 Energy and Minerals 364.91 415.51 365.2 50.4 50.4 0.137888
04 Works and Transport 2,074.00 1,848.87 2,075.4 -226.5 226.5 0.109155
05 Information and Communication Technology 22.56 20.04 22.6 -2.5 2.5 0.112011
06 Tourism, Trade and Industry 80.67 72.08 80.7 -8.7 8.7 0.10716
07 Education 1,830.07 1,831.59 1,831.3 0.3 0.3 0.000149
08 Health 831.17 827.12 831.7 -4.6 4.6 0.005556
09 Water and Environment 314.32 294.15 314.5 -20.4 20.4 0.064813
10 Social Development 92.90 76.45 93.0 -16.5 16.5 0.177575
11 Security 1,088.21 1,360.21 1,088.9 271.3 271.3 0.24911
12 Justice, Law and Order 1,079.92 1,177.29 1,080.7 96.6 96.6 0.089426
13 Public Sector Management 838.90 855.50 839.5 16.0 16.0 0.019094
14 Accountability 927.89 866.53 928.5 -62.0 62.0 0.066766
15 Legislature 371.30 416.72 371.6 45.2 45.2 0.121543
16 Public Administration 760.11 901.11 760.6 140.5 140.4838 0.184696
17 Interest Payments 6,615.72 6,363.14 6,620.2 -257.1 257.0705 0.038831
18 0.0 0.0 0 0.0
19 0.0 0.0 0 0.0
20 0.0 0.0 0.0 0.0
21 (= sum of rest) 0.0 0.0 0.0 0.0
Allocated expenditure 17,753.15 17,765.21 17,765.2 0.0 1,240.4
Interests
Contingency
Total expenditure 17,753.15 17,765.21
Overall (PI-1) variance 99.9%
Composition (PI-2) variance 7.0%
Contingency share of budget 0.0%
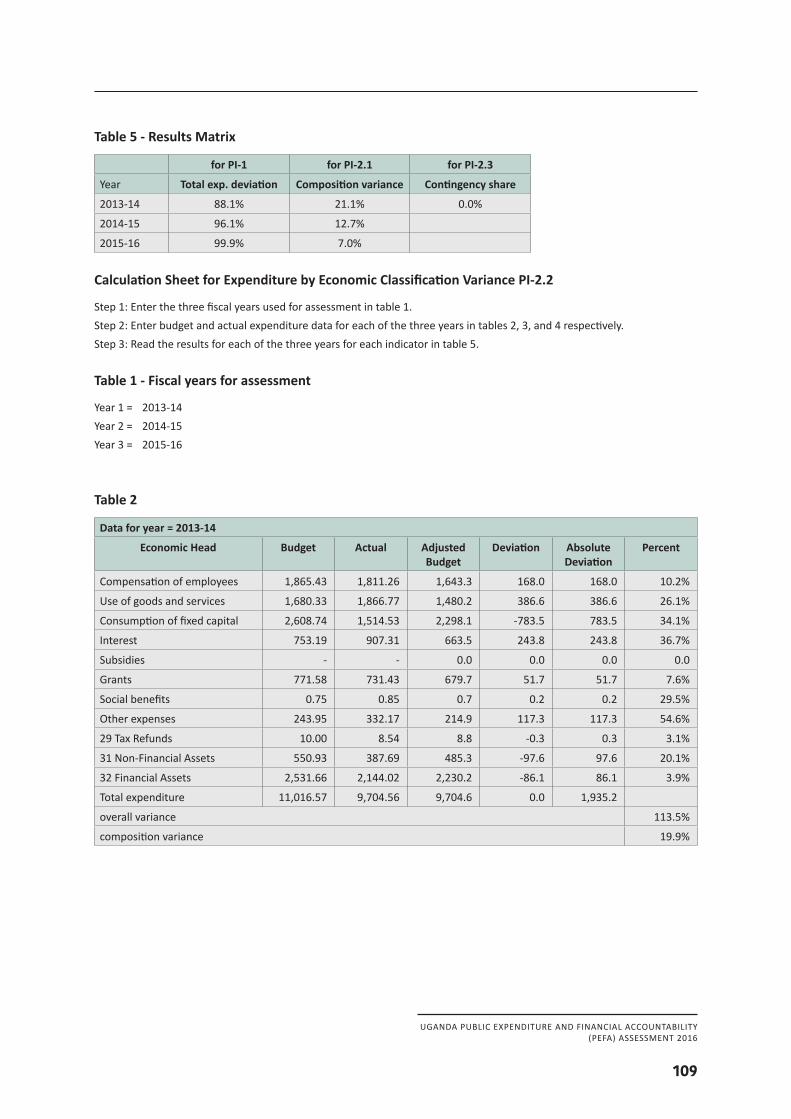
UGANDA PUBLIC EXPENDITURE AND FINANCIAL ACCOUNTABILITY(PEFA) ASSESSMENT 2016
109
Table 5 - Results Matrix
for PI-1 for PI-2.1 for PI-2.3
Year Total exp. deviation Composition variance Contingency share
2013-14 88.1% 21.1% 0.0%
2014-15 96.1% 12.7%
2015-16 99.9% 7.0%
Calculation Sheet for Expenditure by Economic Classification Variance PI-2.2
Step 1: Enter the three fiscal years used for assessment in table 1. Step 2: Enter budget and actual expenditure data for each of the three years in tables 2, 3, and 4 respectively.Step 3: Read the results for each of the three years for each indicator in table 5. Table 1 - Fiscal years for assessment
Year 1 = 2013-14 Year 2 = 2014-15 Year 3 = 2015-16 Table 2
Data for year = 2013-14
Economic Head Budget Actual Adjusted Budget
Deviation Absolute Deviation
Percent
Compensation of employees 1,865.43 1,811.26 1,643.3 168.0 168.0 10.2%
Use of goods and services 1,680.33 1,866.77 1,480.2 386.6 386.6 26.1%
Consumption of fixed capital 2,608.74 1,514.53 2,298.1 -783.5 783.5 34.1%
Interest 753.19 907.31 663.5 243.8 243.8 36.7%
Subsidies - - 0.0 0.0 0.0 0.0
Grants 771.58 731.43 679.7 51.7 51.7 7.6%
Social benefits 0.75 0.85 0.7 0.2 0.2 29.5%
Other expenses 243.95 332.17 214.9 117.3 117.3 54.6%
29 Tax Refunds 10.00 8.54 8.8 -0.3 0.3 3.1%
31 Non-Financial Assets 550.93 387.69 485.3 -97.6 97.6 20.1%
32 Financial Assets 2,531.66 2,144.02 2,230.2 -86.1 86.1 3.9%
Total expenditure 11,016.57 9,704.56 9,704.6 0.0 1,935.2
overall variance 113.5%
composition variance 19.9%
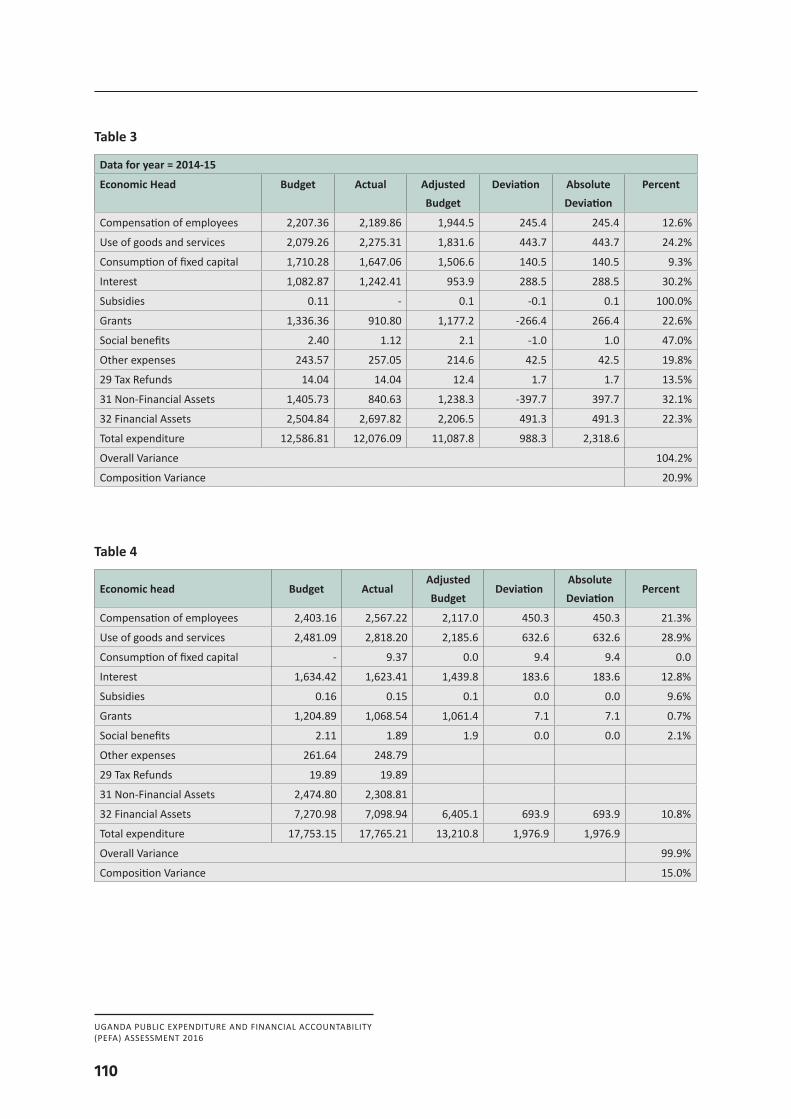
UGANDA PUBLIC EXPENDITURE AND FINANCIAL ACCOUNTABILITY(PEFA) ASSESSMENT 2016
110
Table 3
Data for year = 2014-15
Economic Head Budget Actual Adjusted Budget
Deviation Absolute Deviation
Percent
Compensation of employees 2,207.36 2,189.86 1,944.5 245.4 245.4 12.6%
Use of goods and services 2,079.26 2,275.31 1,831.6 443.7 443.7 24.2%
Consumption of fixed capital 1,710.28 1,647.06 1,506.6 140.5 140.5 9.3%
Interest 1,082.87 1,242.41 953.9 288.5 288.5 30.2%
Subsidies 0.11 - 0.1 -0.1 0.1 100.0%
Grants 1,336.36 910.80 1,177.2 -266.4 266.4 22.6%
Social benefits 2.40 1.12 2.1 -1.0 1.0 47.0%
Other expenses 243.57 257.05 214.6 42.5 42.5 19.8%
29 Tax Refunds 14.04 14.04 12.4 1.7 1.7 13.5%
31 Non-Financial Assets 1,405.73 840.63 1,238.3 -397.7 397.7 32.1%
32 Financial Assets 2,504.84 2,697.82 2,206.5 491.3 491.3 22.3%
Total expenditure 12,586.81 12,076.09 11,087.8 988.3 2,318.6
Overall Variance 104.2%
Composition Variance 20.9%
Table 4
Economic head Budget ActualAdjusted Budget
DeviationAbsolute Deviation
Percent
Compensation of employees 2,403.16 2,567.22 2,117.0 450.3 450.3 21.3%
Use of goods and services 2,481.09 2,818.20 2,185.6 632.6 632.6 28.9%
Consumption of fixed capital - 9.37 0.0 9.4 9.4 0.0
Interest 1,634.42 1,623.41 1,439.8 183.6 183.6 12.8%
Subsidies 0.16 0.15 0.1 0.0 0.0 9.6%
Grants 1,204.89 1,068.54 1,061.4 7.1 7.1 0.7%
Social benefits 2.11 1.89 1.9 0.0 0.0 2.1%
Other expenses 261.64 248.79
29 Tax Refunds 19.89 19.89
31 Non-Financial Assets 2,474.80 2,308.81
32 Financial Assets 7,270.98 7,098.94 6,405.1 693.9 693.9 10.8%
Total expenditure 17,753.15 17,765.21 13,210.8 1,976.9 1,976.9
Overall Variance 99.9%
Composition Variance 15.0%
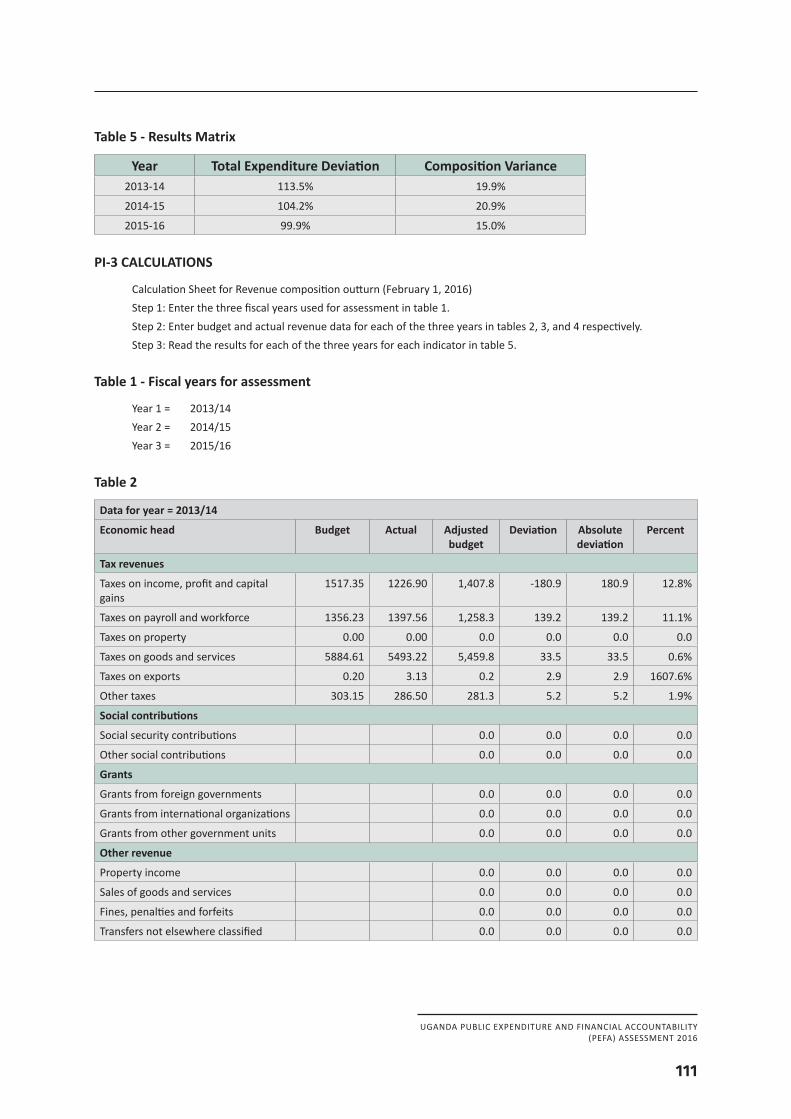
UGANDA PUBLIC EXPENDITURE AND FINANCIAL ACCOUNTABILITY(PEFA) ASSESSMENT 2016
111
Table 5 - Results Matrix
Year Total Expenditure Deviation Composition Variance2013-14 113.5% 19.9%
2014-15 104.2% 20.9%
2015-16 99.9% 15.0% PI-3 CALCULATIONS
Calculation Sheet for Revenue composition outturn (February 1, 2016) Step 1: Enter the three fiscal years used for assessment in table 1. Step 2: Enter budget and actual revenue data for each of the three years in tables 2, 3, and 4 respectively.Step 3: Read the results for each of the three years for each indicator in table 5.
Table 1 - Fiscal years for assessment
Year 1 = 2013/14 Year 2 = 2014/15 Year 3 = 2015/16
Table 2
Data for year = 2013/14
Economic head Budget Actual Adjusted budget
Deviation Absolute deviation
Percent
Tax revenues
Taxes on income, profit and capital gains
1517.35 1226.90 1,407.8 -180.9 180.9 12.8%
Taxes on payroll and workforce 1356.23 1397.56 1,258.3 139.2 139.2 11.1%
Taxes on property 0.00 0.00 0.0 0.0 0.0 0.0
Taxes on goods and services 5884.61 5493.22 5,459.8 33.5 33.5 0.6%
Taxes on exports 0.20 3.13 0.2 2.9 2.9 1607.6%
Other taxes 303.15 286.50 281.3 5.2 5.2 1.9%
Social contributions
Social security contributions 0.0 0.0 0.0 0.0
Other social contributions 0.0 0.0 0.0 0.0
Grants
Grants from foreign governments 0.0 0.0 0.0 0.0
Grants from international organizations 0.0 0.0 0.0 0.0
Grants from other government units 0.0 0.0 0.0 0.0
Other revenue
Property income 0.0 0.0 0.0 0.0
Sales of goods and services 0.0 0.0 0.0 0.0
Fines, penalties and forfeits 0.0 0.0 0.0 0.0
Transfers not elsewhere classified 0.0 0.0 0.0 0.0
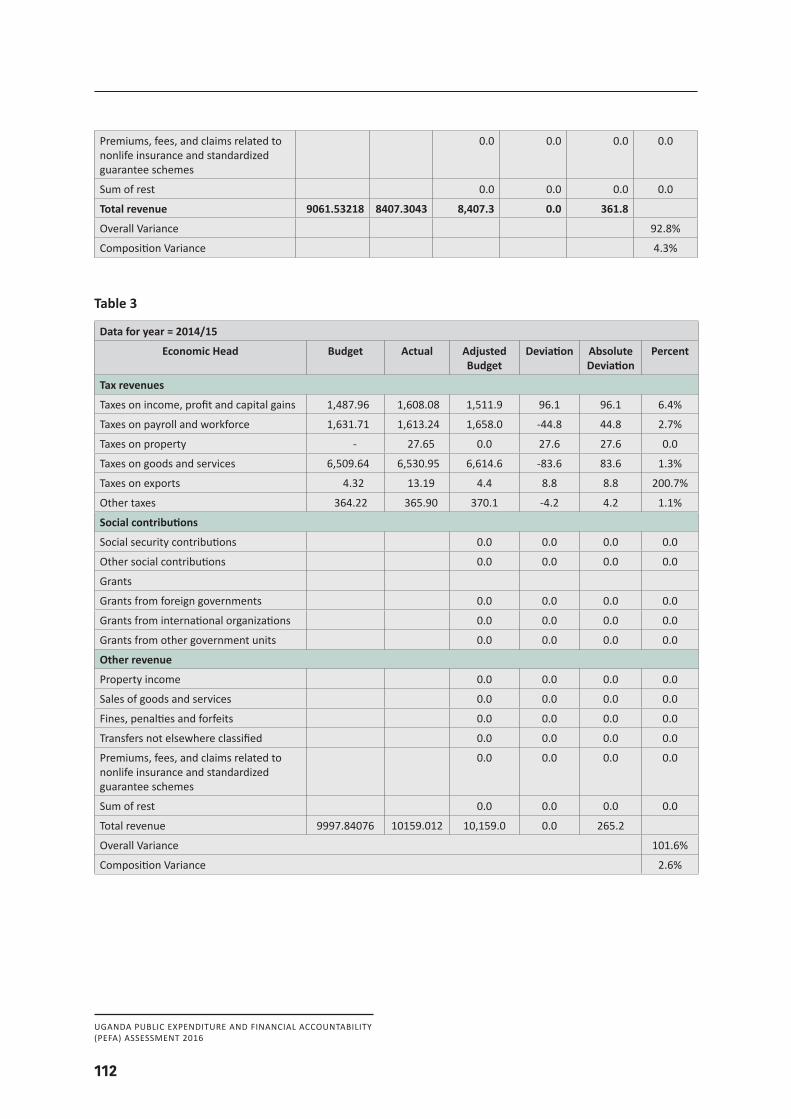
UGANDA PUBLIC EXPENDITURE AND FINANCIAL ACCOUNTABILITY(PEFA) ASSESSMENT 2016
112
Premiums, fees, and claims related to nonlife insurance and standardized guarantee schemes
0.0 0.0 0.0 0.0
Sum of rest 0.0 0.0 0.0 0.0
Total revenue 9061.53218 8407.3043 8,407.3 0.0 361.8
Overall Variance 92.8%
Composition Variance 4.3%
Table 3
Data for year = 2014/15
Economic Head Budget Actual Adjusted Budget
Deviation Absolute Deviation
Percent
Tax revenues
Taxes on income, profit and capital gains 1,487.96 1,608.08 1,511.9 96.1 96.1 6.4%
Taxes on payroll and workforce 1,631.71 1,613.24 1,658.0 -44.8 44.8 2.7%
Taxes on property - 27.65 0.0 27.6 27.6 0.0
Taxes on goods and services 6,509.64 6,530.95 6,614.6 -83.6 83.6 1.3%
Taxes on exports 4.32 13.19 4.4 8.8 8.8 200.7%
Other taxes 364.22 365.90 370.1 -4.2 4.2 1.1%
Social contributions
Social security contributions 0.0 0.0 0.0 0.0
Other social contributions 0.0 0.0 0.0 0.0
Grants
Grants from foreign governments 0.0 0.0 0.0 0.0
Grants from international organizations 0.0 0.0 0.0 0.0
Grants from other government units 0.0 0.0 0.0 0.0
Other revenue
Property income 0.0 0.0 0.0 0.0
Sales of goods and services 0.0 0.0 0.0 0.0
Fines, penalties and forfeits 0.0 0.0 0.0 0.0
Transfers not elsewhere classified 0.0 0.0 0.0 0.0
Premiums, fees, and claims related to nonlife insurance and standardized guarantee schemes
0.0 0.0 0.0 0.0
Sum of rest 0.0 0.0 0.0 0.0
Total revenue 9997.84076 10159.012 10,159.0 0.0 265.2
Overall Variance 101.6%
Composition Variance 2.6%
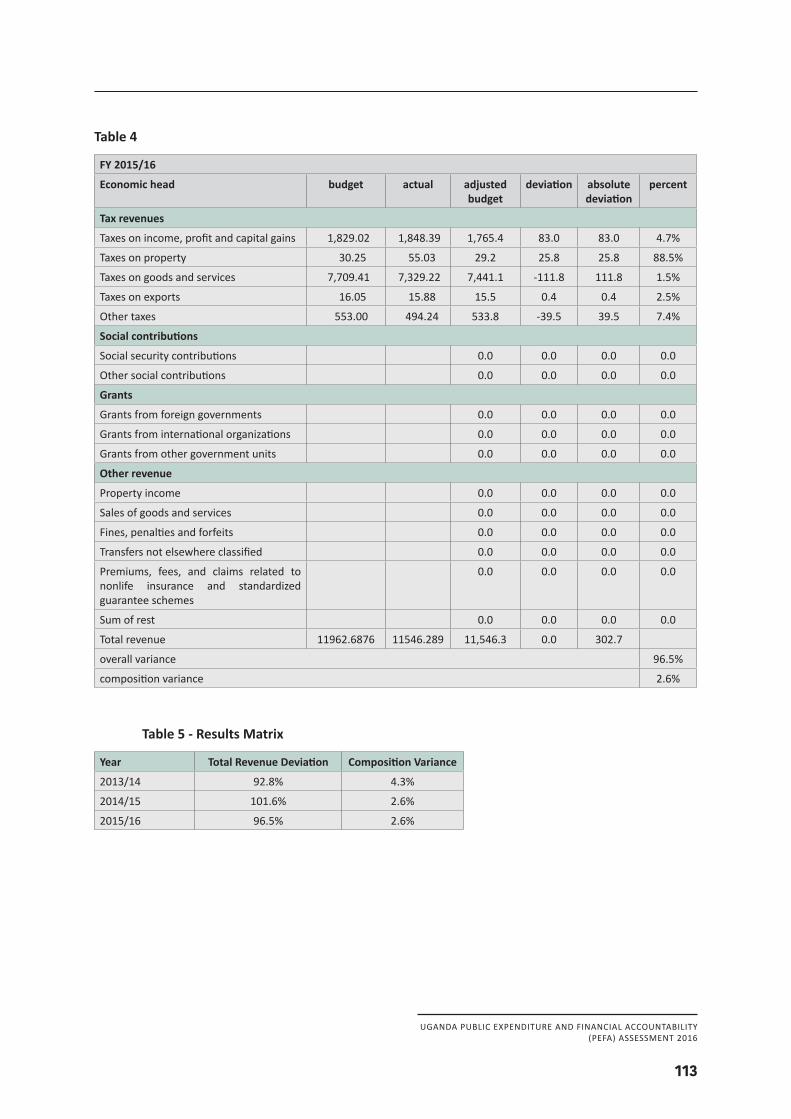
UGANDA PUBLIC EXPENDITURE AND FINANCIAL ACCOUNTABILITY(PEFA) ASSESSMENT 2016
113
Table 4
FY 2015/16
Economic head budget actual adjusted budget
deviation absolute deviation
percent
Tax revenues
Taxes on income, profit and capital gains 1,829.02 1,848.39 1,765.4 83.0 83.0 4.7%
Taxes on property 30.25 55.03 29.2 25.8 25.8 88.5%
Taxes on goods and services 7,709.41 7,329.22 7,441.1 -111.8 111.8 1.5%
Taxes on exports 16.05 15.88 15.5 0.4 0.4 2.5%
Other taxes 553.00 494.24 533.8 -39.5 39.5 7.4%
Social contributions
Social security contributions 0.0 0.0 0.0 0.0
Other social contributions 0.0 0.0 0.0 0.0
Grants
Grants from foreign governments 0.0 0.0 0.0 0.0
Grants from international organizations 0.0 0.0 0.0 0.0
Grants from other government units 0.0 0.0 0.0 0.0
Other revenue
Property income 0.0 0.0 0.0 0.0
Sales of goods and services 0.0 0.0 0.0 0.0
Fines, penalties and forfeits 0.0 0.0 0.0 0.0
Transfers not elsewhere classified 0.0 0.0 0.0 0.0
Premiums, fees, and claims related to nonlife insurance and standardized guarantee schemes
0.0 0.0 0.0 0.0
Sum of rest 0.0 0.0 0.0 0.0
Total revenue 11962.6876 11546.289 11,546.3 0.0 302.7
overall variance 96.5%
composition variance 2.6% Table 5 - Results Matrix
Year Total Revenue Deviation Composition Variance
2013/14 92.8% 4.3%
2014/15 101.6% 2.6%
2015/16 96.5% 2.6%
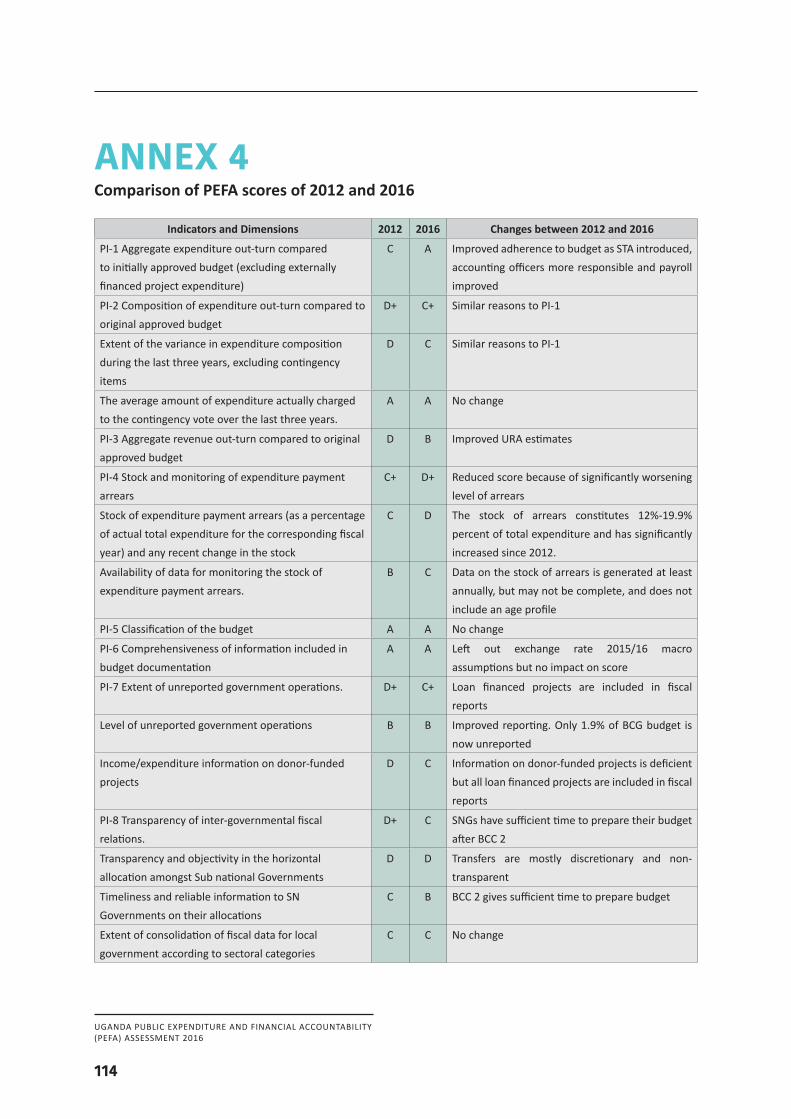
UGANDA PUBLIC EXPENDITURE AND FINANCIAL ACCOUNTABILITY(PEFA) ASSESSMENT 2016
114
ANNEX 4Comparison of PEFA scores of 2012 and 2016
Indicators and Dimensions 2012 2016 Changes between 2012 and 2016
PI-1 Aggregate expenditure out-turn compared to initially approved budget (excluding externally financed project expenditure)
C A Improved adherence to budget as STA introduced, accounting officers more responsible and payroll improved
PI-2 Composition of expenditure out-turn compared to original approved budget
D+ C+ Similar reasons to PI-1
Extent of the variance in expenditure composition during the last three years, excluding contingency items
D C Similar reasons to PI-1
The average amount of expenditure actually charged to the contingency vote over the last three years.
A A No change
PI-3 Aggregate revenue out-turn compared to original approved budget
D B Improved URA estimates
PI-4 Stock and monitoring of expenditure payment arrears
C+ D+ Reduced score because of significantly worsening level of arrears
Stock of expenditure payment arrears (as a percentage of actual total expenditure for the corresponding fiscal year) and any recent change in the stock
C D The stock of arrears constitutes 12%-19.9% percent of total expenditure and has significantly increased since 2012.
Availability of data for monitoring the stock of expenditure payment arrears.
B C Data on the stock of arrears is generated at least annually, but may not be complete, and does not include an age profile
PI-5 Classification of the budget A A No change
PI-6 Comprehensiveness of information included in budget documentation
A A Left out exchange rate 2015/16 macro assumptions but no impact on score
PI-7 Extent of unreported government operations. D+ C+ Loan financed projects are included in fiscal reports
Level of unreported government operations B B Improved reporting. Only 1.9% of BCG budget is now unreported
Income/expenditure information on donor-funded projects
D C Information on donor-funded projects is deficient but all loan financed projects are included in fiscal reports
PI-8 Transparency of inter-governmental fiscal relations.
D+ C SNGs have sufficient time to prepare their budget after BCC 2
Transparency and objectivity in the horizontal allocation amongst Sub national Governments
D D Transfers are mostly discretionary and non-transparent
Timeliness and reliable information to SN Governments on their allocations
C B BCC 2 gives sufficient time to prepare budget
Extent of consolidation of fiscal data for local government according to sectoral categories
C C No change
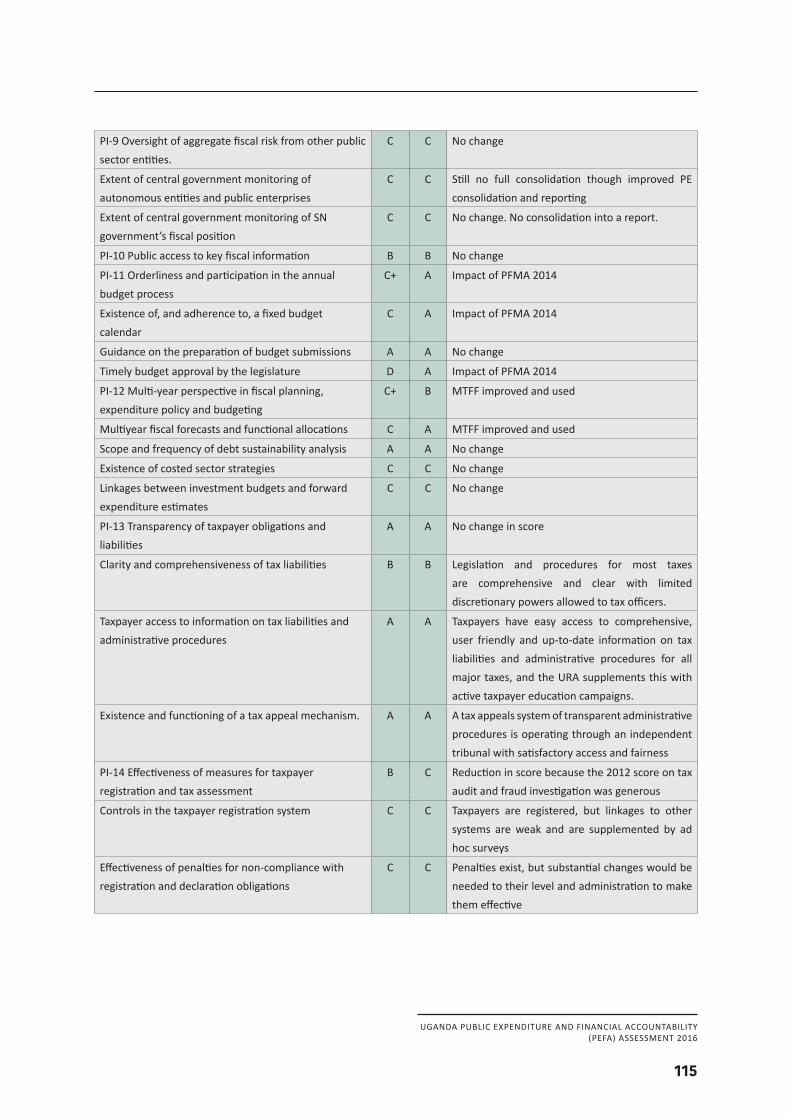
UGANDA PUBLIC EXPENDITURE AND FINANCIAL ACCOUNTABILITY(PEFA) ASSESSMENT 2016
115
PI-9 Oversight of aggregate fiscal risk from other public sector entities.
C C No change
Extent of central government monitoring of autonomous entities and public enterprises
C C Still no full consolidation though improved PE consolidation and reporting
Extent of central government monitoring of SN government’s fiscal position
C C No change. No consolidation into a report.
PI-10 Public access to key fiscal information B B No change
PI-11 Orderliness and participation in the annual budget process
C+ A Impact of PFMA 2014
Existence of, and adherence to, a fixed budget calendar
C A Impact of PFMA 2014
Guidance on the preparation of budget submissions A A No change
Timely budget approval by the legislature D A Impact of PFMA 2014
PI-12 Multi-year perspective in fiscal planning, expenditure policy and budgeting
C+ B MTFF improved and used
Multiyear fiscal forecasts and functional allocations C A MTFF improved and used
Scope and frequency of debt sustainability analysis A A No change
Existence of costed sector strategies C C No change
Linkages between investment budgets and forward expenditure estimates
C C No change
PI-13 Transparency of taxpayer obligations and liabilities
A A No change in score
Clarity and comprehensiveness of tax liabilities B B Legislation and procedures for most taxes are comprehensive and clear with limited discretionary powers allowed to tax officers.
Taxpayer access to information on tax liabilities and administrative procedures
A A Taxpayers have easy access to comprehensive, user friendly and up-to-date information on tax liabilities and administrative procedures for all major taxes, and the URA supplements this with active taxpayer education campaigns.
Existence and functioning of a tax appeal mechanism. A A A tax appeals system of transparent administrative procedures is operating through an independent tribunal with satisfactory access and fairness
PI-14 Effectiveness of measures for taxpayer registration and tax assessment
B C Reduction in score because the 2012 score on tax audit and fraud investigation was generous
Controls in the taxpayer registration system C C Taxpayers are registered, but linkages to other systems are weak and are supplemented by ad hoc surveys
Effectiveness of penalties for non-compliance with registration and declaration obligations
C C Penalties exist, but substantial changes would be needed to their level and administration to make them effective
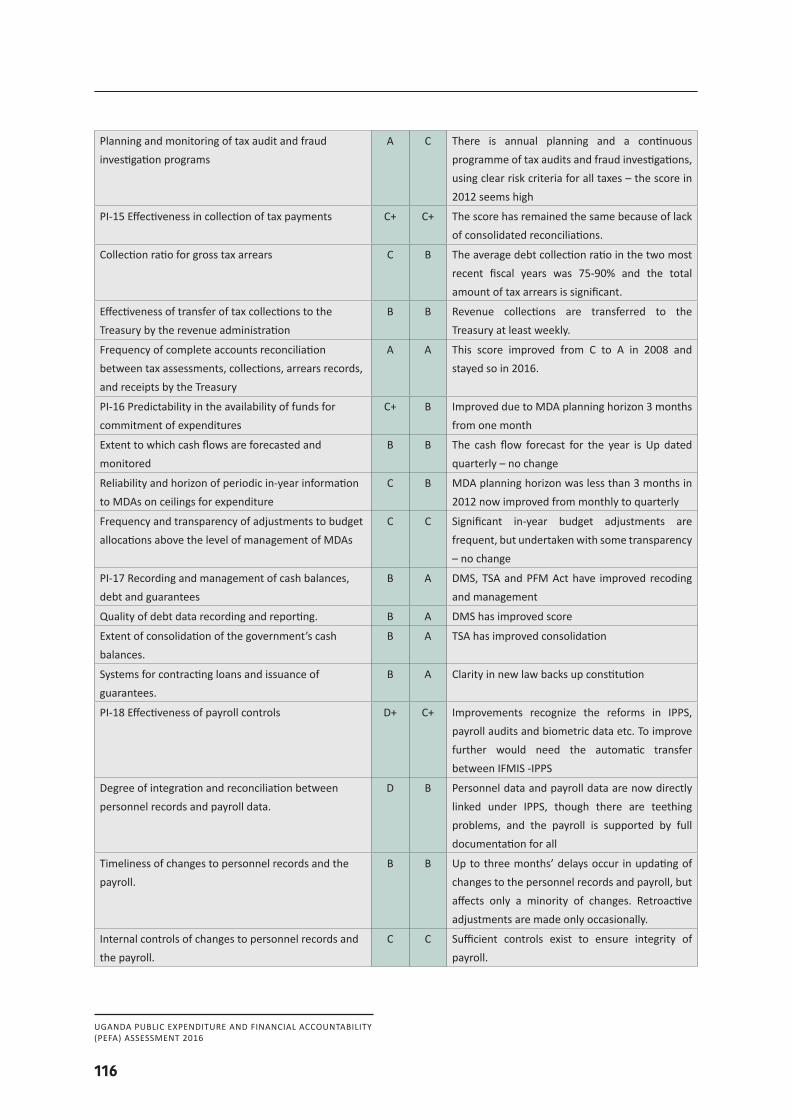
UGANDA PUBLIC EXPENDITURE AND FINANCIAL ACCOUNTABILITY(PEFA) ASSESSMENT 2016
116
Planning and monitoring of tax audit and fraud investigation programs
A C There is annual planning and a continuous programme of tax audits and fraud investigations, using clear risk criteria for all taxes – the score in 2012 seems high
PI-15 Effectiveness in collection of tax payments C+ C+ The score has remained the same because of lack of consolidated reconciliations.
Collection ratio for gross tax arrears C B The average debt collection ratio in the two most recent fiscal years was 75-90% and the total amount of tax arrears is significant.
Effectiveness of transfer of tax collections to the Treasury by the revenue administration
B B Revenue collections are transferred to the Treasury at least weekly.
Frequency of complete accounts reconciliation between tax assessments, collections, arrears records, and receipts by the Treasury
A A This score improved from C to A in 2008 and stayed so in 2016.
PI-16 Predictability in the availability of funds for commitment of expenditures
C+ B Improved due to MDA planning horizon 3 months from one month
Extent to which cash flows are forecasted and monitored
B B The cash flow forecast for the year is Up dated quarterly – no change
Reliability and horizon of periodic in-year information to MDAs on ceilings for expenditure
C B MDA planning horizon was less than 3 months in 2012 now improved from monthly to quarterly
Frequency and transparency of adjustments to budget allocations above the level of management of MDAs
C C Significant in-year budget adjustments are frequent, but undertaken with some transparency – no change
PI-17 Recording and management of cash balances, debt and guarantees
B A DMS, TSA and PFM Act have improved recoding and management
Quality of debt data recording and reporting. B A DMS has improved score
Extent of consolidation of the government’s cash balances.
B A TSA has improved consolidation
Systems for contracting loans and issuance of guarantees.
B A Clarity in new law backs up constitution
PI-18 Effectiveness of payroll controls D+ C+ Improvements recognize the reforms in IPPS, payroll audits and biometric data etc. To improve further would need the automatic transfer between IFMIS -IPPS
Degree of integration and reconciliation between personnel records and payroll data.
D B Personnel data and payroll data are now directly linked under IPPS, though there are teething problems, and the payroll is supported by full documentation for all
Timeliness of changes to personnel records and the payroll.
B B Up to three months’ delays occur in updating of changes to the personnel records and payroll, but affects only a minority of changes. Retroactive adjustments are made only occasionally.
Internal controls of changes to personnel records and the payroll.
C C Sufficient controls exist to ensure integrity of payroll.
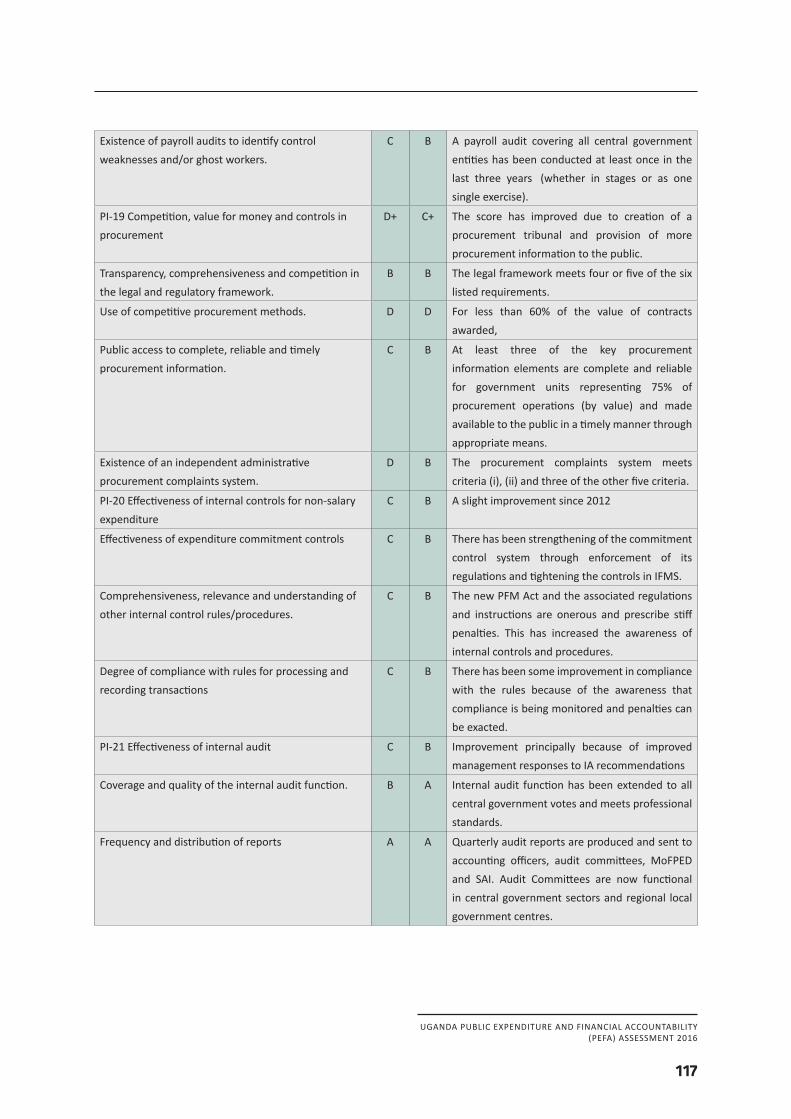
UGANDA PUBLIC EXPENDITURE AND FINANCIAL ACCOUNTABILITY(PEFA) ASSESSMENT 2016
117
Existence of payroll audits to identify control weaknesses and/or ghost workers.
C B A payroll audit covering all central government entities has been conducted at least once in the last three years (whether in stages or as one single exercise).
PI-19 Competition, value for money and controls in procurement
D+ C+ The score has improved due to creation of a procurement tribunal and provision of more procurement information to the public.
Transparency, comprehensiveness and competition in the legal and regulatory framework.
B B The legal framework meets four or five of the six listed requirements.
Use of competitive procurement methods. D D For less than 60% of the value of contracts awarded,
Public access to complete, reliable and timely procurement information.
C B At least three of the key procurement information elements are complete and reliable for government units representing 75% of procurement operations (by value) and made available to the public in a timely manner through appropriate means.
Existence of an independent administrative procurement complaints system.
D B The procurement complaints system meets criteria (i), (ii) and three of the other five criteria.
PI-20 Effectiveness of internal controls for non-salary expenditure
C B A slight improvement since 2012
Effectiveness of expenditure commitment controls C B There has been strengthening of the commitment control system through enforcement of its regulations and tightening the controls in IFMS.
Comprehensiveness, relevance and understanding of other internal control rules/procedures.
C B The new PFM Act and the associated regulations and instructions are onerous and prescribe stiff penalties. This has increased the awareness of internal controls and procedures.
Degree of compliance with rules for processing and recording transactions
C B There has been some improvement in compliance with the rules because of the awareness that compliance is being monitored and penalties can be exacted.
PI-21 Effectiveness of internal audit C B Improvement principally because of improved management responses to IA recommendations
Coverage and quality of the internal audit function. B A Internal audit function has been extended to all central government votes and meets professional standards.
Frequency and distribution of reports A A Quarterly audit reports are produced and sent to accounting officers, audit committees, MoFPED and SAI. Audit Committees are now functional in central government sectors and regional local government centres.
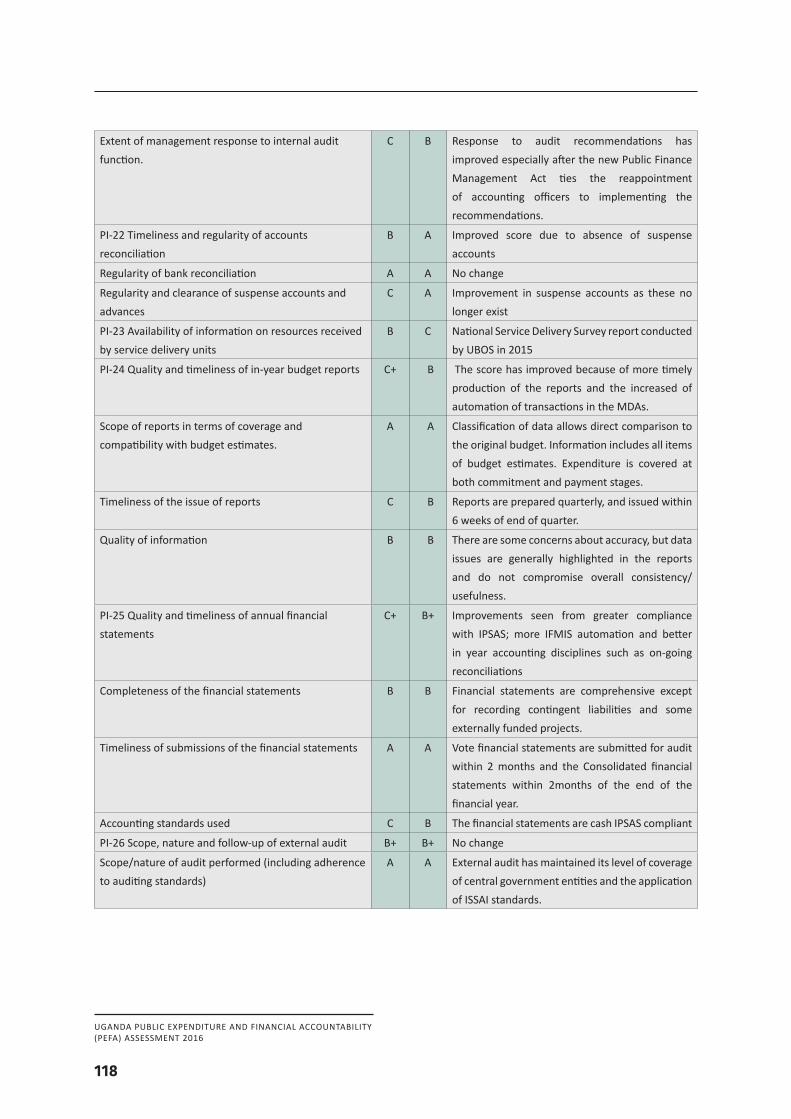
UGANDA PUBLIC EXPENDITURE AND FINANCIAL ACCOUNTABILITY(PEFA) ASSESSMENT 2016
118
Extent of management response to internal audit function.
C B Response to audit recommendations has improved especially after the new Public Finance Management Act ties the reappointment of accounting officers to implementing the recommendations.
PI-22 Timeliness and regularity of accounts reconciliation
B A Improved score due to absence of suspense accounts
Regularity of bank reconciliation A A No change
Regularity and clearance of suspense accounts and advances
C A Improvement in suspense accounts as these no longer exist
PI-23 Availability of information on resources received by service delivery units
B C National Service Delivery Survey report conducted by UBOS in 2015
PI-24 Quality and timeliness of in-year budget reports C+ B The score has improved because of more timely production of the reports and the increased of automation of transactions in the MDAs.
Scope of reports in terms of coverage and compatibility with budget estimates.
A A Classification of data allows direct comparison to the original budget. Information includes all items of budget estimates. Expenditure is covered at both commitment and payment stages.
Timeliness of the issue of reports C B Reports are prepared quarterly, and issued within 6 weeks of end of quarter.
Quality of information B B There are some concerns about accuracy, but data issues are generally highlighted in the reports and do not compromise overall consistency/ usefulness.
PI-25 Quality and timeliness of annual financial statements
C+ B+ Improvements seen from greater compliance with IPSAS; more IFMIS automation and better in year accounting disciplines such as on-going reconciliations
Completeness of the financial statements B B Financial statements are comprehensive except for recording contingent liabilities and some externally funded projects.
Timeliness of submissions of the financial statements A A Vote financial statements are submitted for audit within 2 months and the Consolidated financial statements within 2months of the end of the financial year.
Accounting standards used C B The financial statements are cash IPSAS compliant
PI-26 Scope, nature and follow-up of external audit B+ B+ No change
Scope/nature of audit performed (including adherence to auditing standards)
A A External audit has maintained its level of coverage of central government entities and the application of ISSAI standards.
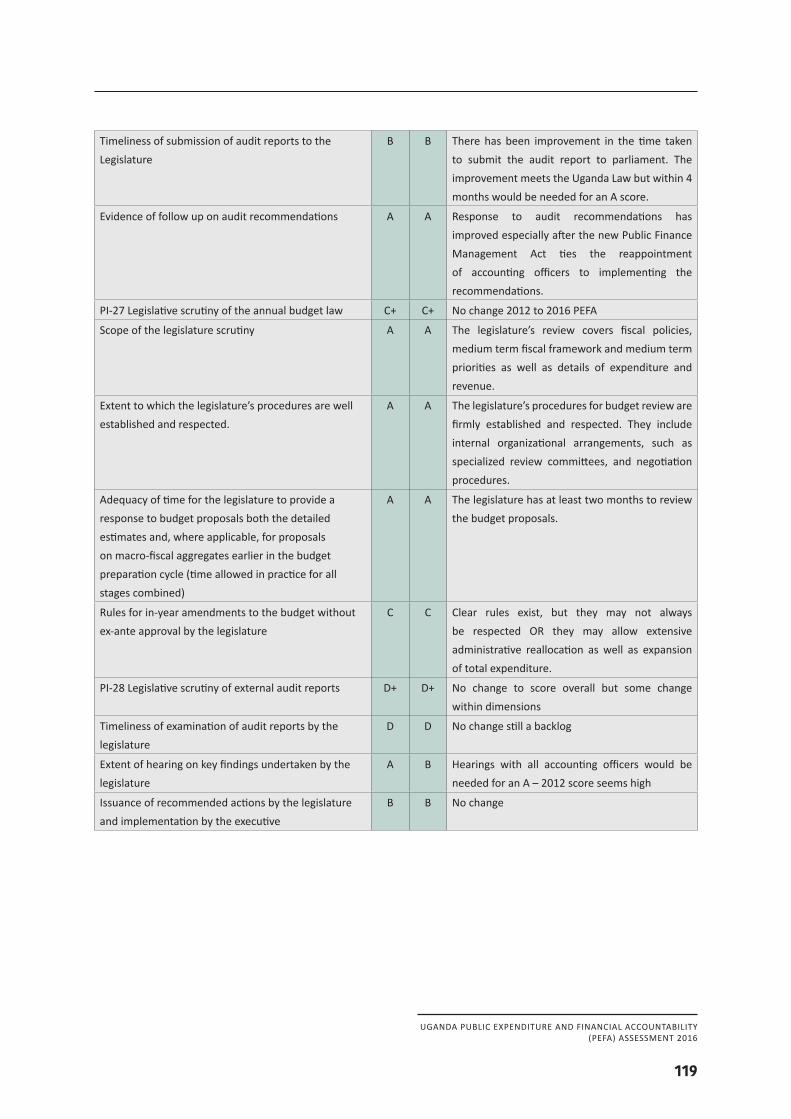
UGANDA PUBLIC EXPENDITURE AND FINANCIAL ACCOUNTABILITY(PEFA) ASSESSMENT 2016
119
Timeliness of submission of audit reports to the Legislature
B B There has been improvement in the time taken to submit the audit report to parliament. The improvement meets the Uganda Law but within 4 months would be needed for an A score.
Evidence of follow up on audit recommendations A A Response to audit recommendations has improved especially after the new Public Finance Management Act ties the reappointment of accounting officers to implementing the recommendations.
PI-27 Legislative scrutiny of the annual budget law C+ C+ No change 2012 to 2016 PEFA
Scope of the legislature scrutiny A A The legislature’s review covers fiscal policies, medium term fiscal framework and medium term priorities as well as details of expenditure and revenue.
Extent to which the legislature’s procedures are well established and respected.
A A The legislature’s procedures for budget review are firmly established and respected. They include internal organizational arrangements, such as specialized review committees, and negotiation procedures.
Adequacy of time for the legislature to provide a response to budget proposals both the detailed estimates and, where applicable, for proposals on macro-fiscal aggregates earlier in the budget preparation cycle (time allowed in practice for all stages combined)
A A The legislature has at least two months to review the budget proposals.
Rules for in-year amendments to the budget without ex-ante approval by the legislature
C C Clear rules exist, but they may not always be respected OR they may allow extensive administrative reallocation as well as expansion of total expenditure.
PI-28 Legislative scrutiny of external audit reports D+ D+ No change to score overall but some change within dimensions
Timeliness of examination of audit reports by the legislature
D D No change still a backlog
Extent of hearing on key findings undertaken by the legislature
A B Hearings with all accounting officers would be needed for an A – 2012 score seems high
Issuance of recommended actions by the legislature and implementation by the executive
B B No change
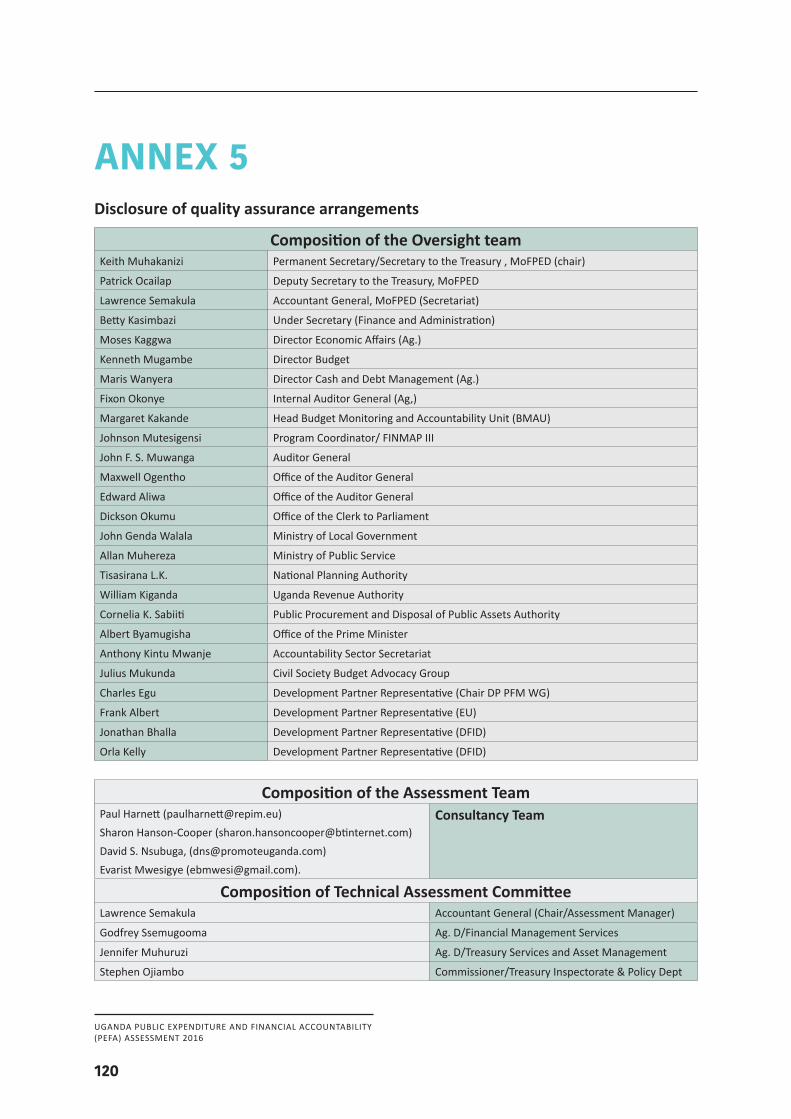
UGANDA PUBLIC EXPENDITURE AND FINANCIAL ACCOUNTABILITY(PEFA) ASSESSMENT 2016
120
ANNEX 5Disclosure of quality assurance arrangements
Composition of the Oversight teamKeith Muhakanizi Permanent Secretary/Secretary to the Treasury , MoFPED (chair)
Patrick Ocailap Deputy Secretary to the Treasury, MoFPED
Lawrence Semakula Accountant General, MoFPED (Secretariat)
Betty Kasimbazi Under Secretary (Finance and Administration)
Moses Kaggwa Director Economic Affairs (Ag.)
Kenneth Mugambe Director Budget
Maris Wanyera Director Cash and Debt Management (Ag.)
Fixon Okonye Internal Auditor General (Ag,)
Margaret Kakande Head Budget Monitoring and Accountability Unit (BMAU)
Johnson Mutesigensi Program Coordinator/ FINMAP III
John F. S. Muwanga Auditor General
Maxwell Ogentho Office of the Auditor General
Edward Aliwa Office of the Auditor General
Dickson Okumu Office of the Clerk to Parliament
John Genda Walala Ministry of Local Government
Allan Muhereza Ministry of Public Service
Tisasirana L.K. National Planning Authority
William Kiganda Uganda Revenue Authority
Cornelia K. Sabiiti Public Procurement and Disposal of Public Assets Authority
Albert Byamugisha Office of the Prime Minister
Anthony Kintu Mwanje Accountability Sector Secretariat
Julius Mukunda Civil Society Budget Advocacy Group
Charles Egu Development Partner Representative (Chair DP PFM WG)
Frank Albert Development Partner Representative (EU)
Jonathan Bhalla Development Partner Representative (DFID)
Orla Kelly Development Partner Representative (DFID)
Composition of the Assessment TeamPaul Harnett ([email protected])Sharon Hanson-Cooper ([email protected])David S. Nsubuga, ([email protected]) Evarist Mwesigye ([email protected]).
Consultancy Team
Composition of Technical Assessment CommitteeLawrence Semakula Accountant General (Chair/Assessment Manager)
Godfrey Ssemugooma Ag. D/Financial Management Services
Jennifer Muhuruzi Ag. D/Treasury Services and Asset Management
Stephen Ojiambo Commissioner/Treasury Inspectorate & Policy Dept
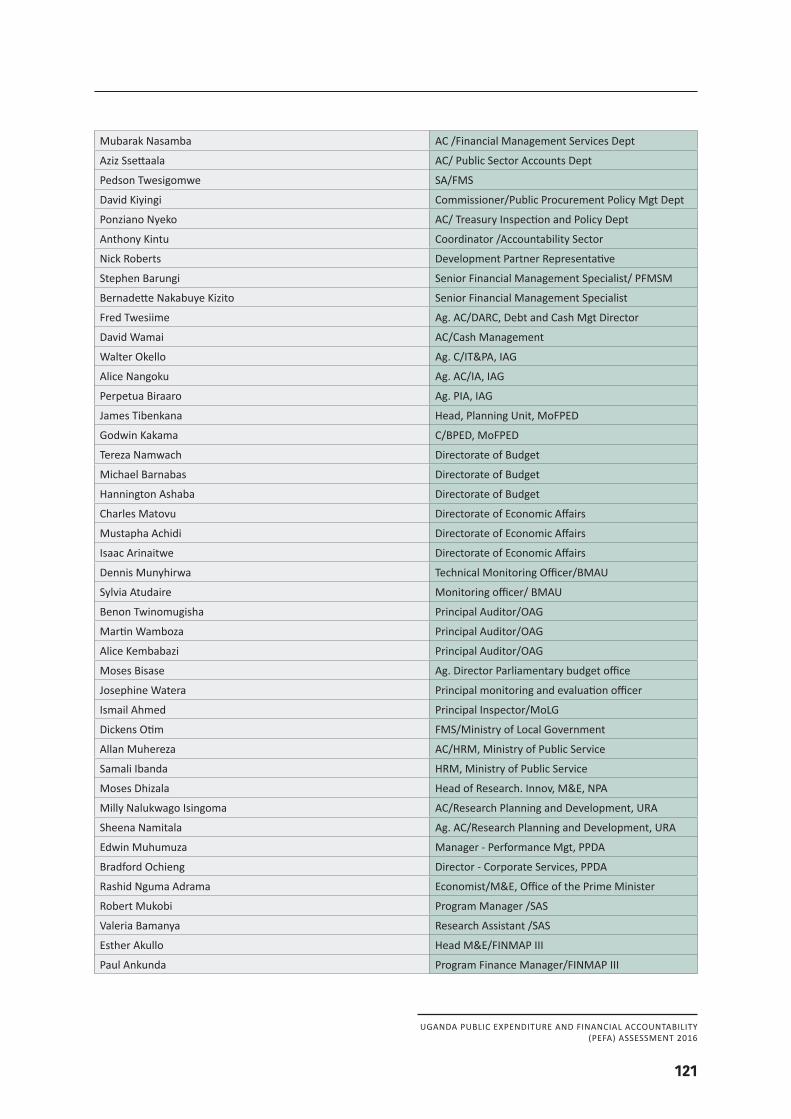
UGANDA PUBLIC EXPENDITURE AND FINANCIAL ACCOUNTABILITY(PEFA) ASSESSMENT 2016
121
Mubarak Nasamba AC /Financial Management Services Dept
Aziz Ssettaala AC/ Public Sector Accounts Dept
Pedson Twesigomwe SA/FMS
David Kiyingi Commissioner/Public Procurement Policy Mgt Dept
Ponziano Nyeko AC/ Treasury Inspection and Policy Dept
Anthony Kintu Coordinator /Accountability Sector
Nick Roberts Development Partner Representative
Stephen Barungi Senior Financial Management Specialist/ PFMSM
Bernadette Nakabuye Kizito Senior Financial Management Specialist
Fred Twesiime Ag. AC/DARC, Debt and Cash Mgt Director
David Wamai AC/Cash Management
Walter Okello Ag. C/IT&PA, IAG
Alice Nangoku Ag. AC/IA, IAG
Perpetua Biraaro Ag. PIA, IAG
James Tibenkana Head, Planning Unit, MoFPED
Godwin Kakama C/BPED, MoFPED
Tereza Namwach Directorate of Budget
Michael Barnabas Directorate of Budget
Hannington Ashaba Directorate of Budget
Charles Matovu Directorate of Economic Affairs
Mustapha Achidi Directorate of Economic Affairs
Isaac Arinaitwe Directorate of Economic Affairs
Dennis Munyhirwa Technical Monitoring Officer/BMAU
Sylvia Atudaire Monitoring officer/ BMAU
Benon Twinomugisha Principal Auditor/OAG
Martin Wamboza Principal Auditor/OAG
Alice Kembabazi Principal Auditor/OAG
Moses Bisase Ag. Director Parliamentary budget office
Josephine Watera Principal monitoring and evaluation officer
Ismail Ahmed Principal Inspector/MoLG
Dickens Otim FMS/Ministry of Local Government
Allan Muhereza AC/HRM, Ministry of Public Service
Samali Ibanda HRM, Ministry of Public Service
Moses Dhizala Head of Research. Innov, M&E, NPA
Milly Nalukwago Isingoma AC/Research Planning and Development, URA
Sheena Namitala Ag. AC/Research Planning and Development, URA
Edwin Muhumuza Manager - Performance Mgt, PPDA
Bradford Ochieng Director - Corporate Services, PPDA
Rashid Nguma Adrama Economist/M&E, Office of the Prime Minister
Robert Mukobi Program Manager /SAS
Valeria Bamanya Research Assistant /SAS
Esther Akullo Head M&E/FINMAP III
Paul Ankunda Program Finance Manager/FINMAP III
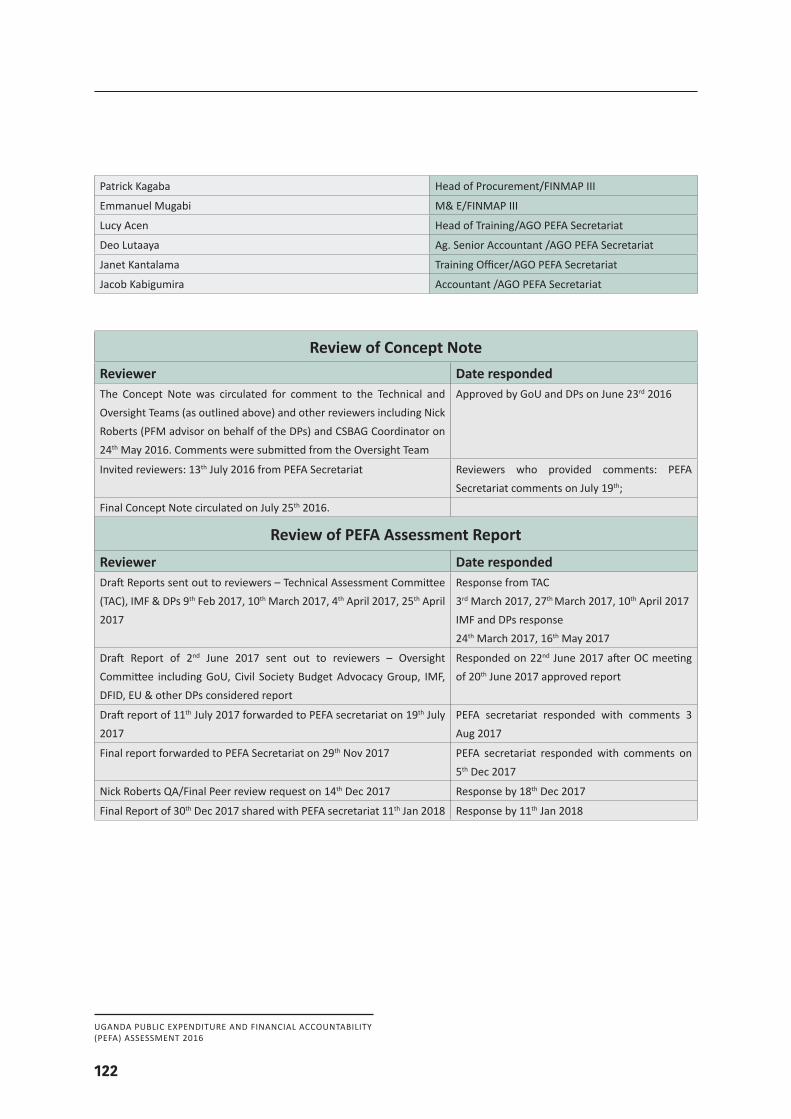
UGANDA PUBLIC EXPENDITURE AND FINANCIAL ACCOUNTABILITY(PEFA) ASSESSMENT 2016
122
Patrick Kagaba Head of Procurement/FINMAP III
Emmanuel Mugabi M& E/FINMAP III
Lucy Acen Head of Training/AGO PEFA Secretariat
Deo Lutaaya Ag. Senior Accountant /AGO PEFA Secretariat
Janet Kantalama Training Officer/AGO PEFA Secretariat
Jacob Kabigumira Accountant /AGO PEFA Secretariat
Review of Concept NoteReviewer Date respondedThe Concept Note was circulated for comment to the Technical and Oversight Teams (as outlined above) and other reviewers including Nick Roberts (PFM advisor on behalf of the DPs) and CSBAG Coordinator on 24th May 2016. Comments were submitted from the Oversight Team
Approved by GoU and DPs on June 23rd 2016
Invited reviewers: 13th July 2016 from PEFA Secretariat Reviewers who provided comments: PEFA Secretariat comments on July 19th;
Final Concept Note circulated on July 25th 2016.
Review of PEFA Assessment ReportReviewer Date respondedDraft Reports sent out to reviewers – Technical Assessment Committee (TAC), IMF & DPs 9th Feb 2017, 10th March 2017, 4th April 2017, 25th April 2017
Response from TAC3rd March 2017, 27th March 2017, 10th April 2017IMF and DPs response24th March 2017, 16th May 2017
Draft Report of 2nd June 2017 sent out to reviewers – Oversight Committee including GoU, Civil Society Budget Advocacy Group, IMF, DFID, EU & other DPs considered report
Responded on 22nd June 2017 after OC meeting of 20th June 2017 approved report
Draft report of 11th July 2017 forwarded to PEFA secretariat on 19th July 2017
PEFA secretariat responded with comments 3 Aug 2017
Final report forwarded to PEFA Secretariat on 29th Nov 2017 PEFA secretariat responded with comments on 5th Dec 2017
Nick Roberts QA/Final Peer review request on 14th Dec 2017 Response by 18th Dec 2017
Final Report of 30th Dec 2017 shared with PEFA secretariat 11th Jan 2018 Response by 11th Jan 2018

MINISTRY OF FINANCE, PLANNING AND ECONOMIC DEVELOPMENT Accountant General’s Office, P.O Box 8147, Kampala
Telephone +256 414 341305 / +256 414 707256