the resource allocation of foundation funding for arkansas
TRANSCRIPT

BUREAU OF LEGISLATIVE RESEARCH One Capitol Mall, 5TH Floor Little Rock, Ark., 72201 (501) 682-1937
The Resource Allocation
of Foundation Funding for
Arkansas School Districts and
Open-Enrollment Charter Schools
July 15, 2014
Prepared for the
THE HOUSE INTERIM COMMITTEE ON EDUCATION AND THE SENATE INTERIM COMMITTEE ON EDUCATION
2013-14 Adequacy
Study

Bureau of Legislative Research Project Number 14-001-27

Bureau of Legislative Research Project Number 14-001-27
CONTENTS
Acronyms ................................................................................................................................. v
Introduction .............................................................................................................................. 1 Data and Methodology............................................................................................................ 1
Educational Adequacy Defined ............................................................................................... 3
Education Funding in Arkansas .............................................................................................. 4
Foundation Funding Overview ................................................................................................ 5
Matrix: School Size and Grade Distribution ............................................................................. 7
Current Research on Class Size ..................................................................................... 8 State Ranking ................................................................................................................. 9
School-Level Staffing .............................................................................................................11 Classroom Teachers .............................................................................................................11
Staffing in the Matrix ......................................................................................................11 Actual Staffing Patterns .................................................................................................13 Cost of Classroom Teachers .........................................................................................13 Expenditures from Foundation Funding .........................................................................14 Expenditures From All Funding Sources ........................................................................15 Economics Requirement ...............................................................................................17
Instructional Facilitators .........................................................................................................18
Staffing in the Matrix ......................................................................................................19 Actual Staffing Patterns .................................................................................................20 Cost of Instructional Facilitators .....................................................................................20 Expenditures From Foundation Funding ........................................................................21 Expenditures From All Funding Sources ........................................................................22
Special Education Teachers ..................................................................................................23
Staffing in the Matrix ......................................................................................................23 Actual Staffing Patterns .................................................................................................24 Cost of Special Education Teachers ..............................................................................24 Expenditures From Foundation Funding ........................................................................25 Expenditures From All Funding Sources ........................................................................26
Library Media Specialists .......................................................................................................26
Staffing in the Matrix ......................................................................................................26 Actual Staffing Patterns .................................................................................................27 Cost of Library Media Specialists ...................................................................................28 Expenditures From Foundation Funding ........................................................................28 Expenditures From All Funding Sources ........................................................................29
Counselors, Nurses and Other Pupil Support ........................................................................29
Counselors ....................................................................................................................29 Nurses ...........................................................................................................................33 Other Pupil Support Services ........................................................................................37
School-Level Administration Personnel ................................................................................39 Principals ...............................................................................................................................39
Staffing in the Matrix ......................................................................................................39 Actual Staffing Patterns .................................................................................................39 Cost of Principals ..........................................................................................................40 Expenditures From Foundation Funding ........................................................................41

Bureau of Legislative Research Project Number 14-001-27
Expenditures From All Funding Sources ........................................................................42 School-Level Secretary..........................................................................................................42
Staffing in the Matrix ......................................................................................................42 Cost of School-Level Secretaries ...................................................................................43 Expenditures From Foundation Funding ........................................................................43 Expenditures From All Funding Sources ........................................................................44
School-Level Resources ........................................................................................................45 Technology ............................................................................................................................45
Cost of Technology........................................................................................................45 Expenditures From Foundation Funding ........................................................................47 Other Technology Funding ............................................................................................48 Expenditures From All Funding Sources ........................................................................49 Indirect Technology Funding .........................................................................................50
Instructional Materials ............................................................................................................52
Cost of Instructional Materials .......................................................................................52 Expenditures From Foundation Funding ........................................................................55 Expenditures From All Funding Sources ........................................................................55
Extra Duty Funds ...................................................................................................................56
Cost of Extra Duty Funds...............................................................................................56 Expenditures From Foundation Funding ........................................................................57 Expenditures From All Funding Sources ........................................................................57
Supervisory Aides ..................................................................................................................58
Cost of Supervisory Aides .............................................................................................58 Expenditures From Foundation Funding ........................................................................59 Expenditures From All Funding Sources ........................................................................59
Substitutes.............................................................................................................................60
Cost of Substitutes ........................................................................................................60 Expenditures From Foundation Funding ........................................................................62 Expenditures From All Funding Sources ........................................................................62 Health Insurance for Substitutes ....................................................................................63
District-Level Resources ........................................................................................................64 Carry-Forward Transition .......................................................................................................64
Operations and Maintenance .................................................................................................64
Cost of Operations and Maintenance ............................................................................64 O&M Staffing Levels ......................................................................................................66 Expenditures From Foundation Funding ........................................................................67 Expenditures From All Funding Sources ........................................................................67
Central Office ........................................................................................................................68
Cost of the Central Office ..............................................................................................68 Expenditures From Foundation Funding ........................................................................70 Expenditures From All Funding Sources ........................................................................71
Transportation .......................................................................................................................71
Cost of Transportation ...................................................................................................71 Expenditures From Foundation Funding ........................................................................72 Expenditures From All Funding Sources ........................................................................73
Other Non-Matrix Expenditures .............................................................................................74
Expenditures .................................................................................................................74 Instructional Aides .........................................................................................................75

Bureau of Legislative Research Project Number 14-001-27
District Comparisons ..............................................................................................................77 Districts and Open-enrollment Charter Schools .....................................................................77
District Size ...........................................................................................................................77
Poverty Level .........................................................................................................................78
Student Achievement ............................................................................................................78
Total Per-Pupil Expenditures .................................................................................................79
Fund Balances ........................................................................................................................79
Conclusion ..............................................................................................................................80
References ..............................................................................................................................81
Appendix A: Explanation of Matrix Line Items ......................................................................84
Appendix B:Standards of Accreditation ................................................................................85

Bureau of Legislative Research Project Number 14-001-27
ACRONYMS
ACE—Arkansas Department of Career Education
ACTAAP—Arkansas Comprehensive Testing, Assessment and Accountability Program
ADE—Arkansas Department of Education
ADM—Average Daily Membership
APSCN—Arkansas Public School Computer Network
BLR—Bureau of Legislative Research
FTE—Full-Time Employee/Full-Time Equivalent
GED—General Educational Development
IDEA—Individuals with Disabilities Education Act
LEA—Local Educational Agency
LPN—Licensed Practical Nurse
NCES—National Center for Education Statistics
NSL—National School Lunch
PAM—Physical education, art and music
PARCC—Partnership for Assessment of Readiness for College and Careers
RN—Registered Nurse
SREB—Southern Regional Education Board
URT—Uniform Rate of Tax

Page 1
INTRODUCTION
Arkansas Code §10-3-2102 requires the Education Committees to “[r]eview and continue to evaluate the amount of per-student expenditure necessary to provide an equal educational opportunity and the amount of state funds to be provided to school districts, based upon the cost of an adequate education, and monitor the expenditures and distribution of state funds and recommend any necessary changes.” The law calls for this requirement to be accomplished by completing a resource allocation review. This report serves as that required review.
Arkansas's K-12 education foundation funding formula, referred to as the matrix, is used to determine the per-pupil level of foundation funding disbursed to each school district. The components of the matrix were determined originally by a 2003 study by Allan Odden, Lawrence Picus and Mark Fermanich (Picus, 2003). The levels were subsequently refined in 2006 by Allan Odden, Lawrence Picus and Michael Goetz (Picus, 2006). The matrix was not intended to reimburse schools for actual expenditures but rather to provide a methodology for determining an adequate level of funding to allow schools to meet minimum accreditation standards and adequately educate Arkansas students. This report examines school district expenditures and staffing levels in comparison with the funding level assumptions on which the foundation funding matrix is based.
DATA AND METHODOLOGY
A review of foundation funding in the context of the total funding available to districts provides perspective for an examination of districts' expenditures for resources necessary for adequacy. This report reviews the basic assumptions of the matrix funding model regarding school size and the grade distribution of students and evaluates how closely today’s schools match the matrix assumptions. It also compares FY 2012-13 school district staffing levels and expenditures with those established in the matrix formula.
FOUNDATION FUNDING EXPENDITURES
A major objective of the biennial adequacy study is to determine how school districts have spent the foundation funding they have received. To calculate district expenditures, data was extracted from a data warehouse maintained by the Arkansas Public School Computer Network (APSCN) Division of the Arkansas Department of Education (ADE). Precisely measuring districts’ foundation fund expenditures has always been hindered by the fact that there is no single expenditure code that identifies expenditures of foundation funding. Additionally school districts have a variety of funds they can use to pay for matrix items. In the district accounting system, foundation funding is placed in and spent from two funds: the Salary Matrix Fund and the Operating Matrix Fund. However, other district revenues, such as excess property tax revenue, can be comingled with current year foundation funding in these funds.
To estimate the expenditures from these funds that were made using foundation funding, the Bureau of Legislative Research (BLR) divided the total revenue in the Salary Matrix and Operating Matrix Funds for each district by the amount of foundation funding they received in FY 2012-13 ($6,267 per student) to reach a percentage. That percentage was then applied to districts’ total expenditures in each matrix line item to determine the portion of expenditures made with foundation funding.
For each matrix line, this report provides average staffing levels and expenditures for the 239 districts operating in 2013 and for the 16 open-enrollment charter schools. This report also provides the districts’ expenditures per student by district size (average daily membership, or ADM) and by the percentage of students who are eligible for free or reduced price lunch (NSL percentage). This type of analysis provides information on how spending patterns differ based on the size of a district

Page 2
or the level of poverty among its student population. The ADM and NSL percentage used for each school year is 2012-13 data. The table below provides the number of districts in each category. The data source used for district size and NSL status is ADE.
ADM # of Districts NSL % # of Districts
Small (750 or Less) 87 Low Poverty (<70%) 150
Medium (751-5,000) 137 Medium Poverty (70%-<90%) 81
Large (5,001+) 15 High Poverty (90%+) 8
This report also examines districts’ per-student expenditures based on student achievement. Districts were divided into quartiles based on the percent of students who scored proficient or advanced on state Arkansas Comprehensive Testing, Assessment and Accountability Program (ACTAAP) assessments (i.e., Benchmark and End-of-Course assessments). Each district’s proficiency on literacy assessments and on math assessments were averaged for one single proficiency calculation. The proficiency data was obtained from ADE.
Average Proficiency
Top Quartile 85.19%
2nd Quartile 79.79%
3rd Quartile 74.35%
4th Quartile 63.98%
Source:http://www.arkansased.org/public/userfiles/Public_School_Accountability/School_Performance/ESEA_Acct_Status_Reports/2013_District_Status_20131101.xlsx
EXPENDITURES FROM OTHER FUNDING SOURCES
This report also provides information on district expenditures on matrix items (e.g., classroom teachers) using funding other than foundation funds. For each matrix item, this report includes a pie chart showing the percentage of districts’ total expenditures that came from foundation funding and the percentage that came from other sources of funds.
The pie charts describe the fund sources using the following fund types:
Foundation: The portion of the unrestricted state funds that equals the matrix funding amount of $6,267 per student for the 2012-13 school year.
NSL: State categorical funding based on the percentage of students receiving free or reduced price meals.
PD: State categorical funding for professional development activities.
ALE: State categorical funding for alternative learning environments.
ELL: State categorical funding for English Language Learners.
Other State Restricted: Restricted state funds expended from the Salary and Operating Funds.
Federal Funds: Federal grant funds such as Title I expended from the Federal Grants Fund.
Building Fund: Bond proceeds, state Partnership Program facilities funding or other funds used for facilities acquisition and construction purposes.
Debt Service Fund: Generally consists of property tax revenues transferred to this fund for retirement of bonded indebtedness and interest.
Capital Outlay/Dedicated M&O: Property taxes from approved local millage for specific purposes.
Activity Fund: Admission receipts, sales, dues and fees relating to school-sponsored athletics and activities.
Food Service Fund: includes daily sales from student meals and state and federal funding for food service operations.

Page 3
DISTRICT AND SCHOOL SURVEYS
As part of the 2014 adequacy study, the BLR conducted surveys of all 238 school district superintendents and a randomly selected, representative sample of 74 school principals. This report provides the questions and responses that are related to foundation funding and the matrix. Responses to other survey questions have been or will be presented in other reports throughout the adequacy study process.
The district-level survey was conducted using an online questionnaire. The survey was distributed to the districts beginning October 28, 2013, and the last district responded January 21, 2014. The school survey was administered through interviews with principals conducted by BLR staff during site visits to the selected schools. The school visits were made beginning October 31, 2013, with the final visit on January 29, 2014. The district survey allowed the BLR to collect specific, quantitative data from all districts, while the school survey asked more open-ended qualitative questions. To elicit the most candid responses, district and school staff were assured their answers would not be individually identified, therefore responses are provided only in aggregate.
EDUCATIONAL ADEQUACY DEFINED
The Education Committees have used the following working definition of "educational adequacy" to serve as a basis for identifying the resources required for adequate funding:
(1) The standards included in the state's curriculum frameworks, which define what all Arkansas students are to be taught, including specific grade level curriculum and a mandatory thirty-eight (38) Carnegie units defined by the Arkansas Standards of Accreditation to be taught at the high school level;
(2) The standards included in the state's testing system. The goal is to have all, or all but the most severely disabled, students perform at or above proficiency on these tests; and
(3) Sufficient funding to provide adequate resources as identified by the General Assembly.

Page 4
EDUCATION FUNDING IN ARKANSAS
Arkansas schools receive many different types of funding. In 2012-13, school districts received $4,958,673,885 in total revenue. Foundation funding makes up 57.8% of that amount. The following chart illustrates the relationship of foundation funding revenue to districts' total revenue. This report addresses how foundation funds are used by districts. The chart demonstrates that significant levels of additional unrestricted revenue are available to districts to meet their adequacy needs.
State Unrestricted Revenues primarily consist of property tax revenues and the state aid portion of foundation funding. Other types of unrestricted state funds include student growth funding, declining enrollment funding, isolated funding and other local revenue sources. School districts have broad authority to spend these funds for their educational needs.
25 Mills Uniform Rate of Tax is included in the state unrestricted revenues classification. This category includes the URT portion of foundation funding, amounts that may be transferred to the Building Fund or Debt Service Fund, amounts that are part of dedicated millage and amounts that may be used for other operational costs.
State Restricted Funds include funds such as NSL and other categorical funds, Magnet School Programs, Early Childhood Education, Adult Education, Career Education, Special Education, funding for Educational Service Cooperatives, Academic Facilities funding and other grants for specific programs.
Federal Revenues include Title I funding, IDEA, Part B funding, Improving Teacher Quality Grants, School Lunch and Breakfast grant funds and other federal grant funding.
Other Funding Sources include the sale of bonds for construction activities, loans, insurance compensation for loss of assets, other gains from disposals of assets and other miscellaneous funding.
Other Unrestricted $828.35 16.71%
State Restricted
$566.20 11.42%
Federal Restricted
$565.78 11.41%
Other Sources $133.02 2.68%
State Foundation Aid
$1,833.06 36.97% 25 Mills URT
$1,004.07 20.25%
Miscellaneous $10.95 0.22%
98% Shortfall $17.20 0.35%
Foundation $2,865.28 57.78%
In Millions
Foundation Revenue

Page 5
FOUNDATION FUNDING OVERVIEW
Foundation funding is the building block of public education funding in the state of Arkansas (A.C.A. § 6-20-2301 et seq.). Every year the state distributes foundation funding to each school district on a per-student basis. Foundation funding is unrestricted, meaning the state does not specify what school districts may or may not purchase with it. This policy is intended to provide flexibility for the specific needs of each school district, allowing some districts to spend more on teacher salaries, for example, while other districts may have higher transportation needs.
Foundation funding is funded by two main components: the Uniform Rate of Tax (URT) and state foundation aid. The URT is a constitutionally mandated minimum millage rate (or property tax rate) that school districts must levy at the local level. This rate is set at 25 mills and is used specifically for the maintenance and operations of schools. State aid is then provided to make up the difference between the amount of money raised through the URT and the funding level set by the Legislature. For example, if a district’s URT generated $2,267 per student in 2012-13, the district would have received an additional $4,000 in state foundation funding aid, for a total of $6,267. (Eight districts in 2012-13 collected more than $6,267 in URT and therefore received no state aid.)
Foundation funding is distributed based on a school district’s average daily membership (ADM), which is the calculation for a district’s total number of students. Each school district receives the foundation funding amount set for each year multiplied by its prior year ADM. For example, the foundation funding rate was $6,267for the 2012-2013 school year. If a school district’s ADM was 530, its funding would be determined by multiplying $6,267 by 530 for a total of $3,321,510. Typically, this funding makes up about 58% of districts’ total revenue. (Districts also receive federal funding, as well as other types of state money, including categorical funding.)
The Matrix
Arkansas uses a specific formula, known as the matrix, to arrive at the per-student funding amount. The matrix calculates the per-student funding based on the cost of personnel and other resources needed to operate a prototypical school of 500 students. Each year legislators involved in the adequacy study determine the dollar amount needed to fund each line item of the matrix, based on the money needed to adequately fund school districts’ educational needs. Unlike the foundation funding amount ($6,267 for 2012-13), the matrix is not established in statute. Instead, it is used as a tool to set the foundation funding rate. The matrix is divided into two basic sections: 1.) the number of people needed for the prototypical school of 500 students, and 2.) the cost of all needed resources. The first section describes the 35.665 school-level personnel needed for the prototypical school.
Matrix Item FTE
Classroom Teachers
Kindergarten 2.00
Grades 1-3 5.00
Grades 4-12 13.80
Non-Core 4.14
Subtotal 24.94
Pupil Support Staff
Special Education 2.90
Instructional Facilitators 2.50
Library Media Specialist 0.825
Counselors & Nurses 2.50
Subtotal 8.725
Administration
Principal 1.00
Secretary 1.00
Total 35.665

Page 6
The second section of the matrix specifies the cost of the staff described in the first section of the matrix, as well as the cost of all other needed resources. The matrix is divided into three cost categories:
1. School-level salaries of teachers and other pupil support staff, a principal and a secretary. The matrix also identifies the salaries for the school-level staff and calculates the per-student cost of paying the identified salaries for the number of staff needed.
2. School-level resources including instructional materials and technology-related expenses.
3. District-level resources, which include
funding for operations & maintenance, districts’ central offices and transportation expenses.
School-Level Resources Per-Student Cost
Technology $217.60
Instructional Materials $176.70
Extra Duty Funds $55.20
Supervisory Aides $54.70
Substitutes $64.00
School-Level Salaries
Salary & Benefits
Per-Student Cost
Classroom Teachers $60,566 $3,021.03
Pupil Support Staff $60,566 $1,056.90
Principal $95,102 $190.20
Secretary $38,334 $76.70
District-Level Resources Per-Student Cost
Operations & Maintenance $629.00
Central Office $415.10
Transportation $309.90
Teacher Salaries + Benefits, $4,077.90
Principal Salaries+Benefit
$190.20
School-Level Secretaries, $76.70
Technology, $217.60
Instructional Materials, $176.70
Extra Duty Funds, $55.20
Supervisory Aides, $54.70
Substitutes, $64.00
Operations and Maintenance,
$629.00
Central Office, $415.10
Transportation, $309.90
Per-Student Foundation Funding: 2012-13
School-Level Resources
District-Level Resources
School-Level Salaries
Total $6,267

Page 7
MATRIX: SCHOOL SIZE AND GRADE DISTRIBUTION
In their 2003 report to the Legislature, Picus and Associates recommended basing the state's funding model on the amount of funding and staffing needed to operate a prototypical school of 500 students. The original matrix was calculated based on that recommended school size. After a thorough review in 2006, the consultants concluded again that the use of 500 students as the base school size is a valid model for per-pupil funding, and in 2007, the method of funding was held constitutional by the Arkansas Supreme Court.
The following table shows that 70% of the schools in FY 2012-13 (including open-enrollment charter schools) have fewer than 500 students, while 30% have 500 or more students. The size of schools has been fairly consistent for the past decade.
School Size: Regular Districts
# of Students
Base for Matrix 2004-05 2011-12 2012-13 2013-14
# of schools
% # of
schools %
# of schools
% # of
schools %
100 or less 58 5% 39 4% 36 3% 42 4%
101-249 229 21% 194 18% 197 19% 196 18%
250-349 228 21% 227 21% 210 20% 203 19%
350-499 271 25% 295 28% 295 28% 289 27%
500 or more 320 29% 314 29% 324 31% 339 32% Note: Percents do not add to 100% because of rounding.
An individual school does not typically have grades K-12, but for the purpose of establishing a model, the prototypical school of 500 is assumed to have 40 kindergarten students, 115 students in grades one through three (38.3 per grade), and 345 students in grades four through 12 (38.3 per grade). This assumption is necessary because the funding model must account for the different staffing levels required for each of these grade groupings.
While the matrix was designed for schools with 500 students, its classroom teacher staffing assumptions concerning grade distribution for K through 12 can be compared with school districts. The following table shows that just 16% of districts have fewer than 500 students. In 2012-13, the average district size in Arkansas was 1,930 ADM.
2012-13 District Size
# of Students # of Districts %
350-499 37 16%
500-999 85 36%
1,000-2,499 71 30%
2,500-4,999 31 13%
5,000 or more 14 6%
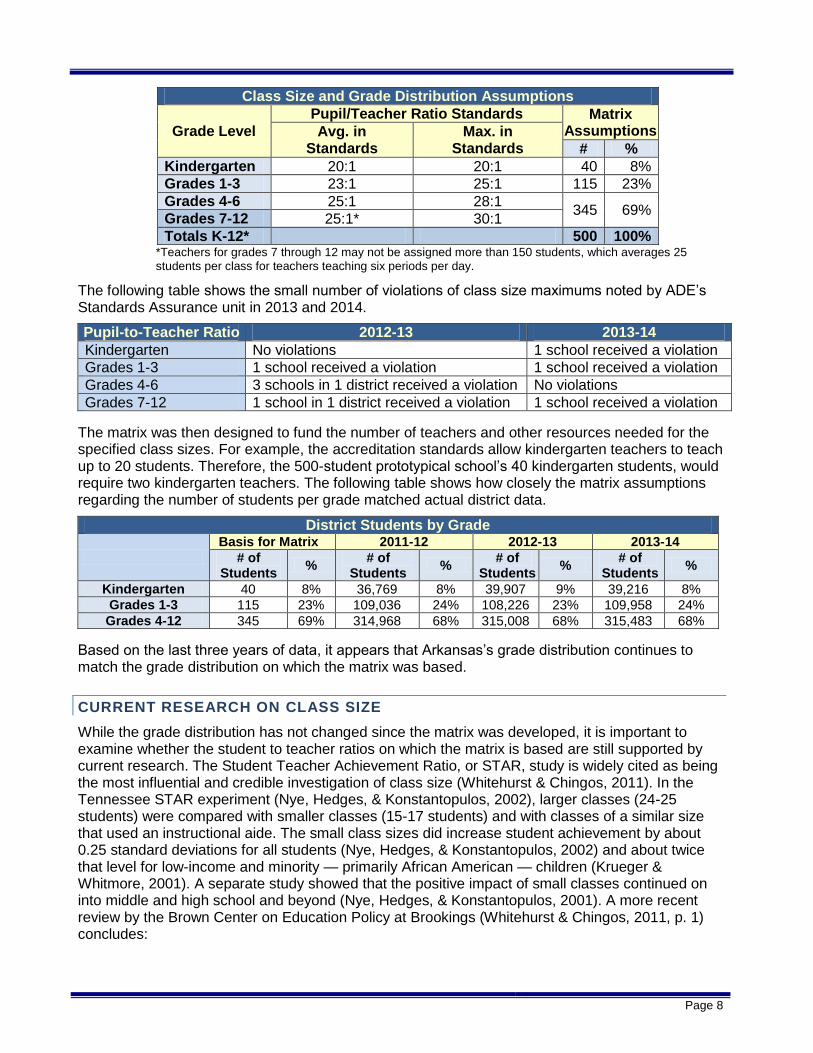
In 2003 and 2006, Picus and Associates recommended developing the matrix based on class sizes of 15 students per class for grades K-3, or an average of 18 students per class for grades K-5. They also recommended a matrix that supported class sizes of 25 students for middle and high school classes. The Arkansas Joint Legislative Committee on Educational Adequacy, however, opted to base the matrix on the state’s existing class size standards (Arkansas Department of Education’s Rules Governing Standards for Accreditation of Arkansas Public Schools and School Districts). The standards limit class sizes to a maximum of 20 students per kindergarten class, 25 students for grades 1-3, 28 students for grades 4-6 and 30 for grades 7-12.
Page 8
Class Size and Grade Distribution Assumptions
Grade Level
Pupil/Teacher Ratio Standards Matrix Assumptions Avg. in
Standards Max. in
Standards # %
Kindergarten 20:1 20:1 40 8%
Grades 1-3 23:1 25:1 115 23%
Grades 4-6 25:1 28:1 345 69%
Grades 7-12 25:1* 30:1
Totals K-12* 500 100% *Teachers for grades 7 through 12 may not be assigned more than 150 students, which averages 25 students per class for teachers teaching six periods per day.
The following table shows the small number of violations of class size maximums noted by ADE’s Standards Assurance unit in 2013 and 2014.
Pupil-to-Teacher Ratio 2012-13 2013-14
Kindergarten No violations 1 school received a violation
Grades 1-3 1 school received a violation 1 school received a violation
Grades 4-6 3 schools in 1 district received a violation No violations
Grades 7-12 1 school in 1 district received a violation 1 school received a violation
The matrix was then designed to fund the number of teachers and other resources needed for the specified class sizes. For example, the accreditation standards allow kindergarten teachers to teach up to 20 students. Therefore, the 500-student prototypical school’s 40 kindergarten students, would require two kindergarten teachers. The following table shows how closely the matrix assumptions regarding the number of students per grade matched actual district data.
District Students by Grade
Basis for Matrix 2011-12 2012-13 2013-14
# of Students
% # of
Students %
# of Students
% # of
Students %
Kindergarten 40 8% 36,769 8% 39,907 9% 39,216 8%
Grades 1-3 115 23% 109,036 24% 108,226 23% 109,958 24%
Grades 4-12 345 69% 314,968 68% 315,008 68% 315,483 68%
Based on the last three years of data, it appears that Arkansas’s grade distribution continues to match the grade distribution on which the matrix was based.
CURRENT RESEARCH ON CLASS SIZE
While the grade distribution has not changed since the matrix was developed, it is important to examine whether the student to teacher ratios on which the matrix is based are still supported by current research. The Student Teacher Achievement Ratio, or STAR, study is widely cited as being the most influential and credible investigation of class size (Whitehurst & Chingos, 2011). In the Tennessee STAR experiment (Nye, Hedges, & Konstantopulos, 2002), larger classes (24-25 students) were compared with smaller classes (15-17 students) and with classes of a similar size that used an instructional aide. The small class sizes did increase student achievement by about 0.25 standard deviations for all students (Nye, Hedges, & Konstantopulos, 2002) and about twice that level for low-income and minority — primarily African American — children (Krueger & Whitmore, 2001). A separate study showed that the positive impact of small classes continued on into middle and high school and beyond (Nye, Hedges, & Konstantopulos, 2001). A more recent review by the Brown Center on Education Policy at Brookings (Whitehurst & Chingos, 2011, p. 1) concludes:

Page 9
“Because the pool of credible studies is small and the individual studies differ in the setting, method, grades, and magnitude of class size variation that is studied, conclusions have to be tentative. But it appears that very large class-size reductions, on the order of magnitude of 7-10 fewer students per class, can have significant long-term effects on student achievement and other meaningful outcomes. These effects seem to be largest when introduced in the earliest grades, and for students from less advantaged family backgrounds.
When school finances are limited, the cost-benefit test any educational policy must pass is not “Does this policy have any positive effect?” but rather “Is this policy the most productive use of these educational dollars?” Assuming even the largest class-size effects, such as the STAR results, class-size mandates must still be considered in the context of alternative uses of tax dollars for education.”
While there is evidence that early grades (K-3) benefit more from smaller classes (15-23) than upper grades, there are no consistent findings regarding exact numbers in class size (Whitehurst & Chingos, 2011).
STATE RANKING
The National Center for Education Statistics (NCES) calculates the average class size in each state each year. The most recent data available is for 2011-12. Average class size represents the average number of students assigned to a class for instruction. With an average class size of 20.4 in the elementary grades, Arkansas ranks 9th among the 16 Southern Regional Education Board (SREB) states and 5th among surrounding states.
Elementary Grades (Pre-K-Grade 5)
SREB States Avg. Class
Size SREB States
Avg. Class Size
Surrounding
States Avg. Class
Size
1. 1. Tennessee 17.7 9. Arkansas 20.4 1. Tennessee 17.7
2. Texas 18.2 9. Virginia 20.4 2. Texas 18.2
3. West Virginia 18.7 11. Oklahoma 20.7 3. Louisiana 19.0
4. North Carolina 18.8 12. Georgia 21.0 4. Missouri 20.2
5. Louisiana 19.0 13. Mississippi 21.6 5. Arkansas 20.4
6. South Carolina 19.1 2. 14. Kentucky 23.3 6. Oklahoma 20.7
7. Alabama 19.2 Maryland NA 7. Mississippi 21.6
8. Delaware 20.3 Florida NA
In the higher grades, Arkansas’s average class size ranks and 6th among SREB states and 4th among surrounding states.
Secondary Grades (Grades 6-12)
SREB States Avg. Class
Size SREB States
Avg. Class Size
Surrounding
States Avg. Class
Size
1. Mississippi 22.8 9. South Carolina 26.0 1. Mississippi 22.8
2. Louisiana 23.4 10. Kentucky 26.6 2. Louisiana 23.4
3. Oklahoma 23.7 11.Tennessee 26.9 3. Oklahoma 23.7
4. Virginia 23.8 11.Texas 26.9 4. Arkansas 25.4
5. West Virginia 24.0 13. Alabama 27.4 5. Missouri 26.8
6. Arkansas 25.4 14. Georgia 27.5 6. Tennessee 26.9
7. North Carolina 25.8 Florida NA 6. Texas 26.9
7. Delaware 25.8 Maryland NA
Source: National Center for Education Statistics, Table 209.30 Highest degree earned, years of full-time teaching experience and average class size for teachers in public elementary and secondary schools, by state: 2011-12 http://nces.ed.gov/programs/digest/d13/tables/dt13_209.30.asp

Page 10
NCES also calculates each state’s pupil-to-teacher ratios. Using this measure, Arkansas ranks 2nd among surrounding states and 3rd among SREB states.
Surrounding States Total Students
Full-Time Equivalent (FTE)
Teachers Pupil/Teacher
Ratio
1. Missouri 916,584 66,251.53 13.83
2. Arkansas 483,114 33,982.96 14.22
3. Louisiana 703,390 48,657.02 14.46
4. Tennessee 999,693 66,381.70 15.06
5. Mississippi 490,619 32,006.66 15.33
6. Texas 5,000,470 324,281.97 15.42
7. Oklahoma 666,120 41,349.40 16.11
SREB States Total Students
Full-Time Equivalent (FTE)
Teachers Pupil/Teacher
Ratio
1. Virginia 1,257,883 90,831.79 13.85
2. West Virginia 282,870 20,247.47 13.97
3. Arkansas 483,114 33,982.96 14.22
4. Louisiana 703,390 48,657.02 14.46
5. Maryland 854,086 57,589.05 14.83
6. Delaware 128,946 8,587.21 15.02
7. Tennessee 999,693 66,381.70 15.06
8. Georgia 1,685,016 111,133.30 15.16
9. Florida 2,668,156 175,006.30 15.25
10. Mississippi 490,619 32,006.66 15.33
11. Texas 5,000,470 324,281.97 15.42
12. North Carolina 1,507,864 973,08.09 15.50
13. South Carolina 727,186 46,782.20 15.54
14. Alabama 744,621 47,722.67 15.60
15. Oklahoma 666,120 41,349.40 16.11
16. Kentucky 681,987 41,859.68 16.29
Source: National Center for Education Statistics, State Enrollments/Teacher Counts http://nces.ed.gov/ccd/elsi/expresstables.aspx?bridge=quickFacts&tableid=12&level=State&year=2011-12

Page 11
SCHOOL-LEVEL STAFFING
The first component of the matrix is school-level staffing. This component is made up of 24.94 full time classroom teachers and another 8.725 pupil support staff. This matrix component also includes one principal and one school-level secretary, for a total of 35.665 school-level full-time employees (FTEs). Funding for the total school-level personnel group ($4,344.80 in FY13) constitutes 69% of the per-pupil funding contained in the matrix.
The school-level staffing can be broken down into three categories: classroom teachers, pupil support staff and administration.
Matrix Item FTEs
Classroom Teachers
Kindergarten 2.0
Grades 1-3 5.0
Grades 4-12 13.8
Non-Core 4.14
Subtotal 24.94
Pupil Support Staff
Special Education 2.9
Instructional Facilitators 2.5
Library Media Specialist 0.825
Counselors & Nurses 2.5
Subtotal 8.725
Administration
Principal 1
Secretary 1
Total 35.665
CLASSROOM TEACHERS
The first section of the school level staffing is classroom teachers. About 70% of the total 35.665 FTE school-level personnel funded in the matrix are classroom teachers who have direct daily interaction with students. Research studies have demonstrated that teachers influence student learning more than any other single factor within the school context, and the effects of teaching on student achievement are cumulative (Daley & Kim, 2010; Rand Corporation, 2012; Rowan, Correnti, & Miller, 2002).
STAFFING IN THE MATRIX
Classroom teachers are divided into two categories in the matrix: core teachers and non-core teachers.
Core teachers include teachers whose primary responsibility in lower grades is to serve as the primary classroom teacher. In higher grades, core teachers teach in one or more of four academic areas: language arts, math, science, and social studies. The staffing levels established in the matrix were developed in the original 2003 funding study based on the average class size staffing requirements established by ADE’s Rules Governing Standards for Accreditation of Arkansas Public Schools and School Districts (state accreditation standards). The accreditation standards require districts to provide instruction to elementary and middle school students annually in language arts, math, social studies and science.
For high school students, districts are required to teach the core courses listed in the table to the right each year.
Grades K-8
Language Arts Math
Social Studies Science
Grades 9-12
Language Arts 6 units Math 6 units
Science 5 units Social Studies 4 units

Page 12
In 2003, Picus and Associates also considered the recommendations from local panels of education professionals and research on best practices to calculate adequate staffing levels. The resulting matrix staffing and funding levels were confirmed in the subsequent 2006 study and were components of the funding system that the Arkansas Supreme Court found constitutional.
The second group, referred to in this report as non-core teachers, includes educators who teach physical education, art, or music (PAM), or other electives. These teachers have also been called "specialist teachers." The state public school accreditation standards require districts to provide instruction to elementary and middle school students annually in each of the following areas:
Grades K-4 Grades 5-8
Tools for Learning (e.g., research skills), Fine Arts, Health & Safety Education, Physical Education
Practical Living Skills/Career Exploration Career & Technical Education
For high school students, districts are required to teach the following non-core courses annually.
Grades 9-12
Foreign Language 2.0 units Health & Safety .5 units
Fine Arts 3.5 units Physical Education 1.0 unit
Computer Applications 1.0 unit Career & Tech 9.0 units
Economics .5 units
State law further specifies that elementary schools (grades 1-6) must provide 40 minutes of visual arts instruction and 40 minutes of music instruction each week to students (§6-16-130), or about 2% each of the 30 hours of required weekly instructional time. Elementary and middle schools (grades K-8) are required to provide 60 minutes per week of physical education, or about 3% of the total required hours (§6-16-132). These requirements were a common topic discussed by principals during the BLR’s interviews with school principals. The school survey asked principals in the 74 schools visited “what state or federal laws, or ADE rules, should be changed or eliminated, and why?” Nine of 74 respondents in the survey stated that they needed more flexibility in scheduling music, art, and physical education (PE) classes. Some respondents suggested that they should be able to prioritize time for math and literacy instruction in the schedule above these non-tested subjects.
The 2003 and 2006 Picus and Associates studies recommended that the state calculate the number of non-core teachers needed at 20% of the total core academic teachers. The consultants reasoned that core teachers need one period per day for collaborative planning and professional development, which they could receive when students are in elective classes. Arkansas state law requires each teacher to be allowed at least 200 minutes per week to schedule time for conferences and instructional planning. The planning time must be occur in increments of no less than 40 minutes during the instructional day (§6-17-114).
The 20% calculation was based on a regular five-hour teacher instructional day at the elementary level and five-period day at the high school level. Twenty percent of 20.8 core teachers is 4.16 (4.14 is the number in the matrix as a result of rounding adjustments) non-core teachers per 500 students.
Matrix Item
Type Average
Class Size # of Students
in Matrix FTE Teachers
in Matrix
Classroom Teachers
Core
Kindergarten 20 40 2.0
Grades 1-3 23 115 5.0
Grades 4-12 25 345 13.8
Matrix Item Type FTE Teachers in Matrix
Classroom Teachers
Core English Language Arts, Math, Social Studies and Science
20.8
Non-Core
Physical Education, Art, Music and other electives
4.14, or 20% of Core

Page 13
ACTUAL STAFFING PATTERNS
The APSCN data system does not allow for analysis of classroom teachers full-time employees (FTEs) by the type of courses they teach. Therefore, the data in this report include both core and non-core teachers. The average number of combined classroom teachers is just slightly lower than the staffing level established in the matrix. The following table compares the number for classroom teachers in the matrix with the average number of classroom FTEs paid from foundation funds.
Large districts use foundation funding to employ about six fewer teachers per 500 students than small districts. This may result from larger districts’ ability to gain greater efficiencies with more students. There was less difference in the numbers of teachers employed by districts of differing levels of poverty. High poverty districts had two additional classroom teachers funded by foundation funding than districts with the lowest level of poverty.
By District Size By Poverty Level
2012-13 Foundation Paid Staff Per 500
2012-13 Foundation Paid Staff Per 500
Small (750 or Less) 28.04 Low Poverty (>70%) 24.83
Medium (751-5,000) 25.84 Medium Poverty (70%-<90%) 24.98
Large (5,001+) 22.66 High Poverty (90%+) 26.82
COST OF CLASSROOM TEACHERS
For school-level staff, the matrix specifies not only the numbers of needed employees, but how much those employees typically cost. The 2012-13 matrix used a base salary for teachers of $48,356. An additional 22% of that amount is added for fringe benefits (14% for retirement and 8% for Social Security, Medicare, unemployment, and workers’ compensation) and a flat rate of $1,572 for health insurance ($131 for 12 months). Act 1446 of 2013 gave the Arkansas Teacher Retirement System the authority to increase the employer contribution percentage to 15%, but in February 2014, system trustees voted to continue charging 14%.
2012-13
Teacher Salary in Matrix $48,356
Retirement $6,770
Social Security, Medicare, Unemployment, Workers’ Compensation $3,868
Health Insurance $1,572
Total = Salary + Fringe $60,566
This total compensation amount of $60,566 is multiplied by the 24.94 classroom teachers needed for a 500-student school. On a per-student basis [calculated as ($60,566*24.94)/500], classroom teacher compensation makes up about $3,021 per student.
BACKGROUND
During the Lake View lawsuit, the courts cited Arkansas’s comparatively low teacher salaries and wide wage disparities among districts in the state. In 2003, the Arkansas General Assembly addressed these concerns by passing new taxes to generate additional funding for a variety of educational reforms, including a raise for teachers. Act 59 of the Second Extraordinary Session of 2003 raised the statutory minimum salary nearly 26% and increased the other steps of the salary schedule by 20-25%. For 2004-05, the average salary used in the matrix formula was set at $39,000 and each subsequent year a cost-of-living adjustment has been applied.
Classroom Teachers in Districts
Matrix FTE
Number Per 500 Foundation Paid
Staff Per 500
2011-12 24.94 24.63
2012-13 24.94 24.90

Page 14
The actual average teacher salary for school districts for FY 2012-13 was $47,316, or $1,040 below the salary provided through the matrix. (This actual average salary includes teachers paid with districts’ foundation funds as well as teachers who are paid with other funding sources, excluding federal funds). If Arkansas’s actual average salary for 2012-13 had equaled the average teacher salary in the matrix, Arkansas would have ranked 2nd among surrounding states and 7th among SREB states in average teacher salary.
In 2012-13, the majority of districts (203 of the 239 districts) had averages below the teacher salary in the matrix. In other words, the funding districts received exceeded the salaries they actually paid in 85% of districts in the state. Additionally, higher salaries in larger districts appear to be driving the statewide average salary higher. The 24 districts (10%) with the highest teacher salary averages employ over one-third (34.7%) of the FTE teachers in the state.
The actual average salary for open-enrollment charter schools, $36,131, is significantly lower than the average salary for school districts, and it is $12,225 less than the average salary in the matrix. All but one open-enrollment charter school in 2012-13 had been granted waivers from the statute setting the minimum teacher salary schedule. As a result, these charter schools are not required to pay the minimum salary of $29,244.
EXPENDITURES FROM FOUNDATION FUNDING
In 2013, districts statewide spent nearly $1.3 billion of their foundation funds on classroom teachers. This equates to approximately $2,841.31 per student, or nearly $180 less than the foundation funding rate. Open-enrollment charter schools spent $2,414.08 per student, or about $607 less than the matrix amount.
Classroom Teachers: Foundation Funding and Expenditures
District Funding District Expenditures
2011-12 $1,354,493,587 $1,271,053,688
2012-13 $1,381,230,972 $1,299,078,881
While large districts employed fewer teachers using foundation funding than smaller districts, they actually spent more on those teachers, as shown in the following chart. This reflects the higher salaries that larger districts tend to pay. High poverty districts spent less of their foundation funding on classroom teachers than lower poverty districts. This may be a reflection of the other types of funding that high poverty districts have to spend on teachers’ salaries, including National School Lunch state categorical funding. Additionally six of the eight districts in the highest poverty group are considered high-priority districts, which means the state pays every teacher in those districts an annual bonus of between $3,000 and $5,000 on top of their regular salary. Despite these additional resources, the high poverty districts had an average teacher salary of $42,493 (excluding one district whose classroom teacher FTE count, which is necessary to calculate the average salary, is thought to have been reported incorrectly). That salary is about $4,800 lower than the state average for 2012-13. This lower average salary may result from having less experienced staff who are paid at the lower steps of the salary schedule. Of the eight districts with more than 90% of students qualifying for free or reduced price lunch, only one uses the statutory minimum salary in its salary schedule.
The pattern of per-student spending based on district student achievement level follows a pattern similar to the spending based on concentrations of poverty. The lowest achieving districts spent less foundation funding per student on classroom teachers than the highest achieving districts. All of the districts in the highest poverty group are also in the lowest achieving group.

Page 15
EXPENDITURES FROM ALL FUNDING SOURCES
In addition to foundation funding, districts receive a variety of other sources of funding that can be used for teacher salaries. Districts used foundation funding to pay for 80% of the total cost of classroom teacher salaries, but they also used another $319.3 million in other types of funding to pay for teachers. The chart below shows the district expenditures for classroom teachers by the type of funding used.
The following chart shows districts’ total expenditures for classroom teachers over the previous five years. Districts have steadily increased their spending on classroom teachers each year with a slight spike in spending in 2011. This jump is likely due to the availability of federal stimulus funding to use from the American Recovery and Reinvestment Act. Spending on classroom teachers using federal funds increased 70% between 2010 and 2011.
$2,8
41
$2,3
87
$2,7
55
$2,8
32
$2,8
79
$2,8
96
$2,7
19
$2,6
19
$2,9
38
$2,8
76
$2,8
87
$2,6
35
Matrix Funding
$3,021.00
$0
$500
$1,000
$1,500
$2,000
$2,500
$3,000
$3,500
$4,000
Per
Stu
dent
District Size Poverty Student Achievement
Foundation Funding Expenditures Per Student Classroom Teachers
Matrix Funding Amount
Foundation $1,299,078,881
$151,559,539
$37,848,941
$27,179,214
$7,537,732
$39,381,806
$55,081,165
$732,690
2012-13 District Expenditures for Classroom Teachers
Foundation
Other State Unrestricted
NSL
ALE
ELL
Other State Restricted
Federal Funds
Activity Fund

Page 16
CAREER AND TECHNICAL EDUCATION FUNDING
Foundation funding is not the only source of funds intended to cover elective courses. The General Assembly appropriates about $20.4 million to the Department of Career Education (ACE) for K-12 career and technical education provided by 24 secondary technical centers. (According to ACE, only $20.1 million of this appropriation was actually funded in 2012-13.) The secondary technical centers are sponsored by high schools, education service cooperatives, or two-year colleges and are designed to serve high school students within a defined geographical region. Technical centers draw students from multiple high schools, allowing them to provide high-cost career and technical programs that local high schools could not otherwise afford to offer, such as welding, criminal justice, and construction trades courses. Students most often travel to secondary technical centers to take these courses, but a limited selection of these courses may be offered on some primary high school campuses. Currently, there are 24 area centers offering 48 different student programs. Sixteen of these centers are on post-secondary campuses, and eight exist on high school campuses. Sixty-eight high schools do not have access to a secondary area technical career center, according to the Department of Career Education (ACE). In 2012-13, 178 school districts sent 8,933 students to secondary technical centers for courses. However, all high schools are required to have at least nine career and technical courses taught in three occupation areas.
ACE distributes the $20.1 million in two parts. The department provides school districts with $3,250 per full-time equivalent student (FTE) based on each district’s prior-year enrollment in career education courses provided by the tech centers. This per-student amount is specified in statute and has remained unchanged since it was first established through Act 59 of 2003. Funding is also provided for students considered to be less than 1 FTE at the rate of $1,625 for 1/2 FTE, $1,083 for 1/3 FTE, and $541 for 1/6th FTE. For the 2012-13 school year, funding was provided for 2,942.5 FTE students, and the total amount paid to the schools was $9,464,290.04. This funding is considered pass-through funding because each year the secondary technical centers bill participating high schools for student training fees based on the previous year’s FTE count.
After all of these reimbursements are paid to districts, ACE sends the remaining funds directly to the secondary technical centers for program operation and administration expenses. This funding is distributed to each technical center based on the FTE student count of each center. In 2013, this portion of the funding totaled $10,672,092.96, which averaged about $3,600 per FTE. In 2012-13, ACE spent a total of $20,136,362 in vocational center grants.
$1,407 $1,415 $1,396 $1,428 $1,451
$43 $41 $41
$42 $38 $21 $22
$23
$27 $27
$8 $8
$8
$9 $8 $26 $38
$40
$43 $39 $57
$72 $122 $70 $55
$1,250
$1,300
$1,350
$1,400
$1,450
$1,500
$1,550
$1,600
$1,650
2009 2010 2011 2012 2013
Millio
ns
Districts Expenditures for Classroom Teachers,
by Funding Source
State Unrestricted NSL ALE ELL Other State Restricted Federal Funds Activity Fund

Page 17
The General Assembly also appropriates $2.37 million to help new career education programs purchase a minimum level of equipment. This funding is typically provided to school districts, but secondary tech centers are also eligible. In 2012-13, ACE spent a total of $2,369,210 in vocational start-up grants.
ECONOMICS REQUIREMENT
In 2009 the Department of Education added a requirement that all students must take a ½ unit of economics to graduate, beginning with the class of 2013-14. The economics course can be counted toward students’ three required social studies credits. Because this change required districts to offer economics, the BLR sought information from districts about whether they made changes to their course offerings to accommodate this new requirement. The district survey first asked districts if they added any sections of high school economics between 2008-09, before the requirement was added, and 2013-14 to ensure that the graduating class could meet the economics graduation requirement. Nearly 90% of districts said the requirement caused them to add economics to their course offerings. Seven districts did not provide an answer.
Added Economics Section(s)?
Number of Districts
% of Districts
No Response 7 3%
No 18 8%
Yes 213 89%
District Survey Question: Did your district eliminate any social studies or career focus sections between 2008-09 and the current year due to the addition of the ½ credit economics requirement?
More than two-thirds of districts indicated that they did not eliminate any social studies or career focus sections in the previous five years due to the requirement that they add a ½ credit of economics.
If yes, how many? Please list the course names of the sections dropped.
Collectively, the 64 districts that reported eliminating some social studies or career focus sections said they stopped offering 324.5 sections of social studies or career focus.
The survey allowed districts to list the courses they dropped to accommodate the added economics section, and allowed them to list as many as necessary. Of the 64 districts that indicated they dropped a course, the vast majority (45 districts) indicated that they dropped a section of Civics/American government. Many of these districts indicated that they reduced Civics from being a year-long course to a semester-long course. Seven districts said they dropped Contemporary American History or Pre-AP American History, six dropped Sociology, four dropped Psychology, three dropped World Geography, one dropped Arkansas History and another dropped Global Studies. Two of the 64 districts did not specify what sections were dropped.
Number of Districts
% of Responding Districts
Yes 64 27%
No 164 69%
No Response 10 4%
Sections Eliminated
Number of Districts
.5-3 45
4-10 6
11-20 10
20+ 3

Page 18
INSTRUCTIONAL FACILITATORS
An instructional facilitator is a staff member who helps teachers plan, develop and evaluate instruction. Instructional facilitators may be referred to as “academic coaches,” “specialists” and “curriculum supervisors.” Among their many responsibilities, instructional facilitators perform the following functions:
Demonstrate lessons in curriculum and teaching techniques for classroom teachers and others
Facilitate communication about research-based instructional practices and student achievement between and among teachers, within and across grade levels
Assist in the implementation of the components of the Arkansas Comprehensive School Improvement Planning (ACSIP) process
Plan and provide professional development for classroom teachers by conducting formal workshops, group discussions and one-on-one mentoring
Assist teachers in analyzing classroom and state assessment data to inform instruction
Leadership in curriculum and teaching is significantly enhanced by instructional facilitators or academic coaches. Instructional facilitators play a critical role in organizing and facilitating professional learning communities, and modeling instruction, observing teaching, and providing feedback based on classroom observation (Cornett & Knight, 2008; Odden, 2009). Instructional facilitators must have a thorough grasp of their specialty to train teachers, and therefore, schools need three facilitators to cover math, literacy, and science. To better understand the importance of instructional facilitators to school district administrators, the BLR posed the following question on the district survey.
District Survey Question: How important are instructional facilitators (academic coaches) to student achievement gains?
More than three-quarters of the districts consider instructional facilitators either “very useful” or “essential.” However, 32 districts (14%) said they did not have any instructional facilitators.
The BLR also asked about instructional facilitators in its survey of 74 school principals. In the interviews, each school was asked about the services provided by instructional facilitators.
Although approximately 19% of the schools surveyed did not use instructional facilitators, most of the schools (81%) reported the utilization of their services. While the amount of time spent by each instructional facilitator fluctuated depending on funding and needs of the school or district, the BLR found that most of the schools surveyed reported similar services were being provided in each school. For example, respondents frequently reported that the instructional facilitators modeled instructions or lesson plans, demonstrated how to work with students, provided feedback, observed classroom teaching, mentored new/non-tenured teachers, showed co-teaching techniques, and helped with Common Core training.
In addition to their work with the teachers, instructional facilitators also worked with students. These activities included: pull-outs, small group instruction, co-teaching , and one-on-one student interactions. Instructional facilitators also provided leadership support for school administrators. Some of the schools reported that instructional facilitators led professional learning community group meetings, met with the principal to discuss the Arkansas Comprehensive School Improvement Plan (ACSIP), and some held meetings to discuss pre/post teacher conference observations.
Districts
Giving This Response
% of Responding
Districts
Not very useful 0 0%
Useful 28 12%
Very useful 64 27%
Essential 113 48%
No instructional facilitators 32 14%
No response 1 NA

Page 19
STAFFING IN THE MATRIX
The instructional facilitator line of the matrix provides $302.83 per student to support 2.5 employees. Those 2.5 staff members allow for a half-time assistant principal (.5 FTE) and a half-time technology coordinator (.5 FTE).
BACKGROUND
In 2003, Picus and Associates recommended providing funding for 2.5 instructional facilitators per 500 students. They noted that instructional facilitators “coordinate the instructional program, and provide the important ongoing coaching and mentoring that the professional development literature shows is so critically necessary for teachers to change and improve their instructional practice” (Picus, 2003, p. 23). They also noted that “[c]urriculum and instructional adaptation requires the support of a specially trained coach at the building level,” an important consideration today as districts take on the Common Core State Standards (Picus, 2003, p. 30).
In Arkansas, teachers who currently serve as instructional facilitators are not required to have any special licensing beyond the standard teaching license. The state can grant an endorsement for teachers who want to add it, but instructional facilitators are not required to obtain it. In fact, just nine people in the state have an instructional facilitator endorsement.
A position similar to an instructional facilitator is a curriculum administrator or curriculum supervisor. Individuals who serve as curriculum administrators may have a curriculum administrator license, in addition to their standard teaching license. Districts are not required to hire licensed curriculum administrators, but if they enter an employee in the APSCN system as a curriculum administrator, that individual must have an appropriate license. There are currently 1,220 licensed curriculum administrators, according to ADE.
In addition to instructional facilitators, Picus and Associates noted in 2003 that the recommended 2.5 employees in the instructional facilitator line could include a technology assistant whose role would be to “provide the technological expertise to fix small problems with the computer system, install all software, connect computer equipment so it can be used for both instruction and management issues and provide professional development to embed computer technologies into the curriculum.” The current Arkansas School Facilities Manual, which contains state standards for the construction of new school facilities, calls for districts to maintain a technology support program staffing level of one technical staff person for every 150 computers. However, the Arkansas Division of Public School Academic Facilities and Transportation indicated that they have never used that particular section of the Facilities Manual because it is outside the scope of the statute defining what the Facilities Manual must include (§6-21-809). The Division said the Facilities Manual is currently being revised, and the technology section (Section 5) is being removed.
Assistant principals are also addressed in the instructional facilitator line of the matrix because the state accreditation standards treat them as interchangeable. The standard 15.02 requires districts to employ a half-time (.5 FTE) assistant principal, instructional supervisor or curriculum specialist for schools exceeding 500 students. Because the standards require any of these three positions to fulfill the requirement, the matrix funds all three within the instructional facilitator line. That said, just 31% of schools have 500 or more students, so this accreditation standard would not apply to approximately 700 of the state’s more than 1,000 schools.
In 2003, the consultants discouraged Arkansas from including assistant principals within the matrix. “[F]ew if any comprehensive school designs include assistant principal positions,” they wrote.
In passing Act 59 of the Second Extraordinary Session of 2003, the General Assembly adopted the consultants’ recommendation and funded a total of 2.5 employees in the instructional facilitators line of the matrix.

Page 20
When the consultants were rehired in 2006, they reiterated their recommendation that Arkansas provide funding to support 2.5 instructional facilitators and specified that the staffing level for the technology assistant be calculated at .5 of the total 2.5 FTEs. They also noted an adequacy study finding that a number of school districts were not actually spending foundation funding on instructional facilitators. The consultants recommended pulling the instructional facilitator funding out of the matrix and creating a separate line of categorical funding where districts’ use of the money would be restricted to that purpose.
The General Assembly adopted the consultants’ recommendation to designate funding for 2.5 instructional facilitators, and discussed allowing .5 of an FTE for an assistant principal. The Legislature also opted to leave the instructional facilitator funding in the matrix, rather than breaking it out as a categorical. The instructional facilitator line has included 2.5 FTEs since that time.
ACTUAL STAFFING PATTERNS
The staffing level established in the matrix for instructional facilitators, assistant principals and technology assistants is more than two and a half times the actual average number of employees that districts employ using their foundation funding. The following table compares the matrix number for instructional facilitators, assistant principals and technology assistants with the average FTE for school districts.
Instructional Facilitators in Districts Matrix FTE Number Per 500 Foundation Paid Staff Per 500
2011-12 2.5 .89
2012-13 2.5 .93
As shown in the following table, large districts tend to employ more of these employees than smaller districts, which may result from having larger schools that use more assistant principals. High poverty districts have fewer of these employees than lower poverty districts.
By District Size By Poverty Level
2012-13
Foundation Paid Staff Per 500
2012-13
Foundation Paid Staff Per 500
Small (750 or Less) .38 Low Poverty (>70%) .91
Medium (751-5,000) .92 Medium Poverty (70%-<90%) 1.0
Large (5,001+) 1.10 High Poverty (90%+) .71
STATE RANKING
NCES provides data on the number of “instructional coordinators” in each state. Under the NCES definition, instructional coordinators are staff who supervise instructional programs at the school or district level. Instructional coordinators may be most comparable to what Arkansas calls curriculum supervisors. The most recent data available for all states are from 2011-12. According to the NCES data, Arkansas had .83 instructional coordinators per 500 students in 2011-12. The state has the fifth highest number of instructional coordinators per 500 students among SREB states and the second highest number among surrounding states. (The enrollment data used to calculate the instructional coordinators per 500 students include pre-K students who have been excluded from the BLR’s foundation funding analysis.)
COST OF INSTRUCTIONAL FACILITATORS
Like all school-level pupil support staff, the cost of each FTE in the instructional facilitator line is calculated using the average teacher salary of $60,566 for 2013 (base salary of $48,356, plus benefits). For 2.5 instructional facilitators, the matrix provides $151,415 for every 500 students or $302.83 per student.
Page 21
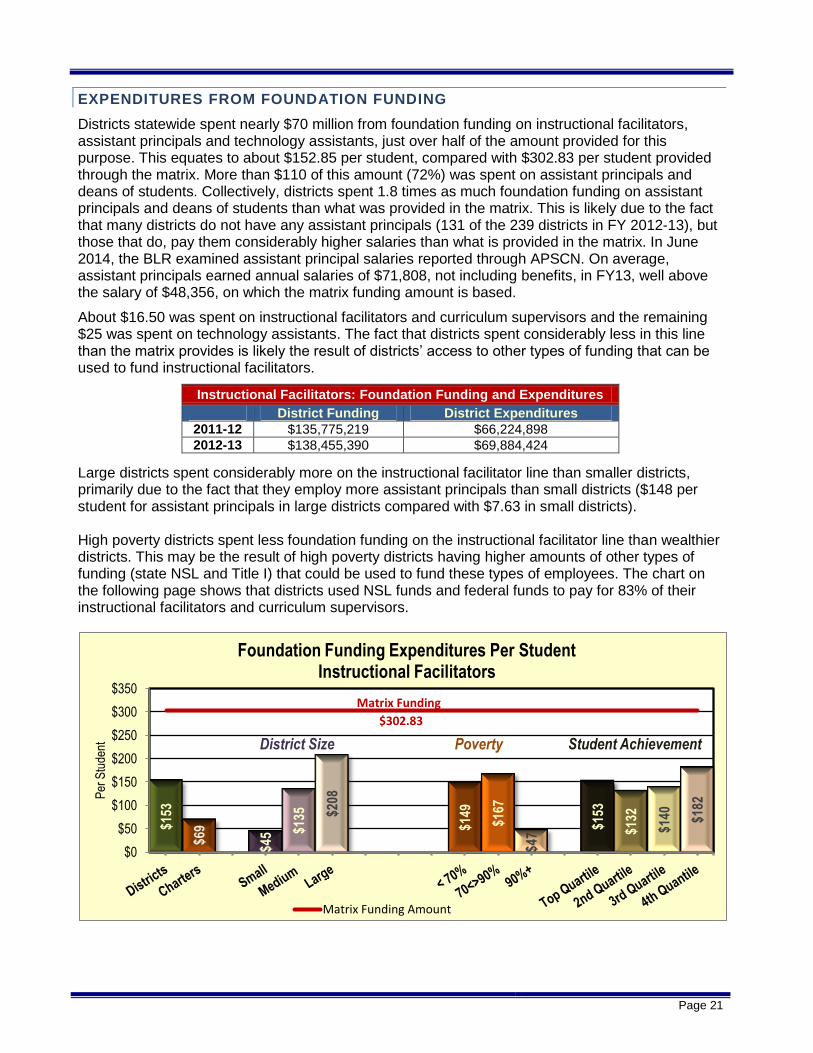
EXPENDITURES FROM FOUNDATION FUNDING
Districts statewide spent nearly $70 million from foundation funding on instructional facilitators, assistant principals and technology assistants, just over half of the amount provided for this purpose. This equates to about $152.85 per student, compared with $302.83 per student provided through the matrix. More than $110 of this amount (72%) was spent on assistant principals and deans of students. Collectively, districts spent 1.8 times as much foundation funding on assistant principals and deans of students than what was provided in the matrix. This is likely due to the fact that many districts do not have any assistant principals (131 of the 239 districts in FY 2012-13), but those that do, pay them considerably higher salaries than what is provided in the matrix. In June 2014, the BLR examined assistant principal salaries reported through APSCN. On average, assistant principals earned annual salaries of $71,808, not including benefits, in FY13, well above the salary of $48,356, on which the matrix funding amount is based.
About $16.50 was spent on instructional facilitators and curriculum supervisors and the remaining $25 was spent on technology assistants. The fact that districts spent considerably less in this line than the matrix provides is likely the result of districts’ access to other types of funding that can be used to fund instructional facilitators.
Instructional Facilitators: Foundation Funding and Expenditures
District Funding District Expenditures
2011-12 $135,775,219 $66,224,898
2012-13 $138,455,390 $69,884,424
Large districts spent considerably more on the instructional facilitator line than smaller districts, primarily due to the fact that they employ more assistant principals than small districts ($148 per student for assistant principals in large districts compared with $7.63 in small districts). High poverty districts spent less foundation funding on the instructional facilitator line than wealthier districts. This may be the result of high poverty districts having higher amounts of other types of funding (state NSL and Title I) that could be used to fund these types of employees. The chart on the following page shows that districts used NSL funds and federal funds to pay for 83% of their instructional facilitators and curriculum supervisors.
$153
$69
$45 $1
35
$208
$149
$167
$47
$153
$132
$140
$182
Matrix Funding
$302.83
$0
$50
$100
$150
$200
$250
$300
$350
Per
Stu
dent
District Size Poverty Student Achievement
Foundation Funding Expenditures Per Student Instructional Facilitators
Matrix Funding Amount

Page 22
EXPENDITURES FROM ALL FUNDING SOURCES
In addition to foundation funding, districts receive a variety of other sources of funding that can be used for instructional facilitators, assistant principals and technology assistants.
Instructional Facilitators and Curriculum Supervisors
Districts use foundation funding to cover just 9% of their total expenditures for instructional facilitators and curriculum supervisors. Districts primarily use National School Lunch Act (NSL) state categorical funds and federal funds.
Districts do, however, use foundation funds to cover the majority of their expenditures for assistant principals and technology assistants. Foundation funds cover 87% of assistant principal expenditures and 68% of their expenditures for technology assistants, as shown in the following charts.
Foundation $7,559,361
$1,290,109
NSL $36,499,195
$2,157,502
$222,459
$1,919,462
$1,250,234
Federal Funds $35,335,106
2012-13 District Expenditures for Instructional Facilitators and Curriculum Supervisors
Foundation
Other State Unrestricted
NSL
PD
ALE
ELL
Other State Restricted
Federal Funds
Foundation $50,607,516
$5,389,348
$267,430
$1,716,291
$250,133
2012-13 District Expenditures for Assistant Principals and Deans of Students
Foundation
Other State Unrestricted
ALE
Other State Restricted
Federal Funds

Page 23
SPECIAL EDUCATION TEACHERS
All districts must provide students with disabilities access to special education services under the federal Individuals with Disabilities Education Act (IDEA). Arkansas Code §6-41-202 establishes in state statute that it is also the state’s policy to provide a free and appropriate public education to students with disabilities.
Every special education student has an individualized education program (IEP), which serves as the plan for his or her specialized instruction. The IEP is a plan or program developed to ensure that a child with a disability identified under the law and who is attending an elementary or secondary educational institution receives specialized instruction and related services. The IEP specifies the special education programming and related services that must be provided to meet each student’s needs. There were 54,222 special education K-12th grade students in Arkansas public schools in the 2012-13 school year (not including students in the Division of Youth Services, the Department of Correction or the Conway Human Development Center), making up 11.5% of the total student enrollment in the state1.
STAFFING IN THE MATRIX
The matrix provided $351.28 per student to support 2.9 special education teachers. These teachers are in addition to the 24.94 classroom teachers.
BACKGROUND
The Joint Legislative Committee on Educational Adequacy (Joint Adequacy Committee) set the special education funding rate in the foundation funding matrix in 2003. The Committee determined that the matrix would fund 2.9 special education teachers for every 500 students. Because the specific needs of special education students dictate the level of staffing required, the state could not simply calculate the number of special education teachers needed based on maximum student to teacher staffing for special education classes.
1 Calculation made using data retrieved from
https://adedata.arkansas.gov/statewide/State/EnrollmentByGrade.aspx?year=21&search=&pagesize=10 and the Arkansas Department of Education’s Dec. 1, 2012, special education child count data.
Foundation $11,717,547
$1,829,014
$2,110,941
$537,423
$1,075,894
$77,213
2012-13 District Expenditures for Technology Assistants
Foundation
Other State Unrestricted
NSL
Other State Restricted
Federal Funds
Activity Fund

Page 24
The Committee’s consultants, Picus and Associates, had originally proposed funding 2.0 special education teachers, but after receiving input from panels of Arkansas educators and the Arkansas Department of Education, the Joint Adequacy Committee opted to increase the number to 2.9 teachers. Hired again in 2006, Picus and Associates affirmed the state’s methodology of funding special education using a “census” approach, meaning that the funding is based on total enrollment rather than on the number of special education students. They noted that the census methodology “is an approach that is becoming more common across the country to provide resources for children with disabilities.”
As of 2012, nine states use the census approach for special education funding distribution, while 20 states provide either a flat grant for each special education student or a weighted amount based on the student’s disability or instructional environment (e.g., self-contained classroom or regular classroom) (Verstegen, 2012). Eight states use a cost reimbursement method, and the remaining 22 states, including Arkansas, use some other distribution method or a combination of methods. Arkansas provides funding for 2.9 special education teachers through the matrix as well as another $11 million for districts that incur “catastrophic” expenditures for severely disabled students.
In 2006, Picus and Associates recommended continuing the census-based funding methodology, and they affirmed the state’s funding of 2.9 special education teachers for “high-incidence, lower cost students with disabilities.” Since then, the matrix has continued to fund 2.9 special education teachers for every 500 students.
ACTUAL STAFFING PATTERNS
The average number of special education teachers is just slightly more than the staffing level established in the matrix. The following table compares the matrix number for special education teachers with the average FTE for all districts.
Special Education Teachers in Districts Matrix FTE Number Per 500 Foundation Paid Staff Per 500
2011-12 2.9 2.98
2012-13 2.9 2.95
There were only small differences in the staffing levels of district groups based on size and concentrations of poverty, with large districts and high poverty districts having the highest staffing levels paid with foundation funding.
By District Size By Poverty Level
Foundation Paid
Staff Per 500
Foundation Paid Staff Per 500
Small (750 or Less) 2.69 Low Poverty (>70%) 3.0
Medium (751-5,000) 2.87 Medium Poverty (70%-<90%) 2.86
Large (5,001+) 3.14 High Poverty (90%+) 2.56
COST OF SPECIAL EDUCATION TEACHERS
Like most school-level staff, the cost of each FTE in the special education line is calculated using the average teacher salary of $60,566 for 2013 (base salary of $48,356, plus benefits). For 2.9 special education teachers, the matrix provides $175,641 for every 500 students or $351.28 per student.

Page 25
EXPENDITURES FROM FOUNDATION FUNDING
In 2013, districts statewide spent about $160.6 million from foundation funding on special education teachers. This equates to about $351.32 per student, which is almost exactly the amount funded in the matrix ($351.28).
Special Education Teachers: Foundation Funding and Expenditures
District Funding District Expenditures
2011-12 $157,499,254 $157,000,486
2012-13 $160,608,253 $160,628,972
Open-enrollment charter schools spent considerably less foundation funding per student on special education teachers than regular school districts, as shown in the following chart. This is true when considering only foundation funding expenditures ($87 per student compared with districts’ $351) as well as expenditures from all funding sources ($172 per charter school student compared with districts’ $464). This lower level of spending may be due to the fact that charter schools as a group have a smaller percentage of students in special education, about 7.1%, compared with 11.56% of students in regular school districts. Charter schools may have fewer severely disabled students than regular school districts have.
The chart also indicates that larger districts spent more from foundation funding than smaller districts and districts with low concentrations of poverty spent more than districts with high concentrations of poverty. There was little difference in districts’ spending patterns based on student achievement, with the exception of the districts in the highest achieving group, which slightly outspent districts in the other groups.
$351
$87
$268
$322
$417
$360
$334
$273
$379
$342
$328
$343
Matrix Funding $351.28
$0
$100
$200
$300
$400
$500
Per
Stu
dent
District Size Poverty Student Achievement
Foundation Funding Expenditures Per Student Special Education Teachers
Matrix Funding Amount
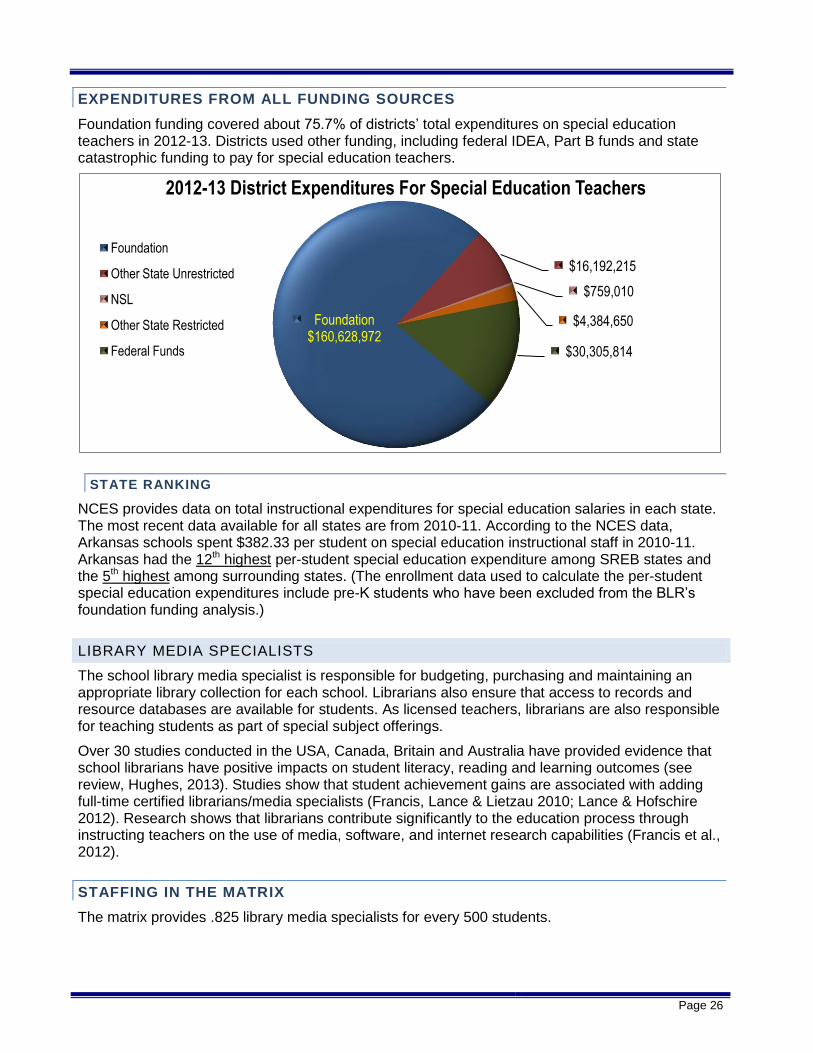
Page 26
EXPENDITURES FROM ALL FUNDING SOURCES
Foundation funding covered about 75.7% of districts’ total expenditures on special education teachers in 2012-13. Districts used other funding, including federal IDEA, Part B funds and state catastrophic funding to pay for special education teachers.
STATE RANKING
NCES provides data on total instructional expenditures for special education salaries in each state. The most recent data available for all states are from 2010-11. According to the NCES data, Arkansas schools spent $382.33 per student on special education instructional staff in 2010-11. Arkansas had the 12th highest per-student special education expenditure among SREB states and the 5th highest among surrounding states. (The enrollment data used to calculate the per-student special education expenditures include pre-K students who have been excluded from the BLR’s foundation funding analysis.)
LIBRARY MEDIA SPECIALISTS
The school library media specialist is responsible for budgeting, purchasing and maintaining an appropriate library collection for each school. Librarians also ensure that access to records and resource databases are available for students. As licensed teachers, librarians are also responsible for teaching students as part of special subject offerings.
Over 30 studies conducted in the USA, Canada, Britain and Australia have provided evidence that school librarians have positive impacts on student literacy, reading and learning outcomes (see review, Hughes, 2013). Studies show that student achievement gains are associated with adding full-time certified librarians/media specialists (Francis, Lance & Lietzau 2010; Lance & Hofschire 2012). Research shows that librarians contribute significantly to the education process through instructing teachers on the use of media, software, and internet research capabilities (Francis et al., 2012).
STAFFING IN THE MATRIX
The matrix provides .825 library media specialists for every 500 students.
Foundation $160,628,972
$16,192,215
$759,010
$4,384,650
$30,305,814
2012-13 District Expenditures For Special Education Teachers
Foundation
Other State Unrestricted
NSL
Other State Restricted
Federal Funds

Page 27
BACKGROUND
In 2003, Picus and Associates recommended the state provide funding for librarians for middle schools and high schools. At the elementary level, the consultants recommended considering librarians as part of the 20% non-core teachers. They recommended funding 1.0 FTE librarian for middle schools, 1.5 FTE librarians for high schools and no additional positions for librarians at the elementary level. Based on these figures, the total amount of librarians for the prototypical school of 500 students was set at .7 FTEs. The General Assembly adopted this recommendation and established the librarian staffing level at .7 FTEs.
In 2006, when the state rehired Picus and Associates, the consultants noted that the staffing level of .7 librarians per 500 students would not be an adequate level for districts to comply with the state accreditation standards. Standard 16.02.3 calls for schools with fewer than 300 students to have a 1/2 time library media specialist (0.5 per 300, or 0.83 per 500). Schools with 300 to 1,499 students must have a full-time library media specialist (1.0); and schools with 1,500 or more students must have two library media specialists (two per 1,500 is 0.67 per 500). Library media specialists are master’s degree-level licensed staff with an endorsement in school library media. State statute specifies that “only trained and certified library media services program personnel shall be assigned to carry out duties of the library media specialist” (§6-25-104). The law allows library media clerks to handle clerical duties when “supervised by the library media specialist.”
In 2006, the consultants recommended funding 1.0 library media specialist in the matrix. The General Assembly, however, opted to set the staffing level at .825. That staffing level is the result of an analysis that examined the number of schools in 2006 at each enrollment size: under 300 students, 300-1,500 and more than 1,500. Based on the number of schools at each level, 912.5 librarians were needed statewide. Based on this data, the average number of librarians needed was calculated to be .825 per school (912.5/1,106).
Using the same analysis for schools in 2012-13, it appears that an average of .85 librarians would be needed to be in compliance with state standards. (This analysis includes charter schools, some of which have waivers from the librarian to student ratio.) This is slightly more than is provided in the matrix. In the past three years, no schools have been cited for failing to meet the librarian-to-student ratio.
ACTUAL STAFFING PATTERNS
Districts used foundation funding to employ .91 FTE library media specialists in 2012-13. That number is slightly higher than the staffing level established in the matrix. The following table compares the matrix number for librarians with the average FTE for all districts.
Library Media Specialists in Districts Matrix FTE Number Per 500 Foundation Paid Staff Per 500
2011-12 0.825 0.91
2012-13 0.825 0.91
School Size
# of Schools in 2006
Required Librarians
Librarians Multiplied by #
of Schools
Under 300 407 0.5 203.5
300-1500 689 1.0 689
Over 1500 10 2.0 20
Totals 1,106 912.5
School Size
# of Schools in 2013
Required Librarians
Librarians Multiplied by #
of Schools
Under 300 339 0.5 169.5
300-1500 710 1.0 710
Over 1500 13 2.0 26
Totals 1,062 875

Page 28
Large districts had lower staffing levels for library media specialists than smaller districts, which may be due to economies of scale. High poverty districts had slightly higher staffing levels than low poverty districts.
By District Size By Poverty Level
2012-13
Foundation Paid Staff Per 500
2012-13
Foundation Paid Staff Per 500
Small (750 or Less) 1.30 Low Poverty (>70%) .87
Medium (751-5,000) .98 Medium Poverty (70%-<90%) .98
Large (5,001+) .70 High Poverty (90%+) 1.17
STATE RANKING
NCES provides data on the number of librarians and library support staff in each state. The most recent data available for all states are from 2011-12. According to the NCES data, Arkansas had a total of 1.13 librarians per 500 students in 2011-12. Arkansas had the highest number of librarians per 500 students among SREB states and the highest number among surrounding states. (The enrollment data used to calculate the librarians per 500 students include pre-K students who have been excluded from the BLR’s foundation funding analysis.)
COST OF LIBRARY MEDIA SPECIALISTS
Like most school-level staff, the cost of each FTE in the library media specialist line is calculated using the average teacher salary of $60,566 for 2013 (base salary of $48,356, plus benefits). For 0.825 librarians, the matrix provides a total of $49,966.95 for every 500 students or $99.93 per student.
EXPENDITURES FROM FOUNDATION FUNDING
In 2013, districts statewide spent about $53.4 million from foundation funding on librarians and media specialists. This equates to about $116.74 per student, or about $17 more than the per student amount in the matrix.
Open-enrollment charter schools spent just $8.58 per student on library media specialists, well under the amount provided in the matrix. This is primarily due to the fact that nine of the 16 open-enrollment charter schools had waivers from the accreditation rules requiring a library media specialist. Smaller districts spent more for library media specialists than large districts, which is likely due to economies of scale. High poverty districts spent slightly more than low poverty districts.
$117
$9
$144
$121
$103
$115
$121
$124
$109
$124
$128
$111
Matrix Funding $99.93
$0
$50
$100
$150
$200
Per
Stu
dent
District Size Poverty Student Achievement
Foundation Funding Expenditures Per Student Library Media Specialists
Matrix Funding Amount
Librarians: Foundation Funding and Expenditures
District Funding District Expenditures
2011-12 $44,805,822 $53,629,707
2012-13 $45,690,279 $53,374,981

Page 29
EXPENDITURES FROM ALL FUNDING SOURCES
In addition to foundation funding, districts have other sources of funding that can be used for library media specialists. Still, districts used foundation funding for about 87% of their total expenditures for library media specialists.
COUNSELORS, NURSES AND OTHER PUPIL SUPPORT
This line of the matrix provides guidance counselors, nurses, and other pupil support services. These positions may also include speech therapists, social workers, psychologists, and family outreach workers. State statute requires all districts to develop and implement a plan describing how individual student services will be coordinated and provided (§6-18-1004).
The matrix established a staffing level of 2.5 FTEs for counselors, nurses and other pupil support. This includes 1.11 FTEs for a counselor, a .67 FTE for a nurse and a .72 FTE for other student services.
COUNSELORS A guidance counselor is a master’s level certified staff member responsible for a wide variety of activities. According to state law (§6-18-1005), guidance and counseling services include:
Individual and group counseling
Orientation programs for new students
Academic advisement for class selection
Consultation with parents, faculty, and out-of-school agencies concerning student problems and needs
Utilization of student records and files
Interpretation of assessments and dissemination of results to the school, students, parents, and community
Following up with early school dropouts and graduates
Foundation $53,374,981
$5,187,524
$581,851
$115,998
$888,302
$70,006
$936
2012-13 District Expenditures for Library Media Specialists
Foundation
Other State Unrestricted
NSL
ALE
Other State Restricted
Federal Funds
Activity Fund
FTEs in the Matrix
Counselors 1.11
Nurses .67
Other Pupil Support Staff .72 Total 2.5

Page 30
A school-initiated system of parental involvement
An organized system of informational resources on which to base educational and vocational decision making
Educational, academic assessment, and career counseling, including advising students on the national college assessments, workforce opportunities, and alternative programs that could provide successful high school completion and postsecondary opportunities for students
Coordinating administration of the Test for Adult Basic Education or the General Educational Development pretest to students by designating appropriate personnel, other than the school guidance counselor, to administer the tests
Classroom guidance
Guidance in understanding the relationship between classroom performance and success in school
School counseling programs have significant influence on behavioral problems, health and mental health, dropout rates, family issues, and career development. Additionally, the American Counseling Association (2007) has provided solid evidence that school guidance counselors significantly contribute to student achievement through academic and personal counseling.
STAFFING IN THE MATRIX
The matrix provides funding for 1.11 guidance counselors for every 500 students.
BACKGROUND
In 2003, Picus and Associates recommended one pupil support staff for every 100 students who are eligible for free or reduced price lunch (NSL students). They argued that the level of pupil support needs increases and decreases with the level of poverty in the population. The consultants also recommended one counselor for every 500 middle school students and two counselors for every 500 high school students. For elementary schools, the consultants did not recommend any additional counselors beyond the pupil support staff based on NSL students.
The General Assembly elected to create a separate source of funding based on the number of NSL students and authorized districts to use this funding to provide certain pupil support services. Additionally the General Assembly also opted to provide pupil support services through the matrix. They set the staffing level for counselors based on the state accreditation standards (16.01.3), which require districts to have at least one counselor for every 450 students, or approximately 1.11 FTEs per 500 students.
In 2006, when Picus and Associates were rehired, they endorsed the staffing levels set for pupil support in the matrix, which included 1.11 counselors, but they also recommended enhancing NSL funding with an additional 1.0 FTE for additional pupil support services staff for every 100 NSL students. The General Assembly decided against implementing this recommendation because the Adequacy Study Oversight Subcommittee found that “funds received by school districts through state foundation funding aid and categorical funding for NSL students is adequate, when school districts spend those funds efficiently.”2 The staffing level for guidance counselors has remained at 1.11 since it was originally established.
Today the American School Counselor Association (2013) recommends a school counselor-to-student ratio of 1:250, which is about 1.8 times the staffing level funded by the Arkansas foundation funding matrix.
2 Adequacy Study Oversight Subcommittee, A Report on Legislative Hearings For the 2006 Interim Study on
Educational Adequacy, adopted by the House and Senate Education

Page 31
Guidance Counselors’ Time Allocation
An additional consideration for guidance counselors is the many demands on their time. Duties for counselors vary considerably by time of the year. In many schools, administrative duties for state testing become a full-time responsibility during the spring semester, leaving little time for personal and career counseling.
State law requires guidance counselors to spend at least 75% of their work time each month providing “direct counseling related to students” and prohibits them from spending more than 25% of their time each month on “administrative activities.” The American School Counselor Association recommends that school counselors spend 80 percent or more of their time in direct and indirect services to students.
State law requires the Arkansas Department of Education to produce a report describing districts’ compliance with the state laws on the provision of student services, including guidance counseling. According to the Jan. 1, 2014 report, 124 of the approximately 1,300 counselors reported spending less than 75% of their time providing direct counseling. The report notes that this is an increase of 10 counselors from the previous year.
ACTUAL STAFFING PATTERNS
On average, districts use foundation funding to employ 1.14 FTE guidance counselors per 500 students. This staffing level is slightly more than the staffing level established in the matrix. The following tables compare the matrix number for counselors with the average FTE for all districts.
Guidance Counselors in Districts Matrix FTE Number Per 500 Foundation Paid Staff Per 500
2011-12 1.11 1.14
2012-13 1.11 1.14
District staffing patterns for guidance counselors varied little by district size or by concentrations of poverty.
By District Size By Poverty Level
2012-13 Foundation Paid Staff Per 500
2012-13 Foundation Paid Staff Per 500
Small (750 or Less) 1.16 Low Poverty (>70%) 1.15
Medium (751-5,000) 1.18 Medium Poverty (70%-<90%) 1.10
Large (5,001+) 1.07 High Poverty (90%+) 1.12
State law requires the Arkansas Department of Education to produce an annual report describing districts’ compliance with state laws regarding the provision of student services, including guidance counseling. According to the Jan. 1, 2014 report, there are about 1,300 school counselors in the state. The report indicates that “many” of those counselors have more than 450 students, up to a student load of 681. Even though some counselors are assigned more than 450 students, their districts may still be in compliance with the accreditation standards if the district as a whole meets the 450 to 1 student to counselor ratio. According to ADE, one district violated the guidance counselor-to-student ratio standard in 2012-13. No violations were noted in 2011-12 or 2013-14.

Page 32
STATE RANKING
NCES provides data on the number of guidance counselors in each state. The most recent data available for all states are from 2011-12. According to the NCES data, Arkansas had a total of 1.58 guidance counselors per 500 students in 2011-12. Arkansas had the highest number of guidance counselors per 500 students among SREB states and the highest number among surrounding states. (The enrollment data used to calculate the guidance counselors per 500 students include pre-K students who have been excluded from the BLR’s foundation funding analysis.)
COST OF COUNSELORS
Like most school-level staff, the cost of each FTE in the pupil support line is calculated using the average teacher salary of $60,566 for 2013 (base salary of $48,356, plus benefits). For 1.11 guidance counselors, the matrix includes $134.46 per student for counselors.
EXPENDITURES FROM FOUNDATION FUNDING
In 2013, districts statewide spent about $72.3 million from foundation funding on counselors. This equates to about $158.19 per student, or about $24 more per student than the matrix provides.
Counselors: Foundation Funding and Expenditures District Funding District Expenditures
2011-12 $60,284,197 $72,245,974
2012-13 $61,747,193 $72,324,733
Open-enrollment charter schools spent considerably less foundation funding per student than the amount provided in the matrix. This is in part due to the fact that eight of the 16 charter schools in operation in 2012-13 had waivers from the state guidance counseling requirement. Larger districts, on average, spent more foundation funding per student than smaller districts, and high poverty districts spent less per student than districts with less poverty. There was little difference among districts when grouped by student achievement.
$158
$68
$140
$156
$166
$162
$150
$138
$162
$157
$160
$152
Matrix Funding
$134.46
$0
$50
$100
$150
$200
Per
Stu
dent
District Size Poverty Student Achievement
Foundation Funding Expenditures Per Student Counselors
Matrix Funding Amount

Page 33
EXPENDITURES FROM ALL FUNDING SOURCES
Districts used foundation funding to cover 82.5% of their total expenditures for guidance counselors in 2012-13. In addition to foundation funding, districts have a variety of other sources of funding that can be used for counselors. The following chart shows the funding sources districts used to pay for guidance counselors.
NURSES
Nurses are essential to assessing the health of students, delivering emergency care, administering medication and vaccines, performing health care procedures, and providing health care counseling and programs.
STAFFING IN THE MATRIX
The matrix provides funding for a .67 FTE nurse for every 500 students.
BACKGROUND
Picus and Associates’ 2003 report made no specific mention of school nurses, but their 2006 report noted that nurses were included in their recommendation for 1.0 pupil support staff for every 100 NSL students. As mentioned above, the General Assembly adopted a staffing level of 2.5 pupil support services staff with the passage of Act 59 of the Second Extraordinary Session of 2003. That same session, the General Assembly also passed Act 67, which increased the number of required school nurses from 1 per 1,000 students to 1 per 750 students. The new law also added a provision that made the statute effective “only upon the availability of state funds.” The statutory nurse requirement was in addition to an ADE accreditation standard requiring all school districts to have a health services program under the direction of a licensed nurse (16.03.1), and provide the program with needed facilities, equipment and materials. The standards require the health services programs to include screening, referral and follow-up procedures for all students.
In 2006, the Adequacy Study Oversight Subcommittee specifically noted in its report that state law requires one school nurse per 750 students. The subcommittee also specified that of the 2.5 FTEs in the pupil support line of the matrix, a .67 FTE per 500 students is intended for nursing staff. Despite designating a portion of the matrix to nursing staff, many interested parties have argued that funding was never specifically provided for nurses. ADE’s interpretation of this law is that funds
Foundation, $72,324,733
$7,022,717
$4,478,968
$548,753
$105,221
$2,165,325
$956,199
2012-13 District Expenditures for Counselors
Foundation
Other State Unrestricted
NSL
ALE
ELL
Other State Restricted
Federal Funds

Page 34
were never made available for school nurses. As a result, the department’s standards assurance unit does not check that districts adhere to the nurse to student ratio.
The National Association of School Nurses currently recommends a nurse-to-student ratio of 1:750 in a school with all well students, 1:225 in a school that requires daily nursing services, and 1:125 in a school with complex health care needs.
Act 414 of 2013 created a Public School Health Services Advisory Committee and charged it with conducting a one-year study of the on-campus health needs of public school students and the provision of school health services. Among the issues the Committee is examining is the current level of need for on-campus health services, the condition of the facilities and equipment used to provide school health services, and the cost of providing these services. The Committee is required to produce a final report by September 1, 2014.
ACTUAL STAFFING PATTERNS
On average, districts use foundation funding to employ .44 FTE nurses per 500 students. This staffing level is about a third less than the staffing level established in the matrix. The following tables compare the matrix number for nurses with the average number of FTEs for all districts.
Nurses in Districts Matrix FTE Number Per 500 Foundation Paid Staff Per 500
2011-12 .67 .49
2012-13 .67 .44
Large districts employed fewer nurses per 500 students with foundation funding than smaller districts, but there was little difference among the districts when grouped by concentrations of poverty.
By District Size By Poverty Level
Foundation Paid
Staff Per 500
Foundation Paid Staff Per 500
Small (750 or Less) .65 Low Poverty (>70%) .43
Medium (751-5,000) .44 Medium Poverty (70%-<90%) .47
Large (5,001+) .39 High Poverty (90%+) .45
When all funding sources are considered (including foundation funding, federal funding, state categorical funding, etc.), districts had a total of 746.17 FTE nurses in 2012-13, according to data compiled by the Arkansas Department of Education. Statewide that’s about 1 nurse for every 615 students, which is well under the 1 to 750 ratio required by state law. However, 55 districts do not meet the required number of nurses for their student population, according to the ADE data. Five districts had zero nurses in 2012-13. Some of these districts may provide nurses through a contracted service, in which case, individual nurse employees would not appear in the APSCN data. In fact, the BLR visited schools in two of these districts during the 2013-14 school year, and the administrators indicated they do, in fact, have a nurse assigned to their school part of the week. To better understand school administrators’ perceptions of their nurse staffing level, the BLR posed several health services questions on the school survey. School Survey Question: How many FTE nurses does your school have? On average, the schools said they have .69 FTEs. What level of nursing license does your nurse have? Fourteen schools said their nurse was an LPN, three said their nurse was an LPN but they also had access to an RN, and 54 said their nurse was an RN.

Page 35
Does your school have adequate nursing services to handle all of the health issues of students? If not, how many more FTEs would your school realistically need? About 43% of the 74 schools surveyed said they did not have enough nursing staff, including 12 that had at least one full-time nurse. Of those schools, most said they need another .5 FTE or 1 FTE. The remaining 42 schools said they believed they had sufficient nursing support. Why is additional nursing needed at your school?
Several common themes surfaced when discussing the need for additional nursing staff.
The increase in chronic diseases: Ten principals noted the increase in chronic diseases, with seven specifically mentioning diabetes. Other chronic conditions mentioned included asthma, allergies and students having seizures.
The increase in students taking medication: Eight principals said more students require medication.
The increase in the severity of disabilities: Eight principals said the severity of students’ disabilities has worsened, with some students needing a feeding tube or an implanted port for medicine.
All day nursing care needs: Seven principals noted that they need a nurse all day, not just part of the day. Several noted the difficulty of getting a substitute when their only nurse takes leave.
A survey of school nurses conducted by the state’s Coordinated School Health program (a partnership of ADE and the Department of Health), found that school nurses are often asked to take on additional non-nursing duties. Of the 245 school nurses who responded to the survey for the 2012-13 school year, 52.2% said they were required to substitute for school secretaries when the secretaries were absent, 5.7% were required to sub for classroom teachers, and 6.1% said they were required to serve as a Benchmark Testing Monitor. Others said they were required to take on bus (9.4%), lunch (10.6%), or morning duty (7.4%) responsibilities (Coordinated School Health, 2013).
COST OF NURSES
Although the amount of funding districts receive for nurses is based on the average teacher salary of $60,566 (with a base salary of $48,356), Arkansas school nurses’ actual salaries are considerably lower. According to salary data compiled by the Arkansas Department of Education, the average base salary for school nurses in the 239 districts in 2012-13 was $33,579.
EXPENDITURES FROM FOUNDATION FUNDING
In 2013, districts statewide spent about $19 million from foundation funding on nurses. This equates to $41.63 per student, or about $40 less per student than the matrix provides. Districts may have spent less foundation funding on nurses because they have other sources of funding to use for this purpose.
Nurses: Foundation Funding and Expenditures District Funding District Expenditures
2011-12 $36,387,759 $18,070,842
2012-13 $37,106,045 $19,035,075
Few discernible patterns emerged when examining foundation funding expenditures by district size, poverty level or student achievement. Open-enrollment charter schools spent slightly more per student than districts. It’s possible that charter schools’ expenditures more closely align with
Schools % of Schools Surveyed
Yes 42 57%
No 32 43%

Page 36
districts’ expenditures in this matrix line than they did for the previous two matrix items is because just two of the charter schools open in 2012-13 requested waivers from the nurse-to-student ratio requirement.
EXPENDITURES FROM ALL FUNDING SOURCES
In addition to foundation funding, districts have a variety of other sources of funding they can use for nurses. Districts used foundation funding to cover just 51% of their total expenditures for nurses. A little over half of the districts used state NSL funding for this purpose, thereby reducing these districts’ reliance on foundation funding to employ nurses.
$42 $5
1
$43
$38 $4
7
$42
$41
$47
$46
$44
$30 $4
6
Matrix Funding
$81.16
$0
$20
$40
$60
$80
$100
Per
Stu
dent
District Size Poverty Student Achievement
Foundation Funding Expenditures Per Student Nurses
Matrix Funding Amount
Foundation $19,035,075
Other State Unrestricted $2,450,104 NSL
$9,590,332
$70
$75,420
$2,179,027
$3,886,830
$15,698
2012-13 District Expenditures for Nurses
Foundation
Other State Unrestricted
NSL
PD
ALE
Other State Restricted
Federal Funds
Activity Fund

Page 37
OTHER PUPIL SUPPORT SERVICES
Other pupil support services include psychological services, social work services, speech pathology services and audiology services.
STAFFING IN THE MATRIX
The matrix provides 0.72 FTE positions within the 2.5 pupil support services staff for other types of student services personnel described under the Public School Student Services Act (§ 6-18-1001 et seq.)
ACTUAL STAFFING PATTERNS
On average, districts use foundation funding to employ .18 FTE pupil support services per 500 students. This staffing level is about a quarter of the staffing level established in the matrix. The following tables compare the matrix number for pupil support staff with the average staffing level for all districts.
Pupil Support Staff in Districts Matrix FTE Number Per 500 Foundation Paid Staff Per 500
2011-12 .72 .19
2012-13 .72 .18
In 2012-13, smaller districts employed fewer student support staff using foundation funding than larger districts, and high poverty districts employed fewer student support staff than low poverty districts.
By District Size By Poverty Level
Foundation Paid
Staff Per 500
Foundation Paid Staff Per 500
Small (750 or Less) .10 Low Poverty (>70%) .19
Medium (751-5,000) .14 Medium Poverty (70%-<90%) .18
Large (5,001+) .27 High Poverty (90%+) .08
STATE RANKING
NCES provides data on the number of student support staff in each state. Under the NCES definition, employees who provide student support services are staff “whose activities are concerned with providing non-instructional services to students.” Staff in this category include attendance officers, staff providing health, psychology, speech pathology, audiology, or social services as well as the supervisors of these employees and of transportation and food service workers. Student support staff may be most comparable to what this report has included as Arkansas’s nurse and pupil support staff. The most recent data available for all states are from 2011-12. According to the NCES data, Arkansas had a total of 7.91 student support services staff per 500 students in 2011-12. Arkansas had the highest number of student support services staff per 500 students among SREB states and the highest number among surrounding states. (The enrollment data used to calculate the student support services staff per 500 students include pre-K students who have been excluded from the BLR’s foundation funding analysis.)
COST OF OTHER PUPIL SUPPORT STAFF
Like most school-level staff, the cost of each FTE in the pupil support line is calculated using the average teacher salary of $60,566 for 2013 (base salary of $48,356, plus benefits). For .72 pupil support staff, the matrix provides $43,608 for every 500 students or $87.22 per student.

Page 38
EXPENDITURES FROM FOUNDATION FUNDING
In 2013, districts statewide spent about $21.1 million from foundation funding on other student support services. This equates to $46.17 per student, or about $41 less per student than the matrix provides. Districts may have spent less foundation funding on student support services because they have other sources of funding to use for this purpose.
Other Pupil Support Services: Foundation Funding and Expenditures District Funding District Expenditures
2011-12 $39,103,263 $19,146,140
2012-13 $39,875,152 $21,108,738
Large districts spent nearly two and a half times the amount of foundation funding per student on student support services as smaller districts. High poverty districts spent less than half as much per student as wealthier districts. Districts in the second quartile for student achievement spent less than half as much as the other groups of districts, but this is likely unrelated to student performance.
EXPENDITURES FROM ALL FUNDING SOURCES
In addition to foundation funding, districts have a variety of other sources of funding they can use for student support services. Districts used foundation funding to cover just a third of these expenditures. Districts used federal funds to cover half of their student support expenditures. More than half of the federal funds used ($16.3 million) were IDEA funds for special education students and another 37% ($11.5 million) was spent using Medicaid funding.
$46
$31
$27
$30
$74
$45
$51
$19
$49
$21
$53
$54
Matrix Funding $87.22
$0
$20
$40
$60
$80
$100
Per
Stu
dent
District Size Poverty Student Achievement
Foundation Funding Expenditures Per Student Other Pupil Support Services
Matrix Funding Amount
Foundation $21,108,738
$3,307,682
$3,286,936
$929
$1,660
$154,243
$2,813,584
Federal Funds $31,476,677
Activity Fund $31,416
2012-13 District Expenditures for Other Pupil Support Services
Foundation
Other State Unrestricted
NSL
PD
ALE
ELL
Other State Restricted
Federal Funds
Activity Fund

Page 39
SCHOOL-LEVEL ADMINISTRATION PERSONNEL
Principals and their building-level clerical support are considered the glue that holds a school together. Principals must provide the operational management and instructional leadership to make schools run smoothly and to improve student achievement. The duties completed by school clerical personnel include record-keeping, answering phones, managing the office, and serving as a liaison to parents.
PRINCIPALS
A school principal serves as not only administrative oversight for a school, but also as the school’s instructional leader. Principals “provide instructional leadership by creating professional communities in which teachers provide considerable instructional leadership, developing professional development opportunities for teachers, signaling that instructional improvement and student achievement are core goals, and helping the school as a whole to take responsibility for student achievement increases or decreases while also managing the non-instructional aspects of the school” (Picus and Associates, 2006, p. 23).
STAFFING IN THE MATRIX
The matrix provides 1.0 FTE principal for every 500 students.
BACKGROUND
In 2003, Picus and Associates recommended 1.0 principal for the prototypical school of 500 students, noting that “all comprehensive school designs, and all prototypic school designs from professional judgment studies around the country include a principal for every school unit” (Picus, 2003, p. 22). The General Assembly implemented this recommendation in the matrix formula beginning with the 2004-05 school year. In their 2006 report, Picus and Associates noted that the state’s accreditation standards require districts to employ at least a half-time principal (.5) for every school, and one full time (1.0) principal for schools with 300 students or more. Still, they continued to recommend providing funding for one full-time principal for a school of 500 students. They reasoned that the actual salaries paid in smaller schools are typically low enough that the salary funding provided in the matrix is adequate even for schools with fewer than 500 students.
Odden and Picus’s core strategy of strong leadership, and the matrix provision of one full-time principal in every school, continues to be supported by recent literature (see reviews, Chenoweth, 2008; Dufour & Marzano, 2011; Marzano, Watters, & McNulty, 2005; Odden, 2009). A full-time principal is essential to developing and facilitating the professional learning communities that have been found to be critical to turning around low-performing schools and promoting achievement gains in other schools (American Institutes for Research, 2010; Dufour & Marzano, 2011; Herman et al., 2008; Reeves, 2003). Odden and Picus’ (2006) recommendation of one principal and one clerical staff (or secretary) for each school is consistent with other evidence-based adequacy studies (e.g., Augenblick, Palaich, & Associates, 2011; Conley & Rooney, 2007; Odden, Picus, & Goetz, 2008), and a more general study of school staffing in Massachusetts (Massachusetts Association of Regional Schools, 2009).
ACTUAL STAFFING PATTERNS
Districts’ actual average number of principal positions is nearly the same as the staffing level established in the matrix. The following table compares the matrix number for principals with the average FTE for all districts.
Principals in Districts Matrix FTE Number Per 500 Foundation Paid Staff Per 500
2011-12 1.0 .99
2012-13 1.0 .99

Page 40
The following table shows the number of schools (including charter schools) with fewer than 300 students, where a half-time principal is required, and those with 300 or more students, which require a full-time principal. The table indicates that the state’s public schools would need a minimum of 892.5 FTE principals to meet the state accreditation standards. In 2012-13, districts employed about 992 FTE principals, according to data provided by the BLR in June 2014.
School Size # of Schools
in 2013 Principals Required
Per School Total Principals
Required
Under 300 339 .5 169.5
300+ 723 1 723
Totals 1,062 892.5
Compared with smaller districts, large districts used foundation funding to employ fewer principals per 500 students. This is likely due to the fact that large districts tend to have larger schools, allowing principals to serve greater numbers of students. High poverty districts also employed more principals than low poverty districts.
By District Size By Poverty Level
2012-13
Foundation Paid Staff Per 500
2012-13
Foundation Paid Staff Per 500
Small (750 or Less) 1.54 Low Poverty (>70%) .96
Medium (751-5,000) 1.08 Medium Poverty (70%-<90%) 1.07
Large (5,001+) .72 High Poverty (90%+) 1.24
STATE RANKING
NCES provides data on the number of school administrators in each state. This NCES category includes principals, assistant principals, as well as people who supervise school operations and coordinate school instructional activities. The most recent data available for all states are from 2011-12. According to the NCES data, Arkansas had a total of 1.84 school administrators per 500 students in 2011-12. Arkansas had the 7th highest number of school administrators per 500 students among SREB states and the 4th highest number among surrounding states. (The enrollment data used to calculate the number of school administrators per 500 students include pre-K students who have been excluded from the BLR’s foundation funding analysis.)
COST OF PRINCIPALS
Unlike other salaries discussed previously in this report, the principal salary is not based on the average teacher salary. Instead, the matrix includes a salary and benefits package totaling $95,102, or $190.20 per student. That amount is comprised of the following items:
Base salary of $76,664
Health insurance contribution of $1,572
Additional benefits calculated at 22% of the base salary ($16,866). This is comprised of 14% for state retirement, 6.2% for Social Security, 1.45% for Medicare and .35% for unemployment and workers’ compensation.
The principal salary and benefits package was originally established at $72,000 in the 2004-05 matrix, but in 2007, the Education Committees determined that the salary level had been set too low due to a miscalculation. Based on evidence presented in 2006, the Committees opted to increase the principal salary by 12.88% from $76,335 in 2006-07 to $86,168 in 2007-08. The salary has received an annual increase each year since FY 08 as the foundation funding rate has received annual cost of living adjustments.

Page 41
In June 2014, the BLR produced a report on education administrator salaries, including principal salaries. That report found that the nearly 1,000 principals statewide earn an average base salary of $78,507, or $1,843 more than the average principal salary used in the matrix. Principals in larger districts tend to earn higher salaries than those in smaller districts, and principals of high schools typically earn more than those in middle or elementary schools.
EXPENDITURES FROM FOUNDATION FUNDING
In 2012-13, districts spent $96,685 in foundation funding on principal compensation (including benefits) for every 500 students, or about $1,583 more than what was funded by the matrix. Districts spent a total of about $88.4 million, or $193.37 per student.
Principals: Foundation Funding and Expenditures District Funding District Expenditures
2011-12 $85,279,222 $87,392,771
2012-13 $86,960,391 $88,410,069
Smaller districts spent more foundation funding on principals than larger districts, which is likely the result of employing more principals for a given student population, rather than paying individual principals higher salaries. High poverty districts spent more per student on principals than districts with lower concentrations of poverty.
$193
$185
$257
$205
$159
$190
$200
$214
$173
$219
$201
$195
Matrix Funding
$190.20
$0
$50
$100
$150
$200
$250
$300
Per
Stu
dent
District Size Poverty Student Achievement
Foundation Funding Expenditures Per Student Principals
Matrix Funding Amount
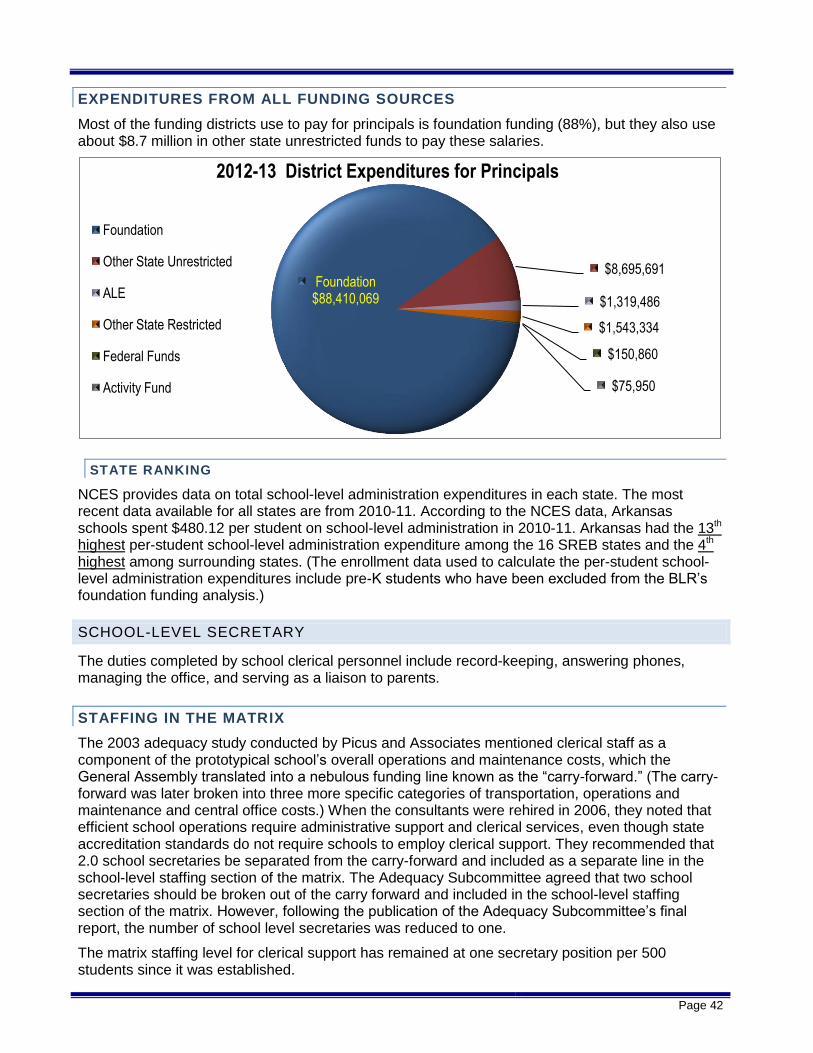
Page 42
EXPENDITURES FROM ALL FUNDING SOURCES
Most of the funding districts use to pay for principals is foundation funding (88%), but they also use about $8.7 million in other state unrestricted funds to pay these salaries.
STATE RANKING
NCES provides data on total school-level administration expenditures in each state. The most recent data available for all states are from 2010-11. According to the NCES data, Arkansas schools spent $480.12 per student on school-level administration in 2010-11. Arkansas had the 13th highest per-student school-level administration expenditure among the 16 SREB states and the 4th highest among surrounding states. (The enrollment data used to calculate the per-student school-level administration expenditures include pre-K students who have been excluded from the BLR’s foundation funding analysis.)
SCHOOL-LEVEL SECRETARY
The duties completed by school clerical personnel include record-keeping, answering phones, managing the office, and serving as a liaison to parents.
STAFFING IN THE MATRIX
The 2003 adequacy study conducted by Picus and Associates mentioned clerical staff as a component of the prototypical school’s overall operations and maintenance costs, which the General Assembly translated into a nebulous funding line known as the “carry-forward.” (The carry-forward was later broken into three more specific categories of transportation, operations and maintenance and central office costs.) When the consultants were rehired in 2006, they noted that efficient school operations require administrative support and clerical services, even though state accreditation standards do not require schools to employ clerical support. They recommended that 2.0 school secretaries be separated from the carry-forward and included as a separate line in the school-level staffing section of the matrix. The Adequacy Subcommittee agreed that two school secretaries should be broken out of the carry forward and included in the school-level staffing section of the matrix. However, following the publication of the Adequacy Subcommittee’s final report, the number of school level secretaries was reduced to one.
The matrix staffing level for clerical support has remained at one secretary position per 500 students since it was established.
Foundation $88,410,069
$8,695,691
$1,319,486
$1,543,334
$150,860
$75,950
2012-13 District Expenditures for Principals
Foundation
Other State Unrestricted
ALE
Other State Restricted
Federal Funds
Activity Fund

Page 43
COST OF SCHOOL-LEVEL SECRETARIES
Like the principal’s salary, the school secretary’s salary is not based on the average teacher salary. Instead, the matrix includes a specific salary and benefits package totaling $38,334, or $76.70 per student in 2012-13. That amount is comprised of a base salary, health insurance contribution, retirement, Social Security, Medicare, unemployment and workers’ compensation.
EXPENDITURES FROM FOUNDATION FUNDING
The APSCN system does not allow for easy calculation of FTE secretaries. However, expenditures can be examined. In 2012-13, districts spent $52.4 million in foundation funding on school secretary compensation (including benefits), or $114.61 per student. This can be calculated as $57,308 for every 500 students, or about $18,973 more than what was funded by the matrix.
School-Level Secretaries: Foundation Funding and Expenditures
District Funding District Expenditures
2011-12 $34,374,376 $51,397,675
2012-13 $35,052,993 $52,403,189
Open-enrollment charter schools spent considerably more foundation funding per student on school-level secretaries than regular school districts spent. District spending on secretaries did not appear to differ significantly based on district size or student achievement, although large districts and low achieving districts had slightly higher per student expenditures on secretaries. High poverty districts had the lowest per student expenditures of the three poverty-level groups.
$115
$219
$108
$110
$124
$111
$126
$86
$107
$108
$117
$128
Matrix Funding
$76.67
$0
$50
$100
$150
$200
$250
Per
Stu
dent
District Size Poverty Student Achievement
Foundation Funding Expenditures Per Student School-Level Secretary
Matrix Funding Amount

Page 44
EXPENDITURES FROM ALL FUNDING SOURCES
Most of the funding districts use to pay for secretaries is foundation funding (87%), but districts also use about $6.4 million in other state unrestricted funds to pay these salaries.
Foundation $52,403,189
$6,383,264
$135,955
$1,216,239
$84,227
$17,303
2012-13 District Expenditures for Secretaries
Foundation
Other State Unrestricted
ALE
Other State Restricted
Federal Funds
Activity Fund
Page 45
SCHOOL-LEVEL RESOURCES
In addition to staffing, schools need a variety of other types of resources. The school-level resources in the matrix include five general categories: technology equipment and related services, instructional materials, extra duty funds, supervisory aides, and substitute teachers.
TECHNOLOGY
Technology is a powerful tool that gives teachers, students and administrators new ways to address problems such as shortages of materials, time and professional development. For instance, technology brings rich and diverse materials into the classroom. Hundreds of libraries and museums have recorded parts of their collections in digital form and distribute these sources through the internet and as software. Technology also has the ability to change the dynamics of time and space in schools. By helping students work more independently, technology gives teachers more time to work one-on-one or with small groups of students. Technology has allowed students and parents increased opportunities for individualizing, customizing and providing access to education through virtual or distance learning. Students who have struggled in traditional classrooms often find success in a virtual setting where the teacher and student communicate one-on-one through computer use and the student can proceed at his or her own pace. It also offers access to highly qualified teachers in hard-to-staff subjects or hard-to-staff urban and rural schools, giving all students the opportunity to take a rigorous curriculum, regardless of their school’s ability to recruit and retain teachers (Grinager, 2006).
To ensure districts have funding to support their need for computers and other technology, the matrix provided $217.60 per student in 2012-13. The current rate (2013-14) is $221.50 per student. Collectively districts received $99.5 million in foundation funding for technology in 2013.
COST OF TECHNOLOGY
The technology line item of the matrix was originally set at $250 per student based on the 2003 recommendations of Picus and Associates. This rate was established to provide districts $125,000 per 500 students to purchase, update, and maintain hardware and software. The funding was designed to provide one computer for every three students and the technology infrastructure needed for distance learning. On the advice of the consultants, the technology funding rate was set at $250 per student, but over the next two years, the General Assembly decreased the amount to $185 per student, due to evidence presented to the Education Committees that the price of technology was decreasing.
In 2006 when the consultants were rehired to adjust the matrix, they again recommended districts be provided $250 per student to pay for technology expenditures. This time they detailed the individual costs comprising the $250 funding amount. This funding was designed to cover four categories of technology expenditures: 1.) computers, 2.) operating system and other non-instructional software, 3.) network equipment, printers and copiers, and 4.) instructional software and additional hardware. Picus and Associates described the four components and recommended the following per-student cost for each.

Page 46
Individual Items Per-Student
Cost 1) Computers One computer for every four students, plus one computer for every
teacher, principal and other key school staff, which calculates to an overall ratio of 1 computer for every three students
$100
2) Operating system and other non-instructional software
Operating system (e.g., Windows)
Productivity suite (e.g., Microsoft
Office)
Server software
Database
Antivirus/anti-spyware
Other network
$50
3) Printers, copiers, network equipment
Network equipment and internet connectivity
Copiers, 240 copies per student
Printers
$50
4) Instructional software and additional hardware
Instructional hardware: e.g., LCD projectors, smart boards (interactive whiteboard), document cameras (digital overhead), etc.
Instructional software: e.g., Accelerated Reader, multimedia resources such as Discovery.com, etc.
Software for administrators: e.g., Edusoft (helps administrators analyze test scores)
$50
Picus and Associates noted that the technology funding was designed to cover the costs of physical technology needs and services, not technology employees. Technology staff, they noted, are funded through other line items in the matrix. Specifically, .5 FTE technology assistant is provided through the instructional facilitator line item of the matrix, and the central office line item supports 1 FTE technology coordinator in the central office line item.
While the consultants, in 2006, reiterated their recommendation that technology should be funded at $250 per student, the Adequacy Subcommittee determined that $185 per student accurately reflected the cost of technology (minus technology staff) in schools. However, the committee opted to increase the technology funding in 2007-08 to $220 and decrease it to $201 for 2008-09 based on a declining inflationary index for computers. Since that time, the technology line item has steadily increased as a cost of living adjustment has been applied each year to the total foundation funding rate.
According to the existing research literature, the per pupil cost of technology varies widely, from around $150 to $1,000 (Greaves et al., 2010). This variance is the product of several factors, including types and amounts of hardware and software, refresh cycles, use of instruction and outside consultation, and intensity of the use of technology. The current (FY 2013) matrix figure of $217.60 appears to lie within the normal range of per pupil spending for technology (Greaves et al., 2010; Washington State Legislature, 2012). It is also in accord with the figure reported in other recent adequacy studies (Conley & Rooney, 2007; Mangan & Purinton, 2010; Picus et al., 2012).
Current state statute and state accreditation standards establish only minimal technology requirements. State accreditation standards require a minimum of “one (1) computer per media center with multimedia/networking capacity for administrative purposes only.” No school has received a violation in the last three years related to this standard.
Districts are not required to obtain a particular number of computers/devices for students, and the state does not routinely track the amount of technology equipment districts have. ADE does require districts to develop technology plans, and those plans call for districts to inventory their current technology equipment. The plan also requires districts to provide their “internet connected student/computer ratio.” A sample of 93 districts’ 2012-15 technology plans were examined by the BLR. More than 90% of the district plans reviewed reported having at least one computer for every three students, as can be seen in the table above.
Student to Computer Ratio
# of Districts
% of Sample Districts
1 or less to 1 7 8%
>1-2 to 1 58 62%
>2-3 to 1 20 22%
>3-4 to 1 7 8%
>4-5 to 1 1 1%

Page 47
ADE has been collecting information from schools about the total number of devices they have and the number of those devices that meet the minimum requirements for the assessments being developed by the Partnership for Assessment of Readiness for College and Careers (PARCC). According to this data, there are 2.756 devices per student statewide in the 859 schools that provided device counts to ADE. (Another 36 schools provided data, but these schools could not be matched with enrollment figures.) According to this data, schools reported that 87.2% of their devices meet the minimum PARCC requirements.
EXPENDITURES FROM FOUNDATION FUNDING
In 2013, districts collectively spent $34.3 million in foundation funding on technology. This equates to approximately $75.13 per student in 2012-13, compared with $217.60 funded in the matrix. The following table shows the per-student expenditures for 2012 and 2013. (Note: In past Resource Allocation reports, technology staff have been included in the technology expenditures. However, in an effort to more closely align with the established intent of the matrix, school-level staff expenditures have been calculated as part of the instructional facilitator line, while district-level technology staff expenditures have been calculated as part of the central office line.)
Technology: Foundation Funding and Expenditures
District Funding District Expenditures
2011-12 $97.5 million $29,849,682
2012-13 $99.5 million $34,349,834
Mid-sized districts—those with 751 to 5,000 students—spent more on technology, on average, than other districts. Additionally, high-poverty districts spent less foundation funding per student on technology than more affluent districts. This could result from high-poverty districts having additional funding beyond foundation funding (e.g., Title I) to use for technology purchases. Districts in the highest student achievement quartile spent more than one and a half times as much on technology as the lowest achieving quartile. Open-enrollment charter schools spent considerably more on technology than regular districts. Two charter schools had technology expenditures well above the others, which pushes the total charter school amount higher. One of the charter schools opened in 2012-13, and its technology expenses may be high due to one-time start-up costs. The other charter school is a virtual school which likely must invest more in technology than a traditional school.
$75
$219
$50 $8
9
$62 $83
$58
$35 $9
1
$66
$79
$56
Matrix Funding
$217.60
$0
$50
$100
$150
$200
$250
Per
Stu
dent
District Size Poverty Student Achievement
Foundation Funding Expenditures Per Student Technology
Matrix Funding Amount

Page 48
OTHER TECHNOLOGY FUNDING
In addition to foundation funding, districts have a variety of other funding sources they may use to purchase technology-related items. Some districts may have mills dedicated for technology-related capital outlay. Districts also receive considerable federal funding as described below.
Federal Funding
Districts can use a variety of federal funding sources to purchase technology, including Title I, II, and III funds, IDEA, Part B funds to purchase computers, technology labs and software. Federal funding for technology needs was previously provided through Title II-D, funding known as Enhancing Education Through Technology (Ed Tech) Grants, but the federal government stopped providing this funding in FY 2011. These federal grants provided $1 million to $2.5 million in additional funding for technology needs. This funding increased to nearly $4.8 million in 2010 with funding enhancements provided through the American Recovery and Reinvestment Act.
E-Rate Funding
The Schools and Libraries Program, commonly known as E-Rate, is a Federal Communications Commission (FCC) program that provides discounts to help K-12 schools and libraries pay for telecom and internet services. The $2.4 billion program provided about $27.4 million in discounts to Arkansas schools and educational agencies in 2013. The program uses funding from the Universal Service Fund, which is funded by a fee paid by wireless and telephone customers through their phone bill. The program provides discounts for the purchase of telecommunications services, including broadband, telephone services, web hosting wireless internet access, and the installation of fiber.
Districts are awarded discounts based on the percentage of each schools’ students who are eligible for free or reduced price lunch and whether they are located in an urban or rural location. Districts with higher concentrations of poverty receive greater discounts than those with lower concentrations and districts in urban areas receive lower discounts than those in rural communities. In Arkansas, districts are eligible for discounts ranging from 25% of eligible charges to 90%. Districts and the state must apply for the discounts each year. The Universal Service Administrative Company, a not-for-profit company contracted to administer the program, either reimburses the districts for a certain percentage of their expenses or pays the discounted portion directly to the telecom providers. The funding is distributed with a priority on certain services. Services in lower priority categories may not receive funding if all available funding has been spent on higher priority services. In 2012-13, Arkansas districts, charter schools and education service cooperatives collectively received about $16.93 million in funding.
2012-13
State (for APSCN connectivity to schools, for distance learning connectivity, and for districts purchasing broadband through the state contract)
$10,490,548*
Districts $14,496,075
Educational Service Cooperatives $2,002,994
Charters $433,940 *The state’s E-Rate reimbursement amount for 2012-13 represents discounts for charges incurred in 2011-12 and some from 2012-13.
In February 2014, the FCC announced plans to shift $2 billion over the next two years to the E-Rate program to enhance funding for wireless connectivity. The FCC anticipates the new funding will be generated through fiscal management changes and by redirecting funding for non-broadband services to support Wi-Fi connectivity. On July 11, 2014, the FCC is scheduled to vote on a proposal to reform the E-Rate program, according to a recently released FCC report (Modernizing E-Rate: Providing 21st Century Wi-Fi Networks for Schools and Libraries across America. Federal Communications Commission. July 1, 2014).

Page 49
These changes should significantly increase the availability of Wi-Fi funding for the state of Arkansas. Over the next five years the proposed changes in E-Rate funding are estimated to provide an additional 982 schools with “guaranteed available Wi-Fi funding,” according to the FCC report, compared with the number of schools that received E-Rate funding for “internal connections” in the previous five years. Internal connections, which are necessary for wireless connectivity, have been a secondary priority for the E-Rate program and only a small percentage of schools have received E-Rate funding for this purpose. The FCC estimates that its proposal will expand E-Rate funding to an additional 408,286 Arkansas students. This is a 427% increase in the number of students with guaranteed Wi-Fi funding over the previous five years.
EXPENDITURES FROM ALL FUNDING SOURCES
Foundation funding makes up just a third of the money districts use to make technology purchases. Major sources of funding that districts use for technology include state NSL funding (16%), federal funds (17%) and money from their capital outlay/dedicated M&O funds.
The chart below indicates that the majority of districts’ technology expenditures were made for supplies and materials, with equipment making up the second largest expenditure area for technology.
Foundation $34,349,834
Other State Unrestricted $8,719,314
NSL $17,093,194 $119,429
$350,976
$392,563
$2,436,533 Federal Funds $17,654,335
$7,783,605
CapitalOutlay/ Ded.M&O
$13,752,043
$1,003,058
$719,880
2012-13 District Expenditures for Technology
Foundation
Other State Unrestricted
NSL
PD
ALE
ELL
Other State Restricted
Federal Funds
Building Fund
CapitalOutlay/Ded.M&O
Activity Fund
Food Svs. Fund
$9.5 $4.9
$2.1
$55.9
$29.1
$2.9
$0
$10
$20
$30
$40
$50
$60
Technical Svs Repair and Maintenance
Communications (Network/Internet)
Supplies and Materials
Equipment Other
In Millions
2012-13 District Expenditures for Technology (All Funding Sources)

Page 50
INDIRECT TECHNOLOGY FUNDING
In addition to foundation funding and other types of funding districts receive directly for technology-related expenses, the state provides funding to education service cooperatives and other entities that ultimately benefits school districts. Even though these funding programs do not provide technology funding directly to school districts, they offer districts resources that may alleviate the need to purchase their own technology equipment or services. The following funding programs are appropriated to the Department of Education through the Public School Fund:
Cooperative Education Technical Centers Operations
This funding provided about $1.2 million in 2013 to allow the state’s 15 educational service cooperatives to employ technology coordinators. Each cooperative received $75,000 to employ one technology coordinator whose job is to help member school districts determine technology needs, analyze their technology systems and design local networks. The technology coordinators also provide districts with staff development and information on technology standards. The ADE Rules Governing Technology Training Centers in Education Service Cooperatives indicate that technology coordinators “should” have “demonstrated expertise in providing staff development in instructional technologies and demonstrated expertise in school district technology planning.” The rules also call for technology coordinators to have “relevant training in network operating systems and management information systems.”
Technology Grants
This funding program provided more than $3.6 million in 2013 for various technology resources. The majority of the money ($2.5 million) was provided to the Environmental and Spatial Technology program, known as the EAST Initiative. The EAST Initiative helps schools establish and implement project-based, service learning programs by providing guidance and equipment to participating schools. EAST selects five to 12 new schools each year and provides about $67,000 worth of equipment (including laptops, tablets and printers) to schools that join the program. EAST also provides training to students and professional development to their teachers. More than 200 Arkansas schools have EAST programs, according to the EAST Initiative’s website.
Distance Learning
The Distance Learning program provides about $12 million annually to fund a statewide system of distance learning coursework for Arkansas public schools. Distance learning was implemented in the state by Act 1083 of 1999 and was intended to help schools deal with the shortage of qualified teachers and to increase access to a variety of courses beyond those required by the state accreditation standards. All core courses offered through distance learning must meet or exceed all of the curriculum standards and requirements adopted by the Board of Education. Career and technical courses must be approved by the Arkansas Department of Career Education (ACE). All courses must also be taught by an appropriately licensed educator. The courses offered through distance learning vary widely and may include subjects from photography and journalism to criminal justice and agricultural business. Distance learning classrooms may contain a group of students enrolled in one course or students simultaneously working on various courses. Students are able to remotely interact with both their instructor as well as with other students. An adult facilitator must also be present in every distance learning classroom.
Nearly $6 million of the distance learning funding was distributed to three education service cooperatives and the University of Arkansas (UA). About $4.3 million of that amount funds the actual distance learning coursework services, while the remaining amount funds other types of digital resources for schools. The co-ops and UA’s Arkansas School for Mathematics, Science and the Arts work together as a consortium to provide a coordinated network of distance learning courses statewide. Consortium activities are organized by a state coordinator.
The three co-ops—Dawson (Arkadelphia), Southeast Arkansas (Monticello), and Arch Ford (Plumerville)—and the School for Mathematics, Science and the Arts provide distance learning

Page 51
courses and employ the instructors teaching the classes. Dawson employs 12 instructors, Southeast uses nine instructors, and Arch Ford has 34 distance learning instructors. Each cooperative has its own course specialty to avoid significant overlap in course offerings. Dawson specializes in career and technical courses, Arch Ford in courses providing the required 38 credit units (core courses), and Southeast Arkansas in courses that provide concurrent credit. The University of Arkansas at Monticello and Arkansas Tech University are the two higher education institutions that provide college credit for concurrent courses. They oversee the curriculum provided for these courses but receive no funding for granting credit from their institution.
To supplement the Distance Learning funding provided through ADE, districts that use distance learning pay the consortium an annual membership fee of $2,500. The consortium uses this funding to train on-site facilitators and provide professional development for distance learning teachers. In 2014-15, the consortium will begin charging a $25 per student per course fee.
The Department of Information Systems also receives a significant portion of the Distance Learning funding to provide bandwidth and video services to districts using distance learning courses. In 2013, DIS charged ADE a little over $3.8 million to provide video network services for 212 school districts, two charter schools, 13 education service cooperatives, the Arkansas School for the Deaf and the Arkansas School for the Blind.
The Distance Learning funding also funds one distance learning coordinator in each cooperative. In past years, $75,000 has been allocated for each distance learning coordinator, but ADE is planning to allocate more money for these positions in 2014-15. The increase coincides with a change in the position to digital learning support specialists, which requires more expertise in education delivery through digital learning. The new positions will help plan, implement and evaluate digital learning courses.
During the 2013 legislative session, the General Assembly passed Act 1280, which requires all school districts to provide at least one digital learning course beginning in the 2014-15 school year. The law also requires students beginning with the ninth grade class of 2014-15 to take at least one digital learning course to graduate from high school. The law established a pilot program in 2013-14 in which a group of school districts provided at least one digital learning course. The law also establishes criteria for companies to become “approved digital learning providers” in Arkansas. There are currently 21 approved distance learning providers (http://ardl.k12.ar.us/mod/page/view.php?id=241).
Under Act 1280, districts that have not offered distance learning courses now will have to begin offering these classes. In 2012-13, 57 districts used no distance learning courses, while 168 districts did. Districts that used no distance learning in 2012-13 tended to be larger districts as shown in the table below. About 47% of all public school district students attend school in these districts. Larger districts may not have as much need for distance learning as smaller districts that struggle to find qualified teachers in all required subjects.
# of Distance Learning Course Offered
# of Districts Average
ADM Total ADM
0 57 3,797 216,455
1-5 94 1,553 146,005
6-10 54 1,026 55,406
11-15 14 971 13,596
16-20 7 1,203 9,622
21+ 12 1,525 18,296

Page 52
INSTRUCTIONAL MATERIALS
Instructional materials are the books and other supplies needed for classes and educational research. Instructional materials include textbooks, workbooks, worksheets and other consumables, math manipulatives, science supplies, and library materials. In their 2006 report Picus and Associates noted, “The need for current up-to-date instructional materials is paramount. Newer materials contain more accurate information and incorporate the most contemporary pedagogical approaches.”
COST OF INSTRUCTIONAL MATERIALS
In 2003, the Joint Adequacy Committee adopted the recommendation that the state provide $250 per student for instructional materials and supplies. This funding level was based on recommendations in other states. The General Assembly accepted this recommendation and adopted $250 per student as the funding level for instructional materials.
In 2006, Picus and Associates recommended a reduced funding amount of $185 per student and specified the types and costs of instructional materials that would be included. This amount was intended to cover textbooks, consumable supplies (e.g., workbooks) and pedagogical aides, library texts and electronic services, formative assessments and funding for elementary teachers to purchase instructional materials. Based on the cost estimates provided below, the recommended funding amount was calculated to be $160 per student plus $25 per student for formative assessments.
Elementary Middle High
Textbooks $60 $70 $100
Consumables (workbooks, worksheets, etc.) and pedagogical aides (math manipulatives and science lab supplies)
$60 $50 $50
Library texts and electronic services $20 $20 $25
Formative assessments (informal periodical testing used to gauge what student are learning and to adjust teaching strategies)
$25 $25 $25
Teacher purchase of instructional materials $20 NA NA
TOTAL $185 $165 $200
1,329 1,315 1,402 1,351 1,321
201 189 189 182 177
11,598 12,105
12,670 11,582
10,138
0
2,000
4,000
6,000
8,000
10,000
12,000
14,000
0
500
1,000
1,500
2,000
2,500
2009-10 2010-11 2011-12 2012-13 2013-14
Students in School Districts Taking Distance Learning Courses
Distance Learning Courses School Districts Students

Page 53
The Adequacy Subcommittee, however, recommended funding instructional materials without formative assessments, which are not required by statute or accreditation standards. The Subcommittee set the funding at $160 per student and recommended further study of the issue. In the interim, ADE asked Dr. Margaret Heritage, a national expert, to study the issue. Dr. Heritage met with the House and Senate Interim Committees on Education and then participated in a two-day workshop with district personnel, teachers and ADE staff. Since then, funding for formative assessments has not been added to the matrix. The instructional materials funding has gradually increased as annual inflationary adjustments have been added.
The current matrix funding level for instructional materials ($176.10 for FY 2013) is within the range of other state per-pupil funding levels for instructional materials (e.g., Augenblick et al., 2006, 2011; Picus et al., 2012; Washington State Legislature, 2012), and it is congruent with figures found in other state adequacy studies (e.g., Mangan & Purinton, 2010; Odden, Picus, & Goetz, 2008; Picus et al., 2012).
State statute requires districts to “provide instructional materials, including the availability of any equipment needed to access the instructional materials,” for all K-12 students in the state at no cost to the student (§6-21-401). The state accreditation standards also require school districts to “adopt instructional materials which provide complete coverage of a subject as described in that subject’s curriculum frameworks and which fit the achievement levels of the students assigned to each teacher.” In the last three years, no district has been cited for violations concerning a deficit of instructional materials, according to school performance reports3 and information provided by ADE.
The following sections provides additional information about each of the four areas included in instructional materials funding.
TEXTBOOKS
The consultants’ recommendation for textbooks was calculated based on the purchase of one textbook per student each year with a six-year textbook adoption cycle. State law specifies that districts may select their own textbooks, but any instructional materials purchased with state funds must be consistent with the state “curriculum and educational goals established by the State Board of Education” (§6-21-401). In the past, a state textbook selection committee, appointed by the State Board of Education, established a list of recommended books and other instructional materials. The state then allowed districts to purchase materials from the approved list through a state contract. Act 511 of 2013 eliminated the statewide textbook selection committee. To contain the price of instructional materials, Act 511 included a provision prohibiting textbook publishers from charging a school district “a price for instructional materials that exceeds the lowest contracted price currently bid in another state on the same product” (§6-21-403(e)(2)).
With the passage of Act 511, Arkansas is now one of 29 states and the District of Columbia in which the selection and purchase of textbooks and other instructional materials occurs at the local level. In the other 21 states, textbooks are selected by the state education board or department, according to the State Instructional Materials Review Association. Most of the 21 states that have a state selection process adopt new textbooks on a six-year adoption cycle. According to the most recent data available from NCES, textbook adoption states spent an average of $50.95 per pupil on textbooks in 2010-11, while non-adoption states spent $59.75. Arkansas, which used a state selection process in 2010-11, spent $55.94 per pupil. (The NCES data for 2010-11 does not include textbook expenditures for Alaska, Connecticut, Illinois, New Hampshire, North Dakota, Washington, Idaho, or Texas.)
3 Arkansas Department of Education, Report Card, http://www.arkansased.org/divisions/public-school-
accountability/school-performance/report-card

Page 54
STATE RANKING
NCES provides data on the textbook expenditures in each state. The most recent data available for all states are from 2010-11. According to the NCES data, Arkansas schools spent $55.94 per student on textbooks in 2010-11. Arkansas had the 7th highest per-student textbook expenditures among SREB states and the 5th highest among surrounding states. (The enrollment data used to calculate textbook expenditures per 500 students include pre-K students who have been excluded from the BLR’s foundation funding analysis.)
CONSUMABLES AND OTHER PEDAGOGICAL AIDES
Along with textbooks, the instructional materials line item includes workbooks, worksheets, and teaching aides, such as math manipulatives and science supplies. The consultants did not specify the basis for their estimated cost of these additional instructional materials.
State accreditation standards do not require specific levels of these types of instructional materials, but some state and federal requirements necessitate their purchase, particularly in science. For high school science courses, state accreditation standards require “active student participation in laboratory experience…for a minimum of 20% of instructional time.” No district has been cited for violations of this standard for at least the last three years.
The need for science equipment and supplies has increased in recent years at the elementary level as the requirements of No Child Left Behind shifted to include accountability in science courses. The federal law required states to begin testing at least three grades of students in science by 2007-08. In 2007-08, Arkansas began administering science benchmark exams to 5th and 7th graders and end-of course biology exams to high school students enrolled in biology.
LIBRARY MATERIALS
In 2006 Picus and Associates recommended providing $20 per student for elementary and middle school library collections and subscriptions and $25 per student for high school libraries. The funding for library collections, according to the consultants, was at that time above the national average. More recent data indicates that school libraries nationally spent an average of $11,827 in 2012.4 For a school of 500 students, this would equate to about $23.65 per student.
A survey of school library programs across the country indicates that school libraries are continuing to increase the number of books in their collection, while the number of periodical subscriptions and video materials is decreasing. The survey found that schools had on average 13,517 books in their collections in 2012. State standards require a minimum of 3,000 volumes or eight books per student, whichever number is larger. According to ADE accreditation reports, no district has been cited for violations concerning libraries in the last three years. For 2013, the average book price charged to school libraries ranged from $6.93 for a paperback children’s book to $28.27 for a hardback non-fiction adult title, according to the average book prices published by the School Library Journal.5
While school libraries are increasing their book collections, they are also increasing their computer access. The number of computers in libraries (29.29 in 2012) has increased by about 22.5% since 2008, according to the American Association of School Librarians survey.
TEACHER PURCHASE OF INSTRUCTIONAL MATERIALS
The matrix provided an additional $20 per elementary school pupil to cover the costs of the elementary teacher fund. This fund provides $500 for each elementary school teacher for the purchase of instructional materials.
4 American Association of School Librarians, “School Libraries Count!” (2012)
5 School Library Journal, “SLJ’s Average Book Prices 2013,” June 11, 2013

Page 55
EXPENDITURES FROM FOUNDATION FUNDING
In 2013, districts collectively spent nearly $50.5 million in foundation funding on instructional materials. This equates to approximately $110.47 per student in 2012-13, compared with $176.70 funded in the matrix. The following table shows the per-student expenditures for 2012 and 2013.
On average, charter schools spent well above the matrix funding amount for instructional materials. However, one charter school had unusually high expenditures for instructional materials—$3,024 per student. If this school is removed, charter schools logged $124 per student in instructional materials expenditures, which is below the matrix amount. Districts differed very little on per-student expenditures for instructional materials based on district size or student achievement. High poverty districts, however, spend considerably less foundation funding for instructional materials than low poverty districts and low achieving districts spent less than higher achieving districts.
EXPENDITURES FROM ALL FUNDING SOURCES
One reason districts spent less foundation funding on instructional materials than they were provided may be that they have other sources of funding to use for this purpose. Districts use foundation funding to cover about 56% of their total expenditures for instructional materials. Other sources of funds used include federal funds, other state unrestricted funds and state NSL funding.
$110
$313
$97
$110
$116
$115
$104
$39 $1
23
$107
$113
$93
Matrix Funding $176.70
$0
$50
$100
$150
$200
$250
$300
$350
Per
Stu
dent
District Size Poverty Student Achievement
Foundation Funding Expenditures Per Student: Instructional Materials
Matrix Funding Amount
Foundation, $50,509,677
$9,990,543
$7,111,271
$293,940
$373,376
$877,400
$3,363,346
$9,986,398
$3,147,147
$214,915
$4,263,627
2012-13 District Expenditures for Instructional Materials
Foundation Other State Unrestricted NSL PD ALE ELL Other State Restricted Federal Funds Building Fund Debt Svs. Fund CapitalOutlay/Ded.M&O Activity Fund Food Svs. Fund
Instructional Materials: Foundation Funding and Expenditures
District Funding
District Expenditures
2011-12 $79,208,690 $54,971,747
2012-13 $80,788,124 $50,509,677

Page 56
EXTRA DUTY FUNDS
Schools use extra duty funds to pay stipends for teachers who coach and those who supervise after-school clubs or other extracurricular activities, such as newspaper or the yearbook.
COST OF EXTRA DUTY FUNDS
In 2003, the Joint Adequacy Committee recommended providing $90 per student for extra duty activities. The amount was calculated based on $60 per student for middle schools and $120 per student for high schools. Although a panel of education professionals convened for the adequacy study asked that $30 per student be added for elementary schools, the Committee did not recommend additional funds for these younger students.
In their 2006 report, Picus and Associates wrote that students who are engaged in extracurricular activities tend to “perform better academically than students not so engaged, though too much extra-curricular activity can be a detriment to academic learning.” They noted that while districts received $90 per student for extra duty funds, they actually spent $215 per student for activities during the 2004-05 school year, most of which was spent on athletics. They argued that while athletics are important, “we are not aware of any research that suggests the benefits of highly competitive interscholastic athletic programs is any more important in improving student learning than more modest athletic programs.” They further argued that funding for coaches should be at the same level as the funding provided for stipends for other extra-curricular activities. They recommended adding only an inflationary adjustment to the extra duty funding in the matrix, increasing the amount to $100 per student, and suggested that districts wanting to spend more on athletics could do so using local funds.
The consultants' 2006 report recommended $100 per student, but that recommendation was based on an earlier miscalculation in the original matrix. The Adequacy Subcommittee determined that the original number did not properly weight the funding amount to account for the fact that elementary students, who made up nearly half of the student population, did not require extra duty funding. The General Assembly corrected the calculation in 2007 by applying the consultants' 2003 recommendation to the FY 2005-06 count of elementary, middle and high schools. That calculation resulted in a per-student cost of $48.84, which was rounded to $50 for the FY 2006-07 matrix level. The matrix amount for extra duty pay was developed using the following calculations:
Basis for Extra Duty Pay
School/Grade FY06 Enrollment % of Total Unit Price Weighted Cost
Elementary 224,241 48.34% $0 $0
Middle 101,739 21.93% $60 $13.16
Secondary 137,942 29.73% $120 $35.68
Totals 463,922 100% $48.84
In the years since the funding amount was set, the extra duty line gradually increased as the foundation funding amount received annual inflationary increases.
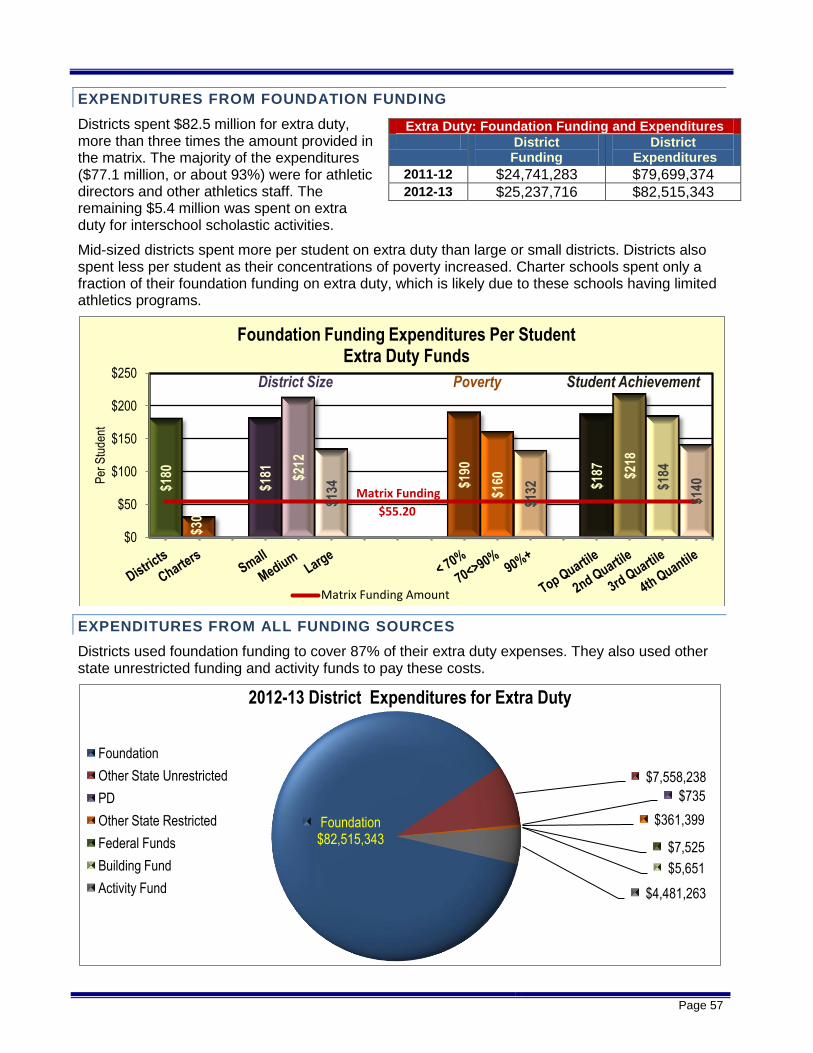
Page 57
EXPENDITURES FROM FOUNDATION FUNDING
Districts spent $82.5 million for extra duty, more than three times the amount provided in the matrix. The majority of the expenditures ($77.1 million, or about 93%) were for athletic directors and other athletics staff. The remaining $5.4 million was spent on extra duty for interschool scholastic activities.
Mid-sized districts spent more per student on extra duty than large or small districts. Districts also spent less per student as their concentrations of poverty increased. Charter schools spent only a fraction of their foundation funding on extra duty, which is likely due to these schools having limited athletics programs.
EXPENDITURES FROM ALL FUNDING SOURCES
Districts used foundation funding to cover 87% of their extra duty expenses. They also used other state unrestricted funding and activity funds to pay these costs.
$180
$30
$181
$212
$134
$190
$160
$132
$187
$218
$184
$140
Matrix Funding
$55.20
$0
$50
$100
$150
$200
$250
Per
Stu
dent
District Size Poverty Student Achievement
Foundation Funding Expenditures Per Student Extra Duty Funds
Matrix Funding Amount
Foundation $82,515,343
$7,558,238
$735
$361,399
$7,525
$5,651
$4,481,263
2012-13 District Expenditures for Extra Duty
Foundation
Other State Unrestricted
PD
Other State Restricted
Federal Funds
Building Fund
Activity Fund
Extra Duty: Foundation Funding and Expenditures District
Funding District
Expenditures
2011-12 $24,741,283 $79,699,374 2012-13 $25,237,716 $82,515,343

Page 58
SUPERVISORY AIDES
Supervisory aides are staff who help students get on and off buses in the morning and afternoon, and supervise lunch and recess periods.
COST OF SUPERVISORY AIDES
During the 2003 adequacy study, the Joint Adequacy Committee took the advice of panels of Arkansas educators and provided $35 per student to pay for supervisory aides to monitor students getting on and off the bus, and during lunch and recess. Although the state accreditation standards do not specifically require supervisory aides, the educator panel urged the Legislature to include this funding due to a law passed in 2003 that limits the amount of time teachers may be assigned to these supervisory duties. Districts cannot assign teachers to more than 60 minutes of “non-instructional duties” per week without receiving additional pay (§6-17-117).
When the consultants were rehired in 2006, they noted that the original $35 per student was intended to provide two full-time supervisory aides for a school of 500. They again recommended two supervisory aides, but they suggested increasing the funding amount to $98.70 per student. This higher amount was based on a salary of $24,676 each.
The Adequacy Study Oversight Subcommittee, however, determined that a school of 500 students would require just one supervisory aide each day. They based this conclusion on a 2006 survey conducted by ADE in which districts were asked to submit the total hours spent for supervisory duties and the cost of those hours. That data indicated that the average number of supervisory hours per day per student equaled .01742, or 8.71 hours per day for a school of 500 students. The average salary and benefit cost of this time was $87.21 per hour. Due to the statutory time restrictions, teachers could fill only 6.28 hours of the 8.71 supervisory hours needed, leaving 2.43 hours that would need to be filled by a non-teacher. For this amount of time, the Adequacy Subcommittee determined that one supervisory aide would be adequate, but increased the level of funding by 33%, based on the information provided by ADE. The 2012-13 matrix funding amount of $54.70 provides a salary of $27,350 (not including benefits) for one supervisory aide.
Since 2006, Odden and Picus have remained consistent in recommending two supervisory aides for elementary and middle schools and three of these aides for high schools (Odden et al., 2008a, 2008b; Picus et al., 2012).
In school surveys conducted for past adequacy studies, principals were asked to discuss their use of supervisory aides. Most indicated that they do not pay for additional time but rather work within the 60 minutes of duty in teacher contracts, filling in with other classified personnel when needed. Many of the administrators felt the 60-minute statutory restriction was not enough time for management of their school. Similar responses were given to a school survey question the BLR asked during the current adequacy study.
School Survey Question: What state or federal laws or ADE rules should be changed or eliminated and why?
Among the responses received for this question, 15 of the 74 principals surveyed complained about the restrictions on teachers’ time for supervisory duties. Some of those principals complained about the 60 minute limit on supervisory duty, while others complained about the statutory requirement that teachers be allowed at least 30 minutes for an uninterrupted, duty-free lunch each school day (§6-17-111). These principals said these requirement impede their ability to schedule effectively and they needed more flexibility.
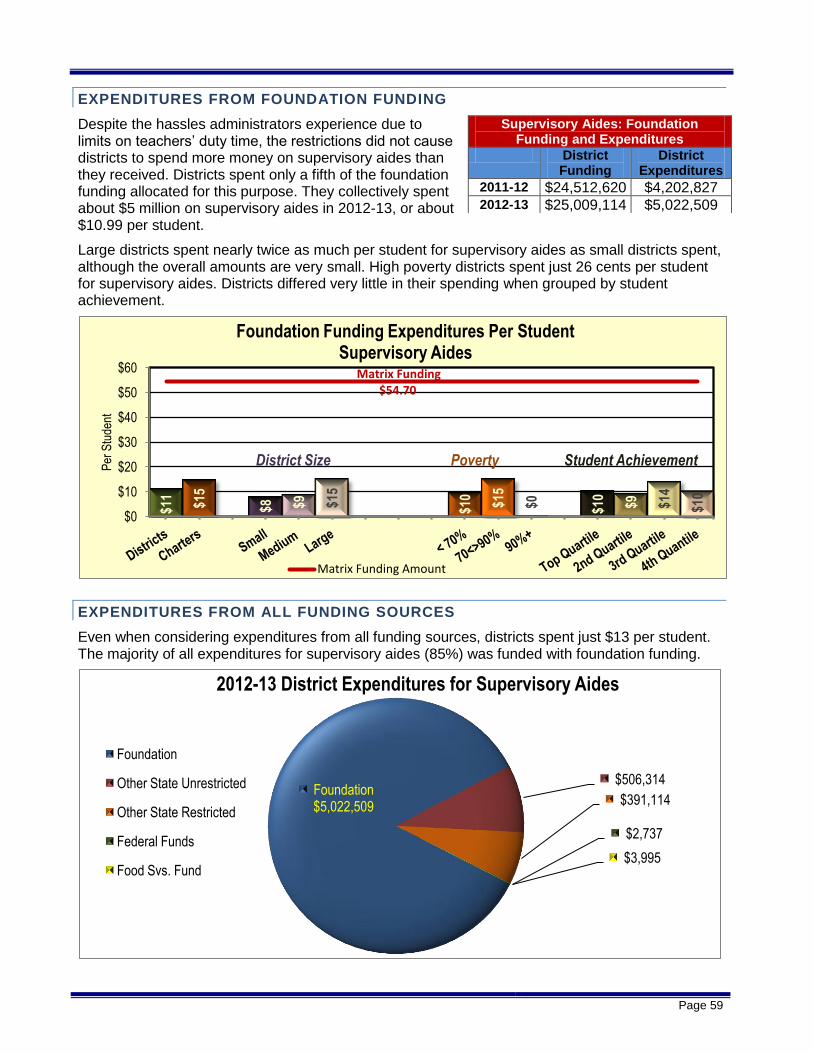
Page 59
EXPENDITURES FROM FOUNDATION FUNDING
Despite the hassles administrators experience due to limits on teachers’ duty time, the restrictions did not cause districts to spend more money on supervisory aides than they received. Districts spent only a fifth of the foundation funding allocated for this purpose. They collectively spent about $5 million on supervisory aides in 2012-13, or about $10.99 per student.
Large districts spent nearly twice as much per student for supervisory aides as small districts spent, although the overall amounts are very small. High poverty districts spent just 26 cents per student for supervisory aides. Districts differed very little in their spending when grouped by student achievement.
EXPENDITURES FROM ALL FUNDING SOURCES
Even when considering expenditures from all funding sources, districts spent just $13 per student. The majority of all expenditures for supervisory aides (85%) was funded with foundation funding.
$11
$15
$8
$9
$15
$10
$15
$0
$10
$9
$14
$10
Matrix Funding $54.70
$0
$10
$20
$30
$40
$50
$60
Per
Stu
dent
District Size Poverty Student Achievement
Foundation Funding Expenditures Per Student Supervisory Aides
Matrix Funding Amount
Foundation $5,022,509
$506,314
$391,114
$2,737
$3,995
2012-13 District Expenditures for Supervisory Aides
Foundation
Other State Unrestricted
Other State Restricted
Federal Funds
Food Svs. Fund
Supervisory Aides: Foundation Funding and Expenditures
District Funding
District Expenditures
2011-12 $24,512,620 $4,202,827 2012-13 $25,009,114 $5,022,509

Page 60
SUBSTITUTES
State statute requires districts to provide teachers with one day of paid sick leave per contract month (§6-17-1204), or a total of nine or ten days for most teachers. When teachers are absent, schools must rely on substitute teachers to manage classes. State law requires substitutes who teach more than 30 consecutive days to have a bachelor's degree or be licensed to teach. The only requirement for all other substitutes is a high school diploma or Graduate Equivalent Degree (GED).
COST OF SUBSTITUTES
The 2003 consultants’ report notes that the Joint Adequacy Committee recommended districts receive funding to pay for 10 days for each classroom teacher and specialist teacher (non-core) in the matrix. The Committee calculated the funding amount based on an average daily salary of $100, plus benefits, or $121 per day.
In 2006, Picus and Associates noted that the funding level the General Assembly had approved for substitutes appeared to adequately cover what districts were spending on substitute teachers. However, they noted that districts tended to pay less than the $100 per day salary on which the matrix is based. “The data actually showed that the average daily reimbursement rate for substitute teachers was below the average wage of a building custodian. Such a low number indicates a problem; either qualified substitute teachers are not available so the wage paid equals the worth of the substitute hired, or substitute wages need to increase to allow districts to hire more qualified substitute teachers” (Picus, 2003, p. 46).
The consultants recommended that the funding level for substitute pay continue to be based on an average daily salary of $100. The Committee, however, reduced the substitute funding allocation based on evidence that the average daily pay for substitutes is lower than $100. Instead, the Committee used a base salary of $75 per day and set the funding amount at $59 per pupil. The funding level has increased annually as inflationary adjustments were applied to the foundation funding rate. The FY 2013 matrix per pupil figure of $64 appears to be within the range presented in other state adequacy studies (e.g., Augenblick et al., 2002; Mangan & Purinton, 2010; Odden et. al., 2006b).
The substitute funding rate of $65.20 in FY 2013-14 supports an average daily rate of pay of about $107, plus 22% in benefits, for the 24.94 classroom teachers in the matrix. To find out how this amount compares with districts’ actual practice, the districts were asked to provide information on their substitute pay rates. The district survey requested pay rates for substitutes the districts hire directly and for those they hire through an outside agency. On average, districts paid a rate that is considerably below the amount supported in the matrix.
District Survey Question: For the substitutes your district is hiring directly in 2013-14, what is the average daily pay for:
District Average Range
Certified Teachers $73.57 $50-$265
Substitutes with degrees but not certified $61.63 $50-$125
Substitutes with no degree $59.30* $32.80-$76 *Two other districts said they pay $7.25 and $8 per hour.
District Survey Question: For the substitutes your district is hiring through a substitute placement company in 2013-14, what is the average daily pay for:
District Average Range
Certified Teachers $76.01 $50-$235
Substitutes with degrees but not certified $69.09 $50-$161
Substitutes with no degree $65.62 $50-$87.75

Page 61
Of the 69 districts that listed their wages for the certified substitutes they hire directly and for certified substitutes they hire through a placement company, 37 said there was no difference in pay between the two hiring methods. Eight said they pay less for placement company substitutes than for substitutes they hire directly, and 24 said they pay more for placement company substitutes. It appears that of those who pay more for placement company substitutes, a common mark-up is 35%.
Of the 65 districts that listed their wages for the degreed but not certified substitutes hired directly and for those they hire through a placement company, 39 said there was no difference in pay. Three said they pay less for placement company substitutes than for substitutes they hire directly, and 23 said they pay more for placement company subs. It appears that, of those who pay more for placement company substitutes, a common mark-up is 35%.
While the substitute funding was not intended to cover substitutes for staff other than classroom teachers, some districts pay for substitutes for personnel such as counselors, school secretaries, custodians, and teaching aides. To better understand the type of staff districts typically hire substitutes to cover, the district survey posed this question:
District Survey Question: Besides classroom teachers, for which positions does your district typically hire a substitute?
The vast majority of districts hire substitutes for bus drivers. Many districts also hire substitutes to cover for custodians, school secretaries, instructional aides, and nurses.
# of Districts That Hire Subs for This Position
% of All Districts
Bus drivers 214 90%
Custodians 139 58%
School-level secretaries 125 53%
Instructional aides 109 46%
Nurses 101 42%
Central office secretaries 29 12%
Instructional facilitators 10 4%
Counselors 10 4%
Building-level administrators 3 1%
Central office administrators 0 0%
None 7 3%
Other 61 26%
No Response 2 1%
Of the 61 districts that indicated they hired substitutes for other positions not specifically listed, 54 (23%) indicated they hired substitutes for food service employees. The other districts indicated hiring subs for crossing guards, bus aides, maintenance, media specialists, security and special education paraprofessionals.

Page 62
EXPENDITURES FROM FOUNDATION FUNDING
Districts spent slightly more foundation funding on substitutes than they received for that purpose in 2012-13. Collectively, they spent $30.7 million, or $67.24 per student.
Substitutes: Foundation Funding and Expenditures
District Funding District Expenditures
2011-12 $28,674,278 $29,706,126
2012-13 $29,261,120 $30,741,682
Small districts spent slightly more foundation funding per student for substitutes than large districts spent. High poverty districts spent more than low poverty districts, and low achieving districts spent more than higher achieving districts. These differences may be a reflection of teacher absenteeism in these districts. However, while differences exist in spending patterns, the actual dollar differences between groups is relatively small.
EXPENDITURES FROM ALL FUNDING SOURCES
Districts used foundation funding to cover about 82% of all their expenditures for substitutes.
$67
$61 $7
2
$69
$64
$64 $7
4
$76
$63
$68
$65
$74
Matrix Funding $64.00
$0
$20
$40
$60
$80
$100
Per
Stu
dent
District Size Poverty Student Achievement
Foundation Funding Expenditures Per Student Substitutes
Matrix Funding Amount
Foundation $30,741,682
$4,443,693
$252,801
$159,600
$46,739
$815,299
$1,054,443
$10,841
2012-13 District Expenditures for Substitutes
Foundation
Other State Unrestricted
NSL
ALE
ELL
Other State Restricted
Federal Funds
Activity Fund

Page 63
HEALTH INSURANCE FOR SUBSTITUTES
The federal Affordable Care Act requires large employers (those with 50 or more full-time employees) to provide health insurance benefits to their employees or face a penalty. Under the law, employers are required to offer insurance to employees who work on average 30 or more hours per week. This employer mandate was delayed until January 1, 2015. However, it was believed that the law could result in some districts electing to hire substitutes through an outside agency, such as Subteach, where they would be contract workers, rather than employees. Because substitutes hired through a temporary agency are typically more expensive than those hired directly, the district survey attempted to quantify the extent to which districts are moving toward hiring agencies.
District Survey Question: In 2012-13, did your district pay the health insurance match for any substitutes? Two districts said they pay the health insurance match for substitutes, while the vast majority (227) said they did not. Nine districts did not respond to this question. District Survey Question: For 2012-13 (last year), what percentage of your substitutes were hired directly by the district and what percentage were contracted through a substitute placement company (e.g., Subteach, Kelly Services, PESG, etc.)? More than half of the districts (127) said they hired 100% of their substitutes directly in 2012-13, while 65 districts said they hired 100% of their substitutes through a placement company. Another 42 had a mix of directly hired substitutes and substitutes hired through an agency. Four districts either did not respond to this question or provided an unusable answer. District Survey Question: For 2013-14 (current year), what percentage of your substitutes does your district anticipate hiring directly and what percentage does your district anticipate contracting through a substitute placement company? About 37% of districts (87) said they anticipate hiring 100% of their substitutes directly in 2013-14, while 38% (91 districts) said they expected to hire 100% of their substitutes through a placement company. Six districts either did not respond to this question or provided an unusable answer. The responses indicate that at least 40 districts expected to shift their substitute hiring practices toward using outside agencies.
Hiring Method Average
District %
Hired directly 56%
Contracted through a substitute placement company
44%
Other 0%
Hiring Method Average
District %
Hired directly 41%
Contracted through a substitute placement company
59%
Other 0%

Page 64
DISTRICT-LEVEL RESOURCES
District-level expenditures include operations and maintenance, central office expenses, and district transportation expenses. This section of the report also addresses expenditures from foundation funding that are not readily attributable to a matrix line item. Examples of these types of expenditures include instructional aides, pre-K programs and adult education.
CARRY-FORWARD TRANSITION
The original matrix had a line item called “carry-forward” that represented what might be best described as miscellaneous expenditures that are not otherwise identified in the matrix. In the 2003 report, the consultants recommended line items and funding for many school costs that would be included in the "carry-forward'' line item.
With these assumptions and methods, we began to calculate the additional costs. To do so, we took total expenditures of school districts (minus expenditures for debt and expenditures supported by federal sources) and divided them into two parts. The first were those expenditures that would be "carried forward" unchanged, and included such things as fiscal services, board and legal services, executive administration (superintendent), athletics, facilities and capital other than debt, community services, food services, and other non-instructional services, operations and maintenance, transportation, technology services, certain instructional support such as drug and crime prevention and tuition paid to other local school districts (Picus, 2003 p. 65).
Identifying and quantifying those expenditures more precisely was one of the primary purposes of the 2006 consultants' report. The consultants separated the carry-forward amount into three line items that included: operations and maintenance, central office expenses, and transportation expenses.
OPERATIONS AND MAINTENANCE
This line of the matrix includes the staff and other resources necessary to maintain school facilities and grounds and keep school buildings clean, heated, and cooled.
COST OF OPERATIONS AND MAINTENANCE
In their 2003 report, Picus and Associates did not provide a recommendation on funding for operations and maintenance. Instead, they noted that the Joint Adequacy Committee recommended that the existing amounts districts were spending on operations and maintenance should be provided to school districts. Any changes to those amounts were to be identified by a separate study of school facilities needs. Until the study could be completed, the General Assembly chose to include the funding for operations and maintenance within a general category for district-level expenditures, called the carry-forward. The matrix included $1,152 per student for this purpose.
In November 2004, the Task Force to the Joint Committee on Educational Facilities released its final report, which noted the findings of the 32nd Annual Maintenance and Operations Study conducted by American School and University Magazine (2003). That national study found that, on average, the cost of school district operations and maintenance is approximately 9% of a district’s total expenditures. The General Assembly then passed Act 1426 of 2005, which required districts to spend at least 9% of their foundation funding to pay for utilities, custodial services, maintenance, repair, and renovation activities. If districts do not spend the required 9%, they must transfer unspent funds into an escrow account to be used for future O&M expenses. At the end of the 2012-

Page 65
13 school year, 20 districts had not spent the full 9% on O&M, according to an ADE Commissioner’s Memo.6 At the end of the 2013-14 school year, just six districts had not spent their 9% minimum.7
In 2006, Picus and Associates recommended separating the carry-forward into three different categories, including one for operations and maintenance. The consultants suggested providing $594 per student to cover custodians, maintenance workers, groundskeepers, maintenance supplies, and utilities.
Cost Per Pupil Average Salary in 2006
Custodians $170 $29,471
Maintenance $65 $29,471
Supplies $97 NA
Grounds $65 $29,471
Utilities $160 NA
Insurance $37 NA
TOTAL $594
The Adequacy Subcommittee determined that the consultants’ recommendations were based on costs in higher priced geographical areas of the country and on more duties than are required in Arkansas. The House and Senate Interim Committees on Education asked the Academic Facilities Oversight Committee to study the issue further. The Facilities Oversight Committee then recommended O&M funding be set at 9% of the foundation funding rate to mirror the statute established by Act 1426 of 2005. This amount also included funding to support a director of operations and maintenance and a secretary.
Some people involved with the Task Force to the Joint Committee on Educational Facilities recall a discussion about whether districts’ utility costs should be included in the 9% required expenditure amount. Their concern was that districts’ utility costs would comprise such a large portion of O&M expenditures that districts would not be compelled to spend adequate amounts on facilities upkeep. In 2012-13, districts spent $100.5 million on utilities (water/sewer, telephone, networking/internet, natural gas, electricity, and butane/propane), or about $220 per student. About 23.4% of districts’ O&M expenditures were utility costs. If these utility expenditures had been excluded from O&M expenditures, 179 districts would have been under their 9% requirement in 2012-13 and would have been required to spend more on facility upkeep.
In addition to the 9% for O&M, the 2006 Adequacy Subcommittee also recommended providing $27 per student for property insurance. The amount for property insurance was derived through a calculation made in January 2007, when ADE analyzed the total state school district expenditures for property insurance. The total was $12,350,868, which was divided by 456,648.56 ADM with the result being $27 expended per student. The 2006 Adequacy Subcommittee also recommended that districts be required to spend the $27 per student only on property insurance. That recommendation never became law, but in 2007, the General Assembly authorized the Commission for Arkansas Public School Academic Facilities and Transportation to promulgate rules to establish a property insurance requirement (§6-21-114(d)(2)(A)). Those resulting rules require each district to “provide or acquire all risk property coverage for direct physical loss of or damage to school district buildings, structures, and business personal property (contents)” (Rules Governing Property Insurance Requirements, 4.01). In 2012-13, districts collectively spent $41.64 per student from all funding sources on insurance ($39.05 per student for property insurance, plus $2.60 for liability, fleet, accident and other insurance).
6 ADE Commissioner’s Memo, 9% Requirement for Utilities and Facilities Maintenance, FIN-13-084, June 5,
2013 7 ADE Commissioner’s Memo, 9% Requirement for Utilities and Facilities Maintenance, FIN-14-085, June 26,
2014

Page 66
When the General Assembly established the O&M funding level in 2006, the overall foundation funding level had not been finalized. The Legislature used an amount they knew would exceed the final foundation amount to make sure the O&M funding level would be adequate. The total O&M amount in 2007-08 and 2008-09 was set at $581 per student, which included $554 for the 9% of foundation funding and $27 for property insurance. The result is that the amount for 2007-08 is 10.16% of the total matrix for that year and 10.04% of the total matrix for 2008-09. The table to the right presents the operations and maintenance funding history for each year since the recalibration of the matrix in 2006.
Since that time, the O&M funding amount has steadily increased as a cost of living adjustment has been applied each year to the total foundation funding rate. The study on which the 9% figure is based was last published in 2009. At that time, the American School and University Magazine’s Annual Maintenance and Operations Study found that, on average, districts nationally spent $910.20 per student on O&M, including utilities, or 9.57% of districts’ average total expenditures per student. In 2013, the matrix provided $629 per student for O&M, and collectively districts received $287.6 million for this purpose.
O&M STAFFING LEVELS
The state has no required minimum staffing level for operations and maintenance personnel, but the state’s Public School Facilities, Maintenance, Repair and Renovation Manual, maintained by the Division of Public School Academic Facilities and Transportation (Facilities Division), provides the following staffing recommendations:
Operations and Maintenance Position Recommended Staffing Level
Custodians One FTE per 18,000 to 20,000 square feet
Grounds/General Labor Personnel One FTE per 18-20 acres
Maintenance Personnel One FTE per 80,000-90,000 square feet
According to data provided by the Facilities Division, districts are slightly under staffed for custodians on average and slightly overstaffed on maintenance staff. The FTE data come from staff counts that districts provided to the Facilities Division in their facilities master plans. About 85% of the districts (202) had fewer custodial FTEs than recommended. About 37% of districts (88) had fewer maintenance FTEs than recommended. The Facilities Division does not have data on grounds staff or district acreage.
Operations and Maintenance Position Actual Staffing Ratios for Current Year
Custodians One FTE per 24,744 square feet
Grounds/General Labor Personnel Data is not available
Maintenance Personnel One FTE per 73,520 square feet
History of Matrix Foundation Funding for Operations & Maintenance
Fiscal Year
Matrix Funding for O&M per
ADM
Percent of Foundation
Funding
2008 $581.00 10.16%
2009 $581.00 10.04%
2010 $592.60 10.04%
2011 $604.50 10.04%
2012 $616.60 10.04%
2013 $629.00 10.04%
2014 $640.30 10.02%
2015 $651.80 10.00%
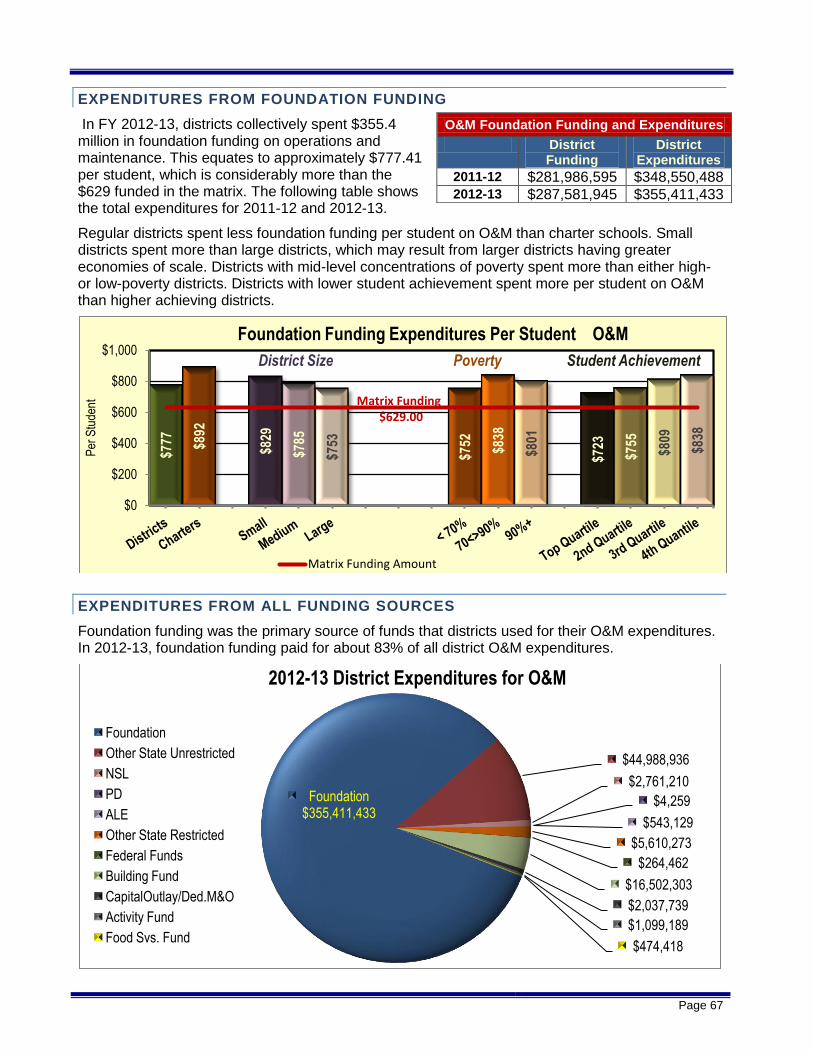
Page 67
EXPENDITURES FROM FOUNDATION FUNDING
In FY 2012-13, districts collectively spent $355.4 million in foundation funding on operations and maintenance. This equates to approximately $777.41 per student, which is considerably more than the $629 funded in the matrix. The following table shows the total expenditures for 2011-12 and 2012-13.
Regular districts spent less foundation funding per student on O&M than charter schools. Small districts spent more than large districts, which may result from larger districts having greater economies of scale. Districts with mid-level concentrations of poverty spent more than either high- or low-poverty districts. Districts with lower student achievement spent more per student on O&M than higher achieving districts.
EXPENDITURES FROM ALL FUNDING SOURCES
Foundation funding was the primary source of funds that districts used for their O&M expenditures. In 2012-13, foundation funding paid for about 83% of all district O&M expenditures.
$777
$892
$829
$785
$753
$752
$838
$801
$723
$755
$809
$838
Matrix Funding $629.00
$0
$200
$400
$600
$800
$1,000
Per
Stu
dent
District Size Poverty Student Achievement
Foundation Funding Expenditures Per Student O&M
Matrix Funding Amount
Foundation $355,411,433
$44,988,936
$2,761,210
$4,259
$543,129
$5,610,273
$264,462
$16,502,303
$2,037,739
$1,099,189
$474,418
2012-13 District Expenditures for O&M
Foundation
Other State Unrestricted
NSL
PD
ALE
Other State Restricted
Federal Funds
Building Fund
CapitalOutlay/Ded.M&O
Activity Fund
Food Svs. Fund
O&M Foundation Funding and Expenditures
District Funding
District Expenditures
2011-12 $281,986,595 $348,550,488
2012-13 $287,581,945 $355,411,433

Page 68
Data collected by NCES indicates that the national per-student expenditure for operations and maintenance for FY 2011, the most recent year of data available, was $1,015. According to the NCES data, Arkansas schools spent $902 per student on operations and maintenance.8
STATE RANKING
NCES provides data on total operations and maintenance expenditures in each state. The most recent data available for all states are from 2010-11. According to the NCES data, Arkansas schools spent $902.49 per student on O&M in 2010-11. Arkansas had the 8th highest per-student O&M expenditure among SREB states and the 4th highest among surrounding states. (The enrollment data used to calculate the per-student O&M expenditures include pre-K students who have been excluded from the BLR’s foundation funding analysis.)
CENTRAL OFFICE
The matrix provides funding for district-level administrative expenses including the salaries and benefits of the superintendent, as well as administration personnel (legal, fiscal, human resources, communications, etc.), district instructional and pupil support directors, and clerical staff. The central office line of the matrix also provides funding for activities of the local school board. In their 2006 report, Picus and Associates noted the importance of an effective central office in a district. They wrote, “The district office has the responsibility to organize and manage all aspects of the district including the curriculum and instructional program, as well as to implement national, state, and local reforms, oversee budgets, and provide necessary materials, equipment, facilities, and repairs to the schools” (Picus, 2006, p. 67).
COST OF THE CENTRAL OFFICE
In 2003, Picus and Associates did not provide a recommendation on funding for operations and maintenance. The General Assembly chose to include the funding for central office expenses within a general category called the carry-forward and included $1,152 per student in the matrix for this purpose.
When the consultants were rehired in 2006, they attempted to specify an adequate funding amount for the central office. They noted that when they completed their first report for Arkansas in 2003, little research existed on the number of people and resources necessary for the central office. The issue is further complicated, they said, by the fact that some district office personnel, such as special education directors and federal coordinators, are partially funded with federal dollars. In 2006 the consultants contended, based on research completed in 2005, that a district of 3,500 students would need a central office staff of 17 people as described in the table below.
Central Office for District Size of 3,500 Students Superintendent's Office Positions Associated Salary
Superintendent 1 $118,748
Assistant Superintendent 1 $110,516
Secretary 2 $34,751
Business Office
Business Manager 1 $54,940
Human Resources Manager 1 $110,516
Secretary 1 $34,751
Payroll Clerk 1 $34,751
Accounts Payable Clerk 1 $34,751
8 National Center for Education Statistics, Revenues and Expenditures for Public Elementary and Secondary
Education: School Year 2010-11 (Fiscal Year 2011), retrieved from http://nces.ed.gov/pubs2013/2013342.pdf

Page 69
Central Office for District Size of 3,500 Students Curriculum and Support
Director of Pupil Services 1 $110,516
Director of Special Education 1 $110,516
Secretary 3 $34,751
Technology
Director of Technology 1 $110,516
Operations & Maintenance
Director of M&O 1 $110,516
Secretary 1 $34,751
Total 17
Prorating to a district size of 500 students, Picus and Associates reasoned, would require 1/7th of the staff described above. Based on this staffing level, the consultants recommended $328 per student for central office staff and another $263 for other miscellaneous central office needs, for a total of $591 per student.
The consultants’ recommendation was based on a prototypical district of 3,500 students, but in Arkansas in 2006, only 26 of the districts, or 11%, had 3,500 or more students. To test the appropriateness of the recommended funding level, ADE obtained FY 2005-06 central office expenditures and personnel counts for districts with an ADM between 3,000 and 4,000. The average number of personnel was 17.82. The average total central office cost was $395 per ADM.
Based on this information, the Adequacy Subcommittee determined that the consultants’ figures were “inflated because of being computed on higher-priced geographical areas and on more duties than are required in Arkansas.” The Subcommittee, instead, recommended that central office expenses be funded at $376 per student. This figure represented the $395 per student in actual costs, less $19 per student for the Director of Operations and Maintenance and secretary positions that were included as part of the operations and maintenance line of the matrix.
The only central office position required by the state accreditation standards is the superintendent. In 2012-13, Arkansas superintendents earned an annual salary of $107,295 on average, according to a report the BLR presented in June 2014. When $1,572 is added for health insurance and 22% is added for retirement, Medicare and other expenses, the average superintendent’s compensation package totals $130,472.
The June report also examined the salaries of assistant superintendents, finding just 56 of the 239 districts in 2012-13 had employed an assistant superintendent. On average, these 56 districts employed 1.35 FTE assistant superintendents, but larger districts had more assistant superintendents than smaller districts. The average salary for assistant superintendents was $104,834.
STATE RANKING
NCES provides data on the number of local education agency (LEA) administrators and LEA administrative support staff in each state. This NCES category includes superintendents, deputy superintendents, assistant superintendents, district level business managers and instructional support staff. The most recent data available for all states are from 2011-12. According to the NCES data, Arkansas had a total of .7 LEA administrators per 500 students in 2011-12. Arkansas had the 4th highest number of school administrators per 500 students among SREB states and the 3rd highest number among surrounding states. (The enrollment data used to calculate the LEA administrators per 500 students include pre-K students who are excluded from the BLR’s foundation funding analysis.)

Page 70
The NCES category for LEA administrative support staff includes business office support, data processing employees, and secretarial and other clerical staff. In 2011-12, Arkansas had 2.47 administrative support staff per 500 students. The state ranked 2nd among SREB states and 2nd among surrounding states. NCES also provides data on total expenditures for district administration in each state. The most recent data available for all states are from 2010-11. According to the NCES data, Arkansas schools spent $234.35 per student on district administration in 2010-11. Arkansas had the 4th highest per-student district administration expenditure among the 16 SREB states and the 5th highest among surrounding states.
EXPENDITURES FROM FOUNDATION FUNDING
Districts collectively spent about $153.6 million in foundation funding on central office expenditures in 2012-13. This equates to $335.96 per student, or about $79 per student less than the funding amount provided in the matrix.
Central Office: Foundation Funding and Expenditures
District Funding District Expenditures
2011-12 $186,131,275 $151,628,604
2012-13 $189,785,796 $153,604,465
The spending patterns for central office expenses differed considerably between regular school districts and open-enrollment charter schools. While districts spent less than they received in foundation funding for central office expenses, charter schools spent more than $230 per student above the matrix amount. The higher spending per student may be due primarily to the small size of some charter schools. Six of the charter schools had fewer than 350 students. Similarly, small regular school districts spent more per student on central office expenses than larger districts. High-poverty districts spent more than 1.5 times the amount low-poverty districts spent. Low-achieving districts spent more per student on the central office than higher achieving districts, but these districts still spent less per student than the matrix amount.
$336
$647
$490
$345
$280
$318
$368
$581
$298
$346
$317
$402
Matrix Funding
$415.10
$0
$100
$200
$300
$400
$500
$600
$700
Per
Stu
dent
District Size Poverty Student Achievement
Foundation Funding Expenditures Per Student Central Office
Matrix Funding Amount

Page 71
EXPENDITURES FROM ALL FUNDING SOURCES
Foundation funding was the primary source of funds for districts’ central office expenditures. Districts used foundation funding to cover 84% of all of their central office expenditures. Federal funds was another frequently used funding source for central office costs. Federal funds covered about 12% of all central office expenditures districts made in 2012-13.
Note: The “other state restricted funding” in the chart above is a negative figure due to a one-time corrective transaction in one district.
TRANSPORTATION
Transportation expenditures include school bus and district vehicle operations and maintenance, transportation personnel, insurance and equipment costs. They also include bus purchases and non-academic transportation. Transportation does not include expenditures for athletic or activity transportation.
COST OF TRANSPORTATION In 2003, Picus and Associates did not provide a recommendation on funding for transportation. The General Assembly chose to include the funding for central office expenses within a general category called the carry-forward and included $1,152 per student in the matrix for this purpose.
In their 2006 report, the consultants recommended funding transportation at $286 per student, based on districts’ actual 2004-05 transportation expenses inflated for 2007-08. However, they noted that while the state transportation expenditures averaged around $286 per ADM, individual districts’ expenditures vary considerably, from a low of $67 to a high of $695 per student. In a June 2006 presentation, the consultants recommended that the General Assembly collect better data on transportation operations and develop a funding formula based on student density, mileage or hours of operation, rather than on ADM. They recommended that the General Assembly consider moving the funding for transportation out of the matrix to be funded separately.
Although each biennial adequacy study since 2006 has examined transportation expenditures, the General Assembly has not altered the method of distribution. However, in 2011, the General Assembly passed Act 1075, which appropriated $500,000 for supplemental transportation funding for 2011-12. ADE was directed to draft rules and regulations to establish how those funds would be distributed. Under the supplemental transportation rules, any district that spent state foundation
Foundation $153,604,465
($8,058,553)
$604,098
$100,134
$93
$112,211
$5,109,926
$21,761,636
$174,000
$755,622
$7,738,920
$100,109
2012-13 District Expenditures for Central Office
Foundation
Other State Unrestricted
NSL
PD
ALE
ELL
Other State Restricted
Federal Funds
Building Fund
CapitalOutlay/Ded.M&O
Activity Fund
Food Svs. Fund

Page 72
funding of more than 120% of the matrix transportation funding was eligible for a share of the $500,000 supplemental funding. After those districts were identified, the funding was distributed proportionally based on how far above the 120% mark the districts’ transportation expenditures were. For 2011-12, 44 districts received supplemental funding in amounts ranging from $3,594 to $30,977.
Although the supplemental transportation funding was appropriated for 2012-13, it was not funded. At the time, ADE said they intended to fund Supplemental Transportation for only one year (FY 2012) and due to an oversight, they did not request the deletion of the special language that requires the department to fund Supplemental Transportation.
EXPENDITURES FROM FOUNDATION FUNDING
Districts collectively spent about $134.6 million in foundation funding to cover their student transportation costs. This equates to $294.45 per student, which is slightly under the $309.90 provided in the matrix. The difference in individual districts’ matrix expenditures for transportation in FY 2012-13 varies from a low of $0 foundation funding expenditures to a high of $663.03 per pupil. Some districts with low foundation funding expenditures for transportation may receive other types of funding they can use to cover these costs, including desegregation aid, isolated funding or special needs isolated funding.
Transportation: Foundation Funding and Expenditures
District Funding District Expenditures
2011-12 $138,935,335 $138,338,998
2012-13 $141,687,830 $134,627,066
Charter schools had much lower transportation expenditures than regular school districts. This is likely due to the fact that many charter schools do not provide daily transportation to students. Eight of the 16 charter schools had either no transportation expenditures or had expenditures of less than $20 per student. Small districts had greater transportation expenditures than large districts, and high-poverty districts had greater per student expenditures than districts with lower concentrations of poverty. Districts in the lowest student achievement group had higher per-student expenditures for transportation than the districts in higher achieving groups.
$294
$119
$338
$305
$267
$295
$290
$346
$294
$286
$275
$321
Matrix Funding
$309.90
$0
$50
$100
$150
$200
$250
$300
$350
$400
Per
Stu
dent
District Size Poverty Student Achievement
Foundation Funding Expenditures Per Student Transportation
Matrix Funding Amount

Page 73
STATE RANKING
NCES provides data on total transportation expenditures in each state. The most recent data available for all states are from 2010-11. According to the NCES data, Arkansas schools spent an average of $357.05 per student on transportation in 2010-11. Arkansas had the 11th highest per-student transportation expenditure among SREB states and the 4th highest among surrounding states. (The enrollment data used to calculate the per-student transportation expenditures include pre-K students who have been excluded from the BLR’s foundation funding analysis.)
EXPENDITURES FROM ALL FUNDING SOURCES
Foundation funding covered 74% of districts’ transportation expenditures. Other significant sources of funding used by districts included state restricted funding and other unrestricted state funding, such as isolated funding.
Foundation Funding $134,627,066
$22,434,271
$424,944
$21,293
$52,094
$18,529,933
$3,146,517
$1,541,960
$1,493,954
$29,625
2012-13 District Expenditures for Transportation
Foundation Funding
Other State Unrestricted Funds
NSL
PD
ALE
Other State Restricted
Federal Funds
Building Fund
Capital Outlay/Dedicated M&O
Activity Fund

Page 74
OTHER NON-MATRIX EXPENDITURES
Districts use foundation funding for purposes not included in the matrix and not specifically noted as being essential for educational adequacy. Other non-matrix items include a variety of items that have not been assigned to a specific matrix line item in this analysis. It is important to note that foundation funding is unrestricted funding, and districts are free to use it however best fits their needs. Spending on non-matrix items should not be considered necessarily problematic or incorrect. In some cases, expenditures were placed in this category simply because they did not fit with the specific intent of the matrix.
Description
Expenditures or other uses from
foundation funds
Expenditures or other uses from
foundation funds per pupil
Athletic supplies and transportation $21,310,475 $46.61
Activity supplies and transportation $2,741,484 $6.00
Supplies and objects other than salaries and benefits in instruction and instructional support not otherwise classified as instructional materials, technology, etc.
$30,944,135 $67.68
Other classified instructional personnel for programs outside regular school programs, including preschool, summer school, homebound instruction, and selected instructional program coordinators
$12,035,401 $26.32
Classified guidance services $3,277,251 $7.17
Instructional aides $57,841,185 $126.51
Classified library support $4,818,030 $10.54
Supplies and materials for counselors, nurses, and other student support services
$3,470,361 $7.59
Pre-school $1,378,270 $3.01
Food service $1,606,660 $3.51
Community outreach $943,834 $2.06
Other financing uses such as bonded indebtedness not accounted for in the debt service fund and indirect costs
$7,280,560 $15.92
Non-technology related facilities construction and site improvement
$6,354,839 $13.90
Other miscellaneous items $20,209,244 $44.20
Total other non-matrix items $174,211,729 $381.03
EXPENDITURES
In 2012-13, districts spent about $174.2 million in foundation funding on items not specifically identified in the matrix.
Other Non-Matrix Items: Foundation Funding and Expenditures Foundation
Funding District Expenditures
2011-12 $0 $170,334,611 2012-13 $0 $174,211,729

Page 75
Districts’ spending patterns for non-matrix items differed very little based on district size. High poverty districts spent more per student on non-matrix items than low poverty districts and the lowest achieving group of districts spent more per student than higher achieving districts. Charter schools spent considerably more per student for non-matrix items than regular districts spent.
INSTRUCTIONAL AIDES
Instructional aides are included in this category of non-matrix because they are not included in the matrix. In 2003, Picus and Associates recommended against providing funding for instructional aides because “research generally shows that they do not add value, i.e., do not positively impact student academic achievement.” However, the consultants noted that research has found instructional aides can have a positive impact on student reading when they are selected “according to clear and rigorous literacy criteria, are trained in a specific reading tutoring program, provide individual tutoring to students in reading and are supervised.” While the consultants questioned the value of instructional aides, many districts consider instructional aides a necessary component in the delivery of education. To quantify the extent to which districts consider instructional aides necessary, the BLR posed the following question on the adequacy study district survey.
District Survey Question: How important are classroom aides to students’ instruction (exclude all non-classroom aides and those required by students’ IEP)?
Nearly 70% of districts indicated that they considered instructional aides “very useful” or “essential.”
Districts Giving This Response
% of Responding Districts
Not very useful 4 2%
Useful 49 21%
Very useful 79 33%
Essential 85 36%
No classroom aides 20 8%
No response 1 NA
$381
$812
$400
$369
$393
$361
$423
$517
$354
$372
$341
$465
Matrix Funding $0.00
$0
$200
$400
$600
$800
$1,000
Per
Stu
dent
District Size Poverty Student Achievement
Other Non-Matrix Expenditures
Matrix Funding
District
Expenditures
2011-12 $55,665,478
2012-13 $57,841,185

Page 76
Statewide districts spent an average of $127 per student for these staff. Large districts spent more foundation funding per student on these staff than smaller districts and high poverty districts spent considerably more than low poverty districts. Districts in the lowest student achievement group spent more foundation funding per student than higher achieving groups.
$127
$94
$108
$111
$154
$130
$114
$191
$136
$109
$98 $1
54
Matrix Funding
$0.00 $0
$50
$100
$150
$200
$250
Per
Stu
dent
District Size Poverty Student Achievement
Foundation Funding Expenditures Per Student Instructional Aides
Matrix Funding

Page 77
DISTRICT COMPARISONS
The variety of needs for different districts and their individual student characteristics make it unlikely that each matrix line item's funding will fit all schools equally well, which is why districts are not required to spend according to the levels established in the matrix. This study reviewed each line of the matrix in an effort to identify how districts are using these resources. The following charts compare the way districts of different sizes, poverty levels, and achievement levels use foundation funding to address the needs of their students.
DISTRICTS AND OPEN-ENROLLMENT CHARTER SCHOOLS
Matrix Regular Districts Charter Schools
Classroom Teachers $3,021.03 $2,841.31 $2,386.68
Special Education Teachers $351.28 $351.32 $86.65
Instructional Facilitators $302.83 $152.85 $69.18
Librarians and Media Specialists $99.93 $116.74 $8.58
Counselors and Nurses $302.83 $245.99 $150.11
Principal Salary + Benefits $190.20 $193.37 $184.67
School-level Secretary $76.70 $114.61 $219.09
Technology $217.60 $75.13 $219.35
Instructional Materials $176.70 $110.47 $312.76
Extra Duty Funds $55.20 $180.48 $30.45
Supervisory Aides $54.70 $10.99 $14.67
Substitutes $60.00 $67.24 $61.12
Central Office $415.10 $335.96 $646.72
Transportation $309.90 $294.45 $119.43
Operations & Maintenance $629.00 $777.41 $891.55
Other Reconciling Items $0.00 $381.03 $812.36
TOTAL $6,267.00 $6,249.35 $6,213.37
DISTRICT SIZE
Matrix
Small (750 or less)
Medium (751 to 5000)
Large (over 5000)
Classroom Teachers $3,021.03 $2,754.91 $2,832.09 $2,878.58
Special Education Teachers $351.28 $267.62 $321.99 $417.15
Instructional Facilitators $302.83 $44.93 $135.32 $208.16
Librarians and Media Specialists $99.93 $143.51 $120.95 $103.21
Counselors and Nurses $302.83 $209.94 $224.25 $287.61
Principal Salary + Benefits $190.20 $256.78 $204.79 $159.24
School-level Secretary $76.70 $107.75 $109.79 $123.55
Technology $217.60 $50.40 $88.74 $62.12
Instructional Materials $176.70 $96.60 $109.51 $115.70
Extra Duty Funds $55.20 $181.19 $212.43 $133.72
Supervisory Aides $54.70 $7.81 $8.80 $15.05
Substitutes $60.00 $72.46 $68.60 $63.80
Central Office $415.10 $490.08 $345.22 $279.94
Transportation $309.90 $338.18 $304.99 $267.03
Operations & Maintenance $629.00 $829.10 $784.65 $752.60
Other Reconciling Items $0.00 $399.79 $369.08 $393.27
TOTAL $6,267.00 $6,251.04 $6,241.21 $6,260.75

Page 78
POVERTY LEVEL
Matrix Low
(less than 70%) Medium
(70%-90%) High
(90% or more)
Classroom Teachers $3,021.03 $2,896.00 $2,718.91 $2,619.21
Special Education Teachers $351.28 $359.88 $334.40 $272.76
Instructional Facilitators $302.83 $149.12 $167.37 $46.91
Librarians and Media Specialists $99.93 $114.78 $121.17 $124.03
Counselors and Nurses $302.83 $248.56 $241.86 $203.75
Principal Salary + Benefits $190.20 $190.09 $200.34 $213.94
School-level Secretary $76.70 $110.67 $125.71 $86.41
Technology $217.60 $83.11 $57.65 $35.35
Instructional Materials $176.70 $114.55 $104.12 $39.45
Extra Duty Funds $55.20 $189.98 $159.73 $131.61
Supervisory Aides $54.70 $9.54 $15.05 $0.26
Substitutes $60.00 $64.17 $74.30 $75.73
Central Office $415.10 $317.67 $368.22 $580.61
Transportation $309.90 $295.06 $290.34 $346.15
Operations & Maintenance $629.00 $752.32 $837.58 $801.00
Other Reconciling Items $0.00 $360.90 $423.32 $517.26
TOTAL $6,267.00 $6,256.38 $6,240.06 $6,094.43
STUDENT ACHIEVEMENT
Matrix
Top Quartile
2nd Quartile
3rd Quartile
4th Quartile
Classroom Teachers $3,021.03 $2,938.10 $2,875.64 $2,887.29 $2,635.31
Special Education Teachers $351.28 $378.60 $341.58 $328.13 $343.17
Instructional Facilitators $302.83 $152.72 $131.56 $139.52 $181.77
Librarians and Media Specialists $99.93 $108.75 $124.33 $127.98 $111.30
Counselors and Nurses $302.83 $256.84 $222.17 $242.75 $251.41
Principal Salary + Benefits $190.20 $172.92 $219.00 $201.40 $195.37
School-level Secretary $76.70 $106.61 $108.15 $116.94 $128.26
Technology $217.60 $90.65 $65.70 $79.13 $56.32
Instructional Materials $176.70 $122.85 $106.72 $112.91 $93.47
Extra Duty Funds $55.20 $186.90 $217.94 $184.36 $140.27
Supervisory Aides $54.70 $10.38 $9.15 $14.02 $10.18
Substitutes $60.00 $63.27 $68.40 $65.25 $73.93
Central Office $415.10 $297.69 $345.70 $316.56 $401.68
Transportation $309.90 $293.91 $285.57 $274.71 $321.25
Operations & Maintenance $629.00 $723.32 $755.46 $809.37 $837.72
Other Reconciling Items $0.00 $353.94 $371.70 $341.29 $465.13
TOTAL $6,267.00 $6,257.43 $6,248.77 $6,241.61 $6,246.54
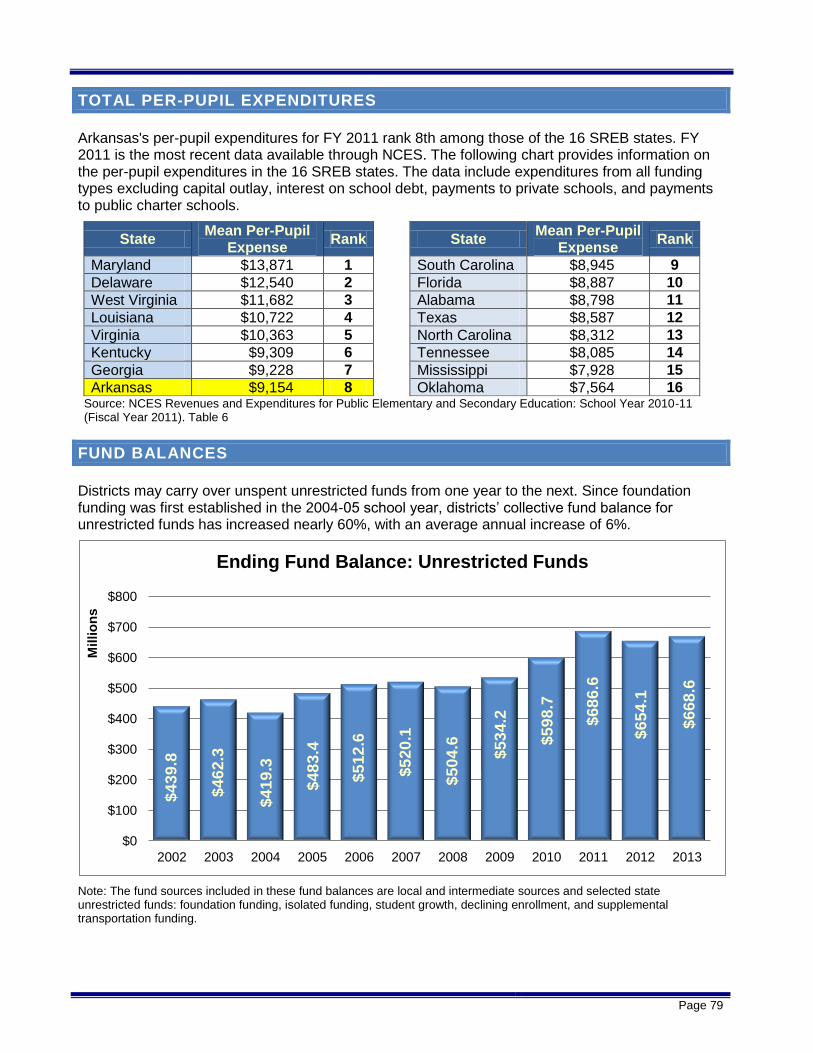
Page 79
TOTAL PER-PUPIL EXPENDITURES
Arkansas's per-pupil expenditures for FY 2011 rank 8th among those of the 16 SREB states. FY 2011 is the most recent data available through NCES. The following chart provides information on the per-pupil expenditures in the 16 SREB states. The data include expenditures from all funding types excluding capital outlay, interest on school debt, payments to private schools, and payments to public charter schools.
State Mean Per-Pupil
Expense Rank State
Mean Per-Pupil Expense
Rank
Maryland $13,871 1 South Carolina $8,945 9
Delaware $12,540 2 Florida $8,887 10
West Virginia $11,682 3 Alabama $8,798 11
Louisiana $10,722 4 Texas $8,587 12
Virginia $10,363 5 North Carolina $8,312 13
Kentucky $9,309 6 Tennessee $8,085 14
Georgia $9,228 7 Mississippi $7,928 15
Arkansas $9,154 8 Oklahoma $7,564 16 Source: NCES Revenues and Expenditures for Public Elementary and Secondary Education: School Year 2010-11 (Fiscal Year 2011). Table 6
FUND BALANCES
Districts may carry over unspent unrestricted funds from one year to the next. Since foundation funding was first established in the 2004-05 school year, districts’ collective fund balance for unrestricted funds has increased nearly 60%, with an average annual increase of 6%.
Note: The fund sources included in these fund balances are local and intermediate sources and selected state unrestricted funds: foundation funding, isolated funding, student growth, declining enrollment, and supplemental transportation funding.
$4
39
.8
$4
62
.3
$4
19
.3
$4
83
.4
$5
12
.6
$5
20
.1
$5
04
.6
$5
34
.2
$5
98
.7
$6
86
.6
$6
54
.1
$6
68
.6
$0
$100
$200
$300
$400
$500
$600
$700
$800
2002 2003 2004 2005 2006 2007 2008 2009 2010 2011 2012 2013
Millio
ns
Ending Fund Balance: Unrestricted Funds

Page 80
CONCLUSION
A major objective of the biennial adequacy study is to determine how school districts have spent the foundation funding they have received. This report describes the amount of foundation funding provided to districts for each component of the matrix and the way districts have spent those funds. It is important to remember that while foundation funding is a major source of funding for school districts, it makes up only about 58% of districts’ total funding. Because school districts, on average, receive 42% of their funding from other sources, they have a variety of options for funding decisions on each line of the matrix.
Districts’ actual foundation funding expenditures in 2012-13 tracked fairly closely with the intent of the matrix in some areas and less well in other areas. Average per-student spending in four areas closely matched the matrix amounts: special education teachers, principals, substitutes and transportation. In seven areas, districts spent less foundation funding than the matrix provided. These areas included classroom teachers, instructional facilitators, counselors and nurses, technology, instructional materials and the central office. In four of those seven areas, districts’ under-spending may result from districts’ having other types of funding they can use for those expenditures.
Districts spent more foundation funding than they received in four areas: librarians, secretaries, extra duty, and operations and maintenance. The matrix provides a basic level of funding for school secretaries and extra duty as a component of providing an adequate education. However previous legislatures have recognized that districts may choose to use more secretaries and athletic staff than what is funded in the matrix, but that any additional spending for these resources could come from local funds. Districts’ spent 23.6% more on O&M than the matrix funding provided, and this may be an area for further study.
Large districts spent more for items directly related to instruction than smaller districts, while small districts put more of their foundation funding in administrative expenditures. Large districts spent more per student on classroom teachers, special education teachers, instructional facilitators, and instructional materials. Small districts spent more per student on expenditures associated with the central office, transportation and O&M.
A similar pattern emerges when viewing districts based on concentrations of poverty. Low poverty districts spent more foundation funding per student for classroom teachers, special education teachers, counselors and nurses, technology and instructional materials. High poverty districts spent more per student on principals, librarians, central office staff and transportation. This pattern may result, in part, from high poverty districts having additional sources of revenue, beyond foundation funding, to spend on instructional resources.
Spending patterns among districts grouped according to student achievement are less clear. Still, top quartile districts spent more foundation funding per student on classroom teachers and special education teachers, while the lowest achieving districts spent more on central office staff, transportation, and O&M.

Page 81
REFERENCES
Adequacy Study Oversight Subcommittee (2006). A report on legislative hearing for the 2006 Interim Study on Education Adequacy. Presented to the Arkansas House and Senate Interim Committees on Education. Retrieved September 12, 2013, from, http://www.arkleg.state.ar.us/education/K12/Pages/AdequacyReportDetails.aspx?catId=2006
American Counseling Association (2007). Effectiveness of school counseling. Alexandra, VA: Office of Public Policy and Legislation. Retrieved September 5, 2013, from, wvde.state.wv.us/counselors/.../Effectiveness+of+School+Counseling.pdf
American School Counselor Association (2013). ASCA national model: A framework for school counseling programs. Herndon, VA: American School Counselor Association. Retrieved September 5, 2013, from, www.schoolcounselor.org
American Institutes for Research (2010). What experience from the field tells us about school leadership and turn-around. Naperville, IL: American Institutes for Research. Retrieved August 30, 2013, from, www.learningpt.org/pdfs/leadership_turnaround_schools.pdf
Augenblick, J., Myers, J., Silverstein, J. & Barkis, A. (2002). Calculation of the cost of a suitable education in Kansas in 2000-2001 using two different analytic approaches. Report prepared for the Kansas Legislative Coordinating Council. Retrieved September 6, 2013, from, skyways.lib.ks.us/ksleg/KLRD/.../SchoolFinanceFinalReport.pdf
Augenblick, J., Silverstein, J., Brown, A. R., Rose, D., DeCesare, D., & Anderson, A. B. (2006). Estimating the cost of an adequate education in Nevada. Denver, CO: Augenblick, Palaich and Associates.
Augenblick, J., Palaich, R. & Associates. (2011). Costing out the resources needed to meet Colorado education standards and requirements. Denver, CO: Augenblick, Palaich and Associates. Retrieved September 4, 2013, from, www.ednewscolorado.org/wp-content/.../08/APACostStudy80811.pdf
Chenoweth, K. (2008). It’s being done: Academic success in unexpected schools. Cambridge, MA: Harvard Education Press.
Cornett, J. & Knight, J. (2008). Research on coaching. In J. Knight (Ed.), Coaching: Approaches and perspectives (pp. 192-216). Thousand Oaks, CA: Corwin. Retrieved August 29, 2013, from, www.instructionalcoach.org/images/.../research.../Cornett_Knight_2008
Committee on Increasing High School Students’ Engagement and Motivation to Learn.(2004). Engaging schools: Fostering high school students’ motivation to learn. Washington, DC: National Academies Press.
Conley, D. T., & Rooney, K. C. (2007). Washington adequacy funding study. Eugene, OR: Educational Policy Improvement Center. Retrieved September 4, 2013, from, www.k12.wa.us/.../WashingtonAdequacyFundingStudy-Appendices.pdf
Coordinated School Health, Summary Report: Arkansas School Nursing in Public and Charter Schools, School Year 2012-13.
Daley, G., Kim, L. (2010). A Teacher Evaluation System That Works. Retrieved October 18, 2010, from, http://www.tapsystem.org/publications/wp_eval.pdf
Dufour, R., & Marzano, R. J. (2011). Leaders of learning: How district, schools, and classroom leaders improve student achievement. Bloomington, IN: Solution Tree Press.
Francis, BH, Lance, KC & Lietzau, Z 2010, School librarians continue to help students achieve standards: The third Colorado study (2010). Denver, CO: Colorado State Library, Library Research Service. Retrieved September 4, 2013, from, http://www.lrs.org/documents/closer_look/CO3_2010_Closer_Look_Report.pdf
Hughes, H 2013, School libraries, teacher-librarians and their contribution to student literacy in Gold Coast schools. School Library Association of Queensland – QUT. Retrieved September 4, 2013, from, , http://www.slaq.org.au/research
Greaves, T.; Hayes, J., Wilson, L., Gielniak, M., & Peterson, R., (2010). Technology factor: Nine keys to student achievement and cost-effectiveness, New York City, NY: Pearson Foundation, Project Red.
Page 82
Retrieved September 5, 2013, from, pearsonfoundation.org/downloads/ProjectRED_TheTechnolgyFactor.pdf
Grinager, H. (2006). How education technology leads to improved student achievement. Washington, DC: National Conference of State Legislatures. Retrieved September 5, 2013, from, https://www.ncsl.org/portals/1/documents/educ/item013161.pdf
Turning around chronically low-performing schools: A practice guide. Washington, D.C.: National Center for Education Evaluation and Regional Assistance, Institute of Education Sciences, U.S. Department of Education. Retrieved August 28, 2013, from, http://ies.ed.gov/ncee/wwc/Publications_reviews.aspx
Krueger, A.B. & Whitmore, D.M. (2001). Would smaller classes help close the black-white achievement gap? (Working paper #451). Princeton, NJ: Princeton University. \\BLRFILE03\BendaB$\A A A Adequacy Matrix O & P\www.irs.princeton.edu\pubs\pdfs\451.pdf. Retrieved August 30, 2013, from, dataspace.princeton.edu/jspui/bitstream/88435/dsp01w66343627/.../451.pdf
Lance, KC & Hofschire, L 2012, Change in school librarian staffing linked with change in CSAP reading performance, 2005 to 2011. Denver, CO: Colorado State Library, Library Research Service, http://www.lrs.org/documents/closer_look/CO4_2012_Closer_Look_Report.pdf
Mangan, M. T., & Purinton, T. (2010). Evidence-based school finance adequacy in Illinois: A subcommittee report of the Education Funding Board, Advisory Board Committee. Retrieved September 9, 2013, from, www.isbe.net/EFAB/pdf/Appendix_IV_fy11.pdf
Marzano, R. J., Walters, T., & McNulty, B. A. (2005). School leadership that works. Alexandra, VA: Association for Supervision and Curriculum Development.
Massachusetts Association of Regional Schools (2009). A study of central office capacity in regional districts. Retrieved August 30, 2013, from, www.doe.mass.edu/research/reports/1109mars.pdf
Michael, R. S., Spradlin, T. E., & Carson, F. R. (2010). Study of educational adequacy: How much money is enough? Bloomington, IN: Indiana University, School of Education. Retrieved September 11, 2013, from, ceep.indiana.edu/finance/.../PR007_IAPSS_Adequacy_Report_070210.pdf
National Association of School Nurses (2012). Education, licensure, and certification of school nurses.
Retrieved September 5, 2013, from, http://www.nasn.org/default.aspx?tabid=237 Also, https //www.nasn.org/portals/0/about/press room faq.pdf
Nye, B.A., Hedges, L.V., & Konstantopulos, S. (2001). The long-term effects of small classes in early grades: Lasting benefits in mathematics achievement at grade nine. Journal of Experimental Education, 69, 245-258. Retrieved August 30, 2013, from, www.jstor.org/stable/20179989
Nye, B., Hedges, L.V., & Konstantopulos, S. (2002). Do low-achieving students benefit more from small classes? Evidence from the Tennessee class-size experiment. Educational Evaluation & Policy Analysis, 24 (3), 201-217. Retrieved August 30, 2013, from, www.sesp.northwestern.edu/docs/.../190626021444fcbd4cd8d57.pdf
Odden, A. R. (2009). Ten strategies for doubling student performance. Thousand Oaks, CA: Corwin.
Odden, A., & Picus L. O. (2011). Improving teaching and learning when budgets are tight.
Odden, A., Picus, L. O., Fermanich, M., & Goetz, M. (2004), An evidence-based approach to school finance in Arizona. Prepared for the Steering Committee of the Arizona School Finance Adequacy Study. Retrieved September 11, 2013, from, www.lpicus.com/c5/index.php/download_file/view/59/129/
Odden, A., Picus, L. O., Goetz, M., Mangan, M. T., & Fermanich (2006b). An evidence-based approach to school finance adequacy in Washington. Final Report Prepared for the K-12 Advisory Committee of Washington Learns. Retrieved September 6, 2013, from www.washingtonlearns.wa.gov/.../EvidenceBasedReportFinal9-11-06_00.
Odden, A., Picus, L. O., Archibald, S., Goetz, M., Mangan, M. T., & Aportela, A. (2007). Moving from good to great in Wisconsin: Funding schools adequately and doubling student performance. Madison, WI: University of Wisconsin-Madison, The Wisconsin School Finance Adequacy Initiative. Retrieved September 11, 2013, from, cpre.wceruw.org/.../WI%20March%201%202007%20Adequacy%20Rep...

Page 83
Odden, A., Picus, L. O., Goetz, M. E. (2008a). A 50 state strategy to achieve school finance adequacy. Denver, CO: Prepared for the Annual Meeting of the AMERICAN Education Finance Association. Retrieved September, 9, 2013, from, www.lpicus.com/c5/index.php/download file/view/62/130/
Odden, A., Picus, L. O., Goetz, M., Aportela, A., & Archibald, S. (2008b). Funding schools adequately in North Dakota: Resources to double student performance. Prepared for the North Dakota Education Improvement Commission.
Phi Delta Kappa, September 1. Retrieved September 12, 2013, from, http://www.edweek.org/ew/articles/2011/09/01/kappan_odden.html
Picus and Associates (2003). An evidence-based approach to school finance adequacy in Arkansas. Final Report Prepared for the Arkansas Joint Committee on Education Adequacy. www.schoolfunding.info/states/ar/ARCostingOutReport.pdf
Picus and Associates (2006a). Recalibrating the Arkansas school funding structure. A Report Prepared for the Adequacy Study Oversight Sub-Committee of the Arkansas General Assembly. Retrieved August 29, 2013, from, http://www.arkleg.state.ar.us/education/K12/AdequacyReports/2006/AR%20Recalibration%20Report%20August%2030,%202006.pdf
Picus, L. O., Odden, A., Goetz, M., & Aportela, A. (2012). Estimating the cost of an adequate education for Texas school districts using the evidence-based approach. North Hollywood, CA:
Lawrence O. Picus Associates. Retrieved September 6, 2013, from, www.txsc.org/wp-content/uploads/2012/11/Odden-slides.pdf
Rand Corporation (2012). Teachers Matter Understanding Teachers’ Impact on Student Achievement. Retrieved November 13, 2013, from, http://www.rand.org/pubs/corporate_pubs/CP693z1-2012-09.html
Reeves, D. B. (2003). High performance in high poverty schools: 90/90/90 and beyond. Retrieved August 29, 2013, from, www.gvsu.edu/.../high_performance_in_high_poverty_schools.pdf
Rooney, K., & Augenblick, J. (2009). An exploration of district consolidation. Denver, CO: Augenblick, Palaich and Associates, Inc. Retrieved September 2, 2013, from, www.apaconsulting.net/uploads/reports/16.pdf
Rowan, B., Correnti, R., & Miller, R. J. (2002). What large-scale survey research tells us about teacher effects on student achievement: Insights from the Prospects study of elementary schools. Teachers College Record, 104, 1525-1567.
Rural School and Community Trust. (2003). The fiscal impacts of school consolidation: Research based conclusions. Arlington, VA: Author. Retrieved September 2, 2013, from, www.ruraledu.org/articles.php?id 2042 Washington State Legislature (2012). A citizen's guide to Washington state K-12 finance. Olympia. WA: Senate Ways and Means Committee. Retrieved September 7, 2013, from, http://www.leg.wa.gov/Senate/Committees/WM/Documents/K12%20Guide%202012%20FINAL5.pdf
Verstegen, D.A. & Knoeppel, R.C. (2012). From Statehouse to Schoolhouse: Education Finance Apportionment Systems in the United States. Journal of Education Finance, 38(2), 145-166.
Whitehurst, G. J. & Chingos, M. M. (2011). Class Size: What research says and what it means for state policy. Washington, DC: The Brookings Institution. Retrieved August 30, 2013, from, http://www.brookings.edu/research/papers/2011/05/11-class-size-whitehurst-chingos

Page 84
APPENDIX A: EXPLANATION OF MATRIX LINE ITEMS
KINDERGARTEN TEACHERS - Generally includes educational activities for students of age 5 or 6.
CLASSROOM TEACHERS (OTHER THAN KINDERGARTEN AND SPECIAL EDUCATION) - Elementary, middle school and high school classroom activities including regular programs, workforce education programs, compensatory education programs, and other classroom instruction such as gifted and talented, art, choir, band or music. This line item does not include adult education and does not include athletics or student activities.
SPECIAL EDUCATION TEACHERS - Instruction services for students with disabilities or special needs.
INSTRUCTIONAL FACILITATORS - Includes Assistant Principals, Curriculum Supervisors, Instructional Facilitators.
LIBRARIAN OR MEDIA SUPPORT - Activities concerned with the operation and effective use of circulating books, reference materials, audio visual materials and other instructional media.
COUNSELORS -- Includes Guidance Counselors, School Nurse, Psychologists, Social workers.
PRINCIPAL - The principal is responsible for directing school activities and operations.
SCHOOL SECRETARY - Secretaries working with principal's office.
TECHNOLOGY - Includes instructional and administrative technology.
INSTRUCTIONAL MATERIALS - General and instructional supplies directly related to the instruction and instructional support functions.
EXTRA DUTY - Generally includes non-classroom duties of certified teachers related to athletics or student activities.
SUPERVISORY AIDES - Non-instructional supervision of students in the lunchroom, playground, etc.
SUBSTITUTES - Persons filling in for certified classroom teachers on a temporary as-need basis.
OPERATIONS AND MAINTENANCE - Activities concerned with maintaining the usefulness, comfort and safety or existing buildings, facilities and grounds . Does not include facilities acquisition and construction services relating to new buildings and facilities. Typical positions include plant supervisor, custodians, electricians, carpenter, crossing guards, etc.
CENTRAL OFFICE - Includes district level support such as superintendent, fiscal operations and purchasing.
TRANSPORTATION - activities relating to student transportation. Expenditures include bus
maintenance, bus purchases, bus drivers, fuel and similar costs. Transportation for athletics and
extracurricular activities are not included.

Page 85
APPENDIX B:STANDARDS OF ACCREDITATION
9.03.4 GRADES 9-12 9.03.4.1 Language Arts - 6 units 4 units English 1 unit oral communications or 1/2 unit oral communications and 1/2 unit drama 1 unit journalism (Other options as approved by the Department) 9.03.4.2 Science - 5 units (Active student participation in laboratory experience is required for a minimum of 20% of instructional time.) 1 unit biology 1 unit chemistry 1 unit physics (Other options as approved by the Department) 9.03.4.3 Mathematics - 6 units 1 unit Algebra I 1 unit geometry 1 unit Algebra II 1 unit pre-calculus mathematics to include trigonometry (Other options as approved by the Department)
9.03.4.4 Foreign Languages - 2 units of the same language 9.03.4.5 Fine Arts - 3 ½ units 1 unit art 1 unit instrumental music 1 unit vocal music ½ unit survey of fine arts or an advanced art or an advanced music course 9.03.4.6 Computer Applications with emphasis on current applications-1 unit 9.03.4.7 Social Studies - 4 units 1 unit American history with emphasis on 20th Century America 1 unit world history ½ unit civics ½ unit of Arkansas history if not taught in grade 7 or 8 (Other options as approved by the Department) 9.03.4.8 Economics - ½ unit The Economics course must be taught by a teacher appropriately licensed in either Social Studies or Business Education. 9.03.4.9 Health and Safety Education and Physical Education - 1½ units 1 unit physical education ½ unit health and safety education 9.03.4.10 Career and Technical Education - 9 units of sequenced career and technical education courses (programs of study) representing three (3) occupational areas.