the rise of innovation surveys: measuring a fuzzy concept · 2015. 11. 12. · soon began to...
TRANSCRIPT

The Rise of Innovation Surveys: Measuring a Fuzzy Concept
Benoît Godin 3465, rue Durocher
Montréal (QUE) Canada H2X 2C6
Project on the History and Sociology of STI Statistics Working Paper No. 16

Previous papers in the series:
1. B. Godin, Outlines for a History of Science Measurement. 2. B. Godin, The Measure of Science and the Construction of a Statistical Territory: The Case of the National Capital Region (NCR). 3. B. Godin, Measuring Science: Is There Basic Research Without Statistics?
4. B. Godin, Neglected Scientific Activities: The (Non) Measurement of Related Scientific Activities.
5. H. Stead, The Development of S&T Statistics in Canada: An Informal Account.
6. B. Godin, The Disappearance of Statistics on Basic Research in Canada: A Note.
7. B. Godin, Defining R&D: Is Research Always Systematic?
8. B. Godin, The Emergence of Science and Technology Indicators: Why Did Governments Supplement Statistics With Indicators?
9. B. Godin, The Number Makers: A Short History of Official Science and Technology
Statistics. 10. B. Godin, Metadata: How Footnotes Make for Doubtful Numbers. 11. B. Godin, Innovation and Tradition: The Historical Contingency of R&D Statistical
Classifications. 12. B. Godin, Taking Demand Seriously: OECD and the Role of Users in Science and
Technology Statistics. 13. B. Godin, What’s So Difficult About International Statistics? UNESCO and the
Measurement of Scientific and Technological Activities. 14. B. Godin, Measuring Output: When Economics Drives Science and Technology
Measurements. 15. B. Godin, Highly Qualified Personnel: Should We Really Believe in Shortages?
2

The Rise of Innovation Surveys: Measuring a Fuzzy Concept
In 1993, twelve European countries conducted the first-ever coordinated survey of
innovation activities. This was the second standardized survey of its kind in the history of
science and technology measurement – the first being the international survey on
research and development (R&D) conducted since 1963. The innovation survey was
based on the Oslo manual, which OECD member countries had adopted in 1992. 1 There
have since been three more rounds of innovation surveys.
Governments’ interest in innovation dates back to the 1960s, but the OECD countries
only began to systematically carry out innovation surveys in the 1980s. 2 There had been
some sporadic data collection by government departments (US Department of
Commerce), statistical agencies (Statistics Canada) and academic units (Science Policy
Research Unit – UK) before then, but rarely in any standardized way. When measuring
innovation, governments generally relied on already-available data like patents or
industrial R&D expenditures.
Eurostat and OECD’s methodological work in the early 1990s marked the beginning of
standardization in the field of innovation measurement. The main objective was to
develop output indicators, which, as statisticians and policy analysts firmly declared,
would measure innovation by measuring the products, processes and services that arise
from innovation activities. But, as this paper will show, subsequent developments strayed
significantly from this initial goal. While official measurements of innovation were, from
1 OECD (1991), OECD Proposed Guidelines for Collecting and Interpreting Innovation Data (Oslo Manual), DSTI/STII/IND/STP (91) 3. Published under catalog number OECD/GD (92) 26. 2 The term innovation, as used in this paper, refers to technological innovation. The latter is really the main, if not the exclusive focus of surveys over the period studied here. For a broader view of innovation, see: B. Godin (2008), Innovation: the History of a Category, Project on the Intellectual History of Innovation, Paper no. 1, Montreal: INRS.
3

the start, clearly intended to measure output, with time the national and international
surveys instead focused on the activities. The summary of a recent NSF workshop on
innovation in fact reported: “participants generally used the term in a way that focused on
the processes and mechanisms for producing commercial applications of new knowledge
rather than on the products or outputs from these processes”. 3
This paper will examine several reasons for this methodological departure. The first part
describes early official measurements of innovation by way of proxies: patents and
industrial R&D. The second discusses two approaches competing for measuring
innovation proper: innovation as an output and innovation as an activity. The last part
examines how the last approach won and became standardized at the international level.
R&D as a Legitimate Proxy?
As early as 1934, J. Schumpeter defined innovation as consisting of any one of the
following five phenomena: 4 1) introduction of a new good; 2) introduction of a new
method of production; 3) opening of a new market; 4) conquest of a new source of supply
of raw materials or half-manufactured goods; and 5) implementation of a new form of
organization. Of all the science and technology statistics that were carried out before the
1970s, however, very few concentrated on innovation as defined by Schumpeter. They
rather focused on technological innovation.
Before the 1970s, innovation was usually measured with proxies, the most important of
which were patents and industrial expenditures on R&D. The extensive use of patents as
an indicator of innovation was pioneered by Jacob Schmookler in the 1950s. 5 People
3 E. V. Larson and I. T. Brahmakulam (2001), Building a New Foundation for Innovation: Results of a Workshop for the NSF, Santa Monica: RAND, p. xii. 4 J. A. Schumpeter (1934), The Theory of Economic Development, London: Oxford, 1980, p. 66. 5 J. Schmookler (1950), The Interpretation of Patent Statistics, Journal of the Patent Office Society, 32 (2):, pp. 123-146; J. Schmookler (1953), The Utility of Patent Statistics, Journal of the Patent Office Society, 34 (6), pp. 407-412; J. Schmookler (1953), Patent Application Statistics as an Index of Inventive Activity, Journal of the Patent Office Society, 35 (7), pp. 539-550; J. Schmookler (1954), The Level of Inventive Activity, Review of Economics and Statistics, pp. 183-190.
4

soon began to realize, however, that patents actually measured invention, not innovation. 6 Fortunately, a second source of data became widely available at that time. In the mid-
1960s, R&D surveys began to be conducted in a systematic way, and industrial R&D was
concomitantly used as a proxy for measuring innovation.
One can find precursors to this practice of using R&D to measure innovation going back
to the 1930s. In 1933, M. Holland and W. Spraragen from the US National Research
Council (NRC) produced the first innovation statistics: “The inquiry was designed to
bring out principally the comparative amounts spent for research in 1929 and 1931; also
the relation of these expenditures to changes in volumes of sales, and the relative
effectiveness of industrial laboratories in leading commercial development”. 7 Holland
and Spraragen’s study of industrial R&D laboratories in the United States showed an
increase in research devoted to the development or improvement of new products as
opposed to the reduction of production costs. 8 Over 90% of firms reported having
produced new products that had been commercialized during the previous two years. The
study also compiled a list of new products that these laboratories were investigating. 9
The next wave of innovation statistics would occur some thirty years later in industrial
surveys, such as those conducted by McGraw-Hill in the United States that asked
questions on the purpose of R&D (products or processes), 10 or the Federation of British
Industries (FBI) that conducted a survey of industrial R&D with questions on innovations
and their commercial use. 11 British firms were asked to estimate the expenditures and
personnel (in man-hours) allocated to innovation activities for the purpose of minor
improvements, major improvements, new products or technical services. The Federation 6 National Bureau of Economic Research (1962), The Rate and Direction of Inventive Activity: Economic and Social Factors, New York: Arno Press. We owe to Schumpeter, op. cit. the distinction between invention, (initial) innovation, and (innovation by) imitation. 7 M. Holland and W. Spraragen (1933), Research in Hard Times, Division of Engineering and Industrial Research, National Research Council, Washington, p. 1. 8 Ibid. p. 5. 9 Ibid. Table 11, no page. 10 McGraw-Hill (1971), Business' plans for research and development expenditures, New York.
5

reported that 37% of industrial R&D was directed toward new products and 24% toward
major improvements.
Despite their titles however, early official statistical analyses and policy documents on
innovation, like Technological Innovation in Britain (1968) by the Advisory Council for
Science and Technology, mostly measured R&D rather than innovation. Similarly, the
first OECD documents on innovation relied chiefly on industrial R&D data. 12 In 1976,
then, K. Pavitt, acting as consultant to the OECD, suggested that the organization
thereafter measure innovation activities proper: 13
Statistics on R&D have inherent limitations (…). They do not measure all the expenditures on innovative activities (…). In particular, they do not measure the expenditures on tooling, engineering, manufacturing and marketing start-up that are often necessary to turn R&D into economically significant technical innovations. Nor do they measure the informal and part-time innovative activities that are undertaken outside formal R&D laboratories (…). They do not indicate the objectives of R&D activities, for example, products or processes (…). They do not measure outputs, either in terms of knowledge, or in terms of new or better products and production processes.
Soon, everyone admitted the deficiency of the indicator. For example, an OECD ad hoc
group on science, technology and competitiveness stated: “innovation cannot be reduced
to nor does it solely arise from R&D”, and admitted that “it is probably quite as
erroneous and misleading for appropriate and adequate policy making for technology and
competitiveness to equate R&D with innovative capacity”. 14
Measuring Innovation Proper
11 Federation of British Industries (1961), Industrial Research in Manufacturing Industry: 1959-1960, London, pp. 83ss 12 OECD (1966), Government and Technical Innovation, Paris. 13 OECD (1976), The Measurement of Innovation-Related Activities in the Business Enterprise Sector, DSTI/SPR/76.44, pp. 2-3. In 1965, the OECD had already distanced itself from Schumpeter’s three-part definition of innovation (invention, innovation, imitation): “innovation should be interpreted more broadly to include all related activity resulting in improvements in processes and products (…)”. See OECD (1965), The Factors Affecting Technical Innovation: Some Empirical Evidence, op. cit. p. 5. 14 OECD (1984), Science, Technology and Competitiveness: Analytical Report of the Ad Hoc Group, STP (84) 26, p. 40.
6

Drawing upon a review of the literature and the results of recent surveys, Pavitt
suggested including questions in national R&D surveys on patents, technology transfer
and innovation activities. In regard to innovation activities specifically, he suggested
asking for percentage of the company’s activities devoted to innovation, the expenditures
spent on industrial innovation, and a list of significant new products and processes that
the company had introduced. 15
Pavitt was in fact suggesting measuring innovation as both an activity (percentage of the
company’s activities devoted to innovation) and an output (list of significant new
products and processes). In fact, innovation is a concept with multiple meanings. For
some, it refers to products and processes coming out from R&D and related activities,
and early measurements of innovation proper were clearly intended to measure output
coming out of these activities. For others, the concept refers to the activities themselves.
With time, national and international surveys focused on innovation as such an activity.
Innovation as Output
The first worldwide survey of innovation proper was conducted in the late 1950s in Great
Britain by C.F. Carter and B.R. Williams for the Science and Industry Committee of the
British Association for the Advancement of Science. 16 The authors analyzed 201
“significant” innovations coming out from 116 firms, looked at the characteristics of
these firms, and studied the sources of the innovations.
Carter and Williams’ method was the approach used by early official measurements. At
the official level, it was the US National Science Foundation (NSF) that started
measuring innovation by using the output approach: identifying and counting
commercialized technological innovations (and the characteristics of the firms that
15 OECD (1976), The Measurement of Innovation-Related Activities in the Business Enterprise Sector, op.cit. 16 C.F. Carter and B.R. Williams (1957), Industry and Technical Progress: Factors Governing the Speed of Application of Science, London: Oxford University Press, chapter 10; C.F. Carter and B.R. Williams (1958), Investment in Innovation, London: Oxford University Press, chapter 5.
7

produced them). This orientation was probably a spin-off from earlier studies contracted
to A.D. Little 17 and E. Mansfield – associate professor of Economics at Carnegie
Institute of Technology –, 18 and the well-known TRACES study on the relationships
between science and technology. 19 The first large NSF innovation study was conducted
by the US National Planning Association between 1963 and 1967 under the direction of
S. Myers from the Institute of Public Administration in Washington DC. 20 The NSF
published the results in 1969. 21 The study examined 567 technical innovations, most of
them minor, that were identified by 121 firms in five manufacturing industries.
Interviews were conducted with individuals who had been directly involved in the
innovation. The report discussed the characteristics of the firms and examined, among
other things, the sources of the innovations (original or adopted), their nature (products or
processes), their costs, and their impacts on the firms’ production processes.
In 1974, the NSF commissioned Gellman Research Associates to conduct a second
innovation survey based on the same approach. The study examined 500 major product
innovations that were introduced during the 1953-73 period. It considered the time
between invention and innovation, the rate of return on the investment, the “radicalness”
of the innovations and the size and R&D intensity of the companies that produced them.
17 Arthur D. Little inc. (1963), Patterns and Problems of Technical Innovation in American Industry, report submitted to the NSF, C-65344, Washington. 18 For summaries, see: NSF (1961), Diffusion of Technological Change, Reviews of Data on R&D, 31, October, NSF 61-52; NSF (1962), Innovation in Individual Firms, Reviews of Data on R&D, 34, June, NSF 62-16; NSF (1963), Enquiries into Industrial R&D and Innovation, Reviews of Data on R&D, 38, March, NSF 63-12; E. Mansfield (1963), Intrafirm Rates of Diffusion of an Innovation, Review of Economics and Statistics, 45, November, pp. 348-359; E. Mansfield (1968), Industrial Research and Technological Innovation: An Econometric Analysis, New York: Norton; E. Mansfield et al. (1971), Research and Innovation in the Modern Corporation, New York: Norton. 19 IIT Research Institute (1968), Technology in Retrospect and Critical Events in Science (TRACES), Washington: NSF; Battelle Columbus Labs. (1973), Interactions of Science and Technology in the Innovative Process: Some Case Studies, Washington: NSF. 20 S. Myers, E.B. Olds, J.F. Quinn (1967), Technology Transfer and Industrial Innovation, National Planning Association, Washington. 21 S. Myers and D. G. Marquis (1969), Successful Industrial Innovation: A Study of Factors Underlying Innovation in Selected Firms, NSF 69-17, Washington.
8

22 The NSF included the results of the study in the 1975 and 1977 editions of Science
Indicators (SI). 23
It was at about the same time that interest in measuring innovation at the OECD really
began. With its 1968 report Gaps in Technology, innovation performance became the key
for explaining differences between the United States and Western Europe: “The
performance of a country in technological innovation has been defined as the rate at
which new and better products and production processes have been introduced and
diffused throughout its economy”. 24 Two aspects of innovation were measured: 1)
performance in terms of being first to commercialize new products and processes
(performance in originating innovations), 2) performance in terms of the level and rate of
increase in the use of new products and processes (performance in diffusing innovations).
The data relied on 140 significant innovations since 1945 in the basic metals, electrical
and chemical industries. The report indicated that American firms were the most
innovative: approximately 60% of the 140 innovations came from the United States. It
concluded that: “United States firms have turned into commercially successful products
the results of fundamental research and inventions originating in Europe. Few cases have
been found of the reverse process”. 25
The report was based on data collected from nine OECD sector studies, 26 but some of
the data had also been obtained from national governments, published sources, experts
and industrialists. The Technological Gaps report was followed by a second study a few
years later by K. Pavitt and S. Wald titled: The Conditions for Success in Technological
22 Gellman Research Associates (1976), Indicators of International Trends in Technological Innovation, Washington: NSF. 23 NSF (1975), Science Indicators 1974, Washington, pp. 99-110; NSF (1977), Science Indicators 1976, Washington, pp. 115-127. 24 OECD (1968), Gaps in Technology: General Report, Paris, p. 14. 25 Ibid. p. 17. 26 Six sector studies were undertaken by the Committee for Science Policy, and three more by the Committee for Industry: scientific instruments, electronic components, electronic computers, machine tools, plastics, fibers, pharmaceuticals, iron and steel, and non-ferrous metals.
9

Innovation. 27 The study noted the country of origin of 110 of the most significant
innovations identified in the Gaps study. The United States led with 74 innovations,
followed by the United Kingdom (18) and Germany (14). 28
Innovation as Activity
Both the NSF and the OECD measured innovation as an output rather than as an activity.
Innovation was measured, among other things, on the basis of technological products and
processes that had originated from innovative activities. Both organizations soon stopped
using the output approach, however.
In the early 1970s, the NSF (and its National R&D Assessment Program) instead turned
to supporting consultants 29 and academics 30 in developing survey instruments for
measuring overall innovation activities and costs. Due to the difficulties identified by
these studies, the NSF waited the 1980s for carrying out two such surveys on innovation:
one in 1985 of 620 manufacturing companies, 31 and another in 1993. 32 The Census
Bureau conducted the latter as a pilot study of 1,000 manufacturing firms (and one
service-sector firm). The survey revealed that a third of the firms introduced a product or
process during the 1990-92 period.
27 OECD (1971), The Conditions for Success in Technological Innovation, Paris. 28 One more author using the same data was J. Ben-David (1968), Fundamental Research and the Universities: Some Comments on International Differences, Paris: OECD, pp. 20-21. 29 W. M. Hildred and L. A. Bengston (1974), Surveying Investment in Innovation, Denver Research Institute and Management Design Associates, Denver (Colorado); R.E. Roberts and C.A. Romine (1974), Investment in Innovation, Midwest Research Institute, Kansas City; L.D. Posner and L.J. Rosenberg (1974), The Feasibility of Monitoring Expenditures for Technological Innovation, Practical Concepts Inc., Washington. 30 C. T. Hill, J. A. Hansen and J. H. Maxwell (1982), Assessing the Feasibility of New Science and Technology Indicators, Center for Policy Alternatives, MIT; C. T. Hill, J. A. Hansen and J. I. Stein (1983), New Indicators of Industrial Innovation, Center for Policy Alternatives, MIT; J. A. Hansen, J. I. Stein and T. S. Moore (1984), Industrial Innovation in the United States: A Survey of Six Hundred Companies, Center for Technology and Policy, Boston University; J. A. Hansen (1987), International Comparisons of Innovation Indicator Development, Washington: NSF. 31 A Survey of Industrial Innovation in the United States: Final Report, Princeton: Audits and Surveys - Government Research Division, 1987; NSF (1987), Science and Engineering Indicators 1987, Washington, pp. 116-119. 32 NSF (1996), Science and Engineering Indicators 1996, Washington, pp. 6-29 to 6-30.
10
The 1993 NSF survey was part of the OECD/European Community Innovation Survey
(CIS) efforts (see below). Before the 1990s, however, the NSF had been completely
oblivious to the existence of similar surveys in Europe. 33 Germany was in fact already
active in this field, having pioneered such innovation surveys as early as 1979. 34 Italy
and other European countries followed suit in the mid-1980s. 35 What characterized the
European surveys was their use of the activities approach: they surveyed on firms’
overall innovation activities, rather than on their specific innovative output. 36
The only other official efforts to measure innovation within an output approach were the
Economic Council of Canada’s study of 283 major innovations, 37 the US Small Business
Administration’s study of 8,074 innovations that were commercially introduced in the
33 J. A. Hansen (2001), Technology Innovation Indicator Surveys, in J. E. Jankowski, A. N. Link, and N. S. Vonortas, Strategic Research Partnerships, Proceeding of an NSF Workshop, NSF 01-336, Washington, p. 224. 34 L. Scholz (1980), First Results of an Innovation Test for the Federal Republic of Germany, STIC/80.40; F. Meyer-Krahmer (1984), Recent Results in Measuring Innovation Ouput, Research Policy, 13, pp. 175-182; L. Scholz (1986), Innovation Measurement in the Federal Republic of Germany, Paper presented at the OECD Workshop on Innovation Statistics, Paris; L. Scholz (1988), The Innovation Activities of German Manufacturing Industry in the 1980s, DSTI/IP/88.35; L. Scholz (1992), Innovation Surveys and the Changing Structure of Investment in Different Industries in Germany, STI Review, 11, December, pp. 97-116. 35 D. Archibugi, S. Cesaratto, and G. Sirilli (1987), Innovative Activity, R&D and Patenting: the Evidence of the Survey on Innovation Diffusion in Italy, STI Review, 2, pp. 135-150; D. Archibugi, S. Cesaratto, and G. Sirilli (1991), Sources of Innovation Activities and Industrial Organization in Italy, Research Policy, 20, pp. 299-314. For other countries, see the special issue of STI Review (1992), Focus on Innovation, 11, December. 36 For good summaries, see J. A. Hansen (1999), Technology Innovation Indicators: A Survey of Historical Development and Current Practice, SRI; J. A. Hansen (1992), New Indicators of Industrial Innovation in Six Countries: A Comparative Analysis, DSTI/STII/STP/NESTI/RD (92) 2; J. A. Hansen (1987), International Comparisons of Innovation Indicator Development, Washington: NSF; J. A. Hansen (1986), Innovation Indicators: Summary of an International Survey, OECD Workshop on Innovation Statistics, Paris, 8-9th December; OECD (1982), Patents, Invention and Innovation, DSTI/SPR/82.74, pp. 34-38; J. M. Utterback (1974), Innovation in Industry and the Diffusion of Technology, Science, 183, pp. 620-626. 37 D.P. De Melto, K.E. McMullen and R.M. Wills (1980), Preliminary Report: Innovation and Technological Change in Five Canadian Industries, Discussion Paper no. 176, Economic Council of Canada, Ottawa.
11

United States in 1982, 38 and the (irregular) surveys on the use or diffusion of advanced
technologies carried out in the United States, Canada and Australia.39
The reorientation of innovation statistics towards activities owes its origin to the
publication of the Charpie report by the US Department of Commerce in 1967. 40 In fact,
the Charpie report solved one of the main methodological problems confronting science
and technology statisticians – how to measure output: “There exist no coherent and
universally accepted body of economic theory, or of statistics, which enables a simple
and uncontroversial measurement of performance in technological innovation (…)”,
stated the OECD report on technological gaps. “Ideally, these comparisons should be
based on an identification of the most significant innovations” (output approach). 41 But
the report identified three limitations to such a methodology: limited and biased sample,
no assessment of the relative importance of innovations, difficulty of identifying clearly
the country of origin. 42 Conclusions were therefore rapidly drawn: “We are not
convinced by the various attempts to measure trends in the output of innovations and, in
particular, the output of major “epoch-making” innovations”. 43
The Charpie report solved the problem when it suggested continuing with the current
philosophy of measuring inputs devoted to activities – like R&D and the Frascati manual
38 The Futures Group (1984), Characterization of Innovations Introduced on the US Market in 1982, Report prepared for the US Small Business Administration, Department of Commerce, Washington: NTIS. 39 For the United States, see NSF (1991), Science and Engineering Indicators 1991, Washington, pp. 154-157; NSF (1996), Science and Engineering Indicators 1996, Washington, pp. 6-24 to 6-27; NSF (1998), Science and Engineering Indicators 1998, Washington, chapter 8; NSF (2000), Science and Engineering Indicators 2000, Washington, chapter 9. For Canada: Statistics Canada (1989), Survey of Manufacturing Technology: The Leading Technologies, Science Statistics, 88-001, 13 (9), October; Y. Fortier and L. M. Ducharme (1993), Comparaison de l’utilisation des technologies de fabrication avancées au Canada et aux États-Unis, STI Review, 12, pp. 87-107. For Australia: B. Pattinson (1992), Survey of Manufacturing Technology – Australia, DSTI/STII/STP/NESTI (92) 8. 40 US Department of Commerce (1967), Technological Innovation: Its Environment and Management, USGPO, Washington. 41 OECD (1970), Gaps in Technology: Comparisons Between member countries in Education, R&D, Technological Innovation, International Economic Exchanges, Paris, pp. 183-184. 42 OECD (1970), Gaps in Technology, op. cit. p. 191. 43 OECD (1980), Technical Change and Economic Policy, Paris, p. 47. Such a criticism was addressed as early as 1971 to Schumpeter in N. Rosenberg (1970), Economic Development and the Transfer of Technology: Some Historical Perspectives, Technology and Culture, 11, pp.
12

– rather than counting products and processes coming out of these activities. The report
defined and measured innovation in terms of five categories of activities: R&D, design
engineering, tooling and engineering, manufacturing, and marketing. The report found
that only 5-10% of innovation costs could be attributed to R&D, which meant that R&D
was not a legitimate proxy for measuring innovation. The statistics were soon challenged, 44 but the report influenced subsequent innovation surveys all around worldwide. Canada
was the first country to produce this type of survey. Statistics Canada, for example,
conducted three innovation surveys and tested two approaches to measuring innovation
in the early 1970s. 45 The first approach (1971) expanded the regular industrial R&D
survey to cover innovation: 97 firms were asked how much they spent on innovation
activities in general, as broadly defined by the categories of the Charpie report. The other
approach (1973) was project-based and collected data on 202 specific projects. But since
most firms kept few records of their innovation activities and projects, neither approach
was able to produce conclusive results.
Internationalizing the Official Approach
It took some time before the OECD turned to the activity approach. As early as the first
OECD ministerial meeting on science in 1963, ministers had asked the organization to
intensify its work on the contribution of science to the economy. The demand led, among
other things, to sector reviews 46 and policy discussions on innovation, 47 and to a
specific definition of innovation as follows: “Technical innovation is the introduction
into a firm, for civilian purposes, of worthwhile new or improved production processes,
44 E. Mansfield et al. (1971), Research and Innovation in the Modern Corporation, op. cit.; H. Stead (1976), The Costs of Technological Innovation, Research Policy, 5: 2-9. 45 Statistics Canada (1975), Selected Statistics on Technological Innovation in Industry, 13-555. 46 Sector reviews were studies of selected sectors of science with implications for economic growth and development (e.g. mineral prospecting, chemical engineering, metal physics, automatic control, biological sciences, operational research). See OECD (1963), Sector Reviews in Science: Scope and Purpose, SR (63) 32. The first sector review was conducted by C. Freeman, in collaboration with J. Fuller and A. Young: The Plastics Industry: A Comparative Study of Research and Innovation, National Institute Economic and Social Research (London), 1963. 47 OECD (1965), The Factors Affecting Technical Innovation: Some Empirical Evidence, DAS/SPR/65.12; OECD (1966), Government and Technical Innovation, op. cit.
13
products or services which have been made possible by the use of scientific or technical
knowledge”. 48 But when the OECD finally included the concept of innovation for the
first time in the Frascati manual (1981), it excluded innovation activities from the
measurement of R&D because they were defined as related scientific activities (RSA): 49
Scientific and technological innovation may be considered as the transformation of an idea into a new or improved saleable product or operational process in industry and commerce or into a new approach to a social service. It thus consists of all those scientific, technical, commercial and financial steps necessary for the successful development and marketing of new or improved manufactured products, the commercial use of new or improved processes and equipment or the introduction of a new approach to a social service.
As national innovation surveys multiplied, however, interest in measuring innovation
increased at the OECD. The conference held in 1980 on output indicators discussed
recent national innovation surveys and indicators (patents), 50 and workshops specifically
devoted to innovation were organized in 1982, 51 1986 52 and 1994. 53 By then, and for a
while, patents were categorically recognized as a “poor indicator of a country’s
technological position”. 54
The real impetus to the OECD’s involvement in innovation surveys was the first
international (or regional) collection of data in Scandinavia under the aegis of the Nordic
Fund for Industrial Development. 55 The Nordic Fund wished to conduct a coordinated
set of surveys on innovation activities in four countries (Finland, Norway, Denmark and
Sweden) and organized a workshop to that end in 1988. 56 The OECD and member
countries were invited to attend. The basic paper of the workshop, written by K. Smith
from the Innovation Studies and Technology Policy Group (Science Policy Council, 48 OECD (1966), Government and Technical Innovation, op. cit. p. 9. 49 OECD (1981), The Measurement of Scientific and Technical Activities: Proposed Standard Practice for Surveys of Research and Experimental Development, Paris, p. 15. 50 Science and Technology Indicators Conference, September 1980, particularly: C. DeBresson, The Direct Measurement of Innovation, STIC/80.3, OECD. 51 OECD (1982), Patents, Invention and Innovation, DSTI/SPR/82.74. 52 OECD (1986), Workshop on Innovation Statistics. 53 OECD (1996), Innovation, Patents and Technological Strategies, Paris. 54 OECD (1982), Patents, Invention and Innovation, op. cit. p. 28. 55 Nordic Industrial Fund (1991), Innovation Activities in the Nordic Countries, Oslo.
14

Norway), set forth a conceptual framework for developing innovation indicators. 57 The
framework was revised during a second workshop in Oslo in 1989 58 and presented to the
OECD Group of National Experts on Science and Technology Indicators (NESTI) the
same year.
OECD Projects on Innovation
1972-1986 Innovation policies
1973-1976 Innovation in services
1978-1981 Innovation in small and medium sized enterprises (SME)
1981-1989 Evaluation and impact of government measures
1986-1989 Reviews of innovation policies (France, Ireland, Spain,
Yugoslavia, and Western Canada)
1994-1998 Best Practices in Technology Policies
1994-2001 National Systems of Innovation (NSI)
1996-1997 Technology Diffusion
To stay ahead of the game, the OECD decided to adopt the Nordic “manual” as its own.
NESTI recommended that the Nordic Fund for Industrial Development prepare a draft
manual for OECD member countries. K. Smith and M. Akerblom (Central Statistical
Office, Finland) drafted the document. 59 The draft was discussed and amended by the
OECD member countries in 1990 and 1991, 60 adopted in 1992, 61 revised for the first
56 OECD (1988), Nordic Efforts to Develop New Innovation Indicators, DSTI/IP/88.25. 57 K. Smith (1989), New Innovation Indicators: Basic and Practical Problems, DSTI/IP/89.25. 58 The main revisions dealt with the problems of identifying and measuring novelty. 59 OECD (1990), Preliminary Version of an OECD Proposed Standard Practice for Collecting and Interpreting Innovation Data, DSTI/IP/90.14. 60 OECD (1991), Compte rendu succinct de la réunion d’experts nationaux pour l’examen du projet de Manuel Innovation, DSTI/STII/IND/STPM (91) 1. 61 OECD (1991), OECD Proposed Guidelines for Collecting and Interpreting Innovation Data (Oslo Manual), op. cit.
15

time in 1996, 62 and published in collaboration with Eurostat in 1997. Another revision is
planned before the next (fourth) round of surveys. 63
The purpose of the Oslo manual was to harmonize national methodologies 64 and collect
standardized information on the innovation activities of firms: the type of innovations
carried out, the sources of technological knowledge, the expenditures on related
activities, the firms’ objectives, the obstacles to innovation and the impacts of innovation
activities. It concentrated on technological product and process (TPP) innovations: “TPP
innovation activities are all those scientific, technological, organizational, financial and
commercial steps, including investment in new knowledge, which actually, or are
intended to, lead to the implementation of technologically new or improved products or
processes”. 65 A firm was considered innovative if it produced one or more
technologically new or significantly improved products or processes in a three-year
period. 66
In 1992, the OECD organized, in collaboration with Eurostat, a meeting to draft a
standard questionnaire and a core list of questions that would permit international
comparisons of innovation surveys in Europe. 67 Three rounds of coordinated surveys
were subsequently carried out in 1993, 1997 and 2001. Workshops were also held in
1993 68 and 1999 69 to review the results of the European Community Innovation
Surveys (CIS). 70 The discussions centered on a number of important issues.
62 OECD (1996), Summary Record of the Meeting Held on 6-8 March 1996, DSTI/EAS/STP/NESTI/M (96) 1. 63 B. Pattinson (2001), The Need to Revise the Oslo Manual, DSTI/EAS/STP/NESTI (2001) 9; OECD (2001), Summary Record of the NESTI Meeting, DSTI/EAS/STP/NESTI/M (2001) 1. 64 For differences between countries, see: P. Kaminski (1993), Comparison of Innovation Survey Findings, DSTI/EAS/STP/NESTI (93) 2. 65 OECD (1997), The Measurement of Scientific and Technological Activities: Proposed Guidelines for Collecting and Interpreting Technological Innovation Data (Oslo Manual), Paris, p. 39. 66 Ibid. p. 53. 67 OECD (1992), Summary Record of the Meeting of the Expert Working Group on Harmonized Innovation Surveys, DSTI/STII/STP/NESTI/M (92) 2. 68 OECD (1993), Summary Record of the Joint EC/OECD Seminar on Innovation Surveys, DSTI/EAS/STP/NESTI/M (93) 2.
16

The first issue consisted of choosing the approach. Should the survey consider innovation
as an output or as an activity? 71 The Oslo manual called the first option the “object
approach” (with the innovation serving as the unit of analysis) and the second option the
“subject approach” (with the firm and the totality of its innovative activities serving as
the unit of analysis). According to the manual, the object approach “results in a direct
measure of innovation”. 72 It “has the important advantage of asking questions at the
project level, while in standard R&D and innovation surveys they tend to be asked at the
firm level, forcing large firms to give some average answer across a number of projects”. 73 The approach works as follows: “develop a list of significant innovations through
literature searches or panels of experts, identify the firms that introduced the innovations,
and then send questionnaires to those firms about the specific innovations”. 74
The OECD opted for the subject approach, however, relegating the discussion of the
object approach to an appendix in the Oslo manual. There it mentioned that the two
approaches could be combined, adding that in such cases the survey should be limited to
the main innovations only, since most firms were ill-equipped to provide this kind of
detailed information. This methodological consideration only played a secondary role in
the decision, however. In fact, the OECD claimed that it preferred the subject approach
69 OECD (1999), Summary Record of the Joint Eurostat/OECD Meeting on Innovation Surveys: Outcomes from the Workshop, DSTI/EAS/STP/NESTI/M (99) 2. 70 For non-member country surveys, see OECD (1999), Description of National Innovation Surveys Carried Out, or Foreseen, in 1997-1999 in OECD non CIS-2 participants and NESTI Observer Countries, DSTI/DOC (99) 1. 71 For early discussions of the issue, see: C. DeBresson (1980), The Direct Measurement of Innovation, op. cit.; D. Archibugi (1988), In Search of a Useful Measure of Technological Innovation, Technological Forecasting and Social Change, 34, pp. 253-277; A.K. Chakrabarti (1989), Technology Indicators: Conceptual Issues and Measurement Problems, Journal of Engineering and Technology Management, 9, pp. 99-116. 72 OECD (1997), The Measurement of Scientific and Technological Activities: Proposed Guidelines for Collecting and Interpreting Technological Innovation Data, op. cit. p. 85. 73 Ibid. pp. 83-84. 74 J. A. Hansen (2001), Technology Innovation Indicator Surveys, in J. E. Jankowski, A. N. Link and N. S. Vonortos, Strategic Research Partnerships, Proceedings from an NSF Workshop, Washington, p. 222.
17
because it is “firms that shape economic outcomes and are of policy significance”. 75 The
choice was in line with the way statistical offices have “controlled” the measurement of
science and technology since the 1960s: the object approach is primarily an expertise
developed (and owned) by academics like economists in the United States, 76 SPRU and
other researchers in the United Kingdom, 77 and A. Kleinknecht et al. in the Netherlands, 78 whereas the firm-based survey (and its subject approach) has always been the
characteristic instrument of statistical offices. 79
The second issue discussed at the workshops concerned the survey’s focus and coverage.
Schumpeter suggested five types of innovation, including organizational and managerial
75 OECD (1997), The Measurement of Scientific and Technological Activities: Proposed Guidelines for Collecting and Interpreting Technological Innovation Data, op. cit. p. 29. 76 J. Jewkes, D. Sawers, and R. Stillerman (1958), The Sources of Invention, St-Martin’s Press; E. Mansfield (1963), Intrafirm Rates of Diffusion of an Innovation, op. cit.; E. Mansfield (1968), Industrial Research and Technological Innovation, op. cit.; National Bureau of Economic Research (1962), The Rate and Direction of Inventive Activity, Princeton: Princeton University Press; E. Mansfield et al. (1977), Social and Private Rates of Return From Industrial Innovations, Quarterly Journal of Economics, pp. 221-240; A.K. Chakrabarti, S. Feinman and W. Fuentivilla (1982), The Cross-National Comparison of Patterns of Industrial Innovations, Columbia Journal of World Business, 17 (6), pp. 33-39. 77 C.F. Carter and B.R. Williams (1957), Industry and Technical Progress: Factors Governing the Speed of Application of Science, op. cit; C.F. Carter and B.R. Williams (1958), Investment in Innovation, op. cit. As part of the Bolton Committee of Enquiry on Small Firms, the Science Policy Research Unit (SPRU) initiated a huge project in 1967 compiling all significant innovations in Britain: C. Freeman (1971), The Role of Small Firms in Innovation in the United Kingdom, Report to the Bolton Committee of Enquiry on Small Firms, HMSO; SAPPHO Project (1972), Success and Failure in Industrial Innovation: A Summary of Project SAPPHO, London: Centre for the Study of Industrial Innovation; C. Freeman (1974), Project SAPPHO, in The Economics of Industrial Innovation, Manchester: Penguin Books, pp. 171s; R. Rothwell et al. (1974), SAPPHO updated: Project SAPPHO Phase II, Research Policy, pp. 258-291; F. Henwood, G. Thomas, J. Townsend (1980), Science and Technology Indicators for the UK - 1945-1979: Methodology, Problems and Preliminary Results, STIC/80.39; J. Townsend et al. (1981), Science Innovations in Britain Since 1945, SPRU Occasional Paper series, no. 16, Brighton: SPRU; C. Debresson (1980), The Direct Measurement of Innovation, op. cit.; K. Pavitt (1983), Characteristics of Innovative Activities in British Industry, Omega, 11, pp. 113-130. 78 A. Kleinknecht (1993), Towards Literature-Based Innovation Output Indicators, Structural Change and Economic Dynamics, 4 (1), pp. 199-207; A. Kleinknecht and D. Bain (1993), New Concepts in Innovation Output Measurement, London: Macmillan; E. Brouwer and A. Kleinknecht (1996), Determinants of Innovation: A Microeconometric Analysis of Three Alternative Innovation Output Indicators, in A. Kleinknecht (ed.), Determinants of Innovation: the Message from New Indicators, Houndmills: Macmillan, pp. 99-124. See also: E. Santarelli and R. Piergiovanni (1996), Analyzing Literature-Based Innovation Output Indicators: the Italian Experience, Research Policy, 25, pp. 689-711; R. Coombs, P. Narandren and A. Richards (1996), A Literature-Based Innovation Output Indicator, Research Policy, 25, pp. 403-413. 79 Australia and Canada tried to incorporate into the Oslo manual questions on the diffusion of advanced technology, but without success, because the subject approach took precedence in the end. See OECD (1991) Compte rendu succinct, op. cit. p. 6; B. Pattinson (1992), Proposed Contents of an Addendum Dealing with Surveys of Manufacturing Technology, DSTI/STII/STP/NESTI (92) 9.
18

innovation. The Oslo manual, however, concentrated solely on technological innovation.
Although the second edition of the manual included (marketed) services, 80 it maintained
a restricted and techno-centric view of innovation. 81 As H. Stead once stated,
technological innovation “obviously excludes social innovation”. 82 Non-technological
innovation such as organizational change, marketing-related changes and financial
innovations were discussed in the manual, but again, only as an afterthought in the
appendices.
This choice was by no means new. The measurement of science and technology had been
biased by a hierarchical approach ever since the first edition of the Frascati manual. The
manufacturing industries took precedence over the service industries in surveys, for
example, and national R&D surveys were initially concentrated on the natural sciences
and only later included the social sciences. Finally, related scientific activities have
always been systematically excluded from surveys. All in all, current statistics “were
built on the bricks and mortar model”. 83
A third issue of the survey’s methodology was the concept of novelty. Some recent
national innovation surveys had recorded a disproportionately high number of innovative
firms. In a recent Canadian study, for example, over 80% of the firms surveyed are
defined as innovators! 84 The source of such overestimations would seem to lie in the
Oslo manual’s decision to define novelty as something that a firm perceives as new rather
than as what the market established as new. 85 Why define novelty in this way? 86
80 Excluding health care, however. 81 F. Djellal and F. Gallouj (1999), Services and the Search for Relevant Innovation Indicators: A Review of National and International Surveys, Science and Public Policy, 26 (4), p. 231. 82 H. Stead (1976), The Measurement of Technological Innovation, DSTI/SPR/76.44/04, p. 1. 83 D. Guellec (2001), New Science and Technology Indicators for the Knowledge-Based Economy: Opportunities and Challenges, STI Review, 27, p. 9. 84 Statistics Canada (2001), Innovation Analysis Bulletin, 88-003, 3 (2), p. 5. 85 J. A. Holbrook and L. P. Hughes (2001), Comments on the Use of the OECD Oslo Manual in Non-Manufacturing Based Economies, Science and Public Policy, 28 (2), pp. 139-144. 86 E.M. Rogers was probably the first author to suggest such a definition of innovation: “An innovation is an idea, practice, or object that is perceived as new by an individual or other unit of adoption. It matters little, so far as human behavior is concerned, whether or not an idea is “objectively” new as measured by the lapse of time since its first use or discovery. The perceived newness of the idea for the individual
19

Because “firms generally know when a product or production process is new to their
firms. Often they do not know whether it is also new to their industry, new to their
country or region, or new to the world”. 87
Nonetheless, it is by using such qualitative answers to the questionnaire that statisticians
calculate the main innovation indicator. The simplest Oslo manual indicator is the
innovation rate, or the percentage of firms that innovate. As the Canadian statistic
showed, the majority of firms describe themselves as innovators. It is a marvelous
statistic for policy rhetoric and managerial morale, but, as the Oslo manual itself warned,
the “proportion of [innovative firms] threatens to become a magic number comparable to
the percentage of GDP devoted to R&D”. 88
Apart from the above three issues, there were two other problems that troubled people,
because they could weaken the legitimacy of innovation statistics. Firstly, there were two
major countries that did not conduct regular innovation surveys nor participate in the
OECD/Eurostat exercise. These were the United States and Japan. This absence was
compounded by the fact that only about 50% of firms actually respond to the surveys in
the participating countries. In fact, it is mainly European countries that conduct
innovation surveys today. This goes back to the technological gap debate and disparities
with the United States, and the slowness with which European countries transformed
research results into commercial innovations, which were at the center of policy
determines his or her reaction to it. If the idea seems new to the individual, it is an innovation”. E.M. Rogers (1962), Diffusion of Innovations, New York: Free Press, p. 13. For an early critique of the concept of novelty, see: T. Levitt (1966), Innovative Imitation, Harvard Business Review, September, pp. 63-70: “When other competitors in the same industry subsequently copy the innovator, even though it is something new for them, then it is not innovation; it is imitation” (p. 63). For a similar distinction, see: J. Schmookler (1966), Invention and Economic Growth, Cambridge: Harvard University Press, p. 2: “The first enterprise to make a given technical change is an innovator. Its action is innovation. Another enterprise making the same technical change later is presumably an imitator and its action, imitation”. For their part, Myers and Marquis suggested distinguishing two types of innovation: original innovation as innovation new to the economy and adopted innovation as innovation new to the firm. See: S. Myers and D. G. Marquis (1969), Successful Industrial Innovation: A Study of Factors Underlying Innovation in Selected Firms, op. cit., p. 3. For early discussions on definitions of innovation, see studies cited in footnote 27 above. 87 J. A. Hansen (2001), Technology Innovation Indicator Surveys, op. cit. p. 229. 88 OECD (1997), The Measurement of Scientific and Technological Activities: Proposed Guidelines for Collecting and Interpreting Technological Innovation Data, op. cit. p. 11.
20

discussions immediately after World War II. The OECD was deeply involved in these
debates, and the science and technology statistics it published between 1970 and 1990
always showed and discussed Europe lagging far behind the United States. The same
discourse on innovation gaps continues to this day at the European Union. 89 The relative
absence of innovation surveys in the United States and Japan, on the other hand, is
probably a consequence of their uncontested superiority in innovation. With their
comfortable lead, the United States and Japan had, until recently, little need to measure
their technological performances, or at least not as regularly as the European countries
do. However, their participation is crucial for carrying out international comparisons.
Secondly, innovation surveys carried measurement problems. Experts, for example,
considered expenditures data 90 to be of questionable value: “The biggest problem stems
from attempts to separate the part of each category of expenditure that is related to new
and improved products and processes from the part that relates to routine activities”. 91 It
is a problem commonly encountered in measuring R&D activities. The European
questionnaire attempted to address the matter by asking firms whether the data provided
were exact or only rough estimates of the actual numbers. This resulted in more firms
simply doing rough estimates.
Another related and important measurement problem was the recurring discrepancy
between innovation and R&D surveys data. 92 Innovation surveys recorded significantly
less R&D activity than did standard R&D surveys because of methodological differences
89 European Union (2001), Competitiveness Report 2001: Competitiveness, Innovation and Enterprise Performance, Brussels. 90 On R&D, know how, tooling up, design, start-up, marketing. 91 J. A. Hansen (2001),Technology Innovation Indicator Surveys, op. cit. p. 232. 92 OECD (2001), Assess Whether There Are Changes Needed as a Result of the Comparison of R&D Data Collected in R&D and in Innovations Surveys, DSTI/EAS/STP/NESTI (2001) 14/PART3; D. Francoz (2000), Measuring R&D in R&D and Innovation Surveys: Analysis of Causes of Divergence in Nine OECD Countries, DSTI/EAS/STP/NESTI (2000) 26; D. Francoz, Achieving Reliable Results From Innovation Surveys: Methodological Lessons Learned From Experience in OECD member countries, Communication presented to the Conference on Innovation and Enterprise Creation: Statistics and Indicators, Sophia Antipolis, 23-24 November 2000.
21
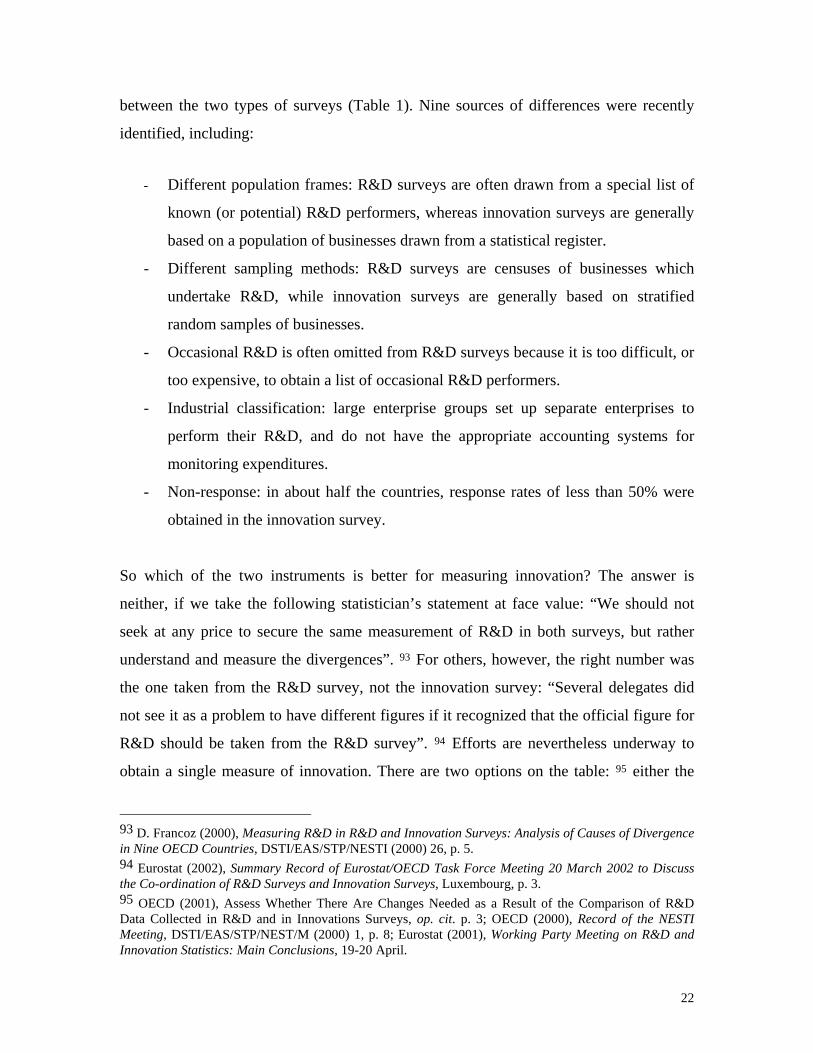
between the two types of surveys (Table 1). Nine sources of differences were recently
identified, including:
- Different population frames: R&D surveys are often drawn from a special list of
known (or potential) R&D performers, whereas innovation surveys are generally
based on a population of businesses drawn from a statistical register.
- Different sampling methods: R&D surveys are censuses of businesses which
undertake R&D, while innovation surveys are generally based on stratified
random samples of businesses.
- Occasional R&D is often omitted from R&D surveys because it is too difficult, or
too expensive, to obtain a list of occasional R&D performers.
- Industrial classification: large enterprise groups set up separate enterprises to
perform their R&D, and do not have the appropriate accounting systems for
monitoring expenditures.
- Non-response: in about half the countries, response rates of less than 50% were
obtained in the innovation survey.
So which of the two instruments is better for measuring innovation? The answer is
neither, if we take the following statistician’s statement at face value: “We should not
seek at any price to secure the same measurement of R&D in both surveys, but rather
understand and measure the divergences”. 93 For others, however, the right number was
the one taken from the R&D survey, not the innovation survey: “Several delegates did
not see it as a problem to have different figures if it recognized that the official figure for
R&D should be taken from the R&D survey”. 94 Efforts are nevertheless underway to
obtain a single measure of innovation. There are two options on the table: 95 either the
93 D. Francoz (2000), Measuring R&D in R&D and Innovation Surveys: Analysis of Causes of Divergence in Nine OECD Countries, DSTI/EAS/STP/NESTI (2000) 26, p. 5. 94 Eurostat (2002), Summary Record of Eurostat/OECD Task Force Meeting 20 March 2002 to Discuss the Co-ordination of R&D Surveys and Innovation Surveys, Luxembourg, p. 3. 95 OECD (2001), Assess Whether There Are Changes Needed as a Result of the Comparison of R&D Data Collected in R&D and in Innovations Surveys, op. cit. p. 3; OECD (2000), Record of the NESTI Meeting, DSTI/EAS/STP/NEST/M (2000) 1, p. 8; Eurostat (2001), Working Party Meeting on R&D and Innovation Statistics: Main Conclusions, 19-20 April.
22

two surveys could be combined, as envisaged by Eurostat – the main user of the
innovation survey – or they could, at the very least, be conducted by the same agency, as
the OECD seems to prefer.
Table 1. R&D Expenditure Measured in R&D Surveys and Innovation Surveys
France, 1997 96
Industry R&D Expenditure from
R&D Survey (US $m) R&D Expenditure from
Innovation Survey (US $m)
Food, beverages, tobacco N/A N/A Textiles, clothing, footwear and leather 120 126 Wood and paper products 51 49 Printing, publishing and recorded media 4 14 Petroleum, coal, chemical and associated products
3,832 1,894
Non-metallic mineral products 212 128 Metal products 497 455 Machinery and equipment 1,230 879 Electric and electronic machinery 2,551 2,724 Precision instruments 1,616 1,171 Automobiles 2,027 1,122 Other transport (mainly aeronautics and space)
2,439 1,039
Energy 524 575 Other manufacturing 111 78 Total manufacturing 15,214 10,254
96 For similar data on Italy and Germany, see G. Sirilli (1999), Old and New Paradigms in the Measurement of R&D, DSTI/EAS/STP/NESTI (99) 13; C. Grenzmann (2000), Differences in the Results of the R&D Survey and Innovation Survey: Remark on the State of the Inquiry, DSTI/EAS/STP/NESTI/RD (2000) 24.
23

Conclusion
The recent internationalization of innovation surveys was characterized by a conceptual
shift from outputs in the 1970s to activities in the 1990s. Without really noticing that they
had departed from their original goal, national governments and the OECD ended up
measuring innovation the way they measured R&D, i.e.: in terms of inputs and activities.
Innovation, however, is a multidimensional phenomenon and a complete measurement
would have to deal with both inputs and outputs.
Certainly, there were contextual factors leading statisticians to measure innovation as an
output early on. Since its very beginnings, the NSF has always tried to convince the
government of the relevance of research to society and the economy. Measuring the
products and processes coming out of research was one way to demonstrate this
relevance. The stated aim of the first NSF innovation statistics was to "provide empirical
knowledge about the factors which stimulate or advance the application in the civilian
economy of scientific and technological findings". 97 Similarly, the OECD needed ways
to convince governments about the superiority of the United States over Western Europe
in terms of technology invention and adoption. Counting innovations was thus part of the
rhetoric for convincing European government to set up science policies and increase
R&D investments. 98
The current practice of measuring innovation as an activity rather than as an output can
be explained by at least three factors. One is the influence of the linear model that has
guided policy-makers since 1945. According to this model, innovation (as a product) is
what comes out (output) of basic research. Whenever statisticians measured innovation,
then, they called it output. However, having focused on activities, innovation surveys fell
far short of measuring innovative outputs (products and processes) and their
characteristics and impacts (or outcomes). Although there are some questions in the 97 S. Myers and D. G. Marquis (1969), Successful Industrial Innovation: A Study of Factors Underlying Innovation in Selected Firms, op. cit. p. iii.
24

innovation survey on the impact of innovation on sales, for example. which were
recognized as key questions as early as 1991, 99 most of these are just qualitative
questions with yes/no answers. 100 Therefore, "it is impossible to quantify these
impacts". 101
A second factor was probably very influential in determining the method of measuring
innovation. I would argue that control by governments of the instrument was a key factor
in the way innovation is now measured by official statisticians. Statistical offices have
long chosen the survey of activities (via the expenditures devoted to these activities) as
the preferred instrument for measuring their concepts. They systematically refuse to rely
on data and databases developed elsewhere, such as in administrative departments
(patents) or in academic circles. Certainly, methodological considerations were important
factors for choosing the activity approach. It is easier to measure activities than products
and processes. But ultimately, only governments have the resources to produce statistics
regularly, so it is this monopoly that defines the de facto standards and dictates the
availability of statistical series.
The third factor explaining the way innovation is actually measured deals with the
concept of innovation itself. Innovation is a fuzzy concept, and is, depending on the
author cited, defined and measured either as a product or as an activity. This is only one
side of the fuzziness of the concept, however. Another relates to whether an innovation is
new at the world level, domestically or from a firm’s point of view. Still another refers to
the production or adoption or implementation of technologies. A firm, for example, is
usually said to be innovative if it invents new products or processes, but some argue that
98 B. Godin (2003), Technological Gaps: Quantitative Evidence and Qualitative Arguments, Project on the History and Sociology of Science and Technology Statistics, Montreal. 99 Sales are not really an impact of an innovating firm for example. An economic impact would rather be profits coming out from innovations, effects of a new process on the innovative firm’s performance, for example, or of a new product on other firms’ performance (productivity, costs) or on the economy as a whole. 100 OECD (1991), Compte rendu succinct, op. cit. p. 5. 101 D. Guellec and B. Pattinson (2001), Innovation Surveys: Lessons from OECD Countries’ Experience, STI Review, 27, p. 92.
25

it could also be so qualified if it adopts new technologies (to improve its operations). The
Oslo manual uses the two definitions of innovation: innovative firms are those that
develop new products, but also those that adopt new processes. But these are really two
phenomena, and probably cannot be added in a single statistics.
The concept of innovation and its measurement have yet to be stabilized. First of all, the
OECD/Eurostat definition of innovation has been changed twice in the last decade. The
definition initially centered on manufacturing activities, but then service activities were
added for the second edition of the Oslo manual. This meant non-comparability between
the two surveys. Secondly, the European questionnaire moved toward a weaker
distinction between technological and non-technological activities in the last round of
surveys. Finally, and above all, respondents do not yet have a consistent understanding of
the concept of innovation, which varies from one industrial sector to another. 102 On the
basis of these shifts and limitations, and from the conclusions of a recent workshop
organized by the European consultative committee on statistical information, one has to
conclude that the OECD/Eurostat standardization on innovation measurement was a bit
premature. 103
102 D. Guellec and B. Pattinson (2001), Innovation Surveys: Lessons From OECD Countries’ Experience, op. cit. pp. 77-101. 103 Comité consultatif européen de l’information statistique dans les domaines économique et social (2003), Les statistiques de l’innovation : davantage que des indicateurs de la R&D, 21e séminaire du CEIES, Athènes, 10-11 avril 2003. While some participants qualified the surveys as being experimental still (p. 26), the chair of the sub-committee on innovation statistics stated that there remains a long way before one could have a definite and comprehensible questionnaire (p. 49).
26