the rise of temporary migration in new zealand and its ... · the rise of temporary migration . in...
TRANSCRIPT

The rise of temporary migration in New Zealand and its impact on the labour market2013
DO
L 12
24
8

Acknowledgements Early results of this research were presented at the Labour, Employment and Work conference in November 2012. The authors would like to thank participants at the conference for their useful feedback and advice. The authors are especially grateful to Mathias Sinning and Jacques Poot for their considered and helpful comments and suggestions.
ISBN 978-0-478-41350-2 June 2013 © Crown copyright 2013
Ministry of Business, Innovation and Employment PO Box 3705 Wellington New Zealand www.dol.govt.nz www.mbie.govt.nz
Visit the Labour and Immigration Research Centre online at www.dol.govt.nz/research or email [email protected].
Ministry of Business, Innovation and Employment (MBIE) Hikina Whakatutuki Lifting to make successful
MBIE develops and delivers policy, services, advice and regulation to support economic growth and the prosperity and wellbeing of New Zealanders.
MBIE combines the former Ministries of Economic Development, Science + Innovation, and the Departments of Labour, and Building and Housing.
Author Keith McLeod Migration Research, Evaluation & Analysis Strategy & Governance Group Ministry of Business, Innovation & Employment
David MaréMotu Economic and Public Policy Research
Disclaimer
The results in this paper are not official statistics; they have been created for research purposes from the Integrated Data Infrastructure (IDI) managed by Statistics New Zealand. Ongoing work within Statistics New Zealand to develop the IDI means it will not be possible to exactly reproduce the data presented here.
The opinions, findings, recommendations and conclusions expressed in this paper are those of the author. Statistics New Zealand or the Ministry of Business, Innovation and Employment takes no responsibility for any omissions or errors in the information contained here.
Access to the data used in this study was provided by Statistics New Zealand in accordance with security and confidentiality provisions of the Statistics Act 1975. Only people authorised by the Statistics Act 1975 are allowed to see data about a particular person, business or organisation. The results in this paper have been confidentialised to protect individual people and businesses from identification.
Careful consideration has been given to the privacy, security and confidentiality issues associated with using administrative data in the IDI. Further detail can be found in the privacy impact assessment for the IDI available from www.stats.govt.nz.
The results are based in part on tax data supplied by Inland Revenue to Statistics New Zealand under the Tax Administration Act 1994. This tax data must be used only for statistical purposes, and no individual information may be published or disclosed in any other form, or provided to Inland Revenue for administrative or regulatory purposes.
Any person who has had access to the unit-record data has certified that they have been shown, have read and have understood section 81 of the Tax Administration Act 1994, which relates to secrecy. Any discussion of data limitations or weaknesses is in the context of using the IDI for statistical purposes, and is not related to the data’s ability to support Inland Revenue’s core operational requirements.

The Rise of Temporary Migration and its Impact on the New Zealand Labour Market v
Executive summary
Background The decade to 2011 saw considerable growth in the use of temporary migrants, including international students, in the New Zealand labour market. This growth coincided with a period of strong economic growth and associated skills shortages. In the 2001 tax year, temporary migrants worked around 1 per cent of the months worked for wages and salaries in that year in New Zealand. Although the months worked by temporary migrants declined from a high of 4.6 per cent in 2009, in 2011 temporary migrants still worked 4.3 per cent of the months worked in that year. The falls in temporary migrant employment did not happen consistently across all immigration categories. While the employment of migrants in the labour market tested Essential Skills Policy has declined considerably since 2009, employment of workers in other categories has been more static. This raises the question of whether the employment of temporary migrants may have had, or be having, negative effects on the employment opportunities available to New Zealanders.
It is difficult to identify a consensus from the large body of international and New Zealand literature that has looked at the labour market impacts of immigration. Findings vary according to the methods adopted, the data used, characteristics of the immigrants and local workers, local policy settings, and the characteristics of the local economy, either at a point in time or more generally. Nevertheless, in general, the impacts of immigration on wages and the employment of existing workers are estimated to be small at worst. Negative impacts may be more evident for certain groups of the population, such as youth, or when the economy is in decline.
Research questions and approach This study begins to answer the question of whether temporary migrants have had an impact on the employment outcomes of New Zealanders, either when the economy is growing, as it has been over most of the last decade, or following a downturn, as has been the case more recently. While several studies have looked at the impact of immigration generally on the outcomes of New Zealanders, no studies have looked at temporary migration specifically, because of either data limitations or the recent nature of growth in this type of migration.
Migrants are attracted to areas where employment is growing. As a result, immigration tends to be positively associated with local wages and employment. We use econometric methods to control for this “spurious” correlation. We use a powerful new database that brings together administrative data sets from across government, most critically immigration, tax and business data. This database enables us to examine employment patterns of temporary migrants in New Zealand for the first time, and to robustly contrast these with employment patterns of the wider New Zealand population. The data set includes information for all individuals who have entered or left New Zealand since the late 1990s or who have had taxable earnings since the early 2000s or both.

vi The Rise of Temporary Migration in New Zealand and its Impact on the Labour Market
Growth in temporary migrant employment For the purposes of this study, temporary migrants are defined as those immigrants to New Zealand who have a temporary right to work in the country. They come from a wide variety of countries, and enter and remain in New Zealand under a variety of immigration categories, including as international students, skilled workers, working holidaymakers, seasonal agricultural workers or family members of other migrants. While temporary migration as a whole has grown considerably, this hides important underlying changes, such as recent falls in the employment of skilled workers. Even more profound changes have occurred in the countries from which New Zealand employers source such migrants. Great Britain and Ireland provided most temporary workers in the early part of the decade to 2011, China dominated in the period from 2006 to 2008, and India emerged as the main source of temporary migrant employment in 2011.
The changes in policy categories and countries of origin were driven by interrelated changes in immigration policy settings, immigrant labour supply and labour demand. This has also resulted in considerable change in the regions and industries of temporary migrant employment. The hospitality sector and horticulture and viticulture sectors have emerged as key employers, with in excess of 10 per cent of the months worked in associated industries being worked by temporary migrants in 2011. Working holidaymakers were prevalent in both these industry sectors, while many international students worked in the former, and Recognised Seasonal Employer Scheme workers emerged as an important source of labour for employers in the latter. Skilled and family workers were employed in a wider range of industries and regions.
Over most of the decade to 2011, the employment of both New Zealanders and temporary migrants grew. Since 2009, employment measured as the total number of months worked has fallen for all groups, with youth being particularly affected. More recently, real monthly earnings have also fallen, reflecting either reductions in hours or reductions in real hourly wage rates. Hiring patterns over the period reflected changes in total employment, with recent decreases being most notable for youth (although they did rebound in 2011). While the hiring of beneficiaries generally trended in the opposite direction to the hiring of temporary migrants, this is likely to be indicative of the reduced number of beneficiaries and (at least partially) the associated increased demand for temporary migrants as economic conditions improve. To establish whether temporary migration had a causal influence on the earnings and employment of New Zealanders, a more sophisticated approach is required.
Modelling the impact of temporary migration Approaches taken in the literature typically use variation over time and either variation across geographic regions or variation across groups defined by individual characteristics at a national level to assess the impacts of immigration. The data used in this study was particularly suited to the former approach, because detailed information on the employment and earnings of both migrants and New Zealanders was available covering several years and including information on the geographic location of employment. The period covered by the data was associated with considerable change in both the numbers of temporary migrants working in New Zealand and the nature of the employment they undertook. As well as geographical information, industry of employment was also available in the data, and the indirect impact of migration across local industries was considered alongside the direct impact of migration within a local industry.

The Rise of Temporary Migration in New Zealand and its Impact on the Labour Market vii
These direct and indirect effects are difficult to interpret separately, because we cannot assume industries are independent of each other. Changes in the structure of employment by industry over the years has seen the growth of support industries such as Agriculture and Fishing Support Services, Employment Services, and Packaging Services (which grew 46 per cent, 64 per cent and 83 per cent respectively from 2001 to 2009, and fell only slightly in subsequent years). Temporary migrant employment represented between a quarter and a half of the growth in these industries in the years to 2009.
Generally, we estimated positive significant direct employment and hiring effects within industries that were cancelled out, at least in part, by significant negative indirect effects across industries. We estimated positive earnings effects both within and across industries that were significant and positive in aggregate. This tends to indicate that, overall, temporary migrant employment has had a positive impact on the employment outcomes of New Zealanders. The only exception to this was when we looked at specific migration categories. This identified a small negative impact of the employment of temporary migrants approved through the family category on the employment of New Zealanders aged over 25. The family category also had an impact on turnover, and was associated with reductions in the hiring of New Zealanders of any age.
Some evidence from international studies suggests the impacts of temporary migration may be more negative in an economic downturn. To assess this in the New Zealand context, we modelled the impact of temporary migration over the shorter period from 2009 to 2011. Overall, we found no evidence of a negative impact since 2011. However, the model may not be sufficiently robust to adequately identify effects, so this result should be treated with caution.
Conclusion Temporary migrant employment grew over most of the decade to 2011, but adjusted to economic change from 2008, albeit not as quickly as for some groups of New Zealanders such as youth. While employment through some temporary policy categories changed rapidly in response to declining labour demand and an increased supply of New Zealanders looking for work, the employment of migrants from other categories only flattened off. Nevertheless, the research was unable to find any evidence that this had adverse consequences for the employment of New Zealanders overall. It could be that these migrants continued to do jobs that New Zealanders were unwilling or unable to undertake, and that temporary migrants continued to provide an important boost to the sectors of the economy in which they work.
While we have not identified negative impacts in this study, and temporary migration is no doubt an important source of labour and skills for New Zealand businesses, it should not be assumed that restrictions on temporary migrant numbers and employment conditions should be removed or that conditions should not be tightened in some areas. The analysis in this study was largely undertaken over a period of economic growth, and the possibility of negative impacts in the future should not be discounted, particularly if temporary immigration settings were relaxed. There was also evidence of negative impacts related to one policy category, and negative impacts may also exist in specific industries and regions.

viii The Rise of Temporary Migration in New Zealand and its Impact on the Labour Market
Contents
Executive summary...................................................................................... v
Background .................................................................................................. 1
Temporary migration to New Zealand ................................................................ 2
Research questions ........................................................................................... 3
Evidence of the impact of immigration on native employment ............................ 4
Data and methods ........................................................................................ 7
Data – Integrated Data Infrastructure ................................................................. 7
Population of interest ......................................................................................... 7
Definitions .......................................................................................................... 7
Outcomes of interest .......................................................................................... 8
Geographic and industry classification ............................................................... 9
Classification of temporary migrants .................................................................. 9
Temporary migrants in the New Zealand labour market ......................... 10
Employment trends .......................................................................................... 10
Trends in temporary migration ......................................................................... 13
Temporary migrants’ place in the labour market .............................................. 16
Differences in youth employment by age ......................................................... 23
Modelling the impact of temporary migration.......................................... 26
Analytical approach ......................................................................................... 26
Results – Direct effects .................................................................................... 30
Results – Allowing for direct and indirect effects .............................................. 34
Impact on youth of different ages ..................................................................... 37
Impact of temporary migration after 2008 ........................................................ 38
Impact of temporary migration by policy category ............................................ 39
Conclusion .................................................................................................. 43
Future research ............................................................................................... 44
References .................................................................................................. 45
Appendix A: Key classifications in the analysis ..................................... 48
Appendix B: Decomposition of employment growth by industry .......... 51
Appendix C: Full results from all models ................................................. 54
The Rise of Temporary Migration in New Zealand and its Impact on the Labour Market ix
Tables Table 1: Relative changes in temporary migrant employment by region to 2011 ................. 17
Table 2: Relative changes in temporary migrant employment by industry to 2011 .............. 19
Table 3: Share of months worked in each industry by population group, 2011 tax year ....... 21
Table 4: Share of months worked in each industry for youth broken down by age, 2011 tax year ............................................................................................................................. 24
Table 5: Models of the impact of temporary migrant employment on total employment (months worked) ................................................................................................................ 30
Table 6: Models of the impact of temporary migrant employment on hires .......................... 31
Table 7: Models of the impact of temporary migrant employment on earnings .................... 32
Table 8: Models of the direct and indirect effects of temporary migrant employment on the employment of New Zealanders ................................................................................... 34
Table 9: Models of the direct and indirect effects of temporary migrant employment on hiring of New Zealanders ................................................................................................... 35
Table 10: Models of the direct and indirect effects of temporary migrant employment on monthly earnings of New Zealanders and temporary migrants ........................................... 35
Table 11: Models of the impact of temporary migrant employment on total employment of youth of different ages ................................................................................................... 37
Table 12: Models of the impact of temporary migrant employment on monthly earnings of youth of different ages ................................................................................................... 37
Table 13: Models of the impact of temporary migrant employment on total employment 2009 to 2011 ..................................................................................................................... 38
Table 14: Models of the impact of temporary migrant employment on hiring 2009 to 2011 .................................................................................................................................. 38
Table 15: Models of the impact of temporary migrant employment on earnings 2009 to 2011 .................................................................................................................................. 39
Table 16: Models of the impact of temporary migrant employment by policy category on total employment by policy category .................................................................................. 39
Table 17: Models of the impact of temporary migrant employment by policy category on hiring ................................................................................................................................. 40
Table 18: Models of the impact of temporary migrant employment by policy category on monthly earnings ............................................................................................................... 41
Table A1: Industry groupings presented in the analysis ...................................................... 48
Table A2: Region groupings............................................................................................... 49
Table A3: Temporary migrant categories ........................................................................... 49
Table A4: Country of origin groupings ................................................................................ 50
Table B1: Change in months worked for wages and salaries by industry, 2001–2011 ........ 51
Table B2: Change in months worked for wages and salaries by industry, 2001–2009 ......... 52
Table B3: Change in months worked for wages and salaries by industry, 2009–2011 ......... 53
Table C1: Regression results for industry level models ...................................................... 54
Table C2: Regression results for region level models ......................................................... 55
Table C3: Regression results for local industry level models .............................................. 56
Table C4:Regression results for local industry level models, with indirect effects across industries ........................................................................................................................... 57
Table C5: Regression results for local industry level models, with indirect effects across industries, 2009 to 2011 only ............................................................................................. 59
x The Rise of Temporary Migration in New Zealand and its Impact on the Labour Market
Table C6: Regression results for local industry level models, with indirect effects across industries, youth by age ..................................................................................................... 60
Table C7: Regression results for local industry level models, with indirect effects, by temporary migrant category ............................................................................................... 61
Figures
Figure 1: Total wage and salary employment by tax year, 2001–2011 ................................ 11
Figure 2: Earnings per month worked for wages and salaries by tax year, 2001–2011 ....... 12
Figure 3: Total hires of wage and salary earners by tax year (other New Zealanders split by pre-hire benefit receipt), 2001–2011 .............................................................................. 13
Figure 4: Temporary migrant employment by migrant category and tax year, 2001–2011 ... 14
Figure 5: Temporary migrant employment by country of origin and tax year (top five country groups in 2011), 2001–2011 .................................................................................. 15
Figure 6: Months worked by temporary migrants as a percentage of all months worked in a region, 2011 tax year .................................................................................................. 16
Figure 7: Months worked by temporary migrants as a percentage of all months worked in an industry, 2011 tax year .............................................................................................. 18
Figure 8: Earnings per month worked for wages and salaries by tax year for youth, broken down by age, 2001–2011 ....................................................................................... 25
Figure 9: Model specifications ............................................................................................ 27
Figure 10: Specification of an instrument based on lagged country-share of temporary migration ........................................................................................................................... 29

The Rise of Temporary Migration in New Zealand and its Impact on the Labour Market 1
Background
The last decade has seen considerable growth in the use of temporary migrants to fill labour market gaps in New Zealand. This growth coincided with a period of strong economic growth and associated skills shortages, and followed a 2001 review of temporary work policy (Department of Labour, 2001). A key outcome from the review was Cabinet’s agreement to “an overarching work policy objective, which was that work policy should complement residence policy by contributing to developing New Zealand’s capacity base” (Merwood, 2006, p. 4).
Research has shown that temporary workers and international students who become permanent residents in New Zealand are more likely to integrate well than permanent migrants who have not worked or studied in New Zealand before migrating. One recent report concluded that “encouraging more migrants to make use of temporary permits before applying for permanent residence in New Zealand may be beneficial to both migrants and New Zealand” (Department of Labour, 2009, p. 150). Temporary migration developed into an important pathway for prospective permanent migrants. From 2002, new work-to-residence policies were introduced, and the introduction of other policies such as the Skilled Migrant Category provided greater recognition of New Zealand work experience and qualifications (Merwood, 2006).
As a result of these policy changes and the growing economy, the number of temporary permits issued rose consistently year on year through most of the decade to 2010. With the onset of the global economic crisis, and consequent reduction in labour demand, the number of temporary migrants being granted permits in New Zealand decreased, but this did not happen consistently across all immigration categories. Although the number of temporary approvals has decreased under labour market tested policies such as Essential Skills, the number of working holidaymakers has continued to increase in recent years (Department of Labour, 2010). The rise in temporary migration over the decade and the continued growth in some categories raise the question whether there may be negative side effects on the employment opportunities available to New Zealanders. This study begins to answer this question.
While several reports have estimated the impact of immigration generally on the outcomes of New Zealanders, no studies have looked at temporary migration specifically. Data limitations associated with survey data sources mean temporary migrants are not separately identified. In fact, in many cases, responses from temporary migrants are not sought or captured.

2 The Rise of Temporary Migration in New Zealand and its Impact on the Labour Market
Temporary migration to New Zealand Temporary migration to New Zealand includes people categorised broadly as workers and international students. Temporary work policies are broadly designed to “allow employers to recruit temporary workers from overseas to meet particular or seasonal labour shortages while protecting employment opportunities and conditions for New Zealand workers” (Department of Labour, 2011, p. 2). International student policies have a focus on attracting and developing students who have the skills and talents New Zealand needs. These policies also aim to increase global connectedness, support sustainable growth of export education capability, earn foreign exchange and strengthen New Zealand education while managing risk to New Zealand and maintaining social cohesion (Department of Labour, 2011).
Estimates of the number of international students undertaking paid work vary, but Ministry of Education (2008) research indicated 35 per cent of international students were in part-time work. More recent evidence from the Integrated Data Infrastructure (IDI) indicates that the proportion of international students in wage and salary employment ranged from 20 per cent to 30 per cent between 2007 and 2011, peaking in the December quarter each year (Merwood, 2013).
Not surprisingly, most migrants in most other temporary categories work while in New Zealand. Examples of temporary work policies include: • Essential Skills – a policy that facilitates the entry of people required on a
temporary basis to fill job shortages where New Zealand citizens or residents are not available.
• Working Holiday Schemes – bilateral schemes that allow young people to work and study while in New Zealand, if the primary intention for their visit is to holiday
• horticulture and viticulture policies such as the Recognised Seasonal Employer Scheme that allow horticulture and viticulture businesses to supplement their New Zealand workforce with migrant workers
• Family – a policy that allows partners of New Zealand citizens, residents, and work or student visa holders to work in New Zealand.
Merwood (2013) also looked at the proportion of temporary workers in various categories who were employed for wages and salaries. The proportion in paid work as at 31 March 2011 ranged from a little over a half for family partnership migrants and working holidaymakers (56 per cent and 57 per cent respectively) to around 80 per cent for seasonal work policies (including the Recognised Seasonal Employer Scheme), the Study to Work Policy, and the Essential Skills Policy, and up to around 90 per cent for the Work to Residence Policy.
There are several reasons why temporary migrants may not be identified as working in the data. The first, and most obvious, is that they may not be working. Family migrants may be supported by their partner, international students may be living off their savings or being supported by family, and working holidaymakers may be travelling. Another possibility is that they are out of New Zealand for a short time and not earning, but are still considered as being resident in New Zealand.1
1 Merwood (2013) defined the usually resident population for whom employment rates were calculated as comprising migrants who are in New Zealand at the reference date or who are out of New Zealand for a period of less than three months.

The Rise of Temporary Migration in New Zealand and its Impact on the Labour Market 3
Finally, there are two possibilities under which we may be undercounting temporary migrant employment. Firstly, the worker may be employed in the “hidden” or “shadow” economy and not paying tax on their earnings. It is impossible to know the extent of this. However, it would be reasonable to assume it is more likely to occur for those groups engaged in employment of a more short-term, transitional nature such as international students and working holidaymakers.
A World Bank report concluded the size of the hidden economy in New Zealand to be small in world terms, estimated at around 12 per cent of gross domestic product in each of the five years to 2007 (Schneider, Buehn, and Montenegro, 2010). The New Zealand Inland Revenue does not produce its own estimates of the size of the hidden economy, but it does identify sectors of the economy where it expects non-compliance to be of particular concern (Inland Revenue, 2010). These sectors include the hospitality industry and the agriculture and horticulture sectors, both of which are areas of the economy with large numbers of temporary migrant workers.
Secondly, it is possible that some workers may not be matched correctly in the IDI data, because of issues related to the recording of names or dates of birth or both. It is not possible to accurately measure this “false negative” rate, but the fact that well over 90 per cent of certain migrant groups who we would expect to be in employment have wages and salaries, leads us to believe that the rate is likely to be below 10 per cent overall and is possibly considerably less. The “false positive” rate, whereby someone is matched incorrectly to another person’s records, is estimated by Statistics New Zealand to be around 0.3 per cent (Statistics New Zealand, 2012).
Overall, we consider that the data is likely to capture and classify correctly the vast majority of temporary migrant employment. Any error is likely to be lesser in magnitude and importance than comparable measures derived from survey sources.
Research questions From economic theory, we would expect the impact of immigration on the employment of workers to be most dependent on the extent to which migrants are complements or substitutes for existing workers and on how immigration affects the demand for labour. As a result, the impact of immigration is likely to be highly context dependent, and could vary according to the skills of migrants and the existing labour force and to specific characteristics of the local economy, including how quickly the labour market is able to adjust to the increase in labour supply. In addition to expanding labour supply, immigration can also increase the demand for labour. Migrants increase consumer demand for goods and services, and this can result in increased wages and employment in the economy.
The primary research question that motivated our analysis is: What impact does temporary migration have on the labour market outcomes of New Zealanders?2 A subsequent question is whether this impact differs for subgroups of the New Zealand population who we identify as being at greater risk in the labour market. Beneficiaries (people who were in receipt of an income-tested benefit before gaining work3) and youth were identified as groups of specific interest.
2 New Zealanders are defined as being New Zealand citizens or people who have an indefinite right to reside in New Zealand regardless of when they were granted residence status. The data does not include a way of identifying country of birth, so overseas-born New Zealanders are not separately identified in the analysis. While the impact of temporary migration may be larger or smaller for the overseas-born or recent migrants, depending on

4 The Rise of Temporary Migration in New Zealand and its Impact on the Labour Market
We are also interested in establishing whether there is any evidence that impacts on New Zealand employment were different in periods of recession than in periods of economic growth. In our analysis, this question is re-framed as whether there is any evidence of a negative impact of temporary migration after 2008.
Finally, we are interested in exploring whether there is any evidence of specific types of temporary migration policy having a differential impact on outcomes of New Zealanders. Temporary migration is heterogeneous with respect to the type of employment undertaken, so it would be reasonable to assume that impacts may differ.
Evidence of the impact of immigration on native employment Over recent decades numerous studies have examined the impact of immigration on native4 employment, particularly focusing on effects on total employment or wages or both. The vast majority of such studies use quasi-experimental methods and generally fall into two categories; those using spatial variation in migration patterns (e.g. Altonji and Card, 1991; Card, 2001; Dustmann, Fabbri, and Preston, 2005), and those using variation in “skill cells”, often defined by age and qualifications at a national level (e.g. Borjas, 2003; Borjas and Katz, 2007; Ottaviano and Peri, 2012).5 Such studies use econometric methods such as instrumental variables and fixed effects estimation to address endogeneity concerns associated with migrants’ non-random location choices. A meta-analysis by Longhi, Nijkamp, and Poot (2004) drew on results of wide-ranging studies using the spatial variation approach, while numerous reports have attempted to draw general conclusions and policy implications from such studies (e.g. Levine, 2010; Somerville and Sumption, 2009).
the degree to which they compete with temporary migrants in the labour market, these differential impacts are not the focus of this research. 3 Income-tested benefits are the Unemployment Benefit, Domestic Purposes Benefit, Widow’s Benefit, Invalid’s Benefit, Independent Youth Benefit, Emergency Benefit, Sickness Benefit, and associated hardship benefits. 4 The term “native” is commonly used in immigration and economic research literature to describe the non-migrant population, often defined as the population of people who were born in the country whose labour market is being analysed. 5 The spatial variation approach is also commonly referred to as an “area” or “spatial correlation” approach. The skill cell approach is also referred to as a “factor proportions” or “national” approach.

The Rise of Temporary Migration in New Zealand and its Impact on the Labour Market 5
Some studies using the skill cell approach (e.g. Borjas, 2003; Borjas and Katz, 2007) found significant negative impacts of immigration on low-skilled natives, suggesting the spatial correlation approach may give positively biased results.6 One of the key criticisms of this type of study, however, is the degree to which it assumes migrants are perfect substitutes for natives in the labour market. More recent studies, such as that by Ottaviano and Peri (2012) and Manacorda, Manning, and Wadsworth (2012), extending the work of Card and Lemieux (2001) to allow for imperfect substitutability between migrants and natives, have produced more positive findings, however. Borjas, Grogger and Hanson (2008) contend, however, that the evidence behind imperfect substitutability is weak, and depends on the way the sample is constructed.
A recent exception to this aggregate approach is a study by Cattaneo, Fiorio, and Peri (2013) that followed the outcomes of individuals longitudinally over time and related their outcomes to varying levels of immigration competition. The authors noted the danger that compositional changes of the “cells” used in an aggregate analysis could mask the effects on individuals. As with most of the earlier studies, however, the conclusion from this study was that overall higher immigrant competition pushed natives towards “jobs using more sophisticated skills, requiring higher education and paying higher wages”.
While conclusions vary across studies, the overall consensus is that the impact of immigration on the labour market outcomes of natives is small at worst. Bauer, Flake, and Sinning (2013, p. 4) conclude that:
Although simple theoretical models suggest that an increase in labor supply due to immigration may result in lower wages and/or higher unemployment of natives if they are perfect substitutes to immigrants, empirical studies typically conclude that immigration has economically irrelevant or no effects on wages and employment of natives.
Recent New Zealand studies have tended to back up this general conclusion. Maré and Stillman (2009) and Tse and Maani (2012) identified an overall modest but positive impact of recent migrants on native employment.
Although Borjas (2004, p. 1) asserted that “reduction in [native] earnings occurs regardless of whether the immigrants are legal or illegal, permanent or temporary”, we have identified few studies that have looked specifically at the impacts of temporary migration generally or of specific temporary migration policies. In the latter case, a handful of studies have looked at the United States “H-1B” temporary skilled worker programme. Most notably, Zavodny (2003) finds no evidence of negative wage impacts, but a possible positive impact on unemployment. At the other end of the skill range, a very recent study by Clemens (2013) looked at the impact of temporary seasonal workers in the state of North Carolina. The study found no significant direct effect on the employment of native workers, but suggested there existed a positive significant indirect impact on employment in other sectors of the state economy.
6 The main criticism of the spatial approach is that natives could respond to an immigration-related local labour supply shock by moving to another area, an effect not generally captured by this approach.

6 The Rise of Temporary Migration in New Zealand and its Impact on the Labour Market
Gross and Schmitt (2012) present an analysis of the impact of temporary foreign workers in the Canadian context. However, the outcome of interest in this study is regional disparities in unemployment rates, rather than the employment or unemployment of native workers. Few survey data sources capture detailed or robust information on the immigration policy that leads to a migrant getting the right to live and/or work in a country, so studies of temporary migration tend to rely on administrative data sources, often in combination with survey sources.
Similarly, few studies have looked at hiring as an outcome of concern, with the odd exception (e.g. Wagner, 2009). Poot and Cochrane (2004, p. 14) noted that “taking labour market dynamics into account … the impact of immigration on layoff rates or hiring rates can also be investigated”, but “the impact of immigration on labour turnover and transitions appears as yet not researched”. Wagner (2009) estimated that migration had reduced native wages in Austria, and resulted in many native workers changing industry, primarily from services to manufacturing.
There is some evidence in the literature linking impacts of immigration to the state of the economy. For example, a recent report from the Migration Advisory Committee (2012) in the United Kingdom found no association between working-age migrants and native employment in buoyant economic times, but did find a significant negative association in depressed economic times. Similarly, the report identified a significant negative association between migration from outside the European Union and native employment, but not for migrants from the European Union.7 These conclusions were drawn from region-based models with region fixed effects included, but not instruments. Instrumental variables models were constructed using lagged migration as an instrument, but coefficients changed as different lag periods were tested and the fixed effect results were preferred. In a similarly timed study, also in the United Kingdom context, however, Lucchino, Rosazza-Bondibene, and Portes (2012) failed to find any impact of either increased migrant inflows on unemployment or more adverse effects during periods of low economic growth.
There is a general conclusion in the literature that labour market impacts are not likely to be equal for all groups of the native population. Many studies distinguish between low-skilled and high-skilled native populations, while others identify other groups at particular risk of substitution such as youth. In a recent study, Smith (2012) looked specifically at the impact of low-skilled migrants on the employment of young Americans. Smith identified negative effects on wages and employment of native-born Americans and a considerably larger effect for younger native-born. While our study has a slightly different focus, looking at temporary, rather than explicitly low-skilled migration, many temporary migrants work in low-paid jobs in low-skilled industries such as agriculture and hospitality. Temporary migrants in most policy categories are also far more likely than the non-migrant New Zealand population to take up work of a short-term nature and to move between jobs on a regular basis.
7 Some caution should be taken in interpreting this distinction. Although not statistically significant, the estimated negative association between European Union migration and native employment was even greater than that for non-European Union migration. This was not discussed in the report, but is evident in the tables included in the annex.

The Rise of Temporary Migration in New Zealand and its Impact on the Labour Market 7
Data and methods
Data – Integrated Data Infrastructure In 2011, Statistics New Zealand began bringing together a series of its linked data sets into the Integrated Data Infrastructure (IDI). This followed a successful proposal for Migrant Levy funding, and included linking the then Department of Labour’s immigration and international movements data with other linked longitudinal databases (Statistics New Zealand, 2012). This paper takes advantage of the new link between immigration data and the Inland Revenue data that sits at the core of the IDI. Statistics New Zealand controls access to this data, following strict security and confidentiality conditions as set out on page iii. With this data we can identify immigrants on temporary visas and link this to information on earnings, industry and location of employment, and receipt of social security benefits for both temporary migrants and New Zealand citizens and residents. Our analysis uses monthly earnings data to construct spells in employment, and hence to identify when people are hired.
Population of interest All New Zealand residents and citizens could be considered as being at risk of adverse outcomes due to a migration-related labour supply shock, but those most disadvantaged in the labour market may be at greater risk. This is, in part, because of the lack of attachment these groups have to the labour market and, in part, because of an increased likelihood that they may be substitutes for temporary migrants in low-skilled industries or part-time, seasonal and fixed-term work.
Our analysis examines two groups who might be considered as being particularly disadvantaged. Firstly, those who are in receipt of a benefit, so have been out of work for long enough to require income support, and young people (aged 16 to 24) not in receipt of a benefit, but who may be entering the labour market for the first time or seeking short-term work. Youth experience high unemployment and have been particularly negatively affected by the recent recession. They tend to have less experience and fewer skills than other people, making them less likely to be hired and more likely to be laid off, and they often lack both labour market information and job search expertise (Department of Labour, n.d.).
Definitions For the purposes of this report, New Zealanders are defined as people who have the right to permanent residence in New Zealand. This right may be through citizenship, either by grant or birth, or by being the holder of a residence class visa.
Youth are defined as New Zealanders aged 16–24 (or subgroups thereof), while “other New Zealanders” are defined as New Zealanders aged 25 and over.
Beneficiaries are defined in the context of hiring, and are defined as people who have received an income-tested benefit in the three months before being hired and who are not defined as youth.

8 The Rise of Temporary Migration in New Zealand and its Impact on the Labour Market
Outcomes of interest The analysis focuses on three key outcomes of interest: • total employment, expressed as the number of months worked and calculated
as the number of calendar months in which the population of interest received taxed salary and wage earnings
• monthly earnings, expressed as the average monthly salary and wages earned over all months worked by the population of interest
• the number of hires, calculated as the number of times a worker earned salaries and wages from a particular employer where they had not earned salaries and wages from that employer in the previous two months.
The first measure gives an idea of how much work is being undertaken by temporary migrants and New Zealanders respectively, how this has changed over time, and how it differs by subgroup. We are unable to define total employment in terms of hours worked, because this information is not collected in the tax system, so is not captured in the IDI. However, the measure is more refined than simply counting the number of workers. This is important in the context of temporary migration, as some categories of temporary migration (such as Essential Skills) encourage relatively stable employment, because the visa is linked to a particular job for a particular employer. Other categories (such as the working holiday schemes, family category, and international students) allow more freedom in moving between jobs. International students are further required to work only part time during term-time, possibly encouraging work of a more transitory nature.
Monthly earnings for salary and wage earners are available in the IDI, sourced through monthly tax returns submitted by employers. As indicated above, hours worked are not recorded, which means hourly wages cannot be calculated. Therefore, fluctuations in earnings could be driven by either changes in the hours worked by employees or changes in their hourly wage. Any estimates of the impact of temporary migration should be interpreted in this context.
The number of hires provides an alternative measure of employment change. While the measure may capture direct evidence of substitution occurring (i.e. a temporary migrant being hired for a job that otherwise would have gone to a New Zealander), it will also capture broader impacts on labour market churn (e.g. where an increase in temporary migration results in a reduction in both hires and separations of New Zealanders). The latter may result from New Zealanders being less likely to risk moving from one job to another or finding it harder to secure alternative employment. If they remain in their current job, this may not result in an impact on overall employment.
Constructing a measure such as hires that relates to a transition into employment, also allows us to look at the impact on recipients of income-tested benefits (referred to as beneficiaries). This is a subgroup of the population that may be particularly at risk of substitution in the labour market, and for whom the Government has specific interest in helping to find employment.
We also investigate including a measure of separations, calculated as the number of times a worker who had previously been paid by an employer, stopped being paid by that employer for at least two months. The results from the analysis of this measure are almost identi`cal to the results for the hiring analysis, possibly supporting the conclusion that any hiring effects relate to changes in employment churn rather than substitution. Ideally, we would use a more nuanced measure that would restrict separations to those that were forced (i.e. firings and redundancies).

The Rise of Temporary Migration in New Zealand and its Impact on the Labour Market 9
However, this information was not available in the IDI. We would expect such effects to be picked up in the overall employment measure, however.
Geographic and industry classification For the purposes of our analysis, we break down employment according to the industry of the employer and the region of employment. We combine a few small regional council areas such that we end up with 12 regional areas (which match regions used in the reporting of Household Labour Force Survey data) and break down industry of employment into 21 categories. Industry categories were selected based on a desire to separately represent large industries (e.g. Construction and Manufacturing), while providing extra detail in industries in which temporary migrants tend to be employed (e.g. Agriculture). Definitions of industries and regions are in Appendix A (Tables A1 and A2, respectively).
We do not have industry and region data for all salary and wage earners, but this information is missing for only a very small minority of workers. In any particular year, fewer than 0.3 per cent of workers have a missing industry and 0.03 per cent have a missing region. Industry and region information is missing for at most 0.2 per cent of temporary migrants in any particular year. Industry and region information is derived from the classification of the employer. Where an employer engages in activities across multiple industries or regions, it is possible that workers may be misclassified. However, results are generally consistent with expected employment totals by region and industry from other data sources. Therefore, we expect the level of misclassification to be low overall.
Classification of temporary migrants Temporary migrants have been defined primarily according to the category under which they were granted work rights in New Zealand. We have broadly classified these into five categories, described below. Appendix A (Table A3) outlines the immigration policies that fit into each broad category. The five categories are: • International students • Essential Skills • Working Holiday Schemes • Family • Recognised Seasonal Employer • Other Categories.
Temporary migrants are also described in this report according to their country of origin. This category is used both descriptively and to construct an instrumental variable in the modelling section, discussed later in the report. Most countries of origin are represented separately. However, some groupings were constructed where trends and employment patterns were similar and countries were geographically and/or culturally close to each other. Groupings are outlined in Appendix A (Table A4).

10 The Rise of Temporary Migration in New Zealand and its Impact on the Labour Market
Temporary migrants in the New Zealand labour market
This section describes employment changes in New Zealand over the decade of interest, with a particular focus on the changing place of temporary migrants in the New Zealand labour market and the changing characteristics of those migrants. These statistics, and the models that follow in the next section, use data over the 11-year period from the year ending 31 March 2001 to the year ending 31 March 2011 (referred to as the 2001 and 2011 tax years).
To better understand the changes in employment over recent years, we first present time series of the employment of temporary migrants and New Zealanders. This shows the context in which the growth of temporary migration has occurred. We then describe changes in temporary migration according to the policies under which these migrants have been approved and their countries of origin. We then describe the characteristics of temporary migrants and their place in the labour market in 2011, the most recent tax year in our data. Finally, we look at differences in the employment of youth of different ages.
Outcomes are described in terms of total employment, earnings and hiring, as described above.
Employment trends
Trends in months worked
Figure 1 shows the general trend in total employment over the period of interest, broken down by months worked by youth (aged 16–24), other New Zealanders and temporary migrants. The general positive economic conditions were associated with increases in employment over most of the decade. In relative terms, employment growth was shared fairly evenly between youth and other New Zealanders between the 2001 and 2009 tax years, the former increasing 16 per cent to around 3.9 million months and the latter increasing 19 per cent to 18.8 million months.8 Over the same period, employment of temporary migrants grew almost 500 per cent as a result of a buoyant labour market with associated skills shortages and the changes to the immigration system discussed earlier. In 2001, temporary migrants worked 1.0 per cent of the approximately 19 million months worked for wages and salaries in New Zealand in that year. By 2009, temporary migrants worked 4.6 per cent of the 24 million months worked. However, this declined slightly to 4.3 per cent of the 23 million months worked in 2011.
8 Note, however, that youth employment peaked a year earlier, in 2008. From 2001 to 2008, youth employment increased 19 per cent to a high of 4.1 million months.

The Rise of Temporary Migration in New Zealand and its Impact on the Labour Market 11
Since 2009, employment growth has stalled overall with youth wage and salary employment dropping 13 per cent (on top of a 3 per cent decrease the previous year), employment of other New Zealanders dropping almost 2 per cent, and temporary migrant employment dropping around 10 per cent. Falls in employment began slightly earlier for youth, in 2009. As is evident, temporary migration still represents a relatively small slice of the overall New Zealand labour market, but, despite the recent drop in temporary migrant employment, levels remain high in historical terms. This raises a particular question about whether this level of temporary migration may be having a negative impact on the employment of New Zealanders.
Figure 1: Total wage and salary employment by tax year, 2001–2011
Note: All counts used to construct this graph have been rounded using graduated random rounding to protect confidentiality. Source: Figures have been extracted from the Integrated Data Infrastructure managed by Statistics New Zealand.
Trends in wage and salary earnings
Real earnings from wages and salaries over time, expressed in 2011 dollars, are reported in Figure 2. As with the total employment results presented above, real earnings increased over most of the decade from 2001, before declining in 2010 for youth and in 2011 for temporary migrants and other New Zealanders, a little later than for total employment. Other New Zealanders earned the most in all years, with youth earning the least. As discussed above, differences could reflect differences in hours worked each month or in wage rates.

12 The Rise of Temporary Migration in New Zealand and its Impact on the Labour Market
Figure 2: Earnings per month worked for wages and salaries by tax year, 2001–2011
Note: All counts used to construct this graph have been rounded using graduated random rounding to protect confidentiality. Source: Figures have been extracted from the Integrated Data Infrastructure managed by Statistics New Zealand.
Trends in hiring
When we look at hiring, other New Zealanders (aged 25 and over) are separated according to whether they had received a benefit in the three months before being hired. Figure 3 shows the contrasting changes in hires among beneficiaries and other groups of New Zealanders.
Youth and older non-beneficiary hires generally mimic the economic conditions driving total hiring, but beneficiary hires are more responsive to changes in beneficiary numbers, which fell over the decade before rebounding in 2009 and 2010. As the number of beneficiaries dropped over the decade, hires of beneficiaries also dropped. The turning point happened a year later than for other groups, with beneficiary hires showing a lagged response to changes in benefit numbers, increasing in 2010.
Hiring patterns of temporary migrants mirror those of beneficiaries over most of the decade. However, this correlation cannot be interpreted as causation without more sophisticated econometric analysis. Positive economic conditions increase labour demand and drive up the employment of both New Zealanders and temporary migrants. This, in turn, results in fewer New Zealanders on benefits, so fewer beneficiaries are available to move into work.

The Rise of Temporary Migration in New Zealand and its Impact on the Labour Market 13
Figure 3: Total hires of wage and salary earners by tax year (other New Zealanders split by pre-hire benefit receipt), 2001–2011
Note: All counts used to construct this graph have been rounded using graduated random rounding to protect confidentiality. Source: Figures have been extracted from the Integrated Data Infrastructure managed by Statistics New Zealand.
Hiring rates as a proportion of months worked show a more gradual change over time. Rates for other New Zealanders (including beneficiaries and non-beneficiaries) declined slowly from just under 7 per cent in 2001 to a little over 5 per cent in 2011. Youth hires represented a higher proportion of months worked, declining from 14 per cent in 2001 to 12 per cent in 2010, before rebounding to 13 per cent in 2011. Temporary migrant hiring was even greater than for youth hiring, reflecting the short-term nature of much temporary migrant employment – hiring was highest in 2002 (19 per cent), but was relatively variable over time, perhaps reflecting (at least in part) the changing composition of temporary migrant flows. The temporary migrant rate of hiring reached a low of 15 per cent in 2010.
Trends in temporary migration Trends in temporary workers and international student visa approvals are summarised well in the Ministry of Business, Innovation and Employment’s annual Migration Trends and Outlook (Migration Trends).9 The 2010/11 report covered trends from the year ended 30 June 2003 (2002/03) to the year ended 30 June 2011 (2010/11) (Department of Labour, 2011).10
9 The Ministry of Business, Innovation and Employment was formed on 1 July 2012, bringing four separate government agencies, including the Department of Labour, into one ministry. The Ministry now publishes Migration Trends and Outlook. 10 Note that this differs from the analysis of employment in this report, which is based on the tax year (i.e. the year to 31 March).

14 The Rise of Temporary Migration in New Zealand and its Impact on the Labour Market
In this section, we focus on temporary migrant employment rather than visa approvals. Although someone may be issued a visa with work rights, this does not necessarily mean they work in New Zealand. People may do more than one job while on a visa, or they may do one job that spans periods on multiple visas.
Figure 4 presents temporary migrant employment according to the type of visa the migrant was most recently issued (migrant category). Migration Trends shows that the number of international students approved peaked at around 90,000 in 2002/03, before dropping to fewer than 70,000 in 2006/07 (Department of Labour, 2011). Over this period, international student employment grew, however, peaking at almost 180,000 months, before falling from the 2006 tax year. International student employment has fluctuated at around 150,000 months per year since 2008, while students approved have increased gradually year on year.
Figure 4: Temporary migrant employment by migrant category and tax year, 2001–2011
Note: All counts used to construct this graph have been rounded using graduated random rounding to protect confidentiality. Source: Figures have been extracted from the Integrated Data Infrastructure managed by Statistics New Zealand.
Perhaps the most striking year-on-year growth has been in the employment of migrants under the Essential Skills Policy. Visas issued under this policy are tied to a particular job, and the visa is subject to a labour market test that establishes whether New Zealanders are available for the job before the visa is approved. Therefore, employment under this category might be expected to react most strongly to changes in economic conditions. Following considerable year-on-year growth throughout the decade, employment of essential skills migrants declined considerably in the 2010 tax year, before dropping even more strongly in 2011. Nevertheless, migrants with Essential Skills visas worked over 230,000 months in the 2011 tax year, more than those with any other category of temporary visa.

The Rise of Temporary Migration in New Zealand and its Impact on the Labour Market 15
Working Holiday Scheme employment has been consistent with growth in approvals over the last decade. Although the number of approved working holidaymakers flattened in 2009/10, employment dropped slightly in that year before rebounding to almost 200,000 months in 2010/11. Employment under the Recognised Seasonal Employer Scheme has been stable since the 2009 tax year, and represents only a small part of the temporary migrant labour market with little more than 30,000 months worked per year. Nevertheless, this is an important category of employment for the horticulture and viticulture industry.
Figure 5 shows changes in temporary migrant employment broken down by country of origin groupings (as discussed earlier, and presented in Appendix A, some countries were grouped with other countries in the same region that had similar employment patterns). The graph shows the five origin country groupings that had the highest employment in 2011, making up 55 per cent of temporary migrant employment in that year.
Figure 5: Temporary migrant employment by country of origin and tax year (top five country groups in 2011), 2001–2011
Note: All counts used to construct this graph have been rounded using graduated random rounding to protect confidentiality. Source: Figures have been extracted from the Integrated Data Infrastructure managed by Statistics New Zealand.
Temporary migrants from different countries show quite distinct patterns of change in employment over the period. Temporary migrant employment from Great Britain and Ireland was relatively stable over recent years, while employment of temporary migrants from China grew rapidly over the first half of the decade, before dropping sharply since 2007. The employment of temporary migrants from India, the Philippines and Fiji was relatively inconsequential up to 2007, but increased rapidly from that point. The employment of temporary migrants from India in particular has shown rapid growth that has not been halted by the onset of the global economic crisis and the consequent tightening labour market in New Zealand. In 2011, Indian temporary worker employment was higher than for temporary workers from any other country of origin, with almost 180,000 months worked.
16 The Rise of Temporary Migration in New Zealand and its Impact on the Labour Market
Country of origin is strongly linked to the type of visas migrants are issued. While migrants from the United Kingdom and Philippines each made up more than 10 per cent of Essential Skills visa approvals in 2010/11, they were not important sources of international students (Department of Labour, 2011). Indian and Chinese migrants, on the other hand, made up only 8 per cent and 6 per cent of Essential Skills approvals respectively, but 14 per cent and 22 per cent of international student numbers respectively. Over half the working holidaymakers in 2010/11 came from the United Kingdom, Germany and France.
Temporary migrants’ place in the labour market This section shows the place of temporary migrants in the New Zealand labour market, with a particular focus on the regions and industries in which they work and the way these have changed over time.
Temporary migrant employment by region
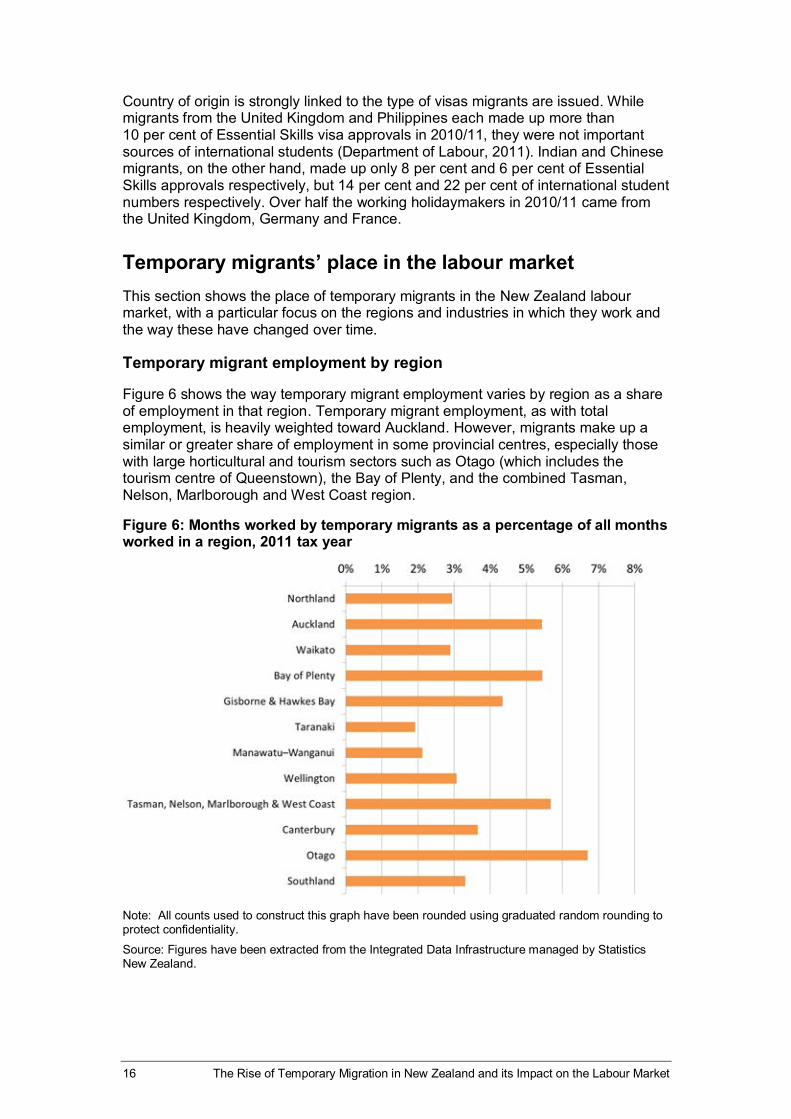
Figure 6 shows the way temporary migrant employment varies by region as a share of employment in that region. Temporary migrant employment, as with total employment, is heavily weighted toward Auckland. However, migrants make up a similar or greater share of employment in some provincial centres, especially those with large horticultural and tourism sectors such as Otago (which includes the tourism centre of Queenstown), the Bay of Plenty, and the combined Tasman, Nelson, Marlborough and West Coast region.
Figure 6: Months worked by temporary migrants as a percentage of all months worked in a region, 2011 tax year
Note: All counts used to construct this graph have been rounded using graduated random rounding to protect confidentiality. Source: Figures have been extracted from the Integrated Data Infrastructure managed by Statistics New Zealand.

The Rise of Temporary Migration in New Zealand and its Impact on the Labour Market 17
Relative changes in temporary migrant employment by region are presented in Table 1. Relative growth was reasonably evenly shared across all regions over the first years of the decade from 2001 to 2005 with all regions increasing 150 per cent to 350 per cent from relatively small bases. From 2005 to 2009, growth was more localised in the key horticulture and viticulture regions with Bay of Plenty; Tasman, Nelson, Marlborough, and West Coast; and Gisborne and Hawke’s Bay all continuing to grow around 150 per cent. In the more recent period to 2011, temporary migrant employment in both Southland and the Bay of Plenty continued to show steady growth, around a fifth, while temporary migrant employment in most areas declined.11
Table 1: Relative changes in temporary migrant employment by region to 2011
Year % change 2001–2005
% change 2005–2009
% change 2009–2011
Months employed
2011
Northland 171 80 -7 18,700
Auckland 184 79 -18 409,100
Waikato 269 57 -8 56,700
Bay of Plenty 232 160 18 73,800
Gisborne & Hawke’s Bay 253 142 3 46,700
Taranaki 235 112 -7 11,200
Manawatu–Wanganui 292 36 -4 25,100
Wellington 218 48 -15 87,200
Tasman, Nelson, Marlborough, & West Coast 353 175 -9 53,600
Canterbury 295 55 -9 112,100
Otago 296 69 1 77,700
Southland 279 104 22 18,000
Total 222 78 -10 989,900
Note: All counts have been rounded using graduated random rounding to protect confidentiality.
Source: Figures have been extracted from the Integrated Data Infrastructure managed by Statistics New Zealand.
11 Temporary migrant employment in Otago and in Gisborne and Hawke’s Bay was almost unchanged over this period.

18 The Rise of Temporary Migration in New Zealand and its Impact on the Labour Market
Temporary migrant employment by industry
Figure 7 shows migrant employment by industry groupings and clearly illustrates that temporary migration is of vastly different importance to different industries. The dominance of temporary migrants in horticulture and viticulture and in hospitality can be seen clearly with more than a 15 per cent share in key associated industries, including Fruit and Tree Nut Growing, Agriculture and Fishing Support Services, Packaging Services, Employment Services,12 Accommodation, and Food and Beverage Services.
Figure 7: Months worked by temporary migrants as a percentage of all months worked in an industry, 2011 tax year
Note: All counts used to construct this graph have been rounded using graduated random rounding to protect confidentiality. Source: Figures have been extracted from the Integrated Data Infrastructure managed by Statistics New Zealand.
12 Note that while the first four industries listed are identified as being associated with horticulture and viticulture, some workers in each may be involved in other sectors. As an indication of whether this is the case, look at the location of employment. For example, Agriculture and Fishing Support Services workers could support other types of agriculture. However, the three key horticulture and viticulture regions of Bay of Plenty; Gisborne and Hawke’s Bay; and Tasman, Nelson, Marlborough, and West Coast account for almost half of the months worked in this industry. Packaging Services could include some workers in non-horticultural industries. However, around 80 per cent of months worked in this industry were worked in the same three regions identified above, and around 60 per cent of months were worked in the Bay of Plenty alone. Employment Services will incorporate work in a far wider range of sectors. However, this is an important industry of employment for Recognised Seasonal Employer Scheme workers. Finally, some horticulture and viticulture workers will be employed in industries other than the four identified. Obvious examples are the Manufacturing sub-industry “Wine and Other Alcoholic Beverage Manufacturing”, which includes many viticulture workers, and the horticultural industries “‘Nursery and Floriculture Production” and “Mushroom and Vegetable Growing”, which employ relatively few temporary migrants and are included in Other Agriculture, Forestry and Fishing in our analysis.
The Rise of Temporary Migration in New Zealand and its Impact on the Labour Market 19
There are considerable differences in industry of employment for migrants approved under different temporary categories. Almost a third of months worked by international students are in the Food and Beverage Services industry (29 per cent), while another sixth are in Retail Trade13 (15 per cent). Essential Skills workers are far more widely spread across industries, with fewer than half of the months worked by such migrants being worked in the top five14 industries: Food and Beverage Services, Manufacturing, Other Health Care and Social Assistance, Dairy Cattle Farming, and Residential Care Services (14 per cent, 10 per cent, 9 per cent, 8 per cent, and 7 per cent respectively).
Family migrants were even more evenly spread across industries. Almost half of the months worked by working holidaymakers were worked in Food and Beverage Services (19 per cent), the horticulture-related industries of Agriculture and Fishing Support Services and Fruit and Tree Nut Growing (10 per cent and 8 per cent respectively) and in Employment Services (12 per cent).
Not surprisingly, almost all hours worked by Recognised Seasonal Employer Scheme migrants were worked in Agriculture and Fishing Support Services, Fruit and Tree Nut Growing, and Employment Services (24 per cent, 25 per cent and 12 per cent, respectively) and in Packaging Services (29 per cent).
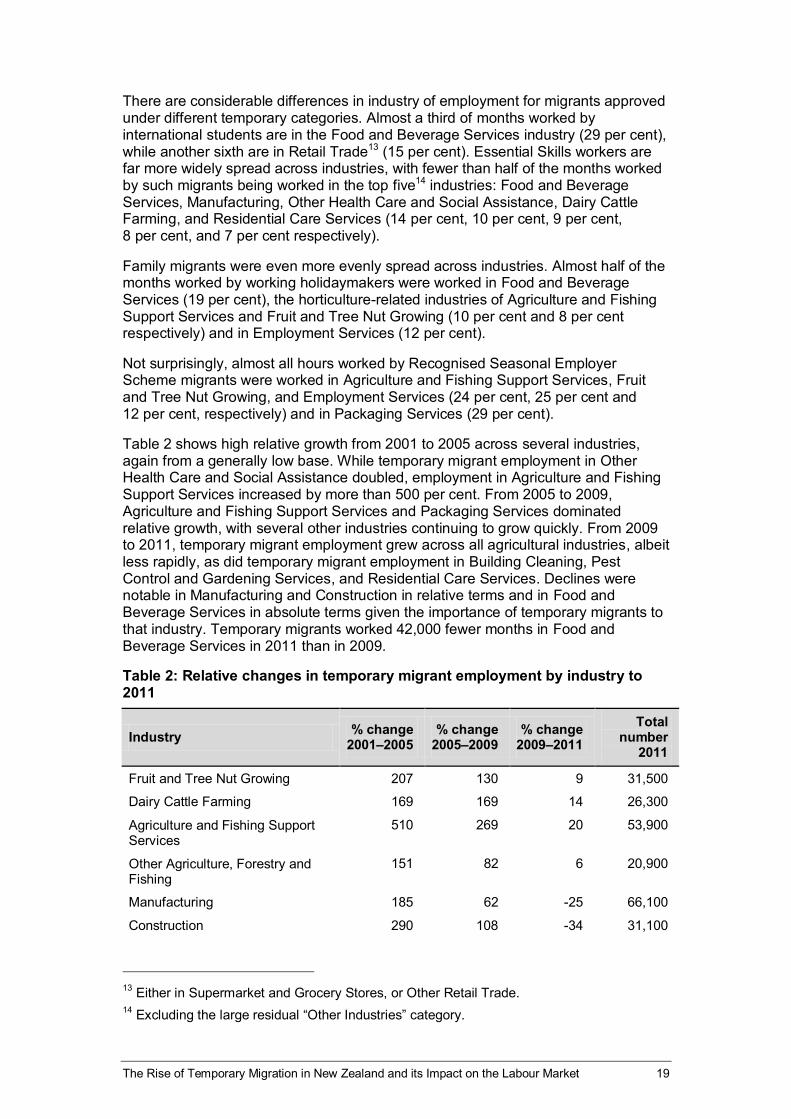
Table 2 shows high relative growth from 2001 to 2005 across several industries, again from a generally low base. While temporary migrant employment in Other Health Care and Social Assistance doubled, employment in Agriculture and Fishing Support Services increased by more than 500 per cent. From 2005 to 2009, Agriculture and Fishing Support Services and Packaging Services dominated relative growth, with several other industries continuing to grow quickly. From 2009 to 2011, temporary migrant employment grew across all agricultural industries, albeit less rapidly, as did temporary migrant employment in Building Cleaning, Pest Control and Gardening Services, and Residential Care Services. Declines were notable in Manufacturing and Construction in relative terms and in Food and Beverage Services in absolute terms given the importance of temporary migrants to that industry. Temporary migrants worked 42,000 fewer months in Food and Beverage Services in 2011 than in 2009.
Table 2: Relative changes in temporary migrant employment by industry to 2011
Industry % change 2001–2005
% change 2005–2009
% change 2009–2011
Total number
2011
Fruit and Tree Nut Growing 207 130 9 31,500
Dairy Cattle Farming 169 169 14 26,300
Agriculture and Fishing Support Services
510 269 20 53,900
Other Agriculture, Forestry and Fishing
151 82 6 20,900
Manufacturing 185 62 -25 66,100
Construction 290 108 -34 31,100
13 Either in Supermarket and Grocery Stores, or Other Retail Trade. 14 Excluding the large residual “Other Industries” category.
20 The Rise of Temporary Migration in New Zealand and its Impact on the Labour Market
Industry % change 2001–2005
% change 2005–2009
% change 2009–2011
Total number
2011
Wholesale Trade 205 55 -16 29,800
Supermarket and Grocery Stores 408 107 -10 35,800
Other Retail Trade 281 54 -7 61,100
Accommodation 327 60 -4 51,600
Food and Beverage Services 235 110 -20 171,300
Professional, Scientific and Technical Services
182 54 -21 52,100
Employment Services 232 59 -1 54,500
Building Cleaning, Pest Control and Gardening Services
351 32 14 23,800
Packaging Services 432 456 2 23,300
Other Admin and Support Services
161 37 -11 15,600
Tertiary Education 215 5 1 20,400
Other Education and Training 131 14 -2 23,900
Residential Care Services 336 179 16 35,300
Other Health Care and Social Assistance
112 23 -11 38,200
Other Industries 239 73 -14 122,800
Total 222 78 -10 989,300
Note: All counts have been rounded using graduated random rounding to protect confidentiality.
Source: Figures have been extracted from the Integrated Data Infrastructure managed by Statistics New Zealand.
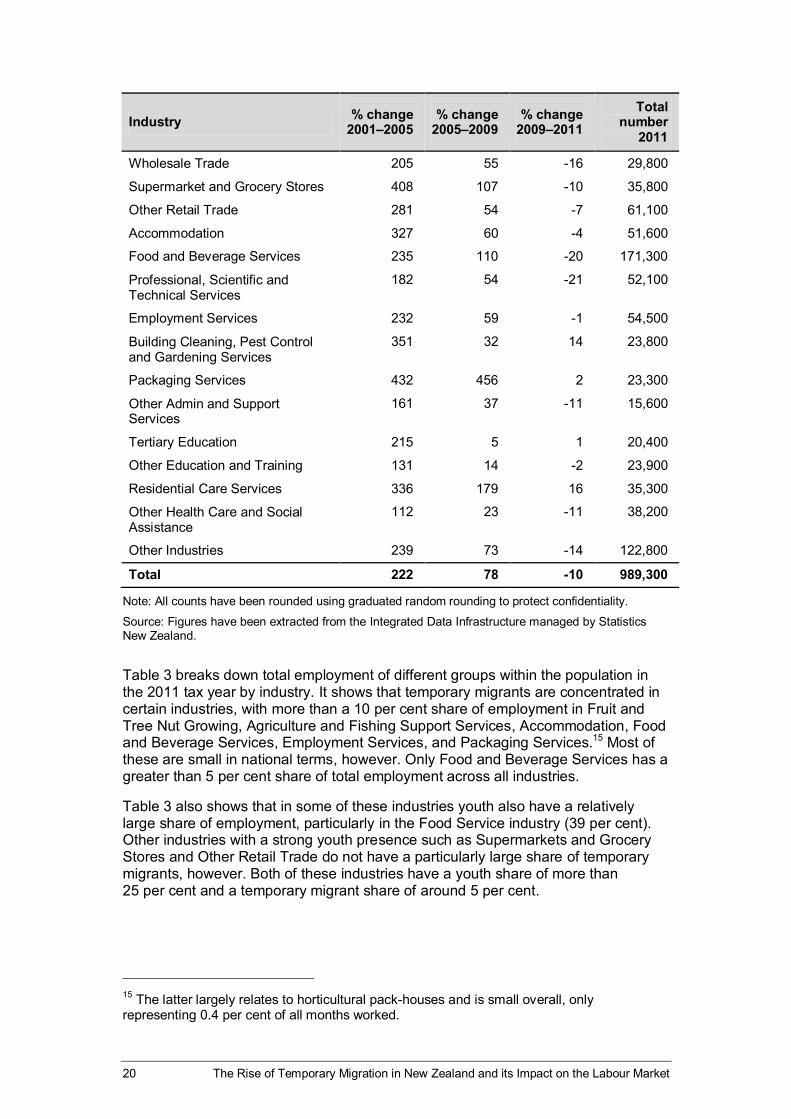
Table 3 breaks down total employment of different groups within the population in the 2011 tax year by industry. It shows that temporary migrants are concentrated in certain industries, with more than a 10 per cent share of employment in Fruit and Tree Nut Growing, Agriculture and Fishing Support Services, Accommodation, Food and Beverage Services, Employment Services, and Packaging Services.15 Most of these are small in national terms, however. Only Food and Beverage Services has a greater than 5 per cent share of total employment across all industries.
Table 3 also shows that in some of these industries youth also have a relatively large share of employment, particularly in the Food Service industry (39 per cent). Other industries with a strong youth presence such as Supermarkets and Grocery Stores and Other Retail Trade do not have a particularly large share of temporary migrants, however. Both of these industries have a youth share of more than 25 per cent and a temporary migrant share of around 5 per cent.
15 The latter largely relates to horticultural pack-houses and is small overall, only representing 0.4 per cent of all months worked.

The Rise of Temporary Migration in New Zealand and its Impact on the Labour Market 21
Table 3: Share of months worked in each industry by population group, 2011 tax year
Industry Youth
(aged 16–24) (%)
Other New Zealanders
(%)
Temporary migrants
(%)
% of total months worked
Fruit and Tree Nut Growing 17 65 18 1
Dairy Cattle Farming 27 64 9 1
Agriculture and Fishing Support Services
17 60 23 1
Other Agriculture, Forestry and Fishing
19 77 4 2
Manufacturing 12 86 3 11
Construction 17 81 2 6
Wholesale Trade 10 88 2 5
Supermarket and Grocery Stores 38 56 6 3
Other Retail Trade 27 70 4 7
Accommodation 19 66 14 2
Food and Beverage Services 39 46 14 5
Professional, Scientific and Technical Services
10 87 3 8
Employment Services 22 65 13 2
Building Cleaning, Pest Control and Gardening Services
12 79 9 1
Packaging Services 15 62 23 0
Other Admin and Support Services
14 81 5 1
Tertiary Education 11 86 3 2
Other Education and Training 6 92 1 7
Residential Care Services 8 86 6 2
Other Health Care and Social Assistance
5 93 2 7
Other Industries 12 86 2 24
Total 15 81 4 100
Note: All counts have been rounded using graduated random rounding to protect confidentiality.
Source: Figures have been extracted from the Integrated Data Infrastructure managed by Statistics New Zealand.

22 The Rise of Temporary Migration in New Zealand and its Impact on the Labour Market
Temporary migrant share of industry employment growth and decline
As noted earlier, employment grew considerably from the 2001 tax year to the 2011 tax year, and this can be broadly split into periods of growth from 2001 to 2009 and of decline from 2009 to 2011. Appendix B includes three tables that decompose employment change, calculated as the change in the number of months worked by industry, over the entire period and over the two sub-periods discussed above. The relative growth or decline is calculated, based on the net change and the number of months worked in the base period. Finally, the contribution towards the growth or decline that can be attributed to New Zealanders and temporary migrants is presented.
Table B1 shows that employment grew almost 3.5 million months (or 18 per cent) from 2001 to 2011. This can be decomposed as 4.1 percentage points due to increases in temporary migrant employment and 13.8 percentage points due to increases in New Zealander employment.
There were considerably different patterns by industry. In three industries (Accommodation; Other Agriculture, Forestry and Fishing; and Other Admin and Support Services) temporary migrant employment growth partially offset declines in New Zealander employment, while in one other industry (Fruit and Tree Nut Growing) it completely offset the decline in New Zealander employment. Changes are perhaps best analysed and understood over the respective sub-periods of growth and decline.
The period from 2001 to 2009 was a period of year-on-year employment growth, with employment growing 4.4 million months16 or 23 per cent (see Table B2). Overall, temporary migrant employment contributed 5 percentage points of this growth, with New Zealanders contributing the remaining 18 percentage points. Several industries saw growth of around 50 per cent or more over the period. These were a mix of industries essentially providing support to other industries, especially in the agriculture sector (e.g. Agriculture and Fishing Support Services, Employment Services, and Packaging Services with growth of 46 per cent, 64 per cent, and 83 per cent, respectively) and other industries (specifically Dairy Farming, Food and Beverage Services, and Construction with growth of 54 per cent, 57 per cent, and 57 per cent, respectively).
Temporary migrants had a large share of growth in most of these industries, representing around 40 percentage points of growth in Packaging Services (around half of the total growth) and 10–30 percentage points in Dairy Cattle Farming, Agriculture and Fishing Support Services, Food and Beverage Services, and Employment Services. Temporary migrant employment contributed only 4 percentage points growth to the construction industry out of the 57 per cent total. While employment growth was only 18 per cent in the Accommodation industry, most of this was due to temporary migrant employment growth in the industry.
16 In the 2001 tax year, 19.4 million months worked for wages and salaries in New Zealand. This figure had grown to 23.8 million months by the 2009 tax year.

The Rise of Temporary Migration in New Zealand and its Impact on the Labour Market 23
From 2009 to 2011, wage and salary employment contracted by almost a million months17 or 4 per cent (see Table B3). While both temporary migrant employment and New Zealander employment fell, temporary migrants contributed a 0.5 per cent decline compared with 3.6 per cent for New Zealanders. Over this period, Construction, Food and Beverage Services, and Other Admin and Support Services fell 11 per cent, 16 per cent and 12 per cent respectively with all other industries growing or shrinking by less than 10 per cent. In each of these industries, temporary migrant employment contributed only a small portion of the decline (1 percentage point, 3 percentage points and 0.5 percentage points respectively).
Differences in youth employment by age Although youth as a whole are often viewed as being at particular risk in the labour market, youth employment varies considerably by age. While many 16–17-year-olds are still at school and a large number of 18–19-year-olds are at university or in other tertiary study, many 20–24-year-olds will be well established in the labour market or entering into post-tertiary employment. Smith (2012) focused on the impact of low-skilled migration on the employment of 16–17-year-olds, identifying a negative impact that was around three times greater than that for adults (aged 22–64).
Table 4 shows the differences in the types of industries in which youth of different age are employed. Younger youth (aged 16–17) are most concentrated in Supermarkets and Grocery Stores, Food and Beverage Services, Dairy Cattle Farming, and Fruit and Tree Nut Growing. Although the spread is somewhat more even across all industries, these are also the industries in which 18–19-year-olds are commonly employed. The latter three are also key industries for temporary migrants, as illustrated in Table 3. The group aged 20–24 makes up the greatest share of the Food and Beverage Services and Other Retail Trade industries.
Differences in the earnings of youth by age over time are shown in Figure 8. Earnings of youth of all ages increased 20–30 per cent between 2001 and 2009, while earnings of younger youth declined more rapidly in the two years to 2011. Earnings of 18–19-year-olds declined more in both absolute terms ($207 per month) and relative terms (17 per cent) than those of either 16–17-year-olds ($85 per month and 15 per cent) or 20–24-year-olds ($169 per month and 8 per cent).
Youth aged 16–17 earn considerably less per month than older youth, which is in line with the increased likelihood of their being in low-paid, part-time work. Given this and the differences in industry of employment highlighted above, it might be reasonable to assume that youth of different ages might be affected in different ways by temporary migration.
17 In the 2011 tax year, 22.9 million months were worked.

24 The Rise of Temporary Migration in New Zealand and its Impact on the Labour Market
Table 4: Share of months worked in each industry for youth broken down by age, 2011 tax year
Industry Youth
(aged 16–17) (%)
Youth (aged 18–
19) (%)
Youth (aged 20–
24) (%)
% of total months
worked by youth
across all industries
Fruit and Tree Nut Growing 3 5 10 1
Dairy Cattle Farming 4 7 16 2
Agriculture and Fishing Support Services 2 4 11 1
Other Agriculture, Forestry and Fishing 2 5 12 3
Manufacturing 1 2 8 9
Construction 1 3 13 7
Wholesale Trade 1 2 7 4
Supermarket and Grocery Stores 8 14 16 7
Other Retail Trade 3 6 18 13
Accommodation 2 4 13 2
Food and Beverage Services 6 12 21 14
Professional, Scientific and Technical Services 0 1 8 5
Employment Services 1 5 17 3
Building Cleaning, Pest Control and Gardening Services 1 3 8 1
Packaging Services 2 4 9 0
Other Admin and Support Services 1 3 10 1
Tertiary Education 0 1 10 2
Other Education and Training 0 1 5 3
Residential Care Services 1 2 5 1
Other Health Care and Social Assistance 0 1 4 2
Other Industries 1 2 9 19
Total 1 3 10 100
Note: All counts have been rounded using graduated random rounding to protect confidentiality.
Source: Figures have been extracted from the Integrated Data Infrastructure managed by Statistics New Zealand.

The Rise of Temporary Migration in New Zealand and its Impact on the Labour Market 25
Figure 8: Earnings per month worked for wages and salaries by tax year for youth, broken down by age, 2001–2011
Note: All counts used to construct this graph have been rounded using graduated random rounding to protect confidentiality. Source: Figures have been extracted from the Integrated Data Infrastructure managed by Statistics New Zealand.

26 The Rise of Temporary Migration in New Zealand and its Impact on the Labour Market
Modelling the impact of temporary migration
The previous section presented a descriptive analysis of employment trends in both the New Zealand population and the temporary migrant population. These trends could be driven by a wide variety of external factors. Where the patterns observed are correlated (for example, the hiring of beneficiaries and hiring of temporary migrants in Figure 3), this could indicate a causal relationship in one direction or the other, or could simply be the result of both measures being influenced by the same drivers. It is necessary to control for the wide range of contextual factors and economic drivers affecting the employment of New Zealanders and temporary migrants, and to take into account the different and changing patterns of employment for these groups. In this section, we use regression modelling with econometric tools such as fixed effects and instrumental variables to try to make sense of these interrelated effects and produce interpretable results.
Analytical approach Similar to other approaches common in the literature, our approach relates a measure of migrant prevalence (in our case the total employment of temporary migrants calculated as the number of months worked) to labour market outcomes of natives. The methods usually include control variables for individual characteristics of natives and/or regional characteristics. Fixed effects for time and/or region are often included to control for unobservable characteristics that are constant across regions and/or over time. Instrumental variable estimation is usually adopted to account for the fact the migrant share cannot be assumed to be exogenous with respect to labour market outcomes in a region and/or at a point in time.
The IDI data allows us to identify people who are working according to certain personal characteristics (such as their income, location, gender and age) as well as characteristics of the employer they are working for (such as industry and number of employees). The data does not allow us to robustly identify those people who are not earning an income, so it is difficult to document employment outcomes or influences at the individual level. Therefore, as is common in the literature, we use outcomes data aggregated over geographic areas and time periods. However, we extend such approaches by aggregating at the industry level as well.
Model specification
Various specifications are outlined in Figure 9 and were estimated first through ordinary least squares regression, with and without fixed effects, and then through instrumental variable estimation. Specifications (1) and (2) are models aggregated by year and region and by year and industry, respectively. Specification (3) provides a more detailed year by industry by region (i.e. local industry) specification. Specification (4) includes not only direct within-industry effects of migration, but also indirect cross-industry effects. The motivation for this approach is discussed below. Workers with missing industry and region information are excluded from the modelling. However, as discussed earlier in the report, this is the case for fewer than 0.3 per cent of workers.

The Rise of Temporary Migration in New Zealand and its Impact on the Labour Market 27
Figure 9: Model specifications
Regional variation
( ) (1)
Industry variation
( ) (2)
Local industry variation
( ) (3)
Local industry variation with indirect effects
(
) ( ) ( ( )) (4)
Where:
= Employment outcomes of New Zealanders (i.e. “Beneficiaries”,
“Youth” or “Other New Zealanders”). For this study outcomes were defined as either total employment (i.e. equivalent to ), total number of hires, or earnings per month worked.
= Total employment of temporary migrants in months worked.
= Total employment in months worked.
= Unemployment in region r, year t.
= Fixed effects.
= Industry.
= Region.
= Year.
= Parameter estimate for the intercept.
= Parameter estimates for the direct and indirect effects of temporary migrant hires.
= Parameter estimates for the change in employment in a local industry and for other industries in that region.
= Parameter estimates for regional unemployment.
= Error term.
28 The Rise of Temporary Migration in New Zealand and its Impact on the Labour Market
As in the descriptive analysis above, we break our data into 12 regions. Our model tests the relationship between the number of months worked by temporary migrants in a particular year, industry and/or region, and the labour market outcomes for New Zealanders (split into youth aged 16–24 and other New Zealanders) in that year, industry and/or region. Since we are interested specifically in whether changes in temporary migration cause changes in outcomes, we need to control for unobserved characteristics and account for the potential endogeneity of temporary migrant hires.
Identification strategy
There are three key parts to our identification strategy. The first involves controlling for changes in regional and/or industry labour demand by including an aggregate employment change figure. We take the difference between the log of the months worked in an industry and/or region in the current year and the months worked in the previous year. In specifications (3) and (4), we also include regional unemployment derived from the Household Labour Force Survey to control for changes in local labour supply (especially of beneficiaries).
Secondly, we include a range of fixed effects to control for unobservables at the year, industry and/or region level. These help control for differences in turnover rates, growth rate trends etc. Specifications (3) and (4) include more detailed fixed effects by industry and year and by industry and region. Specification (4) includes not only a coefficient for local industry temporary migrant employment ( ), but also a coefficient for temporary migrant employment in other industries within a region ( ). We refer to these as the direct effect and indirect effect of temporary migration, respectively.
The only variation in the indirect migration effect within a region and year in specification (4) is due to the direct effect. Thus, the direct and indirect effects are jointly collinear with year-by-region fixed effects. These effects, therefore, are not included in the models, but regional unemployment is incorporated to control for changes in local labour market conditions.
Thirdly, we instrument for temporary migrant employment. This is potentially endogenous, given that migrants may be attracted to areas where overall employment is unexpectedly high (given the industry, region and time influences controlled for by our fixed effects and control variables). Bauer, Flake, and Sinning (2013, p. 9) note that an instrumental variable analysis will only:
deliver consistent estimates of the effect of immigration on labor market outcomes if (i) our instrument is correlated with the share of foreigners in the labor force and (ii) if the only channel through which the instrument affects recent labor market outcomes is its effect on the regional distribution of foreigners.
As noted by Poot and Cochrane (2004), one of the main challenges facing this type of analysis is finding appropriate instruments.
A common approach, which we adopt, is to use temporary migrant employment in the previous period to predict temporary migrant employment in the current period. While previous migration patterns are clearly highly correlated with current migration, if economic conditions are spatially persistent, there is a risk that the instrument will be highly correlated with current employment growth, and therefore not suitable. Although this cannot be easily tested, we tested the robustness of our analysis with a two-year lagged temporary migrant hire instrument. While on the one

The Rise of Temporary Migration in New Zealand and its Impact on the Labour Market 29
hand this instrument is more believably exogenous, on the other hand it is also weaker, because it is less correlated with current migration. Our results were not substantively different with a second lag, and we adopt the predictions based on the first lag in our analysis.
The instrument adopted is similar to one used by Smith (2012). It breaks down lagged temporary migrant employment figures in a region, industry or local industry by country of origin, adjusts these according to the national change in temporary migrant employment from each country, and then re-aggregates them to give a predicted measure of current migrant employment in that region, industry or local industry. The specification of our instrument is outlined in Figure 10. A simpler instrument that is also commonly used in the literature is the unadjusted lagged measure of migration. This proved to be a weaker instrument than the one we have adopted, but produced substantively similar results.
The inclusion of fixed effects alongside instrumental variables is essential to our identification strategy, because it is more reasonable to assume our instrument to be exogenous to current migration in the context of a model that incorporates fixed effects. Without fixed effects, the instrument based on predicted migration would be similar to a lag variable because we use the initial distribution of migrants to construct it. After including fixed effects, we assume that the remaining variation is exogenous.
Consistent with the derivation of the variable used to instrument for the direct local industry effect of temporary migrant employment, a second variable was calculated as to instrument for the indirect effect. Both instrumental variables were included in the models based on specification (4).
Figure 10: Specification of an instrument based on lagged country-share of temporary migration
∑ ( )
( )
( )
Where:
= Predicted migrant employment in region or industry at time t.
= Total employment of migrants from country of origin c in months worked.
= Region r, industry i or local industry ir, depending on the model being estimated.
We also tested instruments based on a lagged policy share instead of a country of origin share. This instrument was weaker than the country-share instrument, which is perhaps not surprising given the considerable changes in policies over the period of analysis. Instruments based on the change in country-share and policy-share at time t=0 (the 2001 tax year) were tested, but found to be extremely weak.
All models are weighted by total employment in the previous period. Dummy variables were constructed for any independent variables with zero aggregate employment. Logged values were then represented as zeros in the analysis.

30 The Rise of Temporary Migration in New Zealand and its Impact on the Labour Market
Results – Direct effects This section presents and discusses results from specifications (1), (2) and (3) based on 12 regions, 21 industries and 252 local industries respectively over 10 time periods (from the 200218 tax year to the 2011 tax year). Impacts are discussed for the three outcome measures of interest below. All models include controls for changes in total employment from t-1 to t and/or the log of regional unemployment, as specified in Figure 9. Full results (excluding coefficients from fixed effects) are presented in Appendix C, and only coefficients and standard errors for the temporary migration variables are included in the tables below. The results from models with fixed effects only and both fixed effects and instruments are similar, and only the latter are presented below.19 Appendix C also includes results of tests for weak instruments and under-identification. In most cases, there was sufficient evidence to reject the null hypotheses that the models were under-identified or the instruments were weak. Where this is not the case, it is clearly identified in the reporting of results.
Impact on total employment
As expected, the results in Table 5 from the ordinary least squares (OLS) model with no fixed effects show a strong positive association between temporary migrant employment and employment of New Zealanders (whether youth or older), regardless of whether the model is broken down by region, industry or local industry, even though control variables are included. We expect endogeneity to be a problem, given that temporary migrants are likely to be attracted to areas and industries that are doing particularly well, so it is not possible to conclude that this represents a causal relationship.
Table 5: Models of the impact of temporary migrant employment on total employment (months worked)
Models
Youth (aged 16–24) Other New Zealanders
(1) (2) (1) (2)
OLS FE & IV OLS FE & IV
Industry β 0.879*** 0.168*** 0.769*** 0.132***
se [0.056] [0.037] [0.067] [0.025]
Region β 0.636*** -0.026 0.658*** -0.032**
se [0.022] [0.017] [0.023] [0.011]
Local industry
β 0.712*** 0.206*** 0.685*** 0.173***
se [0.009] [0.012] [0.010] [0.008]
Note: OLS = ordinary least squares; FE = fixed effects included; IV = instrumental variable model.
* p<0.05, ** p<0.01, *** p<0.001
Source: Figures have been extracted from the Integrated Data Infrastructure managed by Statistics New Zealand.
18 Data for the 2001 tax year was not included in the modelling, because a lag year was required to construct our instrument. Construction of the instrument is discussed below. 19 Results of OLS models with fixed effect only are included in Appendix C.

The Rise of Temporary Migration in New Zealand and its Impact on the Labour Market 31
Once fixed effects are added to the model, as in specifications (1) to (3), and the model is instrumented using the instrumental variable defined in Figure 10, the strength of the relationship between temporary migrant employment and the employment of New Zealanders diminishes as expected. Interestingly, while the industry and local industry models still exhibit a positive significant relationship, the region models show a negative relationship, albeit smaller in magnitude and non-significant for youth. Possible reasons for this discrepancy and the way we adapt our model to address it are discussed below.
Impact on hires
Table 6 presents the same models as in Table 5, but with the number of hires of New Zealanders as the outcome of interest. The group of Other New Zealanders is also split according to whether they were in receipt of an income-tested benefit or not prior to being hired. This is indicative of the fact that prior to being hired they were not able to support themselves through fulltime employment, and did not have the support of a working partner. This is considered to be an indicator of a lack of attachment to the labour market, and of potentially greater risk of an adverse labour market impact.
As with total employment, the hiring model shows a strong positive association between temporary migrant employment and outcomes of New Zealanders in the OLS model, albeit slightly less strong. This could be put down to the fact that the outcome measure is in part capturing a different aspect of employment – labour market turnover – than the measure of total employment used for temporary migration. Once fixed effects and instruments are included, the relationship between temporary migration and New Zealand hiring shows very similar patterns to the total employment models presented above. The negative effects in the region models are slightly larger, and the beneficiary group shows a slightly stronger relationship with temporary migration than other New Zealanders or youth, regardless of whether the relationship is positive or negative.
Table 6: Models of the impact of temporary migrant employment on hires
Models
Youth (aged 16–24)
Other New Zealanders
Beneficiaries Non-beneficiaries
(1) (2) (1) (2) (1) (2)
OLS FE & IV OLS FE & IV OLS FE & IV
Industry β 0.761*** 0.103** 0.510*** 0.132*** 0.654*** 0.089*
se [0.052] [0.039] [0.059] [0.038] [0.056] [0.045]
Region β 0.596*** -0.109*** 0.451*** -0.174*** 0.611*** -0.088*
se [0.021] [0.021] [0.031] [0.033] [0.021] [0.043]
Local industry
β 0.680*** 0.208*** 0.537*** 0.240*** 0.644*** 0.201***
se [0.009] [0.015] [0.010] [0.018] [0.009] [0.018]
Note: OLS = ordinary least squares; FE = fixed effects included; IV = instrumental variable model.
* p<0.05, ** p<0.01, *** p<0.001
Source: Figures have been extracted from the Integrated Data Infrastructure managed by Statistics New Zealand.

32 The Rise of Temporary Migration in New Zealand and its Impact on the Labour Market
Impact on earnings
By adopting an outcome measure that is not directly related to total employment, we are able to test the impact of temporary migration on earnings not only of New Zealanders, but also of temporary migrants. The OLS models presented in Table 7 show a considerably weaker relationship between temporary migration and earnings of New Zealanders (especially other New Zealanders, aged 25 and over) than for other outcomes measures. The relationship is still positive and significant, however. Once we add fixed effects and instruments, the industry and local industry models largely become non-significant.20 Interestingly, the region model, which showed a negative significant relationship when looking at employment and hires, shows a significant positive relationship between temporary migration and earnings.
The relationship between temporary migration and temporary migrant earnings shows similar results to that for other New Zealanders in the industry and local industry models, but a negative significant relationship in the region model.
Table 7: Models of the impact of temporary migrant employment on earnings
Models
Youth (aged 16–24) Other New Zealanders Temporary Migrants
(1) (2) (1) (2) (1) (2)
OLS FE & IV OLS FE & IV OLS FE & IV
Industry β 0.142*** 0.016 0.106*** 0.088*** 0.086** 0.135***
se [0.026] [0.010] [0.024] [0.013] [0.031] [0.028]
Region β 0.110*** 0.045*** 0.043*** 0.108*** -0.001 -0.144***
se [0.008] [0.008] [0.007] [0.017] [0.012] [0.043]
Local industry
β 0.098*** 0.000 0.048*** -0.006 0.041*** 0.021
se [0.004] [0.004] [0.004] [0.007] [0.005] [0.018]
Note: OLS = ordinary least squares; FE = fixed effects included; IV = instrumental variable model.
* p<0.05, ** p<0.01, *** p<0.001
Source: Figures have been extracted from the Integrated Data Infrastructure managed by Statistics New Zealand.
Comparing industry, region and local industry estimates
The OLS estimates show a consistently positive relationship between the presence of temporary migrants and the employment, hiring and earnings of other workers. This is true for the presence of temporary migrants within an industry, within a region or within local industries. This positive relationship may reflect unobserved factors associated with better outcomes for both temporary migrants and other workers or may reflect that temporary migrants are drawn to industries, regions or local industries that are doing well. Once we control for these sources of potential bias, through the use of fixed effects and instrumental variables estimation, the estimated effect of temporary migrants differs at different levels of aggregation.
20 The exception being a residual positive relationship between temporary migration and the earnings of older New Zealanders in the industry model.

The Rise of Temporary Migration in New Zealand and its Impact on the Labour Market 33
The estimated impact of temporary migrants within an industry, or within local industries, remains positive and weaker than the OLS relationship. In contrast, the presence of temporary migrants within a region is negatively related to the employment and hiring of other workers and negatively related to the earnings of temporary migrants.
We believe that the negative relationships at the regional level are misleading, because of correlations between labour market outcomes in migrant-intensive industries and other industries within regions. Regional patterns reflect the relationship between changes in temporary migration that are often localised in just a few industries within each region and employment changes across all industries. The negative estimated impacts may arise if non-migrant industries happen to be performing poorly in the regions that temporary migrants enter. Similarly, industry-level estimates may be misleading in the presence of different regional trends within the industry for migrant and non-migrant regions. The spread of temporary migrant employment across regions is, however, far more even than it is across industries, as shown in the previous section.
Thus, the local industry model is our preferred model, as it allows for more refined controls for both industry and regional patterns. The local industry model has the attraction of presenting a more nuanced view of where migrants are being employed and the impacts they might be having. One limitation of the local industry model, as described in specification (3), is that it does not capture any impacts that temporary migration in a local industry might have on other industries in the region. The most obvious way this could happen is if there were different industries in which someone could be hired to do essentially the same job.
One possible example of where this could be occurring is in the horticulture and viticulture industry. While much of the employment in this industry is not surprisingly classified under the Fruit and Tree Nut Growing industry, two industries that support this industry are also important: Agriculture and Fishing Support Services and Packaging Services.21 These latter two industries were among the fastest growing industries for temporary migrants from 2001 to 2005, and were the only two industries with more than 200 per cent growth from 2005 to 2009 (see Table 2). As shown in Table 3, by 2011 these were the two industries in which temporary migrants had the highest share of total employment (15 per cent and 18 per cent, respectively). It is possible that changes in these industries have impacted on changes in Fruit and Tree Nut Growing and, possibly, on other agricultural industries.
Temporary migration may also have positive flow-on effects that affect industries within a region because of the increased consumption resulting from a larger local population. To allow for potential impacts across industries but within a region we adapt the model in specification (4) to allow for both direct (own-industry) and indirect (across local industries) effects.
21 And to a lesser degree Employment Services, although this industry is also likely to include employment in non-agricultural work.

34 The Rise of Temporary Migration in New Zealand and its Impact on the Labour Market
Results – Allowing for direct and indirect effects This section focuses on the analysis of local industries presented above, but extends the model to allow migrant employment in a particular local industry to affect outcomes in other industries within that region. As well as the direct within local industry effects from specification (3) as presented above, the results in this section provide estimates of indirect effects across local industries. In addition to presenting the individual effects in this section, we test the significance of the combined effect derived by summing the coefficients.22
To construct meaningful estimates, we need to drop the region-by-time fixed effects, as these are collinear with the two variables representing temporary migration within a local industry, and temporary migration across other local industries in a region. To still capture economic change at a region level, we include a time-varying regional variable – the log of estimated regional unemployment. All results presented below incorporate controls, fixed effects and instruments.
Impact on total employment
Table 8 presents the estimated direct and indirect impacts of temporary migration on total employment. The direct effects are very similar to those from the local industry models presented in Table 5. While indirect effects are estimated to be negative and significant, they do not completely cancel out the positive direct effects. The combined effect is positive and significant for employment of both youth and other New Zealanders.
Table 8: Models of the direct and indirect effects of temporary migrant employment on the employment of New Zealanders
Model Youth Other New Zealanders
Direct β1 0.187*** 0.158***
se [0.011] [0.008]
Indirect β2 -0.076*** -0.079***
se [0.012] [0.008]
Combined β1+β2 0.111*** 0.079***
p 0.00 0.00
* p<0.05, ** p<0.01, *** p<0.001
Source: Figures have been extracted from the Integrated Data Infrastructure managed by Statistics New Zealand.
Impact on hires
As above, incorporating the indirect effect into the model does little to change the direct effects estimated in Table 6. In the case of hires, however, the indirect negative impact of temporary migration cancels out the positive direct effect for beneficiaries, once they are separated from other New Zealanders (see Table 9), and the combined effect is non-significant.
22 Also presented are p values for the test of combined significance.
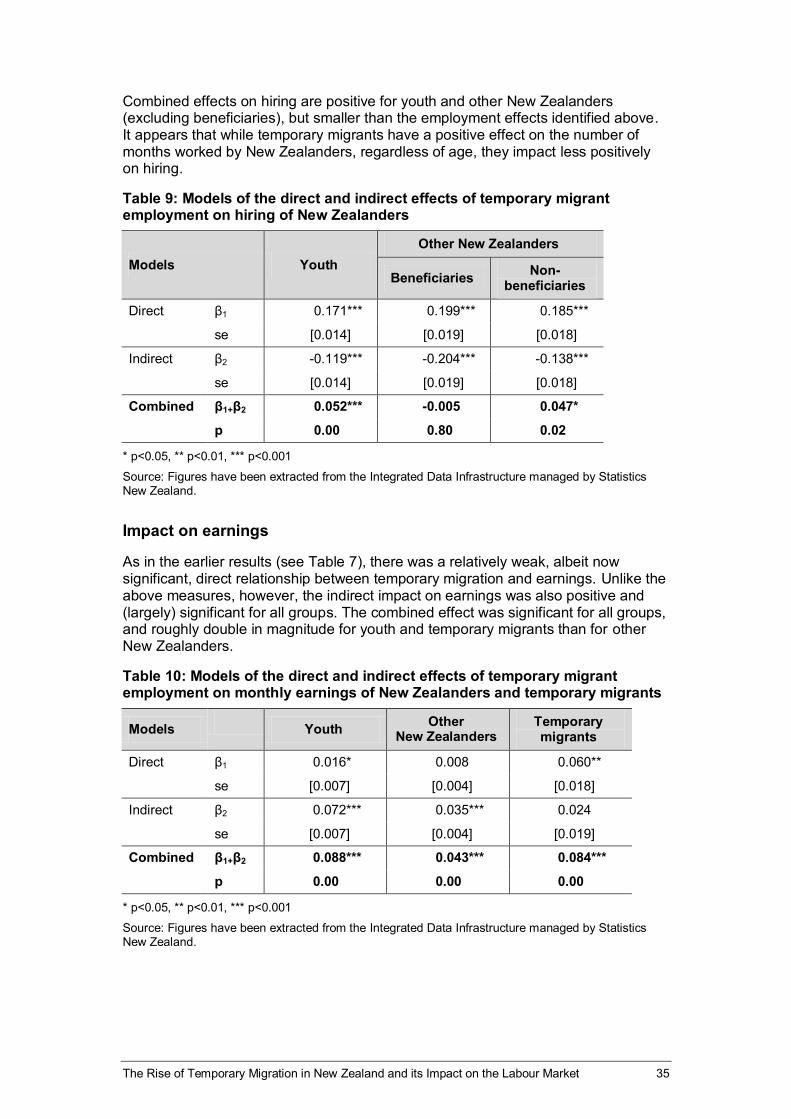
The Rise of Temporary Migration in New Zealand and its Impact on the Labour Market 35
Combined effects on hiring are positive for youth and other New Zealanders (excluding beneficiaries), but smaller than the employment effects identified above. It appears that while temporary migrants have a positive effect on the number of months worked by New Zealanders, regardless of age, they impact less positively on hiring.
Table 9: Models of the direct and indirect effects of temporary migrant employment on hiring of New Zealanders
Models Youth Other New Zealanders
Beneficiaries Non-beneficiaries
Direct β1 0.171*** 0.199*** 0.185***
se [0.014] [0.019] [0.018]
Indirect β2 -0.119*** -0.204*** -0.138***
se [0.014] [0.019] [0.018]
Combined β1+β2 0.052*** -0.005 0.047*
p 0.00 0.80 0.02
* p<0.05, ** p<0.01, *** p<0.001
Source: Figures have been extracted from the Integrated Data Infrastructure managed by Statistics New Zealand.
Impact on earnings
As in the earlier results (see Table 7), there was a relatively weak, albeit now significant, direct relationship between temporary migration and earnings. Unlike the above measures, however, the indirect impact on earnings was also positive and (largely) significant for all groups. The combined effect was significant for all groups, and roughly double in magnitude for youth and temporary migrants than for other New Zealanders.
Table 10: Models of the direct and indirect effects of temporary migrant employment on monthly earnings of New Zealanders and temporary migrants
Models Youth Other New Zealanders
Temporary migrants
Direct β1 0.016* 0.008 0.060**
se [0.007] [0.004] [0.018]
Indirect β2 0.072*** 0.035*** 0.024
se [0.007] [0.004] [0.019]
Combined β1+β2 0.088*** 0.043*** 0.084***
p 0.00 0.00 0.00
* p<0.05, ** p<0.01, *** p<0.001
Source: Figures have been extracted from the Integrated Data Infrastructure managed by Statistics New Zealand.

36 The Rise of Temporary Migration in New Zealand and its Impact on the Labour Market
Interpreting the results
The models in this section address most of our concerns about the region, industry and local industry models presented earlier, and for this reason the results from this section are preferred. We believe the combined effect represents our best overall estimate of the impact of temporary migration in New Zealand. Essentially, this leads us to conclude that temporary migrants and New Zealanders are complementary sources of labour overall. Increases in temporary migration seem to push up the total employment of New Zealanders and increase their earnings. Effects are larger for youth than for other New Zealanders, and earnings effects on temporary migrants are also positive.
Interpretation of the direct and indirect effects separately is complicated, however. There are several possible reasons for the overall positive direct effects, negative indirect employment effects, and positive indirect earnings effects identified above. However, we are able to only speculate about possible hypotheses for these effects and the extent to which each drives the overall result:
It could be that rising temporary migrant employment has been more heavily focused in intermediary industries that provide low-skilled labour to other industries. For example, rising temporary migration may have resulted in more fruit pickers and packers being employed by intermediaries in the Agriculture and Fishing Support Services and Packaging Services industries and fewer by the orchards (represented by the Fruit and Tree Nut Growing industry). This redistribution of employment could manifest as compensating positive direct effects and negative indirect effects. By taking relatively low-paid and low-skilled jobs out of the Fruit and Tree Nut Growing industry (for example) this could result in an apparent increase in earnings in that industry.
Increased consumption from a larger local population may have a direct effect on industries in which migrants are working or an indirect effect on employment in other industries. An increase in the hours worked by existing employees in these industries could result in a positive direct or indirect effect on monthly earnings.
Finally, it is possible that the reliable availability of temporary migrants in some industries in particular regions may have given those industries a competitive advantage over other industries in that region over time.23 This could have resulted in employers in other industries doing less well or changing their industry of business (for example, sheep farms converting to dairy). If the temporary migrant hiring industries have an increased demand for low-skilled labour (of both temporary migrants and New Zealanders), other industries may be more likely to shift towards a more skilled labour force, increasing monthly earnings overall.
The analysis below presents a more nuanced view of impacts for specific subgroups of the New Zealand and/or temporary migrant population, as well as for a more recent time period.
23 Although it could be argued that this advantage would be more likely to affect other employers in the same industry.

The Rise of Temporary Migration in New Zealand and its Impact on the Labour Market 37
Impact on youth of different ages As discussed earlier, given the differences in the employment of youth at different ages, we might expect them to be affected by temporary migration in different ways. This section runs models looking at outcomes for 16–17-year-olds, 18–19-year-olds and 20–24-year-olds separately.
Tables 11 and 12 show the results of models of total employment and monthly earnings split further by the age of youth. In terms of total employment, the overall effect of temporary migration is even more strongly positive for very young youth (aged 16–17). The direct effect is no more positive than for older youth, but the negative indirect effect disappears completely. Overall, the positive effect of temporary migrant employment is two-thirds greater for 16–17-year-olds than for 20–24-year-olds. The monthly earnings effect is also positively significant for all groups, with a larger estimated effect for 18–19-year-olds than other groups. However, differences may not be statistically significant. The results of the models for 20–24-year-olds are similar to those of youth overall, reflecting their dominance of the youth labour market.
Table 11: Models of the impact of temporary migrant employment on total employment of youth of different ages
Models Youth aged 16–17 Youth aged 18–19 Youth aged 20–24
Direct β1 0.148*** 0.148*** 0.190***
se [0.023] [0.017] [0.012]
Indirect β2 0.04 -0.009 -0.076***
se [0.024] [0.018] [0.012]
Combined β1+β2 0.188*** 0.139*** 0.114***
p 0.00 0.00 0.00
* p<0.05, ** p<0.01, *** p<0.001
Source: Figures have been extracted from the Integrated Data Infrastructure managed by Statistics New Zealand.
Table 12: Models of the impact of temporary migrant employment on monthly earnings of youth of different ages
Models Youth aged 16–17 Youth aged 18–19 Youth aged 20–2)
Direct β1 -0.008 0.026* 0.015*
se [0.023] [0.012] [0.006]
Indirect β2 0.098*** 0.107*** 0.068***
se [0.024] [0.013] [0.007]
Combined β1+β2 0.090*** 0.133*** 0.083***
p 0.00 0.00 0.00
* p<0.05, ** p<0.01, *** p<0.001 Source: Figures have been extracted from the Integrated Data Infrastructure managed by Statistics New Zealand.

38 The Rise of Temporary Migration in New Zealand and its Impact on the Labour Market
Impact of temporary migration after 2008 To get a sense of the impact economic change might have on temporary migration and, specifically, whether impacts might be more negative following the global financial crisis in a tighter labour market, we re-ran our model for the period from the 2009 tax year to the 2011 tax year.24 Results from our three outcomes of interest are presented in Tables 13 to 15. While there is no sign of significant negative impacts after 2008 in any of the models, this result should be treated with some caution. The Cragg-Donald test identifies that the instrument used in these models is weak (with a statistic roughly equal to the 10 per cent Stock-Yogo critical value in each case). This means the models may not be adequately addressing endogeneity concerns.
Table 13: Models of the impact of temporary migrant employment on total employment 2009 to 2011
Models Youth (aged 16–24) Other New Zealanders
Direct β1 0.387** 0.494***
se [0.118] [0.114]
Indirect β2 -0.098 -0.226**
se [0.073] [0.071]
Combined β1+β2 0.289*** 0.268***
p 0.00 0.00
* p<0.05, ** p<0.01, *** p<0.001
Source: Figures have been extracted from the Integrated Data Infrastructure managed by Statistics New Zealand.
Table 14: Models of the impact of temporary migrant employment on hiring 2009 to 2011
Models Youth
(aged 16–24) Other New Zealanders
Beneficiaries Non-beneficiaries
Direct β1 0.459 0.608** 0.742*
se [0.273] [0.194] [0.359]
Indirect β2 -0.297 -0.495*** -0.768***
se [0.169] [0.120] [0.223]
Combined β1+β2 0.162 0.113 -0.026
p 0.32 0.32 0.90
* p<0.05, ** p<0.01, *** p<0.001
Source: Figures have been extracted from the Integrated Data Infrastructure managed by Statistics New Zealand.
24 We also ran models that included interaction terms for the post-2008 period. However, results were not very different from those in this section, so are not presented in this report.

The Rise of Temporary Migration in New Zealand and its Impact on the Labour Market 39
Table 15: Models of the impact of temporary migrant employment on earnings 2009 to 2011
Models Youth (aged 161–24)
Other New Zealanders
Temporary migrants
Direct β1 -0.055 0.041 0.199
se [0.067] [0.037] [0.135]
Indirect β2 0.025 -0.012 -0.180*
se [0.041] [0.023] [0.083]
Combined β1+β2 -0.030 0.029 0.019
p 0.45 0.18 0.82
* p<0.05, ** p<0.01, *** p<0.001
Source: Figures have been extracted from the Integrated Data Infrastructure managed by Statistics New Zealand.
Impact of temporary migration by policy category Tables 16 to 18 show the results of models that break down temporary migrant employment by the main policy categories and assess the impact of each category on the employment of New Zealanders (and earnings for temporary migrants) separately. Because of the complexity of constructing a large number of instruments based on country of origin lags, the instrument used in this section is simply lagged temporary migration in each category and local industry by year cell. This was shown to produce substantively similar results to our preferred instrument in our overall analyses and, in most cases, passed weak instrument tests. Exceptions are noted below.
Impact on total employment
The impact of specific policy categories on youth are generally weakly positive at worst, the exception being the Recognised Seasonal Employer Scheme, which suffers from weak instruments, so is unreliable. Results for this scheme are disregarded in the discussion below for this reason. All other groups are associated with positive significant effects on the employment of other New Zealanders, apart from the Family category, which has a negative impact that is significant at the 5 per cent level.
Table 16: Models of the impact of temporary migrant employment by policy category on total employment by policy category
Models Inter-
national students
Essential Skills
Working Holiday
Schemes Family
Recognised Seasonal Employer†
Other categories
Youth (aged 16–24)
Direct β1 0.088*** 0.105*** 0.183*** 0.151*** 0.015 0.068***
se [0.011] [0.012] [0.022] [0.017] [0.033] [0.009]
Indirect β2 -0.057*** -0.076*** -0.047** -0.110*** -0.026 -0.022
se [0.009] [0.014] [0.014] [0.026] [0.017] [0.013]
Combined β1+β2 0.031*** 0.029** 0.136*** 0.041 -0.011 0.046***
p 0.00 0.01 0.00 0.09 0.55 0.00

40 The Rise of Temporary Migration in New Zealand and its Impact on the Labour Market
Other New Zealanders
Direct β1 0.067*** 0.097*** 0.118*** 0.098*** -0.018 0.067***
se [0.008] [0.008] [0.015] [0.011] [0.017] [0.006]
Indirect β2 -0.048*** -0.050*** -0.066*** -0.130*** 0.009 -0.015
se [0.006] [0.010] [0.010] [0.018] [0.009] [0.009]
Combined β1+β2 0.019*** 0.047*** 0.052*** -0.032* -0.009 0.052***
p 0.00 0.00 0.00 0.05 0.33 0.00
† The Recognised Seasonal Employer Scheme models have weak instruments, so are unreliable. The scheme was introduced in 2007 and the model only includes data from 2009 to 2011. * p<0.05, ** p<0.01, *** p<0.001 Source: Figures have been extracted from the Integrated Data Infrastructure managed by Statistics New Zealand.
Impact on hires
Family category migrant employment is associated with significant negative impacts on hiring of youth and beneficiaries, while the impact on non-beneficiary hiring is marginally non-significant (p-value of 0.06). Negative impacts on hiring of youth were not visible in the employment models above, and it is possible that competition for jobs from family category migrants could be resulting in youth staying in jobs for longer. Migrants in the Family category engage in a wider range of work than many other temporary migrants, and are not subject to a labour market test that restricts their employment to jobs for which New Zealanders are not available.
Table 17: Models of the impact of temporary migrant employment by policy category on hiring
Models Inter-
national students
Essential Skills
Working Holiday
Schemes Family
Recognised Seasonal Employer†
Other categories
Youth (aged 16–24)
Direct β1 0.087*** 0.083*** 0.214*** 0.148*** 0.036 0.066***
se [0.013] [0.014] [0.027] [0.020] [0.043] [0.011]
Indirect β2 -0.058*** -0.109*** -0.092*** -0.231*** 0.001 -0.063***
se [0.011] [0.017] [0.017] [0.031] [0.023] [0.016]
Combined β1+β2 0.029*** -0.026 0.122*** -0.083*** 0.037 0.003
p 0.00 0.06 0.00 0.00 0.13 0.87
Other New Zealanders – beneficiaries
Direct β1 0.086*** 0.086*** 0.173*** 0.172*** -0.011 0.117***
se [0.017] [0.019] [0.033] [0.025] [0.065] [0.014]
Indirect β2 -0.065*** -0.092*** -0.177*** -0.253*** 0.017 -0.140***
se [0.014] [0.022] [0.021] [0.040] [0.034] [0.021]
Combined β1+β2 0.021 -0.006 -0.004 -0.081* 0.006 -0.023
p 0.09 0.76 0.86 0.03 0.89 0.29

The Rise of Temporary Migration in New Zealand and its Impact on the Labour Market 41
Models Inter-
national students
Essential Skills
Working Holiday
Schemes Family
Recognised Seasonal Employer†
Other categories
Other New Zealanders – non-beneficiaries
Direct β1 0.079*** 0.098*** 0.173*** 0.141*** -0.206 0.088***
se [0.016] [0.018] [0.032] [0.024] [0.173] [0.013]
Indirect β2 -0.089*** -0.094*** -0.070*** -0.208*** 0.250** -0.022
se [0.014] [0.021] [0.021] [0.038] [0.092] [0.020]
Combined β1+β2 -0.010 0.004 0.103*** -0.067 0.044 0.066***
p 0.38 0.80 0.00 0.06 0.66 0.00
† The Recognised Seasonal Employer Scheme models have weak instruments, so are unreliable. The scheme was introduced in 2007 and the model only includes data from 2009 to 2011. * p<0.05, ** p<0.01, *** p<0.001 Source: Figures have been extracted from the Integrated Data Infrastructure managed by Statistics New Zealand.
Impact on earnings
There is little sign of a negative impact of temporary migration on the earnings of New Zealanders regardless of the category of migration. Estimated impacts are consistently positive and significant for youth (excluding Recognised Seasonal Employer Scheme models), and are positive and significant for other New Zealanders for all categories apart from International Students, for whom impacts are negligible.
Table 18: Models of the impact of temporary migrant employment by policy category on monthly earnings
Models Internati
onal students
Essential Skills
Working Holiday
Schemes Family
Recognised Seasonal Employer†
Other categories
Youth (aged 16–24)
Direct β -0.004 0.01 -0.008 0.011 0.036 0.005
se [0.006] [0.007] [0.011] [0.009] [0.024] [0.005]
Indirect β 0.017*** 0.041*** 0.072*** 0.100*** -0.015 0.047***
se [0.005] [0.008] [0.007] [0.015] [0.013] [0.008]
Combined β 0.013*** 0.051*** 0.064*** 0.111*** 0.021 0.052***
p 0.00 0.00 0.00 0.00 0.13 0.00
Other New Zealanders
Direct β 0.000 0.008* -0.003 -0.003 0.042 0
se [0.004] [0.004] [0.007] [0.005] [0.022] [0.003]
Indirect β 0.003 0.030*** 0.026*** 0.028*** -0.019 0.022***
se [0.003] [0.005] [0.004] [0.008] [0.012] [0.004]
Combined β 0.003 0.038*** 0.023*** 0.025*** 0.023 0.022***
p 0.24 0.00 0.00 0.00 0.06 0.00
† The Recognised Seasonal Employer Scheme models have weak instruments, so are unreliable. The scheme was introduced in 2007 and the model only includes data from 2009 to 2011. * p<0.05, ** p<0.01, *** p<0.001

42 The Rise of Temporary Migration in New Zealand and its Impact on the Labour Market
Source: Figures have been extracted from the Integrated Data Infrastructure managed by Statistics New Zealand.

The Rise of Temporary Migration in New Zealand and its Impact on the Labour Market 43
Conclusion
Temporary migrant employment grew considerably between 2001 and 2011. Over most of the period, the employment of other New Zealanders also grew across all industries and regions. In recent years, in line with changing economic conditions, employment growth of New Zealanders stalled while employment growth of migrants slowed, before falling a year or two later than for other groups. This study sought to identify whether temporary migration had a causal impact on the employment of New Zealanders either across the whole period or since the economic crisis in 2008.
As expected, migrants tend to go to areas and industries where employment is growing overall, resulting in a positive association between temporary migrant employment and employment of New Zealanders. Once we control for this endogeneity in our model, we still see an overall positive relationship between temporary migrant employment and the employment of New Zealanders within an industry and region. While region-based models show negative impacts, we have reason to distrust these results.
Subsequent analyses reveal a negative impact of temporary migration on employment in other industries within the region. These direct and indirect effects seem to largely cancel each other out, so that overall temporary migrant employment appears to have a small positive impact on the employment of New Zealanders, regardless of age. There were smaller, but for the most part still significant (apart from for former beneficiaries), positive effects on the hiring of New Zealanders, whether youth or other age groups.
Interpretation of the “indirect” effect of immigration across industries, as distinct from the “direct” effect within an industry, is difficult and largely speculative. Effects could be driven by temporary migration-related compositional changes in employment, could be because of chance correlation between growth in industries in which migrants tend to be employed and those in which they do not, or could result from certain industries gaining advantages over other industries due to their ability to use temporary migrants as a complement to the New Zealanders they employ.
The impact of temporary migrant employment on the earnings of both New Zealanders and temporary migrants was positive, significant and similar in magnitude to the impact on employment. Care should be taken with over-interpreting this finding, because compositional changes in local industry employment could result in positive effects that are spurious. It seems reasonable to conclude, however, that temporary migration is unlikely to have caused any significant negative impact on earnings of New Zealanders or temporary migrants.
We were unable to identify any significant negative impacts of temporary migration on the outcomes of New Zealanders over the 2001 to 2011 period at an aggregate level. Although our approach relies on important assumptions about the exogeneity of our instrument, the results were robust to the choice of instrument, albeit within a limited set of options. We were able to draw on robust integrated administrative data and applied a variety of econometric methods to rule out spurious associations. Therefore, we believe the probability of the existence of large negative impacts that we have failed to identify is small.

44 The Rise of Temporary Migration in New Zealand and its Impact on the Labour Market
We were similarly unable to identify negative impacts of temporary migration on a more limited time period during which labour market conditions deteriorated, from 2009 to 2011. Overall, we found large positive employment impacts with small and non-significant effects for hiring and earnings. These results are far from conclusive, however, as the instrument was insufficiently strong for us to be confident of its robustness. The question of the impact of temporary migration in New Zealand since the recession remains open.
It was not possible to robustly assess the impact of all major temporary migration categories. Strong instruments were not found for the relatively recently introduced Recognised Seasonal Employer Scheme, so no robust conclusions can be drawn for this scheme. The only temporary migration category that appeared to have significant negative impacts on the employment of New Zealanders was the Family category, but impacts were limited to the hiring of youth and beneficiaries and the number of months worked by New Zealanders aged over 25.
While we have not found evidence of negative effects in aggregate, temporary migration should not be viewed as a blanket or permanent solution to labour shortages and policy settings should not be immune to scrutiny or review. Policy and operational reviews are undertaken regularly, in consultation with external parties; our findings will help to inform this work.
Future research There are several areas where future research could shed new light on the impacts of temporary migration. Research could look at some of the broader non-employment-related risks and benefits of temporary migration, including the on-movement patterns and employment choices of New Zealanders.
It may be useful to investigate in more detail whether specific industries or temporary migration policies experience labour market impacts that are not seen in the aggregate analysis undertaken here.
It may also be useful to take a closer look at the impact on youth and their experiences post-study, particularly given the wealth of information in the Integrated Data Infrastructure about their study and post-study employment outcomes.
Finally, the analysis undertaken in this study will be updated once more data becomes available over the next two to three years.

The Rise of Temporary Migration in New Zealand and its Impact on the Labour Market 45
References
Altonji, J., and Card, D. (1991). The effects of immigration on the labor market outcomes of less-skilled natives. In J. M. Abowd and R. B. Freeman (Eds.), Immigration, trade and the labor market (pp. 201–234). University of Chicago Press.
Bauer, T., Flake, R., and Sinning, M. (2013). Labor market effects of immigration: Evidence from neighborhood data. Review of International Economics, 21, 370–385.
Borjas, G. (2003). The labor demand curve is downward sloping: Reexamining the impact of immigration on the labor market. Quarterly Journal of Economics, 118, 1,335–1,374.
Borjas, G. (2004). Increasing the Supply of Labor through Immigration: Measuring the impact on native-born workers (Backgrounder). Washington, DC: Center for Immigration Studies.
Borjas, G., Grogger, J., and Hanson, G. (2008). Imperfect substitution between migrants and natives: A reappraisal (Working Paper 13887). Cambridge, MA: National Bureau of Economic Research.
Borjas, G., and Katz, L. (2007). The evolution of the Mexican-born workforce in the United States. In G. Borjas (Ed.). Mexican immigration to the United States. University of Chicago Press.Card, D. (2001). Immigrant inflows, native outflows, and the local labor market impacts of higher immigration. Journal of Labor Economics, 19, 22–64.
Card, D., and Lemieux, T. (2001). Can falling supply explain the rising return to college for younger men? A cohort-based analysis. Quarterly Journal of Economics, 116, 705–746.
Cattaneo, C., Fiorio, C., and Peri, G. (2013). What happens to the careers of European workers when immigrants “take their jobs”? (Discussion Paper 7282). Bonn, Germany: Institute for the Study of Labor (IZA).
Clemens, M. (2013) The effect of foreign labor on native employment: A job-specific approach and application to North Carolina farms (Working Paper 326). Washington, DC: Center for Global Development.
Department of Labour. (2001). Review of immigration work policy. Wellington: Department of Labour.
Department of Labour. (2009). New faces, new futures: New Zealand: findings from the Longitudinal Immigration Survey: New Zealand (LisNZ) – wave one. Wellington: Department of Labour.
Department of Labour. (2010). International migration outlook: New Zealand 2009/10. Wellington: Department of Labour.
Department of Labour. (2011). Migration trends and outlook 2010/2011. Wellington: Department of Labour.

46 The Rise of Temporary Migration in New Zealand and its Impact on the Labour Market
Department of Labour. (n.d.). Youth labour market outcomes after the recession. Wellington: Department of Labour. Retrieved 10 June 2013 from www.dol.govt.nz/publications/lmr/hlfs-investigation-reports/youth-labour-market-outcomes/index.asp
Dustmann, C., Fabbri, F., and Preston, I. (2005). The impact of immigration on the UK labour market. Economic Journal, 115, F324–F341.
Gross, D., and Schmitt, N. (2012). Temporary foreign workers and regional labour market disparities in Canada. Canadian Public Policy, 38, 233–263.
Inland Revenue. (2010). Helping you get it right: Inland Revenue’s compliance focus 2010/11. Wellington: Inland Revenue.
Levine, L. (2010). Immigration: The effects on low-skilled and high-skilled native-born workers. Washington, DC: Congressional Research Service.
Longhi, S., Nijkamp, P., and Poot, J. (2004). A meta-analytic assessment of the impact of immigration on wages (Population Studies Centre Discussion Paper 47). Hamilton: University of Waikato.
Lucchino, P., Rosazza-Bondibene, C., and Portes, J. (2012). Examining the relationship between immigration and unemployment using National Insurance Number registration data (Discussion Paper 386). London: National Institute of Economic and Social Research.
Manacorda, M., Manning, A., and Wadsworth, J. (2012), The impact of immigration on the structure of male wages: Theory and evidence from Britain, Journal of the European Economic Association, 10, 120-151.
Maré, D., and Stillman, S. (2009). The impact of immigration on the labour market outcomes of New Zealanders. (Working Papers 09-11). Wellington: Motu Economic and Public Policy Research.
Merwood, P. (2006). Migration trends 2005/2006. Wellington: Department of Labour.
Merwood, P. (2013). Labour market outcomes of recent migrants to New Zealand. Wellington: Ministry of Business, Innovation and Employment.
Migration Advisory Committee. (2012). Analysis of the impacts of migration. London: Migration Advisory Committee.
Ministry of Education. (2008). Experiences of international students in New Zealand: Report on the results of the national survey 2007. Wellington: Ministry of Education.
Ottaviano, G., and Peri, G. (2012). Rethinking the effects of immigration on wages. Journal of the European Economic Association, 10, 152–197.
Poot, J., and Cochrane, B. (2004). Measuring the economic impact of immigration: A scoping paper. Wellington: Department of Labour.
Schneider, F., Buehn, A., and Montenegro, C. (2010). Shadow economies all over the world: New estimates for 162 countries from 1999 to 2007 (Policy Research Working Paper 5356). Washington, DC: World Bank.
Smith, C. (2012). The impact of low-skilled immigration on the youth labor market. Journal of Labor Economics, 30, 55–89.

The Rise of Temporary Migration in New Zealand and its Impact on the Labour Market 47
Somerville, W., and Sumption, M. (2009). Immigration and the labour market: Theory, evidence and policy. London: Equality and Human Rights Commission.
Statistics New Zealand. (2012). Integrated Data Infrastructure and prototype. Wellington: Statistics New Zealand.
Tse, M., and Maani, S. (2012, April). The impact of immigration on the New Zealand labour market. Paper presented at the Economic Impacts of Immigration and Population Diversity International Workshop, University of Waikato, Hamilton.
Wagner, M. (2009). Understanding the labor market impact of immigration (Job Market Paper). University of Chicago.
Zavodny, M. (2003). The H-1B program and its effects on information technology workers. Economic Review, Federal Reserve Bank of Atlanta, issue Q3, 33–43.

48 The Rise of Temporary Migration in New Zealand and its Impact on the Labour Market
Appendix A: Key classifications in the analysis Table A1: Industry groupings presented in the analysis
Industry Industry description Australian and New Zealand Standard Industrial Classification (ANZSIC) 2006 codes included
A013 Fruit and Tree Nut Growing Group A013
A016 Dairy Cattle Farming Group A016
A052 Agriculture and Fishing Support Services
Group A052
A999 Other Agriculture, Forestry and Fishing
Groups A011, A012, A014, A015, A017, A018, A019, A020, A030, A041, A042, A051
C999 Manufacturing Division C
E999 Construction Division E
F999 Wholesale Trade Division F
G411 Supermarkets and Grocery Stores Group G411
G999 Other Retail Trade Groups G391, G392, G400, G412, G421-G427, G431, G432
H440 Accommodation Subdivision H44
H450 Food and Beverage Services Subdivision H45
M999 Professional, Scientific and Technical Services
Division M
N721 Employment Services Group N721
N731 Building Cleaning, Pest Control and Gardening Services
Group N731
N732 Packaging Services Group N732
N999 Other Administrative and Support Services
Groups N722, N729
P810 Tertiary Education Subdivision P81
P999 Other Education and Training Subdivisions P80, P82
Q860 Residential Care Services Subdivision Q86
Q999 Other Health Care and Social Assistance
Subdivisions Q84, Q85, Q87
Z999 Other Industries Divisions B, D, I, J, K, L, O, R, S

The Rise of Temporary Migration in New Zealand and its Impact on the Labour Market 49
Table A2: Region groupings
Code Region grouping
1 Northland
2 Auckland
3 Waikato
4 Bay of Plenty
5 Gisborne/Hawkes Bay
6 Taranaki
7 Manawatu - Wanganui
8 Wellington
9 Tasman/Nelson/Marlborough/West Coast
10 Canterbury
11 Otago
12 Southland
Table A3: Temporary migrant categories
Category Main policies in category
International students Student
Essential Skills Essential Skills Essential Skills - Skill Level 1 General Work
Working Holiday Schemes
Agreements with Argentina, Belgium, Brazil, Canada, Chile, China, Czech Republic, Denmark, Estonia, Finland, France, Germany, Hong Kong, Ireland, Italy, Japan, Latvia, Malaysia, Malta, Mexico, Netherlands, Norway, Peru, Poland, Singapore, Slovenia, South Korea, Spain, Sweden, Taiwan, Thailand, United Kingdom, United States and Uruguay.
Family Family policy
Recognised Seasonal Employer Scheme
Recognised Seasonal Employer
Other categories Approved in Principal Graduate Job Search Graduate Work Experience Long Term Skill Shortage List Practical Experience Post Study Silver Fern Job Search Skilled Migrant Category Specific Purpose or Event Supplementary Seasonal Employment Talent (Accredited Employers) Talent (Arts, Culture, and Sports) Work to Residence

50 The Rise of Temporary Migration in New Zealand and its Impact on the Labour Market
Table A4: Country of origin groupings
Code Country grouping
1 Great Britain/Ireland
2 China
3 India
4 Fiji
5 Japan
6 South Africa
7 Germany
8 US
9 Malaysia
10 Philippines
11 Tonga/Western Samoa
12 Korea
13 Brazil/Argentina/Chile
14 Other nationalities
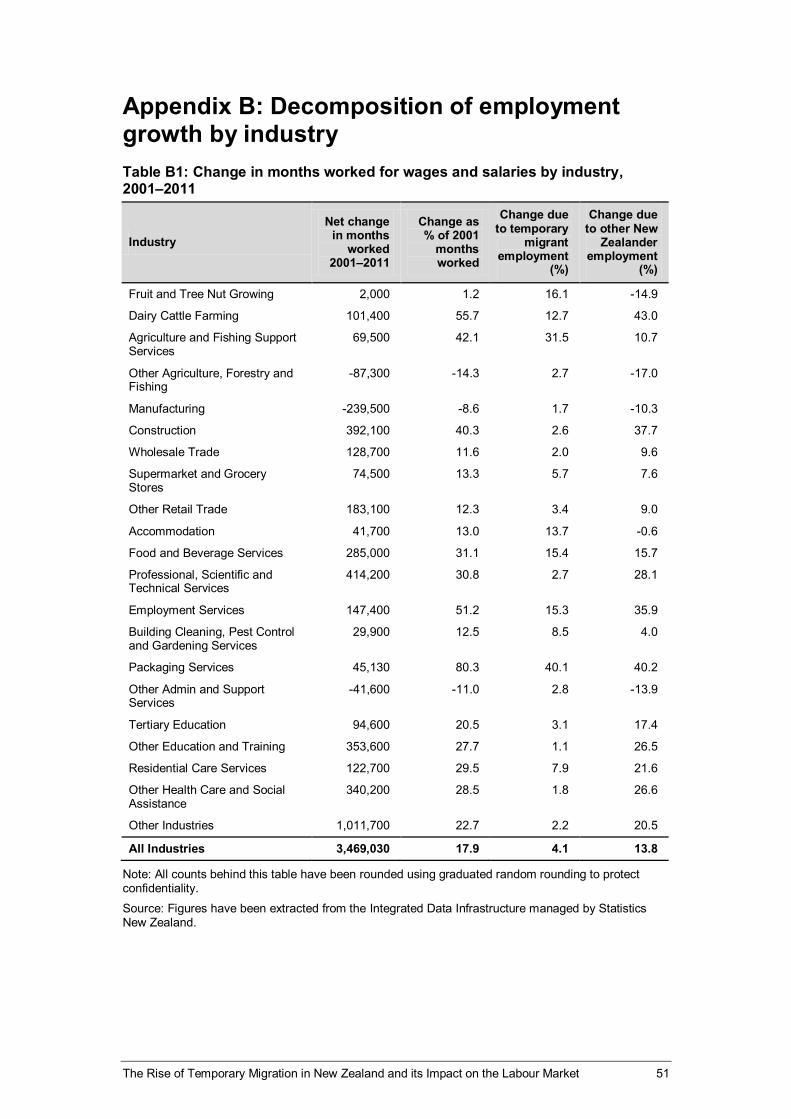
The Rise of Temporary Migration in New Zealand and its Impact on the Labour Market 51
Appendix B: Decomposition of employment growth by industry Table B1: Change in months worked for wages and salaries by industry, 2001–2011
Industry Net change
in months worked
2001–2011
Change as % of 2001
months worked
Change due to temporary
migrant employment
(%)
Change due to other New
Zealander employment
(%)
Fruit and Tree Nut Growing 2,000 1.2 16.1 -14.9
Dairy Cattle Farming 101,400 55.7 12.7 43.0
Agriculture and Fishing Support Services
69,500 42.1 31.5 10.7
Other Agriculture, Forestry and Fishing
-87,300 -14.3 2.7 -17.0
Manufacturing -239,500 -8.6 1.7 -10.3
Construction 392,100 40.3 2.6 37.7
Wholesale Trade 128,700 11.6 2.0 9.6
Supermarket and Grocery Stores
74,500 13.3 5.7 7.6
Other Retail Trade 183,100 12.3 3.4 9.0
Accommodation 41,700 13.0 13.7 -0.6
Food and Beverage Services 285,000 31.1 15.4 15.7
Professional, Scientific and Technical Services
414,200 30.8 2.7 28.1
Employment Services 147,400 51.2 15.3 35.9
Building Cleaning, Pest Control and Gardening Services
29,900 12.5 8.5 4.0
Packaging Services 45,130 80.3 40.1 40.2
Other Admin and Support Services
-41,600 -11.0 2.8 -13.9
Tertiary Education 94,600 20.5 3.1 17.4
Other Education and Training 353,600 27.7 1.1 26.5
Residential Care Services 122,700 29.5 7.9 21.6
Other Health Care and Social Assistance
340,200 28.5 1.8 26.6
Other Industries 1,011,700 22.7 2.2 20.5
All Industries 3,469,030 17.9 4.1 13.8
Note: All counts behind this table have been rounded using graduated random rounding to protect confidentiality. Source: Figures have been extracted from the Integrated Data Infrastructure managed by Statistics New Zealand.

52 The Rise of Temporary Migration in New Zealand and its Impact on the Labour Market
Table B2: Change in months worked for wages and salaries by industry, 2001–2009
Industry
Net change in months
worked 2001–2009
Change as % of 2001
months worked
Change due to temporary
migrant employment
(%)
Change due to other New
Zealanders employment
(%)
Fruit and Tree Nut Growing 13,300 7.8 14.6 -6.8
Dairy Cattle Farming 98,800 54.3 10.9 43.4
Agriculture and Fishing Support Services
76,600 46.5 26.1 20.4
Other Agriculture, Forestry and Fishing
-79,100 -12.9 2.5 -15.4
Manufacturing -400 0.0 2.5 -2.5
Construction 553,700 56.9 4.2 52.6
Wholesale Trade 180,500 16.3 2.5 13.8
Supermarket and Grocery Stores 95,800 17.1 6.4 10.6
Other Retail Trade 269,900 18.2 3.7 14.5
Accommodation 57,300 17.9 14.3 3.6
Food and Beverage Services 522,300 56.9 19.9 37.0
Professional, Scientific and Technical Services
463,500 34.5 3.8 30.7
Employment Services 183,700 63.8 15.5 48.3
Building Cleaning, Pest Control and Gardening Services
36,800 15.4 7.2 8.2
Packaging Services 46,730 83.2 39.2 44.0
Other Admin and Support Services
4,400 1.2 3.3 -2.2
Tertiary Education 82,100 17.8 3.0 14.8
Other Education and Training 290,700 22.8 1.2 21.6
Residential Care Services 95,900 23.0 6.7 16.3
Other Health Care and Social Assistance
287,000 24.0 2.2 21.8
Other Industries 1,154,900 25.9 2.7 23.3
All Industries 4,434,430 22.9 4.7 18.2
Note: All counts behind this table have been rounded using graduated random rounding to protect confidentiality. Source: Figures have been extracted from the Integrated Data Infrastructure managed by Statistics New Zealand.

The Rise of Temporary Migration in New Zealand and its Impact on the Labour Market 53
Table B3: Change in months worked for wages and salaries by industry, 2009–2011
Industry Net change
in months worked
2001–2009
Change as % of 2009
months worked
Change due to temporary
migrant employment
(%)
Change due to other New
Zealander employment
(%)
Fruit and Tree Nut Growing -11,300 -6.2 1.4 -7.5
Dairy Cattle Farming 2,600 0.9 1.1 -0.2
Agriculture and Fishing Support Services
-7,100 -2.9 3.7 -6.6
Other Agriculture, Forestry and Fishing
-8,200 -1.5 0.2 -1.8
Manufacturing -239,100 -8.6 -0.8 -7.8
Construction -161,600 -10.6 -1.0 -9.5
Wholesale Trade -51,800 -4.0 -0.5 -3.6
Supermarket and Grocery Stores -21,300 -3.2 -0.6 -2.6
Other Retail Trade -86,800 -4.9 -0.3 -4.7
Accommodation -15,600 -4.1 -0.6 -3.6
Food and Beverage Services -237,300 -16.5 -2.9 -13.6
Professional, Scientific and Technical Services
-49,300 -2.7 -0.8 -1.9
Employment Services -36,300 -7.7 -0.1 -7.6
Building Cleaning, Pest Control and Gardening Services
-6,900 -2.5 1.1 -3.6
Packaging Services -1,600 -1.6 0.5 -2.0
Other Admin and Support Services
-46,000 -12.1 -0.5 -11.6
Tertiary Education 12,500 2.3 0.1 2.2
Other Education and Training 62,900 4.0 0.0 4.0
Residential Care Services 26,800 5.2 1.0 4.3
Other Health Care and Social Assistance
53,200 3.6 -0.3 3.9
Other Industries -143,200 -2.6 -0.4 -2.2
All Industries -965,400 -4.1 -0.5 -3.6
Note: All counts behind this table have been rounded using graduated random rounding to protect confidentiality. Source: Figures have been extracted from the Integrated Data Infrastructure managed by Statistics New Zealand.
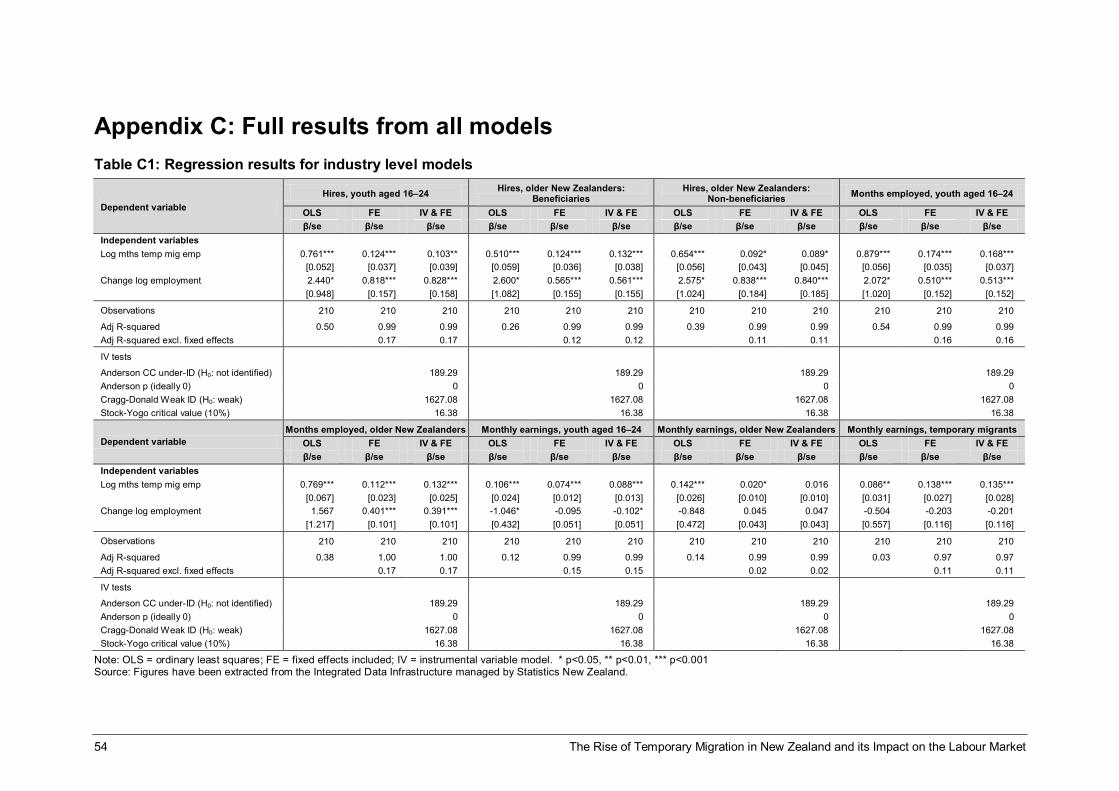
54 The Rise of Temporary Migration in New Zealand and its Impact on the Labour Market
Appendix C: Full results from all models Table C1: Regression results for industry level models
Dependent variable Hires, youth aged 16–24 Hires, older New Zealanders:
Beneficiaries Hires, older New Zealanders:
Non-beneficiaries Months employed, youth aged 16–24
OLS FE IV & FE OLS FE IV & FE OLS FE IV & FE OLS FE IV & FE β/se β/se β/se β/se β/se β/se β/se β/se β/se β/se β/se β/se
Independent variables
Log mths temp mig emp 0.761*** 0.124*** 0.103** 0.510*** 0.124*** 0.132*** 0.654*** 0.092* 0.089* 0.879*** 0.174*** 0.168*** [0.052] [0.037] [0.039] [0.059] [0.036] [0.038] [0.056] [0.043] [0.045] [0.056] [0.035] [0.037] Change log employment 2.440* 0.818*** 0.828*** 2.600* 0.565*** 0.561*** 2.575* 0.838*** 0.840*** 2.072* 0.510*** 0.513*** [0.948] [0.157] [0.158] [1.082] [0.155] [0.155] [1.024] [0.184] [0.185] [1.020] [0.152] [0.152]
Observations 210 210 210 210 210 210 210 210 210 210 210 210
Adj R-squared 0.50 0.99 0.99 0.26 0.99 0.99 0.39 0.99 0.99 0.54 0.99 0.99 Adj R-squared excl. fixed effects
0.17 0.17
0.12 0.12
0.11 0.11
0.16 0.16
IV tests
Anderson CC under-ID (H0: not identified)
189.29
189.29
189.29
189.29 Anderson p (ideally 0)
0
0
0
0
Cragg-Donald Weak ID (H0: weak)
1627.08
1627.08
1627.08
1627.08 Stock-Yogo critical value (10%) 16.38 16.38 16.38 16.38
Dependent variable Months employed, older New Zealanders Monthly earnings, youth aged 16–24 Monthly earnings, older New Zealanders Monthly earnings, temporary migrants
OLS FE IV & FE OLS FE IV & FE OLS FE IV & FE OLS FE IV & FE β/se β/se β/se β/se β/se β/se β/se β/se β/se β/se β/se β/se
Independent variables
Log mths temp mig emp 0.769*** 0.112*** 0.132*** 0.106*** 0.074*** 0.088*** 0.142*** 0.020* 0.016 0.086** 0.138*** 0.135*** [0.067] [0.023] [0.025] [0.024] [0.012] [0.013] [0.026] [0.010] [0.010] [0.031] [0.027] [0.028] Change log employment 1.567 0.401*** 0.391*** -1.046* -0.095 -0.102* -0.848 0.045 0.047 -0.504 -0.203 -0.201 [1.217] [0.101] [0.101] [0.432] [0.051] [0.051] [0.472] [0.043] [0.043] [0.557] [0.116] [0.116]
Observations 210 210 210 210 210 210 210 210 210 210 210 210
Adj R-squared 0.38 1.00 1.00 0.12 0.99 0.99 0.14 0.99 0.99 0.03 0.97 0.97 Adj R-squared excl. fixed effects
0.17 0.17
0.15 0.15
0.02 0.02
0.11 0.11
IV tests
Anderson CC under-ID (H0: not identified)
189.29
189.29
189.29
189.29 Anderson p (ideally 0)
0
0
0
0
Cragg-Donald Weak ID (H0: weak)
1627.08
1627.08
1627.08
1627.08 Stock-Yogo critical value (10%) 16.38 16.38 16.38 16.38
Note: OLS = ordinary least squares; FE = fixed effects included; IV = instrumental variable model. * p<0.05, ** p<0.01, *** p<0.001 Source: Figures have been extracted from the Integrated Data Infrastructure managed by Statistics New Zealand.

The Rise of Temporary Migration in New Zealand and its Impact on the Labour Market 55
Table C2: Regression results for region level models
Dependent variable Hires, youth aged 16–24 Hires, older New Zealanders:
Beneficiaries Hires, older New Zealanders:
Non-beneficiaries Months employed, youth aged 16–24
OLS FE IV & FE OLS FE IV & FE OLS FE IV & FE OLS FE IV & FE β/se β/se β/se β/se β/se β/se β/se β/se β/se β/se β/se β/se
Independent variables
Log mths temp mig emp 0.596*** -0.079*** -0.109*** 0.451*** -0.152*** -0.174*** 0.611*** -0.101* -0.088* 0.636*** -0.015 -0.026
[0.021] [0.019] [0.021] [0.031] [0.030] [0.033] [0.021] [0.039] [0.043] [0.022] [0.016] [0.017]
Change log employment 7.233*** 1.513*** 1.533*** 7.073*** 0.943*** 0.958*** 5.955*** 2.124*** 2.116*** 6.121*** 0.751*** 0.758*** [0.997] [0.160] [0.162] [1.449] [0.258] [0.258] [0.983] [0.337] [0.337] [1.045] [0.135] [0.135]
Observations 120 120 120 120 120 120 120 120 120 120 120 120 Adj R-squared 0.86 1 1 0.64 1 1 0.87 1 1 0.87 1 1 Adj R-squared excl. fixed effects
0.45 0.44
0.22 0.22
0.26 0.26
0.2 0.2
IV tests
Anderson CC under-ID (H0: not identified)
101.68
101.68
101.68
101.68
Anderson p (ideally 0)
0
0
0
0 Cragg-Donald Weak ID (H0: weak)
538.39
538.39
538.39
538.39
Stock-Yogo critical value (10%) 16.38 16.38 16.38 16.38
Dependent variable Months employed, older New Zealanders Monthly earnings, youth aged 16–24 Monthly earnings, older New Zealanders Monthly earnings, temporary migrants
OLS FE IV & FE OLS FE IV & FE OLS FE IV & FE OLS FE IV & FE β/se β/se β/se β/se β/se β/se β/se β/se β/se β/se β/se β/se
Independent variables
Log mths temp mig emp 0.658*** -0.031** -0.032** 0.043*** 0.086*** 0.108*** 0.110*** 0.034*** 0.045*** -0.001 -0.169*** -0.144*** [0.023] [0.010] [0.011] [0.007] [0.016] [0.017] [0.008] [0.008] [0.008] [0.012] [0.040] [0.043] Change log employment 4.513*** 0.343*** 0.344*** -2.318*** -0.117 -0.131 -2.271*** -0.046 -0.053 -2.113*** -0.19 -0.207 [1.063] [0.083] [0.083] [0.309] [0.136] [0.137] [0.362] [0.065] [0.066] [0.578] [0.340] [0.341]
Observations 120 120 120 120 120 120 120 120 120 120 120 120 Adj R-squared 0.87 1 1 0.49 0.97 0.97 0.7 1 1 0.09 0.9 0.9 Adj R-squared excl. fixed effects
0.16 0.16
0.19 0.18
0.14 0.12
0.13 0.12
IV tests
Anderson CC under-ID (H0: not identified)
101.68
101.68
101.68
101.68
Anderson p (ideally 0)
0
0
0
0 Cragg-Donald Weak ID (H0: weak)
538.39
538.39
538.39
538.39
Stock-Yogo critical value (10%) 16.38 16.38 16.38 16.38
Note: OLS = ordinary least squares; FE = fixed effects included; IV = instrumental variable model. * p<0.05, ** p<0.01, *** p<0.001 Source: Figures have been extracted from the Integrated Data Infrastructure managed by Statistics New Zealand.

56 The Rise of Temporary Migration in New Zealand and its Impact on the Labour Market
Table C3: Regression results for local industry level models
Dependent variable Hires, youth aged 16–24 Hires, older New Zealanders: Beneficiaries Hires, older New Zealanders:
Non-beneficiaries Months employed, youth aged 16–24
OLS FE IV & FE OLS FE IV & FE OLS FE IV & FE OLS FE IV & FE β/se β/se β/se β/se β/se β/se β/se β/se β/se β/se β/se β/se
Independent variables
Log mths temp mig emp 0.680*** 0.150*** 0.208*** 0.537*** 0.154*** 0.240*** 0.644*** 0.114*** 0.201*** 0.712*** 0.148*** 0.206*** [0.009] [0.010] [0.015] [0.010] [0.013] [0.018] [0.009] [0.012] [0.018] [0.009] [0.008] [0.012] Change log employment 1.271*** 0.538*** 0.507*** 1.542*** 0.574*** 0.529*** 1.539*** 0.610*** 0.564*** 0.942*** 0.416*** 0.386*** [0.211] [0.030] [0.031] [0.235] [0.038] [0.039] [0.218] [0.037] [0.038] [0.226] [0.025] [0.025] Observations 2504 2504 2504 2502 2502 2502 2503 2503 2503 2504 2504 2504 Adj R-squared 0.71 1 1 0.55 0.99 0.99 0.67 0.99 0.99 0.7 1 1 Adj R-squared excl. fixed effects
0.21 0.19
0.15 0.14
0.15 0.13
0.23 0.21
IV tests
Anderson CC under-ID (H0: not identified)
1203.21
1202.27
1202.75
1203.21
Anderson p (ideally 0)
0
0
0
0 Cragg-Donald Weak ID (H0: weak)
1813.91
1813.03
1813.03
1813.91
Stock-Yogo critical value (10%) 16.38 16.38 16.38 16.38
Dependent variable Months employed, older New Zealanders Monthly earnings, youth aged 16–24 Monthly earnings, older New Zealanders Monthly earnings, Temporary migrants
OLS FE IV & FE OLS FE IV & FE OLS FE IV & FE OLS FE IV & FE β/se β/se β/se β/se β/se β/se β/se β/se β/se β/se β/se β/se
Independent variables
Log mths temp mig emp 0.685*** 0.110*** 0.173*** 0.048*** -0.002 -0.006 0.098*** -0.002 0 0.041*** -0.005 0.021 [0.010] [0.006] [0.008] [0.004] [0.005] [0.007] [0.004] [0.003] [0.004] [0.005] [0.013] [0.018] Change log employment 0.827*** 0.361*** 0.328*** -0.492*** 0.008 0.01 -0.438*** 0.007 0.006 -0.309* 0.027 0.014 [0.250] [0.017] [0.017] [0.090] [0.015] [0.015] [0.095] [0.009] [0.009] [0.125] [0.038] [0.038] Observations 2504 2504 2504 2504 2504 2504 2504 2504 2504 2494 2494 2494 Adj R-squared 0.64 1 1 0.07 0.99 0.99 0.21 1 1 0.03 0.95 0.95 Adj R-squared excl. fixed effects
0.3 0.26
0 0
0 0
0 0
IV tests
Anderson CC under-ID (H0: not identified)
1203.21
1203.21
1203.21
1197.77
Anderson p (ideally 0)
0
0
0
0 Cragg-Donald Weak ID (H0: weak)
1813.91
1813.91
1813.91
1804.64
Stock-Yogo critical value (10%) 16.38 16.38 16.38 16.38
Note: OLS = ordinary least squares; FE = fixed effects included; IV = instrumental variable model. * p<0.05, ** p<0.01, *** p<0.001 Source: Figures have been extracted from the Integrated Data Infrastructure managed by Statistics New Zealand.
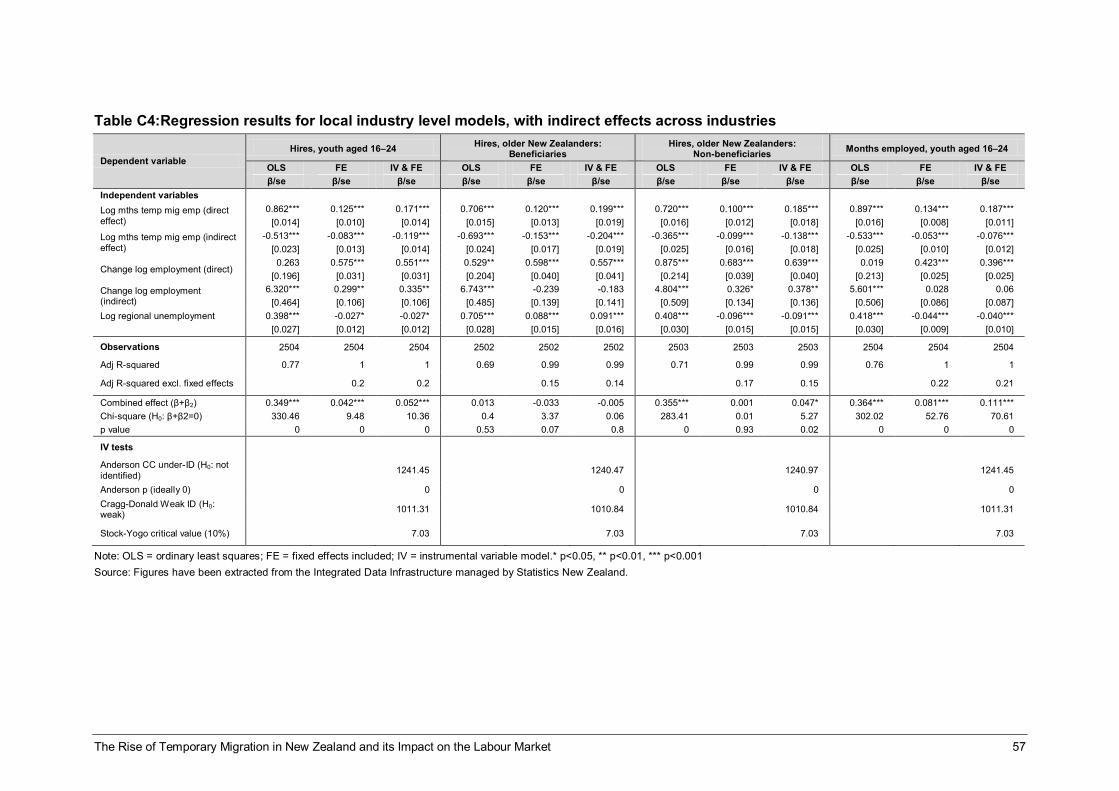
The Rise of Temporary Migration in New Zealand and its Impact on the Labour Market 57
Table C4:Regression results for local industry level models, with indirect effects across industries
Dependent variable Hires, youth aged 16–24 Hires, older New Zealanders:
Beneficiaries Hires, older New Zealanders:
Non-beneficiaries Months employed, youth aged 16–24
OLS FE IV & FE OLS FE IV & FE OLS FE IV & FE OLS FE IV & FE β/se β/se β/se β/se β/se β/se β/se β/se β/se β/se β/se β/se
Independent variables Log mths temp mig emp (direct effect)
0.862*** 0.125*** 0.171*** 0.706*** 0.120*** 0.199*** 0.720*** 0.100*** 0.185*** 0.897*** 0.134*** 0.187*** [0.014] [0.010] [0.014] [0.015] [0.013] [0.019] [0.016] [0.012] [0.018] [0.016] [0.008] [0.011]
Log mths temp mig emp (indirect effect)
-0.513*** -0.083*** -0.119*** -0.693*** -0.153*** -0.204*** -0.365*** -0.099*** -0.138*** -0.533*** -0.053*** -0.076*** [0.023] [0.013] [0.014] [0.024] [0.017] [0.019] [0.025] [0.016] [0.018] [0.025] [0.010] [0.012]
Change log employment (direct) 0.263 0.575*** 0.551*** 0.529** 0.598*** 0.557*** 0.875*** 0.683*** 0.639*** 0.019 0.423*** 0.396***
[0.196] [0.031] [0.031] [0.204] [0.040] [0.041] [0.214] [0.039] [0.040] [0.213] [0.025] [0.025] Change log employment (indirect)
6.320*** 0.299** 0.335** 6.743*** -0.239 -0.183 4.804*** 0.326* 0.378** 5.601*** 0.028 0.06 [0.464] [0.106] [0.106] [0.485] [0.139] [0.141] [0.509] [0.134] [0.136] [0.506] [0.086] [0.087]
Log regional unemployment 0.398*** -0.027* -0.027* 0.705*** 0.088*** 0.091*** 0.408*** -0.096*** -0.091*** 0.418*** -0.044*** -0.040***
[0.027] [0.012] [0.012] [0.028] [0.015] [0.016] [0.030] [0.015] [0.015] [0.030] [0.009] [0.010]
Observations 2504 2504 2504 2502 2502 2502 2503 2503 2503 2504 2504 2504
Adj R-squared 0.77 1 1 0.69 0.99 0.99 0.71 0.99 0.99 0.76 1 1
Adj R-squared excl. fixed effects 0.2 0.2 0.15 0.14 0.17 0.15 0.22 0.21
Combined effect (β+β2) 0.349*** 0.042*** 0.052*** 0.013 -0.033 -0.005 0.355*** 0.001 0.047* 0.364*** 0.081*** 0.111*** Chi-square (H0: β+β2=0) 330.46 9.48 10.36 0.4 3.37 0.06 283.41 0.01 5.27 302.02 52.76 70.61 p value 0 0 0 0.53 0.07 0.8 0 0.93 0.02 0 0 0
IV tests
Anderson CC under-ID (H0: not identified)
1241.45
1240.47
1240.97
1241.45
Anderson p (ideally 0)
0
0
0
0 Cragg-Donald Weak ID (H0: weak)
1011.31
1010.84
1010.84
1011.31
Stock-Yogo critical value (10%) 7.03 7.03 7.03 7.03
Note: OLS = ordinary least squares; FE = fixed effects included; IV = instrumental variable model.* p<0.05, ** p<0.01, *** p<0.001 Source: Figures have been extracted from the Integrated Data Infrastructure managed by Statistics New Zealand.
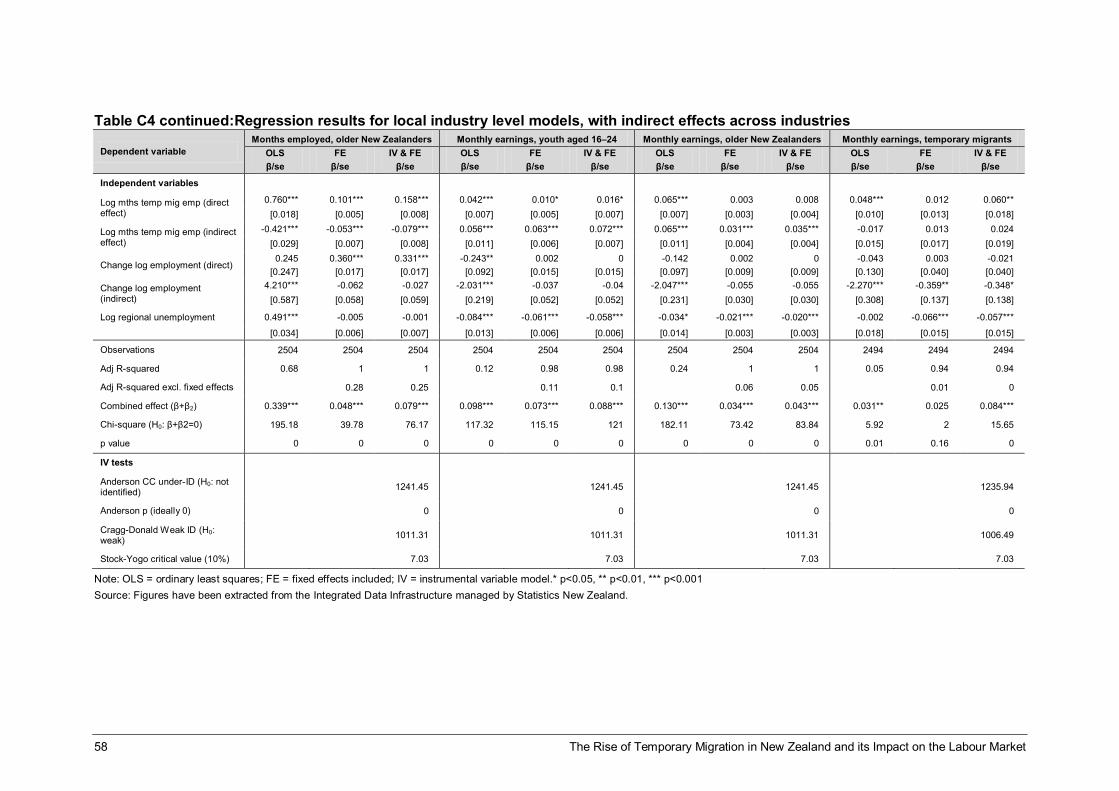
58 The Rise of Temporary Migration in New Zealand and its Impact on the Labour Market
Table C4 continued:Regression results for local industry level models, with indirect effects across industries
Dependent variable Months employed, older New Zealanders Monthly earnings, youth aged 16–24 Monthly earnings, older New Zealanders Monthly earnings, temporary migrants
OLS FE IV & FE OLS FE IV & FE OLS FE IV & FE OLS FE IV & FE β/se β/se β/se β/se β/se β/se β/se β/se β/se β/se β/se β/se
Independent variables
Log mths temp mig emp (direct effect)
0.760*** 0.101*** 0.158*** 0.042*** 0.010* 0.016* 0.065*** 0.003 0.008 0.048*** 0.012 0.060** [0.018] [0.005] [0.008] [0.007] [0.005] [0.007] [0.007] [0.003] [0.004] [0.010] [0.013] [0.018]
Log mths temp mig emp (indirect effect)
-0.421*** -0.053*** -0.079*** 0.056*** 0.063*** 0.072*** 0.065*** 0.031*** 0.035*** -0.017 0.013 0.024 [0.029] [0.007] [0.008] [0.011] [0.006] [0.007] [0.011] [0.004] [0.004] [0.015] [0.017] [0.019]
Change log employment (direct) 0.245 0.360*** 0.331*** -0.243** 0.002 0 -0.142 0.002 0 -0.043 0.003 -0.021
[0.247] [0.017] [0.017] [0.092] [0.015] [0.015] [0.097] [0.009] [0.009] [0.130] [0.040] [0.040]
Change log employment (indirect)
4.210*** -0.062 -0.027 -2.031*** -0.037 -0.04 -2.047*** -0.055 -0.055 -2.270*** -0.359** -0.348* [0.587] [0.058] [0.059] [0.219] [0.052] [0.052] [0.231] [0.030] [0.030] [0.308] [0.137] [0.138]
Log regional unemployment 0.491*** -0.005 -0.001 -0.084*** -0.061*** -0.058*** -0.034* -0.021*** -0.020*** -0.002 -0.066*** -0.057***
[0.034] [0.006] [0.007] [0.013] [0.006] [0.006] [0.014] [0.003] [0.003] [0.018] [0.015] [0.015]
Observations 2504 2504 2504 2504 2504 2504 2504 2504 2504 2494 2494 2494
Adj R-squared 0.68 1 1 0.12 0.98 0.98 0.24 1 1 0.05 0.94 0.94
Adj R-squared excl. fixed effects 0.28 0.25 0.11 0.1 0.06 0.05 0.01 0
Combined effect (β+β2) 0.339*** 0.048*** 0.079*** 0.098*** 0.073*** 0.088*** 0.130*** 0.034*** 0.043*** 0.031** 0.025 0.084***
Chi-square (H0: β+β2=0) 195.18 39.78 76.17 117.32 115.15 121 182.11 73.42 83.84 5.92 2 15.65
p value 0 0 0 0 0 0 0 0 0 0.01 0.16 0
IV tests
Anderson CC under-ID (H0: not identified)
1241.45
1241.45
1241.45
1235.94
Anderson p (ideally 0)
0
0
0
0
Cragg-Donald Weak ID (H0: weak)
1011.31
1011.31
1011.31
1006.49
Stock-Yogo critical value (10%) 7.03 7.03 7.03 7.03
Note: OLS = ordinary least squares; FE = fixed effects included; IV = instrumental variable model.* p<0.05, ** p<0.01, *** p<0.001 Source: Figures have been extracted from the Integrated Data Infrastructure managed by Statistics New Zealand.
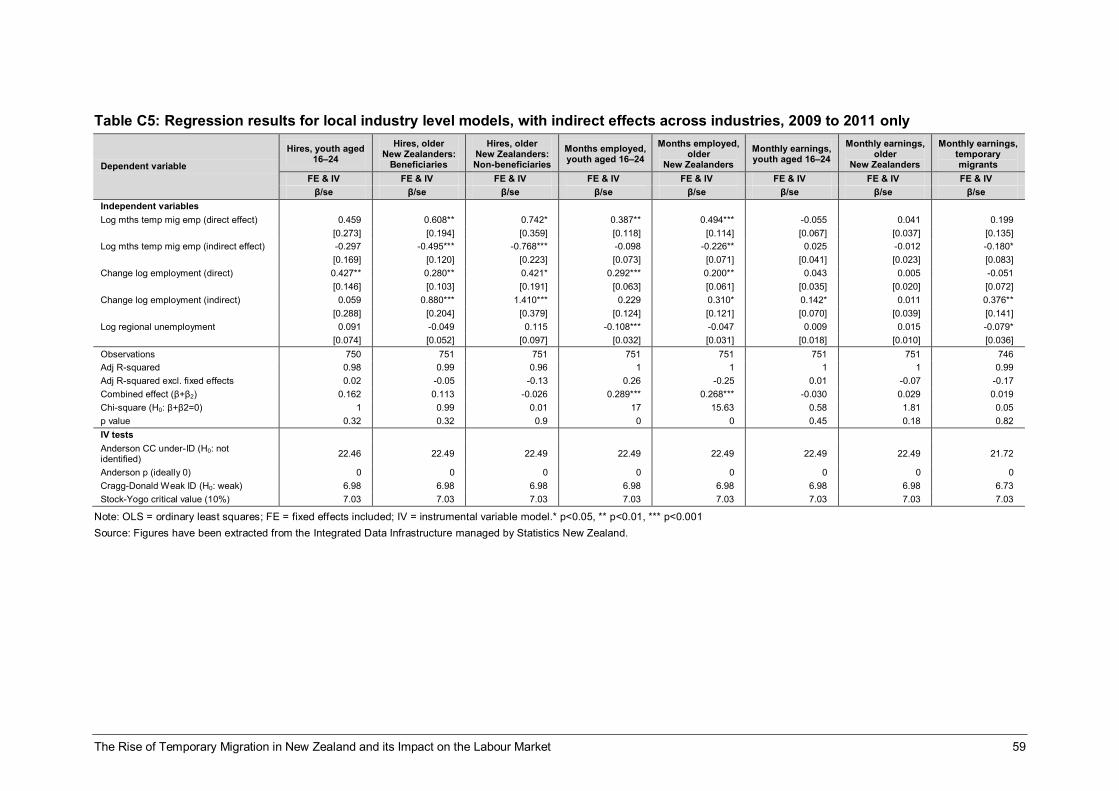
The Rise of Temporary Migration in New Zealand and its Impact on the Labour Market 59
Table C5: Regression results for local industry level models, with indirect effects across industries, 2009 to 2011 only
Dependent variable
Hires, youth aged 16–24
Hires, older New Zealanders:
Beneficiaries
Hires, older New Zealanders: Non-beneficiaries
Months employed, youth aged 16–24
Months employed, older
New Zealanders Monthly earnings, youth aged 16–24
Monthly earnings, older
New Zealanders
Monthly earnings, temporary migrants
FE & IV FE & IV FE & IV FE & IV FE & IV FE & IV FE & IV FE & IV β/se β/se β/se β/se β/se β/se β/se β/se
Independent variables Log mths temp mig emp (direct effect) 0.459 0.608** 0.742* 0.387** 0.494*** -0.055 0.041 0.199 [0.273] [0.194] [0.359] [0.118] [0.114] [0.067] [0.037] [0.135] Log mths temp mig emp (indirect effect) -0.297 -0.495*** -0.768*** -0.098 -0.226** 0.025 -0.012 -0.180* [0.169] [0.120] [0.223] [0.073] [0.071] [0.041] [0.023] [0.083] Change log employment (direct) 0.427** 0.280** 0.421* 0.292*** 0.200** 0.043 0.005 -0.051 [0.146] [0.103] [0.191] [0.063] [0.061] [0.035] [0.020] [0.072] Change log employment (indirect) 0.059 0.880*** 1.410*** 0.229 0.310* 0.142* 0.011 0.376** [0.288] [0.204] [0.379] [0.124] [0.121] [0.070] [0.039] [0.141] Log regional unemployment 0.091 -0.049 0.115 -0.108*** -0.047 0.009 0.015 -0.079*
[0.074] [0.052] [0.097] [0.032] [0.031] [0.018] [0.010] [0.036]
Observations 750 751 751 751 751 751 751 746 Adj R-squared 0.98 0.99 0.96 1 1 1 1 0.99 Adj R-squared excl. fixed effects 0.02 -0.05 -0.13 0.26 -0.25 0.01 -0.07 -0.17 Combined effect (β+β2) 0.162 0.113 -0.026 0.289*** 0.268*** -0.030 0.029 0.019 Chi-square (H0: β+β2=0) 1 0.99 0.01 17 15.63 0.58 1.81 0.05 p value 0.32 0.32 0.9 0 0 0.45 0.18 0.82 IV tests Anderson CC under-ID (H0: not identified) 22.46 22.49 22.49 22.49 22.49 22.49 22.49 21.72
Anderson p (ideally 0) 0 0 0 0 0 0 0 0 Cragg-Donald Weak ID (H0: weak) 6.98 6.98 6.98 6.98 6.98 6.98 6.98 6.73 Stock-Yogo critical value (10%) 7.03 7.03 7.03 7.03 7.03 7.03 7.03 7.03
Note: OLS = ordinary least squares; FE = fixed effects included; IV = instrumental variable model.* p<0.05, ** p<0.01, *** p<0.001 Source: Figures have been extracted from the Integrated Data Infrastructure managed by Statistics New Zealand.

60 The Rise of Temporary Migration in New Zealand and its Impact on the Labour Market
Table C6: Regression results for local industry level models, with indirect effects across industries, youth by age
Dependent variable
Months employed, youth aged 16–17
Months employed, youth aged 18–19
Months employed, youth aged 20–24
Monthly earnings, youth aged 16–17
Monthly earnings, youth aged 18–19
Monthly earnings, youth aged 20–24
FE & IV FE & IV FE & IV FE & IV FE & IV FE & IV β/se β/se β/se β/se β/se β/se
Independent variables Log mths temp mig emp (direct effect) 0.148*** 0.148*** 0.190*** -0.008 0.026* 0.015* [0.023] [0.017] [0.012] [0.023] [0.012] [0.006] Log mths temp mig emp (indirect effect) 0.04 -0.009 -0.076*** 0.098*** 0.107*** 0.068*** [0.024] [0.018] [0.012] [0.024] [0.013] [0.007] Change log employment (direct) 0.503*** 0.457*** 0.372*** 0.142** 0.027 0.001 [0.051] [0.038] [0.027] [0.052] [0.027] [0.014] Change log employment (indirect) 0.592*** -0.024 -0.011 0.3 -0.014 0.004 [0.175] [0.130] [0.091] [0.176] [0.093] [0.049] Log regional unemployment -0.181*** -0.082*** -0.018 -0.091*** -0.086*** -0.062*** [0.019] [0.014] [0.010] [0.019] [0.010] [0.005] Observations 2501 2501 2503 2501 2501 2503 Adj R-squared 0.91 0.95 0.97 0.9 0.97 0.99 Adj R-squared excl. fixed effects 0.12 0.12 0.18 0.02 0.07 0.12 Combined effect (β+β2) 0.188*** 0.139*** 0.114*** 0.090*** 0.133*** 0.083*** Chi-square (H0: β+β2=0) 49.58 48.85 65.65 11.19 86.8 124.12 p value 0 0 0 0 0 0 IV tests Anderson CC under-ID (H0: not identified) 1241.84 1240.05 1240.97 1241.84 1240.05 1240.97 Anderson p (ideally 0) 0 0 0 0 0 0 Cragg-Donald Weak ID (H0: weak) 1013.37 1009.98 1010.85 1013.37 1009.98 1010.85 Stock-Yogo critical value (10%) 7.03 7.03 7.03 7.03 7.03 7.03
Note: OLS = ordinary least squares; FE = fixed effects included; IV = instrumental variable model.* p<0.05, ** p<0.01, *** p<0.001 Source: Figures have been extracted from the Integrated Data Infrastructure managed by Statistics New Zealand.

The Rise of Temporary Migration in New Zealand and its Impact on the Labour Market 61
Table C7: Regression results for local industry level models, with indirect effects, by temporary migrant category
Dependent variable Hires, youth aged 16–24
Hires, older New Zealanders:
Beneficiaries
Hires, older New Zealanders: Non-beneficiaries
Months employed, youth aged 16–24
Months employed, older New Zealanders
Monthly earnings, youth aged 16–24
Monthly earnings, older New Zealanders
International students Log mths temp mig emp (direct effect) 0.087*** 0.086*** 0.079*** 0.088*** 0.067*** -0.004 0 [0.013] [0.017] [0.016] [0.011] [0.008] [0.006] [0.004] Log mths temp mig emp (indirect effect) -0.058*** -0.065*** -0.089*** -0.057*** -0.048*** 0.017*** 0.003 [0.011] [0.014] [0.014] [0.009] [0.006] [0.005] [0.003] Change log employment (direct) 0.580*** 0.602*** 0.682*** 0.432*** 0.366*** 0.01 0.003 [0.033] [0.043] [0.042] [0.029] [0.020] [0.016] [0.009] Change log employment (indirect) 0.326** -0.243 0.375** 0.069 -0.034 -0.025 -0.041 [0.113] [0.147] [0.141] [0.097] [0.067] [0.054] [0.031] Log regional unemployment -0.039** 0.092*** -0.101*** -0.062*** -0.016* -0.074*** -0.027*** [0.012] [0.016] [0.015] [0.010] [0.007] [0.006] [0.003] Observations 2490 2490 2490 2490 2490 2490 2490 Adj R-squared 0.96 0.94 0.94 0.97 0.99 0.99 1 Adj R-squared excl. fixed effects 0.11 0.08 0.1 0.03 0.06 0.07 0.03 Combined effect (β+β2) 0.029*** 0.021 -0.010 0.031*** 0.019*** 0.013*** 0.003 Chi-square (H0: β+β2=0) 9.98 2.89 0.76 15.1 12.84 8.59 1.38 p value 0 0.09 0.38 0 0 0 0.24 Anderson CC under-ID (H0: not identified) 252.02 252.02 252.02 252.02 252.02 252.02 252.02 Anderson p (ideally 0) 0 0 0 0 0 0 0 Cragg-Donald Weak ID (H0: weak) 115.14 115.14 115.14 115.14 115.14 115.14 115.14 Stock-Yogo critical value (10%) 7.03 7.03 7.03 7.03 7.03 7.03 7.03
Essential Skills Log mths temp mig emp (direct effect) 0.083*** 0.086*** 0.098*** 0.105*** 0.097*** 0.01 0.008* [0.014] [0.019] [0.018] [0.012] [0.008] [0.007] [0.004] Log mths temp mig emp (indirect effect) -0.109*** -0.092*** -0.094*** -0.076*** -0.050*** 0.041*** 0.030*** [0.017] [0.022] [0.021] [0.014] [0.010] [0.008] [0.005] Change log employment (direct) 0.603*** 0.623*** 0.692*** 0.448*** 0.372*** 0.005 0.001 [0.032] [0.042] [0.040] [0.027] [0.018] [0.016] [0.009] Change log employment (indirect) 0.287** -0.282* 0.332* 0.053 -0.032 0.005 -0.03 [0.110] [0.144] [0.138] [0.092] [0.063] [0.054] [0.031] Log regional unemployment -0.040** 0.096*** -0.094*** -0.049*** 0 -0.061*** -0.017*** [0.012] [0.016] [0.015] [0.010] [0.007] [0.006] [0.003] Observations 2490 2490 2490 2490 2490 2490 2490 Adj R-squared 0.96 0.94 0.94 0.97 0.99 0.99 1 Adj R-squared excl. fixed effects 0.15 0.11 0.13 0.13 0.15 0.07 0.05 Combined effect (β+β2) -0.026 -0.006 0.004 0.029** 0.047*** 0.051*** 0.038*** Chi-square (H0: β+β2=0) 3.52 0.1 0.06 6.13 33.91 56.17 96.52 p value 0.06 0.76 0.8 0.01 0 0 0 Anderson CC under-ID (H0: not identified) 598.82 598.82 598.82 598.82 598.82 598.82 598.82 Anderson p (ideally 0) 0 0 0 0 0 0 0 Cragg-Donald Weak ID (H0: weak) 323.77 323.77 323.77 323.77 323.77 323.77 323.77 Stock-Yogo critical value (10%) 7.03 7.03 7.03 7.03 7.03 7.03 7.03
Note: OLS = ordinary least squares; FE = fixed effects included; IV = instrumental variable model * p<0.05, ** p<0.01, *** p<0.001 Source: Figures have been extracted from the Integrated Data Infrastructure managed by Statistics New Zealand.

62 The Rise of Temporary Migration in New Zealand and its Impact on the Labour Market
Table C7 continued: Regression results for local industry level models, with indirect effects, by temporary migrant category Dependent variable Hires, youth aged 16–
24 Hires, older New
Zealanders: Beneficiaries
Hires, older New Zealanders: Non-
beneficiaries Months employed, youth aged 16–24
Months employed, older New Zealanders
Monthly earnings, youth aged 16–24
Monthly earnings, older New Zealanders
Working Holiday Schemes Log mths temp mig emp (direct effect) 0.214*** 0.173*** 0.173*** 0.183*** 0.118*** -0.008 -0.003 [0.027] [0.033] [0.032] [0.022] [0.015] [0.011] [0.007] Log mths temp mig emp (indirect effect) -0.092*** -0.177*** -0.070*** -0.047** -0.066*** 0.072*** 0.026*** [0.017] [0.021] [0.021] [0.014] [0.010] [0.007] [0.004] Change log employment (direct) 0.490*** 0.542*** 0.613*** 0.364*** 0.330*** 0.011 0.005 [0.039] [0.048] [0.047] [0.033] [0.023] [0.017] [0.010] Change log employment (indirect) 0.301* -0.142 0.304* -0.017 -0.054 -0.111* -0.076* [0.123] [0.151] [0.148] [0.103] [0.071] [0.053] [0.031] Log regional unemployment -0.023 0.059*** -0.084*** -0.033** -0.013 -0.043*** -0.016*** [0.014] [0.018] [0.017] [0.012] [0.008] [0.006] [0.004] Observations 2490 2490 2490 2490 2490 2490 2490 Adj R-squared 0.95 0.93 0.93 0.97 0.99 0.99 1 Adj R-squared excl. fixed effects -0.05 0.03 0.02 -0.09 -0.04 0.1 0.04 Combined effect (β+β2) 0.122*** -0.004 0.103*** 0.136*** 0.052*** 0.064*** 0.023*** Chi-square (H0: β+β2=0) 35.84 0.03 18.02 63.91 20.19 54.52 19.9 p value 0 0.86 0 0 0 0 0 Anderson CC under-ID (H0: not identified) 158 158 158 158 158 158 158 Anderson p (ideally 0) 0 0 0 0 0 0 0 Cragg-Donald Weak ID (H0: weak) 69.28 69.28 69.28 69.28 69.28 69.28 69.28 Stock-Yogo critical value (10%) 7.03 7.03 7.03 7.03 7.03 7.03 7.03
Family Log mths temp mig emp (direct effect) 0.148*** 0.172*** 0.141*** 0.151*** 0.098*** 0.011 -0.003 [0.020] [0.025] [0.024] [0.017] [0.011] [0.009] [0.005] Log mths temp mig emp (indirect effect) -0.231*** -0.253*** -0.208*** -0.110*** -0.130*** 0.100*** 0.028*** [0.031] [0.040] [0.038] [0.026] [0.018] [0.015] [0.008] Change log employment (direct) 0.552*** 0.558*** 0.650*** 0.400*** 0.354*** -0.001 0.004 [0.034] [0.044] [0.042] [0.029] [0.020] [0.016] [0.009] Change log employment (indirect) 0.432*** -0.119 0.440** 0.073 0.001 -0.089 -0.063* [0.115] [0.148] [0.142] [0.098] [0.066] [0.054] [0.031] Log regional unemployment -0.058*** 0.072*** -0.116*** -0.051*** -0.023** -0.047*** -0.021*** [0.014] [0.018] [0.017] [0.012] [0.008] [0.007] [0.004] Observations 2490 2490 2490 2490 2490 2490 2490 Adj R-squared 0.96 0.94 0.94 0.97 0.99 0.99 1 Adj R-squared excl. fixed effects 0.11 0.1 0.12 0.05 0.12 0.09 0.04 Combined effect (β+β2) -0.083*** -0.081* -0.067 0.041 -0.032* 0.111*** 0.025*** Chi-square (H0: β+β2=0) 8.59 4.94 3.65 2.95 3.91 69.62 10.87 p value 0 0.03 0.06 0.09 0.05 0 0 Anderson CC under-ID (H0: not identified) 332.13 332.13 332.13 332.13 332.13 332.13 332.13 Anderson p (ideally 0) 0 0 0 0 0 0 0 Cragg-Donald Weak ID (H0: weak) 157.38 157.38 157.38 157.38 157.38 157.38 157.38 Stock-Yogo critical value (10%) 7.03 7.03 7.03 7.03 7.03 7.03 7.03
Note: OLS = ordinary least squares; FE = fixed effects included; IV = instrumental variable model * p<0.05, ** p<0.01, *** p<0.001 Source: Figures have been extracted from the Integrated Data Infrastructure managed by Statistics New Zealand.
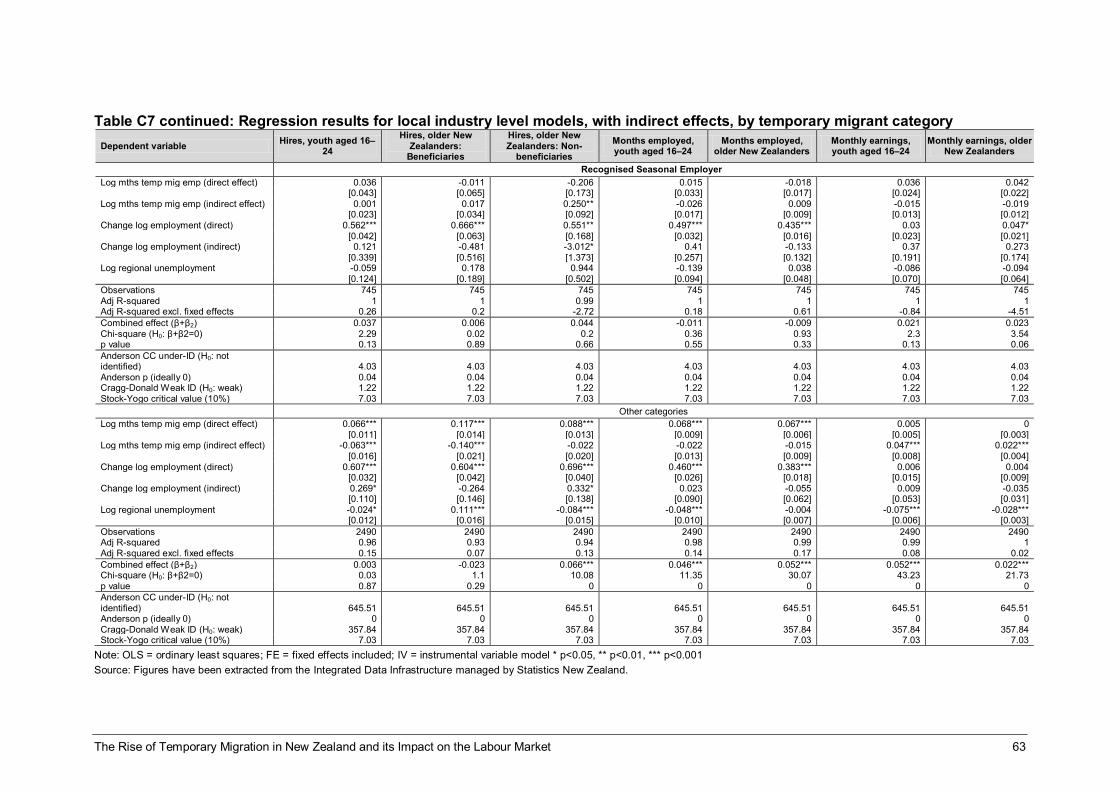
The Rise of Temporary Migration in New Zealand and its Impact on the Labour Market 63
Table C7 continued: Regression results for local industry level models, with indirect effects, by temporary migrant category Dependent variable Hires, youth aged 16–
24 Hires, older New
Zealanders: Beneficiaries
Hires, older New Zealanders: Non-
beneficiaries Months employed, youth aged 16–24
Months employed, older New Zealanders
Monthly earnings, youth aged 16–24
Monthly earnings, older New Zealanders
Recognised Seasonal Employer Log mths temp mig emp (direct effect) 0.036 -0.011 -0.206 0.015 -0.018 0.036 0.042 [0.043] [0.065] [0.173] [0.033] [0.017] [0.024] [0.022] Log mths temp mig emp (indirect effect) 0.001 0.017 0.250** -0.026 0.009 -0.015 -0.019 [0.023] [0.034] [0.092] [0.017] [0.009] [0.013] [0.012] Change log employment (direct) 0.562*** 0.666*** 0.551** 0.497*** 0.435*** 0.03 0.047* [0.042] [0.063] [0.168] [0.032] [0.016] [0.023] [0.021] Change log employment (indirect) 0.121 -0.481 -3.012* 0.41 -0.133 0.37 0.273 [0.339] [0.516] [1.373] [0.257] [0.132] [0.191] [0.174] Log regional unemployment -0.059 0.178 0.944 -0.139 0.038 -0.086 -0.094 [0.124] [0.189] [0.502] [0.094] [0.048] [0.070] [0.064] Observations 745 745 745 745 745 745 745 Adj R-squared 1 1 0.99 1 1 1 1 Adj R-squared excl. fixed effects 0.26 0.2 -2.72 0.18 0.61 -0.84 -4.51 Combined effect (β+β2) 0.037 0.006 0.044 -0.011 -0.009 0.021 0.023 Chi-square (H0: β+β2=0) 2.29 0.02 0.2 0.36 0.93 2.3 3.54 p value 0.13 0.89 0.66 0.55 0.33 0.13 0.06 Anderson CC under-ID (H0: not identified) 4.03 4.03 4.03 4.03 4.03 4.03 4.03 Anderson p (ideally 0) 0.04 0.04 0.04 0.04 0.04 0.04 0.04 Cragg-Donald Weak ID (H0: weak) 1.22 1.22 1.22 1.22 1.22 1.22 1.22 Stock-Yogo critical value (10%) 7.03 7.03 7.03 7.03 7.03 7.03 7.03
Other categories Log mths temp mig emp (direct effect) 0.066*** 0.117*** 0.088*** 0.068*** 0.067*** 0.005 0 [0.011] [0.014] [0.013] [0.009] [0.006] [0.005] [0.003] Log mths temp mig emp (indirect effect) -0.063*** -0.140*** -0.022 -0.022 -0.015 0.047*** 0.022*** [0.016] [0.021] [0.020] [0.013] [0.009] [0.008] [0.004] Change log employment (direct) 0.607*** 0.604*** 0.696*** 0.460*** 0.383*** 0.006 0.004 [0.032] [0.042] [0.040] [0.026] [0.018] [0.015] [0.009] Change log employment (indirect) 0.269* -0.264 0.332* 0.023 -0.055 0.009 -0.035 [0.110] [0.146] [0.138] [0.090] [0.062] [0.053] [0.031] Log regional unemployment -0.024* 0.111*** -0.084*** -0.048*** -0.004 -0.075*** -0.028*** [0.012] [0.016] [0.015] [0.010] [0.007] [0.006] [0.003] Observations 2490 2490 2490 2490 2490 2490 2490 Adj R-squared 0.96 0.93 0.94 0.98 0.99 0.99 1 Adj R-squared excl. fixed effects 0.15 0.07 0.13 0.14 0.17 0.08 0.02 Combined effect (β+β2) 0.003 -0.023 0.066*** 0.046*** 0.052*** 0.052*** 0.022*** Chi-square (H0: β+β2=0) 0.03 1.1 10.08 11.35 30.07 43.23 21.73 p value 0.87 0.29 0 0 0 0 0 Anderson CC under-ID (H0: not identified) 645.51 645.51 645.51 645.51 645.51 645.51 645.51 Anderson p (ideally 0) 0 0 0 0 0 0 0 Cragg-Donald Weak ID (H0: weak) 357.84 357.84 357.84 357.84 357.84 357.84 357.84 Stock-Yogo critical value (10%) 7.03 7.03 7.03 7.03 7.03 7.03 7.03
Note: OLS = ordinary least squares; FE = fixed effects included; IV = instrumental variable model * p<0.05, ** p<0.01, *** p<0.001 Source: Figures have been extracted from the Integrated Data Infrastructure managed by Statistics New Zealand.

More information
www.mbie.govt.nz
0800 20 90 20
Information, examples and answers to your questions about the topics covered here can be found on our website www.mbie.govt.nz or by calling us free on 0800 20 90 20.