the risk and term structure of interest rates chapter 6 – ec311 susanto
TRANSCRIPT

THE RISK AND TERM STRUCTURE OF INTEREST RATES
Chapter 6 – EC311 Susanto

Risk and Term Structure of Interest Rates • Ch. 5 explained the interest rate of one type of
bond.– In fact there are many bonds with different interest rates.
• Now we study why interest rates differ from bond to bond:
1. Bonds with the same term to maturity (but differ in default risk, liquidity, and income tax treatment) have different interest rates.The relationship among interest rates with the same term to maturity is called risk structure of interest rates.
2. A bond’s term to maturity also affects its interest rate.The relationship among interest rates with different terms to maturity but same default risk is called term structure of interest rates.
© 2004 Pearson Addison-Wesley. All rights reserved 6-2
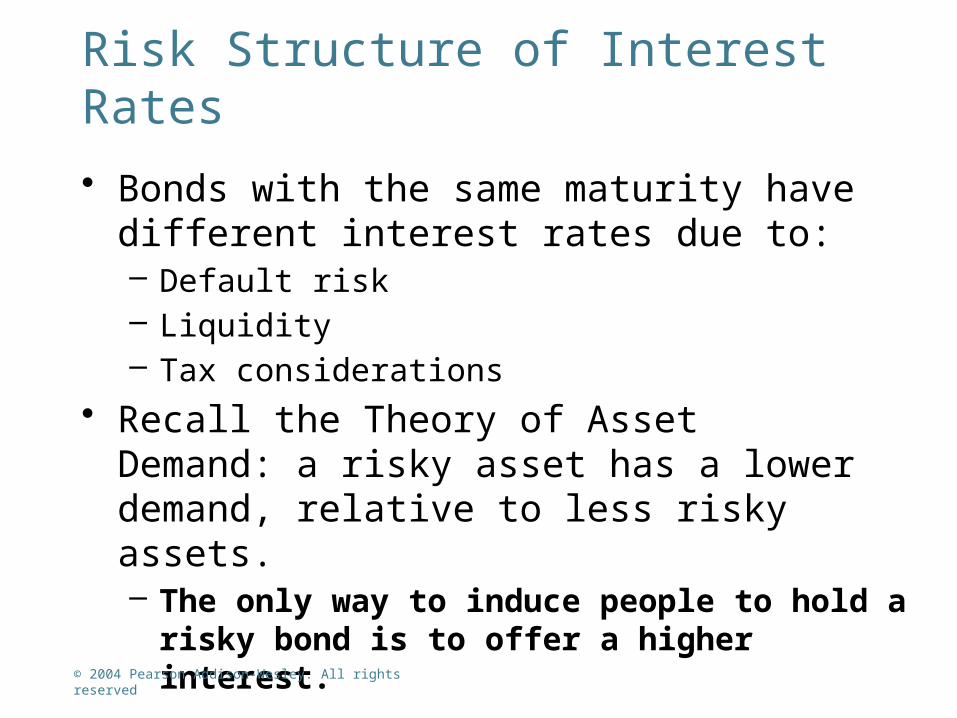
Risk Structure of Interest Rates
• Bonds with the same maturity have different interest rates due to:– Default risk– Liquidity – Tax considerations
• Recall the Theory of Asset Demand: a risky asset has a lower demand, relative to less risky assets. – The only way to induce people to hold a
risky bond is to offer a higher interest.
© 2004 Pearson Addison-Wesley. All rights reserved 6-3
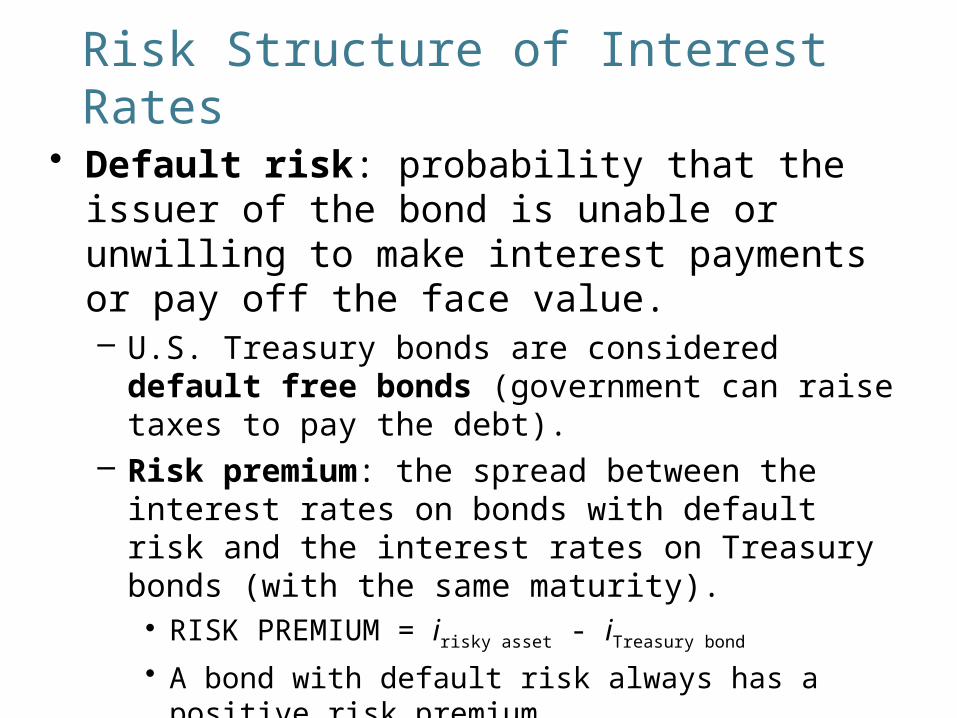
Risk Structure of Interest Rates
• Default risk: probability that the issuer of the bond is unable or unwilling to make interest payments or pay off the face value.– U.S. Treasury bonds are considered default
free bonds (government can raise taxes to pay the debt).
– Risk premium: the spread between the interest rates on bonds with default risk and the interest rates on Treasury bonds (with the same maturity). • RISK PREMIUM = irisky asset - iTreasury bond
• A bond with default risk always has a positive risk premium.
• The higher the default risk of a bond, the larger the risk premium.

© 2004 Pearson Addison-Wesley. All rights reserved 6-5
Risk Structure of Long-Term Bonds in the United States

© 2004 Pearson Addison-Wesley. All rights reserved 6-6
Increase in Default Risk on Corporate Bonds

© 2004 Pearson Addison-Wesley. All rights reserved 6-7
Increase in Default Risk on Corporate Bonds
Corporate Bond Market1. Re on corporate bonds dn, Dc dn, Dc shifts left2. Risk of corporate bonds up, Dc dn, Dc shifts left3. Demand for corporate bonds dn, Pc dn, ic up
Treasury Bond Market4. Relative Re on Treasury bonds up, DT up, DT shifts
right5. Relative risk of Treasury bonds dn, DT up, DT shifts
right6. Demand for Treasury Bond up, PT up, iT dnOutcome:Risk premium, ic – iT, rises

© 2004 Pearson Addison-Wesley. All rights reserved 6-8
Bond Ratings
• Credit-rating agencies rate the quality of bonds in terms of the probability of default.
• Investment-grade: relatively low risk of default, BBB and above.
• Speculative-grade: higher default risk, below BB (also called junk bonds, high-yield bonds).
• Fallen angels: investment-grade securities whose rating have fallen to junk levels.
• Due to increased default risk and thus higher risk premium, junk bonds carry higher interest rates compared to investment-grade bonds.

© 2004 Pearson Addison-Wesley. All rights reserved 6-9
Bond Ratings

© 2004 Pearson Addison-Wesley. All rights reserved 6-10
Liquidity
• Liquidity: the relative ease with which an asset can be converted into cash, depends upon:– Cost of selling a bond (inversely related)– Number of buyers/sellers in a bond market (positive)
• Treasury bonds are the most liquid of all long-term bonds: widely traded, easiest to sell quickly and the cost of selling them is low.
• Corporate bonds are not as liquid: fewer bonds for any one corporation are traded; hard to find buyers quickly.
• The spread between the interest rates on corporate bonds and Treasury bonds also reflects liquidity premium.

© 2004 Pearson Addison-Wesley. All rights reserved 6-11
Corporate Bonds Become Less Liquid
Corporate Bond Market1. Less liquid corporate bonds Dc dn, Dc shifts left2. Pc dn, ic up
Treasury Bond Market1. Relatively more liquid Treasury bonds, DT up, DT shifts
right2. PT up, iT dnOutcome:1. Risk premium, ic – iT, rises2. Risk premium reflects not only corporate bonds’ default risk, but also liquidity
© 2004 Pearson Addison-Wesley. All rights reserved 6-12
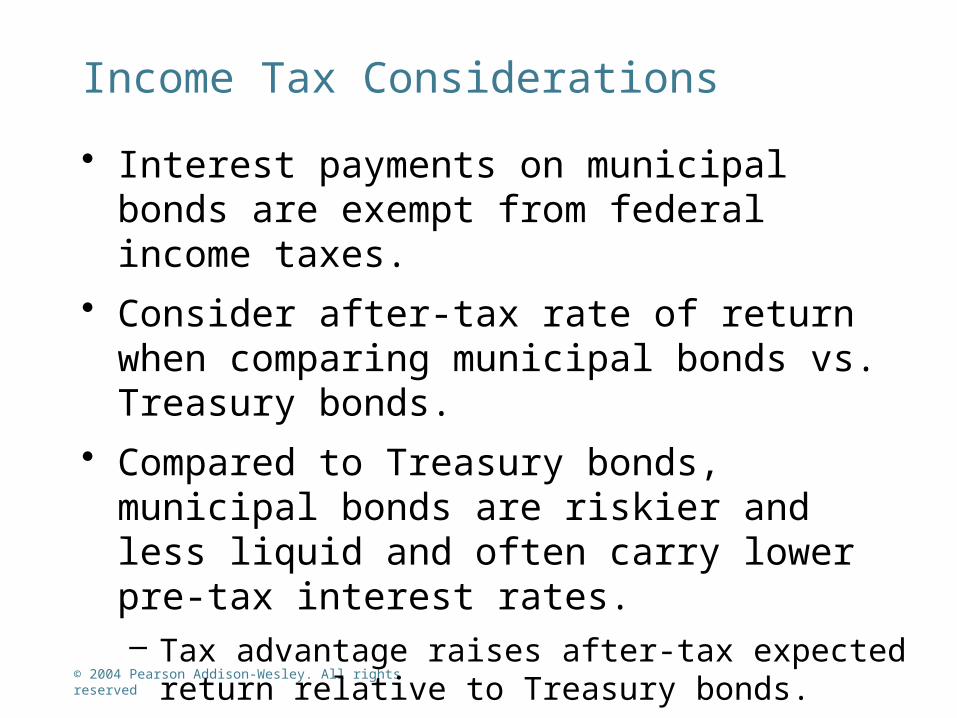
Income Tax Considerations
• Interest payments on municipal bonds are exempt from federal income taxes.
• Consider after-tax rate of return when comparing municipal bonds vs. Treasury bonds.
• Compared to Treasury bonds, municipal bonds are riskier and less liquid and often carry lower pre-tax interest rates.– Tax advantage raises after-tax expected return relative to
Treasury bonds.

© 2004 Pearson Addison-Wesley. All rights reserved 6-13
Tax Advantages of Municipal Bonds

© 2004 Pearson Addison-Wesley. All rights reserved 6-14
Tax Advantages of Municipal Bonds
Municipal Bond Market1. Tax exemption raises relative RETe on
municipal bonds, Dm up, Dm shifts right2. Pm up, im dn
Treasury Bond Market1. Relative RETe on Treasury bonds dn, DT dn, DT
shifts left2. PT dn, iT upOutcome:im < iT
6-15
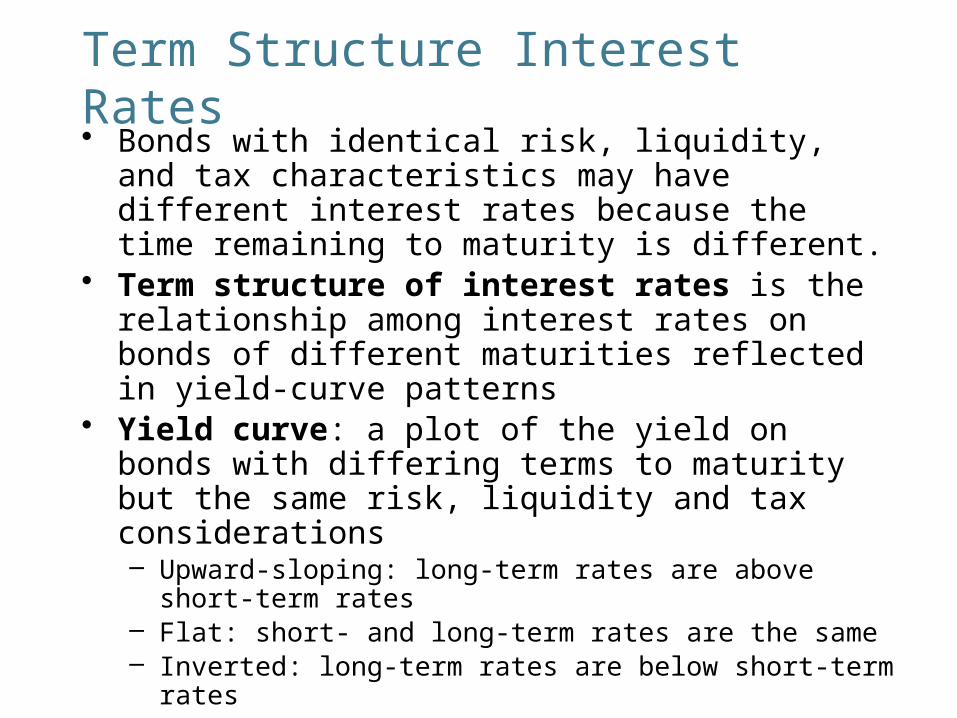
Term Structure Interest Rates• Bonds with identical risk, liquidity, and tax characteristics
may have different interest rates because the time remaining to maturity is different.
• Term structure of interest rates is the relationship among interest rates on bonds of different maturities reflected in yield-curve patterns
• Yield curve: a plot of the yield on bonds with differing terms to maturity but the same risk, liquidity and tax considerations– Upward-sloping: long-term rates are above short-term rates– Flat: short- and long-term rates are the same– Inverted: long-term rates are below short-term rates

6-16
Empirical Facts to be Explained
1. Interest rates for different maturities move together over time
2. Yield curves tend to have steep upward slope when short rates are low and downward slope when short rates are high
3. Yield curve is typically upward sloping
6-17
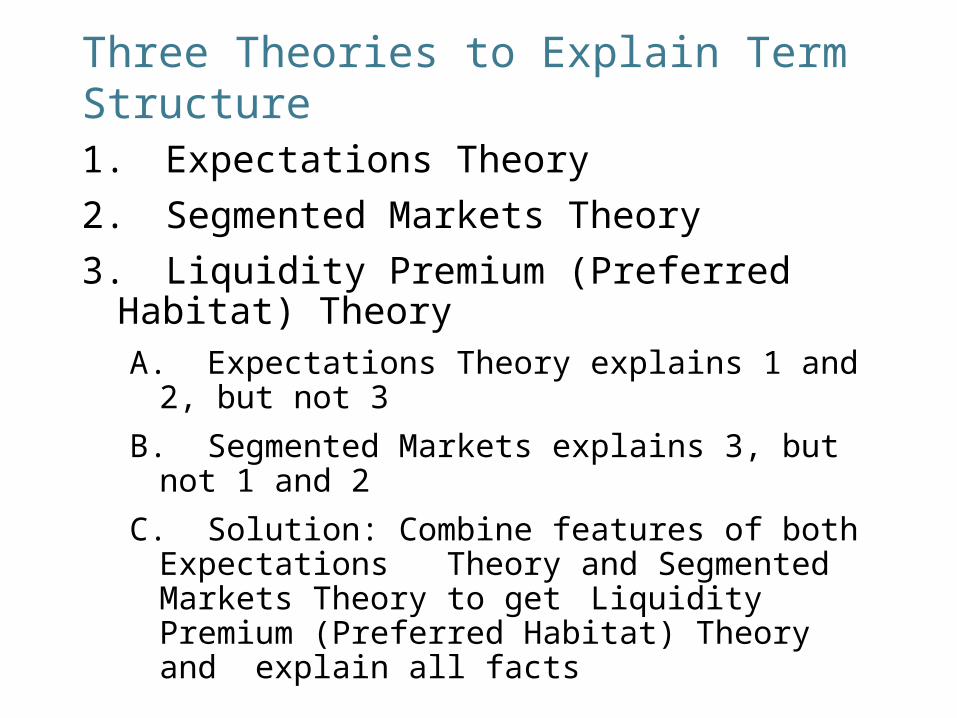
Three Theories to Explain Term Structure1.Expectations Theory
2.Segmented Markets Theory
3.Liquidity Premium (Preferred Habitat) TheoryA. Expectations Theory explains 1 and 2,
but not 3
B. Segmented Markets explains 3, but not 1 and 2
C. Solution: Combine features of both Expectations Theory and Segmented Markets Theory to get Liquidity Premium (Preferred Habitat) Theory and explain all facts

© 2004 Pearson Addison-Wesley. All rights reserved 6-18
Interest Rates on Different Maturity Bonds Move Together

© 2004 Pearson Addison-Wesley. All rights reserved 6-19
Expectations Theory
Key Assumption: Bonds of different maturities are perfect substitutes
-Buyers of bonds do not prefer bonds of one maturity over another-They will not hold any quantity of a bond if its expected return is less than that of another bond with a different maturity.
Implication: RETe on bonds of different maturities are equal
The interest rate on a long-term bond will equal an average of the short-term interest rates that people expect to occur over the life of the long-term bond.
© 2004 Pearson Addison-Wesley. All rights reserved 6-20
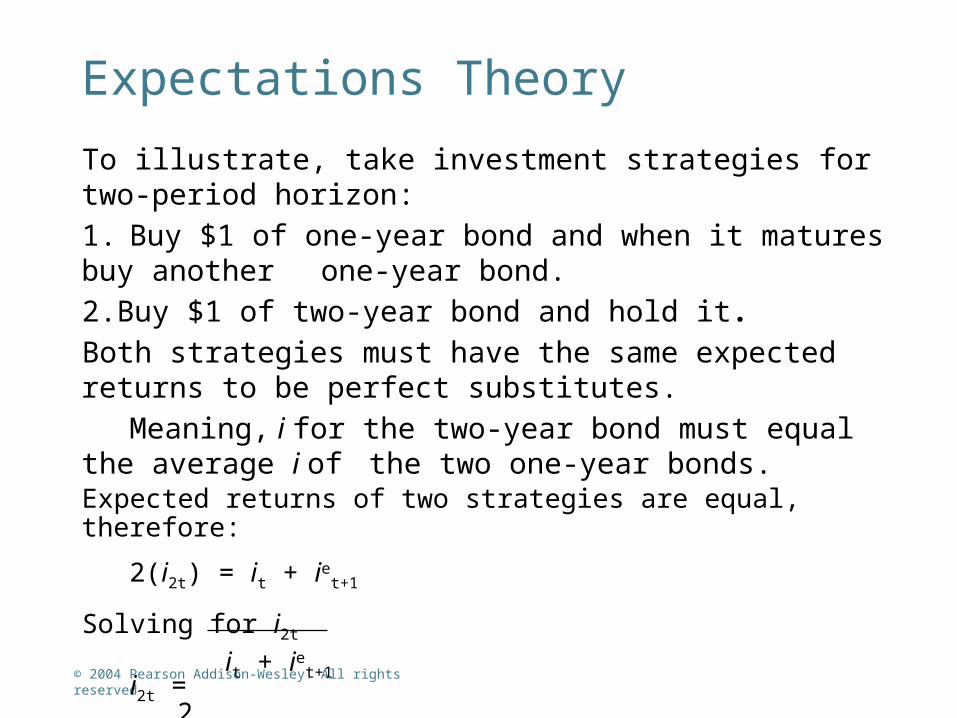
Expectations Theory
To illustrate, take investment strategies for two-period horizon:1. Buy $1 of one-year bond and when it matures buy another one-year bond.2.Buy $1 of two-year bond and hold it.Both strategies must have the same expected returns to be perfect substitutes.
Meaning, i for the two-year bond must equal the average i of the two one-year bonds. Expected returns of two strategies are equal, therefore:
2(i2t) = it + iet+1
Solving for i2t
it + iet+1 i2t =
2

More generally for n-period bond:
it + iet+1 + iet+2 + ... + iet+(n–1)int = n
In words: Interest rate on long bond = average short rates expected to occur over life of long bond
Numerical example:One-year interest rate over the next five years 5%, 6%, 7%, 8% and 9%:
Interest rate on two-year bond:(5% + 6%)/2 = 5.5%
Interest rate for five-year bond:(5% + 6% + 7% + 8% + 9%)/5 = 7%
Interest rate for one to five year bonds:5%, 5.5%, 6%, 6.5% and 7%.
6-21
Expectations Theory

© 2004 Pearson Addison-Wesley. All rights reserved 6-22
Expectations Hypothesis and Term Structure FactsExplains why yield curve has different slopes:
1. When short rates expected to rise in future, average of future short rates = int is above today’s short rate: therefore yield curve is upward sloping
2. When short rates expected to stay same in future, average of future short rates are same as today’s, and yield curve is flat
3. Only when short rates expected to fall will yield curve be downward sloping
Expectations Hypothesis explains Fact 1 that short and long rates move together
1. Short rate rises are persistent
2. If it today, iet+1, iet+2 etc. average of future rates int
3. Therefore: it int , i.e., short and long rates move together

© 2004 Pearson Addison-Wesley. All rights reserved 6-23
1. When short rates are low, they are expected to rise to normal level; long rate = average of future short rates will be above today’s short rate: yield curve will have steep upward slope
2. When short rates are high, they will be expected to fall in future, and long rate will be below current short rate: yield curve will have downward slope
Doesn’t explain Fact 3 that yield curve usually has upward slopeShort rates as likely to fall in future as rise, so average of future short rates will not usually be higher than current short rate: therefore, yield curve will not usually slope upward
Explains Fact 2 that yield curves tend to have steep slope when short rates are low and downward slope when short rates are high

© 2004 Pearson Addison-Wesley. All rights reserved 6-24
Segmented Markets Theory
Key Assumption: Bonds of different maturities are not substitutes at all•The interest rate for each bond with a different maturity is determined by the demand for and supply of that bond•Investors have preferences for bonds of one maturity over anotherImplication: Markets are completely segmented: interest rate at each maturity determined separately
Explains Fact 3 that yield curve is usually upward sloping
Investors typically prefer short holding periods and thus have higher demand for short-term bonds, which have higher price and lower interest rates than long bonds
Does not explain Fact 1 or Fact 2 because assumes long and short rates determined independently

© 2004 Pearson Addison-Wesley. All rights reserved 6-25
Liquidity Premium (Preferred Habitat) TheoriesKey Assumption: Bonds of different maturities are substitutes, but are not perfect substitutes
Implication: Modifies Expectations Theory with features of Segmented Markets Theory • Investors prefer short rather than long bond must be paid positive liquidity (term) premium, lnt, to hold long-term bonds• The interest rate on a long-term bond will equal an average of expected short-term interest rates over the life of the long-term bond plus a liquidity premium that responds to supply and demand conditions
Results in following modification of Expectations Theory
it + iet+1 + ie
t+2 + ... + iet+(n–1)int = + lnt n

© 2004 Pearson Addison-Wesley. All rights reserved 6-26
Relationship Between the Liquidity Premium (Preferred Habitat) and Expectations Theories
© 2004 Pearson Addison-Wesley. All rights reserved 6-27
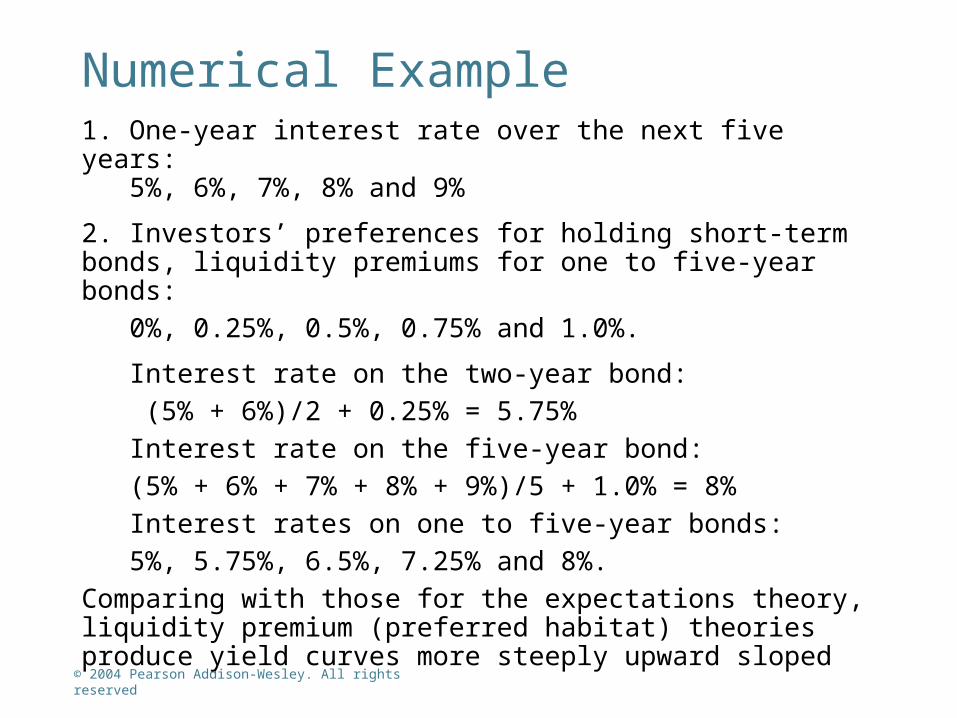
Numerical Example1. One-year interest rate over the next five years:
5%, 6%, 7%, 8% and 9%
2. Investors’ preferences for holding short-term bonds, liquidity premiums for one to five-year bonds:
0%, 0.25%, 0.5%, 0.75% and 1.0%.
Interest rate on the two-year bond: (5% + 6%)/2 + 0.25% = 5.75%Interest rate on the five-year bond:(5% + 6% + 7% + 8% + 9%)/5 + 1.0% = 8%Interest rates on one to five-year bonds:5%, 5.75%, 6.5%, 7.25% and 8%.
Comparing with those for the expectations theory, liquidity premium (preferred habitat) theories produce yield curves more steeply upward sloped

Preferred Habitat Theory
• Investors have a preference for bonds of one maturity over another (thus, preferred habitat).
• They will be willing to buy bonds of different maturities only if they earn a somewhat higher expected return.
• Investors are likely to prefer the habitat of short-term bonds to that of longer-term bonds, they are willing to hold long-term bonds only if they have higher expected returns (a term premium).
© 2004 Pearson Addison-Wesley. All rights reserved 6-28

© 2004 Pearson Addison-Wesley. All rights reserved 6-29
Liquidity Premium (Preferred Habitat) Theories: Term Structure FactsExplains all 3 Facts
• Fact 1: Interest rates on different maturity bonds move together over time; explained by the first term in the equation
• Fact 2: Yield curves tend to slope upward when short-term rates are low and to be inverted when short-term rates are high; explained by the liquidity premium term in the first case and by a low expected average in the second case
• Fact 3: Yield curves typically slope upward; explained by a larger liquidity premium as the term to maturity lengthens

© 2004 Pearson Addison-Wesley. All rights reserved 6-30
Market Predictions of Future Short Rates