the road to the future of cars: opportunities and key ... · the road to the future of cars:...
TRANSCRIPT

RADBOUD UNIVERSITY
MASTER THESIS - INFORMATION SCIENCES
The Road to the Future of Cars:Opportunities and Key Features
for Car Sharing Services
Author:Lennard VAN DEN [email protected]
Internal supervisor:Prof. dr. Martha LARSON
Second assessor:Prof. dr. ir. Arjen DE VRIES
External supervisor:MSc. Vincent BONS
July 5, 2017


iii
Radboud University
AbstractInstitute for Computing and Information Sciences (iCIS)
Information Sciences
The Road to the Future of Cars: Opportunities and Key Featuresfor Car Sharing Services
by Lennard VAN DEN BERG
The current market share of car sharing does not match the potential estimated inliterature. In this thesis, various unexploited opportunities for car sharing, such asintegration with public transportation and service of rural areas, have been identi-fied and explored. The goal of the study is to find features that would increase theutilisation and acceptance of car sharing as a capable mobility alternative. Threeexisting information sources are analysed. Besides literature, online reviews and adaily mobility dataset are chosen, as these sources are not exploited in other researchyet and are easily accessible. The insights that are gained into mobility behaviourand satisfaction, highlight the difficulties to create a homogeneous car sharing ser-vice to attract and satisfy customers in every available location. A list of featuresis created in which trip type, dedicated parking spots and availability are found torequire priority. The provided features and concepts can be used by different par-ties, such as car sharing companies, governments, and policy makers, to improvecar sharing or mobility in general.
Keywords: Car sharing, Shared vehicle fleet, Key design features, Public transporta-tion, Rural

v
AcknowledgementsI would first like to thank my supervisor, Martha Larson, for her advice, feedback
and for the discussions we had. I really appreciate that although the subject was notwithin her research field, she still wanted to guide me, as she saw potential in theresearch topic. Her suggestions and ability to keep an overview were a great helpduring the whole project.
I would also like to thank Ferns Paanakker for giving me the opportunity towrite my master thesis at Going Dutch and Vincent Bons for being my Going Dutchsupervisor. The guidance and expertise provided by both was very valuable. Thefreedom, both in terms of thesis subject and working environment, was highly ap-preciated.
Finally, I want to express my gratitude to my parents and sister for providingme with all the necessary support through my years of study and while working onmy master thesis. Additional thanks to my sister, Jerina, for reviewing this thesis onwriting mistakes.


vii
Contents
Abstract iii
1 Introduction 11.1 Motivation . . . . . . . . . . . . . . . . . . . . . . . . . . . . . . . . . . . 11.2 Problem definition . . . . . . . . . . . . . . . . . . . . . . . . . . . . . . 11.3 Research objective . . . . . . . . . . . . . . . . . . . . . . . . . . . . . . . 21.4 Research approach . . . . . . . . . . . . . . . . . . . . . . . . . . . . . . 21.5 Research question . . . . . . . . . . . . . . . . . . . . . . . . . . . . . . . 31.6 Roadmap . . . . . . . . . . . . . . . . . . . . . . . . . . . . . . . . . . . . 3
2 Literature review 52.1 Car sharing . . . . . . . . . . . . . . . . . . . . . . . . . . . . . . . . . . . 52.2 Public transportation . . . . . . . . . . . . . . . . . . . . . . . . . . . . . 142.3 Private car . . . . . . . . . . . . . . . . . . . . . . . . . . . . . . . . . . . 172.4 Autonomous vehicles . . . . . . . . . . . . . . . . . . . . . . . . . . . . . 192.5 Summary and discussion . . . . . . . . . . . . . . . . . . . . . . . . . . . 23
3 Online review analysis 273.1 Methodology . . . . . . . . . . . . . . . . . . . . . . . . . . . . . . . . . 273.2 Data . . . . . . . . . . . . . . . . . . . . . . . . . . . . . . . . . . . . . . . 283.3 Results . . . . . . . . . . . . . . . . . . . . . . . . . . . . . . . . . . . . . 293.4 Conclusion . . . . . . . . . . . . . . . . . . . . . . . . . . . . . . . . . . . 32
4 Data analysis 334.1 Data . . . . . . . . . . . . . . . . . . . . . . . . . . . . . . . . . . . . . . . 334.2 Data analysis questions . . . . . . . . . . . . . . . . . . . . . . . . . . . . 394.3 Results . . . . . . . . . . . . . . . . . . . . . . . . . . . . . . . . . . . . . 404.4 Conclusion . . . . . . . . . . . . . . . . . . . . . . . . . . . . . . . . . . . 50
5 Car sharing features 535.1 Criteria . . . . . . . . . . . . . . . . . . . . . . . . . . . . . . . . . . . . . 535.2 Overview . . . . . . . . . . . . . . . . . . . . . . . . . . . . . . . . . . . . 545.3 Compatibility . . . . . . . . . . . . . . . . . . . . . . . . . . . . . . . . . 555.4 Dependency . . . . . . . . . . . . . . . . . . . . . . . . . . . . . . . . . . 575.5 Recommendations . . . . . . . . . . . . . . . . . . . . . . . . . . . . . . 59
6 Conclusion and outlook 616.1 Conclusion . . . . . . . . . . . . . . . . . . . . . . . . . . . . . . . . . . . 616.2 Discussion . . . . . . . . . . . . . . . . . . . . . . . . . . . . . . . . . . . 62
Bibliography 65
A Online Review Analysis 71


ix
List of Figures
4.1 Overview of the number of trips per distance categories per mobilitytype (OViN 2015) . . . . . . . . . . . . . . . . . . . . . . . . . . . . . . . 38
4.2 Number of trips versus increasing trip distance (OViN 2015) . . . . . . 384.3 Percentage of cumulative number of trips versus increasing trip dis-
tance, same data as Figure 4.2, but in percentages (OViN 2015) . . . . . 38
A.1 Online review analysis overview . . . . . . . . . . . . . . . . . . . . . . 73


xi
List of Tables
4.1 Means of transport used during the whole week, work week andweekend in % (OViN 2015) . . . . . . . . . . . . . . . . . . . . . . . . . 35
4.2 Trip motivation during the whole week, work week and weekend in% (OViN 2015) . . . . . . . . . . . . . . . . . . . . . . . . . . . . . . . . . 35
4.3 Means of transport for time flexible and non-time-flexible motiva-tional categories in % (OViN 2015) . . . . . . . . . . . . . . . . . . . . . 36
4.4 Means of transport for time flexible motivations, with ’Shopping/Groceries’,which is part of time flexible motivations, singled out in % (OViN 2015) 36
4.5 Trip distribution, distance, time and speed per means of transport inurban and rural areas (OViN 2015) . . . . . . . . . . . . . . . . . . . . . 40
4.6 Trip distribution, distance, time and speed per trip motivation in ur-ban and rural areas (OViN 2015) . . . . . . . . . . . . . . . . . . . . . . 41
4.7 Trip motivation per urbanisation level and city size in % (OViN 2015) . 424.8 Trip mode of transportation per urbanisation level and city size in %
(OViN 2015) . . . . . . . . . . . . . . . . . . . . . . . . . . . . . . . . . . 424.9 Trip distance, time and speed per mobility type per urbanisation level
and city size in % (OViN 2015) . . . . . . . . . . . . . . . . . . . . . . . 434.10 Age distribution in urban and rural areas in % (OViN 2015) . . . . . . . 434.11 Frequency of PT usage in urban and rural areas in % (OViN 2015) . . . 444.12 Owned means of transportation in urban and rural areas in % (OViN
2015) . . . . . . . . . . . . . . . . . . . . . . . . . . . . . . . . . . . . . . 444.13 Social participation in urban and rural areas in % (OViN 2015) . . . . . 454.14 Different means of transportation used in journey with train or bus as
main means of transportation, in amounts and percentages (OViN 2015) 474.15 Average waiting times when switching to train or bus from other mo-
bility type in minutes (OViN 2015) . . . . . . . . . . . . . . . . . . . . . 474.16 Motivation of multimodal journeys with train and bus as main trips
in % (OViN 2015) . . . . . . . . . . . . . . . . . . . . . . . . . . . . . . . 484.17 Distance distribution of multimodal train and bus trips in %, e.g. within
a train and bus multimodal journey, 30.7% of the train trips is longerthan 50 kilometres (OViN 2015) . . . . . . . . . . . . . . . . . . . . . . . 49
4.18 Demography of different multimodal trips in % (OViN 2015) . . . . . . 52
5.1 Overview and one sentence summary of the found candidate featuresin the previous chapters . . . . . . . . . . . . . . . . . . . . . . . . . . . 54
5.2 Detailed overview of the found and discussed features labelled withimportance, implementation difficulty and stakeholder compatibility . 58


xiii
List of Abbreviations
B2C Business 2(to) ConsumerCBS Centraal Bureau voor de StatistiekFMLM First Mile Last MileNS Nederlandse Spoorwegen (Dutch railway company)OViN Onderzoek Verplaatsingen in NederlandP2P Peer 2(to) PeerPT Public TransportationVKT Vehicle Kilometres Travelled


1
Chapter 1
Introduction
This thesis is written as part of the Information Sciences curriculum at the RadboudUniversity, Nijmegen, the Netherlands. The research is performed at a startup com-pany called Going Dutch, located in Lochem, the Netherlands. With the knowledgegained during years of working with transportation planning, they are creating aunique car sharing service. Various untapped growth opportunities for car sharinghave been identified by Going Dutch and are used to define the subject of this thesis.
1.1 Motivation
Cars are one of the most used mobility types in today’s society. They provide a com-fortable, flexible and private way of travelling. Although private cars have manybenefits, downsides also exist. Most cars are stationary for a significant portion ofthe day and car ownership is expensive. As the number of cars on the road grows,congestion, parking issues and CO2 emission also increase.
A way to address these issues could be car sharing, a type of car rental for peoplewho want to rent a car to travel a short distance or for a short period of time. Carsharing provides its users with the benefits of a private vehicle, but removes fixedand unexpected costs, and delegates maintenance and repair responsibilities. Theadvantages are not limited to individual car sharing users. Car sharing increasesthe average daily usage time per car and decreases the time spent stationary, whichleads to less cars needed for everybody to fulfil their travel needs. Additionally, carsharing organisations use fuel efficient vehicles or even electrical vehicles, which isalso beneficial for the environment.
This sounds very promising and studies conducted at the end of the 20th centuryestimated that car sharing has a great potential. One study predicted a car sharingmarket share of 9% in Austria (Steininger et al., 1996), while another study predicteda potential of 600,000 customers for the Mobility Switzerland service (Muheim andReinhardt, 1999). Both studies turned out to be off by more than a factor of five. Whyis interest in car sharing not translated into usage?
1.2 Problem definition
Although the concept of car sharing shows potential, car sharing has not been aswidely adopted as was previously predicted. It is not for a lack of trying, as inGermany alone there are over 100 car sharing companies (Loose, 2010). Variousapproaches have been tried, but more opportunities can be distinguished to improvea car sharing service and capture a larger market share.
For long distance commuters who travel by private car, car sharing is not inter-esting because of the cost and the restriction of some services to return the car to

2 Chapter 1. Introduction
the pickup location. Car sharing is ideal to facilitate short trips, for example, forshopping or social activities, and to replace a second car.
Integration with PT is lacking for car sharing. In theory, car sharing would beideal for the so called ’first mile/last mile’ (FMLM) problem of a PT journey, asshared cars could be used to travel to or from a bus or train station. Current restric-tions limiting integration can be identified, such as returning the car to the pickuplocation as well as the uncertainty of availability. The PT coverage in urban areasis often better than in rural areas resulting in a FMLM less than one mile. While inrural areas, this might be multiple miles.
Most research conducted related to car sharing markets look at urban areas be-cause a higher population density leads to more demand and a bigger market. Withthe decline of PT coverage in rural areas in the Netherlands, these areas might be-come more interested in and interesting for car sharing services.
With the recent technological advancement of self-driving cars, new opportuni-ties arise for car sharing companies. The possibility for cars to relocate themselves,opens the ability to turn car sharing into an autonomous taxi service. The transitionto autonomous cars will not likely happen overnight, therefore car sharing compa-nies could already prepare to ease the transition and have the infrastructure in placeto support such a taxi system.
Given these opportunities are yet unexploited, research is needed to investigatethe feasibility of implementation.
1.3 Research objective
This study aims to find features for car sharing services which would increase theirutilisation and acceptance as a capable mobility alternative. A feature is a distinctiveattribute or element which, when implemented correctly, profits/benefits (or at leastnot harms) at least one stakeholder group. The considered stakeholders involvedwith car sharing are users, car sharing companies, governments, and the environ-ment. This thesis takes the perspective of users to identify wanted and unwantedfeatures.
1.4 Research approach
Three existing information sources are explored to analyse and synthesise informa-tion regarding people’s implicit and explicit mobility preferences. These sources arechosen for their accessibility, and for not being (fully) exploited yet. The first infor-mation source is literature. Literature is examined, and findings are analysed anddiscussed. The goal is to establish a knowledge base about what has already beenresearched in the field of car sharing and related people transportation. The focuslies on both discovering car sharing features as well as PT and private car features.Secondly, current experiences with car sharing services are analysed by looking atonline reviews. Within the reviews, user appreciation of the described feature isstudied. Thirdly, travel behaviour is analysed to confirm, contradict and extrapolateuser desired features. Finally, the gathered features are verified against each otherand the interests of other stakeholders, to create an overview of compatible and con-flicting features.

1.5. Research question 3
1.5 Research question
With the research objective and approach defined, the research question that thisthesis will try to answer can be formulated.
What are the key design features of a shared vehicle fleet to stimulate adoption and socialsupport amongst the general public?
As indicated in the motivation section of this chapter, car sharing has not grownas fast as estimated. Different car sharing companies have had varying degrees ofsuccess, but the number of users remains a small portion of the total population.To exploit all the advantages of car sharing, a larger user base is needed. To findhow more people can be attracted to use car sharing (adoption) and how to shapea positive public opinion (social support) about car sharing, car sharing servicesneed to fit the needs of society. These needs should be reflected in what features areimplemented in car sharing services. This research focuses on finding these featuresin literature, reviews and travel behaviour.
A vehicle fleet is defined as a group of motor vehicles owned or leased by abusiness, government agency or other organization rather than by an individual orfamily.
1.6 Roadmap
The thesis’ structure is derived from the three information sources described in theresearch approach section. Each source is discussed in a separate chapter. Thesechapters have one or two research questions related to the information source theywill analyse.
In chapter 2 candidate car sharing features are searched for in literature. In thischapter car sharing literature is analysed to answer the following question: What kindof candidate car sharing features can be found in literature? As alternative transportationmodes, PT and private car literature is reviewed to distinguish what people wantfrom a transportation service. The question that will be answered is: Which featuresfound in other forms of people transportation can be applied to car sharing?
In chapter 3 the online shared experiences of car sharing users are looked at togive insight into how people use and feel about car sharing. The question that willbe answered is: What are the experiences of car sharing users with car sharing and itscurrent features?
In chapter 4 a dataset with daily mobility in the Netherlands is analysed to differ-entiate between attitude and behaviour. These two do not always match. Therefore,it is important to not only look at what people think and say, but also how they act.This chapter will answer the following question: What kind of candidate features can befound in or deduced from travel behaviour?
In chapter 5 the found candidate features from the three information sourcesare discussed. They are analysed not only from the perspective of the user, butalso from the perspective of the other stakeholders. They are also compared againsteach other to find conflicting features and whether features depend on each other.Recommendations are formed and the research question is answered.
In chapter 6 conclusions are drawn about the research and the identified carsharing opportunities. The used information sources as well as future research isdiscussed.


5
Chapter 2
Literature review
The goal of this chapter is to find candidate car sharing features in literature, by look-ing at the advantages and disadvantages of different mobility types and analysingthe motivation and satisfaction of its users. As mobility types, in addition to carsharing, public transportation (PT) and private cars have been selected to be anal-ysed. PT is chosen, as integration with car sharing is identified to be an unexploitedopportunity. Private car is selected to find what motivates people to use a car asmobility type.
First, car sharing is discussed in-depth to create a better understanding of its differ-ent implementation forms, users and alternatives. Secondly, PT and private cars arediscussed. Thirdly, the future of car sharing is discussed by looking at the poten-tial of autonomous vehicles for car sharing services. Finally, important findings aresummarised and found candidate features are discussed.
2.1 Car sharing
Car sharing allows people to rent a vehicle for a short period of time, with the costof usage based on kilometres and/or time driven.
The first car sharing service is thought to be the Witkar project in the Netherlands(Bendixson and Richards, 1976), based on specially designed electric vehicles. Theservice had a total of 4000 registered users. A lack of governmental support meantthat Witkar would not continue after its experimental phase.
Studies conducted at the end of the 20th century (Steininger et al., 1996; Muheimand Reinhardt, 1999) indicated huge growth potential for car sharing services. Thispotential has not been transformed into success, with recent research in the Nether-lands (TNS Nipo, 2014; Jorritsma and Mobiliteitsbeleid, 2015) showing that only 1%of the Dutch population uses car sharing. TNS Nipo also found that 20% of the re-spondents is open to car sharing, indicating a still existing potential for the future.In 2015, the Dutch government partnered with private companies, such as Capgem-ini, Greenwheels, and SnappCar, to create Greendeal 2018 (Rijksoverheid, 2015), aninitiative to create more awareness, built and share knowledge, and start pilots andprojects to further scale car sharing. These types of collaboration are important forthe growth of car sharing. As Terrien et al. (2016) demonstrate, public and privateentity collaboration is crucial to create a successful car sharing service. They recom-mend special organisational structures, appropriate risk allocation and sharing, andbuilding tools to assess profitability.
Car sharing is growing all over Europe (Loose, 2010), besides the Netherlands,other countries such as Switzerland, show above-average growth rates. Both coun-tries were early experimenters with car sharing. However, Germany, also an earlyexperimenter, has not experienced the same growth yet. The implementation and
6 Chapter 2. Literature review
success of car sharing varies in all countries.
Within this section, car sharing will be investigated. First, its advantages and disad-vantages are looked at. Secondly, a description of the different types of car sharing isgiven. Thirdly, the users of car sharing are analysed by demographics, motivation,and usage. Fourthly, alternative services are discussed.
2.1.1 Advantages
The effects of the advantages of car sharing can be divided into three categories: theindividual, the transportation infrastructure, and the environment. The advantagesfor each category will now be discussed.
Individual
A car provides its users mobility in a way that other means of transportation cannot.Cities and road networks are designed around the use of cars. In the mid-nineteenthcentury, when a car was considered to be a luxury item and less people could affordit, the first clubs were created in which members shared the cost and usage of acar. The main motivation of these clubs was to gain the benefits of mobility withoutthe cost of ownership (Shaheen et al., 1998). Greater mobility remains one of theadvantages of car sharing, especially for people who do not own a car. Sharing thecosts leads to the next advantage. The fixed costs of owning a car are converted intovariable costs; you only pay when you need a car. The cost of insurance and upkeepare one of the most disliked features of car ownership (Millard-Ball et al., 2005). Also(unexpected) costs, such as maintenance and parking costs, are removed.
The effects of car sharing on car ownership has been researched in many stud-ies. (Shaheen et al., 2012) provide an overview of studies indicating the impact oncar ownership in North America. These studies show a range of 2.5 to 55% of theparticipants selling an owned vehicle and 7 to 70% of the participants avoiding a ve-hicle purchase. Not owning a car does not mean less mobility any more, but couldimprove mobility. The broad range of results for the different studies is caused byoutliers. For example, the average of the 17 studies exploring participants sellingtheir car is 25%, with 10 studies only deviating 1% from the average. This averagecannot be used, as not all studies can be weighted equally. Not all sample sizes areknown. It shows that the effects of car sharing depend heavily on implementationand location.
Car sharing services offer different types of vehicles, so users have the possibilityto choose the type of vehicle that best suits the needs for their trip. For example, asmall car will suffice to visit a friend, while a shopping trip might require a biggercar to fit the purchased goods.
Transportation infrastructure
In this thesis, the transportation infrastructure includes all means of transporta-tion and infrastructure used to travel. With motorised mobility in cities estimatedto double between 2015 and 2050 (OECD, 2017), the danger of overloaded roadswithin cities exists. This would decrease mobility within cities, as cars and buses arestuck in traffic more frequently. The influence of car sharing on reducing car own-ership, could help weaken this growth. Another positive effect of car sharing thatwould contribute to better mobility, is an increase in cycling, walking and PT usage

2.1. Car sharing 7
(Millard-Ball et al., 2005; Martin and Shaheen, 2011b). This will be discussed morein-depth later in this chapter.
Less car ownership can lead to an increased parking availability, as less cars needto be parked. This could lead to a reduced need for parking spaces, decreasing theamount of parking spaces that need to be built in new development areas, allowinga different allocation for land. Cars also spend less time idle, decreasing the timespent stationary on a parking location. Some car sharing companies offer users oftheir service dedicated parking spaces, which users describe as an attractive feature(Millard-Ball et al., 2005). Parking privileges also increase car driving efficiency, asless time is wasted searching for a parking location.
A commonly mentioned advantage is a reduction of congestion. Decreasing carownership, reduces the number of cars present on the road at the same time. Al-though mentioned in multiple studies, it has not been studied in a real-life scenarioyet. Congestion decrease caused by car sharing is currently difficult to prove, as carsharing needs to be widely adopted before this effect can be noticed. Predictions canbe based solely on estimated car ownership decrease, not measured car ownershipdecrease.
Environment
The positive impact of car sharing on the environment include less vehicle travel andlower emissions (Martin and Shaheen, 2011a; Shaheen and Chan, 2015). Less vehicletravel and the use of more fuel efficient or electric cars results in lower emissions.
Not only are cars used less often because of car sharing, the total amount ofkilometres driven with cars, Vehicle Kilometres Travelled (VKT), is also lower. (Sha-heen et al., 2012) provides an overview of change in average VKT in North Americacaused by car sharing. The VKT decrease ranges from 3 to 73%. As discussed in theadvantage of the individual section, this wide range of results is caused by outliers.The average decline in VKT is 42%, with five of the 13 studies within a 5% deviation.Meijkamp (2000) showed in a study of four car sharing services in the Netherlands,the average yearly kilometres of car sharing users declined by 33% after becominga member. Of the people who substituted their private car for car sharing, the de-crease in VKT is even larger (65%). The frequency of trips does not decrease, but cartravel is replaced by bike, train or bus use.
Participants in a Dutch car sharing research travelled an average of 1600 km lessper year by car than they did before (Nijland et al., 2015). This results in an estimated8 to 13% less CO2 emissions. Estimations show, if 10% of the car users in the Nether-lands would use car sharing (10 times more than currently) and they would alsodrive 1600 km less per year, this would result in a VKT reduction of maximally 1.3billion km, a decrease in of the VKT in 2020 of 0.5 to 1% (Jorritsma and Mobiliteits-beleid, 2015).
However, a decrease in VKT might not be directly achieved. (Cervero et al.,2002a) found members of a San Francisco based car sharing service actively usingthe service for nine months drove farther, longer, and logged more VKT than mem-bers driving private vehicles. They conclude that this specific car sharing servicestimulates motorised travel. This could be caused by the fact that two-thirds of themembers came from carless households.
New research was performed four years later at the same company to look at thelong-term effects of car sharing. Now they found that the average VKT of membersdecreased compared to non-members (Cervero et al., 2006). The sale of private carsand abstaining from buying an additional car were found to explain this finding.

8 Chapter 2. Literature review
Also, the way car sharing is implemented, influences the VKT. Model simula-tions found that introducing car sharing only in inner London would have littleinfluence on the VKT driven in cars (Le Vine et al., 2014). However, introducing theservice across London would result in a decrease in VKT.
As is mentioned in the above discussed studies, it is important to keep in mindthat participants of surveys who are asked to indicate their VKT before and afterjoining car sharing, need to make an estimation. Errors and biases can creep intotheir estimations. Another limitation is that the results only provide a snapshot, asthe frequency, timing, and location of mobility of people is susceptible to change.
2.1.2 Disadvantages
To use a car sharing service, people need to have an account registered at a service.The registration process is an entry threshold. First time impulsive usage is notpossible because all services need a copy of your driver’s license in order to register.
It is unknown when car sharing is financially beneficial. Looking at the price pertrip for car sharing gives a wrong impression of the cost of car sharing. Car ownersusually only take fuel costs and not fixed costs into account when estimating thecosts for their car trip. The car sharing price includes fixed and fuel costs. Therefore,a single car sharing journey seems more expensive. However, car sharing is cheaperthan owning a car if the annually driven kilometres stay below a certain limit. Thislimit ranges between 10,000 and 16,000 kilometres (Litman, 2000; Shaheen and Co-hen, 2007; Bert et al., 2016), depending on location and organisation. No definitivelimit exists, which increases the uncertainty for people whether car sharing wouldbe financially beneficial for them. There are too many external factors (car sharingcosts, fuel costs, fixed costs of private car) to consider to provide one fitting answerfor everybody.
For new or potential users, the availability of a car could also be a threshold. Thepossibility exists that no car is available close by. It is up to the car sharing companyto minimise this risk and guarantee that each user can travel to their destination. Ifa service is not reliable, people could get stranded.
A large disadvantage of car sharing related research is the difference betweenwhat people answer in a survey and what they actually do. Research indicates alarge potential for car sharing as described in the introduction of this section. Theinterest does not translate into actual users. This is a common phenomenon in be-havioural change surveys (Wong and Sheth, 1985), but could also be the indicationthat car sharing services are missing a killer functionality for a larger public.
2.1.3 Types of car sharing
Following the discussion of the advantages and disadvantages of the general idea ofcar sharing, an overview is given of different models of car sharing.
1. Business-to-consumer (B2C)A company owns a fleet of vehicles which consumers can rent. This variant canbe split into two categories.
(a) Round trip car sharingThe rental period is started and ended at the same location. (e.g. Green-wheels)

2.1. Car sharing 9
(b) One-way car sharingA rented vehicle is picked up from a location and can be dropped off atanother location within a designated operating area. (e.g. Car2go)
2. Peer-to-peer (P2P)The shared cars are owned by and rented to individuals. All P2P services use theround trip principle.
(a) Business intermediaryPrivate car owners list their car on a platform where other people can applyto rent it. (e.g. Snappcar)
(b) Neighbourhood sharingA group of people buy a car together, allowing everybody to use the carwhen needed.
Research from CROW-KpVV (2016) shows that the recent growth of car sharing inthe Netherlands can largely be contributed to P2P car sharing. P2P is easier to scale,as one of the problems of the B2C model is the large investment needed to expand avehicle fleet and to keep the fleet up-to-date.
Knowledge about round trip car sharing might not be directly transferable toone-way car sharing (Becker et al., 2017). Round trip is found to complement PT,while one-way is more often used as an alternative to PT (Le Vine et al., 2014). One-way provides more freedom than PT and round trip. Furthermore, it does not poselimitations in terms of travelling back to the starting location. Le Vine et al. alsofound that the two B2C categories have different market potentials. One-way carsharing in London was found to have a three to four times larger number of potentialsubscribers than round trip car sharing.
Münzel et al. (2017) find that the car to inhabitant ratio for both B2C categoriesis not significantly different, even if their operating areas have different populationdensities. Their fleet sizes vary significantly, but for both categories operating in ur-ban areas, the number of cars per 1000 people is about equal to 0.24.
Besides these differences, a distinction between parking locations can be made.
1. Station basedThe rental period can only be ended in a special parking space, created and re-served for cars owned by the car sharing company.
2. Free floatingThe rental period can be ended by parking the car in any parking space.
Round trip car sharing is mostly combined with station based parking locations,while one-way car sharing offers both types of parking options.
The most suitable markets for station-based round trip car sharing are dense ur-ban areas with good PT coverage (Stillwater et al., 2009; Grasset and Morency, 2010).Station-based car sharing is heavily influenced by the type of PT that is available.Light rail, such as metros and trams has a positive effect on car sharing demand.On the other hand, regional rail has a negative effect on car sharing demand. Itshould be considered that Stillwater et al. note limitations of the available data, suchas sample size and biases.
New members of a car sharing service are found to increase cycling, walking andPT usage (Katzev, 2003; Millard-Ball et al., 2005; Martin and Shaheen, 2011b). Thiscould have several explanations. Firstly, it could be that car sharing users are more

10 Chapter 2. Literature review
aware of the impact of driving a car and are for that reason more actively trying tominimise its usage. They are only a member of a car sharing service for the inciden-tal need for the mobility offered by a car. Secondly, the cost per trip seems higher forcar sharing than for a private car. Part of the otherwise fixed costs are included inthe trip cost. The higher one-time cost could motivate people to use a different mo-bility type. Contrary to the above-mentioned studies, one of the outcomes of a freefloating car sharing study shows that non-car owners who start using car sharingreduce their bike, walk and PT trips (Firnkorn, 2012). Both Martin and Shaheen, andMillard-Ball et al. do not indicate which type of car sharing service is researched,but both have a large sample size. Free floating might offer people more freedom intheir mobility and as a result replace other mobility types. Other possible reasonsfor the different outcomes could be the novelty effect. The participants in the studyperformed by Firnkorn might be newer users than those of the other studies. Be-cause of this novelty, they use the service more often, but their usage might decreaseover time.
2.1.4 Users
In this section, the users of car sharing are analysed. First, the demographics foundin literature is examined. Secondly, the motivation to use car sharing is described.Thirdly, the most used trip types are discussed. Lastly, liked and disliked feature areconsidered.
Demographics
Several researchers have tried to characterise the demographics of car sharing mem-bers. Car sharing users are found to be well-educated (Katzev, 2003; Burkhardtand Millard-Ball, 2006), live in below average size households (Millard-Ball et al.,2005) and live in medium to high density areas (Cervero et al., 2002b; Burkhardt andMillard-Ball, 2006).
However, no differentiating results are found regarding the income of car sharingusers. Costain et al. (2012) found that car sharing is popular among low income,while Millard-Ball et al. (2005) found it to be popular among middle to high incomegroups. Given the cost reduction advantage of car sharing, low income groups couldbenefit the most. However, it would only be beneficial if their kilometres per yearare below a certain limit, as discussed in the disadvantage section of car sharing.
Research indicates that a large part of car sharing users are relatively young(Burkhardt and Millard-Ball, 2006) and range between 25 and 40 years old (Millard-Ball et al., 2005; TNS Nipo, 2014; Kim et al., 2015). This might not be the actual or theonly user group for car sharing as car sharing is still considered an early innovation.The characteristics described in this section show similarities to the demographics ofearly adopters (Hobrink, 2014; Kennedy and Funk, 2016). The demographics couldchange when car sharing becomes a more established service.
Motivation
As described in the car sharing advantage section of this chapter, car sharing re-moves the fixed costs of car ownership and can lead to financial savings when theannually driven kilometres of a member are below a certain limit. This advantageis also reflected in research, showing that financial benefit is recognised by car shar-ing members as a big motivation. Financial motives were found to be the primary

2.1. Car sharing 11
reason of becoming a car sharing member in Austria (Steininger et al., 1996) andLeiden, the Netherlands (Meijkamp, 2000). Other studies found it to be a secondarymotivation (Katzev, 2003), with the occasional need for a vehicle being the primarymotivation.
Four motivational patterns found by Schaefers (2013) also indicate costs and con-venience as important incentives to become a car sharing member. The third pattern,lifestyle, describes an affection for the recognisability of the cars. Other members canbe recognised and create a feeling of a car sharing community. The fourth pattern isan environmental motivation, based on environmental awareness and the perceivedsustainability of car sharing.
Other motivations are a perceived greater convenience or shorter trip time com-pared to PT (Meijkamp, 2000; Kim et al., 2017). This last motivation is most promi-nent for off-peak travel, when PT trip frequency declines (Costain et al., 2012).
Trips
Car sharing trips are different than the average private car trip. Owned cars aremostly used to commute, while car sharing use does not follow a pattern. Car shar-ing trips are more occasional trips and its usage pattern varies (Millard-Ball et al.,2005). Millard-Ball et al. found that the average number of trips of car sharing mem-bers per month is two. These trips are made when things need to be carried, a car isneeded to get to the destination or multiple stops have to be made. Car sharing tripsare short trips because of the way the price is calculated and that rental periods canonly end in certain areas.
Research in the Netherlands found that the most common trip motivations arevisiting family or friends (15%) and days trips/recreational activities (14%) (TNSNipo, 2014). Other categories are not shown.
Car sharing research in Toronto, Canada, also found that trips are mostly socialor recreational trips (Costain et al., 2012). They also found that car sharing is usedfor shopping. Car sharing is observed to have a higher frequency of usage duringthe weekends.
A study in Switzerland found social activities and shopping the main purposeof car sharing (Becker et al., 2017). An interesting difference was found betweenone-way and round trip car sharing. Round trip is significantly more popular thanone-way for transporting goods and leisure activities. On the other hand, one-wayis significantly more popular for visits and commute.
Features
Research focused on wanted features in a car sharing service has already been con-ducted. Recent research conducted in the Netherlands using a large-scale survey,found that people want a cheap and flexible free floating car sharing service, whichincludes reserved parking for car sharing users (Dieten, 2015). This study uses arandom sample of the Dutch population, not current car sharing users.
Costain et al. (2012) found that accessibility is the most important feature. Withaccessibility, the distance between the start location of the user and the nearest carsharing parking lot is meant. However, even if a user lives in close proximity of aparking space, the availability is crucial (Kim et al., 2017). It is important that whensomeone wants to use a car, one is available for direct usage. This is even moreimportant when car sharing is used for the last mile because that leaves less roomfor flexibility. A user could get stranded because no car is available or they have to

12 Chapter 2. Literature review
wait for a very long time. This would decrease the (perceived) reliability of the carsharing service.
Although people acknowledge car sharing to be less expensive than owning acar, even describing it as one of the best features, the hourly and mileage costs arealso ranked highly on the negative feature list (Millard-Ball et al., 2005).
2.1.5 Current situation
Car sharing is located in densely populated areas with limited parking spaces (Millard-Ball et al., 2005; Burkhardt and Millard-Ball, 2006; Shaheen and Cohen, 2007; Loose,2010). This is also found in research into how specific car sharing companies aredoing. These companies are based in big cities, such as Toronto (Costain et al., 2012),Amsterdam (Suiker and Elshout, 2013), San Francisco (SFMTA, 2017), and Bremen(Glotz-Richter, 2016). Glotz-Richter (2016) found that in Bremen, every shared carhas taken 15 private cars of the road, resulting in a total of 3700 less private carsalready. The government has actively been trying to help and promote car sharingby dedicating parking spaces to car sharing and making them stand out. Newly de-veloped areas have to comply to new regulation regarding houses to parking spacesratios and are incentivised to integrate car sharing into the infrastructure. This col-laboration between different parties has helped car sharing grow in multiple citiesand is required to make car sharing a success. As described in the previous section,the demographics of car sharing users currently shows a lot of similarities with thebehaviour of early adopters. A partnership between private and public entities canhelp car sharing companies reach mainstream customers (Terrien et al., 2016).
More local governments are becoming interested in integrating car sharing intotheir current transportation infrastructure. For example, the municipality of En-schede wants to create a service that allows their employees to travel to and fromwork by car, while the car is used by other people during office hours (Tubantia,2017). For car sharing companies these initiatives are a great way to increase theircustomer base.
2.1.6 Alternative services
In this section, alternative services for car sharing will be discussed.
Bike sharing
Another solution for the FMLM of a journey is the shared bike. These bikes canusually be found at train stations where people can rent them for a fixed amount ofmoney for a certain amount of time. In the Netherlands, the biggest bike sharinginitiative is owned by the Dutch Railways (NS). Their fleet consists of simple bikesin a recognisable colour scheme located near train stations. It has become such asuccess that supply cannot keep up with demand (Lieshout, 2016). A disadvantageis that you always need to return the bike to a station again, so it can only be usedfor round trips. Bike sharing is a competitor because it provides people with meansof transport to increase the door-to-door mobility.
Taxi services
Traditional taxi services can be seen as competitors for car sharing. Taxis offer adoor-to-door service, but require some time before getting to your start location andcannot compete with car sharing in terms of price.

2.1. Car sharing 13
Alternative services, such as Uber and Lyft, are more direct competitors. Theirprice is most of the time lower than a taxi service. These services are barely activein the Netherlands, so in the Netherlands they are not yet a car sharing competitor.However, on the global market and especially in the United States where Uber andLyft are expanding rapidly, both companies are and will be car sharing competitors.
Musk (2016) wrote in his Tesla master plan update about the company’s visionregarding the future of Tesla and the autonomous functionality of their cars. Whenautonomous driving is made legal and technologically possible, Tesla wants to allowcar owners to tell their vehicle to turn into a taxi and earn money. The car becomespart of a fleet of vehicles who will pick people up and drop them off where theywant. This implementation has a lot of similarities with car sharing and their pos-sible future when autonomous driving is available. Autonomous vehicles in combi-nation with car sharing will be discussed later in section 2.4.
Private lease
Vehicle leasing allows the leaseholder to use a car for a fixed period of time (at leastone month) for an agreed upon amount of money. The lease company is still theowner of the car. Monthly terminable contracts for private lease cars can be seen asan alternative for car sharing. Companies, such as Helder and Dealerleasing takeaway the maintenance and reparation responsibilities for its users, comparable tocar sharing. However, the fixed costs remain. The monthly terminable contractsalso allow more freedom in switching between different car sizes.
Car rental
Car rental can be seen as the precursor of car sharing. A car is usually rented for oneor more days instead of a few hours and the rental expenses excludes fuel costs. Bothcar rental and car sharing include an own risk policy, which can be brought down bypaying an extra fee. The main difference is that rental cars need to be picked up at aservice location and that paperwork needs to be signed. Most car rental companiesrequire you to return the car to the pickup location or ask for an additional fee toreturn it someplace else. Car rental companies also need a deposit.

14 Chapter 2. Literature review
2.2 Public transportation
In the Oxford dictionary, public transportation (PT) is defined as: "Buses, trains, andother forms of transport that are available to the public, charge set fares, and run onfixed routes" (Dictionary, 2017). PT is not directly demand driven, because schedulesare created in advance, to which the drivers have to stick. In the Netherlands, PT isusually subsidised by the government and thus has governmental involvement. Thegovernment is actively thinking about how to improve the current PT situation andhas recently released their view of PT in 2040 (Rijksoverheid, 2016b). Providing mo-bility in areas of low demand, connecting economic core areas as well as increasingmobility, sustainability, and innovation are some of the presented core ideas. Carsharing is also named as one of the upcoming innovations related to the increase ofdigital applications within PT.
In this section, the advantages and disadvantages of PT are discussed. After that, PTusers are described, followed by a discussion about travel satisfaction.
2.2.1 Advantages
Travellers with PT have few responsibilities and do not constantly need to pay at-tention. Since they are not driving, they have time to relax, rest and/or read. Thisreduces the stress of travelling and makes the time spent travelling feel like less ofa waste. Social interaction in the form of talking to other people on a vehicle is alsopossible. The usage of bus lanes in cities or on highways during rush hour alsoincreases the travel time efficiency.
PT has a lower emission of harmful gases into the atmosphere. Efficiency isincreased, because more people travel in a single vehicle. PT companies are ac-tively trying to become more environmentally friendly. Examples are the agreement,signed with all transport operators, that all new buses from 2025 onwards will beemission free (Rijksoverheid, 2016a) and the since January 2017 wind farm energypowered Dutch Railways (NS) trains (NS, 2017).
The cost of travel with PT is lower than the cost of travelling by car. Fuel costsare shared over a larger number of people and part of the costs is subsidised by thegovernment. Although this is also acknowledged by car owners (Beiraõ and Cabral,2007), it is not seen as a key factor to switch to PT. The disadvantages outweigh theadvantages.
2.2.2 Disadvantages
Handing over the driver responsibilities also has disadvantages, as it can be per-ceived as a lack of control. This lack of control is not only available while driving,but also while planning a route or waiting for a ride. A user is dependent on thetime his ride leaves, at what frequency, and where the journey starts and ends. PTdoes not provide a door-to-door service, so people first need to travel to a dedicateddeparture spot. A bus driver is not allowed to deviate from his route to stop at thefront door of somebody’s home. This reduces the personalisation and flexibility oftravelling.
If a user needs to transfer within one journey to reach his destination, waitingtimes increase the total journey time. This feels like a waste of time, because noprogress is made. Delays can cause missed transfers and increase the total journey

2.2. Public transportation 15
time even more. This reliability issue is limiting the willingness to travel with mul-tiple mobility types within one journey.
Other disadvantages are the lack of privacy, especially if it is crowded. Personalspace can be limited if a lot of people are trying to get into the same vehicle. Avehicle can be so crowded that people need to stand during the journey. This, incombination with a lack of comfortable chairs, make a PT journey less comfortable.It is also difficult to travel with big or a lot of baggage or goods because of spaceconstraints.
2.2.3 Users
Many people travel by PT every day. For some, it is their daily commute, whileothers use it to travel to a social activity. People use PT for a different reason andwith a different mindset. A commuter might want a silent journey, so he can getsome work done, while a tourist might want to chat with his fellow travellers. Acommuter does not need to receive a lot of information, because he has the wholetrip memorized. A tourist needs extra information, otherwise he might miss his stop.This large difference in motivation, frequency, and knowledge makes it impossibleto create one PT system that would fit everybody’s needs. Research needs to make adistinction between different types of passengers. Van Hagen (2009) found six typesof passengers in his research for the Dutch Railways (NS) and created personas foreach passenger category. These are used to educate their conductors to quickly spotwith what type of person they are dealing with and what the best way to providethem information is.
2.2.4 Satisfaction
Besides the differences in individual travellers, also a difference exists between thedesires of a PT provider and a PT user. A provider might measure success rate inthe number of vehicles that leave and arrive on time. However, if a bus waits twominutes to catch the transfers of another bus who is slightly delayed, this would notcount as a success, but would increase user satisfaction. There is a conflict betweenthe late arrival of a bus at a station (supply-oriented) and the late arrival of a trav-eller at his final destination (demand-oriented) (Rietveld, 2005). Another exampleis that a provider looks at the mean interval between buses at a stop or the averagefrequency, while a user looks at the mean waiting time. Rietveld (2005) says thatsupply-oriented measurements underestimate problems because the average qual-ity is taken. However, bad quality tends to coincide with busy periods, resultingin more people having a bad experience. Good quality tends to coincide with quietperiods, with less people having a good experience and thus not cancelling the badexperience out. Rietveld argues that providers should consider both supply- anddemand-oriented quality measures to create a better indication of their overall qual-ity. Parkan (2002) also found that the evaluation criteria that a PT company usesare different from the criteria that a user values highly. The performance measure-ment method Parkan created for their client, incorporating both the productivityand quality, helped them gain insights to improve their performance.
Although PT providers may not directly take user evaluation into account, severalresearchers have already been exploring this field. Both Chowdhury and Ceder(2013) and Redman et al. (2013) found that reliability is the most important PT aspect.It is crucial for users to know that they can finish the journey they started and that

16 Chapter 2. Literature review
they will get to their destination within a reasonable time frame. Big delays are dealbreakers and cause anxiety among travellers (Cheng, 2010). Other anxiety causingproblems include crowding, inner journey transfer and finding the right platform.Crowded vehicles are a big problem and one that is difficult to solve because thedemand for PT fluctuates a lot during the day. During the morning and afternoondemand peaks, while in between the demand is much lower. People who travel bycar are also affected by these peaks, but sit in the comfort of their own car. To rivalprivate car travel and become a better transportation system, PT needs to offer thesame or an improved comfort and convenience (Brownell, 2013). The speed, comfortand crowded aspects were also found by Hart (2012), in addition to higher customersatisfaction amongst incidental and elderly (65+) travellers. These groups are oftenless time bound and have different travel motivations than the regular travellers.
Other research indicates that the average satisfaction of people who have used PTis higher than of people who do not use PT (Guiver, 2007; Harms, 2008). Both Guiverand Harms find that the more frequently one uses a particular means of transport,the more positive one’s judgement. In Harms (2008), thirteen product features weredefined (such as comfort, price, speed and flexibility) and people were asked abouteach feature whether it fits with the car, bike and PT when used for commute andleisure trips. For both trip types, the safety of PT is highly regarded in comparisonto other defined characteristics. But in none of the categories does PT score higherthan the car or bike. The only other category in which PT comes close to the car is inthe low price category.

2.3. Private car 17
2.3 Private car
A private car user is seen as somebody whose daily travels are performed largely orin total by private car.
In this section advantages and disadvantages of private car ownership and usageare given. Followed by a description of its users. Finally, private cars are comparedto PT.
2.3.1 Advantages
For an individual car user, direct benefits can be noticed. First of all, using your carfor a single trip seems cheap. Costs are only made during a trip if a car needs to berefuelled. All other costs (except damage and maintenance costs) are fixed costs thatare not considered when planning a car trip.
Secondly, a car gives its owner a sense of freedom and independence (Hiscocket al., 2002; Hagman, 2003; Guiver, 2007). Cars provide flexibility because they canbe used when the owner requires it, without the need to check whether the car isavailable. They do not depend on other people, except, for example, when one car isshared between multiple people in one household. The road infrastructure has beendesigned around car usage, allowing car drivers to get practically everywhere. Witha car, you can literally drive from door to door without getting out of your vehicle.The large number of roads and the car’s travel speed, allow drivers to get to theirdestination fast.
Thirdly, a car provides privacy (Gardner and Abraham, 2007), personal space,comfort, and a sense of control over your environment (Guiver, 2007). You can leavestuff behind in your car and no one will judge your song preferences.
Lastly, with car ownership comes an attachment to the car and a social status.Buying a car is a big investment, so people carefully select which car they want todrive. Once the investment has been made, people become attached to their car orsee it as a reward for their hard work (Hiscock et al., 2002; Beiraõ and Cabral, 2007).
2.3.2 Disadvantages
The disadvantages of private cars can be divided into individual and collective dis-advantages. These two categories are not mutually exclusive.
One of the disadvantages for an individual user is the cost of car ownership.These costs can be divided into fixed costs (taxes and insurance), running costs(maintenance, fuel, and parking fees), and unexpected costs (fines and repairs). Overtime, the monetary value of a car depreciates, which also needs to be considered.
Not only parking costs are a disadvantage, also the difficulty to find a place topark is. The unavailability of a parking space in close proximity of the final desti-nation extends the journey time and induces stress. Other stress generators can bedriving in general or driving in congested traffic during rush hour.
Congested traffic is a problem on both an individual and collective scale. Thenumber of road vehicles in the Netherlands has been growing with 1.5% annuallyfor the last two years (CBS, 2016a; CBS, 2017d), while annually driven kilometreswith road vehicles also increased slightly (CBS, 2015; CBS, 2016b). In the first quarterof 2017, the total congestion increased by 3% compared to last year (ANWB, 2017).Worldwide the number of private cars is also increasing (OECD, 2017). Congestion

18 Chapter 2. Literature review
leads to irritation and wasted time.
The advantages and disadvantages of private car ownership and usage are clear,but they do not all have the same weight when evaluated by users. Hagman (2003)found that personal and direct experiences form perceived advantages and disad-vantages. However, information acquired via scientific research related to the neg-ative effects on the environment is relativised. Therefore, Hagman (2003) proposesthat researchers should focus on the way interviewees present their arguments, ratherthan their actual arguments.
The cost of ownership is a directly experienced disadvantage. However, trav-ellers often exclude road tax, insurance and maintenance when asked about thetravel expenses of using a private car (Gardner and Abraham, 2007). Participantsin this study did not mention environmental issues regarding car use. They weremore concerned with minimising journey time and effort, and personal space.
2.3.3 Users
Just like with PT users, different categories exist in which travellers can be placed.Jensen (1999) divides car drivers in three different groups: passionate car drivers,daily life car drivers, and leisure time car drivers. All the three groups like cars forthe freedom and independence they offer.
Both Tertoolen et al. (1998) and Jensen (1999) find that car owners are aware ofthe environmental impact of car usage, but that they are unwilling to change. It isconsidered ineffective because the environmental impact when they stop driving isperceived to be small. Other people will continue to drive cars, which is consideredunfair. They are only willing to change if everybody changes (Jensen, 1999). Highertaxes to discourage car ownership could result in car owners to believe that theirpayments give them a right to pollute (Tertoolen et al., 1998). Their research suggeststhat requesting individual drivers to reduce their car usage is not the best way toachieve less car usage. Cars give its users convenience, reliability, and a sense ofprestige and mastery. These benefits need to be taken into account when policies arecreated to encourage people to lower their car travel or switch to a different mobilitytype (Hiscock et al., 2002; Ellaway et al., 2003). The societal norms would need tochange to motivate large groups of people to reduce their car travel.
2.3.4 Private car versus public transportation
A lot of the differences between private car and PT travel can be traced back toindependence. Private car users are not dependent on fixed travel times, locationsand frequency, and other users. They can exert more control over their journey.This flexibility is one of the features that is missed in PT and creates a preferencefor private cars (Jensen, 1999). Research indicate that car drivers also enjoy drivinga car and use it as a means of self-expression (Halko, 2012), which is not sociallyseen the same with PT. The time spend travelling with PT is considered a wastedtime compared to the travel time with cars (Gardner and Abraham, 2007). This iscounter intuitive, because when travelling with PT the user does not have to focuson driving. This permits him/her to do other things, such as work or read, whiletravelling.

2.4. Autonomous vehicles 19
2.4 Autonomous vehicles
The continuous advancement of technology result in more and more applicationsof artificial intelligence. One of these applications are autonomous vehicles (AVs).The increase in test pilots and talk about legislation indicate that self-driving vehi-cles could become the next big technological invention for motorised transportation.AVs could have a big impact on the way car sharing will work in the future. There-fore, AVs will be discussed.
First, the general advantages and disadvantages of autonomous vehicles are dis-cussed. Then literature about the different levels of adoption of AVs and the timeframe of these adoptions are considered. Next, the collaboration between AVs andcar sharing is examined.
2.4.1 Advantages
The first advantage of self-driving cars is that people do no longer need to drive acar themselves. Some people experience driving a car as stressful and only drivebecause of the mobility. An AV would take away this stress, and potential stressfulsituations and allows its passengers to do something unrelated to driving. For ex-ample, people can play games, read or watch a movie, while commuters can workwhile travelling to not waste any productive time. This also means that it allowspeople to travel by car who could not before because of age or a physical disability.A larger group of people can experience the same mobility.
Also, the safety of driving will increase because driver errors can be eliminatedand cars have a faster reaction time than humans. Cars are never sleepy, in a badmood or drunk. It is estimated that human behaviour plays a part in more than 90%of road accidents in the United States (NHTSA and USDOT, 2015). Safety can alsoincrease by communication and coordination between vehicles and infrastructure.AVs can warn each other about road conditions, and traffic jams, while intelligentinfrastructure can calculate the optimal speed for vehicles to maximize throughputand improve traffic light efficiency. Vehicles can drive closer to each other, increas-ing the road capacity. The communication between cars prevents unexpected andunnecessary braking, which could otherwise result in traffic jams.
AVs need less parking spaces, because they can drop their passengers off andcontinue driving. Currently, it takes drivers in down town areas on average 8.1 min-utes to find a parking space (Shoup, 2006). This results in wasted time, extra traffic,congestion and pollution. If the found parking space is not close to the destination,additional time is wasted by walking.
AVs also help reduce pollution by increased fuel efficiency as they can be pro-grammed to drive more efficiently and drive closer together to benefit from eachother’s slipstream.
2.4.2 Disadvantages
Although AVs are expected to drive safer than humans, the technology still needs toprove itself to be totally safe. The cars that are driving around in the United States atthe moment have a safe track record, but their current total mileage can statisticallynot be extrapolated to conclude that AVs are safer (Kalra and Paddock, 2016). Kalraand Paddock estimates that AVs would have to drive hundreds of millions of kilo-metres to confidently say that they are more reliable than a human driver. However,

20 Chapter 2. Literature review
they note that the adoption of AVs does not only depend on the amount of testing,but mostly on the social acceptance.
This social acceptance also depends on the acquisition cost of an AV. The sensorsand development costs that are required to create an AV, make it a more expen-sive alternative than a traditional vehicle. Also, the investments required to create asmart road infrastructure need to be funded.
The lowered threshold of usability for a wider audience, including people with-out a driver’s license, induces more vehicle travel. The car will be used for moretrips increasing the road congestion.
Other concerns about AVs are related to security and privacy. AVs should have ahigh level of security because it must not be possible to hack a vehicle and potentiallylet it crash. This means that AVs should have the possibility to be kept up-to-date,potentially over the air, and that AV manufacturers should regularly provide secu-rity updates for older vehicle models. These updates should pass rigorous testingbecause nothing is allowed to go wrong when a customer is driving in a vehicle.Worries about the privacy about AV drivers exists because AV cars have a lot moresensors and collect a lot of data. This data can be used to improve the algorithmsand the intelligence of AVs, but also contains personal data from the travellers, suchas pickup time and location as well as drop of time and location. If behaviouralpatterns fall into the wrong hands, criminals can know at what times people are atwhich location and pick the optimal time to rob their house.
Currently, AVs do not function correctly under all weather conditions. A lowhanging sun (Yadron and Tynan, 2016), snow or rain can blind the cameras or de-crease its accuracy. Reliability in all weather is important to support total vehicleautonomy.
Having AVs driving around on the streets could also influence other road usersto behave less safe (Litman, 2014). For example, pedestrians might think that AVswill constantly monitor the environment and can anticipate every situation with fastreaction times. They will be less careful at cross walks, because they expect the carsto stop.
2.4.3 Level of adoption and time frame
Various research has been conducted to find the public opinion, potential and timeframe of autonomous driving. Daziano et al. (2017) researched the willingness ofpeople to buy autonomous functionality for their vehicle. They found that house-holds would be willing to pay on average $3500 for partial automation and $4900 forfull automation. It is important to note that these are averages, because one third ofthe respondents said they would not pay at all, while another third said they werewilling to pay over $10,000. This indicates that the public opinion regarding AVsvaries, especially if they need to pay extra to gain access to the functionality.
Recent research in the Netherlands found that more than half of the 1500 partic-ipants (55%) say that they want to be the driver in a car (Zelfsturing.it, 2017). Onethird of the respondents does want the AV functionality.
Instead of implementing autonomous possibilities directly into new vehicles, adifferent approach has been suggested. By iteratively increasing the autonomousfunctionality of cars, people will more slowly get used to it and experience its advan-tages. Examples of these autonomous functionalities are tracking lane boundaries,adaptive cruise control and collision warnings. Ford indicated in 2012 that they havethe technology ready to support autonomous driving, but that they found that cardrivers are not ready yet (Fitchard, 2012). People are uncomfortable with the idea of

2.4. Autonomous vehicles 21
sitting in a car that drives autonomously, but are open to the idea of intelligent andenvironment aware vehicles. Brownell (2013) proposes to first create a communica-tion network for cars to establish inter car communication and then move towardsthe cultural acceptance of fully autonomous cars.
The American National Highway Traffic Safety Administration(NHTSA) agreeswith the incremental integration of autonomous functionality into new cars and de-scribes four levels of AVs, with each higher level increasing autonomy and decreas-ing driver monitoring (NHTSA, 2013). The two highest levels of autonomy do notrequire a user that is actively engaged in driving activities. The NHTSA is currentlyinvestigating the best practises to implement autonomous functionality.
Several predictions are made regarding the time frame in which AVs would be-come accepted and integrated in the transportation system. This ranges from withina couple of years to the end of the century. Litman (2014) thinks that during the2020s AVs are likely to be expensive novelties and estimates that it takes until 2060-2080 before the large benefits of AVs can be exploited. A large autonomous fleet isnecessary to increase traffic density and reduce parking spots. The process is not ex-pected to be limited by technology, but by the adoption and the slow fleet turnover.Modern vehicles are durable and low- and middle-income car drivers are more in-clined to buy a cheaper or second-hand car. Within the same research Litman notesthat other car technologies took a long term to be integrated into cars, although theiradvantages are obvious and their additional costs low. For example, air bags took25 years to get mandated by U.S. federal regulation and automatic transmissions areafter more than 50 years still not standard in cars.
Arbib and Seba (2017) are more optimistic and foresee a big future for AVs andexpect that within 10 years 95% of all U.S. passenger miles will be travelled withan on-demand AV fleet owned by one or multiple businesses. They have identified2021 as the year in which autonomous vehicles become widely available and willdisrupt the existing transportation model.
2.4.4 Car sharing integration
When AVs are used in a car sharing fleet, the potential customer base of car sharingincreases. AVs allow people without a driver’s licence and people who cannot drivea car for other reasons, to travel by car without the use of a human driver. However,the biggest added value of AVs for car sharing is that it allows vehicles to be relo-cated without human involvement. The ability to travel without passengers allowsbetter anticipation of changing vehicle supply and demand.
The system that can be created by combining car sharing and AVs resembles ataxi fleet. Users can request a vehicle to pick them up and drop them off at a specificlocation. It is no longer necessary to walk to a car, as car sharing transforms into adoor-to-door service.
Two different adoption scenarios can be created when talking about collaborationbetween car sharing and autonomous vehicle technology: (1) AVs will speed up theadoption of car sharing, or (2) car sharing will speed up the adoption of AVs.
In the first scenario, car sharing adoption is in the same order of magnitude as itis at the moment. By using AVs in car sharing fleets more people can use the serviceand it makes car sharing a more attractive mobility alternative. The AVs add extrafunctionality that was first missing in car sharing to make it a success.

22 Chapter 2. Literature review
In the second scenario, the integration of AVs in car sharing lets more peopleexperience AV technology. The lower threshold to use AVs and be exposed to itsusage, accelerates the acceptance of AVs as a means of transportation.
Research about setting up an AV fleet in urban areas to replace current car jour-neys find that every AV could replace ten traditional cars (Fagnant et al., 2015; Fo-rum, 2015; Bischoff and Maciejewski, 2016; Chen et al., 2016). This would reducethe number of cars needed in urban areas drastically and free up space for differentutilisation. Full car autonomy is important for these systems to function the waythey are assumed to work in these studies and form a new mode of transport. InForum (2015) it was assumed that no high capacity PT was used, which resulted inan increase of 89% of travelled kilometres for vehicles.
Car sharing is not the only way to start implementation of AVs in the currenttransport system. UITP (2017) proposes to start with implementing AVs in PT,because it allows to start operating in a limited area. This study does not see au-tonomous cars as a substitute for PT, because it lacks the vehicle capacity especiallyin densely populated areas. Different initiatives in PT have already started, such asan autonomous bus made by Mercedes, which had a trial period near Amsterdam(Mercedes, 2016).
A study asked people their preference regarding completing the last mile of atrain journey with an AV, which is one of the use cases of car sharing (Yap et al., 2016).They found no significant preference for either fully autonomous cars or the abilityto drive the car yourself. This could indicate that AVs might not be a requirement toattract car sharing users.

2.5. Summary and discussion 23
2.5 Summary and discussion
In this section, a summary of the important points found in literature is given, fol-lowed by a discussion about the found candidate car sharing features.
2.5.1 Summary
Car sharing has various forms of implementation. Some companies own a fleet ofvehicles (B2C), while others allow people to rent their vehicle to other people (P2P).Some B2C services differentiate themselves by providing dedicated parking spacesto end a rental period to their users. Within a rental period, two trip types can bedistinguished. The rental period has to end where it was started or it can end at adifferent location. Both types were found to have different usage strengths and to beused for different trip types. The advantages of car sharing can be divided into threecategories: the individual, the transportation infrastructure, and the environment.The advantages for the individual are most important for users, with the biggestadvantage being the reduced fixed costs. Accessibility, reliability and parking avail-ability were found to be deemed important satisfaction criteria. Overall, car sharingis mostly used for incidental and social trips.
The biggest advantage of PT is the ability to perform non-driving related activ-ities while travelling. PT is also beneficial for the environment as fewer harmfulgases are emitted and recent agreements obligate PT providers to become more en-vironmentally friendly. The lower cost of PT compared to car ownership does notpersuade car drivers to switch. The disadvantages of limited flexibility and a lack ofcontrol outweigh the benefits. However, the satisfaction of PT users is higher thannon-users, indicating a negative image of PT of non-users.
Driving and owning a car is associated with freedom and independence, andoffers flexibility. The cost of a car trip seems low and reduces the usage threshold.Fixed costs, such as insurance, are not considered, but do make car ownership moreexpensive. Parking is seen as a big disadvantage of driving a car, because findinga parking space takes time and induces stress. Most car drivers are aware of theirenvironmental impact, but do not feel obliged to change their behaviour.
The expected benefits of AVs include higher road safety and less required park-ing spaces. Concerns exist about the actual safety, as well as security and privacy.Estimations of the expected time frame vary. If AVs could be used in a car sharingfleet, the customer base of car sharing can be expanded because a driver’s licensewould no longer be a requirement.
2.5.2 Discussion
With the literature review of car sharing, PT and private car completed, the foundcandidate features of car sharing can be described. First, the candidate featuresfound in car sharing literature will be discussed. Followed by exploring candidatefeatures that can be inferred from PT and private car literature.
What kind of candidate car sharing features can be found in literature?
The biggest distinguishing feature between different car sharing services is imple-mentation of either round trips or one-way trips. Both forms of car sharing were foundto be used for different trip types and have different market potentials. One-way carsharing provides users with more flexibility, and was found to be a wanted feature.

24 Chapter 2. Literature review
The functionality of one-way car sharing in a P2P business model is not viable. If acar owner who leases out his car, cannot be guaranteed a time frame within whichhe receives back his car, he loses his own mobility. Manual repositioning to returnthe car is expensive. Offering a one-way trip service also means that it is more diffi-cult to offer dedicated parking spaces to users. One-way can be used in combinationwith dedicated parking spaces, but this limits the location freedom of ending a rentalperiod. For a free floating one-way service, it is impossible to provide parking ev-erywhere.
Dedicated parking spaces help to expand the accessibility of car sharing. Peopleknow where to find the car because it is easier to recognise and always available atthe same place. Dedicated parking spots ease the stress of drivers to find a place topark and reduces time spent looking for a place. The driver also does not need to geta parking ticket or find a cheap parking spot as this is included in the rental price.When parking spaces close to transport hubs are offered, transfer times decrease andthe multimodality threshold is lowered. To be able to offer these types of parkingspaces, collaboration with public entities, such as cities or municipalities, is required.This collaboration could be further extended into better integration of car sharing inPT or to be developed neighbourhoods. By lowering the parking spaces to houseratio, and offering car sharing parking spaces, people could be incentivised to notbuy a second car.
Offering different sizes and types of vehicles allows people to choose the vehiclethat best fits their current mobility needs. Other mobility types do not offer thisflexibility.
Although not a directly implementable feature, reliability of car sharing was foundto be very important. People should always be able to start or end their journey. Re-liability could be provided by matching the fleet size to meet the demand, performmanual repositioning, or motivate people to end their rental periods in areas withhigh demand. By performing area specific analysis, the demand and the requirednumber of cars can be estimated.
In literature, the reduced cost of car sharing compared to vehicle ownership wasacknowledged as one of the best features of car sharing. However, the exact savingsfor users are unclear. No specific answer has yet been provided, concerning themaximum annually driven kilometres a car sharing user could drive and pay lesscompared to driving those same number of kilometres with an owned car. Giving(potential) users a clear, personalised insight into their prospective savings, couldconvince more people to use car sharing.
Combining car sharing and AVs to create an autonomous fleet of vehicles couldtransform the usage of car sharing. People no longer need to be able to drive to usethe service, resulting in a larger customer base.
Next the candidate features inferred from PT and private car literature will be ex-plored.
Which features found in other forms of people transportation can be applied to car sharing?
Flexibility is offered by car ownership, but not by PT. Car owners can start a journeyany time they want, while PT users are restricted by the predetermined schedule.Car sharing can offer a flexibility equal to car ownership, if it allows users to rent acar with minimal to no reservation time. This allows for spontaneous or incidentaltrips.

2.5. Summary and discussion 25
One of the complaints towards PT is the lack of personalisation. The service is nottailored to individuals, but to larger generic user groups. Car sharing can offer usersmore personalisation in terms of trip information and updated routes when delaysoccur. For a higher-level personalisation, user groups or even individual users canbe targeted and tailor car sharing to their needs. For example, giving them a discountduring specific times or updating them with PT travel information during a trip ifthey plan to continue their travels with PT. By showing a user he can minimise hisjourney time and efforts, car sharing becomes extra attractive.
Comfort and convenience are two features that people miss in PT, but find in driv-ing a private car. Car sharing cars should be kept clean and have comfortable chairs.Convenience can be achieved through an easy rental procedure. It should be com-municated that car sharing can offer both these features.
Parking availability and price were found to be big disadvantages of travel by car.By offering parking as part of the car sharing service, less time is wasted and lessstress experienced while looking for a parking space.
The found candidate features form a provisional list of features for car sharing ser-vices. In the next two chapters, two different information sources will be used, on-line reviews and a dataset, to confirm the found features and, if possible, expand thelist.

27
Chapter 3
Online review analysis
The goal of this chapter is to analyse the experiences of Dutch car sharing usersthrough online reviews. Different car sharing initiatives have been set up in theNetherlands. They have been active on the market for multiple years already. Dur-ing these years, people have had many different experiences while using car sharing.Some of these experiences have been shared online and provide an insight into whatpeople consider positive and negative attributes of car sharing. Customer opinionis interesting and valuable, but difficult to obtain. Surveys follow a (strict) formatand usually try to gather information from a well-distributed sample. To post ex-periences online, people have taken initiative themselves because they think it isdeemed necessary. Although this method also has its limitations, it is a money andtime efficient way to gather experience based opinions. To make it relevant for thisstudy, the found experiences will be analysed with an emphasis on user experiencewith features.
In this chapter, the analysis of online shared experiences of users of two differentcar sharing services (Greenwheels and Car2go) and one car sharing alternative (OV-fiets) is described. First the methodology, with its limitations is presented. Then theto be analysed data is discussed, followed by the results of the analysis. With thelimitations in mind, conclusions are drawn and the candidate features are defined.
3.1 Methodology
With the increasing integration of internet and social media in everyday life, theinteraction between companies and consumers has shifted to the online space. It isno longer necessary to visit or call a company to ask questions, complain, or givefeedback. Social media has become a common way to have personal interactionwith a company. Companies seem more directly approachable. Some companieseven have their own forums where people can interact with experts and other users.Although these interactions are not classified as reviews, they contain a wealth ofinformation about how a product or service is used and how a user rates it. Theindividual interactions do not cover all aspects of a service, as a professional reviewwould, but zoom in on one or multiple aspects. These business-to-customer andcustomer-to-customer interactions are deemed useful for this study because theyprovide insight into customer experience that would otherwise be difficult to obtain.For the remainder of this thesis, the online interactions will be referred to as reviewsand their authors as reviewers.
The methodology for the analysis is based on an adapted form of content anal-ysis (Stemler, 2001). Stemler describes content analysis as "a systematic, replicabletechnique for compressing many words of text into fewer content categories based on explicit

28 Chapter 3. Online review analysis
rules of coding". It is a useful methodology for examining trends and patterns in texts.Content analysis is more than counting the frequency of created categories. The cre-ated categories are used to spot differences and similarities between the differentinteractions. Because of the small sample size used for this analysis, the frequencycount is not deemed scientifically sound.
No categories are created beforehand, but they emerge as the coder goes throughthe reviews. The categories are based on described features and the user experi-ence. Special attention is paid to deal breakers, reasons for not using a service, anda breach of trust.
The outcomes of the analysis are used as a sanity check of the literature discussedin chapter 2. The found features and their valuation can be evaluated against litera-ture.
3.1.1 Limitations
Although content analysis has its strengths, it is important to notice its limitations.Firstly, the analysis is limited by the available material, which may not be an accuratereflection of reality. If one person complains about a feature, it could be that otherpeople actually appreciate that feature, but have not expressed their appreciationonline.
Secondly, the impact of good and bad experience cannot be considered equal.Bad experiences and impressions are salient, formed more quickly and more difficultto change once established (Baumeister et al., 2001). The negativity bias, weighing anegative experience more heavily than positive, is affecting the type of experiencespeople share online. When people share an experience, they mostly talk about thenegative part because it is more attention grabbing (Kanouse, 1984). This is impor-tant to consider when reading both positive and negative reviews.
Thirdly, the external validity of the analysis is weak. The analysis cannot be gen-eralised to a wider population. The reviews are selected at random, but cannot beconsidered a random sample. Too little background information about the demo-graphics of the sample is known and the sample size is too small.
Fourthly, the review analysis is based on the Dutch market and for that reasononly Dutch reviews are used. The translation of review text to category translationcould lead to a different interpretation. The categories are created in English becausethis thesis is also written in English.
3.2 Data
More than ten car sharing companies are currently active on the Dutch market, vary-ing in size and approach. In chapter 1, PT integration was described as one of thecar sharing opportunities. Of all the companies on the market, only Greenwheelsand Mywheels have some sort of integration with PT. For Mywheels this integrationonly goes as far as the possibility to open a rented car with your OV-chipkaart, theDutch standard PT travel card. Greenwheels also offers this functionality. Green-wheels is unique in that it has a partnership with the NS, the biggest Dutch railwaycompany. Therefore, Greenwheels cars have a dedicated parking location close to amany train stations. Greenwheels is also integrated in the NS-business card service.
Mywheels was left out of the analysis, based on a lack of reviews. As a replace-ment Car2go was chosen. Car2go does not have any integration with PT, but it was
3.3. Results 29
selected because it is one of the most successful car sharing services in the Nether-lands, with currently more than 300 electric cars in Amsterdam.
As the third company, a car sharing alternative was chosen, the OV-fiets. This NSinitiative provides bikes for rental at train stations. The OV-fiets can be seen as a carsharing competitor because of the bike friendly infrastructure in the Netherlands,Thus, it can offer the same FMLM advantage a car could.
The data selected for this analysis consists of online reviews, forum posts, andsocial media posts. These were found by using the search engine Google. The searchquery consisted of the company name plus one or two keywords. For each company,the used keywords can be found in Appendix A. The analysed reviews and thecreated categories can also be found in this appendix. For each review additionalinformation is noted, such as source, type of website, format, and primary audience.The perceived tone of the review is categorised in three categories: positive (green),neutral (orange), negative (red).
3.3 Results
In this section, the results of the analysis will be discussed. First, the two car sharingservices are examined separately, followed by an evaluation with respect to eachother. Then, the OV-fiets is analysed, followed by a comparison of car sharing andbike sharing.
3.3.1 Greenwheels
The most frequently occurring category at the Greenwheels analysis is the ’Onlyuseful when close by’ category. This category encompasses all notions of the de-pendence of distance between start location of the user and the car. The shorter thedistance, the more useful the service is deemed to be. The people who write thesecomments in their reviews live close enough to use the service and as a result theirreview is influenced by the survivor bias. Survivor bias means that only people orthings who passed a certain threshold or criteria are looked at, and other instancesare ignored. In the car sharing case, this could lead to the idea that the cars are welldistributed over a city or the Netherlands. The people who note that you shouldlive close to a car sharing parking place to use the service, all live close to a parkingspace and because of that use the service.
Another commonly occurring category is the ’High cost’ category. People fromthe sample indicate that they feel they pay a lot of money to use Greenwheels. Forreviewer number 9, the high price together with the transition to smaller cars, per-suaded them to buy a car and stop using Greenwheels. Other reviewers note thehigh price as a downside, but do not describe it as a reason to stop using the service.
3.3.2 Car2go
One of the selling points of Car2go in Amsterdam is the possibility to park anywherewithout additional parking fees if you end the rental period. In addition, they alsohave special Car2go parking spaces. Especially in a big city where parking spacesare scarce and expensive, this sounds like an ideal solution. The reviewers indicatethat they perceive this as a big advantage, but it does not always serve its purpose.People still have trouble finding a parking spot and sometimes they find a parkingspace dedicated to Car2go occupied with a non-Car2go vehicle. Although it is diffi-cult for Car2go or any car sharing company, to prevent unauthorized vehicles from

30 Chapter 3. Online review analysis
parking in their reserved parking spots, it is very frustrating for the affected user.Car2go indicated in an interview that they do not receive a lot of notifications aboutwrongly parked cars (Suiker and Elshout, 2013). Although an issue with wronglyparked cars was mentioned in a couple of reviews, it shows that the reviews are nota real representation of what happens to a lot of car sharing users. On the otherhand, the classification ’not a lot’ is very subjective and Car2go will not publiclystate that a lot of their customers have problems with parking.
The choice of Car2go to offer its users only electric vehicles (EVs) creates an en-vironmental friendly image. The current battery technology for EVs does have adownfall, their unreliable maximum distance. As two of the reviewers noted, thedistance drops drastically if the outside temperature is low. The batteries drainquicker, resulting in more time spend charging and less time driving. Combustionengines do not have this seasonal dependency. It is important to educate people ofthis phenomenon beforehand, to prevent them from getting stuck somewhere withan empty battery.
3.3.3 Greenwheels vs Car2go
The main difference between the two services is the types of cars they use. Car2gouses Smart Fortwos, which are known to be small. One car can only transport twopeople at a time and does not have a lot of trunk space. Greenwheels car fleet con-sists of city cars, station wagons and small vans. All Greenwheels cars are biggerthan Car2go’s cars, but only the Greenwheels reviewers complain about small cars.People know Car2go uses smaller vehicles and have different expectations. Expecta-tion management by a car sharing company is very important. People need to knowwhat to expect, so they can anticipate the situation.
Although the sample size is small, it is worth noting that the reviews give noindication of the car sharing advantages described in the literature. The Car2goreviews do not even speak of the EVs environmental advantages. Only one Green-wheels reviewer (review 10) notes that car sharing is an environmentally friendlyalternative, but she focuses mostly on the fuel efficiency of the car. This efficiency isnot limited to a car sharing service.
3.3.4 OV-fiets
Although the OV-fiets can be seen as an alternative to car sharing, car sharing is notmentioned in one of the analysed reviews. The users of both services seem to havedifferent mindsets when it comes to mobility. This could be because of the limitedsample size.
However, the OV-fiets is seen as alternative for the bus. Not only to destinationswhere no bus connection is available, but also on lines where the bus is crowded.
The OV-fiets is seen as an extension of a train journey, but not of a bus journey.This could have two explanations. Firstly, the bikes are located near train stationsand not near bus stops (except when the bus stop is located at a train station). There-fore, people can only start their OV-fiets journey at a train station and bus stopslocated near a train station. Secondly, bus lines have a lot more branches and stops,resulting in a higher network density. The distance people need to travel from a busstop to their destination is likely shorter than from a train stop to their destination.
The reviews from the forum of the NS (reviews 1-7) indicate that users comeacross a different procedure to rent a bike at different stations. It is understandablethat not every place can be equipped in the same way, but the reviewers even talk

3.3. Results 31
about a different order of the steps needed to complete a rental. The lack of a stan-dard procedure implemented at all rental stations creates confusion for its users andhas a negative influence on the user experience. This only affects people who usebikes at different stations, but is unnoticeable for people who only use the OV-fietsfrom one certain station. Establishing a standard procedure would create a betterexperience for people renting from different stations and for a better possibility toevaluate the overall service quality of the OV-fiets.
An emerging theme in a lot of the reviews is the current state of the bike. Thereviewers do not seem to mind that the bikes are not new and do not have a lot ofluxury. They can even look past a broken light. However, a broken bike, which can-not be used, does result in a very negative experience. A broken bike decreases thereliability of the service. Reliability is very important for a transportation service,because people do not like the uncertainty and do not want to get stranded. Thereseems to be some leeway in terms of maintenance condition, if the core functionality(riding a bike) still works. Some bike depots close before it gets dark, which moti-vates people to return the bike earlier and decreases the need for bike lights. In theNetherlands, bike lights only need to be present on a bike when it is dark or whenweather conditions create bad visibility (Rijksoverheid, 2017).
3.3.5 Car sharing vs bike sharing
The main similarity found in the reviews seems to be that both car sharing and bikesharing are used to get to places where no PT is available. Bike sharing is also usedin combination with PT, more specifically the train.
A difference is that the OV-fiets is more difficult to use as the first mile of a jour-ney than car sharing. Car sharing can be distributed over a larger area, while OV-fiets locations are concentrated near train stations. So, if you do not live near a trainstation, you cannot use the shared bike for the start of your journey. If the final des-tination of your shared bike journey is not at a train station, you still need to returnthe bike. Car sharing does not have this difficulty, if you use a free floating service.
What does make car sharing more difficult is the unpredictability of where avehicle is available. The bike starting point is always the same. However, for acar sharing service without fixed parking spots, the location of each car can changeevery day.
As mentioned in the OV-fiets reviews, one person (review 4) is willing to pay tobe able to make a reservation for a bike. This is a common feature in car sharing andgives users the guarantee that a car is available when they need it. A Greenwheelsreviewer (10) describes this process as simple.
In the OV-fiets reviews, multiple remarks were made about the state of the bikesand that some of the bikes required maintenance. For a car sharing service thiswould be unacceptable. For example, a broken light on a car is very dangerousand would result in a fine. The failure of other equipment inside a car is also notacceptable.
The standardisation issue of the OV-fiets should not be a problem for car sharing.No special facilities need to be designed where people come to rent a car. Whenreservations can be made via an application on a mobile phone, everything can bedone in software. What needs to be standardised is the placement of the hardwareinside the car and the procedure to start and end a rental period.
32 Chapter 3. Online review analysis
3.4 Conclusion
This chapter looked at the different experiences people shared online. Most reviewswere as expected and expressed in the limitations section negatively biased. Thisis important to keep in mind, because it helps to put these reviews into perspec-tive. The positive reviews were underrepresented, but their presence indicate thatcar sharing does not only produce negative experiences.
The question related to this chapter is:What are the experiences of car sharing users with car sharing and its current features?
The ability to draw valid conclusions is limited because of the limited sample sizeand the distribution of the sample. However, some aspects found in literature werealso found in the analysis. The cost of usage is a barrier because it seems higher thanthe single usage of a private car. Giving people more insight into the cost of usagecompared to private cars could help them put it into perspective.
Of the advantages of car sharing found in literature, the reduced fixed costsand environmentally friendly effect have been mentioned, both in only one review.Whether this is because of a negativity bias or not feeling the need to mention theadvantages, is unclear. The limited sample size could also give a skewed perspec-tive.
It was found that not only the type of features that a car sharing service pro-vides are important, but also whether they are communicated to (potential) users.The fact that Greenwheels and not Car2go customers complained about small cars,while Greenwheels offers bigger cars than Car2go, shows that user expectation man-agement is crucial to prevent bad user experiences. The same holds for the electriccars of Car2go, which need explanation about how to charge, as well as its limitedrange in cold weather.
None of the Greenwheels reviews mentioned anything about the collaborationbetween the NS and Greenwheels. The ability to open a car with the standard PTcard was mentioned as a nice feature, but that feature is not limited to the collabo-ration of Greenwheels with the NS. There was no indication that the cars were usedfor FMLM mobility.
Although rural areas and the usage of car sharing together with PT were not foundin the reviews, the conclusion cannot be drawn that rural areas do not have potential,or that trips combining car sharing and PT do not happen at all. The sample of theonline reviews is too limited to draw that conclusion. A larger sample is required.Therefore, in the next chapter, a large dataset with the daily mobility of people in theNetherlands is analysed to find FMLM behaviour.

33
Chapter 4
Data analysis
The goal of this chapter is to investigate the rural area opportunities and integrationof car sharing in PT. A dataset, containing the daily mobility in the Netherlands, isanalysed by comparing urban and rural area trips, and examining multimodal trips.
First, the dataset, its usage, and its limitations are presented. Secondly, a pre-liminary data analysis is conducted to understand the data and how it can be used.Thirdly, the data analysis questions and approach is presented. Fourthly, data re-search is conducted to answer the data analysis questions. Finally, the data analysisquestions are answered and candidate car sharing features are deduced.
4.1 Data
In this section, background information about the to be analysed dataset is presentedand its usage is described. Next, the limitations of the data and conclusions arediscussed, followed by a preliminary analysis to get acquainted with the data andestablish research questions for the analysis.
4.1.1 Onderzoek Verplaatsingen in Nederland (OViN)
Since 2010, the Dutch bureau for statistics (CBS) conducts a yearly, nationwide studycalled OViN (Onderzoek Verplaatsingen in Nederland, (CBS, 2016d)). The goal ofthe study is to obtain information about the daily mobility of the Dutch popula-tion. Each participant is asked to provide their travel movement of one specific day.Within this research, the mobility behaviour is described in terms of place of ori-gin and destination, time of travel, means of transport, and motive for travel. Inaddition, attention is paid to the background variables for a particular movementpattern and choice of transport. Participants are also asked to give more personal in-formation to obtain a better view of daily mobility in relation to demographic. Themost recent available study is used, which dates from 2015. The 2016 study can beexpected around July 2017.
Participants are asked in a letter to fill in an online questionnaire. If filling in thequestionnaire online is not possible, the survey can also be performed via a phonecall or a researcher can visit the respondent at home. In 2015, 37,350 responses werecollected on a total of 66,987 approached people. This means 0.2% of the total popu-lation participated. The participants of the study include everybody, except peoplewho live in a care home or institution.
Since this research contains a sample from the total population, the results fromthe data analysis are not equal to the actual values, and thus have a margin of error.When the sample and the response of the basic research are insufficient to makereliable statements on a lower level of aggregation, additional work is done called’meerwerk’. The basic research can be used to make statements about the travel

34 Chapter 4. Data analysis
behaviour in the Netherlands, but with this additional research travel behaviour ina particular region can also be described. ’Meerwerk’ is done by obtaining moreparticipants, who receive the same survey as the other participants.
Important conclusions from the 2015 research include a decline in travellers’ kilo-metres, which can be traced back to a decrease in recreational travel. Less peoplehave used a car as their transportation mode, but the total kilometres travelled bycar remains the same.
4.1.2 Usage of the data
The data is used to analyse the overall movement behaviour in the Netherlands. Byanalysing the data in different ways, a better understanding is created of the dailymovements that are performed. Rural areas are compared to urban areas based ondifferent criteria that will be discussed later, and multimodality trips with PT areinvestigated. By analysing the findings, estimations can be made about the potentialof both opportunities and whether car sharing fits within current mobility patternsor if people need to change to incorporate car sharing into their mobility patterns.
4.1.3 Limitations
The first limitation originates from the dataset. Although the sample size is largeand seems to have a well distributed demographic, caution needs to be taken whendrawing conclusions. It also needs to be considered, that it only contains data fromthe Netherlands.
Secondly, the dataset contains a classification created by the CBS (CBS, 2017a)for every municipality on a scale from one to five ranging from not urban (less than500 addresses per km2) to ’very strong urban’ (more than 2500 addresses per km2).Within the dataset, the average value for a municipality is given to an address, in-stead of the value for a specific address. This reduces the accuracy to determine thepopulation density of an address.
Lastly, it is unclear how accurate the distances in the dataset are. Participantsare asked to estimate their travel distance. Unrealistic speeds are filtered out andrecalculated based on other given variables. However, less obvious mistakes mightnot be corrected. The distance category length distribution is also unclear, becausethe steps are not equal.
4.1.4 Preliminary analysis
The dataset consists of around 115,000 entries filling 166 columns, each with abbre-viations of the data that they contain. It is difficult to understand the contents ofthe data just by looking at the tables. Therefore, a preliminary analysis is conductedto understand the way the data is organised and how it can be used. The insightsgained during this analysis, are used in the deeper data analysis.
Motivation and means of transportation
To start, an overview has been created (see Table 4.1) to see the distribution of mainmeans of transport used for all data records. The majority of the travel is performedby car (44%), but with 26% bikes are a close second. PT has a mobility share of 11%(Train and Bus/tram/metro).

4.1. Data 35
Whole week Work week Weekend
Car (driver) 30 30 29Car (passenger) 14 11 23Train 6 7 3Bus/tram/metro 5 6 4Moped/scooter 1 1 1Bike 26 27 21Walk 16 16 18Remaining 2 2 1
TABLE 4.1: Means of transport used during the whole week, workweek and weekend in % (OViN 2015)
Whole week Work week Weekend
To/from work 18 21 6Business visit 2 2 0Services/Personal care 3 4 1Shopping/Groceries 20 19 24Education 12 16 1Social visit 13 10 24Social recreation 18 15 29Tours/hiking 6 5 9Different 8 8 6
TABLE 4.2: Trip motivation during the whole week, work week andweekend in % (OViN 2015)
Each participant is asked to indicate his/her motivation for a journey, which isvisualised in Table 4.2. The different motivations can be divided into a time depen-dent and independent group. When travelling to school or to/for work, you areexpected to be present at a predetermined time. The arrival time is fixed, not flexi-ble. On the other hand, shopping, groceries, hiking, and social activities have no ora less strict arrival time. A flexible arrival time allows a flexible departure time. Forexample, somebody who is going shopping would not mind waiting 15 minutes fora vehicle to become available, while somebody who is going to a business meetingcannot afford additional travel time, and need to have a vehicle available directly.The means of transport for both groups is checked to search for difference betweenthese trip motivations.
In Table 4.3 the motivation for movements with a flexible arrival time are brokendown into different mobility modes. Compared to the results from Table 4.1, a de-crease of 4% for PT can be noticed, as well as a 5% increase in walking. Althoughthere is a decrease in car drivers by 4%, the percentage of car passengers increases by4%. Thus, the ratio car drivers to car passengers changes. The flexible arrival timegroup contains more social mobility motivations, which could explain why morepeople travel together in one car. People go to or perform social activities togetherwith somebody else.
In Table 4.3 the motivation for movements with a non-flexible arrival time arebroken down into different mobility modes. These motivations have a lot less carpassengers than the flexible deemed motivations (10%), while the car drivers in-crease by 6% (2% when compared to Table 4.1). Although cycling remains about the

36 Chapter 4. Data analysis
Type of motivation
Flexiblea Non-flexibleb
Car (driver) 26 32Car (passenger) 18 8Train 3 12Bus/tram/metro 4 9Moped/scooter 1 1Bike 26 27Walk 21 9Remaining 1 2
a ’Shopping/Groceries’, ’Social visit’, ’Social recreation’ and ’Tours/Hiking’b ’To/from work’, ’Business trips’, ’Services/Personal care’ and ’Education’
TABLE 4.3: Means of transport for time flexible and non-time-flexible motivational cate-gories in % (OViN 2015)
Type of motivation
Flexiblea Shopping/Groceries
Car (driver) 26 32Car (passenger) 18 14Train 3 1Bus/tram/metro 4 3Moped/scooter 1 1Bike 26 29Walk 21 19Remaining 1 1
a ’Shopping/Groceries’, ’Social visit’, ’Social recreation’ and ’Tours/Hiking’
TABLE 4.4: Means of transport for time flexible motivations, with ’Shopping/Groceries’,which is part of time flexible motivations, singled out in % (OViN 2015)
same, the amount of walking decreases by 12%.To further look at flexible trips, the category ’Shopping/Groceries’ was chosen
for analysis. The means of transportation for the flexible motivations are repeatedand compared to ’Shopping/Groceries’ trips in Table 4.4. The ’Shopping/Groceries’category was chosen for further analysis because car sharing provides an extra ad-vantage for these types of trips. A car has storage space for transporting more orlarger items, which could not as easily be brought along on a bike or in PT. This isreflected in 6% more car driver trips and 3% less PT trips. However, the number ofbike trips increases (3%). A decrease in PT usage, but an increase in bike trips can beseen in comparison with the means of transportation of all categories (Table 4.1).
The motivation for trips are important to consider when setting up a car sharingservice because the mobility motivation might require a different type of vehicle.Social activities increase the amount of people that share one car.

4.1. Data 37
Weekend versus week
In Table 4.2, an overview is given of the different motivations to travel during theweekend. During the weekend, the number of social trips (time flexibility) is sig-nificantly higher than during the week, while work related trips are very low. Themotivation for trips during the week displayed in Table 4.2 show a decrease in socialtrips and a large increase in work and education related trips, as would be expected.The shopping category is also smaller (5%) during the week. As described in theuser section of chapter 2, car sharing has a higher usage during the weekends. Thiscan be explained by a higher motivation for social trips for which car sharing is useda lot. People are more flexible during the weekend. Car sharing can provide themmobility which they otherwise would not have had.
The types of mobility used during the week and weekend (Table 4.1) show abig increase of car passengers during the weekend (12%), while the car driver shareremains about the same. So, during the weekend the number of people per car ishigher than during the week, which could be explained by the increase in socialactivities. The usage of PT decreases during the weekends (6%) as well as the usageof bikes (6%).
Trip distance
The graph in Figure 4.1 shows the division of distance categories of different meansof transportation. The peak for bike usage in the 1.0 to 2.5 kilometres category issignificant. Train usage is minimal for distances below 10 kilometres, but spikes fordistances over 50 kilometres. The car passenger peaks follow the same pattern asthe car driver peaks. This is interesting, considering the survey targets individualpeople and not households.
If car sharing to aim for integration with PT, it should not become a competitor.For example, if car sharing is used for longer trips (<30km), it would compete witha large portion of the Bus/Tram/Metro usage as well as Train usage. So, users needto somehow be encouraged to use car sharing for shorter distances and switch to thetrain for longer distances.
The distribution of means of transportation for different distances can be seenin Figure 4.2 and Figure 4.3. On the x-axis, the trip distance increases. The first barincludes all trips longer than 0.1 kilometres, the second bar includes all trips longerthan 0.5 kilometres, and so on. In Figure 4.2 the y-axis shows the number of tripand in Figure 4.3 the y-axis shows the percentage of trips from 0 to 100%. From3.7 kilometres and further, the share of car travel experiences little fluctuation. Cardrivers and passengers combined perform more than 50% of all trips longer than1 kilometre. The amount of train travel increases as cycling and walking decrease.Until about 20 kilometres, the bus/tram/metro share remains stable, indicating theyare mostly used for relatively short distances.

38 Chapter 4. Data analysis
0
2,000
4,000
6,000
8,000
10,000
12,000
Car (driver) Car (passenger) Train Bus/tram/metro Bike Walk
Num
ber o
f trip
s
0.1-0.5 km 0.5-1.0 km 1.0-2.5 km 2.5-3.7 km 3.7-5.0 km 5.0-7.5 km 7.5-10 km 10-15 km 15-20 km 20-30 km 30-40 km 40-50 km > 50 km
FIGURE 4.1: Overview of the number of trips per distance categoriesper mobility type (OViN 2015)
0
20,000
40,000
60,000
80,000
100,000
120,000
> 0.1 km > 0.5 km > 1.0 km > 2.5 km > 3.7 km > 5.0 km > 7.5 km > 10 km > 15 km > 20 km > 30 km > 40 km > 50 km
Num
ber o
f trip
s
Car (driver) Car (passenger) Train Bus/tram/metro Bike Walk
FIGURE 4.2: Number of trips versus increasing trip distance (OViN2015)
0%
10%
20%
30%
40%
50%
60%
70%
80%
90%
100%
> 0.1 km > 0.5 km > 1.0 km > 2.5 km > 3.7 km > 5.0 km > 7.5 km > 10 km > 15 km > 20 km > 30 km > 40 km > 50 km
Num
ber o
f trip
s in
%
Car (driver) Car (passenger) Train Bus/tram/metro Bike Walk
FIGURE 4.3: Percentage of cumulative number of trips versus increas-ing trip distance, same data as Figure 4.2, but in percentages (OViN
2015)

4.2. Data analysis questions 39
4.2 Data analysis questions
In chapter 1, expanding car sharing services into rural areas, as well as integratingcar sharing into PT for FMLM usage were identified as opportunities for car sharing.These opportunities will be analysed in the dataset. Questions are created to guidethe process. These questions will be introduced and the approach to answering themwill be elaborated on.
Question 1: Urban versus rural
What are the differences and similarities between urban and rural travel patterns?
Car sharing companies are currently mostly active in urban areas, but the Nether-lands also has a relatively large rural area and population. To estimate whether carsharing could also be applied in rural areas, the travel patterns are compared. Alot of similarities could show a car sharing potential for rural areas. Conclusionsneed to be drawn carefully because the average of the travel patterns of two groupis taken. Outliers in either group could shift the results.
To be able to answer this question, the definition of urban and rural areas firstneeds to be defined. According to the definitions of the CBS, urban areas have adensity of more than 1500 addresses per km2 (CBS, 2017b), while rural areas have adensity of less than 1000 addresses per km2 (CBS, 2017c). The OViN dataset containsa separate column for population density for the place of residence of each partici-pant. The density is divided into five categories: (1) less than 500 addresses per km2,(2) between 500 to 1000 addresses per km2, (3) between 1000 and 1500 addresses perkm2, (4) between 1500 and 2500 addresses per km2, and (5) more than 2500 addressesper km2.
The travel patterns are dissected into distance, time, speed, motivation, andmeans of transport. For both areas, the demographic composition is analysed interms of age, occupation, PT usage frequency, and car ownership.
Question 2: First mile, last mile in PT
What are characteristics of the first and last mile of a PT trip?
In the introduction of this thesis, a lack of integration with PT was described as aweak point of the current car sharing set up. The dataset is used to analyse thebehaviour of people who perform a multimodal trip, which can give more insightinto the way people travel with PT. When a PT journey is performed with differentmodes of transportation, the term multimodality is applicable. It means that multi-ple modes of transportation are used within the same journey. To complete the firstor last mile of a PT journey, people often needs to travel to or from a transportationhub. Especially interesting is the way which people arrive at a train station or busstop and how they continue their journey from a train station or bus stop. Thesefirst mile, last mile trips are studied in terms of means of transportation, motivation,distance, and transfer, waiting and trip times. Also, the demographic composition isanalysed in terms of age, occupation, PT usage frequency, and car ownership.
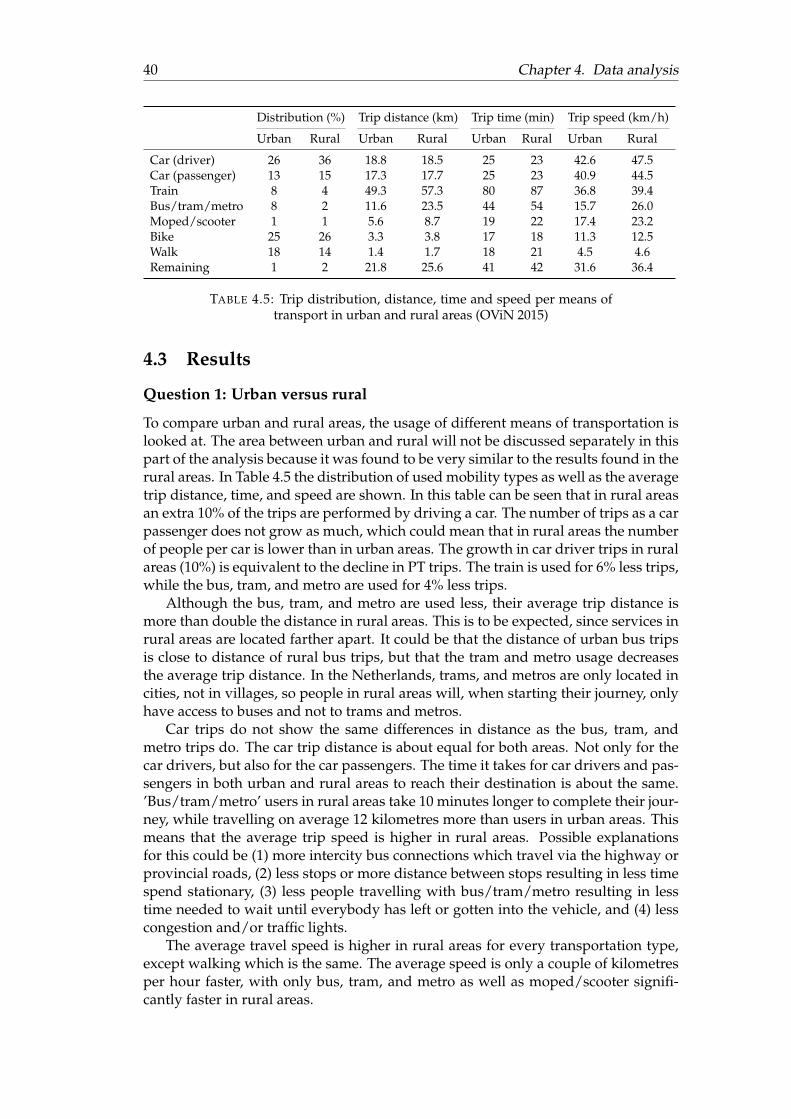
40 Chapter 4. Data analysis
Distribution (%) Trip distance (km) Trip time (min) Trip speed (km/h)
Urban Rural Urban Rural Urban Rural Urban Rural
Car (driver) 26 36 18.8 18.5 25 23 42.6 47.5Car (passenger) 13 15 17.3 17.7 25 23 40.9 44.5Train 8 4 49.3 57.3 80 87 36.8 39.4Bus/tram/metro 8 2 11.6 23.5 44 54 15.7 26.0Moped/scooter 1 1 5.6 8.7 19 22 17.4 23.2Bike 25 26 3.3 3.8 17 18 11.3 12.5Walk 18 14 1.4 1.7 18 21 4.5 4.6Remaining 1 2 21.8 25.6 41 42 31.6 36.4
TABLE 4.5: Trip distribution, distance, time and speed per means oftransport in urban and rural areas (OViN 2015)
4.3 Results
Question 1: Urban versus rural
To compare urban and rural areas, the usage of different means of transportation islooked at. The area between urban and rural will not be discussed separately in thispart of the analysis because it was found to be very similar to the results found in therural areas. In Table 4.5 the distribution of used mobility types as well as the averagetrip distance, time, and speed are shown. In this table can be seen that in rural areasan extra 10% of the trips are performed by driving a car. The number of trips as a carpassenger does not grow as much, which could mean that in rural areas the numberof people per car is lower than in urban areas. The growth in car driver trips in ruralareas (10%) is equivalent to the decline in PT trips. The train is used for 6% less trips,while the bus, tram, and metro are used for 4% less trips.
Although the bus, tram, and metro are used less, their average trip distance ismore than double the distance in rural areas. This is to be expected, since services inrural areas are located farther apart. It could be that the distance of urban bus tripsis close to distance of rural bus trips, but that the tram and metro usage decreasesthe average trip distance. In the Netherlands, trams, and metros are only located incities, not in villages, so people in rural areas will, when starting their journey, onlyhave access to buses and not to trams and metros.
Car trips do not show the same differences in distance as the bus, tram, andmetro trips do. The car trip distance is about equal for both areas. Not only for thecar drivers, but also for the car passengers. The time it takes for car drivers and pas-sengers in both urban and rural areas to reach their destination is about the same.’Bus/tram/metro’ users in rural areas take 10 minutes longer to complete their jour-ney, while travelling on average 12 kilometres more than users in urban areas. Thismeans that the average trip speed is higher in rural areas. Possible explanationsfor this could be (1) more intercity bus connections which travel via the highway orprovincial roads, (2) less stops or more distance between stops resulting in less timespend stationary, (3) less people travelling with bus/tram/metro resulting in lesstime needed to wait until everybody has left or gotten into the vehicle, and (4) lesscongestion and/or traffic lights.
The average travel speed is higher in rural areas for every transportation type,except walking which is the same. The average speed is only a couple of kilometresper hour faster, with only bus, tram, and metro as well as moped/scooter signifi-cantly faster in rural areas.

4.3. Results 41
Distribution (%) Trip distance (km) Trip time (min) Trip speed (km/h)
Urban Rural Urban Rural Urban Rural Urban Rural
To/from work 19 17 20. 1 22.1 35 29 34.4 45.6Business visit 2 2 26.9 25.5 31 27 52.2 56.6Services/Personal care 4 4 9.2 11.9 23 21 24.0 34.3Shopping/Groceries 21 19 4.7 6.7 15 15 18.8 26.8Education 12 13 10.1 13.2 27 30 22.4 26.4Social visit 12 13 20.9 15.9 32 22 39.2 43.4Social recreation 18 18 13.4 12.8 30 25 26.7 30.8Tours/hiking 5 6 8.2 7.1 44 47 11.2 9.1Different 7 8 13.1 12.8 22 18 35.7 42.5
TABLE 4.6: Trip distribution, distance, time and speed per trip moti-vation in urban and rural areas (OViN 2015)
Next, the differences between trip motivations are looked at. Table 4.6 gives anoverview of the different categories, their distribution, trip distance, and trip du-ration.
As opposed to the trip means of transportation, there is no significant differencebetween urban and rural in distribution of trip motivation. The biggest difference is2% for ’To/from work’ and ’Shopping/Groceries’. For both categories, the trip dis-tance for rural inhabitants is about 2 kilometres longer. However, the trip durationis six minutes shorter for ’To/from work’ and equal for ’Shopping/Groceries’. Thisagain shows that the average trip speed is higher in rural areas. This holds for allcategories, except ’Tours/Hiking’.
Trips to go (grocery) shopping have the shortest distance and travel time for bothrural and urban areas, but (after ’Tours/hiking’) also have the lowest average speed.Table 4.3 shows that shopping trips are mostly performed by car (46%) followed bybike (29%) and walking (19%). Although the car is used for a large portion of thetrips, the short trip distance has the most influence on the trip speed.
The social visit distance for urban trips is five kilometres longer than for ruraltrips. The higher people density in urban areas does not translate into friends andfamily living close together. Longer trips are needed to visit these groups of people.
There is no significant difference between urban and rural areas in terms of thetrip motivation distribution. Differences do exist in trip distance and duration, butneither area has significantly longer trips. Rural areas have a higher travel speed inmost categories, but do not have significantly shorter trips than urban areas. Theurban area will be further specified to search for differences.

42 Chapter 4. Data analysis
Urban >250k Urban >150k Urban >100k Urban Rural
To/from work 20 19 19 19 17Business visit 2 2 2 2 2Services/Personal care 4 3 3 4 3Shopping/Groceries 20 21 21 21 18Education 12 12 12 12 13Social visit 12 12 12 12 13Social recreation 19 19 18 18 18Tours/hiking 4 5 5 5 6Different 7 8 8 7 8
e.g. ’Urban >250k’ shows the distribution of trip motivation for people in an urban area in a city withmore than 250,000 inhabitants.
TABLE 4.7: Trip motivation per urbanisation level and city size in %(OViN 2015)
Urban >250k Urban >150k Urban >100k Urban Rural
Car (driver) 18 23 24 26 36Car (passenger) 10 12 12 13 15Train 9 9 9 8 4Bus/tram/metro 17 11 9 8 2Moped/scooter 1 1 1 1 1Bike 24 25 25 25 26Walk 20 19 18 18 15Remaining 1 1 1 1 2
e.g. ’Urban >250k’ shows the distribution of mode of transportation of people living in an urban area ina city with more than 250,000 inhabitants.
TABLE 4.8: Trip mode of transportation per urbanisation level andcity size in % (OViN 2015)
In Table 4.7 and Table 4.8 the results of a more specified urban area can be found.The distribution of urban starting locations is not concentrated on big cities only.Also, smaller cities have areas with an amount of address per km2 that falls intoa higher urbanisation category. According to literature, car sharing is only viablein cities with a large number of inhabitants (>500,000) (Bert et al., 2016). To furtherexplore the differences between rural and urban areas, an additional criterion is usedto specify urban areas: number of city inhabitants. The provided city sizes fromthe OViN database are used. By combining the urban definition with the numberinhabitants, the densely populated areas are used and the suburbs of the cities areexcluded. The only cities with more than 250.000 inhabitants in the Netherlands areAmsterdam, Rotterdam, Den Haag and Utrecht. All these cities have either a metro,a tram, or both.
From Table 4.7 can be noted that the distribution of trip motivation for all densitytypes are close. The difference between rural and very urban areas is at most 3%.There is no significant different in trip motivation between all the different areas.
Table 4.8 shows a big difference in mobility types per density. Cities with morethan 250.000 inhabitants have half the amount of car driver trips of rural areas. Theshare of car passengers also decreases, but not proportional to the decrease in cardrivers. The PT usage in bigger cities is a lot higher than in rural areas. Especially inthe cities with more than 250,000 inhabitants, which is expected because these citiesadditionally facilitate a tram, metro, or both.

4.3. Results 43
Distance (km) Time (min) Speed (km/h)
Urban >250k Urban Rural < 50k Urban >250k Urban Rural < 50k Urban >250k Urban Rural < 50k
Car (driver) 20.4 18.0 18.4 29 25 23 41.9 42.6 47.4Car (passenger) 16.9 17.3 17.7 28 25 24 36.8 40.9 44.8Train 52.9 49.3 58.5 85 80 87 37.6 36.8 40.3Bus/tram/metro 8.9 11.6 22.8 42 44 54 12.7 15.7 25.4Moped/scooter 5.5 5.6 7.9 22 19 20 12.7 17.4 23.6Bike 2.4 3.3 3.8 19 17 18 7.5 11.3 12.5Walk 1.2 1.4 1.7 18 18 22 4.2 4.5 4.6Remaining 20.9 21.8 25.3 40 41 41 28.3 31.6 36.8
TABLE 4.9: Trip distance, time and speed per mobility type per ur-banisation level and city size in % (OViN 2015)
Urban Rural Difference
0 – 15 years 21.1 21.4 +0.316 – 20 years 5.2 5.5 +0.321 – 25 years 5.0 3.9 -1.126 – 30 years 5.7 4.0 -1.731 – 35 years 6.1 4.2 -2.136 – 40 years 6.6 4.7 -1.941 – 45 years 7.1 7.3 +0.246 – 50 years 7.4 8.0 +0.651 – 55 years 7.8 7.9 +0.156 – 60 years 7.1 8.0 +0.961 – 65 years 6.3 7.4 +1.166 – 70 years 5.8 7.3 +1.571 – 75 years 3.7 4.7 +1.076 – 80 years 2.7 3.3 +0.681 – 100 years 2.2 2.3 +0.1
TABLE 4.10: Age distribution in urban and rural areas in % (OViN2015)
Although the motivation of types does not vary significantly between differentdensities, the mobility types do. Urban areas with a high number of inhabitantsdrive significantly less by car and use the bus, tram, and/or metro significantly moreas their transportation mode.
When comparing the average speed of trips of people living in small villages in ruralareas (Table 4.9), the average speed in rural areas is higher for every mode of trans-port compared to urban areas and urban cities with more than 250.000 inhabitants.This does not mean that rural trips are also completed faster than urban trips. Onlycar trips take less time in rural areas. PT trips take longer in rural areas, but all othermodes of transport take about the same time.
Next the demographics of urban and rural areas are compared. In Table 4.10 thedifferent age distributions can be seen. Interesting to note is the large number ofparticipants below the age of 12 in both areas. Their recorded movements werepotentially influenced by the travel behaviour of their parent(s) or guardian(s). Theshare of participants in rural areas aged between 18 and 40 is lower than in urbanareas, while the share of participants in rural areas aged between 41 and 100 is higherthan in urban areas. The percentage differences are small.

44 Chapter 4. Data analysis
Urban Rural Difference
Daily 7.2 3.7 -3.4Few times a week 12.0 4.1 -8.0Few times a month 18.4 6.5 -11.9Less than ones a month 25.0 20.8 -4.2Almost never 37.4 64.9 +27.5Unknown 0.0 0.0 +0.0
TABLE 4.11: Frequency of PT usage in urban and rural areas in %(OViN 2015)
Urban Rural Difference
No means of transportation 2.0 0.7 -1.33 or more cars 3.3 7.8 +4.52 cars 27.2 39.9 +12.71 car 53.0 47.2 -5.8Motorcycle 0.4 0.0 -0.4Moped 1.5 0.4 -1.1Bike 12.4 3.7 -8.7Other 0.3 0.2 -0.1Unknown 0.0 0.1 +0.1
TABLE 4.12: Owned means of transportation in urban and rural areasin % (OViN 2015)
In Table 4.11 the difference in frequency of PT usage is shown. Rural area in-habitants use PT significantly less, as they score lower in every PT usage case. Inrural areas, almost 65% of the participants never use PT versus 37.4% in urban areas.This is a big difference, which confirms the earlier findings regarding the differencein means of transportation in the different areas. Although the difference in the ’al-most never’ category is big, the difference in daily PT usage is significantly smaller.
The noticeable differences in social participation (Table 4.13) in both areas are indivision of retirees and workers. Rural areas have more retirees and people whowork between 12 and 30 hours per week. Urban areas have more people who workmore than 30 hours per week. The differences are small and can, given the limita-tions of the sample of the dataset, not be considered strong difference.
The differences between rural and urban areas have been analysed with a high levelof abstraction. The obtained results indicate that in both areas the trip motivationis about the same, but that the use of means of transportation varies between thetwo. Rural area trips are more often performed by car, while urban area trips havea higher share of PT trips. By looking at the demographics, it was also found thatrural area inhabitants use PT less frequently. The higher use of cars in rural areaswas reflected in more households that own two or more cars. However, single carownership was higher in urban areas. Although differences in age distribution inboth areas was discovered, no significant differences in social participation werefound.
The obtained answers give insight into the average distribution of trips and de-mographics of urban and rural areas and might not be true for specific areas. Fora better estimation of the potential of specific areas, a detailed analysis of that area

4.3. Results 45
Urban Rural Difference
Working 12-30 hours per week 12.0 13.5 +1.5Working more than 30 hours per week 31.9 29.0 -2.9Household 4.4 5.1 +0.7Student 20.7 20.5 -0.2Unemployed 2.9 1.7 -1.2Incapacitated 2.7 2.1 -0.6Retired 16.2 19.7 +3.5Other 1.9 1.9 0.0Unknown 0.0 0.0 0.0Not applicable: younger than 6 years 7.4 6.5 -0.9
TABLE 4.13: Social participation in urban and rural areas in % (OViN2015)
needs to be performed. The results indicate that no significant difference betweenurban and rural demographics exists that could prevent car sharing from growingin both areas. The difference in current use and potential of car sharing in rural ar-eas could be related to geographic reasons. A less densely populated area in theorymeans less customers. This theory is one of the reasons why less car sharing compa-nies are active in rural areas. Furthermore, a lack of car sharing initiatives does notincrease the number of customers, creating a vicious circle.

46 Chapter 4. Data analysis
Question 2: First mile, last mile in PT
To look at the multimodality of travel behaviour, first the relevant multimodalitiesneed to be defined. In the dataset, each journey has a main mean of transportation,while the trips that make up the total journey can be performed by various trans-portation modes. The analysed multimodalities are based on modes where eitherthe train or the bus is the main mode of transportation. The number of metro andtram entries in the dataset is very low and only applicable in big cities and urbanareas. Therefore, only journeys in which the train or bus is given as the main modeof transportation are looked at. The train journeys are made multimodal by usingthe bus, car, bike, or by walking. The bus journeys are made multimodal by usingthe car, bike, or by walking. The dataset does not contain any entries in which thebus is the main mode of transportation and the train is one of the trip types duringthis journey.
The data from the dataset used for this analysis is cleaned by removing entriesthat do not have a departure and arrival postcode, a travel distance, or departuretime. The choice was also made to set the minimum age of respondents to 18 yearsold. Car sharing users in the Netherlands need to be at least 18 years old becausea driver’s license is required. Of the total 115,987 trips, 74,088 trips remain to beanalysed.
Of these trips, 5343 (7.2%) were trips in which the main mode of transportationwas a train. Of these trips, 1741 were performed by train. The remaining 3602 tripswere performed by other means of transportation and used to get to or away from atrain station. An overview of these trips can be found in Table 4.14. The number ofremaining trips is more than twice the number of train trips, which could mean thatevery train trip in the dataset has a trip to get to and from the train station, a first mileand a last mile. Of these remaining trips, about half (46.5%) is completed by foot andone-fourth (24.9%) is completed by bike. The bus is used for 13% of the trips. 3% ofthe trips are performed by people who switch to or from a car during their journey.This is a low amount given the large parking structures and Park&Rides near trainstations. The car drivers and passengers categories cannot be combined, because carpassengers can be dropped off while the driver continues their journey somewhereelse without using the train.
Next, the multimodality of bus journeys is reviewed. In total 1928 trips arerecorded in the database where the bus is the main transportation mode. 911 ofthese trips are performed with the bus. That leaves 1017 trips performed with othermodes of transportation. In Table 4.14 the trip division for bus as the main trans-portation mode is given. The number of additional trips is not twice as big as thenumber of bus trips, as was the case with the train trips. This means no first andlast mile are recorded for every bus trip. A possible explanation could be that busesprovide a better door-to-door service, thus not requiring additional travelling afterthe bus trip is finished. This is confirmed by the large share of walking (83%) asextra mobility. The distances that need to be covered before or after a bus trip arerelatively short. Biking is used a lot less in combination with bus travel, than withtrain travel, reflected in the 14% decrease. The share of car drivers remains roughlythe same, while no record exists of combined bus, and tram, or metro travel, wherethe bus is the main mode of transportation. With the metro or the tram as the mainmeans of transportation, a combination with buses in one journey exists. Also, nojourney exists in which the bus is the main mode of transportation and the train isused as part of the journey.
In Table 4.15, the average waiting times for either the train or bus is shown for
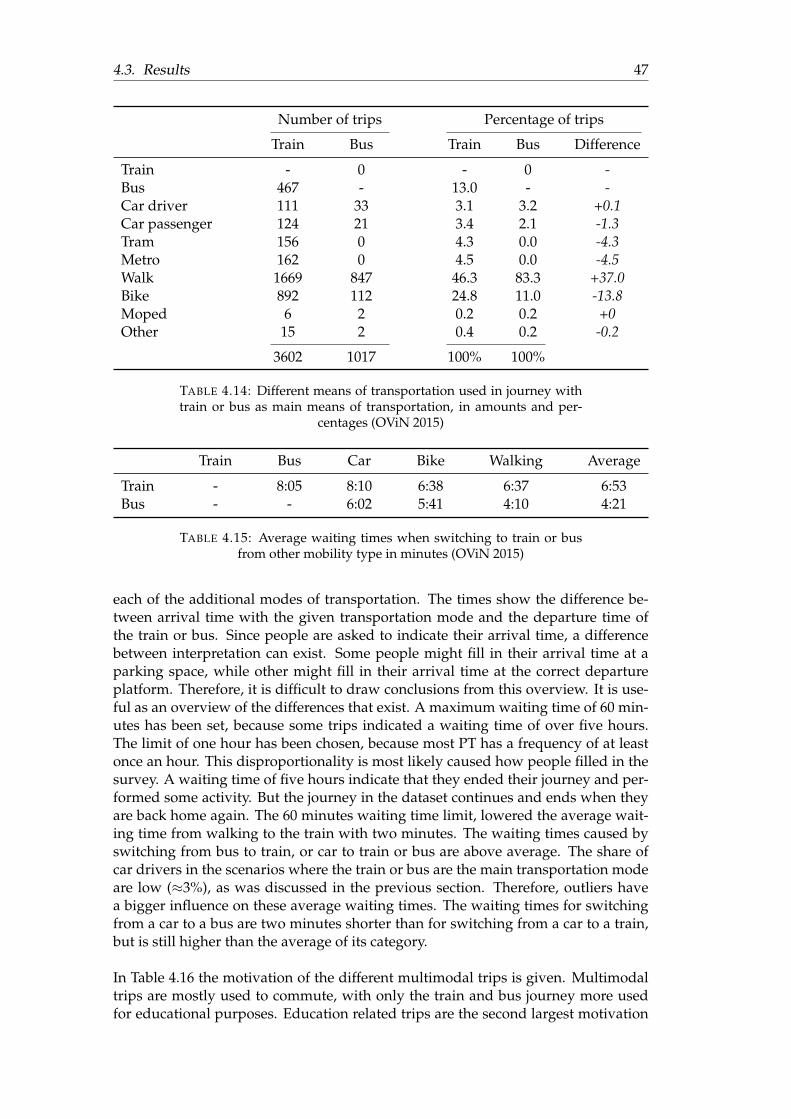
4.3. Results 47
Number of trips Percentage of trips
Train Bus Train Bus Difference
Train - 0 - 0 -Bus 467 - 13.0 - -Car driver 111 33 3.1 3.2 +0.1Car passenger 124 21 3.4 2.1 -1.3Tram 156 0 4.3 0.0 -4.3Metro 162 0 4.5 0.0 -4.5Walk 1669 847 46.3 83.3 +37.0Bike 892 112 24.8 11.0 -13.8Moped 6 2 0.2 0.2 +0Other 15 2 0.4 0.2 -0.2
3602 1017 100% 100%
TABLE 4.14: Different means of transportation used in journey withtrain or bus as main means of transportation, in amounts and per-
centages (OViN 2015)
Train Bus Car Bike Walking Average
Train - 8:05 8:10 6:38 6:37 6:53Bus - - 6:02 5:41 4:10 4:21
TABLE 4.15: Average waiting times when switching to train or busfrom other mobility type in minutes (OViN 2015)
each of the additional modes of transportation. The times show the difference be-tween arrival time with the given transportation mode and the departure time ofthe train or bus. Since people are asked to indicate their arrival time, a differencebetween interpretation can exist. Some people might fill in their arrival time at aparking space, while other might fill in their arrival time at the correct departureplatform. Therefore, it is difficult to draw conclusions from this overview. It is use-ful as an overview of the differences that exist. A maximum waiting time of 60 min-utes has been set, because some trips indicated a waiting time of over five hours.The limit of one hour has been chosen, because most PT has a frequency of at leastonce an hour. This disproportionality is most likely caused how people filled in thesurvey. A waiting time of five hours indicate that they ended their journey and per-formed some activity. But the journey in the dataset continues and ends when theyare back home again. The 60 minutes waiting time limit, lowered the average wait-ing time from walking to the train with two minutes. The waiting times caused byswitching from bus to train, or car to train or bus are above average. The share ofcar drivers in the scenarios where the train or bus are the main transportation modeare low (≈3%), as was discussed in the previous section. Therefore, outliers havea bigger influence on these average waiting times. The waiting times for switchingfrom a car to a bus are two minutes shorter than for switching from a car to a train,but is still higher than the average of its category.
In Table 4.16 the motivation of the different multimodal trips is given. Multimodaltrips are mostly used to commute, with only the train and bus journey more usedfor educational purposes. Education related trips are the second largest motivation

48 Chapter 4. Data analysis
Train Bus
Bus Car Bike Walk Car Bike Walk
To/from work 28.1 48.6 55.0 45.8 60.6 51.8 34.6Business visit 0.4 0.0 2.9 2.2 3.0 0.0 1.1Services/Personal care 3.2 0.0 1.3 1.4 0.0 0.0 9.4Shopping/Groceries 2.1 6.3 4.4 4.4 6.1 7.1 16.8Education 40.3 18.9 17.9 20.4 6.1 19.6 13.3Social visit 12.8 9.9 7.0 11.7 6.1 5.4 10.3Social recreation 9.6 10.8 8.2 10.8 6.1 13.4 11.5Tours/hiking 0.9 0.9 1.1 0.6 0.0 0.9 0.8Different 2.6 4.5 2.1 2.6 12.1 1.8 2.2
TABLE 4.16: Motivation of multimodal journeys with train and busas main trips in % (OViN 2015)
category in most multimodality journeys. The exception is the combination of busand walking, where shopping activities are more common. while in theory the busdoes not provide a lot of room for baggage.
Table 4.17 shows an overview of the distance that every part of a multimodal tripcovers. An example will be given of the first column. If the train and bus are usedtogether in a journey, 30.7% of all the train trips are at least 50 kilometres and 27.6%of all bus trips are between 5.0 and 7.5 kilometres. In bus and car multimodalitytrips, the car is used for a longer distance than the bus trips, as a higher percent-age of bus trips are shorter distances. This is not the same for the multimodal trainand car journeys. For those journeys, the train is used to travel the furthest distances.
Finally, the demographics of the discussed multimodality groups are discussed toprovide more context to the talked about findings. Table 4.18 shows an overviewof relevant demographic related categories found in the dataset. Each section in acolumn adds up to 100%.
Most transportation combinations show a higher usage in more urbanised ar-eas, but the train and car combination is mostly used in hardly urbanised areas andrelatively little used in extremely urbanised areas. Train and bike multimodal jour-neys are mostly present in extremely urban areas and to a lesser extent in stronglyurbanised areas. The bus and bike combination is mostly preferred in strongly ur-banised areas as a multimodality journey.
Both the categories where the bus is the main mode of transportation show adistinct user age group. A large share of the users is 20–29 years old or 45–54 yearsold. However, it should be noted that the bus and car combination has gaps for the20–24 and 55–64 year old categories. This is most likely caused by a limited samplesize. The train and bus mobility combination shows a large share of 20–24 year olds.These are most likely students, as the student share in the social participation is high(42.9%).
In all other multimodality categories is the people in employment group is thebiggest. This can be biased, because most citizens in a country are usually workers.The preferred multimodality type of retirees is by train and car.

4.3. Results 49
Train + bus Train + car Train + bike Bus + car Bus + bike
Train Bus Train Car Train Bike Bus Car Bus Bike
Not in NL 0.0 0.0 0.0 0.9 0.0 0.0 0.0 2.9 0.0 0.00.1–0.5 km 0.0 0.4 0.0 0.0 0.0 1.4 0.0 0.0 0.0 7.80.5–1.0 km 0.0 2.8 0.0 1.8 0.0 5.6 2.6 0.0 0.0 18.11.0–2.5 km 0.8 19.3 0.0 15.0 0.6 52.1 33.3 2.9 4.0 50.02.5–3.7 km 0.2 14.4 0.0 12.4 0.1 20.2 25.6 2.9 4.0 16.43.7–5.0 km 1.0 7.5 0.8 4.4 0.0 8.9 12.8 5.7 0.8 1.75.0–7.5 km 3.6 27.6 4.0 20.4 2.7 9.8 7.7 8.6 10.3 5.27.5–10 km 2.3 5.5 4.0 9.7 4.1 0.9 2.6 2.9 19.8 0.910–15 km 8.6 12.4 8.1 12.4 8.5 1.1 5.1 8.6 23.0 0.015–20 km 12.2 5.1 8.9 6.2 9.9 0.0 0.0 17.1 15.9 0.020–30 km 17.0 4.1 13.7 12.4 20.4 0.0 5.1 11.4 11.9 0.030–40 km 13.2 1.0 7.3 1.8 16.1 0.0 0.0 11.4 4.0 0.040–50 km 10.5 0.0 7.3 0.0 11.2 0.0 0.0 5.7 3.2 0.0>50 km 30.7 0.0 46.0 2.7 26.3 0.0 5.1 20.0 3.2 0.0
TABLE 4.17: Distance distribution of multimodal train and bus tripsin %, e.g. within a train and bus multimodal journey, 30.7% of the
train trips is longer than 50 kilometres (OViN 2015)
The multimodality travel which includes travel by car, shows a higher car owner-ship share than multimodality travel without car. For multimodality journeys with-out cars, the bike ownership is higher.
The non-car related multimodality journeys show a larger share of higher fre-quency of PT usage. Notable is that train and car multimodality show a high per-centage of PT travel of less than ones a month. The recorded trips in the datasetmight just have coincided with the incidental PT travel for that month.

50 Chapter 4. Data analysis
4.4 Conclusion
From the obtained results from the analysis, conclusions will be drawn. The conclu-sions are limited by the sample size of the dataset. Although the dataset containedover 115,000 entries, only a small number of those entries possessed the looked-forcharacteristics. Both research questions will be repeated and then answered. Finally,the question related to this chapter will be answered.
Question 1: Urban versus rural
What are the differences and similarities between urban and rural travel patterns?
The travel patterns of both areas have been analysed by looking at trip character-istics, such as means of transportation, motivation, distance and time, and demo-graphic characteristics, such as age, occupation, and PT usage frequency.
A striking similarity between both areas is the division of trip motivations. Themain motivations in both areas are (grocery) shopping, social recreation, and com-muting. No significant difference was found between the distribution of trip motiva-tion. Also, the social participation showed big similarities. Differences were foundin the share of retirees and workers, but these differences were small. The othersocial participations have evenly matched shares.
However, big differences were found in the modes of transportation betweenboth areas. Cars have a higher usage share in rural areas, especially compared tourban areas in big cities. The lower car usage in urban areas is replaced by more PTusage, while the bike share remains roughly constant. The higher the urbanisation ofan area, the lower the car driver travel share, and the higher the PT share. The largershare of car usage in rural areas is also reflected in the higher number of householdsin rural areas with 2 or more cars. However, urban areas have a higher single carownership. Urban areas were found to have a larger share of people between theage of 20 and 40, while rural areas were found to have a higher share of peoplebetween the age of 60 and 70. The age group in urban areas was also found inliterature to be the age group of the majority of current car sharing users. As wasdiscussed in chapter 2, this age group is often the early adopters of new technology.The trip characteristics show that trips in rural areas cover a longer distance, but takeless time. Every mode of transportation in rural areas has a higher average speedcompared to urban areas.
Question 2: First mile, last mile in PT
What are characteristics of the first and last mile of a PT trip?
To analyse the characteristics of multimodal PT trips, different multimodality tripswere defined. The train and the bus were chosen as two main mobility categories.Travelling by car, bike, and walking were defined as additional mobility modes. Inthe case of train travel, the bus was also considered an additional mobility type.
The ability to draw conclusions from the findings is limited by the uncertaintyof the accuracy of the filled in data by the participants of the survey. For example,it was found that half of all the multimodal bus journeys were actual bus trips. Thismeans bus trips only have a first or a last mile.
Walking is part of the majority of multimodal trips, both for train and bus. Thesecond largest multimodality mode of transportation is the bike. The share of cars

4.4. Conclusion 51
within multimodal trips is small, but constant in both the scenarios. The waitingtimes to switch from car to train or bus were found to be significantly longer thanfor switching from bike or walking.
The main motivation for people to perform multimodal trips are commute trips,with education related trips in second. Combining train with bus was found to bemost used for education related trips. This was also found by looking at the age andsocial participation of this group. Multimodal train journeys which involved carswere found to be performed mostly in hardly urbanised areas. This can be relatedto the first research question of this chapter as it shows potential for car sharing inhardly urbanised areas. Multimodal trips seem to attract a specific age group, assome age groups are over represented. However, given the limitations of the samplesize, it can be caused by a lack of more data entries.
Chapter question
What kind of candidate features can be found in or deduced from travel behaviour?
The two studied areas show large similarities and few differences. Rural areas showa higher car usage and ownership than urban areas, which indicates that the infras-tructure and trips are suited for car sharing. However, the difference between thetwo areas could be related to the lower population density. Car sharing should offerthe same reliability in these areas as in higher density population areas. This canbe more difficult because a lower population density means less demand per carlocation. As was found in chapter 3, a car sharing parking location close to one’shouse increases one’s use incentive. Car sharing should incorporate a mechanism tosupply cars where demand exists, to create a reliable service.
The higher number of cars per household in rural areas could be a focus point ofa market strategy in rural areas. By creating awareness about the amount of time acar spends stationary each day and the fixed amount of money car ownership costs,the financial benefit of car sharing could become a major selling point. Especially ifno mobility is lost.
The analysis of multimodality showed that the car is barely used in combinationwith the bus or train, as was also found in chapter 3. Multimodal trips with cars weremainly commute trips. As found in literature, commute trips are predominantlyperformed by one-way car sharing services.
Multimodality can be increased, and waiting times can be decreased, by inform-ing users about PT connections, expected arrival times and delays.

52 Chapter 4. Data analysis
Train Bus
Bus Car Bike Car Bike
Level of urbanisationExtremely urbanised 33.7 9.3 37.2 15.2 18.6Strongly urbanised 32.6 20.7 32.8 32.6 49.2Moderately urbanised 17.1 23.1 14.3 18.2 12.0Hardly urbanised 13.5 42.1 12.1 14.4 15.0Not urbanised 3.1 4.8 3.5 19.7 5.2
Age18 – 19 years 11.7 3.7 6.9 3.0 5.720 – 24 years 34.8 17.0 22.2 0.0 25.425 – 29 years 9.5 14.3 11.5 33.3 17.230 – 34 years 4.9 5.7 8.6 4.5 4.135 – 39 years 5.3 0.0 10.1 5.3 6.640 – 44 years 4.7 4.0 8.9 3.8 1.445 – 49 years 4.4 18.1 9.5 25.0 10.050 – 54 years 5.5 9.9 8.5 18.2 20.055 – 59 years 6.8 5.9 7.0 0.0 6.160 – 64 years 5.1 4.8 2.5 0.0 0.065 – 69 years 2.1 7.3 3.4 3.8 2.770 – 74 years 2.9 7.7 0.7 3.0 0.975 – 79 years 0.9 1.5 0.0 0.0 0.080 years or older 1.5 0.0 0.2 0.0 0.0
Social participationWorking 12-30 hours per week 11.6 13.7 15.2 22.7 17.5Working more than 30 hours per week 32.2 49.1 51.6 53.8 46.5Household 1.2 1.5 1.1 0.0 1.6Student 42.9 19.8 24.6 16.7 23.4Unemployed 1.3 0.9 0.9 0.0 4.1Incapacitated 0.4 0.0 0.7 0.0 1.1Retired 8.2 15.0 4.5 6.8 3.6Other 2.1 0.0 1.4 0.0 2.3Unknown 0.0 0.0 0.0 0.0 0.0
Owned means of transportationNo means of transportation 1.3 0.0 0.0 0.0 0.03 or more cars 3.1 11.2 1.9 13.6 3.22 cars 20.1 47.1 15.4 30.3 23.61 car 45.3 38.3 51.3 42.4 52.2Motorcycle 0.5 0.0 0.8 0.0 0.0Moped 0.0 0.0 1.9 0.0 0.9Bike 29.4 3.3 28.3 13.6 20.2Unknown 0.0 0.0 0.4 0.0 0.0
Public transportation usage frequencyDaily 47.6 39.0 46.1 30.3 44.7Few times a week 40.7 27.8 41.8 31.8 38.1Few times a month 7.8 16.3 8.7 33.3 11.1Less than ones a month 3.6 17.0 3.1 0.0 6.1Almost never 0.4 0.0 0.4 4.5 0.0
TABLE 4.18: Demography of different multimodal trips in % (OViN2015)

53
Chapter 5
Car sharing features
In this chapter, the found candidate features will be discussed. First, the criteria afeature needs to comply with are considered. Secondly, the found candidate featureswill be presented. Thirdly, the compatibility of features will be examined. Fourthly,the dependency of features on each other or external sources is investigated. Finally,recommendations are formed.
5.1 Criteria
As was defined in chapter 1, a feature is a distinctive attribute or element which,when implemented correctly, profits/benefits (or at least not harms) at least onestakeholder group. The considered stakeholders involved with car sharing are users,car sharing companies, governments, and the environment. During the feature gath-ering phase, the perspective of users was used. However, when assessing the possi-ble implementation of a feature, all stakeholders need to be considered.
The main preferences of the different stakeholders are now sketched on an abstractand simplified level.
Users of a car sharing service want a service that offers them the same mobilityas owning a car, with a lower cost. Convenience is a big priority.
Car sharing companies want to capture and expand their market share, offer abetter service than their competitors, and earn money.
Governments (local and central) want to provide citizens with a high level of mo-bility to improve area accessibility and attractiveness.
The environment wants reduced pollution, and less emission of harmful gases.
Stakeholders could have conflicting interests. For example, users want a cheap ser-vice and spend as little money as possible. Service providers on the other hand wantto make a profit and need to ask an at least cost covering price.
Features should work together to create a better service. If a feature is counteringthe effects of another feature, the positive effect is weakened or reversed.
It should be feasible for car sharing companies to implement a feature. Feasibilitycan, for example, be measured in terms of costs or implementation time. If a featurewould take multiple years to be correctly implemented and is not vital for the currentfunctioning of the service, risks arise. It is unknown whether the feature would stillbe desired in the future.

54 Chapter 5. Car sharing features
Feature Summary
Trip typesRound trips The start and end location of the rental period are identicalOne-way trips The start and end location of the rental period can be different
Dedicated parking spacesStation based When not being rented, a vehicle is positioned at a dedicated parking spotFree floating When not being rented, a vehicle can be positioned at any public parking spot
ReliabilityAvailability The assurance that when needed, a vehicle is always at one’s disposalAccessibility The distance between user and vehicle start location should be minimalUp-to-date vehicles The vehicles are well maintained, do not break down, and fuel-efficient
FlexibilityDifferent types of vehicles Depending on the travel needs, an appropriately sized vehicle can be chosenLow reservation time Spontaneous trips can be undertaken
Cost educationInsight into savings Provide (potential) customers with more understanding about the financial side
PersonalisationPlanning In advance route planning shows mobility alternatives and PT possibilitiesTravel information While renting, information is provided about travels changes and delaysDiscount Customers are rewarded for ending rental periods in optimal demand locationsKey cards Customers can register their own card to open a car
Autonomous vehiclesVehicle repositioning Vehicles automatically reposition themselves to areas with (potential) demandTaxi fleet The whole car sharing fleet is made autonomous and functions as a taxi service
TABLE 5.1: Overview and one sentence summary of the found candi-date features in the previous chapters
5.2 Overview
In this section, the candidate features found in the previous chapters are discussed.An overview of the features can be found in Table 5.1.
The primary differentiating feature between different car sharing services is the de-gree of freedom to pick a location to end a rental period. Round trip car sharingrequires users to end their rental period at the same location as the starting location,while one-way car sharing allows users to end their rental period at a different locationthan their starting location. This difference attracts different usage patterns and cre-ates different market potentials. One-way requires more planning, as the geographicdistribution of vehicles can change over time.
Another feature that defines the degree of freedom granted to users is the us-age of dedicated parking spaces for car sharing cars. Free floating services offer theirusers the freedom to park the car wherever they want, given some predefined arealimitations. Station based services limit the freedom of users by restricting them touse a particular parking space, but reward users by offering them a parking spot.This removes the stress induced by searching for a parking spot. Also, no additionalparking fees need to be paid. The fixed places to park also make it easier for users toremember where they can pick up a vehicle and start their journey. Through govern-mental collaboration, car sharing companies can position parking spots in or closeto areas with high demand.
Offering reliability was found to be very important. Travellers want to be assuredthat they can finish their journey once started. Availability of cars is crucial for thereliability of the service. Therefore, a geographically well-distributed vehicle fleetwith cars available at places with demand is required. Correct demand estimationsare important to be able to provide this availability.
Reliability is influenced by well-functioning vehicles. When a car breaks down, thefleet size decreases and the driver has a bad experience. Therefore, vehicles need to

5.3. Compatibility 55
be well maintained and timely replaced. An advantage of this is that the fleet is keptup-to-date with technological and fuel efficiency improvements.
By keeping the required reservation time low, spontaneous and unplanned tripscan also be performed by car sharing. A short minimal reservation time increasesthe flexibility of the service and mimics the characteristics of owning a car.
A way to offer more mobility than a private car would, is giving people the abil-ity to choose between different vehicle sizes. Different travel motives could requirespecific types of vehicles, such as a vehicle with a large trunk when buying furni-ture. It is important to inform and educate users about the various vehicle types, tohave their mobility needs fulfilled correctly.
It is also important to educate (potential) users about the costs of car sharing. Theremoval of fixed costs compared to car ownership are considered important and seenas a big motivation to start using car sharing. However, the costs of a car sharingtrip, calculated in terms of distance and/or time, are perceived as high. By giving anestimation of the trip costs beforehand, the user does not get an unpleasant surprisewhen the trip is ended. Another way to make the financial benefits more evident isproviding more insight into the savings which can be achieved with car sharing. Thiscan, for example, be achieved by letting users calculate the amount of money theycould save when replacing their current private car usage by car sharing.
Other forms of information and personalisation are also important. During a trip,information can be provided about delays on the road or in PT. This offers users theability to be extra flexible and change their route on the fly. Personalisation can alsohappen in the form of discounts. For example, it can be used to motivate a user toend his rental period in an area with (potential) demand. In return, the user gets anumber of free kilometres for his next usage.
Car sharing can offer a level of convenience that other mobility types cannot offer.Convenience and personalisation can be improved by allowing users to open a carwith something else than a company provided card. For example, by using theirPT card, mobile phone or registering their own card (e.g. drivers licence). Thisdecreases the possibility of missing the necessities to open a car.
Integration of autonomous vehicles could evolve the current car sharing imple-mentation. An autonomous taxi fleet could be created which can pick up and dropoff people anywhere they want. Or in a less disruptive scenario, it can be used toreposition cars from areas with low demand to areas with high demand.
5.3 Compatibility
In this section, the compatibility of features is discussed. First, features are comparedagainst each other for consistency. Secondly, the compatibility of the features interms of the different stakeholders is discussed.
5.3.1 Feature combinations
Two conflicting features are either offering one-way or round trips. The companies onthe market have all chosen one or the other as specialisation. Round trip prohibitsone-way trips, but one-way allows round trip journeys, as the user is also allowedto return to his start location. Implementing one-way trips requires more activeplanning because the vehicles are not returned to the same location. Therefore, thegeographic distribution of the vehicles could change.

56 Chapter 5. Car sharing features
When creating a P2P-based car sharing service, it is impossible to offer a one-waytrip service. Even if no physical transfer of car keys is needed. The people who leaseout their car want to know when their car returns, otherwise they compromise theirown mobility.
Combining one-way and station based car sharing limits the freedom provided bythe one-way trips. When a user is obligated to use a company provided parking spot,his destination location flexibility is limited. The advantages of a dedicated parkingplace are not applicable in all scenarios, as parking places are not always close to thedestination of a user. One-way in combination with free floating provides the samemobility as a private car would.
The advantages of dedicated parking spots seem to be very important for currentusers. However, it could be argued that parking spots would not be useful whencar sharing is transformed into an autonomous taxi network. The cars do not need tobe parked and can drive around until somebody requests their services. This wouldmake investments in parking places not future proof. However, the usage and visi-bility of parking spots could still be an advantage, especially at transportation hubs.The parking spots can be used as easy pick up locations and reduce the fuel con-sumption of not used vehicles.
5.3.2 Stakeholders
The candidate features described in section 5.2 were found by using the user per-spective. In this section, the benefits for the other stakeholders is checked. Not allfeatures are relevant for each stakeholder. Therefore, only the relevant features foreach stakeholder will be discussed.
Car sharing companies
Of the supported trip types of car sharing, one-way trips provide its users the mostfreedom. However, it is the most difficult trip type for companies to implementcorrectly, especially in combination with free floating. If a balanced distribution isnot automatically created, additional balancing needs to be done. One possibilityis to hire people to manually reposition vehicles. However, this is very expensiveand inefficient. Another possibility is to motivate users to end their rental period inan area with high demand by offering them discounts or achievements. Planningsoftware to automate this process would need to be created.
Although the creation of dedicated parking spots costs money, time, and effort, itcan be very beneficial for car sharing companies. It provides recognisability and iseffectively advertisement. It was found to be a wanted feature by many users. Nothaving to search for a parking spot removes one of the disadvantages of driving aprivate car.
Companies want to supply their customers with reliable vehicles, which meansregular maintenance and replacement of vehicles. Keeping the vehicles up-to-date isa disadvantage, because it means that companies need to keep reinvesting in carinventory without expanding the fleet size. On the other hand, by replacing oldercars with more fuel-efficient cars, fuel costs can be reduced.
Offering different vehicle sizes is beneficial for users, as they can pick a suitablecar for different travel needs. This creates a heterogeneous vehicle fleet. This is adisadvantage for car sharing companies because it makes vehicle distribution andmaintenance more difficult. Within the normal vehicle distribution, the different

5.4. Dependency 57
types of vehicles also need to be distributed. Otherwise, the different vehicles typescannot be exploited by all users.
The implementation of AVs into the vehicle fleet is advantageous for car sharingcompanies, independent of the willingness of people to ride in an AV. For example,people could still be allowed to drive in the vehicles, and the autonomous func-tionality could only be used to reposition the vehicles. This removes the need formanual repositioning, which has a high operating cost. Companies can invest insoftware that optimises the repositioning of AVs to areas with high demand.
Government
By actively working together with car sharing companies, governments can adaptthe planning of certain areas and incorporate car sharing parking places. Both in newand already developed areas. This allows them to increase the mobility of theirinhabitants.
A vehicle fleet consisting of up-to-date vehicles has the advantage of lower emis-sions. Transportation is a big part of the total CO2 emissions. Lower emissions areimportant for governments as they are required to meet emission reduction goals.
One of the probable advantages of an autonomous taxi fleet is the reduced parkingneed. The size of the total fleet of vehicles can be reduced, leading to less cars re-quiring a parking place. This allows governments to reallocate the ground currentlyoccupied by parking structures.
Environment
The availability of cars is very important for the reliability of car sharing. The avail-ability of cars can be increased by expanding the vehicle fleet. However, for theenvironment a small fleet size is more beneficial, as the manufacturing of cars alsoemits harmful gases.
An advantage for the environment is the timely replacement of older vehicles.Fuel-efficient vehicles are a result of keeping the fleet up-to-date. The disadvantage ofemission of harmful gases during the manufacturing of the cars is also applicable inthis situation.
The transition of car sharing into an autonomous taxi fleet could also be benefi-cial for the environment. AVs are expected to be more fuel-efficient and likely notpowered by fossil fuels.
5.4 Dependency
In this section, feature combinations are discussed which can only be implementedtogether, require collaboration, or need additional technological advancements be-fore they can be implemented.
Round trip car sharing is mostly used in combination with station based parking. Whena car is not being used, it is parked on a dedicated parking space. This gives the userthe guarantee that a parking place is always available when returning to the startinglocation to end the rental period.
Creating dedicated parking spaces requires permission of and collaboration with (lo-cal) governments and policy makers. The parking spaces have to be paid for, butin return, collaboration provides companies with more business contacts and betterintegration into the existing infrastructure.
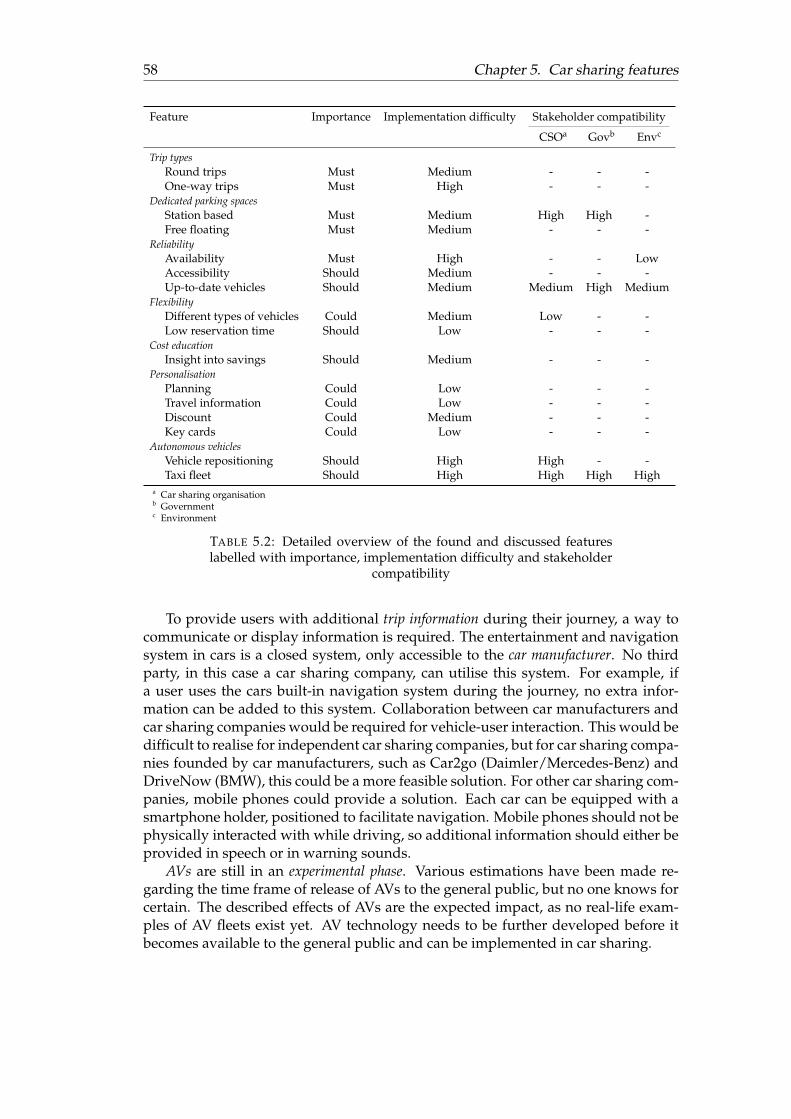
58 Chapter 5. Car sharing features
Feature Importance Implementation difficulty Stakeholder compatibility
CSOa Govb Envc
Trip typesRound trips Must Medium - - -One-way trips Must High - - -
Dedicated parking spacesStation based Must Medium High High -Free floating Must Medium - - -
ReliabilityAvailability Must High - - LowAccessibility Should Medium - - -Up-to-date vehicles Should Medium Medium High Medium
FlexibilityDifferent types of vehicles Could Medium Low - -Low reservation time Should Low - - -
Cost educationInsight into savings Should Medium - - -
PersonalisationPlanning Could Low - - -Travel information Could Low - - -Discount Could Medium - - -Key cards Could Low - - -
Autonomous vehiclesVehicle repositioning Should High High - -Taxi fleet Should High High High High
a Car sharing organisationb Governmentc Environment
TABLE 5.2: Detailed overview of the found and discussed featureslabelled with importance, implementation difficulty and stakeholder
compatibility
To provide users with additional trip information during their journey, a way tocommunicate or display information is required. The entertainment and navigationsystem in cars is a closed system, only accessible to the car manufacturer. No thirdparty, in this case a car sharing company, can utilise this system. For example, ifa user uses the cars built-in navigation system during the journey, no extra infor-mation can be added to this system. Collaboration between car manufacturers andcar sharing companies would be required for vehicle-user interaction. This would bedifficult to realise for independent car sharing companies, but for car sharing compa-nies founded by car manufacturers, such as Car2go (Daimler/Mercedes-Benz) andDriveNow (BMW), this could be a more feasible solution. For other car sharing com-panies, mobile phones could provide a solution. Each car can be equipped with asmartphone holder, positioned to facilitate navigation. Mobile phones should not bephysically interacted with while driving, so additional information should either beprovided in speech or in warning sounds.
AVs are still in an experimental phase. Various estimations have been made re-garding the time frame of release of AVs to the general public, but no one knows forcertain. The described effects of AVs are the expected impact, as no real-life exam-ples of AV fleets exist yet. AV technology needs to be further developed before itbecomes available to the general public and can be implemented in car sharing.
5.5. Recommendations 59
5.5 Recommendations
With the candidate features analysed, a new table can be created to summarise thefindings. In Table 5.2, features are given an importance and implementation diffi-culty rating, as well as a compatibility rating with the different stakeholders.
The importance of features is categorised using the MoSCoW method (Vliet,2007). This method has four qualifiers to identify the priority of requirements orin this case features: (1) Must haves, this feature is needed, and the service will notfunction correctly without it, (2) Should haves, this feature is important, but not cru-cial for a usable service, (3) Could haves, features that will only be implementedwhen time is available, (4), Won’t haves, the feature will be left out, but might beused in a future iteration. The table was filled in based on the perceived importancefrom the previous chapters. For example, inferred features are rated with a lowerpriority than features found in existing services and literature.
Although conflicting and dependent features were found, no "won’t have" fea-tures were identified. Car sharing will not have AVs yet, but should in the nearfuture start experimenting with them. When the tests are successful, the importancemight change from should have to must have. Within the trip types and dedicatedparking spaces category, all the features have been given the must have identifier.However, within each category, a choice needs to be made for one of the features.This choice will create the foundation upon which the car sharing service will bebuilt, so it is an important choice.
The implementation difficulty of features was rated on a three-step scale rangingfrom high to low difficulty. The rating is based on expected implementation timeand costs required to successfully implement the feature.
The stakeholder compatibility is derived from the discussion of stakeholders insubsection 5.3.2 and ranges from high to low compatibility. Only the discussed com-patibilities are shown in the table, the rest is noted with a ’-’. High compatibilitymeans that the feature is beneficial for the stakeholder, while low compatibilitymeans implementation is disadvantageous for the stakeholder. Medium compati-bility means no direct influence, or both advantages and disadvantages exist. Forexample, keeping the vehicle fleet up-to-date is rated as medium compatibility forcar sharing organisations. Potential benefits are lower maintenance costs, less carfailures, better environmental image, and lower fuel costs. However, potential dis-advantages are mostly financial, as companies need to keep reinvesting in vehicles,and new vehicles have a higher depreciation. No weighting factors have been deter-mined, so it is impossible to say which advantages and disadvantages have a higherimportance. Therefore, the compatibility has been labelled as medium. Car sharingorganizations must make their own decision.
5.5.1 Research question
The research question that this thesis tried to answer is:
What are the key design features of a shared vehicle fleet to stimulate adoption and socialsupport amongst the general public?
A list of features has been created, but this list is not set in stone. The list can bechanged, by adding or removing features. Car sharing companies need to decidewhich features they want to implement. Features that must be implemented, shouldbe looked at first. The distinction between offering round trips or one-way trips

60 Chapter 5. Car sharing features
should be made, followed by whether dedicated parking spaces will be provided.The type of trips, location and demographics that the company wants to facilitate,should be used as a guide for picking the most fitting implementation. Secondly, aplan needs to be made and implemented on how to guarantee vehicle availabilityto users, as availability is crucial for good user experience. Thirdly, features withhigh importance, low implementation difficulty and high stakeholder compatibilityshould be considered. A feature fitting these criteria is the low reservation time.Fourthly, the personalisation of the service should be looked at. Although not highon the importance list, its implementation difficulty is estimated to be relatively low.These extra features could distinguish one service from another.
Before these decisions are made, car sharing companies need to get to know theirtarget audience and their needs. Car sharing services should fit to their users, andnot the other way around. By understanding the decision-making behaviour to joina car sharing service, car sharing can be made more attractive (Kim et al., 2017).
Marketing and consumer education could be used to reach and attract a wideraudience. These channels can be used to explain the individual and society-widebenefits of car sharing. The willingness to join and use a car sharing service is higher,if people know about car sharing (Dieten, 2015). Not only the adoption is increased.If the benefits for society are also established, social opinion will be in favour of carsharing.
It should be noted that caution needs to be taken if car sharing is expandingtoo quickly. B2C car sharing requires large financial investments to scale with thegrowth of the user base. If the size of the vehicle fleet cannot keep up with the sizeof the demand, the availability of cars drops. Low availability leads to bad user ex-perience and unhappy customers. Therefore, growing too fast could be destructivefor the long-term future of car sharing. A steady growth rate at which the fleet sizecan keep up with demand is ideal.

61
Chapter 6
Conclusion and outlook
In this chapter, conclusions are drawn about the opportunities identified in chap-ter 1. Next, the used information sources are discussed and evaluated.
6.1 Conclusion
The current market share of car sharing does not match the potential estimated inliterature. To determine how the estimated potential can be reached, various unex-ploited opportunities for car sharing have been identified and explored. The goalwas to find features that would increase the utilisation and acceptance of car shar-ing as a capable mobility alternative. The traveller’s perspective was taken to findmobility preferences, and identify wanted and unwanted features. Three existing in-formation sources (literature, online reviews, and a mobility dataset) were identifiedand analysed.
In literature, car sharing was found to be mostly used for shopping, and socialactivity related trips. The reduced fixed costs are the main motivation to join a carsharing service. The opportunity of AV technology for car sharing was also iden-tified in literature. AVs can be used to create an autonomous taxi network. Thisdecreases the number of cars required for everybody to fulfil their travel needs andincreases the amount of potential car sharing users.
By studying online reviews, a better understanding of the users of car shar-ing was created. Although car sharing companies with PT collaboration were re-searched, no reviews were found discussing this collaboration.
The mobility dataset was investigated to find PT integration in the recorded jour-neys. Multimodality with either bus or train, was observed in a small share of thejourneys. Within this share, cars were not a common means of transportation in aPT multimodality journey. However, influencing factors have been identified, suchas transfer times and the level of urbanisation.
The mobility dataset was also used to determine mobility differences in urbanand rural areas. No significant differences in trip motivation and demographicswere found. The means of transportation used in both areas did differ. In ruralareas, more journeys were performed by car, but less journeys were performed withPT.
From each information source, various candidate features appeared. These fea-tures have been reviewed and evaluated according to defined criteria. Combinationsof features were checked, as well as potential benefits of features for the consideredstakeholder groups. By involving different stakeholders in the evaluation of thefound features, the initial focus on (potential) customers has been balanced.
It is argued to be impossible to implement all the found features. Not all featurecombinations improve car sharing or are deemed beneficial for one or more of thestakeholders. Furthermore, not all features can be implemented yet. Some features

62 Chapter 6. Conclusion and outlook
require more advanced technology, while others require intensive collaboration be-tween multiple parties. Through collaboration and technological advancements, ex-isting features will evolve and new features will arise. Flexibility of car sharingservices is important to be able to adjust to partner and market needs.
This research provides insights from the consumer perspective on mobility, whichcan be used by different parties as guidelines to improve car sharing or mobility ingeneral. It can be used by governments and policy makers to explore the potentialbenefits and requirements of incorporating car sharing into their current PT set-up.Car sharing companies can further investigate the proposed features and check thefeasibility for their specific service. For researchers, this paper provides an overviewof the available car sharing literature and presents alternative information gatheringmethods. These methods can be expanded and adjusted to fit to other locations ofinterest in future research.
6.2 Discussion
By combining conventional and unconventional information sources for car shar-ing research, new insights have been found. The three information sources will bediscussed and evaluated.
Literature is a commonly used information source and was expected to give clearinsights into already researched implementation possibilities of car sharing, since alot of car sharing studies can be found. However, some of the discussed literatureshowed inconsistent findings. These inconsistencies show that the success of carsharing is highly dependent on context and external influences, and can be an ex-planation for the lack of a success formula for car sharing. The literature does notagree on a uniform service to fit the criteria of all potential users.
Using online reviews is less conventional, but provided information that wouldbe difficult to obtain via surveys. The results represent what people deem importantenough to take the initiative themselves and to post online. The ability to drawgeneralisable conclusions is limited by an unknown sample distribution and by thenumber of reviews found in Dutch. This method is valuable for idea generating, butshould, given its limitations, not be used to validate findings from other sources.
The daily mobility dataset contains a lot of entries and shows the travel patternof one specific day of a participant. If not zooming in on specific journey types, thesample provides a lot of entries. However, when zooming in on very specific be-haviour, the sample size becomes small. This makes it difficult to draw conclusions.By enriching the data with other datasets, more information can be collected. Bymatching similar areas, for example, by comparing the proximity of services in thevicinity (CBS, 2016c), the results of one area can be extrapolated to another. Theanalysis done in this thesis can also be applied to the OViN dataset of 2016, whichat the moment of writing, is expected to be published within a month. Differencesbetween the two years can be investigated.
Future research is not only related to further exploitation of the described in-formation sources, but also to verify the findings in this thesis. Since this thesisprovides a theoretical foundation for new features, the practical application of thefeatures should, for example, be tested via a survey or by implementation.
Although car sharing has not yet reached its potential, it is still showing a lot ofpromise. The identified features show possibilities for car sharing to grow. New

6.2. Discussion 63
technological advancements will help car sharing improve and outgrow its esti-mated potential. Until the technology becomes available, car sharing organisationscan experiment with various features and prepare for the future.


65
Bibliography
ANWB (2017). Drie procent filegroei in eerste kwartaal 2017. URL: https://www.anwb.nl/verkeer/nieuws/nederland/2017/april/filezwaarte-maart (visited on 05/24/2017).
Arbib, James and Tony Seba (2017). Rethinking Transportation 2020-2030. Tech. rep.Baumeister, Roy F et al. (2001). “Bad Is Stronger Than Good”. In: Review of General
Psychology 5.4, pp. 323–370.Becker, Henrik, Francesco Ciari, and Kay W Axhausen (2017). “Comparing car-sharing
schemes in Switzerland: User groups and usage patterns”. In: Transportation Re-search Part A 97, pp. 17–29.
Beiraõ, Gabriela and J A Sarsfield Cabral (2007). “Understanding attitudes towardspublic transport and private car: A qualitative study”. In: Transport Policy 14,pp. 478–489.
Bendixson, Terence and Martin G Richards (1976). “Witkar: Amsterdam’s self-drivehire city car”. In: Transportation 5, pp. 63–72.
Bert, Julien et al. (2016). Whats Ahead for Car Sharing? The New Mobility and Its Impacton Vehicle Sales. Tech. rep. Boston Consulting Group.
Bischoff, Joschka and Michal Maciejewski (2016). “Simulation of city-wide replace-ment of private cars with autonomous taxis in Berlin”. In: Procedia - Procedia Com-puter Science 83, pp. 237–244. ISSN: 1877-0509.
Brownell, Christopher Kirlin (2013). “Shared Autonomous Taxi Networks : An Anal-ysis of Transportation Demand in NJ and a 21 st Century Solution for Conges-tion”. Bachelor Thesis. Princeton University.
Burkhardt, J. E. and A. Millard-Ball (2006). “Who is attracted to carsharing?” In:Transportation Research Record 1986, pp. 98–105.
CBS (2015). Jaarmonitor Wegvoertuigen: Kilometers (2014). Tech. rep.— (2016a). Jaarmonitor Wegvoertuigen: Aantallen (2015). Tech. rep.— (2016b). Jaarmonitor Wegvoertuigen: Kilometers (2015). Tech. rep.— (2016c). Nabijheid voorzieningen; buurtcijfers 2015. URL: https://www.cbs.nl/
nl-nl/maatwerk/2016/16/nabijheid-voorzieningen-buurtcijfers-2015 (visited on 06/26/2017).
— (2016d). Onderzoek Verplaatsingen in Nederland 2015. Tech. rep.— (2017a). Definitions. URL: https://www.cbs.nl/en-gb/our-services/
methods/definitions?tab=d\#id=degree-of-urbanisation (visitedon 05/19/2017).
— (2017b). Definitions. URL: https://www.cbs.nl/en-gb/our-services/methods/definitions?tab=u\#id=urban-area (visited on 05/30/2017).
— (2017c). Definitions. URL: https://www.cbs.nl/en-gb/our-services/methods/definitions?tab=r\#id=rural-area (visited on 05/30/2017).
— (2017d). Jaarmonitor Wegvoertuigen: Aantallen (2016). Tech. rep.Cervero, Robert et al. (2002a). “City CarShare: Assessment of Intermediate-Term
Travel-Behavior Impacts”. University of California at Berkeley.Cervero, Robert et al. (2002b). “City CarShare: Assessment of Short-Term Travel-
Behavior Impacts”. University of California at Berkeley.

66 BIBLIOGRAPHY
Cervero, Robert, Aaron Golub, and Brendan Nee (2006). “San Francisco City Car-Share: Longer-Term Travel-Demand and Car Ownership Impacts”. University ofCalifornia at Berkeley.
Chen, T Donna, Kara M Kockelman, and Josiah P Hanna (2016). “Operations of ashared, autonomous, electric vehicle fleet: Implications of vehicle & charging in-frastructure decisions”. In: Transportation Research Part A 94, pp. 243–254.
Cheng, Yung-Hsiang (2010). “Exploring passenger anxiety associated with train travel”.In: Transportation 37, pp. 875–896.
Chowdhury, Subeh and Avishai Ceder (2013). “The effect of interchange attributeson public-transport users’intention to use routes involving transfers”. In: Psy-chology and Behavioral Sciences 2.1, pp. 5–13.
Costain, Cindy, Carolyn Ardron, and Khandker Nurul Habib (2012). “Synopsis ofusers’ behaviour of a carsharing program: A case study in Toronto”. In: Trans-portation Research Part A 46, pp. 421–434.
CROW-KpVV (2016). Autodelen KpVV Dashboard duurzame en slimme mobiliteit. URL:http://kpvvdashboard-4.blogspot.nl/ (visited on 04/13/2017).
Daziano, Ricardo A, Mauricio Sarrias, and Benjamin Leard (2017). “Are consumerswilling to pay to let cars drive for them? Analyzing response to autonomousvehicles”. In: Transportation Research Part C 78, pp. 150–164.
Dictionary, Oxford (2017). Public transport. URL: https://en.oxforddictionaries.com/definition/public_transport (visited on 05/23/2017).
Dieten, R J (2015). “Identifying preferences regarding carsharing systems using astated choice experiment among car users to identify factors of influence”. Mas-ter Thesis. Eindhoven University of Technology.
Ellaway, Anne et al. (2003). “In the driving seat: psychosocial benefits from privatemotor vehicle transport compared to public transport”. In: Transportation ResearchPart F 6, pp. 217–231.
Fagnant, Daniel, Kara M Kockelman, and P Bransal (2015). “Operations of a SharedAutonomous Vehicle Fleet for the Austin, Texas Market”. In: Transportation Re-search Record 2536, pp. 98–106.
Firnkorn, Jörg (2012). “Triangulation of two methods measuring the impacts of afree-floating carsharing system in Germany”. In: Transportation Research Part A46, pp. 1654–1672.
Fitchard, Kevin (2012). Ford is ready for the autonomous car. Are drivers? URL: https://gigaom.com/2012/04/09/ford-is-ready-for-the-autonomous-car-are-drivers/ (visited on 06/07/2017).
Forum, International Transport (2015). Urban Mobility System Upgrade. Tech. rep.Gardner, Benjamin and Charles Abraham (2007). “What drives car use? A grounded
theory analysis of commuters’ reasons for driving”. In: Transportation ResearchPart F 10, pp. 187–200.
Glotz-Richter, Michael (2016). “Reclaim Street Space! – Exploit the European Poten-tial of Car Sharing”. In: Transportation Research Procedia 14.14, pp. 1296–1304.
Grasset, Vincent and Catherine Morency (2010). “Carsharing: Analyzing the Interac-tion Between Neighborhood Features and Market Share”. In: Transportation Re-search Board 89th Annual Meeting.
Guiver, J W (2007). “Modal talk: Discourse analysis of how people talk about busand car travel”. In: Transportation Research Part A 41, pp. 233–248.
Hagman, Olle (2003). “Mobilizing meanings of mobility: car users’ constructions ofthe goods and bads of car use”. In: Transportation Research Part D 8, pp. 1–9.
Halko, Timo (2012). “Designing public transportation for private car users”. MasterThesis. Aalto University.

BIBLIOGRAPHY 67
Harms, Lucas (2008). “Overwegend onderweg”. In: Social en Cultureel Planbureau.Hart, Jorrit van ’t (2012). “Increasing customer satisfaction with public transport”.
Master Thesis. TU Delft.Hiscock, Rosemary et al. (2002). “Means of transport and ontological security: Do
cars provide psycho-social benefits to their users?” In: Transportation Research PartD 7, pp. 119–135.
Hobrink, Stephan (2014). “Explaining Regional Adoption Differentials in Dutch CarSharing Markets”. Master Thesis. Universiteit Utrecht.
Jensen, Mette (1999). “Passion and heart in transport — a sociological analysis ontransport behaviour”. In: Transport Policy 6, pp. 19–33.
Jorritsma, Peter and Kennisinstituut Mobiliteitsbeleid (2015). Deelautogebruik in Ned-erland : Omvang, motieven, effecten en potentie. Tech. rep. Antwerpen: Bijdrage aanhet Colloquium Vervoersplanologisch Speurwerk.
Kalra, Nidhi and Susan M Paddock (2016). “Driving to safety: How many miles ofdriving would it take to demonstrate autonomous vehicle reliability?” In: Trans-portation Research Part A 94, pp. 182–193.
Kanouse, David E. (1984). “Explaining negativity biases in evaluation and choicebehavior: Theory and research”. In: Advances in Consumer Research 11.1, pp. 703–708.
Katzev, Richard (2003). “Car Sharing: A New Approach to Urban TransportationProblems”. In: Analyses of Social Issues and Public Policy 3.1, pp. 65–86.
Kennedy, Brian and Cary Funk (2016). 28% of Americans are ‘strong’ early adopters oftechnology. URL: http://www.pewresearch.org/fact-tank/2016/07/12/28-of-americans-are-strong-early-adopters-of-technology/(visited on 05/19/2017).
Kim, Daejin, Joonho Ko, and Yujin Park (2015). “Factors affecting electric vehiclesharing program participants’ attitudes about car ownership and program par-ticipation”. In: Transportation Research part D 36, pp. 96–106.
Kim, Jinhee, Soora Rasouli, and Harry Timmermans (2017). “Satisfaction and un-certainty in car-sharing decisions: An integration of hybrid choice and randomregret-based models”. In: Transportation Research Part A 95, pp. 13–33.
Le Vine, Scott et al. (2014). “A new approach to predict the market and impacts ofround-trip and point-to-point carsharing systems: Case study of London”. In:Transportation Research part D 32, pp. 218–229.
Lieshout, Marcel van (2016). Ov-fiets steeds populairder, klanten grijpen vaak mis. URL:http://www.volkskrant.nl/economie/ov-fiets-steeds-populairder-klanten-grijpen-vaak-mis~a4415129/ (visited on 05/23/2017).
Litman, Todd (2000). “Evaluating Carsharing Benefits”. In: Transportation ResearchRecord 1702.1, pp. 31–35.
— (2014). “Autonomous Vehicle Implementation Predictions Implications for Trans-port Planning”. In: Traffic Technology International, pp. 36–42.
Loose, Willi (2010). “The State of European Car-Sharing”. In: Final Report D 2.4 WorkPackage 2.
Martin, Elliot and Susan Shaheen (2011a). “Greenhouse Gas Emission Impacts ofCarsharing in North America”. In: IEEE Transactions on Intelligent TransportationSystems 12.4.
— (2011b). “The Impact of Carsharing on Public Transit and Non-Motorized Travel:An Exploration of North American Carsharing Survey Data”. In: Energies 4, pp. 2094–2114.

68 BIBLIOGRAPHY
Meijkamp, Rens (2000). “Changing Consumer Behaviour through Eco-efficient Ser-vices An empirical study on Car Sharing in the Netherlands”. PhD thesis. DelftUniversity of Technology.
Mercedes (2016). Future bus pilot. Tech. rep.Millard-Ball, Adam et al. (2005). “Car-Sharing: Where and How It Succeeds”. In:
Transit Cooperative Research Program.Muheim, Peter and E Reinhardt (1999). “Carsharing: the key to combined mobility”.
In: World Transport Policy & Practice 5.3.Münzel, Karla et al. (2017). “Carsharing Business Models in Germany: Characteris-
tics, Success and Future Prospects”. Utrecht University.Musk, Elon (2016). Master Plan, Part Deux. URL: https://www.tesla.com/blog/
master-plan-part-deux (visited on 05/23/2017).NHTSA (2013). Preliminary Statement of Policy Concerning Automated Vehicles. Tech.
rep. National Highway Traffic Safety Administration.NHTSA and USDOT (2015). Traffic safety facts: Crash stats. Tech. rep. Washington DC:
National Highway Traffic Safety Administration, U.S. Department of Transporta-tion.
Nijland, Hans, Jordy van Meerkerk, and Anco Hoen (2015). Effecten van autodelen opmobiliteit en CO2-uitstoot. Tech. rep. Planbureau voor de Leefomgeving.
NS (2017). Energy. URL: http://www.ns.nl/en/about-ns/energy (visited on05/23/2017).
OECD (2017). “ITF Transport Outlook 2017”. In:Parkan, Celik (2002). “Measuring the operational performance of a public transit
company”. In: International Journal of Operations & Production Management 22.6,pp. 693–720.
Redman, Lauren et al. (2013). “Quality attributes of public transport that attract carusers: A research review”. In: Transport Policy 25, pp. 119–127.
Rietveld, Piet (2005). “Six reasons why supply oriented indicators systematicallyoverestimate service quality in public transport”. In: Transport Reviews 25.April,pp. 319–328.
Rijksoverheid (2015). Autodelen: naar 100.000 deelauto’s in 2018. Tech. rep.— (2016a). Dutch public transport switches to 100 percent emissions-free buses. URL:
https://www.government.nl/latest/news/2016/04/15/dutch-public-transport-switches-to-100-percent-emissions-free-buses (visited on 05/23/2017).
— (2016b). Overstappen naar 2040: Flexibel en slim OV. Tech. rep.— (2017). Wat zijn de regels voor fietsverlichting en reflectie op een fiets? URL: https://
www.rijksoverheid.nl/documenten/vragen-en-antwoorden/wat-zijn-de-regels-voor-fietsverlichting-en-reflectie-op-een-fiets (visited on 05/08/2017).
Schaefers, Tobias (2013). “Exploring carsharing usage motives: A hierarchical means-end chain analysis”. In: Transportation Research Part A 47, pp. 69–77.
SFMTA (2017). On-Street Car Sharing Pilot Program. Tech. rep.Shaheen, Susan and Nelson Chan (2015). Mobility and the sharing economy: Impacts
synopsis. Tech. rep. University of California, Berkeley: Transportation sustainabil-ity research center.
Shaheen, Susan, Daniel Sperling, and Conrad Wagner (1998). “Carsharing in Europeand North America: Past, Present, and Future”. In: Transportation Quarterly 52.3,pp. 35–52.
BIBLIOGRAPHY 69
Shaheen, Susan A and Adam P Cohen (2007). “Worldwide carsharing growth: Aninternational comparison”. In: Transportation Research Record: Journal of the Trans-portation Research Board 1992.1, pp. 81–89.
Shaheen, Susan A, Mark A Mallery, and Karla J Kingsley (2012). “Personal vehi-cle sharing services in North America”. In: Research in Transportation Business &Management 3, pp. 71–81.
Shoup, Donald C (2006). “Cruising for parking”. In: Transport Policy 13, pp. 479–486.Steininger, Karl, Caroline Vogl, and Ralph Zettl (1996). “Car-sharing organizations
The size of the market segment and revealed change in mobility behavior”. In:Transport Policy 3.4, pp. 177–185.
Stemler, Steve (2001). “An Overview of Content Analysis”. In: Practical Assessment,Research & Evaluation 7.17.
Stillwater, Tai, Patricia Mokhtarian, and Susan Shaheen (2009). “Carsharing and theBuilt Environment”. In: Transportation Research Record: Journal of the TransportationResearch Board 2110, pp. 27–34.
Suiker, Stephan and Jos van den Elshout (2013). Effectmeting introductie Car2Go inAmsterdam. Tech. rep. Nationaal verkeerskundecongres.
Terrien, Clara et al. (2016). “Good practices for advancing urban mobility innovation:A case study of one-way carsharing”. In: Transportation Business & Management20, pp. 20–32.
Tertoolen, Gerard, Dik Van Kreveld, and Ben Verstraten (1998). “Psychological resis-tance against attempts to reduce private car use”. In: Transportation Research PartA: Policy and Practice 32.3, pp. 171–181.
TNS Nipo (2014). Monitor Autodelen 2014. Tech. rep.Tubantia (2017). Gemeente Enschede zet in op elektrische flexauto’s. URL: http : / /
www . tubantia . nl / enschede / gemeente - enschede - zet - in - op -elektrische-flexauto-s~a6dc7599/ (visited on 05/29/2017).
UITP (2017). “Autonomous Vehicles: A potential game changer for urban mobility”.In:
Van Hagen, Mark (2009). “How to meet the needs of train passengers? A success-ful customer segmentation model for public transport”. In: European TransportCongress. Noordwijkerhout, the Netherlands.
Vliet, Hans Van (2007). Software Engineering: Principles and Practice. Third edit. Wiley,p. 59. ISBN: 0470031468.
Wong, John L. and Jagdish N. Sheth (1985). “Explaining Intention-Behavior Discrepancy–A Paradigm”. In: Advances in Consumer Research 12, pp. 378–384.
Yadron, Danny and Dan Tynan (2016). Tesla driver dies in first fatal crash while usingautopilot mode. URL: https://www.theguardian.com/technology/2016/jun/30/tesla-autopilot-death-self-driving-car-elon-musk(visited on 06/07/2017).
Yap, Menno D., Gonçalo Correia, and Bart van Arem (2016). “Preferences of trav-ellers for using automated vehicles as last mile public transport of multimodaltrain trips”. In: Transportation Research Part A 94, pp. 1–16.
Zelfsturing.it (2017). 1 op de 3 Nederlanders wil een zelfrijdende auto. URL: http://zelfsturing.it/1-op-de-3-nederlanders-wil-een-zelfrijdende-auto/ (visited on 06/07/2017).


71
Appendix A
Online Review Analysis
A.1 Greenwheels
Search queries
(Greenwheels) + review, forum, ervaring, beoordeling, gebruik
Review websites
Review 1-3 Tweakers.netReview 4 Tweakers.netReview 5-7 RadarReview 8-9 VivaReview 10 KidseropuitReview 11 Eigenwijs Blij
A.2 Car2go
Search queries
(Car2go) + review, forum, ervaring, beoordeling, gebruik
Review websites
Review 1 YelpReview 2 Google Play StoreReview 3 Business InsiderReview 4 AartJan

72 Appendix A. Online Review Analysis
A.3 OV-fiets
Search queries
(OV-fiets) + review, forum, ervaring, beoordeling, gebruik, proef, onderzoek
Review websites
Review 1-6 NS forumReview 7 NS forumReview 8-9 YelpReview 11 RoverReview 12 TweakersReview 13 VivaReview 14 Universiteit Utrecht

A.3. OV-fiets 73
Company
Source
Total#
Curren
t#Co
nten
ttype
Form
atPrim
aryaudien
ceExpe
rience
Maintopic
Notes/features
Greenw
heels
Tweakers
11
Forumstartpost
Text
Forumvisitors
Expe
rience
NoPTalte
rnativeavailable
Highcost
22
Forumpost#
12Text
Forumvisitors
Expe
rience
Payforn
otm
oving
Smallcars
Affordablewith
littleusage
33
Forumpost#
16Text
Forumvisitors
Expe
rience
Recentgrowth
Onlyusefulwhe
ncloseby
Lessfixedcosts
Nomainten
ance
Tweakers
41
Forumpost#
19Text
Forumvisitors
Expe
rience
Onlyusefulwhe
ncloseby
Highcost
Clean
Fullofgas
Highhou
rrate
Radar
51
Forumpost#
1Text
Forumvisitors
Expe
rience
Onlyusefulwhe
ncloseby
Smallcars
Good
price/qu
ality
62
Forumpost#
3Text
Forumvisitors
Expe
rience
Checkford
amage
Highcost
73
Forumpost#
5Text
Forumvisitors
Expe
rience
Highcost
Useforsho
rttrips
Badcustom
erse
rvice
Viva
81
Forumpost#
2Text
Forumvisitors
Expe
rience
Onlyusefulwhe
ncloseby
Payforn
otm
oving
Useforsho
rttrips
Good
customerse
rvice
Nohasslewith
inspectio
nsand
repairs
Smallcars
92
Forumpost#
6Text
Forumvisitors
Expe
rience
Onlyusefulwhe
ncloseby
Smallcars
Highcost
Kidserop
uit.n
l10
1Blog/Review
Text+im
ages
Web
sitevisitors
Expe
rience
Useovcard
Reservationsim
ple
Smallcars
Attractiv
ecolor
Eigenw
ijsBlij
111
BlogRe
view
Text
Web
sitevisitors
Expe
rience
Onlyusefulwhe
ncloseby
Useovcard
Green
Cheape
rthanow
ningcar
Nohasslewith
inspectio
nsand
repairs
Smallcars
Useforsho
rttrips
Company
Source
Total#
Curren
t#Co
nten
ttype
Form
atPrim
aryaudien
ceExpe
rience
Maintopic
Notes/features
Car2go
Yelp
11
Review
Text
Yelpvisitors
Expe
rience
Faster
Comfortable
Parkeverywhe
reNocallservice
Costsa
fterw
ards
Damagecheck
GooglePlaystore
21
Review
Text
(poten
tial)appusers
Appreview
sOccup
iedchargers
Noavailability
Lesscarsincentreatn
ight
Busin
essInsider
31
Review
Text+im
age
BIre
aders
Expe
rience
Affordable
Parkingfeesinclud
edFreem
inuteswhe
nparked
atchargingstation
Limite
dparkingarea
Carrangeincoldweather
AartJan
41
Blog
Text+im
ages
Web
sitevisitors
Expe
rience
Parkingfree
Parkeverywhe
reCh
eap
PTalte
rnative
Smartpho
neusage
Good
quality
Badmanual
Cold
Company
Source
Total#
Curren
t#Co
nten
ttype
Form
atPrim
aryaudien
ceExpe
rience
Maintopic
Notes/features
OV-fie
tsNSforum
11
Forumstartpost
Text
Forumusers
Qualityofbikes
Standardbike
Noluxury
Nohand
brakes
Nogears
Oldbikes
Broken
bikes
22
Forumre
actio
n#2
Text
Forumusers
Qualityofbikes
Broken
bikes
Selfservice
Bikepickproced
ureorde
r3
3Forumre
actio
n#3
Text
Forumusers
Proced
ure
Nostandardprocedu
reStandardisa
tion
44
Forumre
actio
n#10
Text
Forumusers
Qualityofbikes
Broken
lights
Paytore
serve
Bikepickproced
ureorde
rInform
abo
utdefects
55
Forumre
actio
n#11
Text
Forumusers
Broken
bike
Broken
bikes
Nobu
salte
rnative
66
Forumre
actio
n#13
Text
Forumusers
Broken
bike
Broken
bikes
Norepairon
site
NSforum
71
Forumstartpost
Text
Forumusers
Rentingissue
sNoexplanationon
site
Subscriptio
nrequ
ired
Yelp
81
Review
Text
Yelpvisitors
Agreatservice
Fast
Good
price
92
Review
Text
Yelpvisitors
Usefuland
che
apGo
odprice
Returnto
pickuplocatio
n10
3Re
view
Text
Yelpvisitors
Usefuland
che
apGo
odprice
Lotsoflocations
Rover
111
Blog
Text
Roverv
isitors
Greatsuccess
Safe
Fast
Bikepickproced
ureorde
rEn
vironm
entalfrie
ndly
Noop
tiontore
serve
Good
price
Tweakers
121
Forumre
actio
n#8
Text
Forumusers
Mixed
review
Nobikeavailable
Broken
bikes
Nocompe
nsationforn
on-availability
Noexplanationon
site
Slow
serviced
esk
Good
price
Viva
131
Forumre
actio
n#5
Text
Forumusers
Good
experiences
Broken
lights
Good
availability
Depe
nden
tonop
eningho
urs
UniversiteitU
trecht
141
New
sitem
Text+im
age
Universitystud
ents+staff
PTalte
rnative
Bikepreferred
overb
usGo
odprice
FIG
UR
EA
.1:O
nlin
ere
view
anal
ysis
over
view