the role of boundary layer friction on tropical
TRANSCRIPT

Quarterly Journal of the Royal Meteorological Society Q. J. R. Meteorol. Soc. 143: 2524–2536, July 2017 B DOI:10.1002/qj.3104
The role of boundary-layer friction on tropical cyclogenesisand subsequent intensification
Gerard Kilroy,a* Michael T. Montgomeryb and Roger K. Smitha
aMeteorological Institute, Ludwig Maximilians University of Munich, GermanybDepartment of Meteorology, Naval Postgraduate School, Monterey, CA, USA
*Correspondence to: G. Kilroy, Meteorological Institute, Ludwig-Maximilians University of Munich, Theresienstrasse 37, 80333Munich, Germany. E-mail: [email protected]
A recent idealized, high-resolution, numerical model simulation of tropical cyclogenesis iscompared with a simulation in which the surface drag is set to zero. It is shown that, whilespin-up occurs in both simulations, the vortex in the one without surface drag takes overtwice as long to reach its intensification begin time. When surface friction is not included,the inner core size of the simulated vortex is considerably larger and the subsequent vortexintensity is significantly weaker than in the case with friction. In the absence of surfacedrag, the convection eventually develops without any systematic organization and liesoften outside the radius of azimuthally averaged maximum tangential winds. The resultsunderscore the crucial role of friction in organizing deep convection in the inner core of thenascent vortex and raise the possibility that the timing of tropical cyclogenesis in numericalmodels may have an important dependence on the boundary-layer parametrization schemeused in the model.
Key Words: tropical cyclone; hurricane; typhoon; spin-up; cyclogenesis; intensification
Received 3 February 2017; Revised 18 May 2017; Accepted 19 June 2017; Published online in Wiley Online Library
1. Introduction
The importance of the boundary layer in tropical cyclonebehaviour has been recognized for many decades (Charney andEliassen, 1964; Ooyama, 1969; Rosenthal, 1971; Anthes, 1974;Emanuel, 1986, 1997; and references therein). For a long time itsrole was seen as feeding moisture inwards to maintain the inner-core deep convection, much of the moisture being picked up atthe ocean surface through evaporation. Gradually its dynamicalrole in the spinning up of the low-level winds, as well as the windsin the developing eyewall region, was recognized (Carrier, 1971;Anthes, 1974; Smith et al., 2009; Schmidt and Smith, 2016).
Because of the high Reynolds numbers of atmosphericvortices, the frictional boundary layer is generally turbulent.Traditionally, the corresponding vertical turbulent momentumflux near the surface is modelled in terms of a bulk aerodynamicformula equal to the product of a drag coefficient CD and thesquare of the near-surface wind speed. Likewise, the turbulententhalpy flux from the sea surface is modelled also using a bulkaerodynamic formula that equals the product of an enthalpyexchange coefficient CK , the near-surface wind speed and theair–sea disequilibrium of enthalpy.
A number of studies have investigated the effects of theboundary layer in a full cyclone model by varying the turbu-lent exchange coefficients of momentum and enthalpy. The earlyexperiments of this type were based on axisymmetric numer-ical models, using either parametrized convection (Ooyama,1969; Rosenthal, 1971; Emanuel, 1989, 1995), or relativelycoarse, convection-permitting, configurations (Craig and Gray,1996). Later studies employed higher-resolution axisymmetric
representations of moist convection phenomenology (Bryan andRotunno, 2009) and three-dimensional convection-permittingconfigurations (Montgomery et al., 2010; Schecter, 2011; Bryan,2012; Persing et al., 2013; Smith et al., 2014).
1.1. Dependence of vortex intensification on surface drag
In one of the earliest studies Rosenthal (1971), used anaxisymmetric, multi-level, primitive equation model with amodified Kuo cumulus parametrization scheme to examine thedependence of the intensification rate on the drag coefficient. Atthat time, following Charney and Eliassen (1964), the prevailingidea was that surface drag played a dual role in the tropicalcyclone development. In the boundary layer, the reduction of thetangential wind due to surface friction results in an imbalance offorces in the radial direction and leads to inflowing air which,as noted above, supplies the inner-core clouds with moisturethrough the evaporation of water from the underlying ocean. Onthe other hand, a higher surface drag leads to a higher frictionaltorque on the tangential wind.
From an energetics perspective, the quadratic nature of thefrictional drag law implies a cubic dependence of the kineticenergy dissipation rate on wind speed in the boundary layer.Since the energy input to the system is controlled largely by themoist enthalpy fluxes, which are proportional to near-surfacewind speed to leading order, the frictional dissipation ultimatelydominates and arrests the intensification process. These ideaswere already evident in some of Ooyama’s (1969) experimentswhere it was shown that the mature final intensity of the modelcyclone decreases as the drag coefficient increases. These ideas
c© 2017 Royal Meteorological Society

Tropical Cyclogenesis and Subsequent Intensification 2525
were corroborated by Rosenthal (1971) who, in reference to hisfigure 9, noted that ‘decreased drag coefficients ... lead to smallergrowth rates but greater peak intensities’. Rosenthal noted alsothat one should expect no growth at all when CD is decreasedto zero. However, Rosenthal’s conclusions on this latter pointneed to be considered with caution, because they are dependentupon the assumed Kuo cumulus parametrization which linksthe convective mass flux with the frictional convergence in theboundary layer.
In a later study using an axisymmetric convection-permittingmodel, Craig and Gray (1996) found that the rate of intensificationincreases with increasing values of the transfer coefficients forheat and moisture. They found also that the intensification rateis relatively insensitive to changes in the drag coefficient andnoted that ‘frictional convergence is of secondary importance[for intensification], but may represent a sink of energy thatdecreases the growth rate’. An interesting result of Craig andGray’s study was the finding that the largest intensification ratewas obtained with no surface friction at all (their p. 3537), a resultthat is opposite to that of Rosenthal.
Montgomery et al. (2010) used a three-dimensional,convection-permitting model to investigate the sensitivity of theintensification rate to the model drag coefficient. They presenteda series of experiments in which the intensification rate and inten-sity of the vortex were found to increase with increasing surfacedrag coefficient until a certain threshold value was attained andthen the intensification rate and intensity decreased. When thedrag coefficient was set to zero, no system-scale intensificationoccurred on a time-scale of 4 days, despite persistent sea-to-airfluxes of moisture that maintain deep convective activity. In afollow-up study, Smith et al. (2014) extended these calculationsto include a wind-speed-dependent drag coefficient and one offour boundary-layer parametrization schemes. On realistic fore-cast time-scales (5 days), they found that the changes in vortexbehaviour with changing drag coefficient were qualitatively simi-lar among all schemes. The maximum intensification occurred fora value somewhere near the standard value of the drag coefficient.
1.2. A resolution of different model results
A resolution of the discrepancy in the dependence of the vortexintensification rate found by Craig and Gray (1996) comparedwith that found by Montgomery et al. (2010) and Smith et al.(2014) was provided by Persing et al. (2013), who highlightedinter alia the intrinsic differences in the behaviour of deepconvection in axisymmetric and three-dimensional vortices (theirfigure 21). On a time-scale of 12 days, the three-dimensionalsimulation with the lowest drag struggled to develop, while thatin the axisymmetric simulation developed relatively rapidly andthe intensity after 8 days became unrealistically large. The reasonfor the more rapid growth in the axisymmetic configuration wasfound to be linked to the much larger diabatic heating rate andassociated radial gradient thereof in the axisymmetric calculation.This result is related to the organization of deep convection in thetwo model configurations, the convection in the axisymmetricmodel being already organized into convective rings. In thethree-dimensional model, such geometric organization of theconvection cannot be assumed at early times and the frictionalconvergence aids the organization process.
Schecter (2011) examined the consequences of setting thesurface drag to zero for tropical cyclone formation andintensification. Although focused primarily on the evaluationof a reduced model based on Ooyama’s (1969) classicalthree-layer formulation, generalized to three dimensions andincluding a number of convective parametrization schemes∗,Schecter conducted high-resolution, three-dimensional, near-cloud-resolving experiments using the Regional Atmospheric
∗This reduced model was used also as the basis for a related study of diabaticEkman turbulence (Schecter and Dunkerton, 2009).
Modeling System (RAMS; Cotton et al., 2001, and references) togauge the performance of the reduced model. Pertinent to theforegoing discussion were noteworthy experiments conductedwith the RAMS model in which the surface drag coefficient wasset to zero during the early organization phase of an emergentvortex. In these experiments, the exchange coefficients for latentand sensible heat transfer for a ‘cool’ ocean (SST = 26 ◦C) wereunaltered from their standard control values. Schecter (hissection 2.2) found that ‘Initially, eliminating surface drag haslittle effect on the acceleration of wind speed. However, removingthe influence of surface drag on boundary-layer convergence andconvective organization ultimately inhibits hurricane formation’.With zero surface drag, he found that there was no sign ofhurricane formation during a 30 day simulation. Consistent withPersing et al. (2013), Schecter (his section 2.2) noted a subtleinfluence of surface drag in the RAMS experiments: ‘The influenceof surface drag remains minimal 7.33 days into genesis, but seemsto nudge convection toward the centre of the developing domain-scale circulation’. We will return to comment on this insightfulfinding in Section 8.
1.3. The rotating convection paradigm for vortex intensification
Recent work has proposed a new overarching framework forunderstanding the intensification and structure change of tropicalcyclones. This framework, which has been referred to as therotating convection paradigm for tropical cyclone intensification,recognizes the role of rotating deep convective clouds andtheir aggregate effects on driving a system-scale overturningcirculation. In turn, this circulation acts to concentrate absolutevorticity in the lower troposphere, some of the vorticity amplifiedby prior deep convection, and thereby, through Stokes’ theorem,to increase the circulation about fixed circuits in and around theconvective region. A recent review of the process from both anaggregate and eddy-resolving perspective is given by Montgomeryand Smith (2017) and in an abridged version by Smith andMontgomery (2016a).
An important aspect of the rotating convection paradigm isthe role of the frictional boundary layer, in which, as the vortexintensifies, the spin-up of the maximum tangential wind speedoccurs. This feature, which may seem counter-intuitive, wasalready anticipated by Anthes (1974, p. 506). It has since beenfound in observational analyses and was identified by Smith et al.(2009) as an important element of the spin-up process. Smithet al. (2009) referred to this element as the boundary-layer spin-upmechanism to distinguish it from the classical spin-up mechanism,which was articulated by Ooyama (1969, 1982) and involves theconcentration of absolute vorticity above the boundary layer bythe convectively driven secondary circulation referred to above.
The rotating convection paradigm has been invoked in recentwork to explain the dependence of intensification rate on latitude(Smith et al., 2015a) and sea surface temperature (Crnivec et al.,2016). It has been used also to explain how the boundary layerexerts a progressive control on the inner core expansion as thevortex matures (Kilroy et al., 2016a), and to explain the spin-upof the eyewall cloud region (Persing et al., 2013; Schmidt andSmith, 2016).
1.4. A unified theory of genesis and intensification
In another recent paper, the rotating convection paradigm hasbeen shown to extend to understanding tropical cyclogenesis ina favourable environment (Kilroy et al., 2017, hereafter KSM).The paper describes a three-dimensional, near-cloud-resolving(horizontal grid spacing 500 m), warm rain† simulation ofgenesis in a quiescent environment, starting from a weak cyclonic
†An extension of the study to examine the effects of ice microphysics is currentlyunderway.
c© 2017 Royal Meteorological Society Q. J. R. Meteorol. Soc. 143: 2524–2536 (2017)

2526 G. Kilroy et al.
vortex (maximum wind speed 5 m s−1) in thermal-wind balance.Evidence was presented in their section 4 that the boundary layerbegins to exert an important influence on the inner-core flow bythe time that significant intensification begins. Even at this stage,the maximum azimuthally averaged wind speed is no more thanapproximately 10 m s−1. The importance of the boundary layer atearly times was already indicated in calculations by Montgomeryet al. (2006), who noted that surface drag accelerates the genesisprocess and contributes to the strong contraction of the vortexas the vortex develops (their Table and Experiment D2). Theseauthors did not further investigate the role of surface friction inthe genesis process.
1.5. The present study
The purpose of the present paper is to further investigate thesubtle role of frictional effects in the genesis process. We do this bycomparing the control calculation of KSM with one in which thedrag coefficient is set to zero. The remaining paper is organized asfollows. Section 2 describes the model configuration and the twonumerical simulations carried out. Section 3 presents diagnosticanalyses of the two simulations, while section 4 investigatesthe early differences in convective evolution in both experiments.Section 5 investigates the importance of boundary-layer dynamicsat early times. Section 6 provides an explanation for vortexspin-up in the simulation without friction. Section 7 presents anazimuthally averaged view of vortex evolution in both simulations,while section 8 compares our findings with those of previous workon the topic. The conclusions are given in section 9.
2. The numerical model and experimental design
This study focuses on two high-resolution three-dimensionalsimulations, the control experiment in KSM and a rerun of thissimulation with surface drag switched off.
The simulation with surface drag switched off has the samebasic configuration as described in KSM. It relates to the evolutionof a prescribed, initially weak, cloud-free, axisymmetric vortex ina quiescent environment on an f -plane and uses the numericalmodel CM1 version 16, a non-hydrostatic and fully compressiblecloud model (Bryan and Fritsch, 2002). In brief, the outer domainis 3000 × 3000 km in size with variable horizontal grid spacingreaching 10 km near the domain boundaries. The inner domainis 300 × 300 km in size and has a uniform horizontal grid spacingof 500 m. The domain has 40 vertical levels extending to aheight of 25 km. The vertical grid spacing expands gradually from50 m near the surface to 1200 m at the top of the domain. Thesimulation is carried out on an f -plane with the Coriolis parameterf = 2.53 × 10⁻⁵ s−1, corresponding to 10◦N. The balanced initialvortex has a maximum tangential wind speed of 5 m s−1 at thesurface at a radius of 100 km. Surface enthalpy fluxes are presentin both simulations. The subgrid turbulence scheme used is themodel option iturb=3, a parametrized turbulence scheme withno explicit turbulence (Bryan and Rotunno, 2009). A simplewarm-rain scheme is used in which rain has a fixed fall speed of7 m s−1. As in KSM, radiative effects are represented by adopting aNewtonian cooling approximation capped at 2 K day−1, followingRotunno and Emanuel (1987). The only differences in the modelset-up from that in KSM are that the surface drag is switched off(i.e. idrag=0), a zero-gradient boundary condition is chosen‡ (i.e.bcturbu=2) and the simulation is integrated for a longer period oftime (240 h instead of 108 h) because of the longer time requiredfor the vortex to intensify.
‡There appears to be a non-zero turbulent stress calculated even when themodel option idrag=0 is chosen, leading to a reduction in the near-surfacewinds from the initial time. To circumvent this issue, a zero-gradient lowerboundary condition must be chosen also.
In order to reduce the amount of output data produced forthe no-friction control experiment, the data are stored at 15 minintervals before 108 h and every 3 h beyond this time.
The reference sounding is described in KSM (their figure 1).In brief, it is a mean of 39 dropsonde soundings obtainedon 12 September 2010, during the PREDICT (PRE-DepressionInvestigation of Cloud systems in the Tropics) field campaignfor the tropical wave-pouch disturbance that eventually becametropical storm Karl late in the afternoon of 14 September (localtime) (Montgomery et al., 2012; Smith and Montgomery, 2012give details). This mean sounding has a Convective AvailablePotential Energy (CAPE)§ of 2028 J kg−1, a Convective Inhibition(CIN)¶ of 47 J kg−1 and a Total Precipitable Water (TPW) valueof 61 kg m−2. The sea surface temperature (SST) is 29◦C, typicalof the Caribbean region at the time.
3. Vortex evolution with and without friction
In the descriptions that follow, we refer to the zero drag simulationas Ex-NoFr and the control experiment from KSM that includessurface drag as Ex-Fr. Figure 1 compares the evolution of certainmetrics characterizing the azimuthally averaged behaviour ofthese two simulations, including the maximum tangential windspeed (Vmax), the radius at which this maximum occurs (Rvmax)and the temporally smoothed (1-2-1 filter, used five times)maximum vertical velocity (Wmax). Also shown is the maximumlocal total horizontal wind speed, VTmax.
The Vmax curves for both simulations remain almost identicaluntil about 36 h. After this time the curves begin to divergeand at 45 h, the vortex in Ex-Fr begins a rapid intensification(RI)‖ phase. This time is referred to as the intensificationbegin time in KSM. During the following 36 h, Vmax in Ex-Frincreases from about 10 m s−1 to about 70 m s−1. In Ex-NoFr,Vmax increases by only 10 m s−1 during the first 108 h. It increasesless rapidly than in Ex-Fr to nearly 50 m s−1 over the next 60 hand after 168 h it starts to decline. In both experiments, VTmax
is larger than the corresponding azimuthally averaged Vmax at alltimes, a consequence of velocity fluctuations associated with deepconvection.
In both simulations, Rvmax begins to fluctuate as soon as deepconvection begins to develop. In Ex-Fr, Rvmax decreases graduallyuntil about 48 h and then falls rapidly to a value of about 10 km.Thereafter, its value does not change appreciably over the next60 h. In Ex-NoFr, Rvmax fluctuates wildly throughout the first120 h of the integration, although there is a downward trend,indicating that some deep convection occurs within the radiusof maximum winds. Between 130 and 170 h, Rvmax settles on avalue of around 35 km, after which it gradually increases to about50 km at 240 h.
In Ex-Fr, Wmax starts to increase at about 12 h when the firstbout of deep convection occurs. It reaches a small peak about 6 hlater and then declines to near zero at around 24 h. Thereafter,it begins a gradual increase over the next 48 h as the convectionfocuses near the centre of the circulation.
In Ex-NoFr, Wmax remains relatively small in comparison tothat in Ex-Fr until 108 h (0.5 m s−1 or less up to this time)when it gradually increases to attain a lifetime maximum of notquite 1.5 m s−1 at about 144 h. Thereafter, it steadily declines. The
§We remind the reader that CAPE is a parcel quantity that typically has a strongnegative vertical gradient in the lower troposphere. For this reason, the valuescited herein are based on an average for air parcels lifted from the surface andat 100 m intervals above the surface to a height of 500 m. Since the calculationof CAPE is a nonlinear function of temperature and moisture, we prefer thismethod to one based on averaged values of temperature and mixing ratiothrough a surface-based layer of air with some arbitrarily prescribed depth.¶Like CAPE, CIN is a quantity that refers also to an air parcel. Rather thancomputing an average up to 500 m as for CAPE, it seems physically morereasonable to examine the minimum value of CIN up to this level.‖In the tropical cyclone community, RI is typically defined as an increase inthe near-surface total wind speed exceeding about 15 m s−1 over a period of24 h (Kaplan and DeMaria, 2003).
c© 2017 Royal Meteorological Society Q. J. R. Meteorol. Soc. 143: 2524–2536 (2017)

Tropical Cyclogenesis and Subsequent Intensification 2527
90
80
70
60
50
40
30Vm
ax (
m s
–1)
20
10
00 24 48 72 96
Time (h)
120 144 168 192 216 240
120
100
80
60
Rvm
ax (
km
)W
max
(m
s–1)
40
20
0
0
1
2
3
4
5
6
7
8
9
10
0 24 48 72 96
Time (h)
120 144 168 192 216 240
0 24 48 72 96
Time (h)
120 144 168 192 216 240
(a)
(b)
(c)
Figure 1. Time series of (a) maximum total wind speed (VTmax, tot) andmaximum azimuthally averaged tangential wind speed (Vmax, tan), (b) the radiusRvmax at which the maximum tangential wind speed (Vmax) occurs, and (c) theazimuthally averaged maximum vertical velocity (Wmax). Blue curves are for Ex-Fr, red curves are for Ex-NoFr. [Colour figure can be viewed at wileyonlinelibrary.com].
comparatively small values of Wmax in Ex-NoFr suggest that eitherthe deep convective updraughts are much weaker than in Ex-Fr,or that deep convection that does form is located at relativelylarge radii and does not occupy an appreciable range of azimuth.The first possibility can be dismissed by a time series of themaximum total vertical velocity (at any given height or location),indicating that the strongest convection is typically the samemagnitude in both experiments (not shown). This result suggeststhat deep convection occurs at larger radii in Ex-NoFr than inEx-Fr. The suggestion is confirmed by an inspection of horizontalcross-sections of vertical velocity in the middle troposphere and isimplicit also in the height–time series of vertical mass flux shownin Figure 2. These results underscore the crucial role of frictionin organizing deep convection in the inner core of the nascentvortex.
Recently, the occurrence of deep convection close to the centreof an existing circulation has been highlighted as an importantfeature in the development of incipient tropical disturbances into
cyclones (e.g. Smith et al., 2015b; Tang et al., 2016; Kilroyet al., 2016b). This preferred location is not, as frequentlysupposed, because deep convection is more ‘efficient’ in thislocation on account of the higher inertial stability there (Smithand Montgomery, 2016b). Rather, the centre of an incipientvortex (or wave-pouch) takes on a preferential role becausethe convectively induced inflow is then able to draw in theabsolute angular momentum (or M-)surfaces above the frictionalboundary layer to small radii (e.g. Smith and Montgomery, 2016b,section 3.2). Irrespective of whether M is materially conserved,any inward movement of the M-surfaces implies a spin-up of thetangential winds.
Figure 2 shows the structure of vertical mass flux averaged oververtical columns with square cross-sectional areas 20 km × 20 kmand 60 km × 60 km centred on the vortex centre∗∗ as a functionof height and time in Ex-Fr and Ex-NoFr. There are strikingdifferences between the time evolution of the mass flux in thetwo simulations in both sizes of column. While there are sporadicperiods of upward mass flux in Ex-NoFr in both sizes of column,the bursts of deep convection that are characterized by theseperiods are not sustained, at least out to 48 h. In contrast, in Ex-Frthere is a 6 h period of marked convective activity between about18 h and 24 h followed by a 6 h period of suppressed convection.After this suppressed period, deep convection develops stronglyand persists in both columns. The persistence of convectionin the innermost column, in particular, represents favourableconditions for vortex development and, indeed, in Ex-Fr, thevortex begins its RI phase after 45 h (Figure 1(a)).
Three pertinent questions arise at this point:(i) what are the essential differences in convective behaviourbetween the friction and no-friction simulations?;(ii) how does friction support the local convective organizationand rapid intensification?; and(iii) how does the vortex spin up in the no-friction experiment?The next three sections are devoted to answering these questions.
4. Interpretation of differences in convective behaviour
On the basis of simple parcel theory, in order for deep convectionto occur near the circulation centre, there must be both lowCIN and adequate CAPE there. As we will show, the frictionallyinduced inflow associated with boundary-layer dynamics plays afundamental role in providing these conditions, which, in turn,provide for vortex spin-up on a realistic time-scale of a few days.
Figure 3 shows the evolution of CAPE and CIN for bothsimulations until 120 h. Like Figures 2(a) and (c), the inner-core quantities are defined here as averages across a 20 × 20 kmcolumn centred on the circulation centre. In Ex-Fr there is abuild-up of CAPE until about 30 h, after which time there is asharp reduction over the following 5 h. This sharp reduction inCAPE is due to a burst of deep convection in the 20 × 20 kmcolumn at this time (as confirmed by animations of the fields, notshown). The CIN reduces to half its initial value by 24 h, followedby a small increase and then a precipitous fall to near zero a littleafter 36 h. RI occurs about 12 h later.
In Ex-NoFr there is no initial build-up of CAPE. There is asmall reduction of CAPE at about 45 h, but the CIN is larger thanits initial value until about 100 h. After 100 h the CIN reducesslightly (to about 20 J kg−1), but at no point in the first 120 hshown here does the CIN become close to zero. A key questionthen arises: why is the CIN so large in Ex-NoFr?
To answer this question we show in Figure 4 azimuthallyaveraged Hovmoller plots of the water vapour mixing ratiodifference (�q) from that at the initial time for both experiments
∗∗As in KSM, the vortex centre is found by searching for the surface pressureminimum in a filtered pressure field, with a requirement that the vortex isnot allowed to move more than 20 km in a single time step. This preventsthe centre-finding algorithm from locking on to a localized region of strongconvection.
c© 2017 Royal Meteorological Society Q. J. R. Meteorol. Soc. 143: 2524–2536 (2017)

2528 G. Kilroy et al.
8(a) (b)
(c) (d)
mass flux Ex–NoFR 20 km square column
6
4
2
0
0 6 12 18 24
Hour
z k
m
30 36 42 48
0.25
0.05
–0.05
–0.25
–0.5
8mass flux Ex–NoFR
No Friction
Friction
60 km square column
6
4
2
00 6 12 18 24
Hour
z k
m
30 36 42 48
0.25
0.05
–0.05
–0.25
–0.5
8mass flux Ex–FR 20 km square column
6
4
2
00 6 12 18 24
Hour
z k
m
30 36 42 48
0.25
0.05
–0.05
–0.25
–0.5
8mass flux Ex–FR 60 km square column
6
4
2
00 6 12 18 24
Hour
z k
m
30 36 42 48
0.25
0.05
–0.05
–0.25
–0.5
Figure 2. Time–height cross-sections of system-averaged mass flux within (a, c) a 20 km×20 km column and (b, d) a 60 km × 60 km column, centred on thecirculation centre. (a, b) show Ex-NoFr, and (c, d) Ex-FR. Values for the shading of mass flux are given in the colour bar, in units kg m−2s−1, multiplied by 10 forplotting purposes. Thick black contours are for values above 0.1 kg m−2s−1, at 0.1 kg m−2s−1 intervals. [Colour figure can be viewed at wileyonlinelibrary.com].
3150(a) (b) 200
180
160
140
120
100
80
60
40
20
0
2850
2550
2250
1950
1650
1350CA
PE
CIN
1050
750
450
1500 24 48 72
Time (h)
96 120 0 24 48 72
Time (h)
96 120
Figure 3. Evolution of (a) CAPE and (b) CIN, calculated from a sounding of an inner core average 20 km×20 km column out to 120 h in the two experiments Ex-FR(FR) and Ex-NoFR (NoFr). [Colour figure can be viewed at wileyonlinelibrary.com].
at heights of 1 and 3 km out to 48 h. As early as 4 h there ismoistening in Ex-Fr at a height of 1 km. This increase is a resultof the lifting of boundary-layer air produced by the frictionalconvergence that begins at the initial time when surface drag isimposed (section 5). At 10 h the effects of convection are evidentat radii between 45 and 60 km, as evidenced by an increase inmoisture (0.5 g kg−1) at this time. At 12 h the effects of convectivemoistening are seen at a radius of 60 km at a height of 3 km also.There is a continual moistening at smaller radii, during the 48 hperiod shown.
In contrast, in Ex-NoFr, there is no moistening at early timesas in Ex-Fr. In fact, the first notable �q at a height of 1 kmappears at about 15 h. At this time drying is evident to a radiusof 55 km, but beyond, at least to 100 km, there is a moistening.Subsequently, there is a progressive moistening as deep convectiongradually migrates inwards to smaller radii. Even as the dry regiondecreases in size, the strongest drying (�q < −1 g kg−1) occursinside a radius of 25 km from 42 h (thick black dashed contour).This drying must be associated with weak subsidence inducedby deep convection at larger radii. A major difference in the twoexperiments is that, in Ex-NoFr, there is no mechanism to focusdeep convection close to the circulation centre. As shown in thenext section, boundary-layer dynamics in Ex-Fr play an importantrole in focusing the convection inside the radius of maximumtangential winds, thereby increasing the moisture in that region.
5. The role of the boundary layer
Kilroy et al. (2016a) employed a simple, steady, slab boundary-layer model to help explain the radial expansion of the innercore of a mature tropical cyclone. They showed that, when forcedby the radially expanding azimuthally averaged tangential windfield at the top of the boundary layer from the numerical modelsimulation, the slab boundary-layer model correctly predicts theradial expansion of the radial and tangential velocity componentsin the inner core boundary layer, as well as the vertical velocity atthe top of the boundary layer.To investigate the role of the boundary layer in the genesis process,we employ the same slab boundary-layer model as Kilroy et al.(2016a). The details of this model and the justification for its useare given in Smith et al. (2015). We assume that the boundarylayer has a uniform depth of 1000 m.
Figure 5 shows solutions for the radial, tangential and verticalwind components, ub, vb and wb, for the steady, slab boundarylayer with the gradient wind profile used to initialize thecalculations (this profile has a maximum tangential wind speedof 5 m s−1 at a radius of 100 km). Because the initial vortex isrelatively weak, the tangential wind in the boundary layer isessentially the same as that above the boundary layer at all radii,indicating that a linear approximation for the boundary layermay be appropriate. Indeed, it is found that the linear solution
c© 2017 Royal Meteorological Society Q. J. R. Meteorol. Soc. 143: 2524–2536 (2017)

Tropical Cyclogenesis and Subsequent Intensification 2529
48
(a) (b)
(c) (d)
Ex–NoFR qv diff 1 km
1.0
0.5
0.1
–0.1
–0.2
42
36
30
24
t (h
)
18
12
6
00 25 50
Radius (km)
75 100
48Ex–FR qv diff 1 km
1.0
0.5
0.1
–0.1
–0.2
42
36
30
24
t (h
)
18
12
6
00 25 50
Radius (km)
75 100
48Ex–NoFR qv diff 3 km
1.0
0.5
0.1
–0.1
–0.2
42
36
30
24
t (h
)
18
12
6
00 25 50
Radius (km)
75 100
48Ex–FR qv diff 3 km
1.0
0.5
0.1
–0.1
–0.2
42
36
30
24
t (h
)
18
12
6
00 25 50
Radius (km)
75 100
Figure 4. Azimuthally averaged Hovmoller plot of water vapour mixing ratio difference (shading, g kg−1) from the initial profile at a height of (a, b) 1 km and (c, d)3 km for (a, c) Ex-NoFr and (b, d) Ex-FR out to a radius of 100 km for the first 48 h of the simulation. The bold contours are −0.5 g kg−1 (blue dashed) and −1.0 g kg−1
(black solid). [Colour figure can be viewed at wileyonlinelibrary.com].
for the radial wind component is virtually coincident with thenonlinear solution (Figure 5(a)). The vertical velocity at the topof the boundary layer in the nonlinear solution shows inertialoscillations that are an unrealistic feature of the nonlinear slabboundary-layer model. These oscillations are a manifestation ofthe only physical process by which the boundary layer can adjustto the radially changing gradient wind profile at its top in theslab model (Smith and Vogl, 2008; Kepert, 2012) and as seen inFigure 5(b), they are filtered out in the linear solution.
The radial inflow in the boundary layer is generally weak(less than 0.5 m s−1) and decreases in strength with decreasingradius from about 175 km. The increasing magnitude of ub withdecreasing radius is accompanied at large radii by an increase inthe rate of subsidence at the top of the boundary layer. At radiiless than about 210 km, the vertical velocity at the top of theboundary layer (wb) becomes positive and reaches a maximumof nearly 5 mm s−1 at a radius of about 85 km. Even though thismay seem weak, it would lead to a vertical displacement of airparcels of more than 200 m in 12 h, sufficient to have a significantimpact on reducing the local CIN. Indeed, the boundary-layerinduced ascent provides a suitable region for deep convectionto develop and focus. As the vortex wind field strengthens andexpands, the moisture will increase within the boundary layer,
and the ascent will increase in strength at the top of the boundarylayer. In this way the boundary layer exerts a progressive controlon the inner core convection as the vortex intensifies (Kilroy et al.,2016a).
In the absence of boundary-layer friction, deep convectiondevelops without any systematic organization and lies oftenoutside the radius of maximum tangential winds.
6. Spin-up in the simulation without friction
Despite the lack of convective organization driven by boundary-layer dynamics, the vortex in Ex-NoFr does eventually spinup (Figure 1(a)). The vortex intensifies gradually over timeuntil about 108 h, after which, the intensification rate increasesmarkedly. It was shown in KSM for Ex-Fr that prior to anynoticeable increase in Vmax (before the intensification begin timeat 45 h), there was persistent deep convection occurring near thecirculation centre. This deep convection acts to amplify verticalvorticity in the inner core via vortex tube stretching. The system-scale inflow associated with the deep convection converges verticalvorticity radially inwards, thereby increasing the local circulation.By this process, a monolithic core of strong cyclonic vorticityhas formed just before RI. In this section we perform a similar
c© 2017 Royal Meteorological Society Q. J. R. Meteorol. Soc. 143: 2524–2536 (2017)

2530 G. Kilroy et al.
(b)(a) 6 6
5
4
3
2
wb, w
L (
mm
s–1)
uL
, ub, vb, vg (
m s
–1)
1
0
–2
–1
5
4
3
2
1
00 100 200 300
r (km)
400 0 100 200
r (km)
300 400
Figure 5. (a) Radial profiles of radial and tangential wind components, ub and vb respectively, in the boundary layer (blue curves) for a fixed profile of gradient windat the top of the boundary layer (the red line partially hidden). The green line (partially hidden) shows the radial inflow in the linear solution for the boundary layer.(b) shows the corresponding profiles of vertical velocity at the top of the boundary layer calculated from the nonlinear (red curve) and the linear (blue curve) solutions.The calculations are based on the assumption of a constant boundary-layer depth of 1 km at a radius of 500 km. [Colour figure can be viewed at wileyonlinelibrary.com].
analysis for the inner core region of Ex-NoFr at various timesprior to intensification.
To investigate how vertical vorticity accumulates in the innercore in Ex-NoFr, we show in Figure 6 horizontal cross-sectionsof vertical vorticity, wind vectors at a height of 1 km, and surfacepressure at various times from 45 to 132 h. Contours of verticalvelocity equal to 1 m s−1 at heights of 2 and 6 km are superimposedto indicate the location of strong updraughts at these levels.
KSM identified 45 h as the intensification begin time forEx-Fr (their figure 3b). At that time the inner 20 km × 20 kmgrid is engulfed by deep convection and there are numerouspatches of cyclonic vertical vorticity surrounding this area. At45 h in Ex-NoFr, the situation is vastly different (Figure 6(a)).At this time there are only two active convective cells in theinner 100 km × 100 km grid, while there are a few sparselylocated patches of vertical vorticity. By 90 h there are somepatches of cyclonic vorticity near the circulation centre, althoughinterestingly, deep convection at no time occurs near thecirculation centre (not shown). The reason for the lack ofconvection is presumably because of the large CIN andenhanced drying that occurs in the inner 20 km × 20 km column(Figures 4(a) and (c)). Nonetheless, patches of enhanced verticalvorticity have migrated into this region by 90 h. There is adecrease also in surface pressure as depicted by the black contourin Figure 6.
At 108 h (Figure 6c), Vmax begins to increase with time morerapidly (Figure 1(a)). At this time there are many active deepconvective cells with associated patches of enhanced verticalvorticity, although these convective cells are mostly located awayfrom the circulation centre. The surface pressure has droppedfurther and VTmax has increased by 4.3 m s−1 compared to 90 h.Once again a main feature at this time is the lack of deepconvection near the circulation centre. Indeed, the innermost30 km ×30 km centred on the circulation centre contains verylittle active convection. Despite this, the area of enhanced verticalvorticity in this region continues to grow.
At 120 h (Figure 6d), the situation is similar to 12 h earlier interms of the location of deep convection. By this time, VTmax isnow 26.7 m s−1. The number of deep convective cells has increasedsince 108 h, although once again, these cells are located far away(about 20 km) from the circulation centre. The convection isbeginning to develop into an eyewall structure, at a radius ofabout 40 km, which coincides with the radius of maximum windsat this time (Figure 1(b)). The strongest patches of cyclonicvorticity (> 1 × 10⁻³s−1) are located in or near the eyewallregion, although the circulation centre has relatively low valuesof vertical vorticity at this time.
At 132 h (Figure 6e), there is a strong increase in both Vmax andVTmax (Figure 1(a)). The horizontal structure of the system haschanged markedly from 12 h before and a more coherent ring-likestructure in the vorticity field has emerged. During this time there
has been a continual migration of patches of enhanced cyclonicvorticity towards the circulation centre, despite the absence ofdeep convection there. Over the next 24 h the vorticity withinthe ring continues to increase with values exceeding 2 × 10⁻³s−1,despite the continued lack of convection in that region.
While observing the vorticity evolution of the zero drag sim-ulation, there appears to be several barotropic-like mechanismsin action: vorticity anomalies move upgradient until the ring ofvorticity forms. This upgradient vorticity transfer is consistentwith the theories of Schecter and Dubin (1999), McWilliamset al. (2003) and Montgomery and Enagonio (1998). However,to explain the large values of vertical vorticity that continue tomigrate towards the circulation centre within the ring-like config-uration, a different mechanism needs to be invoked. As explainedby Schubert et al. (1999), rings of vorticity have the propensityto become barotropically unstable and the mixing that ensuescan lead to the maximum vorticity migrating inwards. While thestronger regions of cyclonic vorticity in Schubert et al. (1999)underwent a weakening as the ring transformed into a monopole,the ring of vorticity in Ex-NoFr is continually reinforced by thegeneration of cyclonic vorticity anomalies outside the ring, whichthen move updradient into the ring as described above. Theseproffered explanations, which are all based on barotropic dynam-ics, offer a plausible zero-order interpretation of the upscaling ofvorticity near the circulation centre in the absence of friction. Afurther investigation of these processes is certainly warranted, butfalls beyond the scope of this paper.
In summary, we have highlighted some major differencesbetween simulations with and without surface friction. Namely,without boundary-layer dynamics determining where the upflowout of the boundary layer must occur, deep convection isunfocused and occurs at large radii. The collective effects ofthe convection occurring at large radii is to force subsidence, anddrying, in the inner core region, increasing the CIN there andmaking the inner core less susceptible to convection. Eventually,as convection occurs inside the radius of maximum winds, spin-up occurs as M-surfaces are drawn gradually inwards belowand above the boundary layer. In the absence of friction,these surfaces are approximately materially conserved withinthe thermodynamic boundary layer also. Despite the fact thatdeep convection never occurs close to (within 30 km radiusof) the circulation centre, patches of enhanced vertical vorticitygradually migrate to the centre over time, eventually filling theinner core with large values of cyclonic vertical vorticity. Thisresult suggests the importance of barotropic-like dynamics in theabsence of surface friction. When surface friction is included, theinflow generated within the boundary layer plays, in part, a role inmerging patches of enhanced vertical vorticity on a much shortertime-scale (KSM).
c© 2017 Royal Meteorological Society Q. J. R. Meteorol. Soc. 143: 2524–2536 (2017)

Tropical Cyclogenesis and Subsequent Intensification 2531
(b)(a)
(c) (d)
(e) (f)
50zeta, uv (1 km), w (2, 6 km), ps NoFr 45 h
25
0
y (
km
)
–25
–50–50 –25
vTmax = 12.9
0
x (km)
25 50
–5
5
10
20
0.150E+02
Maximum
50zeta, uv (1 km), w (2, 6 km), ps NoFr 90 h
25
0
y (
km
)
–25
–50–50 –25
vTmax = 14.5
0
x (km)
25 50
–5
5
10
20
0.150E+02
Maximum
50zeta, uv (1 km), w (2, 6 km), ps NoFr 132 h
25
0
y (
km
)
–25
–50–50 –25
vTmax = 44.2
0
x (km)
25 50
–5
5
10
20
0.150E+02
Maximum
50zeta, uv (1 km), w (2, 6 km), ps NoFr 150 h
25
0
y (
km
)
–25
–50–50 –25
vTmax = 50.2
0
x (km)
25 50
–5
5
10
20
0.150E+02
Maximum
50zeta, uv (1 km), w (2, 6 km), ps NoFr 108 h
25
0
y (
km
)
–25
–50–50 –25
vTmax = 18.8
0
x (km)
25 50
–5
5
10
20
0.150E+02
Maximum
50zeta, uv (1 km), w (2, 6 km), ps NoFr 120 h
25
0
y (
km
)
–25
–50–50 –25
vTmax = 26.7
0
x (km)
25 50
–5
5
10
20
0.150E+02
Maximum
Figure 6. Horizontal cross-sections of relative vertical vorticity (shading, multiplied by 10−4) and wind vectors at (a) 45 h, (b) 90 h, (c) 108 h, (d) 120 h, (e) 132 h,and (f) 156 h at 1 km altitude for Ex-NoFr. Also shown are contours of vertical velocity (contour interval 1 m s−1) at heights of 2 km (aqua) and 6 km (yellow), and ofsurface pressure (black) contoured every 2 hPa. The wind vectors are relative to the maximum reference vector at the bottom right, while the maximum total windspeed in the domain plotted is given in m s−1 at the bottom left.
c© 2017 Royal Meteorological Society Q. J. R. Meteorol. Soc. 143: 2524–2536 (2017)
2532 G. Kilroy et al.
(a) (b)
(c) (d)
(e) (f)
(g) (h)
(i) (j)
24 h16
12
z (k
m)
8
4
00 50 100 150
Radius (km)
200 250 300
1.0
0.2
0.05
Ex–NoFrNo Friction
No Friction case at later times
Friction24 h
16
12
z (k
m)
8
4
00 50 100 150
Radius (km)
200 250 300
1.0
0.2
0.05
Ex–Fr
36 h16
12
z (k
m)
8
4
00 50 100 150
Radius (km)
200 250 300
1.0
0.2
0.05
Ex–NoFr 36 h16
12
z (k
m)
8
4
00 50 100 150
Radius (km)
200 250 300
1.0
0.2
0.05
Ex–Fr
48 h16
12
z (k
m)
8
4
00 50 100 150
Radius (km)
200 250 300
1.0
0.2
0.05
Ex–NoFr 48 h16
12z
(km
)
8
4
00 50 100 150
Radius (km)
200 250 300
1.0
0.2
0.05
Ex–Fr
60 h16
12
z (k
m)
8
4
0
0 50 100 150
Radius (km)
200 250 300
1.0
0.2
0.05
Ex–NoFr 72 h16
12
z (k
m)
8
4
00 50 100 150
Radius (km)
200 250 300
1.0
0.2
0.05
Ex–NoFr
96 h16
12
z (k
m)
8
4
00 50 100 150
Radius (km)
200 250 300
1.0
0.2
0.05
Ex–NoFr 120 h16
12
z (k
m)
8
4
00 50 100 150
Radius (km)
200 250 300
1.0
0.2
0.05
Ex–NoFr
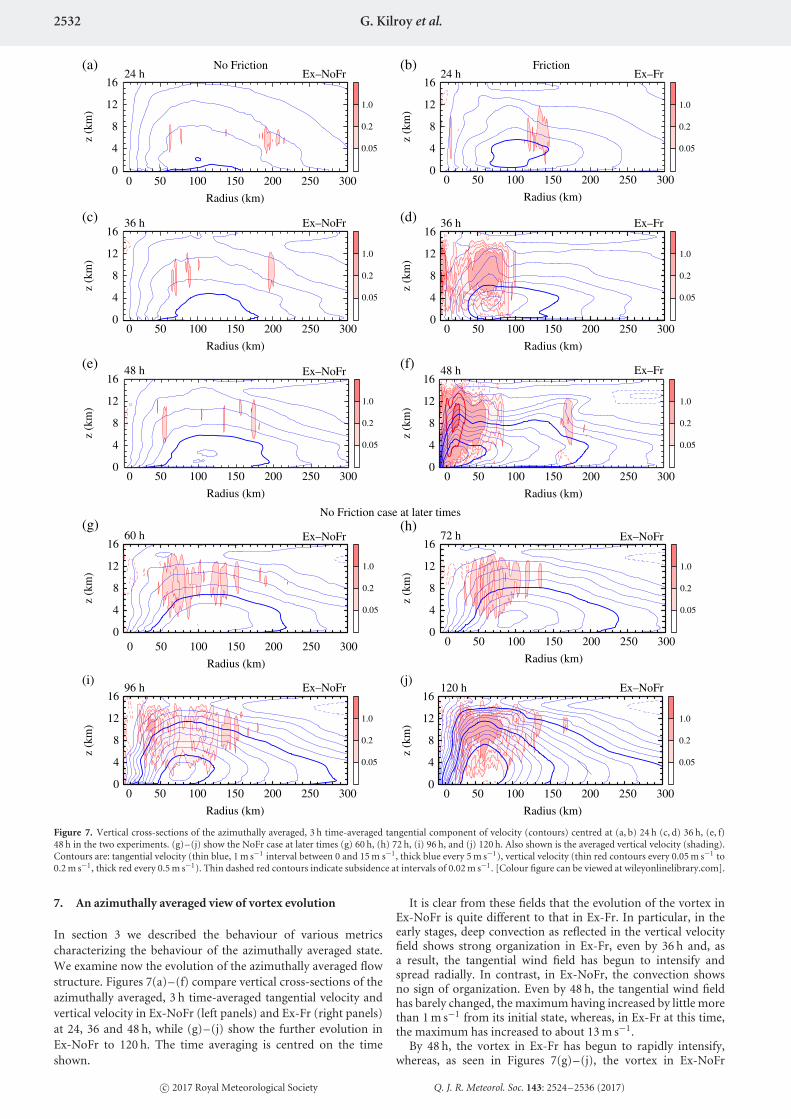
Figure 7. Vertical cross-sections of the azimuthally averaged, 3 h time-averaged tangential component of velocity (contours) centred at (a, b) 24 h (c, d) 36 h, (e, f)48 h in the two experiments. (g)–(j) show the NoFr case at later times (g) 60 h, (h) 72 h, (i) 96 h, and (j) 120 h. Also shown is the averaged vertical velocity (shading).Contours are: tangential velocity (thin blue, 1 m s−1 interval between 0 and 15 m s−1, thick blue every 5 m s−1), vertical velocity (thin red contours every 0.05 m s−1 to0.2 m s−1, thick red every 0.5 m s−1). Thin dashed red contours indicate subsidence at intervals of 0.02 m s−1. [Colour figure can be viewed at wileyonlinelibrary.com].
7. An azimuthally averaged view of vortex evolution
In section 3 we described the behaviour of various metricscharacterizing the behaviour of the azimuthally averaged state.We examine now the evolution of the azimuthally averaged flowstructure. Figures 7(a)–(f) compare vertical cross-sections of theazimuthally averaged, 3 h time-averaged tangential velocity andvertical velocity in Ex-NoFr (left panels) and Ex-Fr (right panels)at 24, 36 and 48 h, while (g)–(j) show the further evolution inEx-NoFr to 120 h. The time averaging is centred on the timeshown.
It is clear from these fields that the evolution of the vortex inEx-NoFr is quite different to that in Ex-Fr. In particular, in theearly stages, deep convection as reflected in the vertical velocityfield shows strong organization in Ex-Fr, even by 36 h and, asa result, the tangential wind field has begun to intensify andspread radially. In contrast, in Ex-NoFr, the convection showsno sign of organization. Even by 48 h, the tangential wind fieldhas barely changed, the maximum having increased by little morethan 1 m s−1 from its initial state, whereas, in Ex-Fr at this time,the maximum has increased to about 13 m s−1.
By 48 h, the vortex in Ex-Fr has begun to rapidly intensify,whereas, as seen in Figures 7(g)–(j), the vortex in Ex-NoFr
c© 2017 Royal Meteorological Society Q. J. R. Meteorol. Soc. 143: 2524–2536 (2017)

Tropical Cyclogenesis and Subsequent Intensification 2533
(a) (b)
(c) (d)
(e) (f)
24 h16
12z
(km
)
8
4
00 50 100 150
Radius (km)
200 250 300
1
0.5
0.2
Ex–NoFr
36 h16
12
z (k
m)
8
4
00 50 100 150
Radius (km)
200 250 300
1
0.5
0.2
Ex–NoFr
48 h16
12
z (k
m)
8
4
00 50 100 150
Radius (km)
200 250 300
1
0.5
0.2
Ex–NoFr
24 h16
12
z (k
m)
8
4
00 50 100 150
Radius (km)
200 250 300
1
0.5
0.2
Ex–Fr
36 h16
12
z (k
m)
8
4
00 50 100 150
Radius (km)
200 250 300
1
0.5
0.2
Ex–Fr
48 h16
12z
(km
)8
4
00 50 100 150
Radius (km)
200 250 300
1
0.5
0.2
Ex–Fr
Figure 8. Vertical cross-sections of the azimuthally averaged, 3 h time-averaged radial velocity component centred at at (a, b) 24 h (c, d) 36 h, (e, f) 48 h in the twoexperiments. Superimposed on the radial component is the averaged diabatic heating rate with some shading as indicated and selected contours of absolute angularmomentum. Contours are: radial velocity (thick blue contours every 1 m s−1, dashed negative, thin blue dashed contours every 0.2 m s−1 down to −0.8 m s−1), diabaticheating rate (thin red contours 0.2 and 0.5 K day−1, dashed negative, medium thickness red contours 1 and 2 K day−1, thick red contours every 5 K day−1), absoluteangular momentum (thick black contours every 5×10⁵ m2s−1). [Colour figure can be viewed at wileyonlinelibrary.com].
develops only slowly for another three days. At 120 h, themaximum tangential wind speed is about 15 m s−1 at a radius of55 km. While the vortex intensifies beyond this time, it does notbecome appreciably more compact, the minimum value of Rvmax
does not decrease much below 40 km (Figure 1).Figure 8 compares vertical cross-sections of the azimuthally
averaged, 3 h time-averaged, radial velocity u, diabatic heatingrate θ , and absolute angular momentum M at 24, 36 and 48 hin Ex-NoFr and Ex-Fr. Again, the rapid organization of deepconvection, characterized here by the highly localized diabaticheating distribution, is evident in Ex-Fr, whereas the absence ofsuch organization is a feature of the Ex–NoFr simulation duringthe same time period. The organization of convection in Ex-Fr isaccompanied by much stronger inflow in the lower troposphereand therefore a much greater inward radial displacement of theM-surfaces than in Ex-NoFr. This displacement is consistent, ofcourse, with the larger tangential velocities seen in Figures 7(b),(d) and (f).
While some of the low-level inflow seen in Figures 8(b), (d) and(f) may be attributed to the ‘sucking effect’ of deep convection,the organization of the convection in Ex-Fr, as described inthe preceding section, has no counterpart in Ex-NoFr. Thisorganization in Ex-Fr is associated with the boundary-layerinduced inflow. As noted by Smith and Montgomery (2015), it isnot possible, in general, to isolate analytically the separate effectsof deep convection and boundary-layer friction in producinginflow in the boundary layer. This is because of the intrinsicnonlinearity of the boundary layer when the characteristic vortexRossby number becomes of order unity (Smith and Montgomery,2008; Vogl and Smith, 2009; Montgomery et al., 2014). Howeverit is possible to estimate the boundary-layer contribution asarticulated by Kilroy et al. (2016a) and it is possible to estimate
the inflow induced by deep convection in the absence of frictionby doing a balance calculation††.
In the Ex-NoFr calculation, the balance calculation shouldbe good everywhere, at least for the azimuthally averaged flow,and therefore helpful in interpreting the subsequent evolutionbeyond 48 h. For this reason we show in Figure 9 similar figuresto those in the left column of Figure 8, but for later times to120 h, together with the corresponding balance calculations inthe right column. The balance calculations for the radial velocitycomponent are based on a solution of the Sawyer–Eliassenequation for the streamfunction of the secondary circulationas discussed in Kilroy et al. (2016a)‡‡. Comparison of theradial velocity component in the full solution and in thecorresponding axisymmetric Eliassen balance solution (forced bythe time and azimuthally averaged diabatic heating rate) showsquantitatively good agreement, supporting the interpretation that,without friction, the azimuthally averaged transverse circulationis captured largely by axisymmetric balance dynamics.
From an azimuthally averaged perspective, in the friction run,the strongest azimuthally averaged tangential wind speed occursin the frictional boundary layer (Kilroy et al., 2017, their figure 6at 48 h and beyond) as a result of the boundary-layer spin-upmechanism (Smith et al., 2009). In the no-friction simulation, the
††One can estimate the boundary-layer contribution of deep convection in abalance calculation also, but because the boundary layer is generally not closeto balance in the inner core of tropical cyclones, this estimate is unlikely to berobust (e.g. Smith et al., 2009).‡‡As in Kilroy et al., the radial resolution of the streamfunction calculation wasdegraded to facilitate convergence of the solution using an iterative successiveover-relaxation method in a reasonable time. Specifically the calculation wascarried out on a domain 500 km in radius and 16 km high with open boundarycondition on the streamfunction at the far radius.
c© 2017 Royal Meteorological Society Q. J. R. Meteorol. Soc. 143: 2524–2536 (2017)

2534 G. Kilroy et al.
(a) (b)
(c) (d)
(e) (f)
72 hCM1 Model SE Balanced
16
12z
(km
)
8
4
00 50 100 150
Radius (km)
200 250 300
1
0.5
0.2
Ex–NoFr
96 h16
12
z (k
m)
8
4
00 50 100 150
Radius (km)
200 250 300
1
0.5
0.2
Ex–NoFr
120 h16
12
z (k
m)
8
4
00 50 100 150
Radius (km)
200 250 300
1
0.5
0.2
Ex–NoFr
72 h16
12
z (k
m)
8
4
00 50 100 150
Radius (km)
200 250 300
1
0.5
0.2
Ex–NoFr
96 h16
12
z (k
m)
8
4
00 50 100 150
Radius (km)
200 250 300
1
0.5
0.2
Ex–NoFr
120 h16
12z
(km
)
8
4
00 50 100 150
Radius (km)
200 250 300
1
0.5
0.2
Ex–NoFr
Figure 9. Radius–height cross-sections similar to Figures 8(b, d, f), but showing the filtered diabatic heating rate and the balanced radial flow calculated from thesolution of the Sawyer–Eliassen equation forced by this heating distribution. Contours of absolute angular momentum are not shown again in the balanced plots(b, d, f). Contour information is as in Figure 8. [Colour figure can be viewed at wileyonlinelibrary.com].
maximum tangential wind speed can occur at mid-levels or low-levels (Figure 7), and M is approximately materially conserved atall locations as there is no boundary layer. The primary reasonfor weaker winds in the no-friction run is that, because thereis no focussing of the convection near the circulation centre,the eyewall that eventually develops is located much further outradially than in the friction run (Rvmax plot in Figure 1). Eventhough M is approximately materially conserved at all locationsin Ex-noFr, since the ‘eyewall’ is located much further out, theM-surfaces are not drawn as close to the centre as in Ex-Fr.
8. Relation to previous work
The findings from sections 5 and 6 are believed to be significantbecause they offer new insights on the role of surface frictionin fostering convective organization in the vortex developmentprocess and they offer also new insight on the mechanism ofvortex spin-up without surface friction. Previous studies bySchecter (2011) and Bryan (2012) have considered, inter alia,the influence of surface friction on vortex development and therelation of these studies to the present one will be discussed here.
As part of an effort to evaluate a family of reduced modelsfor tropical cyclone behaviour, Schecter (2011) conductedhigh-resolution, near-cloud-resolving simulations of tropicalcyclogenesis starting from small-amplitude turbulence in the windfield within a convectively favourable, quiescent environment.He found that by suppressing surface drag entirely, the lackof boundary-layer convergence inhibits cyclone formation. Inparticular, with zero surface drag, he found that there was no signof cyclone formation during a 30 day simulation. Moreover, asnoted in the Introduction, consistent with Persing et al. (2013),Schecter (section 2.2) noted that ‘the influence of surface dragremains minimal 7.33 days into genesis, but seems to nudgeconvection toward the centre of the developing domain-scale
circulation’. Although we have not tried to duplicate his resultsexactly, our results support his findings in the sense that frictionprovides a mechanism for helping convection focus near thecirculation centre. In contrast to the results of Schecter, ourexperiment without friction eventually predicts spin-up, buton a relatively long time-scale. Of course, there are differencesbetween our set-up and his, namely, we employ a higher SST(29◦C versus 26◦C), a relatively moist ‘pouch sounding’ two daysprior to the formation of tropical storm Karl during the PREDICTexperiment, etc. (section 2 gives details), and we employ a singlevortex as initial condition while he starts from a turbulent initialcondition with a specified energy spectra. Moreover, he uses adifferent numerical model with much coarser horizontal gridspacing (3.9 km versus 500 m used here). The differences in thethermodynamics might plausibly account for the eventual spin-up found here without friction. Nevertheless, there appears to beconsensus of both studies that surface friction plays an importantrole at early times in the development process.
The explanation for vortex intensification in the absence ofsurface drag offered in the previous section is in contrast to thatgiven by Bryan (2012). His interpretation of spin-up withoutdrag invokes the vertical redistribution of tangential momentumnear the surface to higher levels by the turbulence scheme. Heexplains that ‘because v [defined as the azimuthally averagedtangential velocity: our insertion] decreases with height in theinitial conditions, the turbulence model would act to decreasev near the surface (and increase v aloft). Assuming the radialpressure gradient stays roughly the same, this decrease in v nearthe surface can lead to radial inflow and thus intensification.’Figure 10(a) shows the initial vortex wind structure alongwith the corresponding M-surfaces, while (b) and (c) showthe corresponding vortex structure at 5 h in Ex-NoFr and Ex-Fr, respectively. The initial vortex structure has an almost zerovertical gradient in both v and M in the lowest 2 km, suggestingthat there would be minimal reduction of v by the turbulence
c© 2017 Royal Meteorological Society Q. J. R. Meteorol. Soc. 143: 2524–2536 (2017)

Tropical Cyclogenesis and Subsequent Intensification 2535
(a)
(b)
(c)
10
8
6
z (k
m)
4
2
00 25 50 75
Radius (km)
100 125 150
3
4
4.5
2
1
Initial vortex
4
3
z (k
m)
2
1
00 25 50 75
Radius (km)
100 125 150
3
4
4.5
2
1
5 hEx–NoFr
4
3
z (k
m)
2
1
00 25 50 75
Radius (km)
100 125 150
3
4
4.5
2
1
5 hEx–Fr
Figure 10. Vertical cross-section of (a) the initial vortex structure, and the vortexstructure at 5 h in (b) Ex-NoFr and (c) Ex-Fr. The V wind component appearsas contours with shading; contours of the radial component of velocity are from±0.1 m s−1 to ±1.0 m s−1 at intervals of 0.1 m s−1. Inflow contours are dashedblue, outflow are solid yellow. Absolute angular momentum is shown as blackcontours every 1×10⁻⁷m2s−1. [Colour figure can be viewed at wileyonlinelibrary.com].
scheme in this layer. Furthermore, we find that there is nodevelopment of systematic inflow in Ex-NoFr near the surface at5 h (Figure 10(b)) or before the initial burst of deep convection atabout 12 h (not shown). In fact, in the lowest few hundred metresabove the surface, there is mostly weak disorganised outflow,leading to weak outward-sloping M-surfaces there. In Ex-Fr(Figure 10(c)) the vortex structure is fundamentally different,with a layer of relatively strong inflow (maximum magnitudeof 0.94 m s−1) to a depth of 500 m, with weak outflow abovethat.
In conclusion, we find no supporting evidence of the turbulencescheme playing any significant role in generating inflow orspinning up the vortex in Ex-NoFr∗.
∗In view of the intrinsic limitations of strictly axisymmetric modelling fortropical cyclone intensification found by Persing et al. (2013), it should benoted that there may be inherent differences in the spin-up of the zero-drag,three-dimensional, simulation presented here and in the axisymmetric, zero-drag simulation of Bryan (2012). However, on account of the near-zero verticalgradient of tangential wind near the surface for the initial vortex used here,we hypothesize that the vortex will not spin up in an axisymmetric zero-drag
In a recent study, Heng and Wang (2016) carried out a pairof numerical model simulations, one with and the other withoutsurface drag, but with the same fixed distribution of heating toforce the intensification of a prescribed initial vortex. They foundthat the vortex in the case without surface drag became the moreintense. This is just the opposite to the finding of the present study.The implication is, of course, that the diabatic heating rate cannotbe presumed to be the same as it will depend on the details ofthe evolving field of convection, which is, as we have shown, tiedto the dynamics and thermodynamics of the evolving boundarylayer. In the absence of a boundary layer in the case withoutsurface drag, the only influence on the location of the convectionis the pattern of enhanced surface moisture fluxes in the vicinityof the maximum tangential wind of the vortex. It follows that theassumption of the same fixed heating distribution in the Heng andWang simulations provides an unrealistic thought experiment intheir words (p. 1318), ‘... to clarify the recent debate on the roleof surface friction in tropical cyclone intensification’.
9. Conclusions
To investigate the effects of surface friction during tropicalcyclogenesis, we have compared the results of two idealized,high-resolution, numerical model simulations, one with and onewithout surface drag. While spin-up occurs in both simulations,the vortex in the one without surface drag takes over twice aslong to reach its intensification begin time. Further, the simulatedvortex is considerably larger in inner core size and weaker inintensity.
A major difference between the two simulations is that there isno mechanism to focus deep convection close to the circulationcentre in the simulation without friction. The frictional boundary-layer dynamics play an important role in focusing the convectionnear the circulation centre, which then increases the moisture inthat region. Indeed, the boundary-layer induced ascent providesa suitable region for deep convection to develop and focus. Asthe tangential wind field of the vortex strengthens and expands,the moisture increases within the boundary layer, and the ascentincreases in strength at the top of the boundary layer. In this waythe boundary layer exerts a progressive control on the inner coreconvection as the vortex evolves.
In the absence of friction, deep convection is unfocused andat early times occurs predominantly at large radii, where surfacefluxes are a maximum. The collective effects of this convection is toforce subsidence, and drying, in the inner core region, increasingthe CIN there and making the inner core less susceptible toconvection. Eventually, as convection develops inside the radiusof maximum winds, spin-up occurs as M-surfaces are drawngradually inwards within and above the boundary layer.
Without friction, the M-surfaces are materially conservedwithin the thermodynamic boundary layer also. However, despitethe fact that deep convection never occurs close to (within30 km radius of) the circulation centre, patches of enhancedvertical vorticity gradually migrate towards the centre to form amonopole of cyclonic vertical vorticity. These findings suggest theimportance of barotropic-like vorticity dynamics in the absenceof surface friction. In contrast, when surface friction is included,the inflow generated within, and above, the boundary layer plays alarger role in the merger of patches of enhanced cyclonic vorticityon a much shorter time-scale.
A comparison of the radial velocity component in thefull solution with that in the corresponding axisymmetricEliassen balance solution (forced by the time and azimuthallyaveraged diabatic heating rate) shows quantitatively goodagreement, supporting the interpretation that, without friction,the azimuthally averaged transverse circulation is captured largelyby axisymmetric balance dynamics.
simulation by the pathway suggested by Bryan (2012). This issue warrantsfurther study.
c© 2017 Royal Meteorological Society Q. J. R. Meteorol. Soc. 143: 2524–2536 (2017)

2536 G. Kilroy et al.
Relating our work to some notable previous studies, we findthat there is now an emerging consensus that surface frictionplays an important role at early times in the tropical cyclogenesisprocess. We find no supporting evidence of the turbulence schemeplaying any significant role in generating inflow or in spinningup the vortex in our simulations. Consistent with recent work,the results demonstrate that the convective organization processis aided by frictional convergence and raise the possibility thatthe timing of genesis in numerical models may depend on theboundary-layer parametrization scheme. This would seem to bea topic that merits further investigation.
In summary, in the absence of boundary-layer friction,the convection eventually develops without any systematicorganization and lies often outside the radius of azimuthallyaveraged maximum tangential winds. The results underscore thecrucial role of friction in organizing deep convection in the innercore of the nascent vortex. Moreover, they point to the dangerof comparing simulations with and without friction using thesame prescribed diabatic heating rate as was done by Heng andWang (2016) in an attempt to downplay the role of friction in theintensification process.
Acknowledgements
We thank Kerry Emanuel, Yuqing Wang and an anonymousreviewer for their thoughtful reviews of the original manuscript.GK and RKS acknowledge financial support for tropicalcyclone research from the German Research Council (DeutscheForschungsgemeinschaft) under grant numbers SM30/23-3 andSM30/23-4 and the Office of Naval Research Global under grantno. N62909-15-1-N021. MTM acknowledges the support of NSFgrant AGS-1313948, NOAA HFIP grant N0017315WR00048,NASA grant NNG11PK021 and the US Naval PostgraduateSchool.
References
Anthes RA. 1974. The dynamics and energetics of mature tropical cyclones.Rev. Geophys. Space Phys. 12: 495–522.
Bryan GH. 2012. Comments on ‘Sensitivity of tropical-cyclone models to thesurface drag coefficient. Q. J. R. Meteorol. Soc. 139: 1957–1960.
Bryan GH, Fritsch JM. 2002. A benchmark simulation for moist nonhydrostaticnumerical models. Mon. Weather Rev. 130: 2917–2928.
Bryan GH, Rotunno R. 2009. The maximum intensity of tropical cyclonesin axisymmetric numerical model simulations. Mon. Weather Rev. 137:1770–1789.
Carrier GF. 1971. Swirling flow boundary layers. J. Fluid Mech. 49: 133–144.Charney JG, Eliassen A. 1964. On the growth of the hurricane depression. J.
Atmos. Sci. 21: 68–75.Cotton WR, Pielke RA, Walko RL, Liston GE, Tremback CJ, Jiang H, McAnelly
RL, Harrington JY, Nicholls ME, Carrio GG, McFadden JP. 2013. RAMS2001: Current status and future directions. Meteorol. Atmos. Phys. 82: 5–29.
Craig GC, Gray SL. 1996. CISK or WISHE as a mechanism for tropical cycloneintensification. J. Atmos. Sci. 53: 3528–3540.
Crnivec N, Smith RK, Kilroy G. 2016. Dependence of tropical cycloneintensification rate on sea surface temperature. Q. J. R. Meteorol. Soc.142: 1618–1627.
Emanuel KA. 1986. An air–sea interaction theory for tropical cyclones. Part I:Steady state maintenance. J. Atmos. Sci. 43: 585–604.
Emanuel KA. 1989. The finite amplitude nature of tropical cyclogenesis. J.Atmos. Sci. 46: 3431–3456.
Emanuel KA. 1995. Sensitivity of tropical cyclones to surface exchangecoefficients and a revised steady-state model incorporating eye dynamics. J.Atmos. Sci. 52: 3969–3976.
Emanuel KA. 1997. Some aspects of hurricane inner-core dynamics andenergetics. J. Atmos. Sci. 54: 1014–1026.
Heng J, Wang Y. 2016. Nonlinear response of a tropical cyclone vortexto prescribed eyewall heating with and without surface friction inTCM4: Implications for tropical cyclone intensification. J. Atmos. Sci.73: 1315–1333.
Kaplan J, DeMaria M. 2003. Large-scale characteristics of rapidly intensifyingtropical cyclones in the North Atlantic Basin. Weather Forecasting 18:1093–1108.
Kepert JD. 2012. Choosing a boundary-layer parameterisation for tropicalcyclone modelling. Mon. Weather Rev. 140: 1427–1445.
Kilroy G, Smith RK. 2016a. Why do model tropical cyclones grow progressivelyin size and decay in intensity after reaching maturity? J. Atmos. Sci. 73:487–503.
Kilroy G, Smith RK, Montgomery MT, Lynch B, Earl-Spurr C. 2016b. Acase-study of a monsoon low that formed over the sea and intensifiedover land as seen in the ECMWF analyses. Q. J. R. Meteorol. Soc. 142:2244–2255.
Kilroy G, Smith RK, Montgomery MT. 2017. A unified view of tropicalcyclogenesis and intensification. Q. J. R. Meteorol. Soc. 143: 450–462.
McWilliams JC, Graves LP. 2003. A formal theory for vortex Rossby waves andvortex evolution. Geophys. Astrophys. Fluid Dyn. 97: 275–309.
Montgomery MT, Enagonio J. 1998. Tropical cyclogenesis via convectivelyforced vortex Rossby waves in a three-dimensional quasi-geostrophic model.J. Atmos. Sci. 55: 3176–3207.
Montgomery MT, Smith RK. 2017. Recent developments in the fluid dynamicsof tropical cyclones. Annu. Rev. Fluid Mech. 49: 1–33.
Montgomery MT, Nicholl ME, Cram TA, Saunders A. 2006. A ‘vortical’ hottower route to tropical cyclogenesis. J. Atmos. Sci. 63: 355–386.
Montgomery MT, Smith RK, Nguyen SV. 2010. Sensitivity of tropical cyclonemodels to the surface drag coefficient. Q. J. R. Meteorol. Soc. 136:1945–1953.
Montgomery MT, Davis C, Dunkerton T, Wang Z, Velden C, Torn R,Majumdar SJ, Zhang F, Smith RK, Bosart L, Bell MM, Haase JS, HeymsfieldA, Jensen J, Campos T, Boothe MA. 2012. The Pre-Depression Investigationof Cloud Systems in the Tropics (PREDICT) Experiment: Scientific basis,new analysis tools and some first results. Bull. Am. Meteorol. Soc. 93:153–172.
Montgomery MT, Zhang JA, Smith RK. 2014. The low-level structure ofrapidly intensifying and mature hurricane Earl. Q. J. R. Meteorol. Soc. 140:2132–2146.
Ooyama KV. 1969. Numerical simulation of the life cycle of tropical cyclones.J. Atmos. Sci. 26: 3–40.
Ooyama KV. 1982. Conceptual evolution of the theory and modeling of thetropical cyclone. J. Meteorol. Soc. Jpn. 60: 369–380.
Persing J, Montgomery MT, McWilliams J, Smith RK. 2013. Asymmetricand axisymmetric dynamics of tropical cyclones. Atmos. Chem. Phys. 13:12249–12341.
Rosenthal SL. 1971. The response of a tropical cyclone model to variations inboundary-layer parameters, initial conditions, lateral boundary conditions,and domain size. Mon. Weather Rev. 99: 767–777.
Rotunno R, Emanuel KA. 1987. An air–sea interaction theory for tropicalcyclones. Part II: Evolutionary study using a non-hydrostatic axisymmetricnumerical model. J. Atmos. Sci. 44: 542–561.
Schecter DA. 2011. Evaluation of a reduced model for investigating hurricaneformation from turbulence. Q. J. R. Meteorol. Soc. 137: 155–178.
Schecter DA, Dubin DHE. 1999. Vortex motion driven by a backgroundvorticity gradient. Phys. Rev. Lett. 83: 2191–2194.
Schecter DA, Dunkerton TJ. 2009. Hurricane formation in diabatic Ekmanturbulence. Q. J. R. Meteorol. Soc. 135: 823–838.
Schmidt CW, Smith RK. 2016. Tropical cyclone evolution in a min-imal axisymmetric model revisited. Q. J. R. Meteorol. Soc. 142:1505–1516.
Schubert WH, Montgomery MT, Taft RK, Guinn TA, Fulton SR, Kossin JP,Edwards JP. 1999. Polygonal eyewalls, asymmetric eye contraction, andpotential vorticity mixing in hurricanes. J. Atmos. Sci. 56: 1197–1223.
Smith RK, Montgomery MT. 2008. Balanced boundary layers used in hurricanemodels. Q. J. R. Meteorol. Soc. 134: 1385–1395.
Smith RK, Montgomery MT. 2012. Observations of the convective environmentin developing and non-developing tropical disturbances. Q. J. R. Meteorol.Soc. 138: 1721–1739.
Smith RK, Montgomery MT. 2015. Towards clarity on understanding tropicalcyclone intensification. J. Atmos. Sci. 72: 3020–3031.
Smith RK, Montgomery MT. 2016a. Understanding hurricanes. Weather 71:219–223.
Smith RK, Montgomery MT. 2016b. The efficiency of diabatic heating andtropical cyclone intensification. Q. J. R. Meteorol. Soc. 142: 2081–2086.
Smith RK, Vogl S. 2008. A simple model of the hurricane boundary layerrevisited. Q. J. R. Meteorol. Soc. 134: 337–351.
Smith RK, Montgomery MT, Nguyen SV. 2009. Tropical cyclone spin-uprevisited. Q. J. R. Meteorol. Soc. 135: 1321–1335.
Smith RK, Montgomery MT, Thomsen G. 2014. Sensitivity of tropical cyclonemodels to the surface drag coefficient in different boundary-layer schemes.Q. J. R. Meteorol. Soc. 140: 792–804.
Smith RK, Kilroy G, Montgomery MT. 2015a. Why do model tropical cyclonesintensify more rapidly at low latitudes? J. Atmos. Sci. 72: 1783–1804.
Smith RK, Montgomery MT, Kilroy G, Tang S, Muller SK. 2015b. Tropicallow formation during the Australian monsoon: The events of January 2013.Aust. Meteorol. Oceanogr. J. 65: 318–341.
Tang S, Smith RK, Montgomery MT, Gu M. 2016. Numerical study of thespin-up of a tropical low over land during the Australian monsoon. Q. J. R.Meteorol. Soc. 142: 2021–2032.
Vogl S, Smith RK. 2009. Limitations of a linear model for the hurricaneboundary layer. Q. J. R. Meteorol. Soc. 135: 839–850.
c© 2017 Royal Meteorological Society Q. J. R. Meteorol. Soc. 143: 2524–2536 (2017)