the role of desalination in an increasingly water-scarce world
TRANSCRIPT

The Role of D
esalination in an Increasingly Water-Scarce W
orld
The Role of Desalination in an Increasingly Water-Scarce World
T E C H N I C A L P A P E RW A T E R G L O B A L P R A C T I C E
M A R C H 2 0 1 9
Pub
lic D
iscl
osur
e A
utho
rized
Pub
lic D
iscl
osur
e A
utho
rized
Pub
lic D
iscl
osur
e A
utho
rized
Pub
lic D
iscl
osur
e A
utho
rized
About the Water Global PracticeLaunched in 2014, the World Bank Group’s Water Global Practice brings together financing, knowledge, and implementation in one platform. By combining the Bank’s global knowledge with country investments, this model generates more firepower for transformational solutions to help countries grow sustainably.
Please visit us at www.worldbank.org/water or follow us on Twitter at @WorldBankWater.
About GWSPThis publication received the support of the Global Water Security & Sanitation Partnership (GWSP). GWSP is a multidonor trust fund administered by the World Bank’s Water Global Practice and supported by Australia’s Department of Foreign Affairs and Trade; the Bill & Melinda Gates Foundation; The Netherlands’ Ministry of Foreign Trade and Development Cooperation; Norway’s Ministry of Foreign Affairs; the Rockefeller Foundation; the Swedish International Development Cooperation Agency; Switzerland’s State Secretariat for Economic Affairs; the Swiss Agency for Development and Cooperation; Irish Aid; and the U.K. Department for International Development.
Please visit us at www.worldbank.org/gwsp or follow us on Twitter #gwsp.

The Role of Desalination in an Increasingly Water-Scarce WorldM A R C H 2 0 1 9

© 2019 International Bank for Reconstruction and Development / The World Bank
1818 H Street NW, Washington, DC 20433
Telephone: 202-473-1000; Internet: www.worldbank.org
This work is a product of the staff of The World Bank with external contributions. The findings,
interpretations, and conclusions expressed in this work do not necessarily reflect the views of
The World Bank, its Board of Executive Directors, or the governments they represent.
The World Bank does not guarantee the accuracy of the data included in this work. The boundaries,
colors, denominations, and other information shown on any map in this work do not imply any
judgment on the part of The World Bank concerning the legal status of any territory or the endorsement
or acceptance of such boundaries.
Rights and Permissions
The material in this work is subject to copyright. Because The World Bank encourages dissemination of
its knowledge, this work may be reproduced, in whole or in part, for noncommercial purposes as long
as full attribution to this work is given.
Please cite the work as follows: World Bank. 2019. “The Role of Desalination in an Increasingly Water-Scarce World.” World Bank, Washington, DC.
Any queries on rights and licenses, including subsidiary rights, should be addressed to World Bank
Publications, The World Bank Group, 1818 H Street NW, Washington, DC 20433, USA; fax: 202-522-2625;
e-mail: pubrights @ worldbank.org.
Cover design: Jean Franz, Franz and Company, Inc.
Cover photos (left to right): Nikolay Voutchkov, Jacob Vanderheyen, Green MPs.

iiiThe Role of Desalination in an Increasingly Water-Scarce World
Acknowledgments ixExecutive Summary xiAbbreviations xxxi
Chapter 1 Water Scarcity Is Increasing at an Alarming Rate 1The Challenge of Water Scarcity 1Responses to Scarcity 2Notes 4
Chapter 2 Desalination Has Increasingly Become a Viable Option to Close a
Water Supply-Demand Gap 5Desalination Explained 5Early History 6Desalination as a Water Supply Option 6Desalination as Risk Management 7Increasing Interest in Desalination 7Notes 10
Chapter 3 Desalination Methods and Their Characteristics 13Thermal Desalination 13Multistage Flash Distillation 13Multieffect Distillation Technology 13Multieffect Distillation with Thermal Vapor Compressor 14Membrane Desalination 14Hybrids 16Growth Patterns of the Commonly Used Desalination Technologies 16Notes 18
Chapter 4 Desalination Cost 19Costs of Multistage Flash Distillation Desalination Projects 19Costs of Multieffect Distillation Desalination Projects 21Costs of Seawater Reverse Osmosis Desalination Projects 22Costs of Hybrid Desalination Projects 25Notes 28
Chapter 5 Key Factors Affecting Cost of Desalinated Water 29Analysis of Cost Differences between Technologies 29Effect of Location on Costs 31Plant Size and Economies of Scale 32
Contents

iv The Role of Desalination in an Increasingly Water-Scarce World
Feedwater Quality 32Target Product Water Quality 35Environmental Impacts and the Effect of Regulation 37Energy Use in Desalination and First Steps toward Using Renewable Energy 40Other Factors Affecting Costs of Desalination 42Comparison of Costs and Other Factors Affecting Choice of Desalination Technologies 43Notes 48
Chapter 6 Likely Development of Technologies and Costs 49New Opportunities for Cost Savings in Desalination 49Background 49Future Advances for Existing Technologies 50Emerging Technological Advances with High-Cost Reduction Potential 51Nanostructured Membranes 51Carbon Nanotubes 53Forward Osmosis 53Membrane Distillation 53Dewvaporation 54Adsorption Desalination 54Electrochemical Desalination 54Capacitive Deionization 54Potential Impact of Technology Development on Costs 55Renewable Energy for Desalination 56Notes 59
Chapter 7 Desalination Project Financing and Delivery, and Implications on Cost 61Procurement Methods and Risk Allocation 61Financing Desalination Projects 66Putting Together Desalination Project Packages and Learning from Experience in the Middle East 68Notes 70
Chapter 8 Choosing Desalination 71Assessing Supply and Demand into the Long Term at the Basin Scale 71Determining the Area and Planning Horizon 72Developing Scenarios Based on Long-Term Development Choices and Trends 72Assessing the Water-Related Implications of Each Scenario 73Evaluating Scenarios Iteratively and Making Decisions 74Downscaling the Basin Analysis at the Local Level 77Assessing Whether the Physical, Economic, and Institutional Conditions Exist to Make Desalination
a Prima Facie Option 79Feasibility and Risk Screening for Desalination Options 80

vThe Role of Desalination in an Increasingly Water-Scarce World
Selecting the Most Appropriate Technology 80Assessing and Quantifying Risks and Their Mitigation 80Assessing the External and Internal Political Economy 80Evaluating the Policy and Institutional Framework for Project Choice, Financing, Delivery, and Operation 82Decisions 84Notes 86
Appendix A Breakdown of Costs of Desalination Projects in the Middle East and
North Africa Region 87
Appendix B Case Study: The Sorek Desalination Plant in Israel 89
Appendix C Case Study: Israel Claims Water Independence through Desalination 93
Bibliography 95
Boxes2.1. The Physical World Contains Natural Desalination Processes 53.1. Why Are Thermal Desalination Plants So Prevalent in the Middle East? 175.1. Biofouling 355.2. Environmental Compliance Can Make Desalination More Expensive 375.3. Environmental Conditions on the Perth Seawater Desalination Plant 405.4. High Labor Costs Can Add Significantly to Unit Costs 425.5. Desalination Plant Land Requirements 466.1. Potential Technology Improvements in Conventional Thermal Desalination Could Reduce
Costs by a Further 10 Percent to 15 Percent 506.2. Membrane Productivity Has Doubled in the Past 20 Years 516.3. Areas for Further Reduction of the Cost of Reverse Osmosis Desalination Technologies 526.4. Nanostructured Reverse Osmosis Membranes 526.5. Dewvaporation Is a Low-Temperature, Low-Cost Evaporation Technology 546.6. Capacitive Deionization 556.7. Australia’s Major Desalination Plants Generate More Wind Power than They Use 576.8. Improvements in Concentrated Solar Power Technology Are Increasing Efficiency 587.1. Risks Associated with the Development and Management of Desalination Infrastructure 627.2. Typical Build-Own-Operate-Transfer Contractual Structure 657.3. Project Financing Costs 677.4. Government Guarantees Helped Israel Achieve Record Low Bid Prices for Desalinated Water 698.1. China’s Sponge City Initiative 738.2. The Emerging Gap between Supply and Demand in Vietnam’s Red-Thai Binh Basin Can Be
Closed by a Combination of Demand Management Measures in Agriculture and in Municipal and Industrial Water Use 74

vi The Role of Desalination in an Increasingly Water-Scarce World
8.3. Singapore Plans for Water Autonomy through Desalination and Wastewater Reuse 788.4. Controversy over the Decision to Build the Kurnell Desalination Plant in Sydney 818.5. Desalinated Water Use in Israel Causing Alarming Iodine Deficiency in People 818.6. Benefits and Challenges of Public–Private Partnerships in Singapore 828.7. The Tribulations of the Tampa Bay Seawater Desalination Plant 83B.1. Technological Innovation at Sorek Increases Efficiency and Flexibility, which Reduces Costs 89B.2. Sorek Used Multiple Measures to Reduce Environmental Impacts of the Plant’s Operation 90B.3. Innovations in Project Financial Engineering Helped Keep the Costs of Sorek Down 91
FiguresES.1. Geographical Limitations Cities Face in Obtaining Water xiES.2. Global Cumulative Contracted and Online Desalination Capacity, 1965–2017 xiiiES.3. Global Cumulative Capacity of Seawater Desalination by Technology xivES.4. Costs of Water Produced by Seawater Reverse Osmosis Desalination Projects,
by Feedwater Source xviES.5. Trends in the Cost of Desalination of Multistage Flash Distillation and Seawater
Reverse Osmosis Plants xxiES.6. Levelized Cost of Energy Evolution in Major Concentrated Solar Power Countries xxiii1.1. Geographical Limitations Cities Face in Obtaining Water 1B2.1.1. Mangrove Leaf with Salt Crystals 52.1. Global Annual and Cumulative Contracted Desalination Capacity, 1970–2014 82.2. Global Installed Desalination Capacity, 2010–16 92.3. Unit Water Cost Trends by Seawater Reverse Osmosis and Multistage Flash Distillation Processes 103.1. General Process of a Multistage Flash Distillation Plant 143.2. Illustration of Multieffect Distillation Desalination Processes 153.3. Illustration of the Reverse Osmosis Desalination Process 163.4. Global Cumulative Capacity of Seawater Desalination by Technology, 1980–2014 174.1. Costs of Multistage Flash Distillation Desalination by Plant Size 204.2. Costs of Multieffect Distillation with Thermal Vapor Compression Projects (Capital, Operation and
Maintenance, and Cost of Water) 224.3. Costs of Water Produced by Seawater Reverse Osmosis Desalination Projects, by Region 244.4. Capital and Operation and Maintenance Costs of Hybrid Desalination Plants as a Function of
Freshwater Production Capacity 264.5. Cost Components of Typical Desalination Plants by Technology 275.1. Optimum Size of Individual Seawater Reverse Osmosis Plants Is between 100 Million Liters
per Day and 200 Million Liters per Day 335.2. Typical Discharge Components of a Seawater Reverse Osmosis Seawater Desalination Plant 395.3. Reduction in Multistage Flash Distillation Desalination Cost, 1955–2005 415.4. Reduction in Reverse Osmosis Power Consumption, 1970–2010 425.5. Summary of Desalination by Desalination Methods, User, and Cost Component 476.1. Trends in the Cost of Desalination by Multistage Flash Distillation and
Seawater Reverse Osmosis Plants 49

viiThe Role of Desalination in an Increasingly Water-Scarce World
6.2. Global Concentrated Solar Power Levelized Cost of Electricity Potential for Reduction by 2025 586.3. Levelized Cost of Energy Evolution in Major Concentrated Solar Power Countries 59B7.2.1. A typical BOOT project structure 65B8.2.1. Red-Thai Binh River Basin Cost Curve of Solutions to Reduce Water Stress in the Dry Season in 2030 75
TablesES.1. Summary of Worldwide Seawater Desalination Costs xvES.2. Typical Breakdown of Total Water Production Costs for Seawater Reverse Osmosis Plants xviiES.3. Salinity (Total Dissolved Solids) and Temperature of Various Seawater Sources xviiiES.4. Ratio of Costs with Source Waters from Different Seas xviiiES.5. Effect of Target Product Water Quality on Costs (Ratio) xixES.6. Energy Consumption of Seawater Desalination Methods xixES.7. Forecast of Desalination Costs for Medium- and Large-Size Seawater Reverse Osmosis Projects xxiii4.1. Database of Multistage Flash Distillation Desalination Plants 204.2. Database of Multieffect Distillation Desalination Plants 214.3. Database of Seawater Reverse Osmosis Desalination Plants by Source of Raw Water 234.4. Database of Hybrid Desalination Plants 265.1. Breakdown of Capital Costs by Technology 305.2. Breakdown of Recurrent Costs by Technology 305.3. Typical Breakdown of Total Water Production Costs for a Recent Efficient Seawater
Reverse Osmosis Project 315.4. Cost of Water Transport to Selected Cities 325.5. Salinity (Total Dissolved Solids) and Temperature of Various Seawater Sources 335.6. Ratio of Costs with Source Waters from Different Seas 345.7. Effect of Target Product Water Quality on Costs (Ratio) 365.8. Concentrate Disposal Method and Construction Cost 395.9. Concentrate Management Methods and Challenges 395.10. Energy Consumption of Seawater Desalination Methods 405.11. Summary of Worldwide Seawater Desalination Costs 435.12. Key Advantages and Disadvantages of Different Desalination Methods 46B5.5.1. Typical Land Requirement as a Function of Plant Size 466.1. Forecast of Desalination Costs for Medium- and Large-Size Seawater Reverse Osmosis Projects 566.2. Levelized Costs of Electricity of Concentrated Solar Power and Other Technologies 576.3. Total Annualized Cost of Desalinated Seawater Using Concentrated Solar Power 577.1. Procurement Methods and Risk Allocation 637.2. Summary of Key Financing Parameters for Desalination Projects in the Middle East 708.1. Comparison of Economic Evaluation of Externalities in the Extended Cost-Effectiveness and
Multicriteria Approaches 76B8.3.1. Share of Water Sources in Singapore’s Water Supply 2017 and Projection for 2060 79A.1. Breakdown of Capital Costs of Desalination Projects in the Middle East and North Africa Region 87A.2. Breakdown of Operation and Maintenance Costs of Desalination Projects in the Middle East and
North Africa Region 88


ixThe Role of Desalination in an Increasingly Water-Scarce World
This task was led by Bekele Debele (Program Leader for Sustainable Development and Infrastructure for China, Mongolia and Korea). This report was
prepared jointly by Bekele Debele and Christopher Ward (Fellow of the Institute of Arab and Islamic Studies, University of Exeter) drawing exhaustively on previous work on desalination commissioned by the World Bank and others. A background technical report on the costs of desalination for the Middle East and North Africa region was commissioned by the World Bank in 2017, from which this report benefited. That report was prepared by a core team that included Bekele Debele, Diego Juan Rodriguez (Senior Economist, World Bank), and Nikolay Voutchkov (President, Water Globe Consultants, LLC). The current report also builds on previous work by the World Bank, notably the 2012 report Renewable Energy Desalination: An Emerging Solution to Close the Water Gap in the Middle East and North Africa (World Bank 2012). Chapter 7 of the current report was prepared by Zael Sanz Uriarte and Bekele Debele.
The task team was supported by guidance and direc-tion from Jennifer Sara (Global Director for Water Global Practice), Guang Zhe Chen (Global Director for Transport and former Senior Director for Water Global Practice) and Steven Schonberger (Director for Water Global Practice), by technical guidance from Alexander
Bakalian (Global Lead for Water Supply and Sanitation, Water Global Practice), William Kingdom (former Global Lead for Water Supply and Sanitation), Greg Browder (Global Lead for Water Security, Water Global Practice), and Richard Damania (Senior Technical Advisor, Water Global Practice), by the peer reviewers (Zael Sanz Uriarte, Senior Water Specialist; Victoria Delmon, Senior Counsel; Khairy Al-Jamal, Senior Water Specialist; Chris Heymans, Senior Water Resources Specialist; and Caroline Van Den Berg, Lead Water Economist), and by many other colleagues within the World Bank. Technical reviews of the final report and expert advice were also received from Ben Furmage, Chief Operating and Finance Officer, Cooperative Research Centre for Water Sensitive Cities, Australia, and Nikolay Voutchkov. Clementine Marie Stip (Operations Officer, Water Global Practice) pro-vided coordination, team assistance, and logistical support throughout this work.
The team is grateful to all the previous authors and advisers and wishes to acknowledge their work. The strong support of all during the many iterations of this work confirm the value and interest of the idea that desalination has indeed become a viable option for the water supply of many client countries of the World Bank.
Acknowledgments


xiThe Role of Desalination in an Increasingly Water-Scarce World
Chapter I: Water Scarcity Is Increasing at an Alarming Rate, Requiring a Systemic Approach to Bridge the Supply-Demand Gaps
An Outlook of Worsening Scarcity
Well over half the world’s population experiences some form of water scarcity each year (Mekonnen and Hoekstra). Scarcity affects populous areas in which supply is constrained and demand from water-using economic activity is high (see figure ES.1). According to 2014 study (McDonald and others 2014),1 one in four major cities in the world, constituting a US$ 5 trillion economy, are already facing water stress. With increas-ing population, urbanization, and economic growth, water scarcity is projected to worsen. By 2030 the world could face a 40 percent shortfall in water supply if no changes are made in how water is managed (United Nations Environment Program [UNEP] 2015). Water resources are also dwindling under the impact of changing rainfall patterns, rising temperatures, and
overexploitation. Already one-third of the world’s aquifers are in distress (Richey and others 2015).
Conventional demand and supply side management options can help alleviate scarcity, but the pace of change is too slow. A great deal can be done to reduce scarcity by improving water productivity, particularly in agri-culture, which is where the cheapest solutions lie (such as more dollars per drop). Improving efficiency and managing demand in industry and municipal systems can also make a notable difference. These improvements are already well underway, and there is potential for much more. However, change is coming far too slowly. Continuing at the current pace of improvement in water productivity would close only a fifth of the emerging supply-demand gap by 2030. Even if current water-saving measures were complemented by new development to squeeze out more water on the supply side, including through reuse of treated wastewater and drainage water, only half of the supply-demand gap would be closed (2030 World Resources Group [WRG] 2009). More generally, both supply and demand management measures face a steep marginal cost curve and will come at an ever- increasing cost.
Responding to Scarcity with Integrated Water Planning
Luckily, there are technical and economic instruments to bring supply and demand into balance. What is needed, and what is now largely lacking in many coun-tries and regions of the world, is a systemic integrated economic approach to water management. The first step is to construct a set of future scenarios that repre-sent relevant choices facing the country or region by identifying where the different segments of the water supply-demand gap are (in agriculture, in industry, in large cities, or in the environment). In a second step, the options to close the different gaps can be identified and ranked by cost,2 and then assessed for feasibility and preinvestment studies.
Executive Summary
FIGURE ES.1. Geographical Limitations Cities Face in Obtaining Water
100
0.2
0.4
0.6
0.8
1.0
20 50 100
Potential distance (km)
Frac
tion
of c
ities
reac
hing
sour
ce
200 500
100 MLD 1,000 MLD 10,000 MLD
Source: McDonald and others 2014. Note: MLD = million liters per day.

xii The Role of Desalination in an Increasingly Water-Scarce World
This kind of integrated planning is needed before decisions are made on future sources of water, includ-ing whether there is a niche demand that can strategi-cally be filled by desalination.
The strategic role of desalination and the rationale for this study. As scarcity grows and with advances in desalination technology and reductions in production cost, policy makers around the world are rightly asking whether desalination should play a part in closing the gap between supply and demand in future years. Although most of the supply-demand gap solutions will still come from the traditional supply and demand side management options, the focus of this report is to expand on desalination as one of the viable options with strategic relevance.
Today more than 150 countries are already using desalina-tion in one form or another to meet particular segments of demand, supplying over 300 million people with potable water. Does this growth point to a future in which faster expansion of desalination is to be expected? Previous lit-erature on desalination leaves many questions of this kind unanswered. Studies tend to be highly technical and to contain widely varying assertions about performance and cost without providing detailed information on the local circumstances that are critical for decision making. In addition, technology and costs are changing very rap-idly; what was true 10 years ago may be out of date today. This report is an attempt to share the latest experiences on desalination from around the world in an objective way and to put desalination in context for policy makers who may be considering it as one of their options.
This report is prepared to help policy makers understand the pros and cons of desalination and to guide their choices. The focus is on answering pertinent questions that policy makers struggle with in terms of the right time to consider desalination as an alternative solution to close a water supply-demand gap; how to go about choosing the right desalination technology, size, financ-ing, and delivery options; and how to take into account institutional and environmental considerations.
Chapter 2: Desalination Has Increasingly Become a Viable Option to Close a Water Demand Gap
Desalination at a glance. Desalination removes salt from water, typically for municipal or industrial uses. It is produced either from brackish water (salt content of less than 10,000 milligrams per liter3), or from sea-water (salt content between 30,000 milligrams per liter and 50,000 milligrams per liter). Although desalina-tion of brackish water offers opportunities to produce lower cost water, it is unlikely to be a main new source of supply because the total volume is limited and in most arid regions of the world the resource is almost fully utilized.4 In contrast, the world’s oceans contain over 97percent of the planet’s water resources, provid-ing an essentially unlimited raw material for seawater desalination.
Desalination as a water supply option with rising feasibil-ity and use. With growing water scarcity and signifi-cantly reduced cost, interest in desalination has risen in recent decades, starting in a few rich but very water-short states, particularly in countries of the Gulf Cooperation Council (GCC), in which the availability of low-cost energy also facilitated adoption. Driven by rising demand and commercial innovation, the cost of desalination has decreased significantly over the years, and it is becoming an increasingly feasible option (see figure ES.2). In 2018, 18,426 desalination plants were reported to be in operation in over 150 countries, pro-ducing 87 million cubic meters of clean water each day and supplying over 300 million people.5 Almost half this capacity (44 percent) is in the still-growing Middle East market, but other regions are growing even faster, notably Asia (in particular China),6 the United States, and Latin America.
Desalination as risk management. Desalination is also a good tool of risk management. Its raw material (the ocean) is practically limitless. Desalination is thus drought proof, and it is a good way to deal with climate change risks.7 Desalination is also a good response to exogenous risks such as dependency. Singapore, for

xiiiThe Role of Desalination in an Increasingly Water-Scarce World
example, opted for large-scale desalination to reduce its dependence on increasingly expensive imported water. The stable, efficient supplies of urban and industrial water that desalination provides can help governments manage a range of economic, social, and political risks.
Desalination as a strategic option. Despite significant reduction in cost, desalination remains largely more expensive and needs to be used strategically to address a limited range of problems. However, today the instances of these problems are fast expanding. Desalination is proving appropriate for certain markets that require high quality and complete reliability of ser-vice and in which customers or governments can afford to pay the higher cost. For example, desalination can produce high-quality potable water that suits the needs of large cities in which there are high concentrations of people who demand a quality 24 hours per day, seven days per week water service and who are prepared to pay for that service. Desalination can also provide a reliable supply of large volumes of water to high-value industry, commerce, and tourism. In these uses, demand is going up with incomes, demographics, and urbanization; it is also in these uses that the value of water is typically the highest.
Desalination is of specific interest in certain locations in which the alternatives are high cost or the risk of supply failure is high. Desalination is, however, demanding in terms of location. Water has a very high ratio of bulk to value and is very expensive to lift or transport. This drives the location of a desalination plant: it should be near its raw material, the sea; it should be close to its market or point of use; and geographically it should not be too far below its market because pumping up elevation is very expensive. Hence, the typical location of a desalination plant is along a coastal city or coastal industrial zone, supply-ing a relatively well-off industrial, commercial, or domestic demand.
Fortunately, already over one-third of the world’s pop-ulation lives in urban centers bordering the ocean and in many arid parts of the world (such as the Middle East, Australia, Northern Africa, and Southern California) the population concentration along the coast exceeds 75 percent. Where the physical and socio-economic conditions are right, seawater desalination provides a strategic solution for the sustainable, long-term satisfaction of part of this growing water demand. When and how to tackle the challenges related to that strategic gap is the subject of this study, which will
FIGURE ES.2. Global Cumulative Contracted and Online Desalination Capacity, 1965–2017
Source: GWI DesalData 2017.
OnlineContracted
19650
20
40
60
80
100
Capa
city
(mill
ion
m3 /d
)120
1970 1975 1980 1985 1990 1995Year
2000 2005 2010 2015
Global cumulative contracted capacity (2017*):99.8 million m3/d
Global cumulative commissioned capacity (2017):92.5 million m3/d
*Values through June 2017

xiv The Role of Desalination in an Increasingly Water-Scarce World
highlight the main desalination methods available and their characteristics, key factors that dictate the cost of desalination, and how to choose desalination as a via-ble option to meet the water supply-demand gap.
Chapter 3: Desalination Methods and Their Characteristics
There are two main desalination methods, thermal and membrane, which can be combined as a hybrid. Thermal desalination is a process of boiling and evaporating salt water and condensing the resulting vapor. The two commonly used thermal processes are multistage flash distillation (MSF) and multiple effect distillation (MED). Both processes work in a way similar to the evaporation process: the saline water passes through a series of chambers, with each successive chamber operating at a progressively lower pressure. Membrane methods adapt the natural process of osmosis, and reverse osmosis (RO) is the most commonly used form. Because the seawater actually passes through the RO membranes they can easily get clogged. Seawater
reverse osmosis (SWRO) plants usually build in pre-treatment facilities not used in thermal systems to pre-treat the source seawater. Membrane technologies can also be used for treating wastewater.
Thermal processes use huge amounts of seawater; their recovery ratio is typically only 10 percent to 20 percent. The recovery ratio of SWRO is much higher at 30 percent to 50 percent. Desalinated water then undergoes post-treatment, such as pH adjustment and disinfection, to make it suitable for drinking.8 Hybrid desalination plants incorporate a combination of a thermal facility (either MSF or MED) and an SWRO system.
Growth Patterns of the Commonly Used Desalination Technologies
SWRO has overtaken thermal technology and now accounts for two-thirds of installed capacity world-wide. In 2014, SWRO technology represented about 63 percent of the global desalination capacity (see figure ES.3), followed by MSF (23 percent) and MED (8 percent). The remaining 6 percent of desalination capacity was largely from hybrid technologies (Bennett 2014).9 However, thermal is still a leading technology in the Middle East, especially in the GCC. In 2015, just over half (53 percent) of all desalination plants in the Middle East used thermal technology, whereas SWRO accounted for the balance (47 percent).
Chapter 4: Desalination Costs
Overall costs have been rapidly decreasing. Recent typi-cal costs of water production show considerable reduc-tions for both thermal technologies (MSF and MED), but particularly for SWRO, which is now registering costs as low as US$ 0.64 per cubic meter in favorable physical and business environments.10 For the pur-poses of this study, a database was built containing over 50 desalination projects from around the world constructed over the last two decades. Table ES.1, which draws on this database, shows the actual costs of desalination by technology and feedwater source for SWRO plants.
FIGURE ES.3. Global Cumulative Capacity of Seawater Desalination by Technology
Source: Li and Yeo 2011.
70
60
50
40
30
20
10
01980 1990 2000
Year
Mill
ion
m3 /d
2010
Reverse osmosisMulti-stage ashMulti-eect distillation

xvThe Role of Desalination in an Increasingly Water-Scarce World
Thermal Desalination
Until now, MSF has been the more competitive thermal technology for larger projects and MED for smaller ones, but MED is becoming more competitive at all scales. Table ES.1 shows total costs of water production (U.S. dollar per cubic meter) for thermal projects: MSF US$ 1.02 per cubic meter to US$ 1.74 per cubic meter, average US$ 1.44 per cubic meter and MED US$ 1.12 per cubic meter to US$ 1.50 per cubic meter, average US$ 1.39 per cubic meter. Costs of water produced by MSF technology are proportional to plant size, with the smaller plants producing water for US$1.50 per cubic meter to US$1.74 per cubic meter and the larger plants producing water for just over U$1 per cubic meter. This is the reason recent plants have been larger and costs of producing water have decreased. Typically delivered as combined water and power projects, the largest MSF plants have proved competitive with MED and, under specific conditions, with SWROs.
Smaller MED plants below 100 million liters per day (MLD) capacity produce water costing US$1.40 per cubic meter to US$1.50 per cubic meter, that is, more cheaply than MSF plants of comparable size. However, at larger production capacities, MED costs are US$1.12 per cubic meter to US$1.40 per cubic meter, which is
costlier than MSF. Hence, where a smaller thermal plant is indicated, MED is the technology of choice.
Despite the historical cost advantage enjoyed by MSF plants at larger capacities, the development of MED technology is producing higher efficiency gains and there are likely to be further economies of scale to be gleaned. This expected growth in economies of scale together with MED’s advantages over MSF, such as lower energy requirements and lower capital costs, is likely to lead to more widespread adoption of MED technology in the coming years when a thermal plant is the choice.
However, even when MED has the cost advantage, MSF technology is sometimes preferred because it is lower risk and more familiar to the market than MED and has been used on a larger scale over a longer period.
SWRO
In terms of average cost, SWRO records the lowest costs, but there are many site-specific factors that make com-parison difficult. Costs of water production from SWRO plants vary widely; globally they range between US$0.64 per cubic meter and US$2.86 per cubic meter, but the cost series contains several outliers caused by
TABLE ES.1. Summary of Worldwide Seawater Desalination Costs
Desalination methodCapital costs
(million US$/MLD)O&M costs (US$/m3)
Cost of water production (US$m3)
Range Average Range Average Range Average
MSF 1.7–3.1 2.1 0.22–0.30 0.26 1.02–1.74 1.44
MED-TVC 1.2–2.3 1.4 0.11–0.25 0.14 1.12–1.50 1.39
SWRO Mediterranean Sea 0.8–2.2 1.2 0.25–0.74 0.35 0.64–1.62 0.98
SWRO Arabian Gulf 1.2–1.8 1.5 0.36–1.01 0.64 0.96–1.92 1.35
SWRO Red Sea 1.2–2.3 1.5 0.41–0.96 0.51 1.14–1.70 1.38
SWRO Atlantic and Pacific oceans 1.3–7.6 4.1 0.17–0.41 0.21 0.88–2.86 1.82
Hybrid MSF/MED 1.5–2.2 1.8 0.14–0.25 0.23 0.95–1.37 1.15
SWRO 1.2–2.4 1.3 0.29–0.44 0.35 0.85–1.12 1.03
Note: Costs are at 2016 values. MED-TVC = multiple effect distillation with thermal vapor compression; MLD = million liters per day; MSF = multistage flash distillation; O&M = operation and maintenance; SWRO = seawater reverse osmosis.

xvi The Role of Desalination in an Increasingly Water-Scarce World
special delivery conditions, regulatory requirements, operation techniques (see the section “Key Factors Affecting Cost of Desalinated Water”). The most signif-icant series is for SWRO plants in the Mediterranean in which the technology is best established. Here, costs range between US$0.64 per cubic meter and US%1.62
per cubic meter with an average of US$0.98 per cubic meter, establishing SWRO as the lowest cost technol-ogy in that environment.11
As for thermal technologies, there are also significant economies of scale for SWRO. Figure ES.4 shows the pattern of economies of scale for SWRO. They are strongest at lower production capacities, but the sav-ings then taper off above 100 MLD. Optimum size of individual SWRO plants is thus between 100 MLD and 200 MLD, and new plants have been registering total production costs in the range of $0.50 per cubic meter to US$0.80 per cubic meter.
Newer SWRO plants generally produce water at much lower costs. Advances in technology have contributed to significantly lower costs for newer projects, with two very large plants in the Mediterranean producing water at around US$ 0.60 per cubic meter.12 Several plants that have come into operation since 2015 that have higher costs (>US$1) are either small plants or are located in areas with higher salinity and warmer waters.
Hybrids
Production costs of hybrid projects have often proved lower than the costs of single-technology production. In hybrid projects, typically two-thirds of the total vol-ume of desalinated water is produced by thermal desalination and one-third is produced by SWRO. The thermal portion of hybrid projects produces water between US$0.95 per cubic meter and US$1.37 per cubic meter, with an average of US$1.15 per cubic meter.
FIGURE ES.4. Costs of Water Produced by Seawater Reverse Osmosis Desalination Projects, by Feedwater Source
Note: The lowest water cost for SWRO relates to the Cangzhou New Bohai Development Zone, China. Among other factors, the favorable cost of electricity (0.65 RMB/KWh) and capital (at about 7 percent over 10 years) and higher lower debt-to-equity ratio (66:33) may have contributed to lower cost of desalinated water. MLD = million liters per day; RO = reverse osmosis; SWRO = seawater reverse osmosis.
3.0
2.5
2.0
1.5
Wat
er c
ost,
US$/
m3
1.0
0.5
00 200
SydneySWRO plant
400
Plant size, MLD
600 800
Pacific/Atlantic OceanGulf of Oman and Indian Ocean
RO Arabian GulfRO Mediterrannean SeaRO Red Sea

xviiThe Role of Desalination in an Increasingly Water-Scarce World
The SWRO portion of hybrid projects produces water between US$0.85 per cubic meter and US$1.12 per cubic meter, with an average of US$1.03 per cubic meter. Hybrid plants can be cost-competitive because of effi-cient energy use and economies of scale, particularly when there is access to periodic supplies of low-cost energy. The combined thermal—SWRO configuration offers more flexibility in operation, allowing turning on and off of the SWRO component as and when excess electricity is available.
Chapter 5: Key Factors Affecting Cost of Desalinated Water
The principal drivers of costs are the interrelated factors of technology choice, plant size, and location, as well as project delivery and environmental regulatory regimes. Project capital, operation and maintenance (O&M), and overall desalinated water production costs depend not only on the primary technology choice made (see the previous section) and on plant size but also on a number of other factors, most of which are specific to location, feedwater quality, target product water qual-ity, environmental impacts and regulations, and energy use.
All these factors together collectively define the risk-reward profile of a desalination project, which in turn drives investor interest and overall cost of desalination.
Analysis of Differences in Cost Structure between Technologies
Overall, thermal technologies, particularly MSF plants, are more capital-intensive than SWRO. Physical con-struction and equipment costs predominate in the capital costs of thermal plants, whereas the breakdown of SWRO capital costs shows a more design-intensive and somewhat riskier technology. However, even for SWRO, capital recovery costs can represent nearly half of the cost of production (see table ES.2), in which cap-ital recovery accounts for 44 percent of total cost. In contrast, recurrent costs for SWRO plants for each
unit of output are double those of MSF plants and three times those of MED plants.
The Effect of Location on Costs
Costs of water conveyance and distribution are import-ant, with cost advantages to projects near the coast and on low-lying land and adjacent to their market. This applies to all desalination projects, but particularly to thermal plants, whose huge volumes of intake water and brine effluent from thermal plants make siting them near the sea a near-imperative. Hybrid projects are cost-effective when colocated with a power plant that has intermittent spare capacity (diurnal or seasonal).
Feedwater Quality
The site-specific raw water quality can have a major impact on the overall cost of desalination because it affects the number and type of pretreatment steps required ahead of the desalination step and the
TABLE ES.2. Typical Breakdown of Total Water Production Costs for Seawater Reverse Osmosis Plants
Cost item US$/m3Percentage
of total
Ë Variable costs 0.30 42
Energy 0.22 30
Chemicals 0.02 3
Replacement of RO membranes and cartridge filters
0.04 6
Waste stream disposal 0.02 3
Ë Fixed costs 0.42 58
Capital recovery costs 0.32 44
Labor 0.02 3
Maintenance 0.03 4
Environmental and performance monitoring
0.01 1
Other O&M costs 0.04 6
Ë Total costs 0.72 100
Source: Voutchkov 2018. Note: Capital recovery cost is assumed at 25 years payment term at 5 percent interest rate. O&M = operation and maintenance; RO = reverse osmosis.

xviii The Role of Desalination in an Increasingly Water-Scarce World
overall sizing of the desalination plant. The total dis-solved solids (TDS) level of the source water directly affects the operational costs because higher operating pressures and temperatures must typically increase as raw water salinity increases. Higher raw water salinity may also reduce the feasible product water recovery ratio. Areas such as small bays, gulfs, or channels can have higher local salinity levels, higher total suspended solids, higher temperature varia-tions, and higher organic loadings and biological activity compared with water in the open ocean. All of these factors add design and construction com-plexity; therefore, they can significantly increase both capital expenditure (CAPEX) and operating expenditure (OPEX) costs.
Furthermore, feedwater temperature has a significant impact on RO system design feed pressure and mem-brane performance. The required SWRO feed pressure typically is reduced by 5 percent to 8 percent on a
linear scale for every 10°C source water temperature increment in a temperature range of 12°C to 40°C. Table ES.3 provides the range of salinity and tempera-ture of major seawater sources.
For thermal technologies, source water quality has less impact, except for scaling. Thermal technologies are not sensitive to seawater quality or risks from biofouling, turbidity, organic content, or algal bloom. Thus, at higher levels of salinity, thermal technologies can compete with RO on energy use. However, thermal plants suffer from scaling, which requires costly treatment.
For SWRO-based technologies, source water quality affects costs, performance, and durability. SWRO plants are sensitive to salinity and temperature (and their variations), boron content, and membrane biofouling potential. Higher salinity and temperature and higher biofouling substances drive up costs because of the complex plant configurations needed, including pre-treatment of feedwater and posttreatment of product water.
Typically, SWRO technology is lower cost when salin-ity and its seasonal variations are lower. For example, in the Mediterranean, the good feedwater quality has made SWRO the lowest cost technology. The more dif-ficult source water conditions of the Arabian Gulf can add as much as 16 percent to SWRO capital costs and 14 percent to O&M costs compared with the conditions of the Mediterranean (see table ES.4).
Thus, thermal technologies have a competitive edge in more saline and hotter waters, particularly when there is a high risk of biofouling; SWRO has a competitive edge in less saline, cleaner, cooler waters.
Target Product Water Quality
Thermal plants produce good quality water, but improv-ing SWRO water quality entails extra costs.
Thermal technologies produce water with low salt, boron, and bromide levels. SWRO product quality is
TABLE ES.3. Salinity (Total Dissolved Solids) and Temperature of Various Seawater Sources
Seawater source TDS (ppt) Temperature (°C)
Red Sea 42–46 (avg. 44) 24–33 (avg. 28)
Arabian Gulf 40–44 (avg. 42) 22–35 (avg. 26)
Mediterranean 38–41 (avg. 40) 16–28 (avg. 24)
Caribbean Sea 34–38 (avg. 36) 16–35 (avg. 26)
Indian Ocean 33–37 (avg. 35) 25–30 (avg. 28)
Pacific and Atlantic oceans 33–36 (avg. 34) 9–26 (avg. 18)
Source: Voutchkov 2018. Note: Avg. = average; ppt = parts per thousand; TDS = total dissolved solids.
TABLE ES.4. Ratio of Costs with Source Waters from Different Seas
Source Unit construction costs Unit O&M costs
Mediterranean 1.00 1.00
Gulf of Oman 1.09 1.07
Red Sea 1.12 1.10
Arabian Gulf 1.16 1.14
Source: Voutchkov 2018. Note: O&M = operation and maintenance.

xixThe Role of Desalination in an Increasingly Water-Scarce World
typically poorer, especially for poorer feedwater quali-ties, and the design may need to be adapted, such as using a two-pass RO system. Higher product water quality requirements add significantly to costs, driving up the cost of water by as much as 50 percent (see table ES.5).
Environmental Impacts
Desalination has environmental impacts and mitigation can be costly. Impacts of desalination on the environ-ment, which are typically subject to regulation, include direct impacts from intake facilities and from brine effluent and the indirect impact of the typically large carbon footprint. The main environmental impact aris-ing at the intake is the effect on aquatic organisms. Monitoring and compliance involves costs, which tend to be higher in Europe and North America, in which costly mitigation measures may be required. For exam-ple, an “intake impact mitigation project” increased both capital and O&M costs of the Carlsbad SWRO plant by 5 percent.
Brine is a significant environmental hazard and careful reintroduction is needed to minimize harm.13 Disposal can cost about 3 percent of total production cost for SWRO, more for thermal technologies (MSF and MED), which produce a much greater volume of brine than RO, and a brine which is hotter but less concentrated. Brine from SWRO is more concentrated and requires more treatment, but the quantities are smaller.
Energy
Despite huge reductions in recent years, for all tech-nologies, but particularly for thermal plants, energy remains by far the largest single item of recurrent cost. Energy costs account for between two-thirds and three-quarters of all recurrent costs for thermal plants (see table ES.6). Energy costs are between one-third and nearly one-half of typical SWRO recurrent costs.
TABLE ES.5. Effect of Target Product Water Quality on Costs (Ratio)
Target product water qualíty
Construction costs
O&M costs
Cost of water
Single-Pass RO System
TDS = 500 mg/LChloride = 250 mg/LBoron = 1 mg/LBromide = 0.8 mg/L
1.00 1.00 1.00
Partial Second-Pass RO System
TDS = 250 mg/LChloride = 100 mg/LBoron = 0.75 mg/LBromide = 0.5 mg/L
1.15–1.25 1.05–1.10 1. 10–1.18
Full Two-Pass RO System
TDS = 100 mg/LChloride = 50 mg/LBoron = 0.5 mg/LBromide = 0.2 mg/L
1.27–1.38 1.18–1.25 1.23–1.32
Full Two-Pass RO System + IX
TDS = 30 mg/LChloride = 10 mg/LBoron = 0.3 mg/LBromide = 0.1 mg/L
1. 40–1.55 1.32–1.45 1.36–1.50
Source: Voutchkov 2018. Note: The four levels of quality correspond to four levels of treatment: (1) single-pass RO; (2) partial second-pass RO; (3) full two-pass RO; and (4) full two-pass RO + IX. O&M = operation and maintenance; RO = reverse osmosis; TDS = total dissolved solids; IX = ion exchange.
TABLE ES.6. Energy Consumption of Seawater Desalination Methods
Desalination method MSF MED MED-TVC SWRO
Electrical energy (kWh/m3) 3.4–4.5 1.5–2.5 1.2–1.8 3–7
Electrical equivalent of thermal energy (kWh/m3) 5.6–8.0 5–8.5 4.0–5.5 None
Total equivalent electrical energy (kWh/m3) 9.0–12.5 6.5–11 5.2–7.3 3–7
Sources: Younes Ghalavand and others 2015; World Bank 2017b. Note: MED = multiple effect distillation; MSF = multistage flash distillation; SWRO = seawater reverse osmosis; TVC = thermal vapor compression.

xx The Role of Desalination in an Increasingly Water-Scarce World
Thermal plants need mainly thermal energy, whereas SWRO uses more electricity. Apart from total energy costs, which are clearly always a much lower share for SWRO, the main difference in energy between technolo-gies is that most of the energy requirement for MSF and MED is thermal energy, with less than one-third of total energy use by this technology coming from electricity. In contrast, the entirety of SWRO’s energy requirement is from electricity, but much more electricity is required in total for SWRO than for thermal technologies.
Energy use has been declining, and there are first steps toward using renewable energy (RE). Technological innovation has reduced energy use for thermal plants and there are opportunities for future energy cost reductions in thermal processes, particularly through increased recovery of energy from the brine stream. For SWRO, continuous technological innovation since the 1970s in pretreatment, filter design, and energy recovery has reduced the energy consumption per unit of water by a factor of 10.
Putting in context. Although desalination does use con-siderable energy, it is not excessive compared with other energy uses in modern economies, and at some point it is less energy intensive than water transfer. The present limited use of RE for desalination is set to expand, offering new opportunities for clean and sus-tainable desalination options.
Comparison of Costs Affecting Choice of Desalination Technologies
In less saline environments, SWRO is the most competi-tive technology. SWRO costs decline significantly at lower salinity or for brackish water because less energy is required. Higher water recovery rates of 30 percent to 50 percent, compared with 10 percent to 20 percent for thermal technology, have significant implications for overall desalination cost because structures for SWRO are less bulky and pumping costs are less. Because SWRO operates at much lower temperatures than thermal technology, scaling is much less; there-fore, the quantity of antiscalant chemicals required is
considerably lower. In addition to lower production costs at lower salinity, SWRO is also more adaptable to local circumstances because it is scalable.
Some drawbacks of thermal technologies make them costlier than SWRO. Both MSF and MED require highly anticorrosive and costly materials such as titanium for the heat exchangers, whereas the RO membranes are made of cellulose acetate or other composite poly-mers, which are relatively less expensive. In addition, the large quantities of antiscalant chemicals needed for thermal plants increase costs. Most importantly, energy costs are also significantly higher for thermal technologies (see previous section) and because ther-mal processes consume both thermal and electric power, there are siting requirements that thermal plants must be colocated with thermal energy sources.
Thermal technologies also have some advantages. The cost of water production by thermal desalination (MSF and MED) is not sensitive to source water quality, unlike SWRO. This makes thermal technology compet-itive in more saline environments and where the water is warmer and biofouling potential higher, for exam-ple, in the Arabian Gulf and the Red Sea.
In addition, economies of scale increase consistently for thermal plants but taper off at higher capacities for SWRO plants.14 Although the combined energy require-ments of thermal technologies are greater, thermal processes, particularly MED, use much less electrical energy than SWRO. The balance of the energy require-ment of thermal processes comes from thermal sources, which can give them a cost advantage, for example, where waste or low-grade heat is available.
MSF is currently more competitive at larger scales, but MED performs well at smaller scales and its costs are reducing. MSF technology has a higher capital cost, but it is the more mature technology, is easier to operate, and it returns economies to scale; whereas MED tech-nology is more competitive at a smaller scale. MED also has a higher performance ratio and has the poten-tial to reduce costs and would benefit from RE.

xxiThe Role of Desalination in an Increasingly Water-Scarce World
Hybrids may be the best option where source water quality is poor and options for cheap energy exist. For high salinity waters in which there is also high biofoul-ing potential, hybrid projects can be more competitive than either thermal technology or SWRO alone. In particular, they may be competitive when there are large diurnal or seasonal variations in power demand, leaving low-cost power periodically available for desalination.
Summary of Key Cost Criteria
Key criteria for choice include the following:
• RO desalination is the most cost-competitive tech-nology for less saline environments, but thermal technology is more competitive for higher salinity environments.
• MSF is the most expensive desalination technology in terms of CAPEX, but it is easier to operate and yields higher economy of scale benefits for mega-size projects than RO.
• MED-TVC technology is more competitive than MSF for small- and medium-size desalination projects.
• Source water conditions make a big difference to costs for SWRO, but not for thermal technology.
• Hybrid thermal/RO projects can be the most com-petitive when there is access to cheap energy and there is a large unmet demand for water.
• Regulatory regimes also affect costs.
• Energy use and GHG emissions can be factors, going forward under the Paris Climate Agreement and the 2030 Sustainable Development Agenda.
Chapter 6: Likely Development of Technologies and Costs
Desalination technology has improved, and costs con-tinue to fall dramatically. Between 1980 and 2005, the cost of production of desalinated water fell by more than half (see figure ES.5). Although desalination still remains costly compared with conventional water treatment technologies, further reductions in costs are likely to close the gap further in the next two decades. These advances are most likely to be in desalination technology, in pretreatment, in concentrate manage-ment, and in energy efficiency and sourcing.
FIGURE ES.5. Trends in the Cost of Desalination of Multistage Flash Distillation and Seawater Reverse Osmosis Plants
5.0
MSF SWRO
4.5
4.0
3.5
3.0
2.5
2.0
1.5
1.0
0.5
01980
UPC
(200
6 US
D)
1985 1990 1995
Year
2000 2005
Source: Wittholz and others 2008. Note: MSF = multistage flash distillation; SWRO = seawater reverse osmosis; UPC = unit produciton cost.

xxii The Role of Desalination in an Increasingly Water-Scarce World
Further large cost reductions are expected, particu-larly for SWRO, in which costs are expected to further decline by up to two-thirds over the next two decades because of technological improvements in membrane design and system integration.
Accelerated development of RE and better concentrate (brine) management capabilities are expected to strengthen the current trend of implementation of environmentally safe and sustainable desalination projects worldwide. This trend also will be helped by emerging technologies that have lower energy con-sumption and cheaper ways of mitigating environ-mental impacts of brine and associated wastes from desalination.
As emerging technologies evolve into well-developed and reliable full-scale desalination systems in the next two decades, desalination is expected to experience a leap in terms of affordability and environmental sustainability.
Advances in Conventional Desalination Technologies
Whereas only relatively limited further improvement in thermal technologies is expected, increasing efficiency in key cost components will continue to make SWRO more competitive. Principal among these cost- reducing factors has been the improvements in mem-brane productivity, which has doubled in the last 20 years. Improvements are continuing apace, as newly developed membrane elements provide flexibility and choice and allow trade-offs between productiv-ity and energy costs. It is these improvements in membrane efficiency rather than in energy recovery that are expected to strengthen the position of SWRO as the most cost-competitive technology in most situations.
Emerging Technological Advances with High Desalination Cost Reduction Potential
In addition to the technological advances already expected under commonly used desalination
technologies, a number of innovative new technolo-gies or adaptations are emerging that may offer potential for even higher productivity and lower costs:
• Nanostructured membranes have up to 20 percent higher productivity than conventional membranes, or they can operate at the same productivity but use up to 15 percent less energy.
• If carbon nanotubes with much higher productivity can be developed, then this could slash desalination costs to the level of conventional water treatment technologies within a decade.
• Forward osmosis (FO), currently used mainly for industrial wastewater treatment, is being devel-oped for potable water, with the potential to reduce energy use by up to one-third (Korenak et al., 2017).
• Membrane distillation (MD) could almost double the recovery ratio from seawater (from 45 percent to 50 percent to 80 percent).
• Dewvaporation, a low-temperature, low-cost evaporation technology at an early stage of devel-opment, could reduce the costs of thermal evapo-ration by up to one-quarter, particularly in hot, dry environments.
• Adsorption techniques can reduce scaling and corro-sion in thermal plants, although the technology is still costly.
• Electrochemical desalination could potentially reduce costs by up to 15 percent by more efficient energy use.
• Capacitive deionization (CDI) could bring cost reduc-tions of up to one-third if the many technology chal-lenges can be overcome to make it a mainstream solution.
• Biomimetic membranes with aquaporin structures, which are membranes modeled on those of living organisms, could offer the ultimate breakthrough in low-energy desalination. Intensive research is underway, but it is still in the early stages.

xxiiiThe Role of Desalination in an Increasingly Water-Scarce World
The potential impact of technology development is stun-ning and could cut SWRO costs by half or more in the foreseeable future. Current trends in the reduction of the cost of desalination, and the increasing costs of the alternatives, are likely to continue, and it is not unlikely that cost reductions of 20 percent within 5 years will be developed for SWRO and 60 percent in 20 years (see table ES.7).
Renewable Energy for Desalination
One area for future focus will be a shift away from fos-sil-based energy supply for desalination. Although some RE options such as hydro, geothermal, and nuclear are already mature technologies and can
supply utility-scale energy continuously, solar and wind would require additional supplementary energy or storage to ensure a continuous supply of energy for desalination. Given the importance to run utility-scale desalination plants at maximum capacity (that is, 24 hours per day, seven days per week), a large energy storage option is required for wind- and solar-based energy sources, making them uncompetitive for now. However, given potential advances in technology, market maturity, and ensuing reduction in cost, some RE options, such as concentrated solar power (CSP) and solar photovoltaic (PV) cells with storage, are expected to be cost-competitive within a decade (see figure ES.6, for example, for the evolution of the
TABLE ES.7. Forecast of Desalination Costs for Medium- and Large-Size Seawater Reverse Osmosis Projects
Parameters Year 2016 Within 5 years Within 20 years
Cost of water (US$/m3) 0.8–1.2 0.6–1.0 0.3–0.5
Construction cost (US$/MLD) 1.2–2.2 1.0–1.8 0.5–0.9
Electrical energy use (kWh/m3) 3.5–4.0 2.8–3.2 2.1–2.4
Membrane productivity (m3/membrane) 28–47 35–55 95–120
Sources: Voutchkov 2016; World Bank 2017a. Note: The figures are estimated for best-in-class desalination plants.
FIGURE ES.6. Levelized Cost of Energy Evolution in Major Concentrated Solar Power Countries
0.35
0.30
0.25
0.20
0.15
0.10
0.05
02006 2008 2010 2012
Year
2014 2016 2018
USD/
kWh
South AfricaSpain USA Morocco Chile China Middle East
Source: Abengoa 2018.

xxiv The Role of Desalination in an Increasingly Water-Scarce World
levelized cost of energy [LCOE] for recent CSP con-tracts). Some strategic support to promote RE-based desalination would make the shift away from fossil energy much quicker.
Chapter 7: Project Delivery and Financing and Their Impact on Costs
Nontechnical factors have a considerable influence on project costs. Nontechnical factors, such as the institu-tional and business environment, method of project delivery, financing, and so forth, greatly influence desalination costs. Factors in this category are usually estimated to influence the cost of desalination by a range of 10 percent to 20 percent of the baseline project costs.
Project Delivery Methods and Risk Allocation
Desalination projects are often mega-size and risk assessment, management, and mitigation are key part of planning. All business decisions require not only an assessment of costs and returns but also an evaluation of the risks attached to a project and measures for managing or eliminating risks together with contin-gency arrangements for mitigating possible impacts. Clearly, the risks associated with mega projects are considerable and risk assessment will be a key part of planning. A recent review of risks associated with desalination projects (Voutchkov 2018) lists the following risks related to design and construction: (1) permitting or licensing risks, (2) entitlement risks, (3) technology risks, (4) construction risks, (5) regula-tory risks, and (6) financial risks. The review also lists the following operational risks: (7) source water qual-ity risks, (8) power supply risks, (9) O&M risks, and (10) desalinated water demand risks.
Selecting the right procurement method is key for matching risk exposure to managerial capacity and ultimately achieving the best value for the money. The sponsor of an infrastructure project has four alterna-tive ways to deal with each of these risks: (1) decide to manage it (keep the risk), if the sponsor believes
there is the technical, managerial, or financial capac-ity required to handle it; (2) insure or hedge the risk, if and where the market offers such solutions; or (3) transfer it or share it with a third party. The condi-tions under which these risks are transferred or shared with a private partner are determined by the procurement instrument adopted to develop the concerned infrastructure. In turn, the selection of the procurement instrument should be made to allo-cate the different risks involved with the party that is best placed to manage them in a cost-effective way, which is not necessarily always the private sector.
Commonly used desalination project delivery meth-ods include: (1) the turnkey approach, also referred to as “engineering, procurement, and construction” (EPC), in which the private contractor is responsible for the design and the construction of the facility; (2) the “design-build-operate” method (DBO), in which the contractor is also responsible for the operation of the plant for a limited number of years, usually two to five; and (3) the “build-own-operate-transfer” method (BOOT), by which the private partner finances the desalination facility and operates it for a long period of time, usually 20 to 25 years, in exchange for tariff-based payments linked to plant capacity and actual water demand. The traditional infrastructure procurement approach, also known as “design-bid-build” (DBB), is rarely used for desalination projects.
Under DBB, the owner retains full control but also takes all the risks. With DBB, the owner is typically a public entity, such as a municipality or utility, which retains control over the plant ownership and is responsible for overall project implementation, as well as for the proj-ect financing and long-term plant O&M. The advan-tages for the owner are essentially control of a strategic asset and product. There also may be the expectation of cost savings by “cutting out the middleman,” although, as explained next, this usually has not been the case in practice. The DBB delivery method could be appropriate for small desalination plants.

xxvThe Role of Desalination in an Increasingly Water-Scarce World
Turnkey approaches are well suited for thermal desalina-tion projects sponsored by public agencies with strong technical capacity. The fact that the performance of thermal desalination facilities can be accurately assessed during the commissioning phase makes the EPC contractual approach suitable for projects spon-sored by clients with previous experience operating such plants.
For RO projects sponsored by agencies with limited pre-vious desalination experience, it is usually advisable to make the EPC contractor also responsible for O&M by adopting design-build-operate (DBO) contractual approaches. Unlike thermal desalination technologies, it is difficult to assess the long-term performance of RO desalination facilities during the commissioning phase because of the sensitivity of the membrane’s perfor-mance to feedwater quality variations and because some of the main O&M variable costs items, particu-larly projected membrane and cartridge filter replace-ment rates, can only be verified long after the plant is commissioned. The duration of the O&M period of the DBO contract is typically 2 to 5 years. Under DBO con-tracts, the contractor is paid a sum for the design-build (DB) of the plant and then an operating fee for the operating period.
BOOT procurement approaches are well suited for the development and management of desalination infra-structure. Because risks and responsibilities can be clearly ringfenced from those related to water distribu-tion activities, the performance of the asset (desali-nated water production capacity, quality, and pressure at the point of delivery) can be clearly measured and evaluated, and remunerations to the private developer can be easily linked to the demand for desalinated water using capacity-plus-volume tariff structures.
Typically, DBO-delivered desalination plants produce water at 5 percent to 10 percent lower costs than the same size desalination projects using identical tech-nology but delivered by DBB, and they also have higher reliability (Voutchkov 2012; World Bank 2017a).
BOOT usually yields the lowest total cost of drinking water production, typically at least 15 percent to 25 percent lower than those of DBB projects and 5 percent to 10 percent lower than DBO projects.
Financing Desalination Projects
Source of Financing—Debt, Equity, or a Blend—Is a Key Determinant of All-Up Costs
For new entrants to the desalination market, costs of financing can be high, even for developed countries like Australia. More mature desalination markets can typically offer lower returns and attract a higher pro-portion of low-cost debt or long-term pension fund financing on favorable terms. Some financing pack-ages reduce costs initially by as much as one-third only to put them back with higher rates at a later stage of the contract. As such, care is needed because the first year cost may have distorted perceptions of desali-nated water to be cheaper than it really is.15
Experience shows that the best financing packages can help to deliver the lowest desalination costs, even with-out innovative technology. Firms in some countries, for example, Singapore and China, have been able to develop financing packages to deliver some of the lowest cost desalination projects in the world while using fairly standard design practices and conven-tional desalination technologies. Strategic use of government guarantees or subsidies can also keep costs down.
Putting Together Desalination Project Packages and Learning from Experience in the Middle East
With long experience in desalination financing, Middle Eastern countries represent a relatively mature market that can provide lessons to newer entrants to desalination. Typically, in the region, DBB and DBO projects are loan- financed, whereas larger projects have mixed debt and equity financing with a typical debt-to-equity ratio in the range of 70:30 up to 90:10. Because of the relatively low risk in the region and the high internal rates of return (typically 10 percent to 17 percent), discount rates are low

xxvi The Role of Desalination in an Increasingly Water-Scarce World
(6 percent to 8 percent), and lengthy repayment periods of up to 20 years can be negotiated. Usually, debt and equity return rates are favorable because the regional desalination market is the most mature market in the world. The project financing and technology risks are well known and manageable and local currencies are stable and usually pegged to the U.S. dollar.
In higher salinity environments in the region and where seasonal algal bloom is a challenge, SWRO is perceived as riskier, and SWRO projects experience higher costs of capital than thermal technologies. In contrast, MSF and MED-TVC desalination projects in the Middle East have a lower cost of investment and return expectations.
Chapter 8: Choosing Desalination
A decision-making process in five steps is proposed (National Water Commission 2011)16: (1) assessing supply and demand into the long term at the basin or regional scale; (2) downscaling the basin or regional analysis to the local level; (3) assessing whether the physical, eco-nomic, and institutional conditions exist to make desali-nation a prima facie option; (4) feasibility and risk screening for desalination options; and (5) decisions.
Step One: Assessing Supply and Demand into the Long Term at the Basin Scale
1. Working at the basin scale17: Because water resources and uses within a basin are all interdependent, the analysis must start at the basin scale and be con-ducted in an integrated way.
2. Determining the area and planning horizon: The geo-graphical planning area would typically be a discrete basin. The planning horizon should be long term, covering several decades.
3. Developing scenarios based on long term develop-ment choices and trends: How many people and where and how will they live and work? What kind of settlements will people live in? What kind of
economic activity? Answers to these questions will allow scenarios to be developed.
4. Assessing the water-related implications of each scenario: For each scenario, the supply-demand balance and gap can be calculated, taking into account the resource, constraints, risks, and the institutional context and capacity.
5. Evaluating scenarios iteratively and taking decisions: For each scenario, the options for closing the supply-demand gap can be assessed and each sce-nario can then be analyzed for implementability and put into the policy context. For each scenario, the costs, benefits, risks, and feasibility can be assessed and the trade-offs analyzed. Policy makers can then proceed to a decision and to action.
Step Two: Downscaling the Basin Analysis to the Local Level
Although options for balancing supply and demand start at the basin level (step one), these options can only be a general guide to solutions at the local level. Local needs and specifics require a much more precise local analysis within the overall basin planning frame-work. The following steps will help planners at this local scale identify the gap to be filled and the options for filling it:
1. Select and specify the demand being evaluated, for example, the water supply demand of an urban agglomeration, or of a water-using industrial complex.
2. Assess water supply and demand over the long term for the specific need identified (the city, the industry) and identify the size, location, and timing of the gap for this specific need.
3. Identify options for demand management and sup-ply augmentation to close the water demand gap for the need identified.
4. Identify the range of options for the next invest-ments to fill the demand gap over the 30-year period,

xxviiThe Role of Desalination in an Increasingly Water-Scarce World
identifying both demand management and supply management options and adopting an integrated cross-sectoral approach.
5. Cost each option at the marginal cost of water sup-ply (dollar per cubic meter).
6. Prepare a “cost” curve, ranking each option by cost and quantifying its contribution to closing the sup-ply-demand gap over time.18
7. Assess risks to security of supply, including both risks to existing source of supply and risks to each of the proposed options.
8. Rank alternatives with each option accompanied by its pros and cons.
9. Identify policy decisions and recommendations that would be required by each of the alternatives and assess their feasibility.
If step two identifies desalination as a possible source of supply to meet a water supply-demand gap for the specific market considered, the next step is to assess whether the physical, economic, and institu-tional conditions exist to make desalination a realis-tic option.
Step Three: Assessing Whether the Physical, Economic, and Institutional Conditions Exist to Make Desalination a Prima Facie Option
This step assesses whether the conditions are present under which desalination might be a viable option to meet a specific segment of a water demand gap.
Desalination is appropriate to meet only a certain type of demand.
Typically, desalination is an option when
• The demand gap is for a high-value market, particu-larly urban water supply and industrial uses;
• Water supply risks are high (political or climatic);
• The value of water is high and where there is high willingness to pay;
• Demand is concentrated, typically for major cities and industrial complexes; and
• The location is appropriate to desalination technology, typically near the raw material (usually the sea) and near the market or point of use and not too far below it in terms of elevation (the most common location is along a coastal city or industrial complex).
Utility-scale desalination projects are large and costly, and this creates a series of institutional requirements and opportunities.
Desalination projects tend to be large to very large: Is the municipality, utility, or country able to handle the development, financing, and management of a mega project?
This kind of project is more appropriate for private sector and international investment: Are the policies and frameworks in place to allow and encourage this?
The cost is high and urban water supply is typically run as a business: Is there consumer willingness and ability to pay?
Quality factors may also affect the choice.
The quality of the feedwater may affect costs and hence the choice of desalination over other sources, and the choice of technology if the desalination option is chosen.
Step Four: Feasibility and Risk Screening for Desalination Options
This step comprises a four-part methodology to estab-lish the feasibility of desalination options and to screen options for their respective risks: (1) selecting the most appropriate technology, (2) assessing and quantifying risks and their mitigation, (3) assessing the external and internal political economy, and (4) evaluating the policy and institutional framework. The following checklist provides a summary of the main factors to be taken into account.

xxviii The Role of Desalination in an Increasingly Water-Scarce World
Step Five: Decisions
After completing the first four steps, the government or municipality will be in a position to compare the desalination option(s) with the alternatives in terms of feasibility, cost and financing, risk, political economy, and institutional readiness and changes needed, and propose the technology and outline technical parame-ters of the project, together with the delivery method and financing. Given the economic, social, and envi-ronmental implications of adopting desalination, good practice would be to conduct extensive public consul-tations before and during the feasibility studies.
This study makes the case for desalination as a via-ble option to meet specific segments of a water
supply-demand gap. Ultimately the test is the eco-nomic viability and cost-competitiveness of desali-nation compared with other options. Desalination also requires a strong institutional capacity to imple-ment and operate mega projects and innovative technology; political, social, and environmental fea-sibility; and the ability to manage risks of financing.
As costs of desalination continue to fall and as the like-lihood of growing supply-demand gaps increases, desalination will certainly become more commonly used. The future may thus be seen in the success of desalination in countries that have widely adopted it, for example, Saudi Arabia and other countries in the Arabian Gulf, Singapore, or Israel.

xxixThe Role of Desalination in an Increasingly Water-Scarce World
Checklist: Feasibility and risk screening for desalination options
1. Select the most appropriate technology using an outline framework for choice of technology taking into account the following factors:
• RO desalination is the most cost-competitive technology for less saline environments
• Thermal is more competitive for higher salinity environments
• MSF is the most expensive desalination technology in terms of CAPEX, but it is easier to operate and yields higher economy of scale benefits for mega-size projects than RO
• MED-TVC technology is more competitive than MSF for small- and medium-size desalination projects
• Source water conditions make a big difference to both technology choice and costs
• Hybrid thermal/RO projects can be the most competitive where cheap energy is periodically available
2. Assess and quantify risks and their mitigation, including:
• Technical risks such as delays in construction, the risk of adopting (or not adopting) innovative technology, and management risks (Will it break down? Is it easy to manage?)
• O&M cost risk, for example, rise in energy prices
• Strategic risk such as pollution risk (sewage from Gaza at Ashdod): Can it be attacked militarily? Is the energy supply secure (Gaza)?
3. Assess the external and internal political economy, including
• The value of water autonomy/self-sufficiency, reduction of dependence (and related energy autonomy), for example, Singapore, Israel, and Gaza
• Generating a water surplus that can be used strategically (part of the Israel-Jordan peace deal)
• Intersectoral interests, for example, adoption of desalination for cities reduces the pressure on other sectors such as agriculture to release water
• Political and consumer acceptance of desalination and willing to pay (WTP)/affordability
4. Evaluate the policy and institutional framework for project choice, financing, delivery, and operation:
• Mega projects require institutional capacity in the public sector and the availability of trusted consultants:
– Economic/water resource planning skills
– Economic/desalination engineering expertise
– Project delivery and financing expertise
• The receiving utility needs to be able to deal with such a large a project:
– Institutional capacity to plan, deliver, and operate and to contract for and oversee project delivery and operation
– Financial soundness, with a full cost recovery tariff policy, established consumer willingness to pay, and overall financial viability of operations
– Technical soundness, with control over unaccounted for water and leakages
• The legal and regulatory framework for water supply needs to protect public and consumer interests
– The environment for public–private partnerships (PPP) and foreign direct investment (FDI) needs to be conducive, that is, be able to attract private participation while protecting the public interest
– Financial markets need to be mature and the options for project financing need to be least cost
– Identify the policy, regulatory, and institutional changes that would need to be made to accompany the desalination investment.

xxx The Role of Desalination in an Increasingly Water-Scarce World
Notes1. It is important to make a distinction between water scarcity simply
because of the hydrological scarcity and institutional scarcity, which also includes financial scarcity.
2. As much as possible, the costs include all economic costs including externalities such as environmental and social costs, and opportunity costs. Other methods of ranking also exist, such as the multicriteria approach (MCA), which uses cost-effectiveness as one among many criteria for ranking options.
3. Technically, all water with salinity content between 500 mg/L and 30,000 mg/L is considered brackish water.
4. Brackish water desalination can be a good local solution in areas where there is an adequate source of brackish water.
5. For more information about “The Current State of Desalination” from the International Desalination Association (IDA), see the website https://www .environmental-expert.com/news/the-current-state-of-desalination -152425.
6. The Government of China has set ambitious targets to boost desalina-tion capacity from a modest 1 million cubic meters in 2013 to over 3 million cubic meters a day by 2020.
7. Desalination plants, usually located close to the coast, are exposed to risks from a rise in sea level and should be protected. Desalination as an energy-intensive process also generates large greenhouse gas (GHG) emissions.
8. MED plants normally have a greater recovery ratio than MSF plants.
9. Desalinated water produced using SWRO methods usually require more posttreatment because of its lower quality.
10. See the special circumstances under which the Sorek desalination plant in Israel has been able to achieve such low costs.
11. Costs on the lower margin are not market representative given their special circumstances of project delivery and risk mitigation options (see appendix B).
12. These include the Sorek SWRO plant in Israel and the Magtaa SWRO plant in Algeria.
13. Environmental harm caused by desalination is localized.
14. At least historically, but the two lowest cost mega plants now in oper-ation are both SWRO: Magtaa in Algeria and Sorek in Israel.
15. This is the case in point for the Sorek SWRO plant in Israel, in which the initial quoted bidding water price was as low as US$0.48 per cubic meter, whereas the cost was adjusted to higher rates in later years of the plant’s operation.
16. This builds on a classic methodology developed under the integrated resource planning (IRP) framework. The IRP framework uses different tools to rank options, including cost-effectiveness and MCAs.
17. It is also important to look into regional water resources beyond a given basin because there are possibilities for cheaper and more via-ble inter-basin transfers.
18. Costs include economic costs, including externalities and opportunity costs. There are also other methods of ranking options, including the MCA that uses cost-effectiveness as one of the criteria for ranking and that also considers trade-offs and negotiations in decision making.

xxxiThe Role of Desalination in an Increasingly Water-Scarce World
°C degrees Celsius
BAT best available technology
BCM billion cubic meters
BOO build-operate-own
BOOT build-own-operate-transfer
BOT build-operate-transfer
BWRO brackish water reverse osmosis
CAPEX capital expenditure
CDI capacitive deionization
CEA cost-effectiveness approach
CEDI continuous electrodeionization
CPI consumer price index
CSP concentrated solar power
DAF dissolved air flotations
DB design-build
DBB design-bid-build
DBO design-build-operate
DBOO design- build-own-operate
DBOOT design-build-own-operate-transfer
ED electrodialysis
EDR electrodialysis reversal
EPC engineering, procurement, and construction
EU European Union
EURIBOR Euro interbank offer rate
FDI foreign direct investment
FO forward osmosis
GCC Gulf Cooperation Council
Abbreviations

xxxii The Role of Desalination in an Increasingly Water-Scarce World
GHG greenhouse gas
GWI Global Water Intelligence
IDA International Desalination Association
IRP integrated resource planning
IRR internal rate of return
IWA Israel Water Authority
IWPP independent water and power project
KSA Kingdom of Saudi Arabia
kWh kilowatt hours
LA loan agreement
LCOE levelized cost of energy
LIBOR London interbank offer rate
m3 cubic meter
MCA multicriteria approach
MD membrane distillation
MED multieffect distillation
MED-TVC multieffect distillation with thermal vapor compression
MENA Middle East and North Africa
mg/L milligram per liter
MLD million liters per day
MSF multistage flash distillation
NF nanofiltration
O&M operation and maintenance
O&M operation and maintenance
OPEX operating expenditure
PPA power purchase agreement
ppm parts per million
PPP public–private partnership

xxxiiiThe Role of Desalination in an Increasingly Water-Scarce World
ppt parts per thousand
PV photovoltaic
RE renewable energy
RO reverse osmosis
SDG6 Sustainable Development Goal #6
SI International System of Units.
SWRO seawater reverse osmosis
TDS total dissolved solids
TSE treated sewage effluent
TVC thermal vapor compression
U.S. EPA U.S. Environmental Protection Agency
UPC unit production costs
VC vapor compression
WHO World Health Organization
WPA water purchase agreement
WRG World Resources Group


1The Role of Desalination in an Increasingly Water-Scarce World
The Challenge of Water Scarcity
Well over half the world’s population already experience some form of water scarcity each year.1 A 2016 study that looked at water scarcity worldwide concluded that about 71 percent of the global population live under conditions of moderate to severe water scarcity, and about 66 percent (4.0 billion people) live under severe water scarcity for at least one month of the year. Of these four billion people, the study found that about one billion live in India and another 0.9 billion in China (Mekonnen and Hoekstra).2
At city level,3 McDonald and others (2014) concluded that one in four major cities in the world, constituting some US$5 trillion economy, is already facing water stress (McDonald and others 2014). Figure 1.1 depicts the average distance cities travel to access water,4 showing most cities must travel long distances to access an adequate water supply. Populations of large cities that require more water (for example, 10,000 MLD) must travel as far as 500 km to satisfy their water supply needs. For most large cities in the developing world, the financial means to source water from such a distance is untenable.
The study also found that although large cities occupy only 1 percent of the Earth’s land surface, their source watersheds cover 41 percent of that surface thus, the raw water quality of large cities depends on the land use in this much larger area. Such interdependency between cities and their surrounding rural areas upstream and downstream in which the same water is also needed to support livelihoods, environmental needs, and so forth, makes ensuring sustainable water security for cities a more challenging task. Strategic management of the cities’ water sources is therefore very important for the future of the global economy.
Water use has grown rapidly and stresses on the resource are widespread. In some areas, withdrawals actually exceed the exploitable water, damaging the resource. There is widespread “mining” of nonrenewable groundwater and consequent decline of aquifer levels and salinization of the remaining resource. Already one-third of the world’s aquifers are in distress (Richey and others 2015). Abstractions from many rivers encroach on the minimum flow needed to conserve the riverine environment, and some major rivers no longer reach the sea. The pollution of water courses has impaired the quality and made them no longer usable. Rivers flowing past many major cities have become “dead rivers.”
Scarcity is growing under pressure from both demand and from the supply side, exacerbated by climate change. On the demand side, demographic pressures and rising levels of per capita and industrial use put pressure
Chapter 1Water Scarcity Is Increasing at an Alarming Rate
Source: McDonald and others 2014.Note: MLD = million liters per day.
100
0.2
0.4
0.6
0.8
1.0
20 50 100
Potential distance (km)
Frac
tion
of c
ities
reac
hing
sour
ce
200 500
100 MLD 1,000 MLD 10,000 MLD
FIGURE 1.1. Geographical Limitations Cities Face in Obtaining Water

2 The Role of Desalination in an Increasingly Water-Scarce World
on scarcity. On the supply side, pressures are also growing, with lower availability as precipitation pat-terns change and as warming both increases evapora-tion and boosts demand still further (Veldkamp and others 2016). Scarcity particularly affects populous areas in which supply is constrained and demand from water-using economic activity is high. It is estimated that under an average economic growth scenario and if no efficiency gains are assumed, global freshwater requirements by 2030 could increase by over 40 percent above the current level (UNEP 2015).
Responses to Scarcity
There are options, both traditional and nonconventional, to bridge the water supply-demand gap.5 The 2030 Agenda for Sustainable Development (specifically, the Sustainable Development Goal #6 [SDG6]) recognizes that water scarcity is a binding constraint on the socio-economic development of many countries. These goals cover all aspects of managing water for equitable access, sustainability, and environmental protection. They specifically address scarcity through increased efficiency and technology (including use of desalina-tion) and through protection of the quality and quan-tity of the resource.
Despite the alarming prospects, there are solutions that are possible and not prohibitively expensive. The easiest solution is to incentivize and enable efficiency improve-ments in both agriculture and industry, concentrating on those improvements that cost the least while main-taining economic value. In most countries, the cheapest solutions are in agriculture in which many ways of increasing dollar per drop are known. More solutions are being developed through a mix of improved effi-ciency of water service and application, and net water gains through increased water productivity all along the value chain. Efficiencies in industrial and municipal systems can also make a huge difference, particularly in fast-urbanizing and industrializing economies, in which soaring industrial and urban demand for water is a major component of the emerging supply-demand gap.
Much can be achieved through these existing supply and demand management options, but implementation is proceeding too slowly to close the ever-widening gap
Despite ongoing improvements in water productivity, at the current pace of change these would close only a fifth of the supply-demand gap. Many countries expe-riencing water scarcity have begun implementing measures to manage supply and demand, and in some cases, such as Israel, have had remarkable success (Siegel 2017). However, the rate of improvement glob-ally is relatively slow. The annual rate of efficiency improvement in agricultural water use worldwide has historically been approximately 1% percent, and the rate of improvement in industry about the same. If agriculture and industry were to sustain this rate until 2030, improvements in water efficiency would close only about 20 percent of the projected supply-demand gap.
Supply side options are limited and all options face rising costs. Opportunities for harnessing the remaining nat-ural waters that can be sustainably and economically developed are limited. It is estimated that supply side infrastructure responses will close only about 20 percent of the gap between supply and demand that is expected by 2030 (2030 WRG 2009). The supply side also faces risks from a changing climate. Declining and more uncertain precipitation and rising tempera-tures may further reduce the reliable resource. More generally, both supply and demand management mea-sures face a steep marginal cost curve and will come at ever-increasing cost.
Under business as usual, it is unlikely that the supply- demand gap can be closed, and scarcity and environmen-tal harm will worsen. If policies and investment continue on their present trajectory, water stress and scarcity will proliferate across the globe and unsus-tainable exploitation will worsen, drawing down and exhausting aquifers and siphoning off the minimum environmental requirements of rivers and wetlands until they dry up.

3The Role of Desalination in an Increasingly Water-Scarce World
In some areas, nonconventional options such as reuse of wastewater and drainage water, and desalination, will be a must
As stresses rise, new technologies will increasingly add to the renewable resource. Worldwide, only about 60 percent of the fresh water withdrawn is actually consumed, and 40 percent is returned to the system as wastewater or drainage flow. In water-short environ-ments, this represents an opportunity to increase water availability, particularly from treated municipal waste-water and agricultural drainage water. Environmental imperatives will increasingly drive a massive expan-sion of wastewater collection and treatment, and rising water scarcity and costs will make wastewater reuse increasingly an economic option; it already is in very water-short countries such as Singapore. Drainage water reuse in agriculture will likewise become more common, especially on major rivers. In Egypt, drainage water reuse already accounts for 10 percent of the total water supply (Ward and Ruckstuhl 2017).
For specific markets and locations, desalination will be the technology of choice. With rapidly advancing desalination technologies and market maturation, desalination costs are rapidly falling, and the environ-mental impacts of desalination are progressively mitigated. Although desalination is likely to remain more expensive in most locations than tradi-tional water supply options, it will become increas-ingly an option to meet certain needs for specific markets. As such, desalination needs to be used strate-gically within an integrated water planning approach.
Integrated Water Planning
Integrated water planning linked to economic and spatial planning is essential to address the water demand gap, and these planning processes will highlight the role of desalination in closing the gap.
Integrated water planning is necessary to address this water supply-demand gap. The lesson from the alarm-ing prospect of an ever-growing supply-demand gap
and of inadequate responses under business as usual is that water is a key part of a country’s planning. On one hand, planning within the water-using sectors must be integrated within overall planning, and the range of efficiency and supply-enhancement measures required have to be invested in, thought through, and incentivized.
On the other hand, economic and spatial planning needs to take into account water costs, water quantities, and water quality. Expansion of settlements and economic growth in energy, agriculture, and manufacturing has real implications for the water budgets of river basins and countries. Technical options of a new supply or better efficiency need to be planned. In addition, options to move to a less water-intensive economy or to water-sensitive planning for urban development need to be considered.
Future water scenarios can be developed that highlight the relevant choices (including desalination) facing the particular country. Using an iterative process, govern-ments and other key stakeholders can create water scenarios from which to chart pathways of develop-ment that balance water supply and demand. These scenarios might include, for example, the water demand implications of rapid agricultural develop-ment, or the consequences of the risk of reduced water availability resulting from climate change. The water supply-demand gap under each scenario can be calculated. The options to close the gap can then be identified and ranked by cost.6 At this stage the scope for nonconventional options such as wastewater reuse and desalination will be evaluated.
Planning processes and how desalination fits into them are described in detail at the end of this report. This kind of integrated planning is needed before decisions are taken on future sources of water, including decisions on desalination. Chapter 8 describes in more detail the planning processes that may identify desalination as a leading option for closing specific parts of the supply-demand gap.
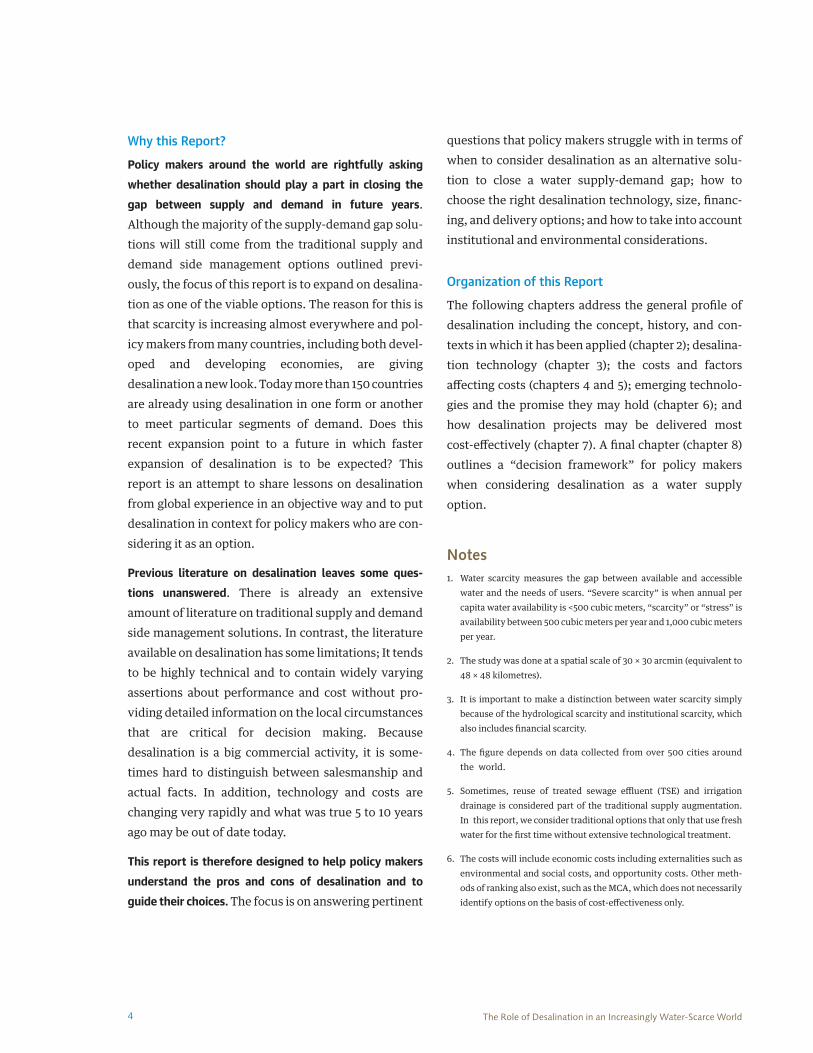
4 The Role of Desalination in an Increasingly Water-Scarce World
Why this Report?
Policy makers around the world are rightfully asking whether desalination should play a part in closing the gap between supply and demand in future years. Although the majority of the supply-demand gap solu-tions will still come from the traditional supply and demand side management options outlined previ-ously, the focus of this report is to expand on desalina-tion as one of the viable options. The reason for this is that scarcity is increasing almost everywhere and pol-icy makers from many countries, including both devel-oped and developing economies, are giving desalination a new look. Today more than 150 countries are already using desalination in one form or another to meet particular segments of demand. Does this recent expansion point to a future in which faster expansion of desalination is to be expected? This report is an attempt to share lessons on desalination from global experience in an objective way and to put desalination in context for policy makers who are con-sidering it as an option.
Previous literature on desalination leaves some ques-tions unanswered. There is already an extensive amount of literature on traditional supply and demand side management solutions. In contrast, the literature available on desalination has some limitations; It tends to be highly technical and to contain widely varying assertions about performance and cost without pro-viding detailed information on the local circumstances that are critical for decision making. Because desalination is a big commercial activity, it is some-times hard to distinguish between salesmanship and actual facts. In addition, technology and costs are changing very rapidly and what was true 5 to 10 years ago may be out of date today.
This report is therefore designed to help policy makers understand the pros and cons of desalination and to guide their choices. The focus is on answering pertinent
questions that policy makers struggle with in terms of when to consider desalination as an alternative solu-tion to close a water supply-demand gap; how to choose the right desalination technology, size, financ-ing, and delivery options; and how to take into account institutional and environmental considerations.
Organization of this Report
The following chapters address the general profile of desalination including the concept, history, and con-texts in which it has been applied (chapter 2); desalina-tion technology (chapter 3); the costs and factors affecting costs (chapters 4 and 5); emerging technolo-gies and the promise they may hold (chapter 6); and how desalination projects may be delivered most cost-effectively (chapter 7). A final chapter (chapter 8) outlines a “decision framework” for policy makers when considering desalination as a water supply option.
Notes1. Water scarcity measures the gap between available and accessible
water and the needs of users. “Severe scarcity” is when annual per capita water availability is <500 cubic meters, “scarcity” or “stress” is availability between 500 cubic meters per year and 1,000 cubic meters per year.
2. The study was done at a spatial scale of 30 × 30 arcmin (equivalent to 48 × 48 kilometres).
3. It is important to make a distinction between water scarcity simply because of the hydrological scarcity and institutional scarcity, which also includes financial scarcity.
4. The figure depends on data collected from over 500 cities around the world.
5. Sometimes, reuse of treated sewage effluent (TSE) and irrigation drainage is considered part of the traditional supply augmentation. In this report, we consider traditional options that only that use fresh water for the first time without extensive technological treatment.
6. The costs will include economic costs including externalities such as environmental and social costs, and opportunity costs. Other meth-ods of ranking also exist, such as the MCA, which does not necessarily identify options on the basis of cost-effectiveness only.

5The Role of Desalination in an Increasingly Water-Scarce World
Desalination Explained
Desalination produces fresh water from saline water sources for municipal or industrial uses. Desalination (also called “desalinization”) is the process of removing dissolved salts, producing fresh water from seawater or brackish water. The natural world contains many exam-ples of desalination (see box 2.1). In the human world, desalination technologies can be used for a number of applications. The most prevalent uses are to produce non-salty, usually potable, water from saline water for domestic or municipal purposes or for industrial use.
Brackish water sources have largely local potential, but the main raw material, seawater, is essentially limitless.
Desalinated water is produced either from brackish water (water with salt content of less than 10,000 milligrams per litre),1 or from seawater (which typically has a salinity in the range of 30,000 milli-grams per litre to 44,000 milligrams per litre). Desalination of brackish water offers opportunities to produce lower cost water than seawater desalination. Although brackish water sources may be locally important, potential is limited by available quanti-ties; the total volume of brackish water worldwide is less than 1 percent of the world’s water. In contrast, the world’s oceans contain over 97 percent of the planet’s water resources and thus provide an essen-tially unlimited raw material.
Chapter 2Desalination Has Increasingly Become a Viable Option to Close a Water Supply-Demand Gap
BOX 2.1. The Physical World Contains Natural Desalination Processes
Evaporation of water over the oceans and inland water bodies in the water cycle is the most obvious natural desalination process. Another process is the formation of sea ice, which produces ice with little salt, which is much lower than that in seawater.
Desalination occurs in the plant world (Figure B2.1.1). Mangrove trees grow in seawater, secreting the salt in their roots and leaves. Willow trees and reeds absorb salt and other contaminants, effectively desalinating the water. This natural desalination process is used in artificially constructed wetlands for treating sewage.
The animal world can also desalinate. Seabirds such as pelicans, petrels, albatrosses, gulls, and terns distill seawater using a gland that secretes highly concentrated brine near the nostrils above the beak. The bird then “sneezes” the brine out. This allows birds to drink salty water from the ocean while they are far from land.
Source: Wikipedia 2018.
FIGURE B2.1.1. Mangrove Leaf with Salt Crystals

6 The Role of Desalination in an Increasingly Water-Scarce World
Early History
Desalination has been known for millennia as both a concept and later as a practice, although in a limited form. Aristotle observed in the “Meteorologica” that “salt water, when it turns into vapor, becomes sweet and the vapor does not form salt water again when it condenses.” He also records that a fine wax vessel held long enough in seawater would be found to contain potable water because the wax acted as a membrane to filter the salt (Ross 1931).
Before the Industrial Revolution, desalination was pri-marily of interest to oceangoing ships. Thomas Jefferson catalogued heat-based methods going back to the 1500s, and formulated practical advice that was publicized to all U.S. ships on the backs of sailing clear-ance permits.2
Modern research began after World War II. Significant research into improved desalination methods started in the United States after World War II. The Office of Saline Water was created in the Department of the Interior by the Saline Water Conversion Act of 1952. The Office was merged into the Office of Water Resources Research in 1974.3
Research also took place at state universities in California, followed by development of commercial membrane elements at the Dow Chemical Company and DuPont. Subsequently, commercial and academic research has proliferated around the world.4
Political interest also began in earnest from the 1940s. David Ben-Gurion, Israel’s first prime minister, talked constantly about the idea of turning seawater into fresh water (Siegel 2017).5 A few days before election in 1960 as John F. Kennedy’s Vice President, Lyndon B. Johnson wrote a lengthy article for the New York Times titled “If We Could Take the Salt Out of Water”(Johnson 1960). Later, as President, he pro-moted research and investment in desalination both at home and abroad.
Desalination as a Water Supply Option
Desalination is more costly than other water supply methods and needs to be used strategically. Desalination ranks consistently as the most expensive option or among the most expensive of water supply options. Desalinated water is a highly specific product that is a strategic solution to a limited range of problems, but the instances of these problems are fast expanding.
Desalination is appropriate for certain markets that require high quality and complete reliability of service and can afford to pay the higher cost. Desalination can produce a high-quality potable water that suits the needs of large cities in which there are high concentra-tions of people who demand a quality 24 hours per day, seven days per week water service and who can afford to pay for that service. Desalination can also provide a reliable supply of large volumes of water to industry, commerce, and tourism. In these uses, demand goes up with incomes, demographics, and urbanization. The value of water is typically the highest in these uses and where there is the highest willingness to pay.
Desalination is of specific interest in certain locations in which the alternatives are also high cost or where the risk of supply failure is high. As a high-cost option, desalina-tion is appropriate when other new sources of water are not available or are also of very high cost, for exam-ple, when there is no new fresh water locally available and new supplies must be brought over long distances and high elevations.6
Desalination is also appropriate when the risks of sup-ply interruptions are high, for example, a water-scarce environment in which existing storage and reserves are too limited, depleted, or contaminated, as is the case of groundwater reserves around many cities.
On the supply side too, desalination is also quite demand-ing in terms of location. Water has a very high ratio of bulk to value; it is a heavy but comparatively inexpen-sive commodity. Hence, transport costs are a major

7The Role of Desalination in an Increasingly Water-Scarce World
consideration, especially when pumping costs are involved. From this reality stem three factors that typ-ically drive location of a desalination plant. First, because desalinated water is typically produced from seawater, the most economical location for a desalina-tion plant is near its raw material source, the sea. Second, transport costs of the finished product dictate that a plant should be sited near its market or point of use because conveyance costs are high. Third, a plant should preferably be located close to its market because pumping up high elevations and long dis-tances is costly.
Hence, the typical location for a desalination project is in the vicinity of a coastal city or coastal industrial zone. The typical profile for a desalination project is near the coast, supplying a relatively well-off industrial, com-mercial, and domestic demand. As countries urban-ize and concentrate their population and economic activities in fewer places, demand for water increases. Already over one-third of the world’s population lives in urban centers bordering the ocean. In many arid parts of the world, such as the Middle East, Australia, Northern Africa, and Southern California, the population concentration along the coast exceeds 75 percent. Where the physical and socioeconomic conditions are right, seawater desalination provides a strategic solution for sustainable, long-term satisfac-tion of part of this growing water demand.
Desalination as Risk Management
Given its lack of vulnerability to changes in rainfall, air temperature, and drought, desalination is a good candi-date to deal with climate change risks. Current and anticipated climate variability and change impacts around the world are likely to threaten water security by reducing supply both from more limited and erratic rainfall and greater incidence of drought and from the greater rate of evaporation caused by rising tempera-tures. Excessively high temperatures will also drive up demand for water, particularly for agriculture,
increasing competition with rising demand for water from municipal and industrial users. The occurrence of prolonged periods of drought is also expected to increase worldwide. Desalination is immune to all these changes; hence, it is an excellent way to increase climate change resilience.
Desalination is also a good response to exogenous risks such as dependency. Desalination is a way of securing self-reliance and water supply independence for a city or territory, in which this is politically or economically important. Singapore, for example, opted for large-scale desalination to reduce its dependence on increas-ingly expensive imported water. Israel has invested in desalination to increase its water security not only because it is a water-scarce country but because of its vulnerable geopolitical environment.
Stable, efficient supplies of urban and industrial water are also typically a top economic, social, and political priority. Supply of water to households and to com-mercial and industrial users is a top economic priority because the service is to the high-value, dynamic sectors of the economy. Supply of water is also a top political priority because demand is highly “vocal” from engaged, articulate, influential consumers, including commerce and industry and constituencies, which count on the political scale.
In addition, with the growth of ever-larger cities, pro-viding quality water services is a massive organizational challenge’ water is far and away the bulkiest commodity brought into cities every day. The economic, social, and political costs of failure are huge, and large urban popu-lations are often potentially politically volatile. Desalination can be a sure, steady resource.
Increasing Interest in Desalination
With growing water scarcity, interest in desalination has risen in recent decades, starting in a few rich but very water-short states. Historically, producing potable

8 The Role of Desalination in an Increasingly Water-Scarce World
water from salt water has been slow, cumbersome, and expensive. However, in recent decades, fast-rising demand for potable water coincided with very high WTP.7 for good water services in a few very dry, well-off countries, particularly in the oil-exporting states of the Middle East and in other high-income but water-scarce states such as Singapore. These factors led to the wider take-up of desalination in many of these countries, particularly in the GCC countries, in which the availability of low-cost energy also facilitated adoption.8
Driven by rising demand and technological advances, the cost of desalination has been falling fast. As mar-ket demand grew, desalination costs fell signifi-cantly, particularly in the last two decades. The main driver of falling costs has been technological advances, but the trend toward larger plants has brought very significant economies of scale. Project development choices, such as colocation of desali-nation plants with power plant generation, and enhanced competitiveness from more efficient methods of project financing and delivery have also played a significant role in reducing the cost of desalination. As a result, desalination costs have
tumbled from a typical range of US$2.50 per cubic meter to US44.00 per cubic meter in the 1980s to costs that now average less than US$1.50 per cubic meter in many locations and that have reportedly fallen as low as around US$0.50 per cubic meter to US$0.60 per cubic meter.9
As a result, desalination is becoming an increasingly affordable option for an increasing number of locations. According to the IDA, there are over 150 countries that use desalination to produce fresh water. In 2018, 18,426 desalination plants were reported to be in oper-ation worldwide, producing 86.5 million cubic meters of clean water each day, which is equivalent to 32 billion cubic meters (BCM) annually and supplying over 300 million people.10 Desalinated water currently accounts for only 1 percent of the world’s drinking water (Voutchkov 2016). However, with the rapidly falling cost of desalination coupled with increasing cost of traditional sources of fresh water and new, more stringent drinking water quality regulations, desalination is becoming more and more practical and economical. Figure 2.1 shows the sharp increase in annual additional desalination capacity, particularly in the last two decades.
FIGURE 2.1. Global Annual and Cumulative Contracted Desalination Capacity, 1970–2014
01970 1980 1990 2000 2010
123456789
10
0102030405060708090100
Addi
tiona
l (m
illio
n m
3 /d)
Cum
ulat
ive
(mill
ion
m3 /d
)
Year
CumulativeAdditional
Source: DesalData 2016.

9The Role of Desalination in an Increasingly Water-Scarce World
The viability of desalination as an additional option of sources of water supply is also growing faster. In recent decades, much of the production of desalinated water has been in the very dry countries of the Middle East, in which almost half (44 percent or 34.1 million m3 per day) of current global capacity is installed and which is still projected to grow at an average of 7 percent to 9 percent per year. Other regions are also expected to grow even faster, particularly Asia, the United States, and Latin America. A particularly fast-growing market is China, in which the government has set ambitious targets to boost desalination capacity from a modest about 1 million cubic meters in 2013 to over 3 million cubic meters per day by 2020 (see figure 2.2).
Nonetheless costs are still usually higher than alterna-tives, so desalination typically remains a strategic option. Although the costs of desalination have fallen fast (see figure 2.3), they are almost always higher than the costs of obtaining fresh water from rivers or ground-water, water recycling, and water conservation when
these options are viable (Caldera and Breyer 2017).11 Only when these alternatives cannot meet demand is desalination likely to be the choice, and then it may be a choice between desalination and long-distance water transport or inter-basin transfer, which are also typi-cally high cost. Figure 2.3 depicts the sharp decline in cost of desalination over a period of 50 years since the 1960s, making desalination a viable option to bridge the water supply-demand gap of certain strategic uses.12
Institutional and Economic Considerations
Utility-scale desalination projects are typically large and costly, and this creates a series of institutional and economic requirements and opportunities.13 Desalination projects tend to be large to very large because there are significant economies of scale, and in any case a large plant is usually needed to meet demand. The implica-tions are that the commissioning municipality or country has to be able to handle the development, financing, and management of a mega project.
FIGURE 2.2. Global Installed Desalination Capacity, 2010–16
0
Capa
city
(106 m
3 /d)
2010 2011 2012 2013 2014 2015 2016
Year
40
20
60
80
120
100
140
KSAUAEUSA
ChinaIsrael
KuwaitAustralia
IndiaSpain
AlgeriaROW
Source: DesalData 2017. Note: KSA = Kingdom of Saudi Arabia; UAE = United Arab Emirates; ROW = rest of the world; USA = United States of America.

10 The Role of Desalination in an Increasingly Water-Scarce World
FIGURE 2.3. Unit Water Cost Trends by Seawater Reverse Osmosis and Multistage Flash Distillation Processes
12
11
9
8
7
6
5
4
3
2
1
01950
Year
Cost
$ /
m3
1960 1970MSF
2020
10
1980 1990 2000 2010
Year
3.03.5
2.52.01.51.00.50
SWRO
Cos
t s/m
3
1970 1980 1990 2000 2010
SWRO
Source: Ghaffour and others 2013.Note: MSF = multistage flash distillation; SWRO = seawater reverse osmosis.
Because this kind of project is appropriate for private sector and international investment, desalination may be a good option when policies and frameworks are in place to allow and encourage this.
Can public utility handle desalinated water efficiently? What happens to the desalinated water after it is released to the water supply utility is also important; there is no point producing expensive water if there is an incomplete distribution network or if the desali-nated water is distributed through a leaky system in which a large volume of the water is lost. Similarly, the financial management of the utility is important. Expensive water has to be paid for and projects will fail if the utility is not able to recover its investment as well as operating costs via the water tariff. What happens to the water afterward is important too. Can the utility collect the large volumes of extra wastewater that are produced, and can it treat and reuse or dispose of the treated wastewater and the related sludge?
Is there the revenue base? Because the cost is high and urban water supply is typically run as a business, there has to be adequate demand for water, a distribution net-work, and consumer willingness and ability to pay, not only for water supply but also for wastewater collection, treatment, and disposal, and for the environmental costs associated with the whole supply chain.
Notes1. Technically, all water with a salinity content between 500 mg/L and
30,000 mg/L is considered brackish water.
2. For more information on “Desalination of Sea Water” by Thomas Jefferson see the website https://www.monticello.org/site/research -and-collections/desalination-sea-water and for more information on “Enclosure: Report on Desalination of Sea Water, 21 November 1791” by Thomas Jefferson see the website https://founders.archives.gov /documents/Jefferson/01-22-02-0296.
3. For more information on desalination, see Records of the Office of Saline Water at the website https://www.archives.gov/research/guide -fed-records/groups/380.html.
4. For more information on desalination see the website https://en.wikipedia.org/wiki/Desalination.

11The Role of Desalination in an Increasingly Water-Scarce World
5. Interview with Shimon Peres, April 25, 2013.
6. The high cost of desalination does drive up the cost of the final prod-uct, but not proportionately to the ratio of its cost to that of other bulk supplies because the share of raw water in the final product price at the tap is typically only about 25 percent.
7. High WTP is not necessarily referring to citizen’s WTP; this also includes the government’s WTP for more water for their citizens.
8. The GCC includes Bahrain, Kuwait, Oman, Qatar, Kingdom of Saudi Arabia (KSA), and the United Arab Emirates.
9. See chapter 5 for a discussion of the factors driving desalination costs and figure 6.1 for an illustration of how these costs have fallen rapidly over the last four decades.
10. For more information about “The Current State of Desalination” from the IDA, see the website https://www.environmental-expert.com /news/the-current-state-of-desalination-152425.
11. For example, Caldera and Breyer (2017) found that the cumulative global SWRO desalination capacity has doubled between 1977 and 2015 and its capital cost fallen by about 15 percent because of advances in technology.
12. Technological maturity, system integration, and market competition combined to cause the reduction of desalination costs in the last 20 years.
13. Although small-scale desalination plants are numerous in number, the focus in this study is mostly on utility-scale desalination plants.


13The Role of Desalination in an Increasingly Water-Scarce World
Chapter 3Desalination Methods and Their Characteristics
There are two main desalination methods: thermal and membrane water separation from salts. There is a multi-tude of desalination technologies under research and in some cases in development (discussed in chapter 6, but the only two that are currently commercially via-ble and commonly used are evaporation and mem-brane separation processes. Before 1998, most of the desalinated water worldwide was produced by ther-mal evaporation. However, in recent years, technolog-ical improvements in RO desalination, a membrane filtration method, have brought a rapid increase in the number of plants using membrane technology. Today, membrane processes account for two-thirds of desali-nation capacity worldwide, whereas thermal processes account for most of the balance.1
Thermal Desalination
Thermal desalination: boiling, evaporating, and condens-ing. Thermal distillation was the earliest method used to desalinate saline water on a commercial basis. The basic principle is to apply heat to create water vapor, which then condenses into pure water, separated from most salts and impurities. The commonly used ther-mal processes are MSF and MED.
Multistage Flash Distillation
MSF is the most robust of all desalination technologies and is capable of very large production capacities. The MSF process consists of a series of stages or chambers maintained at decreasing pressures from the first stage (hot) to the last stage (cold). In figure 3.1, seawater flows in on the right side through tubes in the upper part of the chambers where it is warmed by the water vapor produced in each stage. Its temperature increases from sea temperature to the temperature of the heater on the left as it travels in that direction. The seawater then flows through the heater (the squiggly
line through the cloud, which represents steam) in which it receives the necessary heat for the process.
At the outlet of the heater, the seawater enters the bot-tom of the left-most chamber. In this first stage, the seawater is overheated compared with the tempera-ture and pressure in the chamber. The seawater will immediately release heat (known as “flashing”), and thus vapor, to reach equilibrium with the conditions in that chamber. The vapor is then condensed into fresh water on the tubes at the top of the chamber. The pro-cess takes place again in the next stage and so on until the last and coldest stage (the chamber on the right end). The fresh water builds up and is extracted from the coldest stage (the blue-colored distillate flow). Seawater slightly concentrates from stage to stage and builds up the brine flow at the bottom, which is also extracted from the last stage. The number of stages used in the MSF process is directly related to how effi-ciently the system will use and reuse the heat that it is provided. Typically, 20 percent to 30 percent of the feed seawater is recovered as product water.
Multieffect Distillation Technology
MED works similarly to MSF as an evaporation process. The saline water passes through a series of chambers and each successive chamber operates at a progressively lower pressure. In the MED process, vapor formed in one chamber condenses in the next chamber with the heat released acting as a heating source. In addi-tion, feedwater is usually sprayed over the tube bun-dle at the top of each chamber (the dark blue track in figure 3.2). External steam (the yellow tube in figure 3.2) is introduced in the first chamber and the feedwater evaporates as it absorbs heat from the steam. The resulting vapor enters through the tube to the second chamber at a reduced pressure. The heat released in the second chamber by condensation of

14 The Role of Desalination in an Increasingly Water-Scarce World
the vapor from the first chamber again causes partial evaporation of the feedwater in the second chamber. The process is repeated in each subsequent chamber. In each chamber, the vapor condensing into fresh water inside the tube is then pumped out (the sky blue track in figure 3.2). The remaining brine passes from chamber to chamber (the green line in figure 3.2) until it is pumped out at the end of the process. Typically, 25 percent to-40 percent of the feed seawater is recov-ered as product water under MED.
Multieffect Distillation with Thermal Vapor Compressor
The efficiency of multieffect distillation (MED) can be raised with the addition of a vapor compressor. A TVC can be added to an MED installation to extract part of the steam generated in the final chamber for reuse. The extracted steam will be mixed with the external steam for compression under high pressure, which then acts as a heating source in the first chamber. Because this enhancement can result in significant
energy cost savings, MED-TVC is the most widely applied MED technology today.2
Membrane Desalination
Membrane methods adapt the natural process of osmosis. Membranes play an important role in the sep-aration of salts in natural processes (such as osmosis and dialysis), and this principle has been adapted for commercial use in desalination by designing mem-branes, which selectively allow or prevent the passage of salts. Commercially available membrane processes include reverse osmosis (RO), nanofiltration (NF), electrodialysis (ED), and electrodialysis reversal (EDR).3 NF and RO apply pressure, whereas ED and EDR apply electrical current for salt separation.
Reverse osmosis (RO) is a commonly used water purifi-cation technology that employs a semipermeable membrane to remove ions, molecules and larger parti-cles from drinking water. In RO, an applied pressure is used to overcome osmotic pressure that is driven by chemical potential differences of the solvent.
FIGURE 3.1. General Process of a Multistage Flash Distillation Plant
T = 112°C
Condensate return Distillate
Brine
Seawater
Air extractionHeating steam
Source: Najafi 2016.

15The Role of Desalination in an Increasingly Water-Scarce World
For seawater of salinity of 35,000 milligrams per liter on one side of the membrane (for example, Pacific Ocean or Atlantic Ocean water) and drinking water of salinity of 500 milligrams per liter on the other side of the membrane, the osmotic pressure created on the membrane is 24 bars (350 pounds per square inch).
RO can remove many types of dissolved and sus-pended chemical species as well as biological ones (principally bacteria) from water, and is used in both industrial processes and the production of potable water. The result is that the solute is retained on the pressurized side of the membrane and the pure solvent is allowed to pass to the other side. To be “selective”, this membrane should not allow large molecules or ions through the pores (holes), but should allow smaller components of the solution (such as solvent molecules, i.e., H2O) to pass freely.
How RO technology works. As shown in figure 3.3, the saline water (feedwater) is pumped under high pres-sure through a semipermeable membrane to separate brine (water with much higher salinity content than feedwater combined with other chemicals used for pretreatment) from product water (water that is with much lower salinity content than feedwater).
The RO process, as the name implies, is the opposite of what happens in osmosis. A pressure greater than the osmotic pressure is applied to saline water, which causes fresh water to flow through the membranes while holding back the solutes, or salts. A high- pressure pump forces saline water at 65 to 75 times the atmospheric pressure against semipermeable membranes. The membranes are designed to allow water molecules to pass through them while retaining dissolved salts contained in the source water. The RO
Brine Fresh water
Feed water
Condenser
Vent
Extracted vapourFeed waterFeed waterFeed water
Steam
Steam
Condensate
Nth eect2nd eect1st eect
Thermo-compressor
Vapour
VapourVapour Condenser
Sources: Australian Department of the Environment 2002; Veolia Water Technologies 2006.
FIGURE 3.2. Illustration of Multieffect Distillation Desalination Processes

16 The Role of Desalination in an Increasingly Water-Scarce World
technology can be used both for SWRO desalination and for desalination of brackish water (brackish water reverse osmosis—BWRO). Typically, 40 percent to 60 percent of the seawater fed into a membrane pro-cess is recovered as product water. For brackish water desalination, water recovery can range from 50 percent to 90 percent.
Because RO membranes can be plugged very easily by suspended solids and mineral scaling compounds, RO systems require special facilities not used in thermal desalination systems to pretreat the source seawater. Desalinated water then undergoes posttreatment, such as pH adjustment and disinfection, to make it suitable for drinking.
Membrane technologies can also be used for treating wastewater. Membrane technologies can be used not only for desalting brackish water and seawater sources but also for treating wastewater because of their ability to also remove contaminants other than salts (for example, organic contaminants, bacteria, and viruses).
Hybrids
Hybrid desalination plants incorporate a combination of a thermal desalination facility (either MSF or MED) and
an SWRO desalination system. The combined thermal and SWRO plants are typically colocated with a power generation station and they share a common intake and outfall. Hybrids are usually selected when there is a wide variation in power or water demand either diurnally or between seasons. This allows the hybrid plant to take advantage of cheap energy when it is available but to meet required levels of water produc-tion by switching between SWRO and thermal tech-nology according to which system gives the cheapest product at the time. Because this approach requires careful planning for the balancing of water and power supply and demand at the least cost, it is usually not suitable for “retrofitting” onto existing power produc-tion facilities. Typically, hybrids form part of a new build combined water and power production com-plex developed as an “independent water and power project” (IWPP).
Growth Patterns of the Commonly Used Desalination Technologies
SWRO has overtaken thermal technology and now accounts for two-thirds of installed capacity worldwide. Until the turn of the century, thermal desalination, and in particular MSF, was the most commonly used
Feedwaterinlet
Chlorine
Coagulant
Air scour blower
Cleaning pump Cleaning solutionAlkali
(option)Chlorine(option)
Productwater
Scale inhibitor
Cartridgelter
High pressure pump
RO module
Brine rejectBackwash waste
Medialter
Sodium bisulte
Sources: Australian Department of the Environment 2002; Veolia Water Technologies 2006. Note: RO = reverse osmosis.
FIGURE 3.3. Illustration of the Reverse Osmosis Desalination Process

17The Role of Desalination in an Increasingly Water-Scarce World
technology. The use of SWRO technology has acceler-ated in the last two decades because of its lower energy use and advances in membrane and pretreatment technologies that have made it very competitive, even in the highly saline seawaters in which thermal tech-nologies were historically more competitive. In 2014, SWRO technology represented about 63 percent of the global desalination capacity (see figure 3.4), followed by MSF (23 percent) and MED (8 percent). The remain-ing 6 percent of desalination capacity was largely
from hybrid configurations (Saudi Arabian Water Environment Association 2013; Bennett 2013).4
However, thermal desalination remains popular in the Middle East. Thermal desalination is still a leading technology in the Middle East, especially in the GCC (see box 3.1). In 2015, just over half (53 percent) of all desalination plants in the Middle East used thermal technology, whereas SWRO accounted for the balance (47 percent).5
70
60
50
40
30
20
10
01980 1990 2000
Year
Mill
ion
m3 /d
2010
Reverse osmosisMulti stage ashMulti eect distillation
Source: Li and Yeo 2011.
FIGURE 3.4. Global Cumulative Capacity of Seawater Desalination by Technology, 1980–2014
BOX 3.1. Why Are Thermal Desalination Plants So Prevalent in the Middle East?
Thermal processes are used across the Middle East and are likely to continue to be popular in the region for several reasons. The regional seas are highly saline and warm, and periodically have high concentrations of organics, which are challenging conditions for membrane desalination technology. In addition, thermal technologies can use low-temperature waste steam from power generation turbines, so that colocation of desalination and power generation produces important efficiency savings, taking advantage of shared intake and discharge structures as well as improving energy efficiencies (usually by 10 percent to 15 percent).
These reasons, combined with the low-cost energy in the region, make thermal processes a more attractive desalination technology in the Middle East than in most other locations. In addition, membrane plants have only recently approached the large production capacities required in this region.Source: World Bank 2017a.

18 The Role of Desalination in an Increasingly Water-Scarce World
Notes1. Other desalination processes such as EDR and vapor-compression
(VC) distillation account for a small share of desalination overall.
2. At present, the two largest MED-TVC plants in operation are the 800-MLD Al Jubail plant in Saudi Arabia and the 486-MLD Az Zour North 1 plant in Kuwait.
3. RO is currently the only membrane process used. The other membrane processes have little commercial application. They are discussed in chapter 6.
4. The remaining 6 percent desalination capacity was taken up by ED, hybrids, and other technologies.
5. RO accounted for 47 percent, MSF for 42 percent, and MED for 11 percent. Source: GWI/DesalData 2010c; www.globalwaterintel.com.

19The Role of Desalination in an Increasingly Water-Scarce World
This chapter summarizes the cost of desalination based on an actual database of about 60 desalination plants of different capacity, technology, and configura-tion. To be more realistic in terms of latest cost data, desalination plants built over the past 20 years have been selected for the analysis. Moreover, to provide representative cost figures, desalination plants from different regions of the world were selected, which accounted for different qualities of feedwater sources and environmental regulatory regimes that are import-ant cost factors (for more on factors that dictate the cost of desalination, see chapter 5). This chapter also provides disaggregated desalination CAPEX and OPEX costs, as well as cost of desalinated water.
The capital cost includes the purchase cost of major equipment, auxiliary equipment, land, construction, management overheads, contingency costs, and so forth. The CAPEX for seawater desalination plants have decreased over the years because of the ongoing development of processes, components, and materi-als. Annual running costs consist of costs for energy, labor, chemicals, consumables, and spare parts. These costs have also been decreasing over the years because of improved system configurations and technological advances in materials used for spare parts such as membranes.
The cost of desalinated water reported here does not include the cost of conveyance and distribution up to the point of use because such figures vary markedly based on distance and elevation difference between the points of water production and water use.
Costs of Multistage Flash Distillation Desalination Projects
Costs of water produced by MSF technology are propor-tional to plant size This assessment of MSF plants is based on a database (see table 4.1) of eight plants
constructed between 2002 and 2016, ranging in size from 89-MLD (89,000 cubic meters per day) produc-tion capacity to 880 MLD (880,000 per cubic meter per day).1 Apart from one plant on the Mediterranean, all these plants are located in the Middle East on the Arabian Gulf. The total cost of freshwater production of these plants is between US$1.02 per cubic meter and US$1.74 per cubic meter (average US$1.44 per cubic meter).2 Figure 4.1 shows that capital, O&M and water production costs are all directly proportional to the plant size. Thus, there is a close correlation between plant size and cost of water, with the smaller plants producing water for US$1.50 to US$1.74 and the larger plants producing water for only just over US$1. Innovations in MSF technology have been limited in recent years and have had little impact on costs.
This is why recent plants have been larger, with decreas-ing costs of producing water. Larger MSF plants have lower capital costs per MLD because of economies of scale. They also have relatively lower annual O&M costs per MLD of produced fresh water because of the economies of scale associated with labor, equipment operation, and maintenance costs. This relationship between costs and plant size explains the recent trend of building predominantly mega-size MSF plants (over 500-MLD production capacity).
Typically delivered as combined water and power proj-ects, the largest MSF plants have proved competitive. Because MSF technology requires both steam and electricity, most of the MSF desalination projects in the Middle East and North Africa (MENA) region are located alongside power plants as combined IWPPs. Thus, although the total energy cost of MSF technol-ogy is higher than for RO technology, the colocation and access to relatively lower cost steam typically available from the colocated power generation plant keeps costs down. In addition, unlike SWRO product water, MSF water is of directly potable quality with
Chapter 4Desalination Cost

20 The Role of Desalination in an Increasingly Water-Scarce World
0.6
0.8
1.0
1.2
1.4
1.6
1.8
0
300
600
900
1,200
1,500
1,800
0 200 400 600 800 1,000
Cost
of w
ater
(US$
/m3 )
CAPE
X, m
illio
n US
$; O
PEX
(105 U
S$/y
ear)
Plant Size (MLD)
Capital cost (million US$)
O&M cost (105 US$/yr)
Cost of water (US$/m3)
FIGURE 4.1. Costs of Multistage Flash Distillation Desalination by Plant Size
Note: All costs are in year 2016 US$. CAPEX = capital expenditure; MLD = million liters per day; O&M = operation and maintenance; OPEX = operating expenditure.
TABLE 4.1. Database of Multistage Flash Distillation Desalination Plants
Plant name and locationOperation
year Size
(MLD)
Capital cost (million 2016 US$)
O&M cost (million 2016 US$/year)a Cost of water
(2016 US$/m3)Total Per MLD Total Per MLD
Arzew, Algeria 2002 88.9 199 2.24 9.9 0.11 1.74
Taweelah A1, United Arab Emirates (refurbishment)
2003 146 356 2.44 16.6 0.11 1.67
Sohar, Oman 2007 150 472 3.15 23.9 0.16 1.55
Ras Laffan 2B, Qatar 2008 272 682 2.51 31.3 0.12 1.49
Shuweihat S1, United Arab Emirates 2004 378 808 2.14 35.2 0.09 1.44
Shuweihat S2, United Arab Emirates 2011 459.1 963 2.10 40.5 0.09 1.36
Yanbu Ph3, KSA 2016 550 1000 1.82 52.2 0.09 1.28
Shuaibah 3 IWPP, KSA 2010 880 1640 1.86 68.9 0.08 1.02
Source: World Bank 2017a. Note: IWPP = independent water and power project; KSA = Kingdom of Saudi Arabia; MLD = million liters per day; O&M = operation and maintenance.a. Annual O&M costs are usually reported in total U.S. dollars or U.S. dollars per MLD. To calculate O&M costs in U.S. dollars per cubic meter, the following formula is applied: Unity O&M cost (U.S. dollars per cubic meter) = (Total Annual O&M cost in million U.S. dollars)/(plant size in MLD × 0.001 × 365 days/year). The factor 0.001 is a conversion factor from million liters to million cubic meters For capital recovery cost, unless otherwise indicated, an average of 25-year term and 12% interest rate is assumed. Plant capacity availability factor of 95% is also assumed. Note: Increasing availability factor from 95 percent to 100 percent results in a capital cost increase of 20 percent to 30 percent.

21The Role of Desalination in an Increasingly Water-Scarce World
very low mineral content. Hence, unlike SWRO (see the section “Cost of Seawater Reverse Osmosis Desalination Projects”), there are no extra costs for treating MSF desalinated water. Figure 4.1 shows a clear benefit of building mega-size MSF facilities: their cost of water is competitive to that produced by medium- and large-size SWRO desalination facilities for seawater of similar salinity.
Costs of Multieffect Distillation Desalination Projects
Smaller MED-TVC plants typically produce water at lower cost than MSF, but the costs are comparable for larger plants. This assessment is based on data from 10 plants constructed between 2005 and 2014 (see table 4.2 and figure 4.2). Plant size ranges from 13 MLD (13,000 cubic meters per day) to 800 MLD (800,000 cubic meters per day). Four of these plants are on the Mediterranean and six are on the Arabian Gulf. The total cost of water production is between US$1.12 per cubic meter and U$1.50 per cubic meter. Similar to MSF, variations in cost of MED production are mainly caused by the sig-nificant economy of scale associated with the size of the plants.3 Smaller MED plants typically have lower
capital and operating costs than MSF plants of the same size; hence, they produce water more cheaply. MED plants below 100-MLD (100,000 cubic meters per day) capacity produce water costing in the range US$1.40 per cubic meter to US$1.50 per cubic meter; whereas water from MSF plants of comparable size costs US$1.75 per cubic meter and up. However, at larger production capacities MSF technology produces water more cheaply.
When a smaller thermal plant is needed, MED is becom-ing the technology of choice. A pattern has emerged in which MED technology is being chosen for smaller thermal desalination plants (less than 100 MLD) and MSF technology is being chosen for larger ones. This pattern can be seen because most MED plants constructed in recent years are significantly smaller in size than the MSF plants built over the same period.
However, despite the cost advantages of MED, MSF tech-nology is sometimes preferred because it is lower risk. Although MED plants are more energy efficient and have lower costs than smaller MSF plants of equivalent size, MSF facilities are easier to operate, and MSF is often considered by investors to be the more mature
TABLE 4.2. Database of Multieffect Distillation Desalination Plants
Plant name and locationOperation
yearSize
(MLD)
Capital cost (million 2016 US$)
O&M cost (million 2016 US$/year) Cost of water
(2016 US$/m3)Total Per MLD Total Per MLD
Tobruk (extension), Libya 2014 13.3 25.3 1.90 1.10 0.08 1.50
Rabigh, KSA 2005 25.0 58.4 2.34 2.34 0.09 1.46
Abutaraba, Libya 2007 40.0 69.8 1.75 2.80 0.07 1.43
Zuara, Libya 2010 40.0 59.6 1.49 2.40 0.06 1.45
Layyah, United Arab Emirates 2007 47.5 68.8 1.45 2.61 0.05 1.42
Ras Al Khaimah, United Arab Emirates 2005 68.2 99.4 1.46 3.26 0.05 1.40
Sussa Derna Zawia, Libya 2009 160.0 215.0 1.34 7.40 0.05 1.39
Al Hidd, Bahrain 2008 272.8 320.7 1.18 9.49 0.03 1.38
Ras Laffan, Qatar 2010 286.4 366.2 1.28 10.20 0.04 1.35
Marafiq Jubail IWPP, KSA 2009 800.0 1,115.0 1.39 44.80 0.06 1.12
Source: World Bank 2017a. Note: IWPP = independent water and power project; KSA = Kingdom of Saudi Arabia; MLD = million liters per day; O&M = operation and maintenance.

22 The Role of Desalination in an Increasingly Water-Scarce World
and less risky of the two technologies. MSF technology is therefore sometimes preferred simply because it is perceived as lower risk, even when MED technology may have a cost advantage.
In the future, expected growth in economy of scale is likely to lead to more widespread adoption of MED technology for the high salinity waters of the Middle East. Development of MED technology is producing efficiency gains and there are likely to be further economies of scale to be gleaned. Already one very large MED plant constructed in recent years, the Marafiq Jubail IWPP in Saudi Arabia, which has a capacity of 800 MLD (800,000 cubic meters per day), rivals MSF plants in size and is producing water at US$1.12 per cubic meter, which is little more than MSF plants of comparable size. Because of MED’s advan-tages over MSF of lower energy requirements and lower capital costs, this technology is likely to be used more widely in coming years when a thermal plant is the choice.
Costs of Seawater Reverse Osmosis Desalination Projects4
For SWRO, there are significant economies of scale at lower production capacities, but these taper off above 100 MLD. This assessment is based on data from 34 SWRO plants constructed between 2001 and 2017 (see table 4.3). The plants range in size from 5 MLD (5,000 cubic meters per day) to 624 MLD (624,000 cubic meters per day. Eleven of these plants are on the Mediterranean, seven are on the Atlantic and Pacific, seven are on the Arabian Gulf, and five are on the Arabian Gulf and the Sea of Oman. The total cost of water production is between US$0.49 per cubic meter and US$2.86 per cubic meter. Although there are site-specific factors that influence costs and cause “outliers,”5 costs typically decline as plant capacity increases. However, these reductions tend to taper off above 100-MLD capacity with costs in the range $0.85 per cubic meter to US$1.10 per cubic meter being typical for plants over 100 MLD (see figure 4.3).
FIGURE 4.2. Costs of Multieffect Distillation with Thermal Vapor Compression Projects (Capital, Operation and Maintenance, and Cost of Water)
Source: World Bank 2017a. Note: All costs are in year 2016 US$. CAPEX = capital expenditure; MLD = million liters per day; O&M = operation and maintenance.
0.9
1.0
1.1
1.2
1.3
1.4
1.5
1.6
0
200
400
600
800
1,000
1,200
0 100 200 300 400 500 600 700 800 900
Cost
of w
ater
(US$
/m3 )
CAPE
X (m
illio
n US
$); O
PEX
(105 U
S$/ y
ear)
Plant size (MLD)
Capital cost (million US$)
O&M cost (105 US$/yr)
Cost of water (US$/m3)

23The Role of Desalination in an Increasingly Water-Scarce World
TABLE 4.3. Database of Seawater Reverse Osmosis Desalination Plants by Source of Raw Water
Plant name and location RO system configurationOperation
yearSize
(MLD)
Capital cost (2016 million US$)
O&M cost (2016 million US$/year)
Cost of water (2016
US$/m3)aTotal Per MLD Total Per MLD
Mediterranean Sea
Moni, Cyprus 2 pass/2 stages of second pass 2009 20 35.4 1.77 5.4 0.27 1.62
Larnaca, Cyprusb 2 pass/2 stages of second pass 2009 62 80 1.29 13.9 0.22 1.26
Jorf Lasfar, Morocco 2 pass/2 stages of second pass 2013 75.8 168.2 2.22 14.3 0.19 1.10
Cap Djinet, Algeria 2 pass/2 stages of second pass 2007 100 147.6 1.48 17.9 0.18 0.91
Fouka, Algeria 2 pass/2 stages of second pass 2008 120 196 1.63 19.8 0.17 0.90
Hamma, Algeria 2 pass/2 stages of second pass 2008 200 272.2 1.36 32.3 0.16 0.91
Ashdod, Israel 2 pass/2 stages of second pass 2011 320 444 1.39 44.6 0.14 0.78
Magtaa, Algeria 2 pass/2 stages of second pass 2009 500 512 1.02 55.4 0.11 0.68
Sorek, Israelc 4 stages, 2 passes 2013 624 480 0.77 58.2 0.09 0.64(1)
Barcelona, Spaind 2 pass/2 stages of second pass 2009 200 322.5 1.61 39.5 0.20 1.04
Larnaca, Cyprus 2 pass/2 stages of second pass 2001 64 80.0 1.25 13.2 0.21 0.96
San Nicolas, Canary Islandse 2 pass/2 stages of second pass 2001 5 8.6 1.72 2.2 0.44 1.77
Arabian Gulf and Sea of Oman
Sohar, Oman 2 pass/2 stages of second pass 2013 20 30 1.50 7.5 0.38 1.92
Palm Jumeirah, United Arab Emirates
2 pass/2 stages of second pass 2008 64 118 1.84 18.1 0.28 1.54
Ghalilah, United Arab Emirates
2 pass/2 stages of second pass 2015 68.2 84.1 1.23 16.5 0.24 1.52
Sur, Oman Single pass 2010 82.2 145 1.76 18.2 0.22 1.19(1)
ROI Majis, Omanf 2 pass/2 stages of second pass 2014 20 49.6 2.48 3.7 0.19 1.26
Al Jubail (4), KSA 2 pass/2 stages of second pass 2014 100 169 1.69 19.9 0.20 1.17
Shuwaikh (2), Kuwait 2 pass/2 stages of second pass 2010 136 210 1.54 24.9 0.18 1.16
Al Dur, Bahrain 2 pass/2 stages of second pass 2012 218 254 1.17 29.3 0.13 0.96
Red Sea
Yanbu, KSA 2 pass/2 stages of second pass 2016 30 67.7 2.26 9.82 0.33 1.70
Kaust, KSA 2 pass/2 stages of second pass 2017 40 82.0 2.05 14.2 0.36 1.60
Shuaibah (3) Extension, KSA
2 pass/2 stages of second pass 2011 150 273.8 1.83 30.0 0.20 1.25
Shuqaiq, KSA 2 pass/2 stages of second pass 2010 212 285.0 1.34 34.4 0.16 1.20
Jeddah 3, KSA 2 pass/2 stages of second pass 2013 240 322.6 1.34 36.8 0.15 1.14
Atlantic/Pacific Ocean
Carlsbad, CAg 4 stages, 2 passes 2015 200 484.0 2.42 9.82 0.27 1.67
Corpus Christi, TXh 2 pass/2 stages of second pass In planning 45 118.4 2.63 6.7 0.15 1.20
Santa Barbara, CAi 2 pass/2 stages of second pass 2016 10 44.8 4.48 4.1 0.41 2.50
table continues next page

24 The Role of Desalination in an Increasingly Water-Scarce World
TABLE 4.3. continued
Plant name and location RO system configurationOperation
yearSize
(MLD)
Capital cost (2016 million US$)
O&M cost (2016 million US$/year)
Cost of water (2016
US$/m3)aTotal Per MLD Total Per MLD
Sydney, Australiaj 2 stages, 2 passes 2010 250 1,911 7.64 52.9 0.21 2.86
Singspring, Singaporek 2 pass/2 stages of second pass 2005 136 176.8 1.30 23.4 0.17 0.88
Jaffna, Sri Lankal Single pass In planning 24 50.0 2.08 4.1 0.17 1.10
Durban, South Africam Single pass In planning 36 76.9 2.14 6.6 0.18 1.16
Sources: Caldera and Breyer 2017; World Bank 2017a.Note: KSA, Kingdom of Saudi Arabia; MLD = million litres per day; O&M = operation and maintenance; RO = reverse osmosis.a. For plants in which actual water costs were not available, we assumed a weighted average cost of capital of 7 percent and a lifetime of 25 years for the
SWRO plants, which is consistent with other studies, such as Caldera and Breyer (2017).b. Unit energy costs = US$0.088/kWh. Total plant energy use = 4.35 kWh/m3.c. Unit energy costs = US$0.048/kWh. Total plant energy use = 3.414 kWh/m3.d. Desalination plant uses existing WWTP outfall for brine discharges. Unit energy costs = US$0.10/kWh. Total plant energy use = 3.67 kWh/m3.e. Unit energy costs = US$0.18/kWh. Total plant energy use = 4.75 kWh/m3. Recovery ratio of 42 percent. Unit energy costs = US$0.065/kWh; Total plant
energy use = 4.35 kWh/m3.f. Recovery ratio of 42 percent. Unit energy costs = US$0.065/kWh. Total plant energy use = 4.35 kWh/m3.g. Desalination plant uses existing power plant outfall for brine discharges. Unit energy costs = US$0.09/kWh. Total plant energy use = 3.46 kWh/m3.h. Unit energy costs = US$0.075/kWh. Total plant energy use = 3.04 kWh/m3.i. Desalination plant uses existing power plant outfall for brine discharges. Unit energy costs = US$0.12/kWh. Total plant energy use = 3.78 kWh/m3.j. Unit energy costs = US$0.07/kWh. Total plant energy use = 3.90 kWh/m3.k. Unit energy costs = US$0.08/kWh. Total plant energy use = 3.74 kWh/m3.l. Desalination plant has onshore outfall pipe. Unit energy costs = US$0.071/kWh. Total plant energy use = 3.20 kWh/m3.m. Recovery ratio of 50% (most other plants have a recovery ration of <45%). Unit energy costs = US$0.078/kWh. Total plant energy use = 3.73 kWh/m3.
FIGURE 4.3. Costs of Water Produced by Seawater Reverse Osmosis Desalination Projects, by Region
Note: The lowest water cost for SWRO relates to the Cangzhou New Bohai Development Zone, China. Among other factors, the favorable cost of electricity (0.65 RMB/KWh) and capital (at about 7 percent over 10 years) and higher lower debt-to-equity ratio (66:33) may have contributed to lower cost of desalinated water. MLD = million liters per day; RO = reverse osmosis; SWRO = seawater reverse osmosis.
3.0
2.5
2.0
1.5
Wat
er c
ost,
US$/
m3
1.0
0.5
00 200
SydneySWRO plant
400
Plant size, MLD
600 800
Pacific/Atlantic OceanGulf of Oman and Indian Ocean
RO Arabian GulfRO Mediterrannean SeaRO Red Sea

25The Role of Desalination in an Increasingly Water-Scarce World
There is a wide range of costs for similar size plants simply because desalination in general and RO technol-ogy in particular are, as indicated in chapter 5, sensitive to site-specific conditions and some are simply caused by special delivery conditions and subsidies and the way they are operated. Two very large plants (>500 MLD) have the lowest first-year bid costs (Magtaa in Algeria US$0.68 per cubic meter and Sorek in Israel 0.64 per cubic meter) with these low costs resulting from a combination of innovative technology and special delivery conditions and subsidies, as well as by adjust-ing the price of water from low initial cost (first-year bid price) to higher costs (more than US$0.9 per cubic meter) several years later after the plants began opera-tion.6 In contrast, two medium-size plants have high unit costs: Carlsbad in California is high cost (US$1.67 per cubic meter) because of very stringent environ-mental requirements, and the Sydney, Australia, plant is very high cost (US$2.86 per cubic meter) because the plant is operated as a standby facility so it has prob-lems in covering its high fixed costs and because the plant developed renewable wind energy to offset the plant’s GHG emissions. In addition, labor cost is another important factor. For example, comparing the Sorek plant in Israel and the Carlsbad plant in California, the cost of water differential caused by labor rate difference is US$0.46 per cubic meter, that is, Sorek would have cost US$1.05 per cubic meter if the California labor rates were used for the construction of Sorek.
Newer plants generally produce water at much lower cost. Advances in technology have contributed to sig-nificantly lower costs for newer projects. Several plants that have come into operation since 2015 that have higher costs (>US$1 per cubic meter) are either small plants or are located in areas with higher salinity and warmer waters.
Costs of Hybrid Desalination Projects
Hybrid projects incorporate both thermal and SWRO technologies. Most hybrid projects combine MSF thermal technology with SWRO.7 Under some
circumstances, hybrids have cost advantages (see the following section) and this has resulted in more fre-quent application over the past decade. In these proj-ects, typically two-thirds of the total volume of desalinated water is produced by thermal desalination and one-third by SWRO.
The average costs of hybrid desalination projects have proved lower than the costs of single-technology pro-duction. This assessment is based on data from five hybrid plants constructed between 1994 and 2014 (see table 4.4) ranging in size from 300 MLD (300,000 cubic meters per day) to 1,036 MLD (1,036,000 cubic meters per day). The thermal portion of hybrid proj-ects produces water at between US$0.95 per cubic meter and US$1.3 per cubic meter, with an average of US $1.15 per cubic meter. The SWRO portion of hybrid mega-size desalination projects produce water at between US$0.85 per cubic meter and US$1.12 per cubic meter, with an average of US$1.03 per cubic meter. There are some economies of scale to be had (see figure 4.4).
Hybrid plants can be cost-competitive because of effi-cient energy use and economies of scale. Depending on site-specific local power, water demand conditions, and project size, hybrid plants can be cost-competitive with stand-alone thermal or SWRO plants because of their more energy-efficient configuration, economy of scale from use of joint intake and outfall facilities, and the lower energy consumption of the RO system caused by the use of warm cooling water from the ther-mal desalination plant.8
In particular, hybrid plants may be competitive when there are large seasonal variations in power demand. In many countries, particularly in the Middle East, peak power demand occurs in summer and then drops dramatically to 30 percent to 40 percent in the winter. In contrast, the demand for desalinated water is almost constant throughout the year. This creates a situation in which over 50 percent of power generation capacity is not used. This imbalance between demand for electricity and water can be

26 The Role of Desalination in an Increasingly Water-Scarce World
TABLE 4.4. Database of Hybrid Desalination Plants
Plant name and location TypeOperation
year Size
(MLD)
Capital cost (2016 million US$)
O&M cost (2016 million US$/year) Cost of water
(2016 US$/m3)Total Per MLD Total Per MLD
Yanbu, Phase-1, KSA MSF1995
181.7 348 1.92 32.4 0.18 1.37
SWRO 127.9 175 1.37 41.0 0.32 1.12
Jeddah, 1&2, KSA MSF1994
363.4 672 1.85 56.6 0.16 1.16
SWRO 136.4 188 1.38 38.0 0.28 1.09
Fujairah 1, United Arab Emirates
MSF2004
283.5 620 2.19 16.7 0.06 1.18
SWRO 170.5 202 1.18 18.6 0.11 1.02
Fujairah 2, United Arab Emirates
MED2010
455.0 720 1.58 22.4 0.05 1.11
SWRO 136.0 178 1.31 14.7 0.11 1.05
Ras Al Khair, KSA MSF2014
727.4 1,060 1.46 36.8 0.05 0.95
SWRO 309.1 375 1.21 30.7 0.10 0.85
Source: World Bank 2017a. Note: KSA = Kingdom of Saudi Arabia; MLD = million liters per day; MED = multieffect distillation; MSF = multistage flash distillation; O&M = operation and maintenance; SWRO = seawater reverse osmosis.
FIGURE 4.4. Capital and Operation and Maintenance Costs of Hybrid Desalination Plants as a Function of Freshwater Production Capacity
Source: World Bank 2017a. Note: O&M = operation and maintenance; MLD = million liters per day: MSF = multistage flash distillation; SWRO = seawater reverse osmosis.
MSF SWRO
y = 482.09ln(x) – 2156.3R2 = 0.96
y = 229.22ln(x) – 947.82R2 = 0.96
0
200
400
600
800
1,000
1,200
0 200 400 600 800
Capi
tal c
ost,
mill
ion
US$
Size, MLD
y = 16.879ln(x) – 72.92R2 = 0.96
y = 15.133ln(x) – 54.674R2 = 0.96
0
5
10
15
20
25
30
35
40
45
0 200 400 600 800
O&M
cos
t, m
illio
n US
$/ye
ar
Size, MLD
corrected by diverting the excess electricity to water production in an MSF/MED-RO hybrid configuration. This approach has the potential to save considerable energy costs.
Hybrid plants are most cost-effective when there is limited existing water and power generation capacity but high future demand, such as in new industrial devel-opment zones. Although the construction of hybrid

27The Role of Desalination in an Increasingly Water-Scarce World
plants has yielded some of the lowest water produc-tion costs, these plants have not found widespread use because in many locations power generation plants have already been constructed at a distance from cen-ters of water demand or from sites suitable for new desalination capacity. The cost of building conveyance facilities to transport surplus power and water over long distances to other parts of the country often negates the savings from hybrid production of power and water. Therefore, hybrid plants have found appli-cation mainly in locations with limited existing water
and power generation capacity and large new future demand of both power and water (typically in new industrial development zones).
Hybrid projects are proving popular in the Red Sea and the Gulf. For the source water conditions of the Red Sea and the Arabian Gulf, hybrid desalination projects, which produce a portion (typically two-thirds) of their drinking water by thermal evaporation and the rest (typically one-third) by SWRO desalination, are more competitive than thermal or SWRO desalination
a. Thermal plants. Top—CAPEX; Bottom—OPEX b. SWRO plants. Top—CAPEX; Bottom—OPEX
Indirect costs10%
Indirect costs8%
Thermalenergy52%
Electrical energy14%
Electricalenergy41%
Chemicals4%
Chemicals11%
Membranes5%
Waste discharge2%
Waste discharge4%
Labor9%
Labor13%
Maintenance7%
Maintenance14%
Monitoring2% Monitoring
4%
Construction77.5%
Construction60%
Engineering7%
Projectdevelopment
4%
Project financing4%
Contingency7.5%
Engineering12.5%
Projectdevelopment
7.5%
Project financing8%
Contingency12%
FIGURE 4.5. Cost Components of Typical Desalination Plants by Technology
Source: WaterReuse Association 2012; Gude VG. 2016; Voutchkov 2018.Note: CAPEX = capital expenditure; OPEX = operating expenditure.

28 The Role of Desalination in an Increasingly Water-Scarce World
projects alone. This is supported by a recent trend in construction of a large number of new hybrid desali-nation projects in Qatar, United Arab Emirates, and Saudi Arabia.
Summary of desalination cost components. Figure 4.5 provides a detailed cost breakdown of typical desalina-tion plants by technology. As discussed previous, the lion’s share of desalination cost regardless of technol-ogy is the construction cost, constituting over 75 percent for thermal plants and about 60 percent for SWRO plants.
Notes1. MLD = 1 million liters per day = 1 mega liter per day = 1,000 cubic
meters a day.
2. All dollar figures are 2016 U.S. dollars.
3. About 15 percent to 25 percent of variations in total cost are accounted for by factors such as the cost of energy, chemicals, and materials, by intake and outfall configuration, and by costs of project funding. Source and product water quality specifications and discharge regula-tory requirements make little difference to costs.
4. Initially, the RO membranes were expensive, pretreatment was not well understood, and energy consumption was high. Because of
advances in membrane technology and pretreatment options, mem-brane prices have fallen, their performance has improved, and pre-treatment is better understood. As a result, cost of desalination has fallen significantly over the years.
5. For example, the Carlsbad plant in California and the Sydney, Australia, plant (see figure 4.3).
6. The first-year bid price of water for some projects is misleadingly low because the bids for such projects were structured to be compared with the first-year cost of water. This allowed some of the bidders to shift initial project construction costs to the latter years of the project, when the low introductory cost of water experiences a steep increase in its real market value of US$0.85 per cubic meter per day to 1.20 per cubic meter per day. Often, the public announcements and available information refer to the first-year cost of water numbers without reporting the actual adjustment the of the so-called “low cost of water” desalination projects experience in the following years because such information is considered confidential and is never released or made available to the public.
7. Most of the existing hybrid projects incorporate MSF thermal desali-nation combined with SWRO desalination plant. The only hybrid proj-ect with MED thermal desalination is that of Fujairah #2 in the United Arab Emirates.
8. For instance, at peak power demand, the SWRO will be either par-tially operational or fully shutdown because the peak power price is high and the plant capacity may have not been designed to have additional load from SWRO at the peak power demand. This explains that the hybrids are site specific and also depend on the energy price.

29The Role of Desalination in an Increasingly Water-Scarce World
The principal drivers of costs are the interrelated factors of technology choice, energy cost, plant size and configuration, feedwater and product water quality, and environmental compliance requirements, most of which are site specific in nature. Project capital, O&M, and overall desalinated water production costs depend not only on the primary technology choice made on plant size (see chapter 4) but also on a number of other fac-tors, most of which are site specific to location, feed-water quality, target product water quality, environmental impacts and regulations, and energy use. The next section assesses the main cost differ-ences between thermal and membrane technologies and looks at sensitivities. The following sections exam-ine the other site-specific factors that affect costs.
Other factors, such as the institutional and business environment, method of project delivery, financing, and so forth, also have significant influence on desali-nation costs. Factors in this category are usually esti-mated to influence the cost of desalination by a range of 10 percent to 20 percent of the baseline project costs (see chapter 7).
All these factors together collectively define the risk-reward profile of a desalination project, which in turn drives investor interest and overall cost of desalination.
Analysis of Cost Differences between Technologies
Overall, thermal desalination technologies, particularly MSF plants, are more capital-intensive than SWRO. Table 5.1 gives a rough approximation of average capi-tal costs of each of the three commonly used technolo-gies. Taking mean total capital costs from typical plants constructed over the last 10 years, it appears
that thermal technologies have higher unit capital costs than SWRO (around US$ 1.50 to US$ 2.00 million for each MLD capacity for thermal, and around US$1.30 million for SWRO. Looking at thermal desalination technology, capital costs for MSF plants per each MLD of capacity are higher than those of MED plants.
Physical construction and equipment costs dominate the capital costs of thermal plants, whereas the breakdown of SWRO capital costs shows a more design-intensive tech-nology. For thermal plants the construction costs are typically at least three-quarters of total capital costs, in the range of $1.05 million up to $1.70 million per MLD capacity. Whereas, for SWRO plants, construction costs are in the range of US$0.70 million up to just over $1.00 million per MLD capacity in the MENA region. Such costs exceed US$4 million per MLD in the largest desali-nation projects in Australia and the United States. In contrast, “soft” capital costs (such as engineering ser-vices; administrative, regulatory and legal costs; and financing) during construction tend to be a higher share of total costs for SWRO than thermal desalination because thermal desalination is more mature technol-ogy. This pattern reflects the heavier physical invest-ment required for thermal technology and reflects the more design-intensive and (in some environments) riskier nature of SWRO technology.1 The higher costs of financing during development reflect in part the per-ception in financial markets of SWRO as a risker tech-nology (see chapter 7). This factor also is reflected in the higher provisions for contingencies.
Overall recurrent costs for SWRO plants for each unit of output are double those of MSF plants, and three times those of MED plants. Table 5.2 gives a rough approxi-mation of average recurrent costs of each of the three commonly used technologies. Overall, the annual recurrent costs of each MLD of output from an SWRO
Chapter 5Key Factors Affecting Cost of Desalinated Water

30 The Role of Desalination in an Increasingly Water-Scarce World
plant are roughly around US$ 200,000. For MSF plants, the annual costs are around US$ 100,000, and for MED they are around US$ 60,000.
For both technologies, but particularly for thermal plants, energy is far and away the largest single item
of recurrent cost. Energy costs account for two-thirds to three-quarters of all recurrent costs for thermal and between one-third and nearly one-half for SWRO. Apart from total energy costs, which are clearly always a lower or much lower share for SWRO, the main differ-ence in energy between technologies is that most of
TABLE 5.1. Breakdown of Capital Costs by Technology
Component
Thermal SWRO
CommentShare of total (%)
MSF
(million $/MLD)
MED
(million $/MLD)
Share of total (%)
(million $/MLD)
Construction costs
70–85 1.40–1.70 1.05–1.27 52–68 0.68–1.10 Physical investment cost share of total capital costs tends to be higher for thermal
Engineering services
5–8.5 0.10–0.17 0.07–0.12 10–15 0.13–0.19 Engineering costs tend to be a higher share for SWRO
Project development
2.5–5.5 0.05–0.11 0.04–0.08 6–9 0.07–0.12 Project development costs tend to be a higher share for SWRO
Project financing costs
2.5–6 0.05–0.12 0.04–0.09 6–10 0.07–0.13 Project financing costs tend to be a higher share for SWRO
Contingency 5–10 0.10–0.20 0.07–0.15 10–15 0.13–0.19 Contingencies tend to be a higher share for SWRO
Total capital costs
100 2.00 1.50 100 1.30
Source: World Bank 2017a. Note: MED = multieffect distillation; MLD = million liters per day; MSF = multistage flash distillation; SWRO = seawater reverse osmosis.
TABLE 5.2. Breakdown of Recurrent Costs by Technology
ComponentThermal SWRO
CommentShare of total (%)
MSF ( million $/MLD)
MED (million $/MLD)
Share of total (%)
(million $/MLD)
Variable recurrent costs 62–83 0.06–08 0.04–0.05 53–68 0.11–0.14 Variable costs as a share of total recurrent costs tend to be higher for thermal
• Thermal energy 49–55 0.05 0.03 – –
• Electrical energy 8–20 0.01–0.02 0.01 37–45 0.08
• Other variable costs 5–7.5 0.01 0.01 16.5–23 0.04
Fixed recurrent costs 17–38 0.02–0.04 0.01–0.02 32–46.5 0.06–0.09 Fixed costs as a share of total recurrent costs tend to be higher for SWRO
• Labor 6.5–11 0.01 0.01 12–14.5 0.02
• Maintenance 5–9 0.01 0.01 13–15 0.02
• Other 5.5–18 0.01–0.02 0.01 7–17 0.03
Total annual recurrent costs 100% 0.10 0.06 100 0.20 –
Source: World Bank 2017a. Note: MED = multieffect distillation; MLD = million liters per day; MSF = multistage flash distillation; SWRO = seawater reverse osmosis.

31The Role of Desalination in an Increasingly Water-Scarce World
the energy requirement for MSF and MED is thermal energy, with less than one-third of total energy use by this technology coming from electricity. In contrast, the entirety of SWRO’s energy requirement is from electricity, but much more electricity is required in total for SWRO than for thermal technologies.
Fixed costs are higher for SWRO plants, underlining the higher requirements for more skilled labor and the higher maintenance expenditures for more complex SWRO equipment. The variable recurrent costs of ther-mal plants tend to be a higher share of total O&M than for SWRO. For the fixed costs, the situation is the oppo-site; they tend to be a higher share of total O&M costs for SWRO than for thermal technologies.
Other recurrent costs tend to be higher for SWRO, reflecting the nature of the technology and its operat-ing requirements: more chemicals are used, mem-branes and cartridge filters need replacement, and more labour and maintenance is required. The high regulatory and administrative costs reflect the more stringent institutional and legal environments in which this technology is mainly located.
Recent SWRO examples show that three-quarters of pro-duction cost is energy use and capital recovery costs. The all-up cost of water production in the most recent SWRO plants is in the range of US$0.72 per cubic meter to 1.20 per cubic meter. In a typical case of a recent SWRO plant (see table 5.3), by far the two largest cost items are energy (30 percent of total per cubic meter cost) and cap-ital recovery costs (44 percent of total cost). The remain-ing 26 percent of costs are spread between variable costs of chemicals, membranes and filters, and brine disposal (12 percent of total cost); labor, maintenance, and moni-toring costs; and other O&M (14 percent of total cost).
Effect of Location on Costs
Costs of conveyance and distribution are important, and there are cost advantages to projects near the coast and on low-lying land. Because of the huge weight and volume of water, transporting it is very expensive. A 100-meter
vertical lift is about as costly as a 100- kilometer horizon-tal transport, and they are generally estimated to cost in the range of US$0.05 per cubic meter to US$0.06 per cubic meter.2 For this reason, seawater desalination is typically more viable for points of use that are located near the coast and at lower elevation.
In fact, costs of water transport are a major factor in decid-ing between the option of desalination and that of water transfer. Up to a certain point, it may be more economical to transport fresh water from somewhere else than to desalinate it, especially to places far from the sea, such as New Delhi, India, or high up, like Mexico City, Mexico. Table 5.4 gives some indicative costs of transporting desalinated water from seaside plants to a range of water-short cities. These costs would form an element in the choices between water transfer and desalination. The calculation, however, is not static; transport costs are highly sensitive to energy costs and as desalination costs fall, the desalination option becomes progressively competitive with water transfer.3
TABLE 5.3. Typical Breakdown of Total Water Production Costs for a Recent Efficient Seawater Reverse Osmosis Project
US$/m3 Percentage of total
Variable costs 0.30 42
Energy 0.22 30
Chemicals 0.02 3
Replacement of RO membranes and cartridge filters
0.04 6
Waste stream disposal 0.02 3
Fixed costs 0.42 58
Capital recovery costs 0.32 44
Labor 0.02 3
Maintenance 0.03 4
Environmental and performance monitoring
0.01 1
Other O&M costs 0.04 6
Total water production costs 0.72 100
Source: Voutchkov 2018. Note: Capital recovery cost is assumed at 25 years payment term at 5 percent interest rate. O&M = operation and maintenance; RO = reverse osmosis.

32 The Role of Desalination in an Increasingly Water-Scarce World
Plant Size and Economies of Scale
Project size has a significant influence on the overall cost of desalinated water because in most desalination tech-nologies there are economies of scale.4 Each technol-ogy, however, has a different pattern of returns to scale, which is formed by a combination of the optimal size of the treatment units and the physical footprint of the plant, the flow distribution requirements, and the intake and outfall configuration. The optimal size of the treatment units varies considerably between technolo-gies, so the units that are commercially available vary significantly in size from one technology to another:
• MSF units typically have a capacity of around 30 MLD (in the range of 27.3 MLD to 32.7 MLD). The largest MSF units installed (at the Shuweihat Thermal Desalination Plant in United Arab Emirates) have a production capacity of 75.7 MLD.
• Most working MED plants use units of individual capacity in a range of 3 MLD to 5 MLD. The thermal desalination plant with the largest MED units in
operation (23 MLD per unit) is located in Sharjah, United Arab Emirates.
• Typical size RO trains for medium- and large-size SWRO plants vary from 10 MLD to 20 MLD. The larg-est size SWRO train that can be built using off-the-shelf standard equipment (high-pressure pumps, energy recovery devices, and 8-inch membranes) has a production capacity of approximately 25 MLD. Construction of larger individual trains is techni-cally possible, but usually it is not as cost-effective because it would require the use of custom-made RO system equipment. As a result, some of the econ-omy of scale savings would be negated by the addi-tional equipment costs.
Although thermal desalination plants have consistently higher economies of scale benefits, economies of scale of SWRO tend to decrease at higher capacities. For SWRO plants, the optimum size historically has been 100 MLD to 200 MLD, which gave the lowest produc-tion costs of just over US$1.00 per cubic meter, which is the lowest attainable until recently (see figure 5.1).5 The economy of scale benefits decline for SWRO plants larger than 200 MLD because of the added complexity of flow distribution, treatment, and operations, although this is likely to double to 400 MLD in time.
Most SWRO desalination plants with a capacity larger than 200 MLD are built as multiple identical parallel desalination systems of 100 MLD to 200 MLD, which share common intake and outfall.
Feedwater Quality
Source water quality, such as salinity, temperature, and biofouling elements, affects costs, performance, and durability.6 Table 5.5 depicts the salinity and tempera-ture of different seawater sources. SWRO plants are sensitive to salinity, boron content, temperature, and membrane biofouling potential, whereas thermal technologies simply evaporate pure water and discard all other elements. Design and operations of SWRO plants have to take into account these sensitivities,
TABLE 5.4. Cost of Water Transport to Selected Cities
City, countryDistance
(km)Elevation
(m)Transport cost (US cents/m3)
Beijing, China 135 100 13
New Delhi, India 1,050 500 90
Bangkok, Thailand 30 100 7
Riyadh, Saudi Arabia 350 750 60
Harare, Zimbabwe 430 1,500 104
Crateus, Brazil 240 350 33
Ramallah, Palestine 40 1,000 54
Sana, Yemen 135 2,500 138
Mexico City, Mexico 225 2,500 144
Zaragoza, Spain 163 500 36
Phoenix, U.S. 280 320 34
Tripoli, Libya 0 0 0
Source: Zhou and Tol 2005.a
Note: Distances and elevations are taken from the Times Atlas of the World (2005).a. This assumes a transport of 100 million cubic meter (MCM) per year. Transport costs are assumed to be 6 US cents per 100 kilometer horizontal transport plus 5 cents per 100-meter vertical transport.

33The Role of Desalination in an Increasingly Water-Scarce World
driving up both capital and operating costs. Because RO membranes can be plugged very easily by sus-pended solids and mineral scaling compounds, this type of desalination plant requires special facilities for pretreatment of the source seawater, which are not used in thermal desalination plants such as dissolved air flotation clarifiers (DAFs) and granular media or membrane filters. For thermal plants, scaling (the buildup of scales caused by evaporation) is a major impact. Antiscalants are used to remove them.
On the other hand, thermal plants require highly corro-sion-resistant and costly materials like titanium for the
heat exchangers, whereas the RO membranes are made of composite polymers, which are relatively less expensive.
Typically, RO technology is lower cost when salinity is lower, largely because of lower energy requirements. In more saline and high temperature seas, RO is typi-cally a high cost alternative. However, for the relatively low salinity conditions of the oceans and seas of the rest of the world, SWRO usually yields measurably lower energy demand than thermal desalination. In the Mediterranean, for example, the good feedwater quality has made SWRO the lowest cost technology, with total costs of water production varying from 64 cents per cubic meter to 162 cents per cubic meter, with an average of 98 cents per cubic meter. As a result, most of the desalination plants built in North Africa, Israel, Cyprus, and Malta over the past two decades use membrane rather than thermal technology. Similarly, even existing thermal desalination facilities in low-saline locations are being replaced by SWRO plants, for example, in some of the Caribbean Islands.
At higher levels of salinity, thermal technologies can compete with RO on energy use. With all other condi-tions being equal, an SWRO plant using Red Sea sea-water, which has an average TDS of 44 ppt, will require
TABLE 5.5. Salinity (Total Dissolved Solids) and Temperature of Various Seawater Sources
Seawater source TDS (ppt) Temperature (°C)
Red Sea 42–46 (avg. 44) 24–33 (avg. 28)
Arabian Gulf 40–44 (avg. 42) 22–35 (avg. 26)
Mediterranean 38–41 (avg. 40) 16–28 (avg. 24)
Caribbean Sea 34–38 (avg. 36) 16–35 (avg. 26)
Indian Ocean 33–37 (avg. 35) 25–30 (avg. 28)
Pacific and Atlantic oceans 33–36 (avg. 34) 9–26 (avg. 18)
Source: World Bank 2017a. Note: Seawater TDS and temperature may be outside the table ranges for specific locations. ppt = parts per thousand; TDS = total dissolved solids.
FIGURE 5.1. Optimum Size of Individual Seawater Reverse Osmosis Plants Is between 100 Million Liters per Day and 200 Million Liters per Day
Source: Voutchkov 2018.
072 100
Desalination plant capacity, million liters per day
Unit
cost
, US$
/m3
150 178 240 309 400 600 800 1,000
0.20.40.60.81.01.21.41.61.82.0
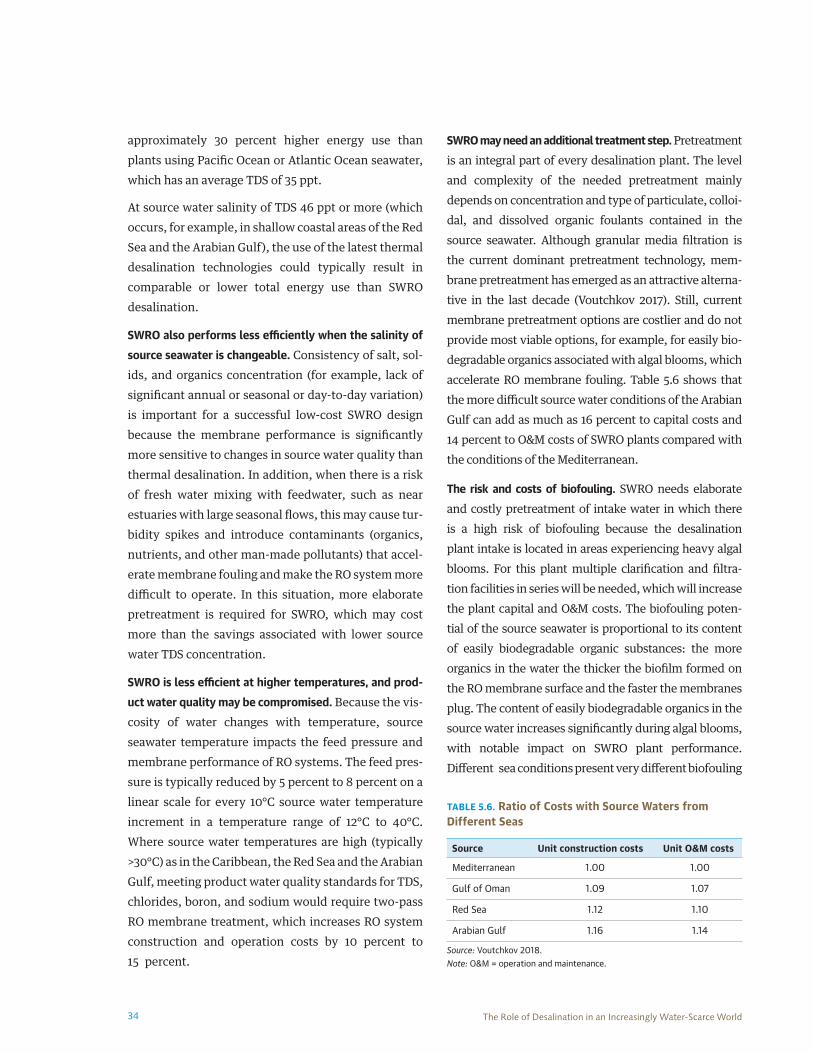
34 The Role of Desalination in an Increasingly Water-Scarce World
approximately 30 percent higher energy use than plants using Pacific Ocean or Atlantic Ocean seawater, which has an average TDS of 35 ppt.
At source water salinity of TDS 46 ppt or more (which occurs, for example, in shallow coastal areas of the Red Sea and the Arabian Gulf), the use of the latest thermal desalination technologies could typically result in comparable or lower total energy use than SWRO desalination.
SWRO also performs less efficiently when the salinity of source seawater is changeable. Consistency of salt, sol-ids, and organics concentration (for example, lack of significant annual or seasonal or day-to-day variation) is important for a successful low-cost SWRO design because the membrane performance is significantly more sensitive to changes in source water quality than thermal desalination. In addition, when there is a risk of fresh water mixing with feedwater, such as near estuaries with large seasonal flows, this may cause tur-bidity spikes and introduce contaminants (organics, nutrients, and other man-made pollutants) that accel-erate membrane fouling and make the RO system more difficult to operate. In this situation, more elaborate pretreatment is required for SWRO, which may cost more than the savings associated with lower source water TDS concentration.
SWRO is less efficient at higher temperatures, and prod-uct water quality may be compromised. Because the vis-cosity of water changes with temperature, source seawater temperature impacts the feed pressure and membrane performance of RO systems. The feed pres-sure is typically reduced by 5 percent to 8 percent on a linear scale for every 10°C source water temperature increment in a temperature range of 12°C to 40°C. Where source water temperatures are high (typically >30°C) as in the Caribbean, the Red Sea and the Arabian Gulf, meeting product water quality standards for TDS, chlorides, boron, and sodium would require two-pass RO membrane treatment, which increases RO system construction and operation costs by 10 percent to 15 percent.
SWRO may need an additional treatment step. Pretreatment is an integral part of every desalination plant. The level and complexity of the needed pretreatment mainly depends on concentration and type of particulate, colloi-dal, and dissolved organic foulants contained in the source seawater. Although granular media filtration is the current dominant pretreatment technology, mem-brane pretreatment has emerged as an attractive alterna-tive in the last decade (Voutchkov 2017). Still, current membrane pretreatment options are costlier and do not provide most viable options, for example, for easily bio-degradable organics associated with algal blooms, which accelerate RO membrane fouling. Table 5.6 shows that the more difficult source water conditions of the Arabian Gulf can add as much as 16 percent to capital costs and 14 percent to O&M costs of SWRO plants compared with the conditions of the Mediterranean.
The risk and costs of biofouling. SWRO needs elaborate and costly pretreatment of intake water in which there is a high risk of biofouling because the desalination plant intake is located in areas experiencing heavy algal blooms. For this plant multiple clarification and filtra-tion facilities in series will be needed, which will increase the plant capital and O&M costs. The biofouling poten-tial of the source seawater is proportional to its content of easily biodegradable organic substances: the more organics in the water the thicker the biofilm formed on the RO membrane surface and the faster the membranes plug. The content of easily biodegradable organics in the source water increases significantly during algal blooms, with notable impact on SWRO plant performance. Different sea conditions present very different biofouling
TABLE 5.6. Ratio of Costs with Source Waters from Different Seas
Source Unit construction costs Unit O&M costs
Mediterranean 1.00 1.00
Gulf of Oman 1.09 1.07
Red Sea 1.12 1.10
Arabian Gulf 1.16 1.14
Source: Voutchkov 2018. Note: O&M = operation and maintenance.

35The Role of Desalination in an Increasingly Water-Scarce World
risks (see box 5.1). For example, the shallow coastal areas of the Arabian Gulf and the Red Sea are significantly more prone to frequent occurrence of heavy algal blooms; therefore, they usually require more sophisticated and costly pretreatment of the source seawater than the SWRO desalination plants located in the Mediterranean.
In contrast, the Arabian Gulf is warmer and more prone to algal blooms. Higher salinity, boron content, and biofouling risk are the main factors driving up costs of SWRO in this region, making thermal technologies more competitive. In the Arabian Gulf, the total cost of water production by SWRO varies from 96 cents per cubic meter to 192 cents per cubic meter and averages 135 cents per cubic meter. This is higher than in the Mediterranean, largely because the seawater in the Arabian Gulf has higher salinity and boron content and significantly higher biofouling poten-tial. These challenges have prompted the need for the construction of multistep pretreatment processes. The higher fouling potential makes it necessary to install a more complex and costly intake, a pretreatment system, and more RO membranes. The resulting higher costs combined with other local conditions make thermal technologies very cost-competitive.
Target Product Water Quality
Thermal desalination technologies produce water with lower salt, boron, and bromide levels than SWRO. Drinking water regulations worldwide usually require that potable water has TDS below 500 parts per million (ppm) and concentration of chlorides below 250 milligrams per liter. In addition, based on the latest World Health Organization (WHO) water quality guidelines, boron levels in desali-nated water should be reduced to less than 2.4 milligrams per liter (WHO 2011). Some countries have stricter regula-tions: Israel, for example, requires the TDS and chloride levels of desalinated water to be below 100 milligrams per liter and 50 milligrams per liter, respectively. Thermal desalination plants, regardless of their technology or configuration, produce consistently higher quality prod-uct water with TDS of 50 milligram per liter or less and minimal boron and bromide levels.
SWRO product water is typically of higher mineral content and the RO system may need to be enhanced, which increases costs. SWRO systems generally produce desali-nated water of TDS and boron content several times higher than that produced by thermal desalination plants. Although product water typically meets national
BOX 5.1. Biofouling
Biofouling is defined as the adhesion, growth of bacteria present in the water, and formation of biofilm on the membrane surface that plugs the pretreatment and RO membranes of desalination plants. Biofouling has been shown to have a negative impact on the operation of SWRO plants. The main consequences observed are decreased membrane freshwater productivity, increased pollutants passage through the membranes, and increased loss of pressure across the membrane system. The biofilm thickness increases over time plugging the membranes to the point in which they have to be cleaned to continue producing fresh water. Preventative measures to alleviate biofouling in the desalination industry are estimated to cost approximately US$15 billion a year worldwide.
For example, the intake for the SWRO desalination project in Jorf Lasfar, Morocco, is located in an industrial port area with a very high content of organics and frequent occurrence of heavy algal blooms and biofouling. The plant incorporates a two-step pretreatment system, and a very conservatively designed two-pass SWRO desalination system. As a result, the cost of water production of this plant is much higher than the average for SWRO plants, and it is comparable to that of MED-TVC plants of similar size. Source: Emmanuelle and others 2015.

36 The Role of Desalination in an Increasingly Water-Scarce World
standards, higher product quality may be required. This has a major influence on the SWRO system configura-tion. For source water qualities with higher salinity and other impurities, additional system configuration of two stages and often two passes are required to achieve good quality product water, which increases costs (see table 5.7). Plants incorporating two sets of RO systems in sequence are more expensive to build and operate than single-pass SWRO plants:
• The capital cost increase associated with the instal-lation of partial or full second RO pass is typically in the range of 10 percent to 25 percent of the total cost of the first-pass SWRO system.
• The additional O&M costs associated with the operation of a second pass system vary between 3 percent and 10 percent of the O&M costs of the first pass.
Almost all SWRO desalination plants before 2010 were built as two-pass RO systems because of the very strin-gent boron content limit in drinking water of 0.5 milli-grams per litre established by the WHO and adopted by the regulatory bodies of a large number of countries.7 In 2011, the WHO issued new Guidelines for Drinking Water Quality (WHO 2011), which relaxed the boron limit to 2.4 milligrams per liter. These new guidelines were adopted in the drinking water regulations of many countries.8 As a result, some of the new SWRO desalination plants built in the Middle East after 2011 do not have second-pass SWRO systems, or if a sec-ond-pass RO system has been installed, it may not be operated.
Still, local requirements for water of higher purity than typical minimum standards (TDS 500 mg/L, chloride 250 mg/L, boron 1 mg/L, and bromide 0.8 mg/L) will have an impact on both capital and O&M costs. At the limit, producing water to the highest standards (TDS 30 mg/L, chloride 10 mg/L, boron 0.3 mg/L, and bro-mide 0.1 mg/L) could increase costs by up to half (see table 5.7).
In any case, desalinated water needs anticorrosion treat-ment and disinfection before distribution. Desalinated product water must meet all local water standards before it is distributed to the community. Common treatment of desalinated water that exits the RO or thermal desalination facilities includes pH adjust-ment, remineralization, and disinfection. Desalinated water is typically soft and corrosive and needs treat-ment to make it harder and more alkaline. It is always treated with calcium-based compounds like lime or calcite for hardness and with chemicals such as carbon dioxide, which add alkalinity to protect the water dis-tribution system against corrosion. In addition, desali-nated water is usually chlorinated for disinfection.
TABLE 5.7. Effect of Target Product Water Quality on Costs (Ratio)
Target Product Water Qualíty
Construction Costs
O&M Costs
Cost of Water
Single-Pass RO System
TDS = 500 mg/LChloride = 250 mg/LBoron = 1 mg/LBromide = 0.8 mg/L
1.00 1.00 1.00
Partial Second-Pass RO System
TDS = 250 mg/LChloride = 100 mg/LBoron = 0.75 mg/LBromide = 0.5 mg/L
1.15–1.25 1.05–1.10 1. 10–1.18
Full Two-Pass RO System
TDS = 100 mg/LChloride = 50 mg/LBoron = 0.5 mg/LBromide = 0.2 mg/L
1.27–1.38 1.18–1.25 1.23–1.32
Full Two-Pass RO System + IX
TDS = 30 mg/LChloride = 10 mg/LBoron = 0.3 mg/LBromide = 0.1 mg/L
1. 40–1.55 1.32–1.45 1.36–1.50
Source: Voutchkov 2018. Note: The four levels of quality in table 5.7 correspond to four levels of treatment: (1) single-pass RO, (2) partial second-pass RO, (3) full two-pass RO, and (4) full two-pass RO + IX. IX = ion exchange; O&M = operation and maintenance; TDS = total dissolved solids.

37The Role of Desalination in an Increasingly Water-Scarce World
Environmental Impacts and the Effect of Regulation
Desalination and the Environment
There are direct and indirect impacts of desalination on the environment that are typically subject to regulation. Direct environmental impacts stem largely from the intake and concentrate discharge processes. The main direct envi-ronmental impact on the marine environment is caused by (1) intake and outlet facilities and (2) elevated content of salinity, temperature, and residual treatment chemi-cals in the plant discharge. The indirect environmental impact of desalination plant operations is the relatively high carbon footprint when heat or electricity produced by conventional fossil-fuel generation is used. Environmental compliance requirements and costs are specific to the choice of technology and site and vary according to the national regulatory regime.
Intake-Related Environmental Impacts and Regulatory Requirements
The main environmental impact at the intake is the effect on aquatic organisms. Seawater contains a host of aquatic organisms, such as algae, plankton, fish, bacteria, and so forth. Where large quantities of water are removed for desalination, the intakes will affect these organisms by one of three processes: impingement, in which larger organisms are trapped against the intake screens by the force of the flow; entrainment, in which organisms are
sucked right into the treatment facilities; and entrap-ment, in which organisms get into the offshore intake and cannot swim back out of it. These intakes have a greater affect than freshwater intakes because the vol-umes of water taken in are double or more.
When these impacts are the subject of regulation, costly mitigation investments may be required. Only a few countries have regulatory requirements specifically controlling the operation of seawater intakes for desali-nation plants (Mickley 2016) but when there are regu-lations, these can add significantly to costs.9 For example, in May 2015, California introduced regula-tions to mitigate the environmental impacts of seawa-ter desalination plant intakes and outfalls, requiring either the use of subsurface wells as intakes (WRA 2011a, b10 or compensation with constructed wetlands (SWRCB 2015).
These regulations are projected to increase the cost of desalinated water in California (see box 5.2). Commonly used alternatives are designed to reduce the entrance velocity or to install screens, both of which will reduce the impingement of aquatic organisms.11
Saline Concentrate (Brine) Disposal and Plant Location
Brine has elevated salinity concentration and requires careful management. Desalination processes produce large quantities of brine, which in the case of thermal
BOX 5.2. Environmental Compliance Can Make Desalination More Expensive
The California Coastal Commission required the largest desalination project in California (the 200-MLD Carlsbad SWRO plant) to implement an intake impingement and entrainment mitigation program. This program requires the owner of the plant to construct 64 acres of coastal wetlands with the aim of creating a marine habitat and ecosystem comparable to that likely to be affected by the plant intake operations at maximum plant freshwater production.
The expenditures for this “intake impact mitigation project” increased the total project capital costs by 5.3 percent (US$28 million) and the annual O&M costs by 4.5 percent (US$2.5 million per year).Source: SWRCB 2015. Note: O&M = operation and maintenance; SWRO = seawater reverse osmosis.

38 The Role of Desalination in an Increasingly Water-Scarce World
desalination plants could also have higher tempera-ture than ambient ocean water. Brine contains not only salts but also some residuals from the pretreatment and cleaning chemicals, together with heavy metals caused by corrosion. Brine is denser than seawater; therefore, it sinks to the ocean bottom. If brine is not properly diluted by natural surf or current conditions or by special outfall diffusers, it could damage the eco-system in the vicinity of the discharge.
Careful reintroduction is needed to minimize harm. Typical ocean conditions allow for rapid dilution, minimizing potential environmental impacts. In addition, brine can be diluted before release, for exam-ple, with another stream of water entering the ocean, such as the outfall of a wastewater treatment or power plant. Where desalination and power plants are colo-cated, the power plant’s cooling water flow is likely to be several times larger than that of the desalination plant, reducing the salinity of the combination.
Another method to dilute the brine is to mix it via a diffuser in a mixing zone. For example, once a pipeline containing the brine reaches the seafloor, it can be dis-charged via many orifices of a long pipe (diffusers) to minimize the concentrated impact of the brine on the discharge area.
The challenge of brine is different for thermal technol-ogy and for SWRO. Thermal technologies produce a much greater volume of brine than RO because they typically use twice as much seawater (or four times as much brackish water) to produce the same quantity of fresh water. Brine from thermal plants is hotter, but the concentration of TDS is lower. The greater volumes of intake water and brine effluent from thermal plants make siting them near the sea a near-imperative.
Discharges from SWRO plants are more concentrated and require more elaborate processing. SWRO plants dis-charge less brine, but the concentration of salinity is higher and the effluent may also contain the chemicals added along the process (for pretreatment and mem-brane cleaning), unless such chemicals are treated
prior to their discharge, or discharged to the sanitary sewer, which is commonly practiced in all SWRO plants worldwide built over the past 20 years. The smaller quantity of brine means that RO site requirements are less onerous, and this strengthens the value of this technology for brackish water desalination. Indeed, RO functions more efficiently inland using brackish source water provided that disposal of waste brine can be managed in an environmentally acceptable way.
Brine Discharge and Regulatory Requirements
Providing for environmentally sound disposal of brine concentrate can be expensive. Currently, the most com-monly used methods of concentrate management are surface water discharge to the ocean, discharge to san-itary sewer, and subsurface discharge. Concentrate disposal requirements may have a measurable impact on both capital and operating costs. Figure 5.2 shows typical RO plant discharge components. Each compo-nent has various characteristics (salinity, temperature, chemicals, and so forth) that have environmental implications.
Environmental impacts and cost of compliance vary largely with desalination technology, regulatory require-ments, and conditions on-site. Tables 5.8 and 5.9 show the construction cost of the most commonly used con-centrate disposal methods and their characteristics. Discharge of brine to sanitary sewers or exfiltration wells is typically practiced for small-size desalination plants only. Larger plants typically discharge concen-trate to surface water by one of three techniques: (1) direct discharge through new outfalls, (2) discharge through existing wastewater treatment plant outfalls, or (3) discharge through existing power plant outfalls. “Co-disposal” through existing outfalls is the cheap-est. For inland desalination plants, concentrate disposal is a challenge and can prove a significant ele-ment of costs.
Most countries have a regulatory framework, but it has often proved difficult to enforce in practice. Regulations usually require reduction of the salinity of the

39The Role of Desalination in an Increasingly Water-Scarce World
From sea
Toward sea
Pretreatment
RO unit
Permeate
Backwash waterfrom lters
1
Pretreated water todrain until reachingrequired qualities
2
Concentrate3
Rinsing water4
Permeate to drain untilconductivity required is reached
5
1 2 3 4 5
FIGURE 5.2. Typical Discharge Components of a Seawater Reverse Osmosis Seawater Desalination Plant
Source: Reproduced from WRA 2011c.Note: RO = reverse osmosis.
TABLE 5.8. Concentrate Disposal Method and Construction Cost
Concentrate disposal method Disposal construction cost (US$/m3/day)
New surface discharge (new outfall with diffusion) 50–750
Colocation of desalination plant and power plant discharge 10–30
Codisposal with wastewater treatment plant discharge 30–150
Sanitary sewer discharge 5–150
Deep/ Beach well injection 200–625
Evaporation ponds 300–4,500
Spray irrigation 200–1,000
Zero liquid discharge 1,500–5,000
Source: Voutchkov 2018; World Bank 2012; Christos Charisiadis 2018.
TABLE 5.9. Concentrate Management Methods and Challenges
Disposal method Use Cost Typical permit requirements (U.S. example)
Surface water discharge Most common Lowest Permit from National Pollutant Discharge Elimination System
Sewer discharge Most challenging aspect is volume Low cost in smallvolumes
Permission from receiving wastewater treatment facility
Land application Percolation pond, irrigation, rapid infiltration system
Higher Meet state regulations
Deep well injection Limited by suitable geography Highest EPA underground injection control program
Evaporation pond Warm, dry areas with flat terrain Viable with low land costs Meet state regulations
Zero liquid discharge Landfill disposal Higher Meet landfill disposal requirements
Source: Khan and others 2009. Note: EPA = Environmental Protection Agency.

40 The Role of Desalination in an Increasingly Water-Scarce World
discharge within a short distance of the outfall, for example, to less than 10 percent of ambient salinity within 300 meters from the point of discharge. In practice, in most desalination projects, the salinity reduction target is reached within just 50 to 100 meters from the point of discharge to the sea. Environmental regulations also require compliance with temperature and chemical contents of brine dis-charges (Letterman and Hopner 2008). Regulatory requirements are usually sound, but their enforce-ment is often difficult (although see box 5.3). Monitoring and ensuring compliance involves costs, and in many instances regulatory agencies do not have an adequate amount of funds to enforce project compliance with the applicable regulatory require-ments (Dawoud 2012).
Energy Use in Desalination and First Steps toward Using Renewable Energy
Energy Consumption
Energy consumption in desalination is high but has been declining. Energy consumed in commercial seawater desalination, including prefiltering and ancillaries, ranges from a minimum of 2.55.5 kWh/m3 for SWRO to a maximum of 9.0 kWh/m3 to 12.5 kWh/m3 for MSF technology (see table 5.10). In specific circumstances, energy consumed under 2 kWh/m3 has been achieved with RO membrane technology processing seawaters with salinity of 35 ppt or less.
Although desalination uses considerable amount of energy, it is not excessive compared with other energy
uses in modern economies; often it is less energy intensive than water transfers.12 Even the lowest energy- consuming desalination technology requires more than 10 times the energy than if freshwater supplies were used; these typically require 0.2 kWh/m3 or less. However, the energy requirement of desalination may be no greater than the energy consumption of freshwa-ter supplies transported over long distances or pumped up to considerable elevations (see the section “Effect of Location on Costs.”). At the limit, supplying all U.S. domestic water by desalination would increase domes-tic energy consumption by around 10 percent, which is just about the amount of energy used by domestic refrigerators.
Energy Requirements of the Different Technologies
Energy costs represent up to half of total operating costs of thermal technology, although there are
TABLE 5.10. Energy Consumption of Seawater Desalination Methodsa
Desalination method MSF MED-TVC SWRO
Electrical energy (kWh/m3) 3.4–4.5 1.5–2.5 2.5–5.5
Electrical equivalent of thermal energy (kWh/m3)
5.6–8.0 4.0–5.5 None
Total equivalent electrical energy (kWh/m3)
9.0–12.5 5.5–8.0 2.5–5.5
Source: Younes and others 2015; World Bank 2012; US DOE 2017; Voutchkov 2018.Note: MED-TVC = multieffect distillation with thermal vapor compression; MSF = multistage flash distillation; SWRO = seawater reverse osmosis.a. “Electrical equivalent” refers to the amount of electrical energy that could be generated using a given quantity of thermal energy and appro-priate turbine generator. These calculations do not include the energy required to construct or refurbish items consumed in the process.
BOX 5.3. Environmental Conditions on the Perth Seawater Desalination Plant
As a condition of its operation, the Perth plant has a comprehensive environmental monitoring program, measuring the seawater intake and brine outfall. In early 2008, the plant was shut down on two occasions because of reduced dissolved oxygen levels in Cockburn Sound.Source: Wikivisually 2018.

41The Role of Desalination in an Increasingly Water-Scarce World
FIGURE 5.3. Reduction in Multistage Flash Distillation Desalination Cost, 1955–2005
Source: Zhou and Tol 2005.
12
9
6
3
01955 1965 1975 1985
Year
Unit
cost
($/m
3 )
1995 2005
opportunities for further reduction. Despite rapid advances in technology in recent years, thermal desalination remains an energy-intensive process (see the section “Analysis of Cost Differences between Technologies” and table 5.2). Although energy costs have been falling, they still represent one-third to one-half of total costs. Although the development of MSF technology has significantly lowered the unit cost of water over the last 50 years (see figure 5.3), as discussed in previous sections, there are further opportunities for energy cost reductions in both the MSF and MED processes through the increased recov-ery of energy from the brine stream. For SWRO plants, energy consumption has dropped far and fast. Since the 1970s, continuous innovation in RO technology in pretreatment, filter design, and energy recovery has reduced the energy consumption per unit of water by a factor of 10 (see figure 5.4). However, further large reductions are unlikely because RO energy consump-tion in the newest plants (as low as 1.8 kWh/m3)
compared with the historic range of 3 kWh/m3 to 5.5 kWh/m3 is now approaching the “theoretical min-imum energy consumption for seawater desalina-tion” (Elimelech and Philip 2011).13
Further energy is required in SWRO for intake, pre-treatment, posttreatment, and brine discharge. In most cases, this represents more than 1 kWh/m3. Here too there have been significant energy savings. Since the 1990s, innovation just in pretreatment, filter design, and energy recovery has reduced total RO energy consumption per unit of water by 75 percent.
Renewable Energy
The present limited use of RE for desalination is set to expand. Given the worldwide concern to reduce emis-sions and to pursue the Paris Climate Agreement and the 2030 Sustainable Development Agenda, RE-based desalination offers an opportunity to reduce environ-mental impacts through innovative technology.14
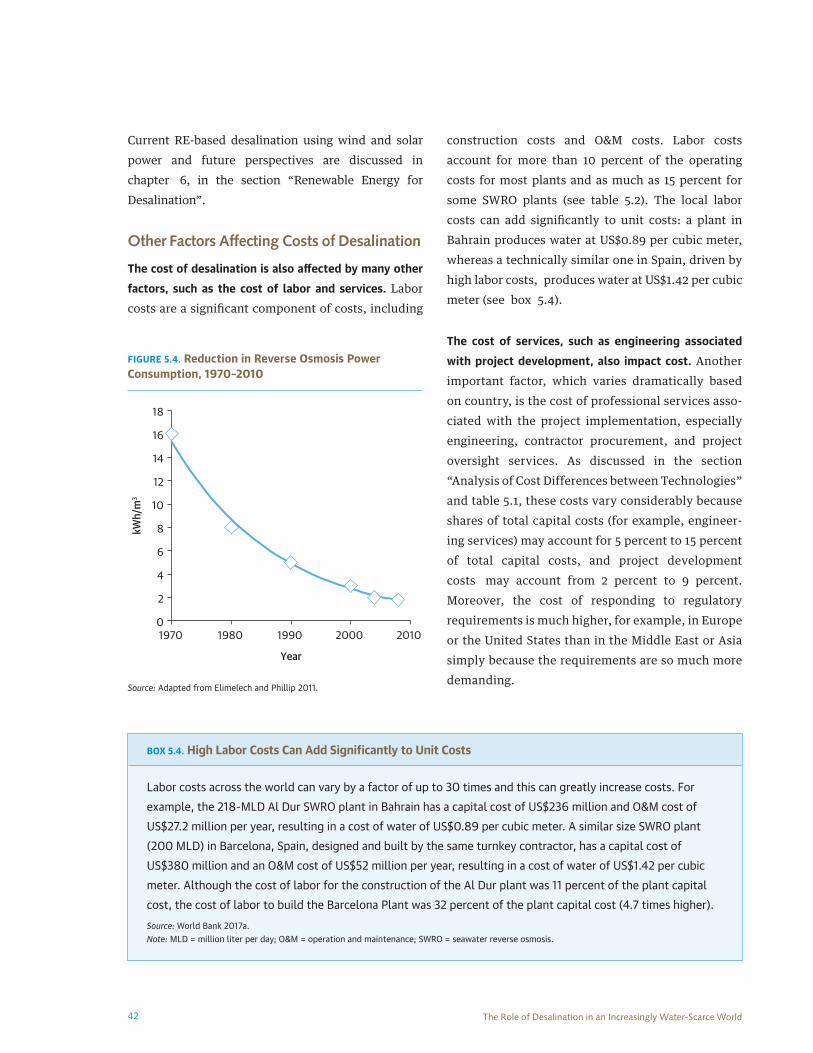
42 The Role of Desalination in an Increasingly Water-Scarce World
Current RE-based desalination using wind and solar power and future perspectives are discussed in chapter 6, in the section “Renewable Energy for Desalination”.
Other Factors Affecting Costs of Desalination
The cost of desalination is also affected by many other factors, such as the cost of labor and services. Labor costs are a significant component of costs, including
construction costs and O&M costs. Labor costs account for more than 10 percent of the operating costs for most plants and as much as 15 percent for some SWRO plants (see table 5.2). The local labor costs can add significantly to unit costs: a plant in Bahrain produces water at US$0.89 per cubic meter, whereas a technically similar one in Spain, driven by high labor costs, produces water at US$1.42 per cubic meter (see box 5.4).
The cost of services, such as engineering associated with project development, also impact cost. Another important factor, which varies dramatically based on country, is the cost of professional services asso-ciated with the project implementation, especially engineering, contractor procurement, and project oversight services. As discussed in the section “Analysis of Cost Differences between Technologies” and table 5.1, these costs vary considerably because shares of total capital costs (for example, engineer-ing services) may account for 5 percent to 15 percent of total capital costs, and project development costs may account from 2 percent to 9 percent. Moreover, the cost of responding to regulatory requirements is much higher, for example, in Europe or the United States than in the Middle East or Asia simply because the requirements are so much more demanding.
BOX 5.4. High Labor Costs Can Add Significantly to Unit Costs
Labor costs across the world can vary by a factor of up to 30 times and this can greatly increase costs. For example, the 218-MLD Al Dur SWRO plant in Bahrain has a capital cost of US$236 million and O&M cost of US$27.2 million per year, resulting in a cost of water of US$0.89 per cubic meter. A similar size SWRO plant (200 MLD) in Barcelona, Spain, designed and built by the same turnkey contractor, has a capital cost of US$380 million and an O&M cost of US$52 million per year, resulting in a cost of water of US$1.42 per cubic meter. Although the cost of labor for the construction of the Al Dur plant was 11 percent of the plant capital cost, the cost of labor to build the Barcelona Plant was 32 percent of the plant capital cost (4.7 times higher). Source: World Bank 2017a.Note: MLD = million liter per day; O&M = operation and maintenance; SWRO = seawater reverse osmosis.
0
2
4
6
8
10
12
14
16
18
1970 1980 1990 2000 2010
kWh/
m3
Year
FIGURE 5.4. Reduction in Reverse Osmosis Power Consumption, 1970–2010
Source: Adapted from Elimelech and Phillip 2011.

43The Role of Desalination in an Increasingly Water-Scarce World
Project financing and delivery methods also influence the cost of desalination. Large infrastructure projects are expensive by their nature and prone to various risks that, if manifested, may affect their ability to achieve the intended outcomes, their performance, and cause delays and cost overruns, which in turn may affect the economic and financial viability of the project. Better understanding of project risk- reward profiles and their allocations to entities that can bet-ter manage them is important. This requires experi-ence from the project promoters and governments and from the professionals involved. Where there is experience on both sides, more competent contract administration and execution lower the need for oversight. It is reported, for example, that the total engineering oversight costs for the Sorek desalination project in Israel were 50 times lower than for a similar-size SWRO plant in Melbourne, Australia. This is, in part, attributed to Israel’s long experience and considerable competence, both on the owner’s side, with extensive government experience and expertise in developing, financing, and regulating desalination projects, and on the project delivery side, with extremely experienced engineers and contractors.
More nontechnical factors affecting desalination cost, such as project financing and procurement mechanisms, are detailed in chapter 7.
Comparison of Costs and Other Factors Affecting Choice of Desalination Technologies
Key Advantages to Seawater Reverse Osmosis
In less saline environments, SWRO is the most compet-itive technology (see table 5.11).15 Most of the medium- and large-size desalination projects constructed in the Mediterranean over the past 15 years use SWRO tech-nology. Depending on site-specific conditions, particu-larly salinity and biofouling potential, and also depending on choices made within the varying regula-tory and business environments, these projects can have the lowest costs of desalinated water production worldwide. The lowest cost of water production for any plant in the sample, the Sorek SWRO plant in Israel, is US$0.64 per cubic meter, and the lowest cost for an SWRO plant in the Pacific is US$0.88 per cubic meter. Whereas the lowest costs of production per cubic meter for the MSF and MED plants in the sample are more than US$1.00 per cubic meter.
TABLE 5.11. Summary of Worldwide Seawater Desalination Costs
Desalination method
Capital costs
(million US$/MLD)O&M costs (US$/m3) Cost of water production (US$m3)
Range Average Range Average Range Average
MSF 1.7–3.1 2.1 0.22–0.30 0.26 1.02–1.74 1.44
MED-TVC 1.2–2.3 1.4 0.11–0.25 0.14 1.12–1.50 1.39
SWRO Mediterranean Sea 0.8–2.2 1.2 0.25–0.74 0.35 0.64–1.62 0.98
SWRO Arabian Gulf 1.2–1.8 1.5 0.36–1.01 0.64 0.96–1.92 1.35
SWRO Red Sea 1.2–2.3 1.5 0.41–0.96 0.51 1.14–1.70 1.38
SWRO Atlantic and Pacific oceans
1.3–7.6 4.1 0.17–0.41 0.21 0.88–2.86 1.82
Hybrid MSF/MED 1.5–2.2 1.8 0.14–0.25 0.23 0.95–1.37 1.15
SWRO 1.2–2.4 1.3 0.29–0.44 0.35 0.85–1.12 1.03
Note: MED-TVC = multieffect distillation with thermal vapor compression; MLD = million liters per day; MSF = multistage flash distillation; O&M = operation and maintenance; SWRO = seawater reverse osmosis.

44 The Role of Desalination in an Increasingly Water-Scarce World
SWRO is more adaptable to local circumstances because it is scalable. SWRO plants typically consist of a several dozen units. As a result, plant size can be expanded incrementally by adding more units as needed to meet growing demand. Production can also be varied to meet short-term shifts in demand by bringing only those units required into operation, whereas MED and MSF processes can only work at full capacity.
Also, costs decline significantly when RO units are treating lower salinity or brackish water because less energy is required. In contrast, thermal distillation processes need the same amount of energy regard-less of salinity, which makes them more efficient at higher levels of salinity and less efficient at lower levels.
Higher water recovery rates and lower costs for anti-scalants also make SWRO a cost-effective technology. SWRO has a higher water recovery ratio of 40 per-cent to 60 percent, compared with 20 percent to 30 percent for MSF and 25 percent to 40 percent for MED. This has significant implications for overall desalination cost because structures for SWRO are smaller and pumping costs are lower. Because SWRO operates at much lower temperatures than thermal technology, scaling is much lower; therefore, the quantity of antiscalant chemicals required is consid-erably lower.
Some drawbacks of thermal technologies make them costlier than SWRO. Both MSF and MED require highly corrosion-resistant and costly materials like titanium for the heat exchangers, whereas the RO membranes are made of composite polymers, which are relatively less expensive. Also, heating large amounts of seawater in the thermal processes creates scaling (see the section “Feedwater Quality”). Large quantities of antiscalant chemicals are needed, which increases costs.
Energy costs are also significantly higher for thermal technologies. MSF/MED processes are very energy
intensive (see the section “Energy Use in Desalination and First Steps toward Using Renewable Energy”), cre-ating challenges as energy costs rise and environmen-tal concerns grow. The thermal processes also consume both thermal and electric power so that usually power plants must be colocated with the MSF or MED plants.
Thermal Technologies Also Have Some Advantages
Thermal technologies may be more cost-effective when the raw water is highly saline or very warm. SWRO is sensitive to salinity and water temperature, whereas thermal technologies are not (see the sec-tion “Feedwater Quality”). In conditions of high salinity and warmer waters, thermal technologies may have a cost advantage.
Economies of scale increase consistently for thermal plants but taper off at higher capacities for SWRO plants. Economies of scale (see the section “Plant Size and Economies of Scale.”) increase consistently for thermal plants. MSF and MED technologies, which have been in development and use far longer, have been constantly improved over the last half century and are available in a greater variety of sizes, with economies of scale maintained in practically all unit sizes.
For SWRO plants, economies of scale are higher than for thermal technology up to 100 MLD but taper off at higher capacities because of their modular nature. Between 100 MLD and 400 MLD, the rate of economy of scale diminishes significantly, and greater than 400 MLD there are minimal economy of scale benefits with SWRO plants.
Although the combined energy requirements of thermal technologies are greater than those of membrane tech-nologies, thermal processes, particularly MED, use much less electrical energy than SWRO. Although its total energy requirement is much higher, MED requires only about one-third or less (20 percent to 33 percent) of the

45The Role of Desalination in an Increasingly Water-Scarce World
electrical energy required for SWRO. The balance of the energy requirement of thermal processes comes from thermal sources, which is a cost advantage, for example, when waste or low-grade heat is available, such as in the cogeneration facilities mentioned previ-ously.16 This can significantly improve the economics of thermal desalination.
In more saline environments and when biofouling is a considerable risk, thermal technologies are compet-itive. The cost of water production by thermal desali-nation (MSF and MED) is not sensitive to source water quality, which makes this type of technology very competitive for production of drinking water in more saline environments with higher biofouling potential, such as the Arabian Gulf and the Red Sea.
Choosing between Multistage Flash Distillation and Multieffect Distillation
MSF technology has a higher capital cost, but it is easier to operate and offers better economies of scale. MSF evaporation is the most expensive desalination tech-nology in terms of capital investment but it is also the most mature. It is easiest to operate and yields higher economy of scale benefits for mega-size projects (for example, projects of 500 MLD or more) than RO mem-brane separation in conditions in which source seawa-ter is of very high salinity and there is high risk of membrane biofouling.
MED technology is more competitive at a smaller scale. When thermal technology is indicated by high salinity and high biofouling potential but the need is for a small-size or medium-size desalination project, MED technol-ogy is more competitive than MSF evaporation.
MED also has some advantages over MSF and has the potential to reduce costs and would benefit from RE. Because MED operates at lower temperatures than MSF its performance ratio (output per unit of steam) is higher (15 units of desalinated water per unit of steam against 11 units for MSF). MED also has significant
potential for cost reduction (see chapter 6). In particu-lar, MED/SWRO and MED/SWRO hybrid systems have great potential with thermal RE, such as thermal solar, geothermal, solar ponds, or alternative nuclear energy.
When Hybrids May Be the Best Option
For high salinity waters when there is also high bio-fouling potential, hybrid projects are more competi-tive than either thermal or SWRO alone. For high salinity, high biofouling potential water conditions (such as those of the Red Sea and the Arabian Gulf), hybrid desalination projects, which produce a portion (typically two-thirds) of their drinking water by thermal evaporation and the rest (typically one-third) by SWRO desalination, are more competitive than the construction of thermal and SWRO desali-nation projects alone. This competitive edge is the reason for the construction of a large number of new hybrid desalination projects in the Arabian Gulf in recent years (see the section “Cost of Hybrid Desalination Projects”).
Key Benefits of Commonly Used Desalination Methods
As discussed previously, each desalination method has its advantages and disadvantages. Table 5.12 pro-vides a summary of those key benefits. For decision making in terms of choice of desalination method, it is important to assess the specific circumstances of a given situation from different angles before making a decision.
Figure 5.5 provides a summary of desalination grouped by desalination type or configuration, user, and cost component. Although desalination is used to meet various water demands, the majority, as indicated in previous sections, is for municipal and industrial uses (about 89 percent), followed by power plants (6 percent) and irrigation and tourism (2 percent each). In terms of cost, overall, MSF is more expensive than MED and SWRO, and SWRO is cheaper than MED.

46 The Role of Desalination in an Increasingly Water-Scarce World
BOX 5.5. Desalination Plant Land Requirements
Figures in table B5.5.1 could be used for initial planning of both thermal and SWRO desalination projects. However, it should be noted that in general thermal desalination plants would require 10 percent to 15 percent less land than SWRO desalination plants of the same freshwater production capacity, mainly because of their simplified pretreatment facilities.
TABLE B5.5.1. Typical Land Requirement as a Function of Plant Size
Plant capacity (m3/day)Typical plant site land
requirements (m2)Plant capacity (m3/day)
Typical plant site land requirements (m2)
1,000 800–1,600 40,000 18,200–24,300
5,000 2,500–3,200 100,000 26,300–34,400
10,000 4,500–6,100 200,000 36,400–48,600
20,000 10,100–14,200 300,000 58,700–83,000
Sources: Voutchkov 2017a; World Bank 2012. Note: Land requirements based on conventional plant layout. Compact plants may require less land.
TABLE 5.12. Key Advantages and Disadvantages of Different Desalination Methods
Desalination method
Key advantages Key disadvantages
MSF • Easiest to operate• Generally, requires less land (see box 5.5) • Lowest O&M costs• More cost-effective than RO for seawater with TDS > 46 ppt• Low TDS and boron product water quality• Source water quality has limited impact on performance
• Highest energy use • Highest thermal discharge footprint• Low recovery ratio
MED-TVC • Lower energy demand than MSF• Uses less chemicals than MSF and RO• Cost of water comparable to RO for large plants• Low TDS and boron product water
• More complex to operate than MSF• Higher energy use than RO• Low recovery ratio
SWRO • No need for steam• Lowest total energy use• Lowest capital and water production costs• Discharge does not create thermal pollution• Higher recovery ratio
• Highest O&M costs• Most complex operation• Reliability is sensitive to source water quality
Hybrid • Lower capital costs• Lowest RO energy use• Lowest RO production cost• Second-pass RO system not needed
• Most complex desalination plant configuration
Source: World Bank 2012; Voutchkov 2018.Note: MED-TVC = multieffect distillation with thermal vapor concentration; MSF = multistage flash distillation; O&M = operation and maintenance; ppt = parts per thousand; RO = reverse osmosis; SWRO = seawater reverse osmosis; TDS = total dissolved solids.

47The Role of Desalination in an Increasingly Water-Scarce World
a. By technology/configuration
RO63%
MSF23%
MED8%
ED3%
Hybrid3%
b. By user
Municipal63%
Industrial26%
Powerplants6%
Irrigation2%
Tourism2% Military
1%
c. By cost component
RO
$0.76/m3
Amortisedcapital cost$0.2938.2%
Electrical energy $0.2431.6%
Membranes$0.033.9%
Labor $0.113.2%
Chemicals $0.079.2%
Miscellaneous $0.033.9%
MED
$0.83/m3
Amortisedcapital cost$0.2934.9%
Electricalenergy $0.06
7.2%
Thermalenergy $0.31
37.3%
Labor $0.089.6%
Chemicals $0.089.6%
Miscellaneous $0.011.2%Miscellaneous $0.01
0.9%
MSF
$1.07/m3
Amortisedcapital cost$0.4239.3%
Electrical energy $0.2018.7%
Thermalenergy
$0.3129%
Labor $0.087.5%
Chemicals$0.054.7%
FIGURE 5.5. Summary of Desalination by Desalination Methods, User, and Cost Component
Source: Gude VG 2016; Voutchkov 2018; Advisian 2018. Note: Costs assume a US$0.05 per kilowatt hour electricity cost and an oil price of US$60 per barrel. ED = electrodialysis; MSF = multistage flash distillation; MED = multieffect distillation; RO = reverse osmosis.

48 The Role of Desalination in an Increasingly Water-Scarce World
Notes 1. Because of its complex configuration and higher requirement for
institutional capacity to operate and maintain the system, in some environments, SWRO is perceived as a higher risk technology option. However, its market maturity has developed rapidly in recent years in every part of the world, which should give investors and consumers more confidence.
2. These estimates and those in table 5.4 are given for indicative purposes only.
3. The high costs have not proved a deterrent in KSA in which water is desalinated at Jubail and then pumped 320 kilometers inland to Riyadh at an elevation of 600 meters.
4. However, similarly sized facilities do not always offer comparative costs for a number of reasons, including feedwater quality and fin-ished water quality targets, intake type, and distance to service area. All of these factors can have a marked effect on the overall cost of water. The importance of understanding these differences cannot be overemphasized when describing costs related to various desalina-tion projects and treating different sources of waters.
5. Recent advances in technology and project delivery are resulting in much lower costs (as low as US$0.60 per cubic meter) and also increas-ing returns to scale for larger SWRO plants.
6. Source water quality characteristics include salinity, temperature, turbidity, silt, organic content, nutrients, algae, bacteria, boron, silica, barium, calcium, and magnesium.
7. See table 4.3. Only a handful of plants do not incorporate at least one additional stage and pass.
8. Including all Middle Eastern countries, but not including Israel, the United States, Canada, and the European Union (EU).
9. Countries with advanced environmental regulations such as the United States, Australia, and many European states have policies and rules that aim to minimize the environmental impact of intakes from power generation facilities in which seawater is used for cooling. Such regula-tions, however, typically do not apply to desalination projects because compared with power plants, which can minimize intake impacts by using alternative means of cooling for power generation, seawater desalination plants are entirely dependent on seawater as a source.
10. Subsurface wells are an excellent environmental solution and can even be cheaper, particularly for small desalination plants. However,
local geological conditions do not often favor this option. At present over 95 percent of the SWRO desalination plants worldwide use open intakes instead of wells.
11. For most plants built in the last two decades, intakes have been designed to minimize impingement of marine organisms by design-ing the entrance velocity into the intakes below 0.15 meter per second. This is consistent with U.S. Environmental Protection Agency (U.S. EPA) best practices for reduction of impingement of aquatic organisms. In addition, many of the newest offshore intakes for SWRO plants have adopted special intake technology, such as wedgewire screens, which minimize impingement and entrain-ment. These screens are rated “best available technology” (BAT) by the U.S. EPA.
12. For example, advances in technology and equipment have resulted in a reduction of 80 percent of the energy used for water produc-tion over the last 20 years. Today, the energy needed to produce fresh water from seawater for one household per year (~2,000 kilo-watts per year) is less than that used by the household’s refrigerator.
13. This theoretical minimum energy required to separate pure water from seawater has been calculated as 1.06 kWh/m3.
14. All desalination technologies are energy-intensive processes that result in large GHG emissions that include CO, CO2, NO, NO2, and SO2. The amount of CO2 is estimated to be 25 kilograms per cubic meter of product water.
15. SWRO plants in the sample for the Pacific and Indian oceans have a wide range of costs. In addition to the bias stemming from the rela-tively small sample size (six plants), location-specific factors are important in driving these cost differences and in producing “outli-ers.” For example, the large Carlsbad plant in the sample has rela-tively high costs because of the high cost of construction and stringent regulatory requirements in California. The Sydney, Australia, plant in the sample has very high capital costs, nearly six times as high as that for the SingSpring plant in Singapore (US$7.64 per MLD versus USD$ 1.30 per MLD) not only for the same reasons as in California but because a decision was made to offset GHG emis-sions by developing RE from wind. For example, many of the largest modern cruise ships use the MED desalination process to make fresh water at sea with waste heat from the ships’ propulsion engines pro-viding the required heat.
16. The figures for the cost are slightly on the lower side primarily because of the low energy cost assumed.

49The Role of Desalination in an Increasingly Water-Scarce World
Chapter 6Likely Development of Technologies and Costs
New Opportunities for Cost Savings in Desalination
This chapter discusses the prospects for further reduc-tion in the costs of desalination. In all regions and for all technologies, there has been a significant decline in desalination costs, particularly in the last two decades. This, combined with the rising costs of other alterna-tive sources, has contributed to an increase in invest-ment in desalination, and this trend is likely to continue. Further large cost reductions are expected, particularly for SWRO, for which costs are expected to further decline by up to two-thirds over the next two decades. Accelerated development of RE and a drop in its costs are expected to strengthen the current trend of implementation of environmentally safe and sus-tainable desalination projects worldwide. This trend also will be helped by emerging technologies, which have lower energy consumption.
As emerging technologies evolve into well-developed and reliable full-scale desalination systems in the next
two decades, desalination is expected to experience a leap in terms of affordability and environmental sustainability.
Background
Technology has improved and costs have fallen dramati-cally and will continue to do so. Desalination has become very much more efficient and cost-effective in recent decades thanks to technology improvements, reduc-tions in costs and energy use, increase in plant size to large and mega capacity sizes, and more competitive project delivery. Between 1980 and 2008, the cost of production of desalinated water fell by more than half (Wittholz and others 2008; see figure 6.1). Although desalination still remains costly compared with conven-tional water treatment technologies, further reductions in costs are likely to close the gap further in the next two decades. These advances are most likely to be in desali-nation technology, in pretreatment, in concentrate management and in energy efficiency and sourcing.
5.00
MSF SWRO
4.50
4.00
3.50
3.00
2.50
2.00
1.50
1.00
0.50
01980
UPC
(200
6 US
D)
1985 1990 1995
Year
2000 2005
FIGURE 6.1. Trends in the Cost of Desalination by Multistage Flash Distillation and Seawater Reverse Osmosis Plants
Source: Wittholz and others 2008. Note: MSF: multistage flash distillation; SWRO = seawater reverse osmosis; UPC = Unit product cost (U.S. dollars per cubic meter).

50 The Role of Desalination in an Increasingly Water-Scarce World
Future Advances for Existing Technologies
Only relatively limited further improvement in thermal technologies is expected. Thermal desalination technolo-gies, MSF and MED, have gradually improved efficiency through enhancement of equipment and system design, configuration, scale formation control, and materials. These technologies are now well proven and mature. The latest MSF and MED plants are efficient and further dramatic improvements in these conventional thermal desalination technologies are not likely. There are, how-ever, potential improvements at the margin which, together, could reduce current production costs by 10 percent to 15 percent (see box 6.1). There is also some potential for improving the environmental performance of MED in the context of links with RE (see the section “Renewable Energy for Desalination”).
Advances in Conventional RO Desalination Technologies
Increasing efficiency in key cost components has pro-gressively made RO more competitive. For SWRO,
improvements in key cost areas over the past two decades, particularly membrane productivity and durability, energy efficiency, and salt separation effi-ciency, have made SWRO increasingly competitive with thermal desalination.
Principal among these cost-reducing factors has been the improvement of membrane technology. Membrane pro-ductivity, that is, the amount of water that can be pro-duced by one membrane element, has more than doubled in the last 20 years (see box 6.2). Today’s high-productivity membrane elements can yield more fresh water per membrane element because of their larger surface area and denser membrane packing.
Improvements are continuing apace as newly developed membrane elements provide flexibility and choice, and allow trade-offs between productivity and energy costs. The newest membrane elements provide flexibility and choice. Essentially, systems can be designed to achieve high productivity with a smaller footprint and at lower construction costs but with the trade-off of higher energy costs. Alternatively, plants can be
BOX 6.1. Potential Technology Improvements in Conventional Thermal Desalination Could Reduce Costs by a Further 10 Percent to 15 Percent
• More cost-effective pretreatment in the application of source seawater softening via membrane nanofiltration or other pretreatment technologies to deal better with scaling
• Development of a new environment-friendly biodegradable generation of advanced-scale control additives
• Development of individual evaporation units of larger capacity to achieve further economies of scale
• Higher performance brine-recirculation designs for MSF units to increase overall desalination plant recovery
• Shifting to lower-cost and lower corrosion materials to reduce O&M costs
• Replacing shell and tube units with plate evaporators in MED plants to improve evaporator productivity and reduce energy use.
• Implementation of absorption heat pumps and alternative VC processes in MED plants for improved energy efficiency.
Source: World Bank 2017a; US DOE 2017; Gude VG 2018.Note: MED = multieffect distillation; MSF = multistage flash distillation; O&M = operations and maintenance; VC = vapor compression.

51The Role of Desalination in an Increasingly Water-Scarce World
designed to be energy saving by using more membrane elements, with lower flux and recovery, and by using the newest energy recovery technologies. This approach minimizes energy use if the system is oper-ated at low recovery levels (35 percent to 45 percent).
Multiple improvements in membrane technology are expected to drive considerable further efficiency gains and cost reductions. Future improvements of the SWRO membrane technology (see box 6.3) are expected to bring higher productivity, more durability and longer life, more integration between membrane activity and other parts of the system, and improved hybrid systems.
It is improvements in membrane efficiency rather than in energy recovery that are expected to strengthen the position of SWRO as the most cost-competitive technol-ogy in most situations. Technology advances are expected to consolidate the position of SWRO treat-ment as the most cost–competitive desalination pro-cess in most locations in the near future. The expectation is that advances in membrane technology will reduce the cost of desalinated water by up to a fur-ther 20 percent in the next five years. The most signifi-cant cost reduction is expected to result from the increase in the volume of fresh water that SWRO mem-branes can produce per unit area. In contrast, because the latest technology already allows energy recovery
of over 95 percent, further advancement of energy recovery technology is not expected to yield signifi-cant additional water cost reduction.
Emerging Technological Advances with High-Cost Reduction Potential
In addition to the technological advances already expected under commonly used desalination technol-ogies, a number of innovative new technologies or adaptations are emerging that may offer potential for even higher productivity or lower costs. These include nanostructured membranes, carbon nanotubes, FO, MD, dewvaporation, adsorption desalination, electro-chemical desalination, CDI, and biomimetic mem-branes with aquaporin structure. These emerging technologies are briefly described in the following paragraphs.
Nanostructured Membranes
Nanostructured membranes have up to 20 percent higher productivity than conventional membranes, or they can operate at the same productivity but use up to 15 percent less energy. Nanostructured RO membranes (see box 6.4) contain minuscule channels that have much higher specific permeability and hence provide more efficient water transport and 10 percent to 20 percent
BOX 6.2. Membrane Productivity Has Doubled in the Past 20 Years
In the second half of the 1990s the typical 100-cm (8-inch) SWRO membrane element had a standard productivity of 19 cubic meters to 22 cubic meters (5,000 gallons to 6,000 gallons) per day at salt rejection of 99.6 percent. In 2003, several membrane manufacturers introduced high-productivity seawater membrane elements that proved capable of producing 28 cubic meters (7,500 gallons per day) at salt rejection of 99.75 percent. Just one year later, even higher productivity of 34 cubic meters (9,000 gallons per day) at 99.7 percent rejection seawater membrane elements were released on the market. Today, membrane elements combining productivity of 45 cubic meters (12,000 gallons per day) and high-salinity rejection are coming to the market. A recent study by US DOE (2017) has also shown the potential energy saving available for desalination, primarily from productivity gains in the desalination process.Source: World Bank 2017a; US DOE 2017; Gude VG 2018.

52 The Role of Desalination in an Increasingly Water-Scarce World
BOX 6.3. Areas for Further Reduction of the Cost of Reverse Osmosis Desalination Technologies
• Development of membranes of higher salt and pathogen rejection, higher productivity, and reduced transmembrane pressure and fouling potential
• Improvement of RO membrane resistance to oxidants, elevated temperature and compaction
• Extension of membrane useful life beyond 10 years
• Integration of membrane pretreatment, advanced energy recovery, and SWRO systems
• Integration of brackish and seawater desalination systems
• Development of a new generation of high-efficiency pumps and energy recovery systems for SWRO applications
• Replacement of key stainless steel desalination plant components with plastic components to increase plant longevity and decrease overall cost of water production
• Reduction of costs by complete automation of the entire production and testing process for membrane elements
• Development of methods for low-cost continuous membrane cleaning that allow reduction of downtime and chemical cleaning costs
• Development of methods for low-cost membrane concentrate treatment, in-plant and off-site reuse, and disposal
Source: World Bank 2017a; Gude VG 2018; US DOE 2017. Note: RO = reverse osmosis; SWRO = seawater reverse osmosis.
BOX 6.4. Nanostructured Reverse Osmosis Membranes
The salt separation membranes commonly used in RO desalination membrane elements are dense semipermeable polymer films of random structure that do not have pores. Water molecules are transported through these membrane films by diffusion and travel on a multidimensional curvilinear path within the randomly structured polymer film matrix. This transport is relatively inefficient, and substantial energy is needed to move the water molecules through the membranes.
A porous membrane structure facilitates water transport and can improve membrane productivity. The recently developed nanostructured membranes either incorporate inorganic nanoparticles within the traditional membrane polymeric film or are made of highly structured porous film that consists of densely packed arrays of nanotubes.Source: World Bank 2017a; US DOE 2017. Note: RO = reverse osmosis.

53The Role of Desalination in an Increasingly Water-Scarce World
higher productivity than the conventional semiperme-able polymer films. Alternatively, they can operate at approximately 10 percent to 15 percent lower energy use while achieving the same productivity as standard RO elements. In addition, nanostructured membranes have comparable or lower fouling rates than conven-tional thin-film composite RO membranes operating under the same conditions, and they can be designed for enhanced rejection selectivity of specific ions. Nanostructured membrane technology has evolved rapidly over the last decade and is now commercially available (Jenkins 2015).1
Carbon Nanotubes
Cutting edge research could develop carbon nanotubes with higher productivity. In recent years researchers worldwide have focused on the development of RO membranes made of vertically aligned densely packed arrays of carbon nanotubes. This technology has the potential to enhance membrane productivity up to 20 times compared with the state-of-the-art mem-branes currently on the market.
…which could bring the production cost of desalinated water to the level of that of conventional water treat-ment technologies within a decade. This innovation greatly decreases the membrane surface area needed to produce the same volume of desalinated water. Carbon nanotubes could reduce the physical size and construction costs of membrane desalination plants by half and bring the cost of production of desalinated water production down to the level of that of conven-tional water treatment technologies. Although carbon nanotube-based desalination membranes are not yet commercially available, it is likely they will be released for full-scale application within the next decade.
Forward Osmosis
FO, currently used mainly for industrial wastewater treatment, is being developed for potable water with the potential to reduce energy use by up to one-third.
In forward (direct) osmosis, a solution with osmotic pressure higher than that of the high-salinity source water (“draw solution”) is used to separate fresh water from the source water through a membrane. A number of research teams worldwide are working on the devel-opment of FO, although the FO systems currently com-mercially available have only found application for treatment of wastewater from the oil and gas industry (Blandin and others 2016).2 The main potential benefit of the development of commercially viable FO tech-nologies for production of desalinated water is the reduction of energy requirements by 20 percent to 35 percent and a consequent reduction of the cost of water production by 10 percent to 15 percent.
Membrane Distillation
MD could almost double the recovery ratio from seawa-ter (from 45 percent to 50 percent to 80 percent). In MD, water vapor is transported between a “hot” saline stream and a “cool” freshwater stream separated by a hydrophobic membrane. The transport of water vapor through the membrane relies on a small tem-perature difference between the two streams. The technology has the potential to almost double recov-ery rates (80 percent versus 45 percent to 50 percent for RO). It is also suitable for further concentration of RO brine, thus, reducing the volume of brine to be dis-posed. There is considerable, largely academic interest in this technology at present because of its very high recovery ratio compared with RO and lower energy use compared with conventional thermal evaporation technologies.
If further developed, MD could lower the cost of desali-nation from highly saline seawater and of management of brine concentrate from brackish water plants. The main cost saving that can result from the application of this technology for large-scale desalination plants is lowering the cost of freshwater production from highly saline seawater and the costs for concentrate manage-ment and disposal for brackish desalination plants by

54 The Role of Desalination in an Increasingly Water-Scarce World
15 percent to 20 percent. However, at present the tech-nology is most suitable for reducing the volume of brine and for fairly small size applications.
Dewvaporation
Dewvaporation is at an early stage of development but could reduce the costs of thermal evaporation by up to one-quarter, particularly in hot, dry environments. This process is a low-temperature, low-cost evaporation technology (see box 6.5), which holds particular prom-ise for regions with low air humidity and high tempera-ture. The theoretical cost reduction this technology could yield is 15 percent to 25 percent of the cost of the present state-of-the-art thermal evaporation tech-nologies. The key to competitiveness is a low-cost heat source; dewvaporation would be cost-competitive with conventional RO desalination only if free or low-cost waste heat were readily available. Thus, the pro-cess holds promise for small-scale applications in combination with solar power. However, the full-scale implementation of the technology at a large scale is at least a decade away.
Adsorption Desalination
Adsorption techniques can reduce scaling and corrosion in thermal plants, but the technology is costly. Adsorption desalination3 is a thermally driven process in which absorbents such as silica gel are used to adsorb water vapor evaporated from seawater at low pressure and temperature (less than 5°C above
ambient). The key benefits of this technology are reduced scaling and corrosion because of the low tem-perature of the evaporation process and reduced energy requirements. The downside of this process is that it requires significant capital and O&M expendi-tures associated with the cooling load to exhaust heat associated with adsorption and condensation.
Electrochemical Desalination
Electrochemical desalination4 could potentially reduce costs by up to 15 percent by more efficient energy use. The continuous electrochemical desalination process is based on a combination of ultrafiltration pretreat-ment, ED, and continuous electrodeionization (CEDI). This process can desalinate seawater to drinking water quality at only 1.5 kWh/m3. The process, which is cur-rently under full-scale development at the Singapore Water Hub, can potentially reduce costs by 5 percent to 15 percent.
Capacitive Deionization
Limited by the ion adsorption capacity of current carbon materials, this technology is currently only viable for lower levels of desalination such as brackish water or industrial water needs. CDI, which uses ion transport from saline water to electrodes of high ion retention capacity (see box 6.6), theoretically has a recovery rate of over 80 percent. However, current carbon electrode technology limits salt removal and it uses twice the energy of conventional RO systems. This technology is
BOX 6.5. Dewvaporation Is a Low-Temperature, Low-Cost Evaporation Technology
In the dewvaporation process, an upward flowing stream of air is humidified by a falling film of saline water that wets one side of a heat transfer surface. At the top of the evaporation tower, the air is heated by an external source (solar irradiation or waste heat) and is then forced down the opposite side of the tower from which it releases the applied heat and forms dew. This dew is condensed and collected at the bottom of the tower.Source: World Bank 2017a.

55The Role of Desalination in an Increasingly Water-Scarce World
also subject to high electrode cleaning costs because of organic fouling.
Several systems are available on the market (Enpar, Aqua EWP, and Voltea). However, these systems have found applications mainly for small brackish water desalination plants and industrial applications because their salt-reducing potential is limited by the low spe-cific ion adsorption of current carbon materials.
Although the technology could bring cost reductions of up to one-third, many technology challenges need to be overcome before it could be a mainstream solution. With the recent development of a new generation of highly efficient lower cost carbon aerogel electrodes, CDI may out compete the use of ion exchange and RO for pro-duction of high purity water. New electrode materials such as grapheme and carbon nanotubes may poten-tially offer solutions to the current technology chal-lenges. The technology holds particular promise because it could theoretically reduce the physical size and capital costs of desalination plants by over 30 percent.
Biomimetic Membranes with Aquaporin Structure
Membranes modeled on those of living organisms could offer the ultimate breakthrough in low-energy desalina-tion. Development of membranes with a structure and function similar to those of the membranes of living organisms may offer the ultimate breakthrough for
low-energy desalination. In these membranes, water molecules are transferred through the membranes using a series of low-energy enzymatic reactions instead of by osmotic pressure.
Intensive research is underway, but it is still in the early stages. Currently researchers in the United States, China, Singapore, and Australia are focusing on advanced research in the field of biomimetic mem-branes (Zhe et al. 2018). Although this research field is expected to ultimately yield high-reward benefits, with a potential to cut overall costs by half or more, it is still in the early stages of development.
Potential Impact of Technology Development on Costs
Current trends in the reduction of the cost of desalina-tion and the increasing costs of the alternatives are likely to continue. The steady reduction of desalinated water production costs, coupled with increasing costs of alternative water sources, are expected to make seawater desalination an increasingly attractive and competitive water source, particularly as a reliable drought-proof alternative for coastal communities worldwide.
SWRO treatments are likely to emerge as the most via-ble, with cost reductions of 20 percent within 5 years and 60 percent in 20 years. The pace of technological
BOX 6.6. Capacitive Deionization
Saline water is passed through an unrestricted capacitor type CDI module consisting of numerous pairs of high surface area electrodes. Anions and cations contained in saline source water are electrosorbed by the electric field on polarization of each electrode pair by a direct current power source. Once the maximum ion retention capacity of the electrodes is reached, the deionized water is removed and the salt ions are released from the electrodes by polarity reversal. The main component, which determines the viability of the CDI, is the ion retention electrode. Based on recent research, carbon aerogel electrodes have proved suitable for low salinity applications.Source: World Bank 2017a. Note: CDI = capacitive deionization.

56 The Role of Desalination in an Increasingly Water-Scarce World
change has been fast and is likely to continue. There are regular commercial releases of new and more effi-cient desalination membranes, innovative thermal membranes, or hybrid desalination technologies. The SWRO membranes are many times smaller, more pro-ductive, and cheaper than the first working proto-types. Technology advances are expected to reduce the cost of SWRO desalinated water by a further 20 percent in the next 5 years and by up to 60 percent in the next 20 years, confirming the position of SWRO as the most competitive process for potable water production (see table 6.1). For example, recent work by Zhe et al. (2018) showed that membrane productivity could be significantly enhanced, by fourfold in this case, compared with commercial alternatives (Tan and others 2018).
Renewable Energy for Desalination
One area for future focus will be a shift away from carbon energy Given the environmental implications of the likely rapid expansion of fossil-fueled desalination, the potential for RE-based desalination is being tested and in some plants has been adopted for full-scale projects (Avrin, He, and Kammen 2015; Global Water Intelligence [GWI] 2015; World Bank 2012). Although advances in membrane and thermal desalination tech-nologies have significant potential for reduction in energy consumption, equally promising advances in RE technologies also offer considerable opportunities for making desalination green and sustainable (see figure 4.2).
RE options include solar, wind, geothermal, and nuclear energy. Large-scale RE-based desalination projects are largely confined to wind, although Saudi Arabia is pio-neering solar PV-based desalination at its plant in Al Khafji (see next). Australia has pioneered the use of wind power for desalination (see box 6.7). Some RE-based desalination projects under development also consider geothermal power as potentially viable. Nuclear-based desalination in China may be viable socioeconomically and environmentally and may be cheaper than interba-sin transfer to meet the growing water demand gap in major cities on or near the coast, including Beijing and Tianjin (Avrin, He, and Kammen 2015).
Although CSP is not currently competitive with either conventional sources or other RE technologies, there is potential for development. CSP could bring consider-able environmental advantages to desalination (World Bank 2012) because it reduces emissions and, com-bined with other technological advances, can help reduce brine production.5 CSP is not economically competitive compared with conventional energy sources or to prevalent RE technologies such as wind and PV (see table 6.2). However, technological advances are expected to bring these costs down considerably.
Costs of solar powered desalination are currently high, but technological advances will make CSP and other RE tech-nologies cost-competitive. A recent World Bank study shows solar-powered desalination costs up to double the costs of standard desalination with costs for thermal technologies in the range of US$1.77 cubic meters to
TABLE 6.1. Forecast of Desalination Costs for Medium- and Large-Size Seawater Reverse Osmosis Projects
Parameters Year 2016 Within 5 years Within 20 years
Cost of water (US$/m3) 0.8–1.2 0.6–1.0 0.3–0.5
Construction cost (US$/MLD) 1.2–2.2 1.0–1.8 0.5–0.9
Electrical energy use (kWh/m3) 3.5–4.0 2.8–3.2 2.1–2.4
Membrane productivity (m3/membrane) 28–47 35–55 95–120
Source: Voutchkov 2016; World Bank 2017a.Note: The figures are estimated for best-in-class desalination plants. MLD = million liters per day

57The Role of Desalination in an Increasingly Water-Scarce World
US$2.08 cubic meters and costs for RO between US$1.50 cubic meters and US$1.87 cubic meters (see table 6.3). However, there is significant potential for development (see box 6.8) and it is estimated that the cost of solar-powered thermal desalination will drop by 40 percent or more by 2025, and will more than half to US$0.90 per cubic meter by 2050.6
The potential of solar has been spurred by the consider-able decrease in solar panel costs over the last 10 years. Currently, PV-based SWRO solar desalination is the leading solar energy choice and is the main focus of further research. However, although small-scale solar-based desalination plants are already common, municipal-scale desalination plants running on solar are only just beginning. The largest desalination plant with solar power supply currently is the 60,000 cubic meter per day SWRO plant in Al Khafji, KSA, commissioned in April 2017.7 Other countries also are experimenting with different configurations of solar desalination with prom-ising results. Fortunately, the regions of the world with freshwater scarcity are also the ones with good solar power potential. They also typically have large desert or waste lands that can be used for solar farms.
Figure 6.2 illustrates the potential for cost reduction of two CSP technologies by 2025 compared with today’s cost: a reduction of 37 percent in overall cost per cubic
BOX 6.7. Australia’s Major Desalination Plants Generate More Wind Power than They Use
The Perth Seawater Desalination Plant uses wind power and contributes more to the grid than it uses. Electricity for the SWRO plant is generated by the 80-megawatt Emu Downs Wind Farm located in the state’s Midwest region near Cervantes. The wind farm contributes 270 gigawatt-hours annually into the general power grid, which more than offsets the 180 gigawatt-hour per year requirement from the desalination plant.
The Sydney Desalination Plant, the third major desalination plant built in Australia, uses RO and is powered entirely by RE from the grid. The project included the construction of a wind farm to offset the energy usage of the plant with 100 percent renewable energy. The 67–turbine Capital Wind Farm at Bungendore was built for this purpose and produces approximately 450 gigawatt-hours per year. The wind farm has been designed to produce more than enough energy to operate the desalination plant and has increased the supply of wind energy in New South Wales by over 700 percent.
Source: AWA 2018. http://www.awa.asn.au/AWA_MBRR/Publications/Fact_Sheets/Desalination_Fact_Sheet.aspx
TABLE 6.2. Levelized Costs of Electricity of Concentrated Solar Power and Other Technologies
Energy source CSP Wind PV Gas CCGT Simple cycle GT
Levelized cost of electricity 196 102 100 80 116
Source: World Bank 2012; Gude VG 2018.Note: LEC calculation is based on 25 years for plant economic life and 10 percent discount rate. CCGT = combined-cycle gas turbine; CSP = concentrated solar power; GT = gas turbine; PV = photovoltaic cells. Unit = US$/MWh. LEC = levelized energy cost
TABLE 6.3. Total Annualized Cost of Desalinated Seawater Using Concentrated Solar Power
CSP-MED CSP-SWRO
Mediterranean Sea 1.97–2.08 1.50–1.74
Red Sea 1.87–1.96 1.56–1.66
Arabian Gulf 1.77–1.89 1.78–1.87
Source: World Bank 2012.Note: The costs assume a hybrid plant with a solar share of 46 percent to 54 percent, project life of 25 years, and discount rate of 6 percent. The energy costs for SWRO and MED were calculated based on the opportunity cost of fuel at the international price and the fuel escalation cost of 5 percent per year. Unit = US$/m3. CSP = concentrated solar power; MED = multieffect distillations: SWRO = seawater reverse osmosis.

58 The Role of Desalination in an Increasingly Water-Scarce World
BOX 6.8. Improvements in Concentrated Solar Power Technology Are Increasing Efficiency
With sufficient heat storage capacity, CSP potentially can provide baseload power 24 hours a day. The efficiency of today’s solar collectors ranges from 8 percent to 16 percent. In a decade or two, technical improvements are expected to increase efficiency to the 15 percent to 25 percent range. Currently, the solar energy collector field comprises more than half of the investment cost. Thus, improvements in collection efficiency indicate significant potential for cost reduction.Source: World Bank 2017a.Note: CSP = concentrated solar power.
FIGURE 6.2. Global Concentrated Solar Power Levelized Cost of Electricity Potential for Reduction by 2025
Sources: Dieckmann and others 2016; IRENA 2012.Note: CAPEX = capital expenditure; EPC = engineering, procurement, and construction; O&M = operation and maintenance.
0.15
0.10
0.05
0
2015
2015
Tempera
ture incre
ase
10m co
llecto
r
Availa
bility &
clean
liness
2015
USD
/kW
h
O&M costs
O&Mcosts
CAPEX (direct)
a. Parabolic through
CAPEX (indirect)
Solar eld
direct
cost
Thermal
storag
e
direct
cost
Power block
direct
cost
Performance improvements
Owner’s c
ost
Indirect
EPC cost
2025
-37%
0.15
0.10
0.05
0
2015
2015
Availa
bility
2015
USD
/kW
h
O&Mcosts
CAPEX (direct)
b. Solar tower
CAPEX (indirect)
O&M costs
Thermal
storag
eTower
Receiv
er
Power block
Heliosta
t eld
Perform
ance
improve
ment
Performance
Owner’s c
ost
-37%
Indirect
EPC cost
2025

59The Role of Desalination in an Increasingly Water-Scarce World
meter for “parabolic trough” desalination and a reduc-tion of 43 percent for “solar tower.”
However, there are still many challenges, and research and development on options for desalination using RE, particularly solar, are a must. The key challenges of RE (solar and wind in particular) are the intermittence of supply, storage requirements, and space for installa-tion of the RE equipment. For example, in terms of water production in MENA, a 10 × 10-km concentrating thermal collector array will produce 1 cubic kilometer of desalinated water per year.8 Global commitment to reduce dependence on carbon-based energy and to meet the targets for reducing carbon emissions under the Paris Agreement on Climate Change is likely to strengthen research and development on desalination using RE.
However, to reach this level of maturity and cost- effectiveness, RE will continue to need strategic support. This support could be a combination of energy policy reforms to remove barriers such as eliminating fossil-fuel subsidies, the creation of an enabling envi-ronment for long-term power-purchase agreements
and feed-in-tariffs, and support for initial investments and research and development related to RE. Already China and KSA are investing in research to reduce the costs of solar panels. The private sector is also invest-ing: Dow Chemicals, for example, is investing signifi-cant resources in promoting desalination technologies.9 Market competition and innovative procurement approaches, such as an auction, are also contributing to cost reduction of RE options. As a result, the evolu-tion of actual CSP LCOE over the last decade has already surpassed expectations (see figure 6.3). For example, the actual LCOE from recent contracts in the Middle East is already lower than the IRNEA 2016 pro-jection for 2025 seen in figure 6.2, which shows rapid reductions in LCOE.
Notes1. From October 2010, a U.S. membrane supplier NanoH2O offered a
nanocomposite membrane that incorporates zeolite nanoparticles (100 nanometres in diameter) into a traditional polyamide thin membrane film. In October 2015 Chemical Engineering reported that “a new composite-MD process capable of removing salt, toxic elements and microorganisms from water is being offered commercially.”
FIGURE 6.3. Levelized Cost of Energy Evolution in Major Concentrated Solar Power Countries
Source: Abengoa 2018.
0.350
0.300
0.250
0.200
0.150
0.100
0.050
02006 2008 2010 2012
Year
2014 2016 2018
USD/
kWh
South AfricaSpain USA Morocco Chile China Middle East

60 The Role of Desalination in an Increasingly Water-Scarce World
2. Several companies such as Oasys, Modern Water, Hydration Technology Innovation, and Trevi Systems have developed these systems. The Trevi Systems FO technology is of potential interest because it uses draw solution that can be reused applying solar power. It is the main innovative technology considered for the ongoing solar power-driven desalination research led by Masdar in the United Arab Emirates.
3. The adsorption desalination process was originally devised by the National University of Singapore and is currently being developed at the King Abdullah University of Science and Technology in KSA.
4. Developed by Evoqua (formerly Siemens) under a Challenge Grant from the Government of Singapore.
5. This is possible through use of RO and MED, which have higher recov-ery ratios and produce less brine.
6. This is based on the assumption that because of technological advances the present CSP costs of approximately US$0.28/kWh will fall to approximately US$0.08/kWh by 2050.
7. The Al Khafji project incorporates the construction a 15-MW PV solar power generation plant that will deliver electricity to the energy grid of a total daily amount equal or higher than the daily desalination plant power demand. The SWRO desalination plant will receive elec-trical energy from the grid.
8. Corresponding to approximately 10 m3 of desalinated water per m2 of collector area.
9. Saudi Arabia creates new solar-powered desalination technology, see the website https://www.aiche.org/chenected/2015/10/saudi-arabia -creates -new-solar-powered-desalination-technology.

61The Role of Desalination in an Increasingly Water-Scarce World
Procurement Methods and Risk Allocation
There are risks that are inherent and specific to the development of large desalination infrastructure. Large infrastructure projects are subject to risks that, if mate-rialized, may affect their ability to achieve the intended outcomes, affect their performance, and cause delays and cost overruns, which in turn may affect the eco-nomic and financial viability of the project. Box 7.1 describes the classification typically used when ana-lyzing infrastructure finance risks, highlighting how these are influenced by the particularities of desalina-tion technologies and markets.
Selecting the right procurement method is key for match-ing risk exposure to managerial capacity and ultimately achieving the best value for money. The sponsor of an infrastructure project has three alternative ways to deal with each of these risks: (1) it can decide to man-age it (keep the risk), if the sponsor has the technical, managerial, and financial capacity required to handle it; (2) insure or hedge the risk, if and where the market offers such solutions; or (3) transfer it or share it with a third party. The conditions under which these risks are transferred or shared with a private partner are deter-mined by the procurement instrument adopted to develop the concerned infrastructure. In turn, the selection of the procurement instrument should be made to allocate the different risks involved with the party that is best placed to manage them in a cost- effective way. This is not necessarily always the private sector.
Table 7.1 describes how the risks associated with the development and management of desalination infra-structure are allocated depending on the selected proj-ect delivery method: (1) the turnkey approach, also referred to as EPC, in which the private contractor is responsible both for the design and the construction
of the facility; (2) The DBO method, in which the con-tractor is also responsible for the operation of the plant for a limited number of years, usually two to five; and (3) the BOOT method, by which the private partner finances the desalination facility and operates it for a long period of time, usually 20 to 25 years, in exchange for tariff-based payments linked to plant capacity and actual water demand. Although the traditional infrastructure procurement approach, also known as DBB, is rarely used for desalination projects, it is also included in table 7.1 for comparison purposes.
Under DBB, the owner retains full control but also takes all the risks. With DBB, the owner is typically a public entity, such as a municipality or utility, which retains control over the plant ownership and is responsible for overall project implementation as well as for the proj-ect financing and long-term plant O&M. In this classic form of contracting, the owner retains a consulting engineer to design the project, produce bid docu-ments, oversee the tendering and selection, and super-vise construction. The owner takes practically all the risks associated with project development from per-mitting to permit compliance, and from project imple-mentation to commissioning, together with the project financing risk. The advantages for the owner are essen-tially control of a strategic asset and product. There also may be an expectation of cost savings by “cutting out the middleman,” although, as explained later, this has not usually been the case in practice. The DBB delivery method could be appropriate for small desali-nation plants.
Turnkey approaches are well suited for thermal desalina-tion projects sponsored by public agencies with strong technical capacity. The performance of thermal desali-nation facilities can be accurately assessed during the commissioning phase, which makes the EPC
Chapter 7Desalination Project Financing and Delivery, and Implications on Cost

62 The Role of Desalination in an Increasingly Water-Scarce World
BOX 7.1. Risks Associated with the Development and Management of Desalination Infrastructure
Site-related risk. This relates to the suitability of the site selected to develop the desalination plant, which, among others, conditions aspects like raw water quality (and quality variability) and raw water availability, which could be an issue for brackish water desalination plants.
Construction risk. This relates to the potential construction delays and costs overruns.
Performance risk. This refers to the ability of the desalination plant to work at the design capacity meeting specified desalinated water quality standards while keeping specific energy consumption (kilowatt hour per cubic meter), specific chemical consumption and, in the case of RO desalination, membrane replacement rates below projected design values. Although the long-term performance of thermal desalination plants can be accurately assessed during the commissioning phase, this is not the case for RO technologies because of the sensitivity of membranes’ performance to feedwater quality variations, some of which may be seasonal. Performance shortfalls could be caused by design-, construction-, or operational-related issues.
Operational risk. This relates to the ability to maintain controlled costs and the desired performance level during the operational phase. Energy costs, the biggest variable cost item for desalination operations, could be locked in to some extent through hedging and futures contracts in countries with competitive energy markets, but in countries with monopolistic energy markets the only way to mitigate this risk is through tariff indexation.
Demand risk. This refers to a possible lower than expected demand for desalinated water, which would be translated into a higher unit cost of the water effectively produced because capital investments and fixed operating costs are constant.
Force majeure risk. This refers to events beyond the control of the parties involved in the development of the project that may inhibit them from fulfilling their duties and obligations under the project agreements.
Political and regulatory risk. Key risks that arise are the decision by a government to cancel a project or to change the terms of the contract or not to fulfill its obligations, political or regulatory risk in failing to implement the tariff increases agreed on in the contract, and the risk of expropriation or nationalization of project assets by a government.
Environmental risk. This relates to liabilities and constraints imposed on the project by environmental and social laws.
Social risk. This refers to the resistance risk the project may face from certain interest groups that can result in delays in implementation, cost overruns, and undermine the overall project viability.
Currency exchange risk. This arises when a project is financed through loans denominated in foreign currencies, whereas project revenues are generally denominated in local currency. This is often the case in desalination projects because retail water tariffs charged and collected by water utilities are denominated in local currency, whereas the share of equipment imports in capital expenditures is high and often above 60 percent. Where the exchange rate between the currency of revenue and the currency of debt diverge, the cost of debt can increase, often dramatically.
box continues next page

63The Role of Desalination in an Increasingly Water-Scarce World
BOX 7.1. continued
TABLE 7.1. Procurement Methods and Risk Allocation
Procurement method → DBB EPC DBO BOOTRisk category ↓
Construction risks Shared. Cost overruns related to design deficiencies are borne by the client. Often construction prices are indexed to inflation for multiyear projects. Other cost overrun risks are borne by the contractor. Delay risk is also transferred with liquidated damages provisions.
Transferred to the private contractor
Transferred to the private contractor
Transferred to the private contractor
Performance risk Retained by owner because the client is responsible for the design.
Transferred for the case of thermal desalination projects but retained by the client for RO projects because of membranes’ long-term performance sensitivity to feedwater quality variations.
Transferred to the private contractor
Transferred to the private contractor
Operational risk Retained by owner Retained. However, often clients outsource O&M activities to a third party after construction is completed.
Shared. Operational performance risk is transferred to the contractor; however, usually O&M fees are indexed to inflation and the client is responsible for purchasing the electricity, facing the risk of energy price hikes.
Transferred. However, in countries with monopolistic energy markets, normally the increased energy cost is reflected in the tariff calculation for the treated water.
table continues next page
Interest rate and loan tenor risk. This is associated with projects financed through debt. Ideally infrastructure assets would be financed through debt charged with a fixed interest rate to reduce fluctuations in the cost of infrastructure services. The tension between local and foreign currency debt is often a question of balancing fixed rate debt with foreign exchange rate risk or local currency debt subject to interest rate risk. Loan tenor is also an important factor in payment risk analysis because balance should be maintained between interest rate and loan tenor to ensure there is adequate revenue stream to service the debt.

64 The Role of Desalination in an Increasingly Water-Scarce World
contractual approach suitable for projects sponsored by clients with previous experience operating such plants. This is, for example, the case of national water companies in charge of the management of large desalination infrastructure portfolios in the GCC, which is a region that has historically relied heavily on desalination to meet its drinking water supply needs.
For RO projects sponsored by agencies with limited pre-vious desalination experience, it is usually advisable to make the EPC contractor also responsible for O&M, adopting DBO contractual approaches. This is because, unlike thermal desalination technologies, it is difficult to assess the long-term performance of RO desalina-tion facilities during the commissioning phase, due to
TABLE 7.1. continued
Procurement method → DBB EPC DBO BOOTRisk category ↓
Demand risk Retained by owner Retained by owner Retained by owner Usually retained. Often, the developer has no relationship with retail water consumers, and the off-taker is a water utility or a water authority that on-sales to utilities. The risk is maintained at the off-taker side adopting take-or-pay tariff schemes.
Environmental risk Retained by owner Retained by owner Retained by owner Shared
Force majeure risk Shared for the construction phase
Shared for the construction phase
Shared for the construction phase
Shared for construction and operations. During operation usually the off-taker must pay the capacity charge of the tariff, whereas the developer handles the loss of revenue risk.
Currency exchange risk
Retained by owner Retained by owner Retained by owner Shared. Usually take-or-pay tariffs are partially denominated in national and hard currencies, or they are indexed to exchange rates.
Interest rate and loan tenor risk
Retained by owner Retained by owner Retained by owner Transferred, although sometimes tariffs are indexed to interest rate variations.
Political risk Irrelevant Irrelevant Irrelevant Relevant in certain contexts. The investor may have to look for guarantees offered by multilateral organizations or export credit agencies, which come at a cost.
Source: Summarized by authors from Sommariva (2010) and others.Note: DBB = Design-bid-build; BOOT = build-own-operate-transfer; DBO = design-bid-build; EPC = engineering, procurement, and construction; O&M = operation and maintenance; RO = reverse osmosis.

65The Role of Desalination in an Increasingly Water-Scarce World
the sensitivity of membranes’ performance to feedwa-ter quality variations and to the fact that some of the main O&M variable costs items, particularly projected membrane and cartridge filter replacement rates, can only be verified long after the plant is commissioned. The duration of the O&M period of the DBO contract is typically two to five years. Under DBO contracts, the contractor is paid a sum for the DB of the plant and an operating fee for the operating period.
BOOT procurement approaches are well suited for the development and management of desalination infra-structure because risks and responsibilities can be
clearly ringfenced from those related to water distribu-tion activities, the performance of the asset (desali-nated water production capacity, quality, and pressure at the point of delivery) can be clearly measured and evaluated, and remunerations to the private developer can be easily linked to the demand for desalinated water using capacity-plus-volume tariff structures. Box 7.2 describes the basics of the contractual and tar-iff structures adopted for desalination BOOT projects.
The use of BOOT schemes for procuring desalination infrastructure and services is gaining popularity. The schemes are popular because they allow the project
BOX 7.2. Typical Build-Own-Operate-Transfer Contractual Structure
The BOOT project structure is seen in figure B7.2.1. The off-taker purchases water from a project company (the SPV—special purpose vehicle) through a WPA over a concession period of typically 20 to 25 years. The WPA establishes the conditions under which desalinated water will be delivered, including the quantity, quality, and the delivery pressure. The WPA also establishes the tariff at which the SPV is remunerated, which usually comprises a fixed capacity payment, which covers capital costs and fixed O&M costs, and a variable payment, which covers variable O&M costs.
Off-takerLender
EnergySupplier
ProjectCompany Sponsors
EPCContractor
O&MContractor
WPA: Water Purchase AgreementPPA: Power Purchase AgreementLA: Loan Agreement
Other agreements:
• Share holders Agreement• Lease Agreements• Security Agreements• Direct Agreements• Membrane Supply Agreement• Sale Assets and Share Facilities Agreements
EPCContract
PPA
LA WPA
O&MContract
FIGURE B7.2.1. A typical BOOT project structure
box continues next page

66 The Role of Desalination in an Increasingly Water-Scarce World
to be financed off the balance sheet of the awarding authority and because risk transfer is more effective when the private partner is providing capital resources that are at risk, rather than when it is only subject to penalties. On the other hand, when the appropriate enabling environment exists, desalina-tion assets constitute an attractive business opportu-nity for private investors and commercial lenders because they are capital-intensive projects with long asset life that can easily fit into well-tested financial structures. The popularity of BOOT schemes in the desalination industry is evidenced by a market analy-sis developed by GWI, according to which 47 percent of desalination capital investments made in 2016 (US$2.9 billion) were financed using BOOT schemes. This share is expected to increase to 50 percent by 2020. Moreover, of the total US$3.7 billion dollars invested globally in the water sector in 2016 using BOOT schemes, 37.3 percent corresponded to desali-nation plants (GWI 2017).
However, the delicate financial situation faced by most of the water utilities (political and currency exchange risks) hinders the viability of BOOT projects pursued by utilities in middle and lower income countries. This situation, however, could be overcome with government support in the form of guarantees, insurance, or grants. This government support, however, comes at a cost and generates contingent liabilities whose fiscal implica-tions should be carefully assessed.
Financing Desalination Projects
Source of financing, such as debt, equity, or a blend, is a key determinant of all-up costs. The financing structure (debt only or equity and debt) and funding sources may have significant impact on project costs (see box 7.3). Various sources of project funding, such as equity investors, local banks, international banks, and pension funds, have different investment return expectations. Costs of debt are typically in the range of 3 percent to 8 percent and “expectations” of return on equity are typically in the range of 10 percent to as much as 40 percent.
For new entrants to the desalination market, costs of financing can be high, even for developed countries with sophisticated financial markets such as Australia. An example is the Melbourne SWRO desalination project for which the construction cost was US$3.5 billion but the all-up capital cost totaled US$4.8 billion. The dif-ference of US$1.3 billion included extra cost associated with project funding: the cost for equity and debt retirement was 27 percent of the total capital cost.
More mature desalination markets can typically offer lower returns and attract a higher proportion of low-cost debt or long-term pension fund financing on favorable terms. In general, the more mature the desalination market is, the lower the equity and debt returns, and a larger portion of the project is funded by low-cost debt. When there is a long track record of successful
BOX 7.2. continued
BOOT projects are awarded to the bidders offering the lowest water tariff. The retained bidder, often a consortium, then creates a limited viability project company, the SPV. The SPV is capitalized by the retained bidder and enters into a nonrecourse financial agreement with the lenders, meaning that the lenders’ recourse will be limited primarily or entirely to the project assets and cash flows if the project company defaults. The direct or step-in agreements give the lenders the right to step in and replace the concession company in the event that the latter fails to perform.
Note: BOOT = build-own-operate-transfer; EPC = engineering, procurement, and construction; O&M = operation and maintenance; SPV = special purpose vehicle.

67The Role of Desalination in an Increasingly Water-Scarce World
BOX 7.3. Project Financing Costs
Project financing costs include expenditures for obtaining all funds and insurance needed for project implementation, from its conception and development through construction, startup, and commissioning. These include the following:
Interest during construction. Debt and bond obligations are typically repaid using revenue from the sale of the desalinated water. However, when the project is under construction no revenue is available to repay debt obligations. Therefore, typically the owner of the project borrows additional funds to pay the interest on the money used for construction. Usually interest during construction is calculated by multiplying the construction cost of the project by the annual interest rate of the loan and by 50 percent of the length of the construction period in years. This estimate assumes that 50 percent of the loan on average will be outstanding. Depending on the type of financing used for funding of the desalination project, interest during construction is usually between 0.5 percent and 2.5 percent of the total capital costs.
Debt Service Reserve. This is intended to protect project lenders against inability of the owner to repay debt because the revenue generated by the project is insufficient. Depending on the type of financing, the complexity of the project and the revenues of the water sales compared with the debt obligations, the debt service reserve is typically set as one of the following three values: (1) maximum annual debt service, (2) 125 percent of the average debt service, or (3) 10 percent of the principal. The debt service reserve typically ranges between 1.5 percent and 3.5 percent for thermal desalination plants and 3.5 percent to 5.0 percent of the project total capital costs for SWRO plants.
Other Financing Costs. These include comprise of expenditures associated with the funding of other reserve funds in addition to the debt service reserve fund if needed to satisfy lender requirements; of administrative and legal costs related to issuing project bonds or arranging project loans and administering payments; and of costs associated with arranging project equity, if equity contributions are used for project financing. Other financing costs also include expenditures associated with purchasing insurance and obtaining performance and payment bonds to protect the owner and contractors against construction failures and problems and for payment of various taxes associated with project implementation as well as for encompassing shipping costs for delivering plant components to the site. These costs range between 0.5 percent and 1.0 percent for thermal desalination plants and 1.5 percent to 2.5 percent of the total capital costs for SWRO desalination projects.
Contingency. These provisions in the project cost estimate reflect the fact that even when a detailed cost estimate is completed, there are a number of unknown factors that may influence the actual expenditures associated with project implementation. The size of contingency funds included in a given cost estimate depends on level of accuracy of this estimate as well as on project complexity, size, funding structure, contractor experience with similar projects, and other project-related risks. A detailed cost estimate usually carries a contingency factor of 5 percent to 10 percent for thermal desalination plants and 10 percent to 15 percent for SWRO projects, depending on the complexity and size of the project.
Note: SWRO = seawater reverse osmosis.

68 The Role of Desalination in an Increasingly Water-Scarce World
desalination and mature financing arrangements, desalination projects may attract very long-term inves-tors such as pension funds with lower return expecta-tions and long grace periods. In more mature markets such as those in the Middle East, the cost of financing is typically only one-third to one-half of that in newer markets.1
The best financing structures can reduce costs by as much as one-third, signaling that as much expertise should be put into developing the financing package as selecting more efficient technology. Obtaining the best terms for debt and equity financing can reduce cost by as much as a third, at least initially. Debt service and dividends may contribute 20 percent to 30 percent of the total cost of desalinated water, so that a typical cost of desalinated water of, say, US$0.80 per cubic meter to US$0.90 per cubic meter could initially be reduced to US$0.60 per cubic meter or less for the first five years if debt or equity payments are deferred for a grace period.2
However, care is needed because costs may go up later, and the first-year cost may have distorted perceptions of desalinated water as cheaper than it really is. The most widely publicized desalinated water costs are the first-year costs, which tend to attract public attention. In addition, because often in project bid assessment first-year costs are used for bid comparison and contractor selection, astute project finance engineering may make projects funded with deferred debt appear more com-petitive than they really are.
Experience shows that the best financing packages can help to deliver the lowest desalination costs, even with-out innovative technology. Firms in some countries, for example, Singapore and China, have been able to develop financing packages to deliver some of the low-est cost desalination projects in the world while using fairly standard design practices and conventional desalination technologies.
Strategic use of government guarantees or subsidies can also keep costs down. The relatively low price obtained
for desalinated water through BOOT schemes for Israel’s desalination plants resulted from careful design of the contracts with the private sector. One ele-ment has been more government guarantees being provided to private investors than is typical for such PPP projects. This allowed Israel to get bid prices for desalinated water that are among the lowest in the world, in turn, making large-scale access to desalina-tion financially viable (see box 7.4). Appendix C also provides a case study of the Sorek plant in Israel, which illustrates many of these lessons.
Putting Together Desalination Project Packages and Learning from Experience in the Middle East
With long experience in desalination financing, Middle Eastern countries represent a relatively mature market that can provide lessons to newer entrants to desalina-tion. Project financing parameters vary significantly from one region of the world to another. Although the Middle East contains only a few of the countries that have developed desalination worldwide, this handful of countries can provide useful lessons in project financing because they have the most mature and best established desalination practice. As a result, projects in the Middle East typically attract better terms than those in other regions because of the maturity of both the technologies and the financial engineering and the stability of local currencies. For example, Israel has one of the world’s most dynamic and innovative desali-nation sectors both in terms of technology and of proj-ect delivery.
In the Middle East, EPC and DBO projects are typically loan-financed. IWPP and BOOT projects are financed using a combination of debt and equity, with a debt-to-equity ratio in the range of 70:30 up to 90:10. Often debt consists of syndicated bank loans provided by a group of local and international banks. The local cur-rency tranche usually represents 40 percent to 50 per-cent of the total debt. A standard contract would provide for (1) short-term nominal financing in local

69The Role of Desalination in an Increasingly Water-Scarce World
currency during construction and (2) conversion to a long-term local currency loan indexed to the consumer price index (CPI). Usually, the lenders would be the same and the conversion would take place at a prede-termined date. This long-term financing is then repaid over a set number of years during the operation period. Hard currency financing is drawn down during con-struction and repaid according to an agreed schedule during the operation period. The hard currency loans would typically start at the relatively lower floating
rates (London interbank offer rate [LIBOR] or Euro interbank offer rate [EURIBOR]) and then convert to a fixed rate at the same time as the local currency loans are converted from short to long term. Typically, both tranches enjoy equal rights on a pari passu basis.
The low-risk environment and economic viability of proj-ects in the region attract favorable financing terms. Because of the relatively low risk and high internal rates of return (IRRs) (typically 10 percent to 17 percent),
BOX 7.4. Government Guarantees Helped Israel Achieve Record Low Bid Prices for Desalinated Water
In addition to the inherent benefits of the BOOT approach, the specific design of the Israeli desalination PPPs included additional guarantees that reduced the level of risk for the private party and so helped to achieve very low bid prices:
Interest change risk borne by the government. The concessionaires have been provided with full protection against changes in the market base interest rate, allowing them to use cheaper variable short-term debt to finance the construction phase and refinance later to long-term debt over the operational period. The PPPs were therefore able to take advantage of historically low interest rates without having to factor in the risk of increasing long-term interest rates. This also allowed private financing to be structured with a high level of gearing (senior debt of about 80 percent and equity at just 20 percent), further reducing the average cost of capital.
Enhanced indexation mechanism with all fluctuation risks borne by the government. The tenders have typically included a hedging mechanism that allows each bidder to include in its financial proposal its own indexation formula based on a predefined selection of market indices as opposed to imposing the same preestablished indexation formula to all bidders. This hedging mechanism allowed fine-tuning to the specific cost structure of each bidder and was more extensive than typically offered in a BOT contract.
Optimizing the fixed payment under the “take-or-pay” guarantee. As is typical with BOTs, a portion of the remuneration of the concessionaire is made through a guaranteed fixed payment in exchange for a guaranteed volume of water available under a take-or-pay guarantee. To facilitate access to nonrecourse private debt, the fixed payment should cover all fixed costs, including fixed operational costs and debt service. Although the proportion of fixed to variable payment is often established ex ante in typical BOT tender documents, in Israel a formula was introduced in the tender to allow bidders to optimize the proportion of fixed to variable fees based on their own cost structure. This allowed each bidder to propose its own optimal mix.
Cost of land borne by the government. This was a significant factor given the high cost of land in Israel’s coastal areas.
Source: World Bank 2017b. Note: BOOT = build-own-operate-transfer; BOT = build-operate-transfer; PPP = public–private partnership;

70 The Role of Desalination in an Increasingly Water-Scarce World
discount rates are low (6 percent to 8 percent), and lengthy repayment periods of up to 20 years can be negotiated. The project financing and technology risks are also well known and manageable, and local curren-cies are stable and usually pegged to the U.S. dollar. Table 7.2 summarizes typical discount rates, loan repay-ment periods, and IRR of desalination projects in the Middle East.
In higher salinity environments in the region, SWRO is perceived as riskier with higher costs of capital than thermal technologies. Red Sea and Arabian Gulf SWRO desalination projects have the highest cost of capital in terms of both debt and equity. This could be explained both by the involvement of large interna-tional corporations, private investors, and banks with relatively higher investment return expectations, and by the higher risks associated with the construction and operation of these projects. For example, SWRO projects that use membrane pretreatment to deal with the hazard of biofouling are usually penalized by the investment community because of their inferior per-formance track record compared with projects with conventional granular media pretreatment. This mar-ket perception is based in part on actual performance. For example, over a decade of experience with the use
of membrane pretreatment for SWRO desalination projects in the Arabian Gulf shows that these plants can typically only produce fresh water at 70 percent to 85 percent of their rated plant capacity during the algal bloom season, which typically lasts three to four months every year.
In contrast, MSF and MED-TVC desalination projects in the Middle East have lower cost of investment and return expectations. This is in large part because these thermal technologies are fairly mature, and risks asso-ciated with construction and operation of this type of project are well understood by the investment com-munity. In addition, many MSF projects attract local funding, which is typically lower cost than interna-tional funding sources.3
Notes1. See the reference to this in the discussion of factors influencing.
2. As in the case of the Sorek desalination plant in Israel (see appendix A).
3. To promote SWRO, which is a technology with much larger potential for cost reduction, government support may be necessary to attract investors at reasonable rates and so keep down costs. For example, the Israeli government kept down the costs of water at the Sorek plant through a range of support that both reduced capital and operating costs and gave comfort to prospective investors (see box 7.2).
TABLE 7.2. Summary of Key Financing Parameters for Desalination Projects in the Middle East
Desalination methodDiscount rate (%) Loan repayment period (years) IRR
Range Average Range Average Range Average
MSF 2.0–6.5 4.8 15–25 20 5.6–13.3 9.8
MED-TVC 4.8–8.0 5.7 10–20 15 6.8–12.0 11.2
SWRO Mediterranean Sea 5.4–7.6 6.4 15–20 18 7.8–16.8 14.9
SWRO Arabian Gulf 5.6–8.4 7.6 10–15 12 8.9–18.5 16.8
SWRO Red Sea 6.0–9.1 8.4 10–20 18 9.4–17.2 17.2
Hybrid (MSF/MED & SWRO 5.6–8.4 6.1 10–25 20 8.4–15.3 13.8
Source: World Bank 2017a. Note: IRR = internal rate of return; MED-TVC = multieffect distillation with thermal vapor compression; MSF = multistage flash distillation; SWRO = seawater reverse osmosis.

71The Role of Desalination in an Increasingly Water-Scarce World
Chapter 8Choosing Desalination
This chapter builds on the methodology that was outlined in chapter 1 for assessing and balancing water supply and demand at the largest possible scale (such as national and river basin scale), and then suggests how that methodology can be adapted and amplified to evaluate choices of desalination technology to fill specific segments of the water supply-demand gap. This methodology also builds on classical IRP frame-work, which generally involves making detailed fore-casts of demand, developing a wide range of options to meet demand, assessing demand and supply side options on an equal basis, and deciding how to meet objectives at least cost while accounting for sustain-ability impacts and uncertainties.
This chapter describes the decision-making process in five “steps”:
• Step One: Assessing supply and demand into the long term at the region or basin scale
• Step Two: Downscaling the basin analysis to the local level, such as industrial zone or urban scale
• Step Three: Assessing whether the physical, eco-nomic and institutional conditions exist to make desalination a prima facie option
• Step Four: Feasibility and risk screening for desali-nation options
• Step Five: Decisions
A case study of how Israel claimed, “water indepen-dence” using desalination as a strategic resource is in appendix B.
Assessing Supply and Demand into the Long Term at the Basin Scale
Reasons to Start at the Basin Scale
Chapter 1 outlined ways to address long-term water security by ensuring that adequate renewable
resources are available; by managing risks to resources such as climate change and pollution as well as secu-rity- and disaster-related risks; and by providing equi-table, sustainable, and affordable access to water for all. The chapter also described how an integrated approach to water resources management enables decision takers to plan with a long view at the basin scale to balance supply and demand sustainably. This section now provides a more detailed guide to water planning at the basin scale as an introduction to how to downscale the planning approach to geographical areas and segments of demand in which desalination may be an option to close the supply-demand gap.
Because water resources and uses within a basin are all interdependent, the analysis must start at the basin scale and be conducted in an integrated way. Desalination projects will form only a part of the solution within any basin, and will normally address very specific needs in particular locations within that basin. It is necessary, however, to start the exercise at the scale of a discrete water management area, typically at the large basin scale. Water flows and is used at that scale, and water planning must always start on an integrated basis at the basin scale.1
Planning at the basin scale will typically cover five stages: (1) determining the geographical planning area (that is, the basin or sub-basin) and selecting the planning time horizon, (2) developing scenarios based on the long-term development choices and trends within the plan-ning area and time horizon, (3) assessing the water implications of each scenario, (4) evaluating the sce-narios iteratively and taking a decision, and (5) prepar-ing water planning on the basis of the chosen scenario.
The more local scale planning, which would trigger deci-sions on desalination, are conducted within the overall basin planning, using essentially a downscaled version of

72 The Role of Desalination in an Increasingly Water-Scarce World
the same techniques. The techniques for planning at the local scale at which decisions on desalination will usually be made are essentially the same as for basin planning. How basin planning techniques can be downscaled to the level of, for example, a major city or an industrial complex within the basin is the subject of the following section (Step Two).
Determining the Area and Planning Horizon
The geographical planning area would typically be a dis-crete basin. The basin is the natural hydrological scale to select but it could be a sub-basin in the case of a very large river system or a transboundary river basin like the Indus, the Nile, or the Mekong. In the case of small states like Singapore, or in the case of a small country with an integrated water supply system like Israel, planning is done at the national level and desalination options at the local scale are integrated within overall national planning for water.
The planning horizon should be long term and cover sev-eral decades.2 This is because demand changes over long timescales and the supply changes needed to meet demand take a long time to mature. Water infra-structure is lumpy and years or even decades may pass from conception to operation. When planning requires strengthening of institutions such as regulatory frame-works and agency capacity to manage water, it takes a long time to put water infrastructure in place and for it to become effective.
The resource itself also changes over long timescales. The impact of changes in precipitation patterns and temperature, the occurrence and consequences of pol-lution, the depletion of groundwater, and the intru-sion of salt water into coastal aquifers all may occur almost imperceptibly at first and it may take years for their effect to be noticed. Far longer is needed to gather information, make the public and decision makers aware, and to reach decisions and implement them. The consequent actions may take many years to have
an impact. For example, typically the time lapse between the start of a change in water quality or water levels in aquifers and effective action to deal with it is several decades. Planning for the long term is thus essential. Israel, for instance, has been developing roll-ing master plans since the 1940s and has been at work for several years already on its water plan for 2050 (Siegel 2017).
Developing Scenarios Based on Long-Term Development Choices and Trends
Water is for the support of human life and society and their environment, so the first planning question has to be how many people and where and how will they live and work? This requires projection over the planning period of the size and location of demographic expan-sion and its implications for demand for water, sanita-tion, and ecological services. How big will the population be? How well-off will it be and what life-style choices will it make? Water consumption per cap-ita typically increases along with income, so how much water will be needed for the average person? What cul-tural values will emerge and how do they relate to water, water conservation, and the management of pollution?
The second question is what kind of settlements will people live in? Will urbanization take an extensive sprawling form of villas and gardens or will people live concentrated in apartment buildings? What choices are there in terms of managing the size and location of urban growth, such as satellite towns or mega cities? What are the constraints and what are the economic and social policy choices that favor particular patterns of development? What will be the specific needs of expanding cities for water, sanitation, and ecological services? How much water for consumption, for amen-ity, for leisure, and for recreation? What kinds of water management can be envisaged? Can a city within the basin, for example, be a “sponge city” (see box 8.1)? What are the water-related risks that have to be fac-tored into planning (for example, floods and drainage)?

73The Role of Desalination in an Increasingly Water-Scarce World
What provisions for wastewater collection, treatment, and reuse or disposal will be needed to preserve water quality?
The third question is what kind of economic activity? What role does agriculture play in the basin? Will the focus be on heavy or light industry? What is the pat-tern of development for the services sector? What kind of water demand will the expected or what will the planned pattern of economic development create? What wastewater will be produced and how will it be safely treated and reused? What will be the environ-mental footprint and how will this affect water resources? What are the options for less water- intensive or pollution-generating growth? How will water’s ecological services be protected and how will watercourses and water-related landscapes be pre-served for amenity and tourism?
Answers to these questions will allow scenarios to be developed. On the basis of this assessment of long-term development choices and trends, planning
scenarios can be developed, highlighting costs and benefits and the risks and trade-offs attached to each development scenario.
Assessing the Water-Related Implications of Each Scenario
For each scenario, the supply and demand balance, and gap can be calculated. This stage will assess the vol-umes, locations, and quality of water required for each scenario and evaluate the supply available to meet the demands. All components of demand need to be con-sidered, including hydropower, agriculture, municipal and industrial, amenity and tourism, navigation or fisheries, as well as the minimum environmental flow needed to sustain the riverine ecology.
The scenario analysis should take account of the resource, constraints, and the risks. The assessment of sources of supply would take into account the existing hydrology and infrastructure and how the hydrology might change, for example, under climatic changes.
BOX 8.1. China’s Sponge City Initiative
Rapid urbanization, poor water management, and drainage are large issues in China. More than 230 cities were affected by flooding in 2013. With cities getting bigger and climate change and climate variability threatening to bring more extreme weather, China has embarked on the sponge city initiative. A sponge city is a city that acts as a sponge with an urban environment planned and constructed to soak up almost every raindrop and capture that water for reuse. Instead of funneling rainwater away, a sponge city retains it for use within its own boundaries. The recycled water can be used to recharge depleted aquifers and to irrigate gardens and urban farms. When properly treated, the recycled water can replace drinking water and can be used to flush toilets or clean homes.
One example is the PPP project launched in Chizhou City (Anhui province) for a sponge city pilot program to improve resilience to extreme weather and simultaneously improve the Qingxi River basin environment. The three components include sewage and municipal drainage, the restoration of the Qingxi River, and sponge city construction measures including public parks and natural recreation areas. The project was so successful that in 2016 the city announced the expansion of the PPP.Sources: Austrade 2016; DRCSC 2017. Note: PPP = public–private partnership.

74 The Role of Desalination in an Increasingly Water-Scarce World
The assessment will need to inventory the corrective actions needed in the basin to maintain the integrity of the resource and to manage risks. Looking forward, this would assess needs for watershed management, resilience against floods and droughts, and risks from upstream transboundary developments, as well as security- and disaster-related risks.3 The assessment would also need to deal with the effects of past mis-management of groundwater (depletion, salinization, ground subsidence, and so forth), of pollution, of reduction in environmental flows, or of deforestation and erosion upstream in the basin.
The scenario analysis should also take account of the institutional context and capacity. Finally, the assess-ment would need to evaluate the institutional capacity for water planning and management and service deliv-ery under each scenario.
Evaluating Scenarios Iteratively and Making Decisions
For each scenario, the options for closing the supply- demand gap can be assessed. This stage brings together the supply and demand projections for each scenario, determines the gap between projected demand and current and projected supply, evaluates the options for closing the gap and costs, and assesses the broad economic, social, and political conse-quences of each.
A convenient methodology for this assessment is the cost curve approach developed by 2030 WRG (2030 WRG 2009),4 which is also known as the cost- effectiveness approach (CEA). Box 8.2 and figure B8.2.1 show how the cost curve can indicate the least cost ways of closing a supply-demand gap for Vietnam.5 One of the limita-tions of the traditional CEA approach is its lack of explicit
BOX 8.2. The Emerging Gap between Supply and Demand in Vietnam’s Red-Thai Binh Basin Can Be Closed by a Combination of Demand Management Measures in Agriculture and in Municipal and Industrial Water Use
The Red-Thai Binh is a diverse basin with significant rice production (15 percent of Viet Nam’s rice irrigation) and home to booming industrial areas and craft villages and large urban conurbations, such as the capital Hanoi. The basin is becoming increasingly water stressed, particularly during the dry season. A reduction in total annual water demand of 4.9 BCM annually would be required to move to a low water stress state.
The study calculated the cost curve that ranked feasible measures to reduce demand in the basin. In the figure B8.2.1, the least cost measures are on the left and the most costly are on the right. The width of each column measures how much water the measure would save, and the height of the column measures the cost in U.S. dollars for each cubic meter of water saved. The cost curve thus allows policy makers to prioritize the cheapest demand management measures.
In the Red-Thai Binh basin agricultural measures are the most cost-effective (with costs ranging from zero to less than US$0.1 per cubic meter) including sprinkler irrigation, AWD rice management practice, no till agricultural and irrigation scheduling, managing evapotranspiration using quotas, and SRI.
If all these measures were applied throughout the basin, the study estimates that approximately half of the water gap could be closed. Less cost-effective municipal and industrial interventions at an estimated US$0.2 per cubic meter to US$0.4 per cubic meter required to fully close the 4.9 BCM annual water gap. It is estimated that reducing the basin’s water stress level to “low” would require a total cost of US$2 billion.
box continues next page

75The Role of Desalination in an Increasingly Water-Scarce World
BOX 8.2. continued
FIGURE B8.2.1. Red-Thai Binh River Basin Cost Curve of Solutions to Reduce Water Stress in the Dry Season in 2030
–0.4
–0.2
0
AWD ricemanagement
2,500Water recycling(industrial parks)
Precision farming
Rice intensication (SRI)
5,000 Canal liningMillion m3
Incrementalavailability
Rainwater harvestingwith fertigationMunicipal wastewater reuse
Industrial wastewatertreatment
Sprinklerirrigation
0.2
Cost
of a
dditi
onal
wat
er a
vaila
bilit
y
0.4
0.6
0.8
1.0
1.2
1.4
1.6Irrigation scheduling
WEI gap in 2030 = 4,860 million m3
Cost to close the gap = 2,000 USD million
Faucets (new and retrot)
Pressure managementIndustrial meteringof non revenue water
Use of quotasMunicipalleakage
Municipal wastewatertreatment
Dual ush (retrot)
Drip irrigation
Zero discharge(industrial parks)
Induced water stress
Mulching
Institutional capacitybuilding for industries
Irrigationscheduling(satellite data)
Soiltechniques
1.8
2.0
2.2
2.4
2.6
2.8
3.0
S/m3
Agricultural Industrial Municipal
Source: Adapted from 2030 WRG/IFC 2017.Note: AWD = alternate wet and dry; BCM = billion cubic meters; SRI = system of rice intensification; WEI = water exploitation index.
accounting for externalities in water resources planning.6 Other evaluation options are also available, including the Multicriteria Approach (MCA) and Extended CEA approach, which incorporates externalities via economic analysis. Each has its advantages and disadvantages (see table 8.1).
An Extended CEA becomes a method of choice when the ranking of options and portfolios of options in terms of
relative dollar costs is the best means of communicating the choice involved to decision makers. Although placing dollar values on some sustainability impacts can be prob-lematic, it provides a critical relativity between impacts and direct costs and between choices among water sup-ply options and other public policy goals. Extended CEA requires the availability of sufficient data that can both measure and value the significant sustainability impacts of options as externalities. Alternatively, resources will be

76 The Role of Desalination in an Increasingly Water-Scarce World
needed to conduct the biophysical and valuation studies to collect that data. On the other hand, an MCA makes sense when it is recognized that decision making may involve multiple objectives and multiple viewpoints, and that there will need to be trade-offs between objectives and viewpoints. The MCA also makes sense when stake-holder participation is likely to be considered an import-ant part of the sustainability assessment process.
Each scenario can then be analyzed for implementability. This analysis would cover the capacity of institutions and agencies to implement the scenario. It would assess the administrative complexity, such as with
rivers that cross multiple administrative boundaries and when there are issues between central and local government. The analysis would also consider socio-economic factors like the number of stakeholders (and hence the extent of cooperation required) and the exis-tence of any cultural barriers (such as reluctance to reuse treated wastewater). The facility of scaling up is also a consideration: what might work at a local scale, such as regulation of groundwater extraction, might be very hard to implement over an entire basin.
Once analyzed in terms of implementation, each scenario can then be put into the policy context. Supply and demand
TABLE 8.1. Comparison of Economic Evaluation of Externalities in the Extended Cost-Effectiveness and Multicriteria Approaches
IRP principle Extended CEA MCA
An open and transparent planning process
In CEA the objective is clear. Alternatives are considered in relation to how cost-effectively they meet the objective. There is a potential loss of transparency in extending CEA, both in how externalities are valued and through including direct costs with externalities in a single dollar value.
The potential for openness is seen as one of the key strengths of MCA because all the objectives and criteria are usually clearly stated. However, whether criteria overlap and result in a form of double counting is commonly less clear.
Participatory planning process
It is technically possible to include stakeholder values in an extended CEA in a robust way with no significant stakeholder participation. However, stakeholder participation is a highly effective means of identifying and mapping stakeholder groups, as well as mapping out which impacts exist.
Stakeholder participation is essential for good practice in MCA, and advocates of MCA see the potential for stakeholder participation as a strength of the approach. Critics of MCA highlight the “gaming” that can result from stakeholders selecting assessment criteria.
Emphasizing least cost for meeting service needs
A key advantage of extended CEA is that it retains a focus on minimizing the cost of service provision.
Relative cost-effectiveness can easily be lost in MCA. It can then be difficult to demonstrate that the final portfolio of options selected to meet the goals and objectives of a water strategy do so cost-effectively.
Integrating demand management with increased supplies
Emphasizing least cost highlights that many demand-management options are low impact and highly cost-effective.
With MCA, highly cost-effective demand-management options may be missed if only options popular with stakeholders (such as reuse and rainwater tanks) are with large-scale supplies.
Integrating often conflicting economic, environmental, and social objectives
There are inherent difficulties in measuring all economic, environmental, and social values of sustainability impacts in dollar terms. The potential exists for impacts that will be considered “intangibles.” For some impacts, there is unlikely to be the data required to make the links from the source of the externality through the changes in the biophysical environment to who is affected and to what extent.
MCA can be well suited to integrating multiple, often conflicting, objectives, and various MCA methodologies are designed to do just that. MCA can incorporate some impacts that cannot be valued adequately in dollar terms when the links are difficult to establish quantitatively. However, the extent to which the results of assessments against different criteria can sensibly be aggregated need to be considered.
Source: National Water Commission 2011.Note: CEA = cost-effectiveness approach; IRP = integrated resource planning; MCA = multicriteria approach.

77The Role of Desalination in an Increasingly Water-Scarce World
also have to be put into the overall policy context, consid-ering the impact of policies on supply and demand. For example, energy subsidies in agriculture are a powerful driver of water overuse, or regulation is a classic approach to pollution, but implementation often falls very short.
The incentive structure is also critical. What incentives do stakeholders have to cooperate, for example, to adopt more water-efficient irrigation practices or to pretreat industrial effluent, or to make factories more water efficient? The report by 2030 WRG suggested the “end user payback curve” as a tool for quick assess-ment of incentives: the shorter the payback period before a farmer or an industrialist or a consumer sees a return on their investment, the more likely they are to adopt the incentive.
For each scenario, the costs, benefits, risks, and feasibil-ity can be assessed, and the trade-offs analyzed.7 Policy makers can then proceed to a decision and to action.
Downscaling the Basin Analysis at the Local Level
Although options for balancing supply and demand start at the basin level (Step One), these options can only be a general guide to solutions at the local level. Local needs and specifics require a much more precise local analysis within the overall basin planning frame-work. Although water saving in agriculture may be the cheapest overall solution to a supply-demand imbal-ance at the basin scale, a large city needs to be able to ensure its very specific water supply needs by identify-ing reliable sources of the supply of quality water in the long term. The following steps will help planners at this local scale identify the gap to be filled and the options for filling it:
1. Select and specify the demand that is being evaluated, for example, the water supply demand of an urban agglomeration or of a water-using industrial complex
2. Follow the methodology of Step One to assess water supply and demand over the long term (30 years, for example) for the specific need identified (the city,
the industry) and identify the size, location, and the timing of the gap for this specific need.
3. Identify options for demand management and sup-ply augmentation to close the water demand gap for the need identified.
4. Identify the range of options for the next invest-ments to fill the demand gap over the 30-year period, identifying both demand management and supply management options and adopting an integrated intersectoral approach. For example, the options might include the following:
• Improving water productivity in agriculture and negotiating for the release of surface and ground-water from agriculture and for transfer of this water to the city or industry
• Optimizing TSE reuse and increasing supply to agriculture, releasing fresh water from agricul-ture for the city or industry
• Agreement from government to supply the needed water to the city or industry by realloca-tion (for example, Israel’s switch in use of the Sea of Galilee water from agriculture to urban supply)
• A city or industry contracting to secure water from upstream users by direct negotiation (for exam-ple, with farmers or forest dwellers upstream in the watershed)
• Agreeing with government on harnessing runoff or river flows and diverting the water to urban or industrial supply
• With government agreement, developing new groundwater wellfields specifically reserved for the city or industry
5. Cost each option at the marginal cost of water sup-ply (dollar per cubic meter) when the cost explicitly considers the following:
• Like-for-like quality of water at point of use or con-sumption, that is, ex-tap, not ex source or ex-factory
• Eliminating explicit or implicit subsidies from the calculation

78 The Role of Desalination in an Increasingly Water-Scarce World
• Long-term socioeconomic impacts
• Environmental externalities such as sustaining ecological services, groundwater depletion, or saline intrusion
6. Prepare the cost curve, ranking each option by cost and quantifying its contribution to closing the sup-ply-demand gap over time.
7. Assess risks to security of supply, including both risks to existing source of supply and risks to each of the proposed options. These risks may include the following:
• Climate risks of changing meteorological and hydrological patterns, risks of extreme events, and so forth
• Risks of natural disasters such as earthquakes and landslides
• Land use changes that may affect the quan-tity, quality, and timing of water availability (for example, deforestation, urban development in the catchment, change in agricultural uses)
• Technical and management risks that might affect supply (for example, the timing and size of releases by hydropower installations, deteriora-tion of supply caused by neglect of O&M)
• Political and geopolitical risks8
• Risks of change in the raw material include the following:
– In the case of desalination, this risk might include increasing temperature, increasing risk of biophysical fouling, and changes in salinity or sea level.
– In the case of freshwater sources, it may include depletion of groundwater, increasing salinity, seawater intrusion, and so forth.
8. Rank alternatives with each option accompanied by its pros and cons.
9. Identify policy decisions and recommendations that would be required by each of the alternatives and assess their feasibility.
Box 8.3 illustrates how one country, Singapore, has planned its water supply to 2060, with desalination occupying an important place.
If Step Two identifies desalination as a possible source of supply to meet a water supply-demand gap for the specific market considered, the next step is to assess whether the physical, economic, and institutional conditions exist to make desalination a realistic option.
BOX 8.3. Singapore Plans for Water Autonomy through Desalination and Wastewater Reuse
Singapore is a small island state with a dense population of 5.3 million on a land area of 710 square kilometers.
With limited land to collect and store rainwater, Singapore faced drought, rationing, floods, water pollution, and inadequate sanitation in the early years after independence. It was also heavily reliant on raw water imported from Malaysia.
Water demand in Singapore is currently about 2.5 million cubic meters daily, with households consuming 45 percent and the nondomestic sector consuming the rest. Consumption per household is currently 149 liters a day. By 2060, it is estimated that Singapore’s total water demand could go up by at least half, with nondomestic consumption accounting for around 70 percent of the total.
box continues next page

79The Role of Desalination in an Increasingly Water-Scarce World
Assessing Whether the Physical, Economic, and Institutional Conditions Exist to Make Desalination a Prima Facie Option
Chapter 2 highlighted the conditions under which desalination might be a viable option to meet a specific segment of a water demand gap. In summary these conditions include the following.
Desalination is appropriate to meet only a certain type of demand. Typically, desalination is an option when
• The demand gap is for a high-value market, particu-larly urban water supply and industrial uses;
• The value of water is high and when there is high willingness to pay;
• Demand is concentrated, typically for major cities and industrial complexes; and
• The location is appropriate to desalination technol-ogy, typically near the raw material (usually the sea),
and near the market or point of use and not too far below it in terms of elevation (the most common location is alongside a coastal city).
Desalination projects are large and costly and this cre-ates a series of institutional requirements and oppor-tunities. Desalination projects tend to be large to very large because there are significant economies of scale and because a large plant is usually needed to meet demand. The implications are that the munici-pality or country has to be able to handle the devel-opment, financing, and management of a mega project. Because this kind of project is more appro-priate for private sector and international invest-ment, there need to be the policies and frameworks in place to allow and encourage this. Finally, because the cost is high and urban water supply is typically run as a business, there has to be consumer willing-ness and ability to pay.
BOX 8.3. continued
To meet these challenges, the PUB, the authority responsible for water in Singapore, has taken an integrated approach to water planning. It has set and long met service standards of 100 percent coverage for supply of potable water at tap and 100 percent sanitation.
As demand for water continues to increase in tandem with population and economic growth, the PUB is carrying out advanced planning to 2060 and is progressively building additional water infrastructure to secure an adequate and affordable supply of water for future generations.
PUB’s strategy is to (1) reuse water “endlessly,” (2) collect every drop of water, and (3) desalinate more water (for more information about PUB, see the website www.pub.gov.sg). PUB refers to the “four taps”, which include local catchment water from rainfall, imported bulk supply from Malaysia, “NEWater” (treated wastewater), and desalinated water. By 2060, PUB estimates that NEWater and desalinated domestic water will meet up to 85 percent of Singapore’s water needs (see table B8.3.1). Overall source: Delmon 2018.Note: PUB = Public Utilities Board.
TABLE B8.3.1. Share of Water Sources in Singapore’s Water Supply 2017 and Projection for 2060
2017 2060
m3/day % m3/day %
Local catchment 100 5 546 15
Imported water 1,136 58 — 0
NEWater 773 40 2,000 55
Desalinated water 455 25 1,091 30
Total 2,464 3,637
Source: Kah Seng 2017

80 The Role of Desalination in an Increasingly Water-Scarce World
Quality factors may also affect the choice. Less saline waters are cheaper and easier to deal with, and seawater pollution can seriously affect the process. Thus, the qual-ity of the feedwater may affect costs and hence the choice of desalination over other sources and also the choice of technology if the desalination option is chosen.
Feasibility and Risk Screening for Desalination Options
This step comprises a four-part methodology to estab-lish the feasibility of desalination options and to screen options for their respective risks: (1) selecting the most appropriate technology, (2) assessing and quantifying risks and their mitigation, (3) assessing the external and internal political economy, and (4) evaluating the policy and institutional framework. At the end of the section, a checklist provides a summary of the main factors to be taken into account.
Selecting the Most Appropriate Technology
This step requires an outline framework for choice of technology, which would take into account all the fac-tors discussed in chapters 3 to 7, and particularly the following:
• RO desalination is the most cost-competitive tech-nology for less saline environments.
• Depending on economy of scale, thermal is some-times more competitive for higher salinity envi-ronments, especially when colocation with power plants is an option.
• MSF is the most expensive desalination technology in terms of CAPEX, but it is easier to operate and yields higher economy of scale benefits for mega-size projects than RO.
• MED-TVC technology is more cost-competitive than MSF for small- and medium-size desalination projects.
• Source water conditions make a big difference to both technology choice and costs.
• Hybrid MED thermal/RO projects can be the most cost-competitive.
Assessing and Quantifying Risks and Their Mitigation
The assessment of risks would include (1) technical risks, such as delays in construction (see box 8.7 for the case of Tampa in Florida); (2) the risk of adopting or not adopting innovative technology (e.g., will it break down?) and management risks (e.g., is the tech-nology easy to manage? Do the skills exist or can they readily be developed?); (3) risks of escalation in O&M costs, for example, rise in energy prices and ways of laying off that risk (see the example from Israel in appendix A); (4) transboundary risks, for example, the risk that untreated sewage from Gaza will drift up the coast and pollute the Israeli desalination plant at Ashdod or, conversely, the risk of insecure or condi-tional energy supply from Israel to the proposed desalination plant in Gaza; and (5) security risks, for example, the risk of war to the multiple desalination plants in the Arabian Gulf.
Assessing the External and Internal Political Economy
There are factors of the external political economy of desalination that may need to be considered. (1) The value of water autonomy and self-sufficiency (and related energy autonomy), which reduces depen-dence on other countries for this essential resource, has been a factor in driving desalination for Singapore (see box 8.3) and for Israel, and the same motive is driving the Palestinian proposals for a plant in Gaza that would eliminate dependence on water imported from Israel. (2) The value of water security that turns a country from being water scarce to becoming water surplus. Again Israel provides an example by using the surplus water now available from its desalina-tion plants as part of its diplomatic strategy in the region.9
There are internal political economy factors regard-ing desalination that may need to be considered. (1) Resolution of intersectoral competition for water, for example, the adoption of desalination for cities,

81The Role of Desalination in an Increasingly Water-Scarce World
reduces the pressure on other sectors such as agricul-ture to release water. The California Coast desalina-tion plants are a good example of this. (2) There is a need to meet the concerns of certain constituencies about the economics and affordability of desalination
(see box 8.4 for concerns about the decision to develop “standby” desalination in Sydney, Australia) and concerns over the environmental and health impacts (see box 8.5 for public health concerns over iodine deficiency in Israel).
BOX 8.4. Controversy over the Decision to Build the Kurnell Desalination Plant in Sydney
Sydney summers during the first decade of the twenty-first century saw significant declines in dam storage levels. A state of drought in the catchment area existed between March 2001 and at least January 2007. In June 2005 dam levels dropped to 40 percent, and the government imposed drought restrictions on water use.
The 2006 Metropolitan Water Plan stated that if dam storage dropped to 30 percent, then recourse should be construction of desalination facilities because they would be completely independent of rainfall and therefore drought proof. Soon after, in February 2007, reservoir levels reached their lowest recorded point of 33.8 percent. The government gave the go-ahead to construct the Kurnell Desalination Plant.
Production commenced in 2010. However, the drought had ended and by July 2012, when the dam storage level reached 90 percent capacity, the government directed the plant to cease production. It was decided that production would recommence when dam storage levels reached 60 percent and would continue until dam storage levels reached 70 percent.
There was an immediate outcry. Sydney Water had entered into a 50-year lease with Veolia and it was reported that the desalination plant was costing the taxpayers US$534,246 per day just to sit idle and that to turn it off completely would cost an extra U$50 million. Environmental economists from the Australian National University said that the project was “a costly decision that did not need to be made.”
However, the government argued that as Sydney’s population expands, the desalination plant will progressively become part of the “base supply” because the population is forecast to grow by around 1.5 million people by around 2035. Already there are plans to double the plant capacity.Sources: New South Wales Office of Water 2017; Trembath 2012.
BOX 8.5. Desalinated Water Use in Israel Causing Alarming Iodine Deficiency in People
The first national iodine survey conducted in Israel revealed a high burden of iodine deficiency among Israelis, posing a high risk of maternal and fetal hypothyroidism, impaired neurological development of the fetus, and reduced intellectual functioning of young children.
The survey report, prepared by researchers from the Hebrew University of Jerusalem and ETH Zurich in Switzerland, with support from the Iodine Global Network, suggested a possible link between seawater desalination and iodine deficiency, finding particular deficits among adults exposed to iodine-poor water concurrently with an increasing proportion of their area’s drinking water coming from seawater reverse osmosis.Source: Kloosterman 2017.

82 The Role of Desalination in an Increasingly Water-Scarce World
Evaluating the Policy and Institutional Framework for Project Choice, Financing, Delivery, and Operation
Experience shows the need for institutional capacity and for an enabling framework. Mega projects require insti-tutional capacity in the public sector and the availabil-ity of trusted consultants, notably economic and water resources planning skills, specific capacity in the eco-nomics and engineering of desalination, and project delivery and financing expertise.
In addition, the receiving utility needs the capacity to be able to deal with so large a project. It needs to have the institutional capacity needed to plan, contract for, and oversee project delivery and operation. Its finances need to be on a sound footing, with a full cost recovery tariff policy, established consumer willingness to pay, and overall financial viability of operations. The utility oper-ations need to be technically sound, with control over unaccounted water and leakages; it makes no sense to pour high cost desalinated water into a leaky system.
The legal and regulatory framework for water supply needs to protect public and consumer interests.
The enabling environment for private investment and PPPs needs to be sound. In particular, the environment for PPP and FDI needs to be conducive, that is, able to
attract private participation while protecting the public interest. Financial markets need to be mature, and the options for project financing need to be least cost.
The different project delivery options, such DBB, DBO, and BOOT, and financing structures need to be evalu-ated and decisions made (see chapter 7 and box 8.6).
On this basis the evaluation should identify the policy, regulatory, and institutional changes that would need to be made to accompany the desalination investment.
The challenges are many and the risks from inex-perience remain high. Box 8.7 illustrates the case of the Tampa Bay Seawater Desalination Plant, which passed through three contractor bankrupt-cies, had major design problems, and was delivered late and 50 percent over budget. The problems stemmed mainly from the inexperience of both the commissioning authority and the contractors with the technology. Clearly, technologies, institu-tions, and delivery models are progressively matur-ing, but the risks of inexperience remain high. The Tampa Desalination Plant has been in continuous operation since the plant operations were awarded to the private contractor team of American Water and Acciona Agua in 2008. A more recent example is the Singapore desalination program’s experience
BOX 8.6. Benefits and Challenges of Public–Private Partnerships in Singapore
Singapore’s PUB has used PPP approaches to construct and operate its desalination and treated wastewater plants. Under this approach, the design, financing, construction, and O&M are undertaken by the same company or consortium. Singapore has found that this approach has both benefits and challenges.
Benefits:
Optimal whole life costing. Using the “optimal life cycle costing” approach instead of the “lowest capital cost” approach gives a strong incentive for the private concession company in designing and building the plant to optimize the O&M costs of the facility. For example, in the Sembcorp NEWater Plant the concession company incorporated a number of energy-saving features in the plant design to lower the operating costs. All pumps have variable speed drives to maximize energy efficiency. Interstage energy recovery turbines (turbo boosters) were also installed in the RO membrane trains to reduce their energy consumption.
box continues next page

83The Role of Desalination in an Increasingly Water-Scarce World
BOX 8.6. continued
Increased Innovation. The technical requirements for the Sembcorp DBOO project were mostly performance based, with the quality and quantity of water as the key performance criteria. This approach allowed the concession company more flexibility to innovate and optimize the plant design. Examples of innovation and optimization in the design included stacking RO pressure vessels higher than normal to reduce the building footprint.
Greater opportunities for private sector business and expertise. The PPP DBOO procurement approach also offers greater business opportunities for the private sector in Singapore’s water industry because the private sector partner not only designs and builds the facility, but also finances, operates, and maintains the plant. This procurement approach creates new business opportunities for the private sector in Singapore to be involved in service delivery to the public sector.
Challenges:
The approach is more complex than a traditional procurement, so PUB needed to have the skills to
• Prepare comprehensive DBOO bid documents, which cover legal, financial, commercial, and technical aspects of the project;
• Conduct a fair and thorough evaluation of all DBOO bids;
• Manage the performance of the private sector service provider; and
• Manage the relationship long term with the private sector service provider.
Source: Gunawansa 2010.Note: DBOO = design-build-own-operate; O&M = operation and maintenance; PPP = public–private partnership; PUB = Public Utility Board; RO = reverse osmosis.
BOX 8.7. The Tribulations of the Tampa Bay Seawater Desalination Plant
The Tampa Bay Seawater Desalination Plant is the largest seawater desalination facility in the United States. Intended to help reduce the growing demand on the area’s aquifers, it produces 25 million gallons per day (95,000 cubic meters) of drinking water and provides 10 percent of the region’s drinking water supply.
Conceived in the early 1990s, the plant had a troubled history, including the bankruptcy of three of the companies involved and a dispute over ownership and control that reached the federal courts. The plant only became fully operational in 2008. The initial project budget was US$110 million, which rose to US$158 million by completion.
In October 1996, Tampa Bay Water issued an initial call for proposals for the plant and in July 1999 it awarded the contract to S&W Water, which was a joint venture between Stone and Webster and Poseidon Resources, on a DBOOT basis.
The project involved the construction of a SWRO plant, a seawater intake, concentrate discharge system, chemical storage and dosing facilities, and 24 kilometers (15 miles) of product water transmission main.
box continues next page

84 The Role of Desalination in an Increasingly Water-Scarce World
with the contractor of two of its largest plants. The contractor, Hyflux, declared bankruptcy putting the project operation responsibilities in jeopardy.
Decisions
After completing the first four steps, the government or municipality will be in a position to compare the desalina-tion option(s) with the alternatives in terms of feasibility, cost and financing, risk, political economy, and institu-tional readiness and changes needed. It also will able to propose the technology and outline technical parameters of the project, together with the delivery method and financing. Given the economic, social, and environmen-tal implications of adopting desalination, good practice would be to conduct extensive public consultations before and during the feasibility studies to ensure there is adequate buy-in from a wide range of stakeholders.
It is also important not to look at decisions as rigid and a one-time off action; instead, they should be seen as dynamic and something that requires continuous monitoring, evaluation, and review.
As costs of desalination continue to fall and as the likelihood of growing supply-demand gaps increases, desalination will certainly become more commonly used. The future may thus be seen in the success of desalination in countries that have widely adopted it, for example, the Gulf countries, Singapore, or Israel.10 Ultimately the test is the economic viability and cost-competitiveness of desalination compared with other options, together with the institutional, political, social, and environmental feasibility and the ability to manage risks of financing, implement-ing, and operating mega projects and innovative technology.
BOX 8.7. continued
Construction was slated to commence in 2001 on a site adjacent to Tampa Electric’s Big Bend 2,000-megawatt power station. However, in 2000, Stone & Webster declared bankruptcy, leaving Poseidon without a partner. Later that year, with performance deadlines looming, Poseidon teamed up with Covanta Energy. A year into the project Coventa also declared bankruptcy. A new company, CTC, was created to complete the plant, and in August 2001 construction finally began.
However, early in 2002, it became clear that the joint venture had been unsuccessful in securing long-term financing. Tampa Bay Water decided to buy out Poseidon’s interest in the project and push forward allowing them to save US$1 million a year in financing charges, while retaining CTC to finish the job.
Several deadlines were missed and when in 2003 a test run produced the first 20,000 cubic meters of water, a performance test revealed 31 deficiencies in the plant, including excessive membrane silting and Asian green mussels clogging the filters. Yet another default on the contract followed and CTC also went into bankruptcy.
Following court hearings, Tampa Bay Water took back control and awarded a contract to fix the plant, payable on completion, to American Water/Pridesa. Major remediation work included redesigning and replacing all the first-pass membranes and modifying the chemical facilities, pretreatment system, flocculation, and sedimentation together with the sand filters and a number of pumps, and the installation of an additional filtration system. Remediation work began in October 2005 and concluded in February 2010 with two final performance tests. Source: Water Technology 2018.Note: DBOOT = design-build-own-operate-transfer; SWRO = seawater reverse osmosis.

85The Role of Desalination in an Increasingly Water-Scarce World
Checklist: Feasibility and risk screening for desalination options
1. Select the most appropriate technology using an outline framework for choice of technology taking into account the following factors:
• RO desalination is the most cost-competitive technology for less saline environments
• Thermal is more competitive for higher salinity environments
• MSF is the most expensive desalination technology in terms of CAPEX, but it is easier to operate and yields higher economy of scale benefits for mega-size projects than RO
• MED-TVC technology is more competitive than MSF for small- and medium-size desalination projects
• Source water conditions make a big difference to both technology choice and costs
• Hybrid thermal/RO projects can be the most competitive but only where cheap energy is periodically available
2. Assess and quantify risks and their mitigation, including:
• Technical risks such as delays in construction, the risk of adopting (or not adopting) innovative technology, and management risks (Will it break down? Is it easy to manage?)
• O&M cost risk, for example, rise in energy prices
• Strategic risk such as pollution risk (sewage from Gaza at Ashdod): Can it be attacked militarily (Gulf)? Is the energy supply secure (Gaza)?
3. Assess the external and internal political economy, including
• The value of water autonomy self-sufficiency, reduction of dependence (and related energy autonomy). for example, Singapore, Israel, and Gaza
• Generating a water surplus that can be used strategically (part of the Israel-Jordan peace deal)
• Intersectoral interests, for example, adoption of desalination for cities reduces the pressure on other sectors such as agriculture to release water
• Political and consumer acceptance of desalination and willing to pay (WTP)/affordability
4. Evaluate the policy and institutional framework for project choice, financing, delivery, and operation:
• Mega projects require institutional capacity in the public sector and the availability of trusted consultants:
– Economic/water resource planning skills
– Economic/desalination engineering expertise
– Project delivery and financing expertise
• The receiving utility needs to be able to deal with such a large a project:
– Institutional capacity to plan, deliver, and operate and to contract for and oversee project delivery and operation
– Financial soundness, with a full cost recovery tariff policy, established consumer willingness to pay, and overall financial viability of operations
– Technical soundness, with control over unaccounted for water and leakages
• The legal and regulatory framework for water supply needs to protect public and consumer interests
– The environment for public–private partnerships (PPP) and foreign direct investment (FDI) needs to be conducive, that is, be able to attract private participation while protecting the public interest
– Financial markets need to be mature and the options for project financing need to be least cost
– Identify the policy, regulatory, and institutional changes that would need to be made to accompany the desalination investment.

86 The Role of Desalination in an Increasingly Water-Scarce World
Notes1. In some cases, for example where there is a cluster of basins near
each other, planning may be initiated at the regional scale: the “southeast river cluster” in Vietnam is treated as a single planning unit. A regional approach may also be taken when there is a prima facie case to be examined for transferring water from one basin to another, for example, when there is one very water short basin and one excess water basin with relatively low transfer costs between them. Globally, there are hundreds of such projects, largely in North America, Australia, China, and India. A notable recent example is the South–North Water Transfer Project in China, which is designed to ultimately channel 44.8 billion cubic meters annually from the Yangtze River in southern China to the more arid and industrialized north through three canal systems. The economic, social, environ-mental, and political hurdles to interbasin transfer are often considerable.
2. Long-term planning and decisions on that basis, however, have their own challenges as technologies evolve and cheaper options become widely available.
3. For example, dam projects are vital to water security, but they are highly vulnerable to earthquake risks. In fact, management of seismic risks can also be an important factor in the feasibility and location of desalination plants. The Carlsbad SWRO plant in California was sited below the fault line in view of the risk of earthquake.
4. The “cost curve” approach calculates the marginal cost of adding a unit volume of water through a given technical intervention.
5. Note that in the case illustrated in box 8.2, demand-side measures are enough to eliminate the supply-demand gap. In practice, supply side measures would also be considered, especially because these bring other benefits such as flood control and drought residence. In addi-tion, in certain cites, particularly those along the coast, desalination may be a local option.
6. Definitions vary, but broadly, externalities are the unintended side effects (or “spill over effects”) of an action taken by one party that affect the wel-fare of another party and have not taken place through a market transac-tion between the parties. Externalities may be positive or negative.
7. Some measures are more complicated than others to estimate, for example, drip irrigation. At a farm level, drip irrigation can have massive efficiency impacts, but at an aggregate level there may be a different impact. By reducing return flows, this measure could actually reduce the supply available to others currently dependent on these flows, therefore, diminishing the true aggregate impact on closing the gap.
8. Internal political risks have become more prevalent in civil conflict in recent years, such as with the “weaponization” of water by ISIS in Syria. Geopolitical risks to water security exist wherever there is transboundary water or dependence of one country on another for water or when water supplies are vulnerable to military action.
9. For instance, Israel’s new-found water surplus has enabled it to give up some water to Jordan from the Sea of Galilee as part of the Israel/Jordan peace deal.
10. The case of Israel is described in a case study in appendix B.

87The Role of Desalination in an Increasingly Water-Scarce World
TABLE A.1. Breakdown of Capital Costs of Desalination Projects in the Middle East and North Africa Region
Cost itemPercent of total capital cost
Thermal desalination projects SWRO desalination projects
Construction costs
• Site preparation, roads, and parking 1.0–1.5 0.5–1.5
• Intake 6.5–8.0 4.5–6.0
• Pretreatment 2.5–3.5 8.0–10.0
• Desalination system (MSF, MED, RO) equipment 46.0–50.0 30.0–35.5
• Posttreatment 1.5–2.5 1.0–2.0
• Concentrate and cooling water disposal 3.0–4.0 1.5–2.0
• Waste and solids handling 0.5–1.0 0.5–1.5
• Electrical and instrumentation systems 2.5–5.5 1.5–2.5
• Auxiliary equipment and utilities 3.5–4.0 1.0–1.5
• Buildings 1.0–2.0 2.5–3.5
• Start-up, commissioning, and acceptance testing 2.0–3.0 1.0–2.0
Subtotal construction costs (percentage of total capital costs) 70.0–85.0 52.0–68.0
Project engineering services
• Preliminary engineering 1.0–1.5 1.5–2.0
• Pilot testing 0.0–0.5 0.0–1.5
• Detailed design 2.5–4.5 6.0–8.0
• Construction management and oversight 1.5–2.0 2.5–3.5
Subtotal engineering services 5.0–8.5 10.0–15.0
Project development
• Administration, contracting, and management 1.0–2.5 1.5–3.5
• Environmental permitting (licensing) 1.0–2.0 3.5–4.0
• Legal services 0.5–1.0 1.0–1.5
Subtotal project development 2.5–5.5 6.0–9.0
Project financing costs
• Interest during construction 0.5–1.5 1.0–2.5
• Debt service reserve 1.5–3.5 3.5–5.0
• Other financing costs 0.5–1.0 1.5–2.5
Subtotal project financing 2.5–6.0 6.0–10.0
Contingency 5.0–10.0 10.0–15.0
Subtotal indirect costs (percentage of total capital costs) 15.0–30.0 32.0–48.0
Total capital costs 100% 100 %
Source: World Bank 2017a.Note: SWRO = seawater reserve osmosis.
Appendix ABreakdown of Costs of Desalination Projects in the Middle East and North Africa Region

88 The Role of Desalination in an Increasingly Water-Scarce World
TABLE A.2. Breakdown of Operation and Maintenance Costs of Desalination Projects in the Middle East and North Africa Region
Cost itemPercentage of total O&M costs
Thermal desalination projects SWRO desalination projects
Variable O&M costs
• Thermal energy 49.0–55.5 0.0
• Electrical energy 8.0–20.0 37.0–45.0
• Chemicals 3.5–5.0 10.0–12.0
• Replacement of membranes and cartridge filters 0.0 4.0–6.0
• Waste stream disposal 1.5–2.5 2.5–5.0
Subtotal-variable O&M costs 62.0–83.0 53.5–68.0
Fixed O&M costs
• Labor 6.5–11.0 12.0–14.5
• Maintenance 5.0–9.0 13.0–15.0
• Environmental and performance monitoring 1.0–2.5 2.0–5.0
• Indirect O&M costs 4.5–15.5 5.0–12.0
Subtotal-fixed O&M costs 17.0–38.0 32.0–46.5
Total O&M costs 100 % 100%
Source: World Bank 2017a.Note: O&M = operation and maintenance; SWRO = seawater reverse osmosis.

89The Role of Desalination in an Increasingly Water-Scarce World
Israel’s Sorek Plant Has Set Significant Benchmarks that Indicate Future Pathways for Desalination
The Sorek Desalination Plant is the world’s largest and most advanced SWRO desalination plant. A special pur-pose company, Sorek Desalination Ltd. (SDL), was established to execute the project. The shareholders in the joint venture are IDE Technologies Ltd. (51 percent) and Hutchison Water International Holdings Pvt Ltd. (HWIH) (49 percent). The plant provides municipal water to about one-fifth of the Israeli population, which is approximately 1.5 million people. The plant sets sev-eral significant industry benchmarks in desalination technology, environmental protection, financing, and water cost (World Bank 2017a, b).1
Technological Innovation
Sorek Uses Innovations in Desalination Technology that Reduces Costs
Technological innovations included the adoption of a pressure center design that allows flexibility to increase and decrease production together with higher efficiency and lower costs; the use of large diameter (16-inch) membrane elements that allow a smaller footprint, easier operation, and less fouling; and the provision of dual energy sources that allow the plant to switch to the cheaper source at different times to achieve a considerably lower total energy cost (see box B.1).
Appendix BCase Study: The Sorek Desalination Plant in Israel
BOX B.1. Technological Innovation at Sorek Increases Efficiency and Flexibility, which Reduces Costs
The pressure center concept allows flexibility to increase and decrease production together with higher efficiency and lower costs. First used successfully in the Ashkelon Plant, and later also in the Hadera and Sorek Plants, the pressure center design makes use of horizontal centrifugal axially split high-pressure pumps, with an optimized size to achieve the highest efficiency. The pressure center offers economy of scale and simplified erection, and allows feed pressure to the RO trains to be increased and decreased. This allows all RO trains to remain operational during periods of reduced production, decreasing system recovery without increasing the total feed to the plant. The design has demonstrated great reliability, higher efficiencies, and greater flexibility under variable operational modes, together with lower CAPEX and OPEX costs.
Large diameter (16-inch) membrane elements allow a smaller footprint, easier operation, and less fouling. The design incorporates 16-inch membrane elements in a vertical PV array. These large membranes behave identically to 8-inch membranes with the same salt rejection performance. Because of the much greater surface area, the membranes accommodate flow rate that is 4.3 times larger but under the same feed pressure and operation conditions. This configuration allows a smaller plant footprint, together with the use of shorter HP pipe headers and an improved membrane loading method. Further, because the volumes of feedwater are larger, the tendency for membrane fouling is less, leading to a significant reduction in membrane handling for maintenance purposes.
box continues next page

90 The Role of Desalination in an Increasingly Water-Scarce World
Environmental Innovation
Pipe Jacking of Both Feed and Brine Pipelines Minimized Environmental Impacts and Will Contribute to Longer Pipe Lifetime
To minimize the plant’s environmental impact, pipe jacking2 was used to install the large diameter feed and brine pipelines. This minimized disruption of the sea-bed and the impact on existing infrastructure and nav-igation is expected to result in longer overall pipeline lifetime. A series of other measures prevent, minimize, or mitigate environmental impacts of the plant’s oper-ation (see box B.2).
Innovation in Project Financing
Innovation in Financing the Sorek Plant Helped Keep the Bid Price Down
It is reported that the Sorek project set a new bench-mark for the price of desalinated water of just US$0.58 per cubic meter at the time of the bid (October 2009). Even though the financial package was put together during the global financial crisis, with unstable financial markets and a shortage of liquidity, it allowed the consortium to reduce its financing costs (see box B.3).
BOX B.1. continued
The ability to switch between two energy sources at different times produces a considerably lower total energy cost. The Sorek plant has two alternative energy sources to minimize the cost of the electrical power needed for the process without compromising reliability. A self-generating energy supply system (IPP) fueled by natural gas is the primary source, and the plant also can switch to cheap energy off-peak through a 161-KV overhead line from the grid. Switching between these two sources results in lower electricity costs that contribute to a lower overall water price.
Sources: World Bank 2017a,b.Note: CAPEX = capital expenditure; IPP = independent power producer; OPEX = operating expenditure; PV = pressure vessel; RO = reverse osmosis.
BOX B.2. Sorek Used Multiple Measures to Reduce Environmental Impacts of the Plant’s Operation
· The feedwater pumping station is located far (2,400 meters) from the coastline, and feedwater flows by gravity to the on-site pumping station.
· Entrainment and impingement effects at the intake system are minimized, thus minimizing the consumption of electricity and chemicals (especially CO2) and reducing the emission of related GHG, air pollutants, and noise.
· Environmentally friendly antiscalants and inorganic and treatable cleaning solutions are used.
· Brine is discharged back to the sea approximately 2 kilometers offshore and at a depth of 20 meters through a specially designed outfall system (diffusers) that enhances quick brine dilution to the seawater body. The critical parameters of the brine disposal are monitored online 24 hours per day, seven days per week.
· The plant is equipped with a special sludge treatment system to treat any effluents generated in the process. This system removes all suspended matter, and only clear water is discharged to the sea.
Source: World Bank 2017a.

91The Role of Desalination in an Increasingly Water-Scarce World
Notes1. The success behind advanced SWRO desalination plants, including
the Sorek SWRO plant in Israel, is also available at http://www.filtsep .com/desalination/features/success-behind-advanced-swro - desalination -plant/.
2. Pipe jacking, generally referred to in the smaller diameters as microtunneling, is a technique for installing underground
pipelines, ducts, and culverts. Powerful hydraulic jacks are used to push specially designed pipes through the ground behind a shield at the same time as excavation is taking place within the shield. This method provides a flexible, structural, watertight, finished pipeline as the tunnel is excavated. For more information see http://www.pipejacking.org.
BOX B.3. Innovations in Project Financial Engineering Helped Keep the Costs of Sorek Down
· A two-tranche project finance package was created with a trio of local and international lenders: an Israel-based tranche in New Israeli Shekels, and a tranche in Euros.
· This lending, which covered 80 percent of the total project cost, is classed as senior debt. The remaining 20 percent of the costs was financed by equity injected by the shareholders.
· A mechanism is provided to hedge against changes in the exchange rates, relevant inflation, and base interest rates applicable to these currencies.
· The consortium also structured an equity bridge facility, which includes a standby facility and a working capital facility.
Source: World Bank 2017a.


93The Role of Desalination in an Increasingly Water-Scarce World
How a long-term strategy, technological innovation, well-designed PPP arrangements, and government guarantees helped Israel achieve record low prices for desalinated water
Water security drove Israel’s decision to invest heavily in desalinationIn the early 2000s, realizing that Israel faced structural water scarcity, the government made the strategic decision to develop desalination plants on a large scale. The aim was that most of the water supply for municipal consumption would come from desalinated water to ensure the country’s water security (World Bank 2017b).
Over the last decade, the country has invested in five mega plantsThe parallel discovery of gas reserves offshore, which enabled the country to produce energy more cheaply, facilitated this strategic choice. Over the last 15 years, five mega desalination plants based on SWRO have been constructed along the Mediterranean with a total capacity of 585 million cubic meters per year. Four of plants were developed through PPPs with private con-cessionaires under build-operate-transfer (BOT) and build-operate-own (BOO) schemes. Desalinated water now supplies 85 percent of domestic urban water con-sumption and 40 percent of the country’s total water consumption.
This has allowed Israel to position itself as one of the world leaders in seawater desalinationThe plants have achieved good performance in terms of energy efficiency and price of desalinated water. The prices for desalinated water are among the lowest in the world and have been key to ensuring the finan-cial viability of the entire system. Prices have fallen from US$0.78 per cubic meter in the first Ashkelon plant down to only US$0.54 per cubic meter in the
more recent Sorek plant (which is the largest one). Desalinated water remains affordable for customers despite applying full cost recovery through tariffs.
Low prices were achieved through economies of scale, the operational mode of the new desalination plants, and well-designed PPP schemes Low prices were achieved through a combination of three main factors: the size of the new desalination plants and the advanced technologies used, their oper-ational mode, and PPP schemes that were designed to minimize the level of risks for the private sector to secure large amounts of private financing on the best possible terms.
By operating continuously, these large plants achieve economies of scale and absorb high fixed costsThe first two factors in the low desalinated water price have to do with the capital-intensive and high fixed cost structure of desalination plants. The Israeli desali-nation program took advantage of this by relying on a few large desalination plants that are mostly operated 24 hours per day, seven days per week. These opera-tions made it possible to achieve significant economies of scale and absorb large fixed costs.
The specificities of Israel’s integrated water management also made this possible using desalinated water as base load, and keeping aquifers as standby reserves.First, the existence of a national water carrier made it possible to restrict the number of new desalination plants to a few large ones, allowing desalinated water to be delivered from just a few production points to all cit-ies and towns across the country. The resulting econo-mies of scale translated into lower fixed costs per unit capacity.
Second, the strategic decision to use desalinated water as “base load” to meet municipal demand and to use
Appendix CCase Study: Israel Claims Water Independence through Desalination

94 The Role of Desalination in an Increasingly Water-Scarce World
the aquifer as a strategic reservoir to meet peak demand translated into the plants being operated continuously (24 hours per day, seven days per week throughout the year) and close to full capacity. This is the opposite of the strategy of many other countries, which use desalinated water mostly to meet peak demand. Continuous operation in Israel meant that fixed costs were absorbed through a larger production volume for a given plant capacity, resulting in a lower average cost per cubic meter.
The third major factor for low prices has been the adop-tion of a PPP approach through BOTThe government’s decision to adopt a PPP approach was driven in part by fiscal concerns and partly by recogniz-ing that the plants involved complex technologies and that the private sector would construct and operate these facilities more efficiently than public sector entities.
The government set up a specialist unit to handle desali-nation PPPsThe Water Desalination Administration was estab-lished under the Israel Water Authority (IWA) to han-dle all aspects of desalination PPPs.
Adopting the BOT approach for large-scale seawater desalination rather than a traditional construction contract approach brought major benefits Under the BOT approach, the private sector has strong incentives to build a plant that minimizes total costs (operating and capital) over the life of the plant, with flexibility (at its own risk) to make technological choices. In addition, the private concessionaire bears all cost overruns caused by delays and change orders. The concessionaire also takes all O&M risks during the operational period of the plant with swift penalties incurred if the plant does not deliver the contracted amount and quality of water. In the end, this fostered the sustainability and efficiency of the new plants.
Government also kept prices down by offering guaran-tees and subsidiesIn addition to the inherent benefits of the BOT approach, the specific design of the Israeli desalination PPPs included guarantees and subsidies that allowed the private sector to bid low prices for desalinated water.

95The Role of Desalination in an Increasingly Water-Scarce World
2030 WRG (World Resources Group). 2009. “Charting Our Water Future.” Washington, DC: World Bank.
Advisian. 2018. “The Cost of Desalination.” Accessed in November 2018. https://www.advisian.com/en/global-perspectives/the-cost-of -desalination.
Austrade. 2016. “China’s Sponge City Program.” https://www.scribd.com /document/351867750/China-Sponge-City-Program.
Australian Department of the Environment. (2002) Introduction to Desalination Technologies in Australia. Available from: http://www .environment.gov.au/system/files/resources/ef2c1cc7-07d8-4ed8-8f79 -816d36fb959e/files/desalination-summary.pdf [Accessed September 2018].
Avrin Anne-Perrine, Gang He, and Daniel M. Kammen. 2015. “Assessing the Impacts of Nuclear Desalination and Geoengineering to Address China’s Water Shortages.” Desalination 360: 1–7.
AWA (Australian Water Association). 2018. “Desalination.” http://www .awa.asn.au/AWA_MBRR/Publications/Fact_Sheets/Desalination_Fact _Sheet.aspx; viewed on December 15, 2018.
Bennett, A. 2013. 50th Anniversary: Desalination - 50 Years of Progress (Part 2). Available from: http://www.filtsep.com/view/33597 /50thanniversary-desalination-50-years-of-progress-part-2/ [Accessed December 2018].
Blandin, Gaetan, Arne R.D. Verliefde, Joaquim Comas, Ignasi Rodriguez-Roda, and Pierre Le-Clech. 2016. “Efficiently Combining Water Reuse and Desalination through Forward Osmosis—Reverse Osmosis (FO-RO) Hybrids: A Critical Review.” Membranes 6 (3): 37.
Caldera, Upeksha, and Christian Breyer. 2017. “Learning Curve for Seawater Reverse Osmosis Desalination Plants: Capital Cost Trend of the Past, Present, and Future. Water Resources Research 53 (12): 10,523–38.
Charisiadis, Christos. 2018. “Brine Zero Liquid Discharge (ZLD) Fundamentals and Design; A Guide to the Basic Conceptualization of the ZLD/MLD Process Design and the Relative Technologies Involved.” Lenntech, Delft, The Netherlands. doi:10.13140/RG.2.2.19645.31205.
Dawoud Mohamad A. 2012. “Environmental Impacts of Seawater Desalination: Arabian Gulf Case Study.” International Journal of Environment and Sustainability 1 (3): 22–37.
Delmon, V. 2018. “Singapore’s Water Sector–Integrated Water Resource Management.” Draft. World Bank, Washington, DC.
DesalData. 2016. Oxford, U.K.: GWI. https://www.desaldata.com/.
———. 2017. Oxford, U.K.: GWI. https://www.desaldata.com/.
Dieckmann, S., Jürgen, D., Giuliano, S., Puppe, M., Lüpfert, E., Hennecke, K., Pitz-Paal, R., Taylor, M., and P. Ralon. 2018: LCOE Reduction Potential of
Parabolic Trough and Solar Tower CSP Technology until 2025, American Institute of Physics, https://doi.org/10.1063/1.4984538.
DRCSC (Development Research Communication and Services Center). 2017. PPPs and Water Governance in China. Study Team Report No. 14, Kolkata, India.
Elimelech, Menachem, and William A. Phillip. 2011. “The Future of Seawater Desalination: Energy, Technology, and the Environment.” Science 333: 712.
Emmanuelle, Filloux, Jingshi Wang, Marc Pidou, Wolfgang Gernjak, and Zhiguo Yuan. 2015. “Biofouling and Scaling Control of Reverse Osmosis Membrane Using One-Step Cleaning Potential of Acidified Nitrite Solution as an Agent.” Journal of Membrane Science 495: 276–283.
Ghaffour, Noreddine, Thomas M. Missimer, and Gary L. Amy. 2013. “Technical Review and Evaluation of the Economics of Water Desalination: Current and Future Challenges for Better Water Supply Sustainability.” Desalination 309: 197–207.
Gude, Veera Gnaneswar. 2016. “Desalination and Sustainability: An Appraisal and Current Perspective.” Water Research 89: 87–106.
————. (ed). 2018. Renewable Energy Powered Desalination Handbook: Application and Thermodynamics. https://doi.org/10.1016/C2017-0-02851-3.
Gunawansa, Asanga. 2010. “Is There a Need for Public Private Partnership Projects in Singapore?” https://www.irbnet.de/daten/iconda/CIB 20081.pdf.
GWI (Global Water Intelligence). 2015. Desalination Markets 2016. Oxford, U.K.: Media Analytics, Ltd.
————. 2017. Desalination Markets 2018. Oxford, U.K.: Media Analytics, Ltd.
IRENA (International Renewable Energy Agency). 2012. Water Desalination Using Renewable Technology. Brief I12. Abu Dhabi, United Arab Emirates: IRENA.
Jenkins, Scott. 2015. “Nanostructured Membrane for Water Purification.” Journal of Membrane Science, 492: 137–146.
Johnson, Lyndon B. 1960. “If We Could Take the Salt Out of Water.” New York Times October 30, 1960.
Kah Seng, Lee. 2017. “Scarcity to Sustainability–Integrated Urban Water Management in Singapore.” PUB presentation. Kah Seng, Lee. 2017. “Scarcity to Sustainability–Integrated Urban Water Management in Singapore.” PUB presentation.
Khan, Stuart J., Murchland, David, Rhodes, Michelle and Waite, T. David. 2009. Management of Concentrated Waste Streams from High-Pressure Membrane Water Treatment Systems, Critical Reviews in Environmental Science and Technology,39(5) 367–415; http://dx.doi.org/10.1080 /10643380701635904.
Bibliography

96 The Role of Desalination in an Increasingly Water-Scarce World
Korenak, J., Basu, S., Malini, B., Hélix-Nielsen, C., and Irena Petrinic. 2017. Forward Osmosis in Wastewater Treatment Processes, Acta Chim. Slov. 2017, (6) 83–94; doi:10.17344/acsi.2016.2852.
Letterman, Sabine, and Thomas Hopner. 2008. “Environmental Impact and Impact Assessment of Seawater Desalination.” Desalination 220: 1–15.
Li, Dong Fei, and Willy Yeo. 2011. “A Survey of Seawater Desalination in Asia Today.” Bulletin of the Society of Sea Water Science, Japan 65 (1): 10–15.
McDonald, R. I., Katherine Weber, Julie Padowski, Martina Florke, Christof Schneider, Pamela A. Green, Thomas Gleeson, Stephanie Eckman, Bernhard Lehner, Deborah Balk, Timothy Boucher, Gunther Grill, and Mark Montgomery. 2014. “Water on an Urban Planet: Urbanization and the Reach of Urban Water Infrastructure.” Global Environmental Change 27: 96–105.
Mekonnen, M. M. and A. Y. Hoekstra. 2016. “Four Billion People Facing Severe Water Scarcity.” Science Advances 2 (2): e1500323.
Mickley, Mike. 2016. “Database of Permitting Practices for Seawater Desalination Concentrate Disposal.” WRRF-13-07. Alexandria, VA: IWA Publishing.
Najafi, F. T. (2016) Environmental Impact Cost Analysis of Multi-Stage Flash, Multi-Effect Distillation, Mechanical Vapor Compression, and Reverse Osmosis Medium-Size Desalination Facilities. ASEE’s 123rd Annual Conference and Exposition, New Orleans, LA, June 26–29, 2016. Paper ID.14849.
National Water Commission. 2011. Integrated Resource Planning for Urban Water—Resource Papers, by Fane et al. Waterlines Report No. 41, Canberra.
New South Wales Office of Water. 2017. NSW Metropolitan Water Plan. New South Wales, Australia.
Pérez de las Peñas, Javier. 2018. “The Future of Solar Thermal Power (STE or CSP) in China.” http://helioscsp.com/the-future-of-concentrated -solar-power -ste -or-csp-in-china-2/.
Richey, Alexander S., Brian F. Thomas, Min-Hui Lo, John T. Reager, and James S. Famiglietti. 2015. “Quantifying Renewable Groundwater Stress Using GRACE.” Water Resources Research 51 (7): 5217–5238.
Ross, W. D., ed. 1931. “Meteorologica.” Vol. 3 of The Works of Aristotle, §358: 16–18 and §359: 1–5. Oxford, U.K.: Clarendon Press.
Saudi Arabian Water Environment Association. 2013. Innovative Water and Wastewater Technologies for a Sustainable Environment, Water Arabia 2013 Conference and Exhibition, February 4–6, 2013, Khobar, Saudi Arabia.
Siegel, S. M. 2017. Let There Be Water. New York: Thomas Dunne Books.
Sommariva, C. 2010. Desalination and Advance Water Treatment: Economics and Financing, Balaban Publishers; 1st ed., 168 PP.
SWRCB (State Water Resources Control Board). 2015. California Ocean Plan. Sacramento, CA: California Environmental Protection Agency.
Times Magazine. 2005. Atlas of the World. London: Times Books.
Trembath, Murray. 2012. “Desal Plant to Close Down.” New South Wales, Australia: St George & Sutherland Shire Leader.
UNEP (United Nations Environment Program). 2015. Options for Decoupling Economic Growth from Water Use and Water Pollution. Report of the International Resource Panel Working Group on Sustainable Water Management, Paris.
US Department of Energy. 2018. “Bandwidth Study on Energy Use and Potential Energy Savings Opportunities in U.S. Seawater Desalination Systems.” https://www.energy.gov/sites/prod/files/2017/12/f46/Seawater _desalination_bandwidth_study_2017.pdf.
Veldkamp, T. I. E, Y. Wada, J. C. J. H. Aerts, and P. J. Ward. 2016. “Towards a Global Water Scarcity Risk Assessment Framework Incorporation of Probability Distributions and Hydro-Climatic Variability.” Environment Research Letters 11: 024006.
Veolia Water Technologies. 2006. http://www.veoliawatertech.com/news -resources/press-releases/2006-09-13,power_clean_systems.htm.
Voutchkov, Nikolay. 2012. Desalination Engineering–Planning and Design. New York: McGraw Hill.
————. 2016. Desalination–Past, Present and Future. International Water Association. http://www.iwa-network.org/desalination-past-present -future/.
————. 2017. Pretreatment for Reverse Osmosis Desalination, 291. Amsterdam: Elsevier.
————. 2018. Total Cost of Water Production. A PowerPoint presentation to the Korea University.
Ward, Christopher, and Sandra Ruckstuhl. 2017. Water Scarcity, Climate Change and Conflict in the Middle East and North Africa. London: I.B. Tauris.
Water Technology. 2018. “Tampa Bay Seawater Desalination Plant.” https://www.water-technology.net/projects/tampa/.
WHO (World Health Organization). 2011. Guidelines for Drinking Water Quality. 4th ed. Geneva. Switzerland: WHO.
Wikipedia. 2018. “Desalination.” Available at: https://en.wikipedia.org /wiki/Desalination [Accessed December 2018].
Wikivisually. 2018. “Perth Seawater Desalination Plant.” https://wikivisually .com/wiki/Perth_Seawater_Desalination_Plant.
Wittholz, Michelle K., Brian K. O’Neill, Chris B. Colby, and David Lewis. 2008. “Estimating the Cost of Desalination Plants Using Cost Database.” Desalination 229 (1–3): 10–20.
World Bank. 2012. Renewable Energy Desalination: An Emerging Solution to Close the Water Gap in the Middle East and North Africa. Washington, DC: World Bank.
————. 2017a. “The Role of Desalination in an Increasingly Water Scarce World.” Unpublished background paper. Washington, DC: World Bank.
————. 2017b. “Water Management in Israel: Key Innovations and Lessons Learned for Water Scarce Countries.” Washington, DC: World Bank.

97The Role of Desalination in an Increasingly Water-Scarce World
WRA (WateReuse Association). 2011a. “Desalination Plant Intakes–Impingement and Entrainment Impacts and Solutions.” White Paper. WRA, Alexandria, VA.
————. 2011b. “Overview of Desalination Plant Intake Alternatives.” White Paper. WRA, Alexandria, VA.
————. 2011c. “The WateReuse Desalination Committee White Paper.” Seawater Concentrate Management. WRA, Alexandria, VA.
————. 2012. “Seawater Desalination Costs.” Desalination Committee White Paper. https://watereuse.org/wp-content/uploads/2015/10 /WateReuse_Desal_Cost_White_Paper.pdf.
Younes Ghalavand, Mohammad Sadegh Hatamipour & Amir Rahimi (2015): A review on energy consumption of desalination processes, Journal of Desalination and Water Treatment, Volume 54 (6) 1526–1541, doi:http://dx.doi.org/10.1080/19443994.2014.892837.
Zhe, T., Chen, S. Peng, X., Zhang, L. and C. Gao. 2018. “Polyamide Membranes with Nanoscale Turing Structures for Water Purification.” Science 360 (6308): 518–21.
Zhou, Yuan, and Richard S. J. Tol. 2005. “Evaluating the Costs of Desalination and Water Transport.” Water Resources Research 40: W03003.


SKU W18059
The Role of D
esalination in an Increasingly Water-Scarce W
orld