the role of ethnic networks in africa: evidence from...
TRANSCRIPT

The Role of Ethnic Networks in Africa: Evidence from
Cross-Country Trade
by Mathias Iwanowsky∗
October 15, 2014
Abstract
I investigate the role of ethnic networks on regional African development on the basisof bilateral trade flows. To identify ethnic networks across borders I employ a spatialidentification strategy for ethnic networks based on the exogeneity of African politicalboundaries. I find that ethnic networks in African countries are an important deter-minant of bilateral trade flows. In particular, ethnic networks decrease the bilateraltrade costs in corrupt or distrustful countries. Ethnic networks also affect the choiceof exporting through an informational channel that reduces fixed costs of exporting.I find the export value added from one additional network member to be 3.6 US$ ofexports in 2010. Considering the average network size of 1.5 million people, ethnicnetworks contribute a considerable fraction to average trade flows. In terms of tradecosts, ethnic network decrease average trade cost as measured by distance by up to26%.
∗Institute for International Economic Studies, Stockholm University. Contact: +46 (0) 8 16 22 53, email:[email protected]

1 Introduction
Geographically separated ethnic enclaves tend to generate their own network that span multiple
countries. These networks constitute both a barrier and an opportunity to economic develop-
ment. Ethnic networks may exclude non-members from economically profitable actions but also
facilitate them for members, especially across country borders. In countries traversed by mis-
trust such linkages are potentially more important (Dunlevy 2006) since they act as a source
of information, a way to share risks (Fafchamps & Gubert 2007) or to bargain for preferred
policies Bates (2008).
In this paper I show that ethnic networks between African countries reduce trade costs signif-
icantly. Furthermore, these networks are more effective in overcoming trade barriers in more
corrupt or distrustful countries.
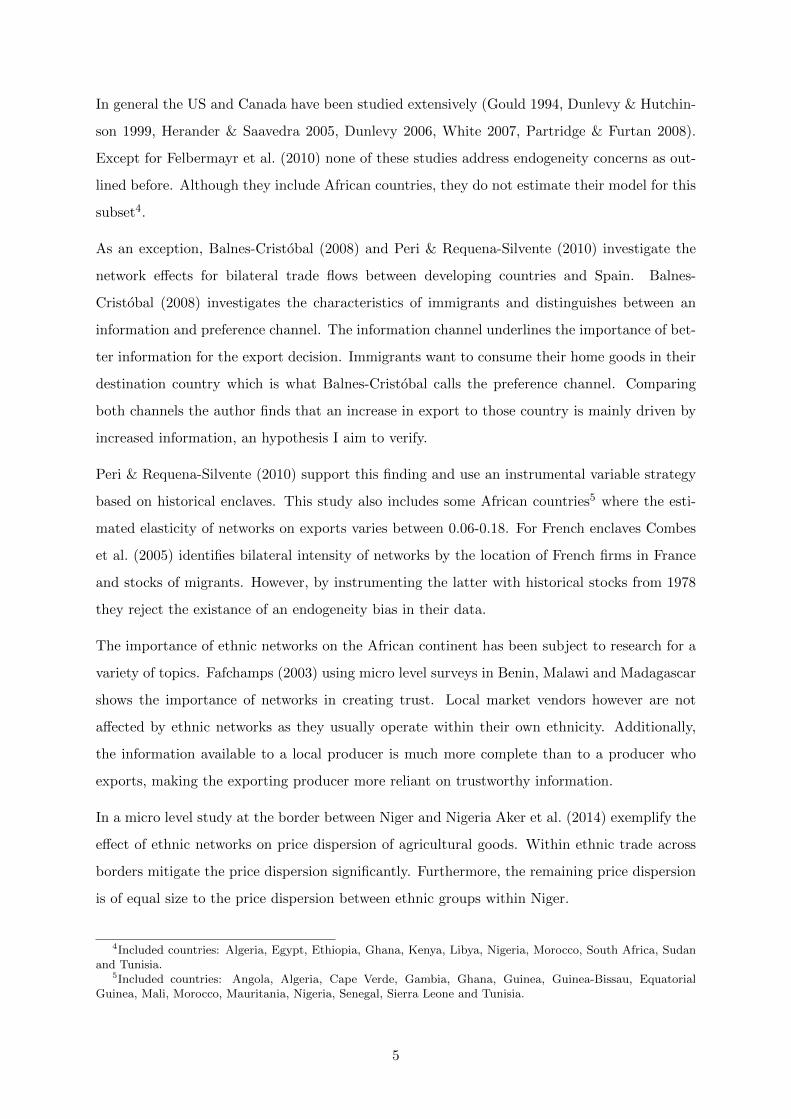
African countries are distinctly different from the rest of the world. Figure 1 shows the distri-
bution of ethnicities and countries in Africa. Political borders are not a result of independence
struggles or inner African wars but drawn by European colonial powers in the late nineteenth
century. This lead to a mixture of ethnicities and tribes both within and across countries.
Today, the average African country has more than 10 ethnic groups who often speak their own
language such that national identification is often an issue, as country borders were set without
considering the ethnic composition. The formation of African states and favoritism of one eth-
nicity by colonial powers led to ethnic motivated conflicts in the second half of the twentieth
century.1 In elections ethnic identification plays an important role in vote casting (Eifert et al.
2010). If ethnic solidarity also holds across borders, it is likely to affect trade flows between
countries.2
Empirical evidence for an effect of networks on bilateral trade flows in developing countries is
scarce. Peri & Requena-Silvente (2010) and Balnes-Cristobal (2008) underline the importance
of migrants in Spain on the export decision of Spanish firms. The same pattern holds for French
firms as Combes et al. (2005) show. For Bolivia Canavire et al. (2006) exemplify the importance
of migration for the value of bilateral trade flows and in South-East Asia, Chinese network links
1e.g. Rwanda 1994, Congo 1998, Mali 2012, Central African Republic 2014 (although the latter are also ofreligious nature, the underlying reason is that a minority was favored by French colonialists.) [List incomplete]
2One example was the temporary practice of Air Namibia, the major carrier of Namibia, having a stopoverin Luanda (Angola) only to refuel due to disputes with the fuel supplier at their main airport. The airline isrun by an ethnicity that has strong ties between the two countries and hence uses its credibility in Angola tobuy fuel. http://www.economist.com.na/headlines/2795-air-namibia-increases-frankfurt-flights andhttp://hannamibia.com/uploads/pdf/news/130305093441120.pdf Additionally, the main supplier of kerosin,Engen, is South African and the ethnicity is only dispersed in Angola and Namibia.
2

attribute up to 1.4% to trade creation (Felbermayr et al. 2010). However, empirical evidence
using all African countries is missing. In this paper I aim at filling that gap and investigate how
ethnic networks influence bilateral trade flows between African countries.
Figure 1: Ethnic (Grey) and Country (Red) Boundaries
Studying the effects of ethnic networks in Africa entails many challenges. First, data qual-
ity about African ethnicities is at most questionable. Different names of ethnicities, language
barriers and historical ethnic conflicts constitute considerable obstacles for research. Second,
conflicts or natural catastrophes might cause migration across borders thus leading to endogene-
ity of current networks. The U.S. for instance attracts many immigrants due to its economic
power and as Woodruff & Zenteno (2007) show, Mexican immigrants use existing networks to
migrate, thus creating reversed causality concerns. I aim to overcome these issues using a spatial
identification strategy by using ethnic networks as they were in 1960.
The spatial identification strategy I employ is based on the random formation of country borders
in Africa. This approach has recently attracted considerable interest among economics due
immutability of geographic factors (Nunn 2008, Nunn & Wantchekon 2011, Nunn & Puga 2012,
Michalopoulos & Papaioannou 2013, 2014). Using an African map provided by Weidmann et al.
(2010) I identify ethnic groups in 1960 and use them as a proxy for ethnic networks today. In
3

a reduced form approach I estimate the effect of ethnicity on bilateral trade flows. Due to the
randomness of country borders in Africa with respect to ethnicities I argue that my approach
identifies a causal effect. I augment a model by Chaney (2008) with an ethnic specific fix cost
function and estimate the elasticity of exports to ethnic networks to be around 0.06. On average
increasing an average network by 1% (26,000 people), increases bilateral trade flows by 0.06%
or 96,000 US$ in 2010.
The point estimate I find is at the lower end of estimates found in the literature for developed
countries (Bandyopadhyay et al. 2008).3 One explanation is that ethnic networks are less
important for bilateral trade in developing countries. This would contradict Dunlevy (2006)
who argues that networks are important in corrupt regimes. Considerable heterogeneity of
export volumes between African countries might also be an explanation why this estimate is
found to be low. Regional African economic integration or political willingness may be different
such that not all countries can fully benefit from their ethnic networks.
Another possibility why the coefficients in the literature are higher then the one found in this
study are neglected endogeneity concerns. If groups are forced to migrate, they will use network
clusters in order to enter new countries (McKenzie & Rapoport 2007). Accordingly, if network
clusters are formed by trade flows it causes reverse causality issues. Following this argument
empirical results not addressing this point suffer from an upward bias regarding the effect of
migration.
This work relates to the literature on networks and trade started by Gould (1994) who investi-
gated the importance of immigrant links for historical US trade flows. To my knowledge, Rauch
(1999) is the first study who uses a network/search framework to estimate the networks effect.
Both studies use migrant links, instead of migrant stocks or flows, to mitigate endogeneity prob-
lems. In a subsequent paper Rauch & Trindade (2002) use the framework to asses the network
effect of Chinese migrants in South-East Asia and find that Chinese networks make up 60% of
the increase in bilateral trade flows. Felbermayr et al. (2010) and Felbermayr & Toubal (2012)
criticize their strategy and augment the initial model by indirect links providing evidence for
an upward bias in Rauch & Trindade (2002). In their study the elasticity of Chinese networks
and bilateral trade flows is dwarfed by other networks and only estimated at 1.4%.
3Generally, most empirical evidence concentrates on migration from developing to developed countries. How-ever, despite the increase since 1970 (Oezden et al. 2012) migration between developing countries still constitutesthe largest migration flow. Additionally, ethnic networks in developing countries are especially important sincedeveloping countries are often more corrupt (Dunlevy 2006, Svensson 2003, Olken & Barron 2009). Thus, theinfluence of ethnic networks on bilateral trade flows can be expected to be larger than between developed coun-tries.
4
In general the US and Canada have been studied extensively (Gould 1994, Dunlevy & Hutchin-
son 1999, Herander & Saavedra 2005, Dunlevy 2006, White 2007, Partridge & Furtan 2008).
Except for Felbermayr et al. (2010) none of these studies address endogeneity concerns as out-
lined before. Although they include African countries, they do not estimate their model for this
subset4.
As an exception, Balnes-Cristobal (2008) and Peri & Requena-Silvente (2010) investigate the
network effects for bilateral trade flows between developing countries and Spain. Balnes-
Cristobal (2008) investigates the characteristics of immigrants and distinguishes between an
information and preference channel. The information channel underlines the importance of bet-
ter information for the export decision. Immigrants want to consume their home goods in their
destination country which is what Balnes-Cristobal calls the preference channel. Comparing
both channels the author finds that an increase in export to those country is mainly driven by
increased information, an hypothesis I aim to verify.
Peri & Requena-Silvente (2010) support this finding and use an instrumental variable strategy
based on historical enclaves. This study also includes some African countries5 where the esti-
mated elasticity of networks on exports varies between 0.06-0.18. For French enclaves Combes
et al. (2005) identifies bilateral intensity of networks by the location of French firms in France
and stocks of migrants. However, by instrumenting the latter with historical stocks from 1978
they reject the existance of an endogeneity bias in their data.
The importance of ethnic networks on the African continent has been subject to research for a
variety of topics. Fafchamps (2003) using micro level surveys in Benin, Malawi and Madagascar
shows the importance of networks in creating trust. Local market vendors however are not
affected by ethnic networks as they usually operate within their own ethnicity. Additionally,
the information available to a local producer is much more complete than to a producer who
exports, making the exporting producer more reliant on trustworthy information.
In a micro level study at the border between Niger and Nigeria Aker et al. (2014) exemplify the
effect of ethnic networks on price dispersion of agricultural goods. Within ethnic trade across
borders mitigate the price dispersion significantly. Furthermore, the remaining price dispersion
is of equal size to the price dispersion between ethnic groups within Niger.
4Included countries: Algeria, Egypt, Ethiopia, Ghana, Kenya, Libya, Nigeria, Morocco, South Africa, Sudanand Tunisia.
5Included countries: Angola, Algeria, Cape Verde, Gambia, Ghana, Guinea, Guinea-Bissau, EquatorialGuinea, Mali, Morocco, Mauritania, Nigeria, Senegal, Sierra Leone and Tunisia.
5

In a political economy setting even small ethnic groups can influence local politics. For the case
of Kenya Burgess et al. (2013) show that government seats are distributed across ethnicities
to foster peace. This view is supported by Francois et al. (2013) who show that government
power is often distributed proportionally to population shares which implies that minorities
have political power and small ethnic networks are likely to have an effect on trade flows. Since
members in political offices can either distribute government contracts or decrease political
uncertainty they may decrease the cost of exporting for own ethnicities in other countries.
The remainder of this paper is structured as follows. In section 2 I present a theory of how ethnic
networks influence bilateral trade flows. In section 3 I describe the data and in 4 I highlight the
empirical strategy and address endogeneity concerns. In section 5 I discuss my baseline results.
In section 6 I conduct a series of robustness checks to verify the results. I identify the potential
channels in section 7. In section 8 I will discuss my findings and their implication. I conclude
in section 9.
2 Theory
In this section I will shortly derive a model of international trade with firm and ethnic hetero-
geneity. My framework draws from Chaney (2008) and will provide empirical predictions and
testable implications.
The economy consists of N countries which contain a subset e ∈ E predefined ethnicities. Not
every ethnicity is present in every country. Further more every economy produces a composite
good q0 and horizontally differentiated goods q(ω). Any firm of ethnicity e ∈ E producing a
heterogeneous good ω ∈ Ω from country i ∈ N , uses its ethnic counterpart e′ ∈ E in country
j ∈ N to maximize the expected profits from selling in market j ∈ N according to:
πij,ee′(ω) = pij(ω)qij(ω)− cij,ee′(ω) (1)
Where the price of a good pij(ω) is country specific,6 as is the demand for a good qij(ω). τij > 1
represent variable trade costs, denoted as ”iceberg trade costs”. A firm needs to produce τij
6Although Aker et al. (2014) show that ethnicities affect the prices between two countries, I assume that thisis a result of a supply or demand shock.
6
goods in order to sell one unit in country j. The cost of producing a good cij,ee′(ω) are assumed
to be ethnic dependent in home e and foreign e′ and of the form:
cij,ee′(ω) =τijϕqij(ω) +
(Lj,e′
Lj
)−ηfij (2)
Here, ϕ denotes productivity which every firm draws from a Pareto distribution G(ϕ) = 1 −
ϕ−γ .7 Here γ represents the degree of firm heterogeneity, with increasing values denoting
decreasing firm heterogeneity. Firms learn about their productivity when drawing from G(ϕ)
and subsequently decide to pay country pair specific fixed costs fij in order to serve market
j.8 These fixed costs are mitigated by the fraction of the population in country j that is of
the same ethnicity e′ = e ∈ E as the owner of the firm.9 I call the effect of the fraction(Lj,e′Lj
)−ηthe network effect of ethnic ties. This fraction is in the unit interval and raised to
the power of η ∈[0, σ−1
γ
)that gives the importance of ethnic networks in decreasing the fixed
costs of exporting. It can be interpreted as decreased costs of acquiring information about the
destination country’s market structure or market demand. Alternatively, one can interpret it
as lower payments to government officials because of ethnic ties or as a proxy for the general
trust worthiness of a society. In a society with poorly enforced market rules and a general aura
of mistrust, the importance of ethnic networks in order to circumvent failure or bribes is likely
to be greater than in well developed markets. This leads to the first set of testable predictions
of the model:
Hypothesis 1 Ethnic networks are more important in countries with poorly enforced rules,
lower social norms and lower levels of trust
Empirical evidence by Grossman et al. (2006) suggests that factors like cultural distance and
institutional development are particular relevant for the fixed cost of exporting. Ethnic networks
should then be beneficial when firms try to circumvent bureaucratically hurdles. The larger these
hurdles, the larger should be the impact of ethnic networks.
7Following a great share of the literature I use the Pareto distribution because it mirrors the empiricaldistributions well Axtell (2001) and is notational convenient.
8The cost of producing a good are wages times cij,ee′(ω). I do however normalize wages to unity to simplifythe expressions. Furthermore, since there are infinitely many possible firms of each ethnicity, I can characterizethe costs of producing variety ω simply by the ethnicity and the productivity of the firm ϕ.
9A similar approach has been undertaken by Krautheim (2012) where the fraction is the number of domesticfirms active in the destination market. In the following I assume that every ethnicity has at least one member inevery country. I will relax that assumption when I extend the basic framework.
7
In every country households maximize their utility according to:
U = q1−µ0
(∫ω∈Ω
q(ω)σ−1σ dω
) σσ−1
µ
(3)
That is, they consume a freely traded homogeneous good q0 and consume every available variety
of the heterogeneous good ω. The share of income spent on the heterogeneous good is given by
µ = 1−µ and the elasticity of substitution is given by σ > 1. Standard results lead to a pricing
of pij(ϕ) = σσ−1
τijϕ and a demand:
qij(ϕ) = pij(ϕ)−σP σ−1j µ
(1 +
Π
L
)Lj (4)
Here(1 + Π
L
)Lj denotes the fraction of world capital Π and labor L income that belongs to
country j. Hereof, a fraction µ is spend on heterogeneous goods. Combining the profit function,
pricing and demand yields the ethnicity dependent productivity cutoff above which firms start
to export due to non-negative profits πij,ee′ ≥ 0:
ϕ∗ij,ee′ =
(σ
σ − 1
)τijPj
[µ
σ
(1 +
Π
L
)Lj
] 11−σ
(Lj,e′
Lj
) η1−σ
f1
σ−1
ij (5)
Now, the price index Pj can be solved explicitly by summing all prices from all exporting
countries together, taking their productivity cutoffs into account.10 Then, the productivity
cutoff can be expressed in terms of primitives:
ϕ∗ij,ee′ =
[γ
γ − (σ − 1)
] 1γ[µ
σ
(1 +
Π
L
)]− 1γ
Lη−1γ
j
τijθjf
1σ−1
ij (Lj,e′)η
1−σ (6)
As in Chaney (2008) the total foreign population decreases the cutoff due to market size effects
Lη−1γ
j . This effect is dampened by ηγ because the ethnic population has a stronger effect on the
cutoff then the total population.11 θ denotes the multilateral resistance term that approximates
how distant a market is in comparison to all other markets.12 In order to obtain a testable
10Pj =
(∑Nk=1 Lk
∑e∈E
∫∞ϕ∗kj,ee′
(σσ−1
τkjϕ
)1−σdF (ϕ)
) 11−σ
11The original cutoff in Chaney (2008) can be recovered by setting η = 0. The effect of the foreign ethnicpopulation is greater since η
γ< η
σ−1due to the assumption γ > σ − 1 that guarantees interior solutions.
12θj =
[∑Nk=1 f
σ−1−γσ−1
kj τ−γkj∑e∈E Lk,e(δLj,e)
η(σ−1−γ)1−σ
]− 1γ
. A popular example is the comparison between Por-
tugal and Spain with New Zealand and Australia. Similar in terms of GDP, the latter trade relatively more witheach other due to their distance to all other markets world wide.
8

equation, I aggregate individual demand13 to the standard gravity equation as first noted in
Anderson (1979):
Xij = µ
(1 +
Π
L
)Ljf
σ−1−γσ−1
ij
(τijθj
)−γ ∑e′=e∈E
Li,e(Lj,e′)η(σ−1−γ)
1−σ (7)
Total exports between any pair of countries increase in market size µ(1 + Π
L
)Lj and multilateral
resistance θ and decrease in variable trade cost τij and fixed costs fij . The network term is
increasing the total trade flows additionally because ν ≡ η(σ−1−γ)1−σ ∈ [0, 1) in order to obtain
interior solutions for the system of equations.14 If the number of ethnicities is greater then
the number of countries, the system of equations is under identified and cannot be estimated
consistently. A workaround is to assume specific values for ν and conduct sensitivity analyses.
The introduction of ethnic heterogeneity in the framework of Melitz (2003) and Chaney (2008)
introduced a second source of heterogeneity that creates a particular feature regarding export
decisions. Firms owned by an ethnic minority might first export to other markets and only later
serve their home market. A famous example of this behavior is the German Beck’s brewery that
first produced only for the export market and only later allowed their products to be sold in
Germany. This feature is similar to capital constraint firms that cannot export in ? and implies
imperfect selection into exporting. Firms that export might have lower productivity than firms
that do not creating welfare losses.
The Extensive Margin Having derived the main theoretical equation to be tested empir-
ically, I will focus now on further predictions and implications. At first, I will examine the
extensive margin implications by the model.15 Following Helpman et al. (2008) one can rewrite
the equilibrium profits by firms and obtain an indicator Z that defines whether a firm is ex-
porting or not.
πij,ee′(ϕ) =
(σ
σ − 1
)1−σ µ
σ
(1 +
Π
L
)Ljτ
1−σij ϕσ−1P σ−1
j −(Lj,e′
Lj
)−ηfij = 0 ⇒
Z ≡µσ
(1 + Π
L
)σ−1γ
(τijθj
)1−σϕσ−1L
(1−η)σ−1γ
j
L−ηj,e′fij≥ 1 (8)
13Xij = Li∑e′=e∈E
Li,eLi
∫∞ϕ∗ij,e
qij,ee′(ϕ)dF (ϕ) whereLi,eLi
is the ethnic fraction in country i.
14I further require that γ > (σ − 1) and η < (σ−1)γ
.15The extensive margin of trade is defined as the number of firms newly starting to export after a reduction in
trade costs. In contrast, the intensive margin amounts to export value adjustments of already existing firms.
9
That is, the probability of exporting to another country Pr[Z ≥ 1] increases in the ethnic
population abroad. In fact, for a specific ethnicity, increasing the ethnic homogeneity in favor
of a firms ethnicity in the destination country increases the probability of exporting. The
advantage of this formulation is the ability to investigate the effect of networks on the extensive
margin of trade. Furthermore, there should be a positive relationship between the number of
ethnic connections between two countries and the number of firms actively trading.16
Hypothesis 2 Number of firms exporting is increasing in the number of ethnic connections
between two countries
The second hypothesis states that ethnic heterogeneity is beneficial for firms exporting, because
they serve as an entry door to an export market.17 Assuming that the first firm that is exporting
is the firm with the largest ethnic population in the destination country, equation (8) gives a
consistent estimate of η.
Ethnic Specific Fixed Costs So far I have assumed that networks only exist within ethnic-
ities and ignored networks that exist between ethnicities. It is however reasonable to assume
that every ethnicity can create networks with other ethnicities in order to conduct trade. In
the following I will relax the initial assumption and assume that every ethnicity has an implicit
(weak) ranking of every other ethnicity. Then, for every ethnicity I can order the other ethnici-
ties according to the cost they have to incur in order to conduct business with them. This cost
is similar to the fixed costs discussed earlier, in the sense that it reflects learning costs between
ethnicities. Hence, I assume there exists a matrix FE×E that reflects this ordering between
every possible combination of ethnicities. The cost of producing and exporting are then given
by:
cij,ee′(ϕ) =τijϕqij(ϕ) +
(Lj,e′
Lj
)−ηfijfij,ee′ (9)
with fij,ee′ being an element from FE×E . Here bilateral fixed costs are disentangled from ethnic
specific cost. Every firm has to incur bilateral fixed costs as before but they also have to invest
16This relationship becomes even more clear when calculating the number of exporters #EXij =∑e∈E Li,e
∫∞ϕ∗ij,ee′
dG(ϕ) = γ−(σ−1)γ
σµ
(1 + Π
L
)L1−ηj
(τijθj
)−γf
γ1−σij
∑e′=e∈E Li,eL
ηγ
1σ−1
j,e which is increasing in the
number of ethnic connections if the increase does not affect Li,e or Lj,e′ .17This relationship holds as long as the exponent on market size Lj is greater then the exponent on ethnic
population Lj,e′ . The resulting condition σ−1γ≥ η
1−η is fulfilled by the data.
10

in ethnic relations in order to mitigate them and export. The basic model is a special case of
this case where the off diagonal elements of FE×E are assumed to be so high that only networks
within ethnicities can emerge. The gravity equation is then given by:
Xij = Ljµ
(1 +
Π
L
)f
1− γσ−1
ij
(τijθj
)−γ∑e∈E
Li,e(Lj,e′)η(σ−1−γ)
1−σ f1− γ
σ−1
ij,ee′ (10)
Now, the network effect is not only within an ethnicity, but also between ethnicities. If the
fixed costs of creating networks between ethnicities are low enough, this specification should fit
the data better. Combining the findings on the extensive margin formulation and the ethnic
specific fixed costs, ethnicities have a two fold effect on trade flows. They increase the number
of firms exporting in distrustful environments by affecting the extensive margin. However, trade
volumes between two countries are negatively affected by the ethnic specific fixed costs. Then if
these fixed costs represent trust or corruption issues, the above model puts a strong emphasis on
reducing corruption and increase trust among ethnicities and further underlines the importance
of testing the first hypothesis.
3 Data
Geographical information I use spatial data based upon the Geo-referencing of Ethnic
Groups (henceforth: GREG) from the Atlas Narodov Mira (Weidmann et al. 2010). It has been
used in various applications and shows the ethnic distribution around the world in 1960, as seen
by Russian scientists. Population count data is obtained from the United Nations Environment
Program / Global Resource Information Database with a spatial resolution of 4 kilometer.
Country information African trade data is obtained from the World Bank Integrated Trade
Survey that employs the UN comtrade dataset which covers all countries from 1950-2010. Mea-
sures of trust are obtained from the Afrobarometer 2005 as used in Nunn & Wantchekon (2011).
Perceived corruption indexes are obtained from the Afrobarometer 2008. I employ the Uppsala
University Department of Peace and Conflict Research data set for the information of conflict18
incidences in Africa. To control for colonial ties between countries I use ”The Issue Correlates
18Conflict in the data is defined as ”a contested incompatibility that concerns government and/or territorywhere the use of armed force between two parties, of which at least one is the government of a state, results inat least 25 battle-related deaths.”
11
of War” colonial history data set from Hensel (2009). The complete set of controls and their
statistics can be seen in Table 14 in the appendix.
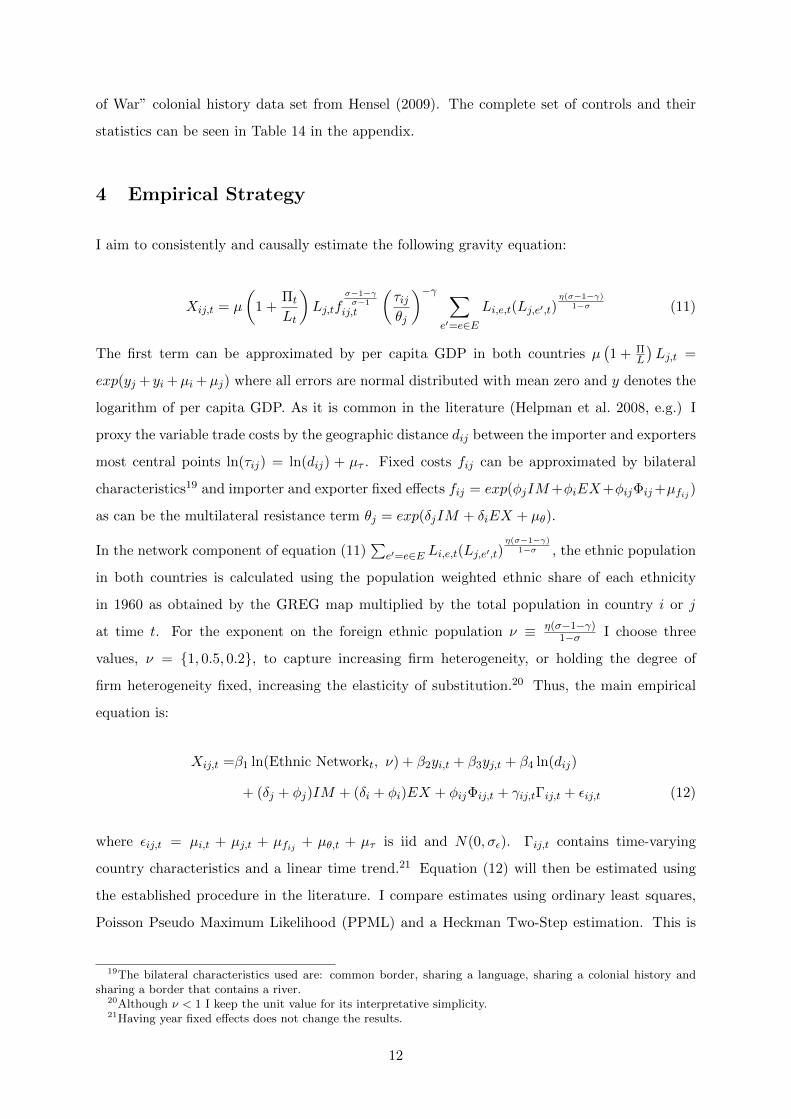
4 Empirical Strategy
I aim to consistently and causally estimate the following gravity equation:
Xij,t = µ
(1 +
Πt
Lt
)Lj,tf
σ−1−γσ−1
ij,t
(τijθj
)−γ ∑e′=e∈E
Li,e,t(Lj,e′,t)η(σ−1−γ)
1−σ (11)
The first term can be approximated by per capita GDP in both countries µ(1 + Π
L
)Lj,t =
exp(yj + yi +µi +µj) where all errors are normal distributed with mean zero and y denotes the
logarithm of per capita GDP. As it is common in the literature (Helpman et al. 2008, e.g.) I
proxy the variable trade costs by the geographic distance dij between the importer and exporters
most central points ln(τij) = ln(dij) + µτ . Fixed costs fij can be approximated by bilateral
characteristics19 and importer and exporter fixed effects fij = exp(φjIM+φiEX+φijΦij+µfij )
as can be the multilateral resistance term θj = exp(δjIM + δiEX + µθ).
In the network component of equation (11)∑
e′=e∈E Li,e,t(Lj,e′,t)η(σ−1−γ)
1−σ , the ethnic population
in both countries is calculated using the population weighted ethnic share of each ethnicity
in 1960 as obtained by the GREG map multiplied by the total population in country i or j
at time t. For the exponent on the foreign ethnic population ν ≡ η(σ−1−γ)1−σ I choose three
values, ν = 1, 0.5, 0.2, to capture increasing firm heterogeneity, or holding the degree of
firm heterogeneity fixed, increasing the elasticity of substitution.20 Thus, the main empirical
equation is:
Xij,t =β1 ln(Ethnic Networkt, ν) + β2yi,t + β3yj,t + β4 ln(dij)
+ (δj + φj)IM + (δi + φi)EX + φijΦij,t + γij,tΓij,t + εij,t (12)
where εij,t = µi,t + µj,t + µfij + µθ,t + µτ is iid and N(0, σε). Γij,t contains time-varying
country characteristics and a linear time trend.21 Equation (12) will then be estimated using
the established procedure in the literature. I compare estimates using ordinary least squares,
Poisson Pseudo Maximum Likelihood (PPML) and a Heckman Two-Step estimation. This is
19The bilateral characteristics used are: common border, sharing a language, sharing a colonial history andsharing a border that contains a river.
20Although ν < 1 I keep the unit value for its interpretative simplicity.21Having year fixed effects does not change the results.
12
necessary due to different distributional assumptions of each procedure. As Santos-Silva &
Tenreyro (2006) show in their influential work, ignoring non-linearities in the error term can
lead to biased estimates. Furthermore, due to a large proportion of zeros in trade data the
PPML estimation is superior to an ordinary least squares regression. Another way to reduce
the resulting bias from ignoring zeros in trade data is to use a Heckman-Two-Step procedure as
used in Helpman et al. (2008). Both procedures estimate the equation non-linearly and report
elasticities but have different distributional assumptions in the error term. While the Heckman-
Two-Step procedure estimates a selection equation and then an ordinary least squares regression
that assigns the weight of an observation in the regression according to its importance, the
PPML assigns each observation the same weight.22 Using the Heckman Two-Step estimation,
however, requires a selection equation with a variable that does not affect the export flows.
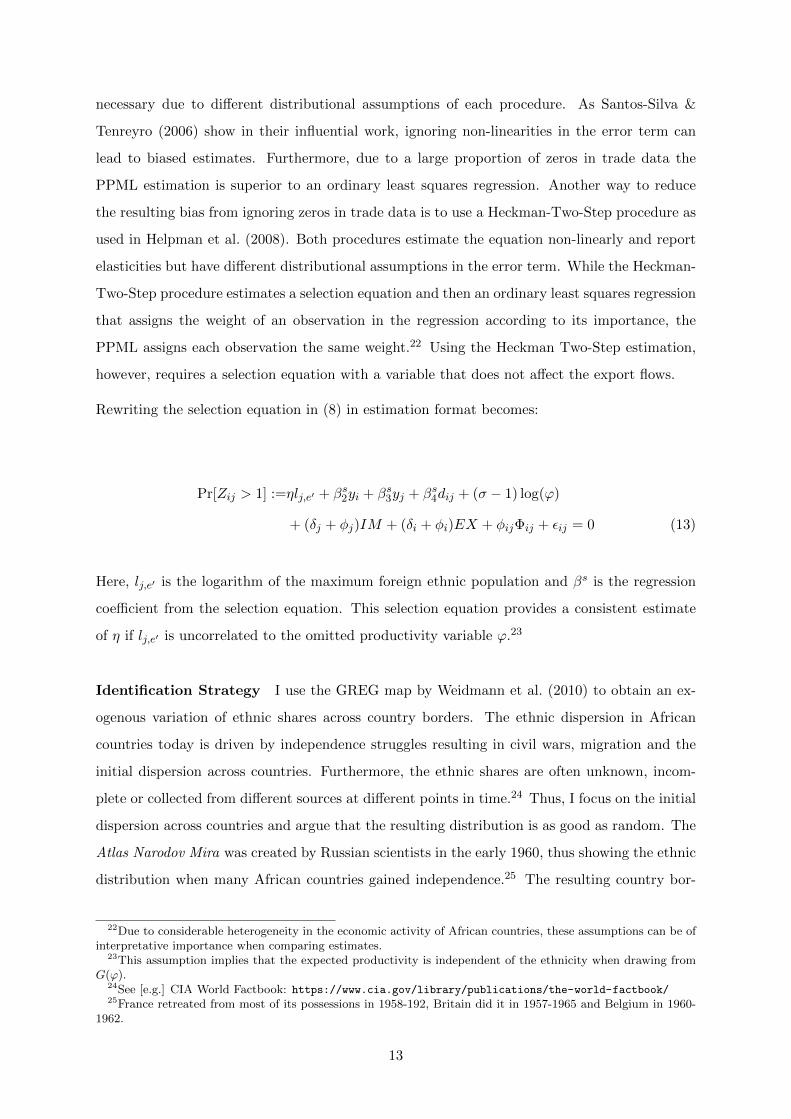
Rewriting the selection equation in (8) in estimation format becomes:
Pr[Zij > 1] :=ηlj,e′ + βs2yi + βs3yj + βs4dij + (σ − 1) log(ϕ)
+ (δj + φj)IM + (δi + φi)EX + φijΦij + εij = 0 (13)
Here, lj,e′ is the logarithm of the maximum foreign ethnic population and βs is the regression
coefficient from the selection equation. This selection equation provides a consistent estimate
of η if lj,e′ is uncorrelated to the omitted productivity variable ϕ.23
Identification Strategy I use the GREG map by Weidmann et al. (2010) to obtain an ex-
ogenous variation of ethnic shares across country borders. The ethnic dispersion in African
countries today is driven by independence struggles resulting in civil wars, migration and the
initial dispersion across countries. Furthermore, the ethnic shares are often unknown, incom-
plete or collected from different sources at different points in time.24 Thus, I focus on the initial
dispersion across countries and argue that the resulting distribution is as good as random. The
Atlas Narodov Mira was created by Russian scientists in the early 1960, thus showing the ethnic
distribution when many African countries gained independence.25 The resulting country bor-
22Due to considerable heterogeneity in the economic activity of African countries, these assumptions can be ofinterpretative importance when comparing estimates.
23This assumption implies that the expected productivity is independent of the ethnicity when drawing fromG(ϕ).
24See [e.g.] CIA World Factbook: https://www.cia.gov/library/publications/the-world-factbook/25France retreated from most of its possessions in 1958-192, Britain did it in 1957-1965 and Belgium in 1960-
1962.
13

Figure 2: Randomness of Borders and Ethnic Shares
(a) Rivers (Blue) in West Africa
0.2
.4.6
.81
Eth
nic
Sha
re in
the
Impo
rtin
g C
ount
ry
0 .2 .4 .6 .8 1Ethnic Share in the Exporting Country
(b) Share of Ethnicities in the Importing andExporting Country
ders, most of which are still valid today, were decided by the political powers in Europe. These
borders were set without taking economic or political consequences into account (Michalopoulos
& Papaioannou 2014) and most importantly, without the knowledge of the future population
of the countries they were forming. Furthermore, as Alesina et al. (2011) show, 80% of African
political boundaries follow either latitudinal or longitudinal lines and thus often combined var-
ious ethnic groups that were then supposed to form a working democracy. This mixture of
ethnicities proved menacing in the second half of the twentieth century as civil war broke out
in several countries.26 Identification with the own country is often of secondary importance to
identification with the own ethnicity (Alesina et al. 2011), possibly also to form a group that
can bargain for rents (Bates 2008).
The argument for random ethnic shares in African countries also holds when the country border
is, or contains, a river. As long as ethnicities did not settle alongside rivers in order to have
political or economical advantages in the event of nation founding ethnic shares are still random.
When comparing country borders and rivers in West-Africa in Figure 2a there are countries that
have multiple rivers passing through countries without having a river as a boundary, supporting
the initial claim.
If country borders were set to split ethnicities in a certain way Figure 2b would show a concen-
tration of values. The values, however, are spread across the complete unit interval supporting
the randomness assumption. Additionally, Michalopoulos & Papaioannou (2013) show that
26Sudan 1955,1983, 1987-today, Algeria 1991-2002, Chad 1965-2002 (with breaks), Somalia 1977, 1991-today,Uganda 1982-1986, Rwanda 1994 Ivory Coast 2002-2007, Guinea-Bissau 1998-1999, Libera 1989-2003 (withbreak). List incomplete.
14

Figure 3: Construction of the ethnic network variable
with the exception of landmass and water area, other potentially important factors are not
systematically different across separated and non-separated ethnicities.27 Thus supporting my
claim that based on observables, ethnic shares are as good as random across countries.
To identify the ethnic population I interact the geographic size of an ethnicity in each country
with population raster data from the United Nations Environment Program. Using a more
recent version of this data would generate a bias towards ethnicities that contain large cities,
due to increased urbanization in Africa.28 Although I use the spatial information where these
ethnicities were located, I do not require individual members to live inside the same area as in
1960. I rather require them to live in the same country and have the same population growth
as all other ethnicities.29 Using this procedure I account for 245 million people in 1960, which
is 85% of the figure reported in popular media.30
27Although showing it for a different input provided by Murdock (1959) that uses pre-colonial data, it is likelyto hold here as well.
28See United Nations (2002) for percentage of urban population in 1950: Botswana 0.4%, Lesotho 1 %, Rwanda1.8% up to 6.2% in 2000, Mozambique 2.5%, Malawi 3.5% up to 14.7% in 2000, Chad 3.9% Niger 4.9% up to20.6% in 2000, Guinea 5.5%. Median in 1950 was 9.6% while in 2000 the median lies at 36.4%.
29Although this claim is violated for individual ethnicities due to expulsion or genocide, on average this claimis likely to hold. To be more precise I require that the ethnic share in 1960 is a good proxy for the ethnic sharesin 1989-2010 and any deviation from the 1960 network share is random. The resulting measurement error willbe addressed in the robustness section.
30Imputing the population shares until today and compare the resulting ethnic shares with the next best fromthe CIA World Factbook, the numbers have a correlation of 0.85.
15

The construction of the ethnic network variable is shown in Figure 3 by the example of Angola
and Namibia. The ethnic network variable contains the blue shaded ethnicities on both sides of
the country border (red). In this case, four ethnicities31 cross the border and their population
share is calculated taking the other ethnicities (green) and the population raster data into
account.
The resulting data set contains 2,256 (48 × 47) country pairs over a time span of 22 years of
which 492 pairs share at least one ethnicity. If a country shares an ethnicity, the ethnic shares
are on average 33.6% and the network size is on average 1.5 million people. I focus on the
period 1989-2010 to have enough time between independence and observation and to be able
to use detailed conflict data. In total 67.7% of all possible trade connections are zero trade or
missing.
5 Baseline Results
The baseline results are reported in Table 1. In the first column I estimate equation (12) using
an ordinary least squares approach and present the main dependent ethnic network variable
with three values for the exponent. Using unity as the exponent ν, a 1% increase in the ethnic
network across countries increases the exports by 0.1%.
In the average country-pair with ethnic connections, the reported elasticity implies that an
increase in the network size on either side of the border by approximately 26,000 members,
increases the average exports between those countries by 96,000 USD in 2010. In a back of the
envelop calculation, comparing this effect to the average trade flow of country-pairs without
ethnic connections, it would increase their exports by 0.3%.32
Another way of interpreting the results would be to consider trade costs. The coefficient on
distance in the equations are -1.068 with a standard error of 0.106 in the specification using
ordinary least squares and -0.388 with a standard error of 0.068 in the PPML specification.
The estimated reduction in trade cost for an average country ranges between 16.3% and 25.9%
in the OLS and PPML specification respectively.33
The next two rows in Table 1 can be thought of in two ways. The first interpretation is an
increase in the degree of firm heterogeneity relative to the elasticity of substitution γ ↓ to fit
31The ethnicities are Herero, Bushmen, Ovambo and Wayeye32Assuming linear elasticities that are equal across countries.33The average for log(Ethnic Network) is 11.23 and for distance as a proxy for trade costs 6.84. Then the
calculation done here is 0.106∗11.231.068∗6.84
= 16.3.
16
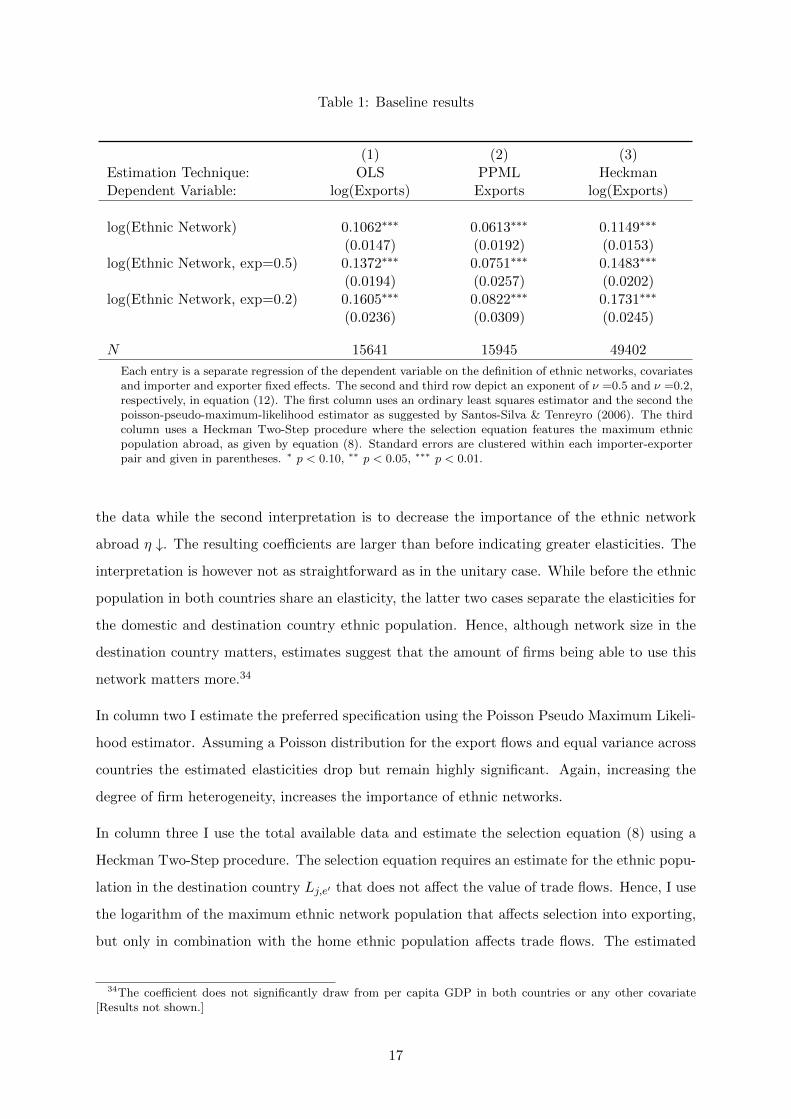
Table 1: Baseline results
(1) (2) (3)Estimation Technique: OLS PPML HeckmanDependent Variable: log(Exports) Exports log(Exports)
log(Ethnic Network) 0.1062∗∗∗ 0.0613∗∗∗ 0.1149∗∗∗
(0.0147) (0.0192) (0.0153)log(Ethnic Network, exp=0.5) 0.1372∗∗∗ 0.0751∗∗∗ 0.1483∗∗∗
(0.0194) (0.0257) (0.0202)log(Ethnic Network, exp=0.2) 0.1605∗∗∗ 0.0822∗∗∗ 0.1731∗∗∗
(0.0236) (0.0309) (0.0245)
N 15641 15945 49402
Each entry is a separate regression of the dependent variable on the definition of ethnic networks, covariatesand importer and exporter fixed effects. The second and third row depict an exponent of ν =0.5 and ν =0.2,respectively, in equation (12). The first column uses an ordinary least squares estimator and the second thepoisson-pseudo-maximum-likelihood estimator as suggested by Santos-Silva & Tenreyro (2006). The thirdcolumn uses a Heckman Two-Step procedure where the selection equation features the maximum ethnicpopulation abroad, as given by equation (8). Standard errors are clustered within each importer-exporterpair and given in parentheses. ∗ p < 0.10, ∗∗ p < 0.05, ∗∗∗ p < 0.01.
the data while the second interpretation is to decrease the importance of the ethnic network
abroad η ↓. The resulting coefficients are larger than before indicating greater elasticities. The
interpretation is however not as straightforward as in the unitary case. While before the ethnic
population in both countries share an elasticity, the latter two cases separate the elasticities for
the domestic and destination country ethnic population. Hence, although network size in the
destination country matters, estimates suggest that the amount of firms being able to use this
network matters more.34
In column two I estimate the preferred specification using the Poisson Pseudo Maximum Likeli-
hood estimator. Assuming a Poisson distribution for the export flows and equal variance across
countries the estimated elasticities drop but remain highly significant. Again, increasing the
degree of firm heterogeneity, increases the importance of ethnic networks.
In column three I use the total available data and estimate the selection equation (8) using a
Heckman Two-Step procedure. The selection equation requires an estimate for the ethnic popu-
lation in the destination country Lj,e′ that does not affect the value of trade flows. Hence, I use
the logarithm of the maximum ethnic network population that affects selection into exporting,
but only in combination with the home ethnic population affects trade flows. The estimated
34The coefficient does not significantly draw from per capita GDP in both countries or any other covariate[Results not shown.]
17

value for the importance of the ethnic networks is η = 0.03 which is below the condition for
interior solutions when the exponent is 0.5 or 0.2.35 The results suggest that there is indeed a
selection bias, the coefficients from column one and three are however not statistically different.
6 Robustness
Ethnic networks do have a strong and economically meaningful impact on bilateral trade flows.
In this section I will explore the robustness of the results in various ways. At first I check whether
data quality poses a threat to my results. Since 67.7% of the possible importer and exporter
pairs contain non-reported trade, I verify that these observations are not missing systematically.
To do so, I employ three different treatments of the dependent variable. First, I assume that
every non-reported trade flow is actually zero trade flow. This is labeled ”All-Zero” in Table 2
and refers to a specification where I use the complete available data set and trust its reliability.
Second, I assume that non-reported trade is only zero trade after I have observed this trading
connection at least once. In Table 2 I refer to this specification as ”Zero-after-Observing” in
column two. The underlying assumption here is that data availability only started when this
importer-exporter pair first traded with each other. Third, I impute the trade flows between
two countries using the last observations value-to-GDP ratio. I refer to this specification as
”Impute-after-Observing” in Table 2, column three. Here I assume that after the first time
trade between the importer-exporter pair has been observed, instead of no trade, there was
non-reported trade for the next years.
If the results are due to systematical under-reporting bilateral trade-flows the results from
at least one of the above treatments should vary significantly from the baseline results. The
results from the PPML regression in Table 2, however, are not statistically different from the
previously obtained results in the baseline. I do not report results from ordinary least squares
or the Heckman Two-Step procedure since for the former the logarithm of zero is undefined and
the latter uses the complete data set by default.
The second test for data quality is how sensitive the results are with respect to the number of
years chosen. In the baseline I include all observations for 1989-2010, together with non-reported
trade. In Table 3 I only take importer-exporter pairs into account when they have been trading
35I keep on reporting the unitary coefficient due to its interpretative simplicity. The condition is η < σ−1γ
which can be obtained by using the value for η in the exponent: η (σ−1)−γ1−σ = ν ⇒ σ−1
γ= η
ν+ηwhich holds for
ν < 1− η.
18
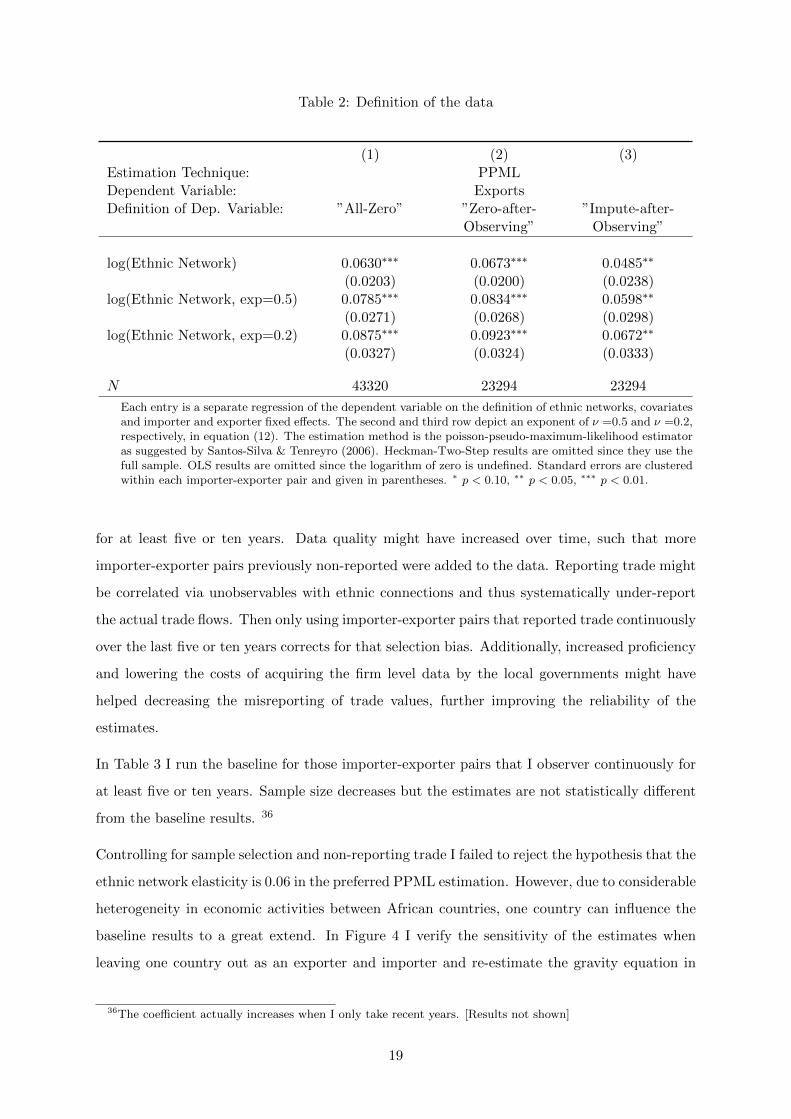
Table 2: Definition of the data
(1) (2) (3)Estimation Technique: PPMLDependent Variable: ExportsDefinition of Dep. Variable: ”All-Zero” ”Zero-after-
Observing””Impute-after-
Observing”
log(Ethnic Network) 0.0630∗∗∗ 0.0673∗∗∗ 0.0485∗∗
(0.0203) (0.0200) (0.0238)log(Ethnic Network, exp=0.5) 0.0785∗∗∗ 0.0834∗∗∗ 0.0598∗∗
(0.0271) (0.0268) (0.0298)log(Ethnic Network, exp=0.2) 0.0875∗∗∗ 0.0923∗∗∗ 0.0672∗∗
(0.0327) (0.0324) (0.0333)
N 43320 23294 23294
Each entry is a separate regression of the dependent variable on the definition of ethnic networks, covariatesand importer and exporter fixed effects. The second and third row depict an exponent of ν =0.5 and ν =0.2,respectively, in equation (12). The estimation method is the poisson-pseudo-maximum-likelihood estimatoras suggested by Santos-Silva & Tenreyro (2006). Heckman-Two-Step results are omitted since they use thefull sample. OLS results are omitted since the logarithm of zero is undefined. Standard errors are clusteredwithin each importer-exporter pair and given in parentheses. ∗ p < 0.10, ∗∗ p < 0.05, ∗∗∗ p < 0.01.
for at least five or ten years. Data quality might have increased over time, such that more
importer-exporter pairs previously non-reported were added to the data. Reporting trade might
be correlated via unobservables with ethnic connections and thus systematically under-report
the actual trade flows. Then only using importer-exporter pairs that reported trade continuously
over the last five or ten years corrects for that selection bias. Additionally, increased proficiency
and lowering the costs of acquiring the firm level data by the local governments might have
helped decreasing the misreporting of trade values, further improving the reliability of the
estimates.
In Table 3 I run the baseline for those importer-exporter pairs that I observer continuously for
at least five or ten years. Sample size decreases but the estimates are not statistically different
from the baseline results. 36
Controlling for sample selection and non-reporting trade I failed to reject the hypothesis that the
ethnic network elasticity is 0.06 in the preferred PPML estimation. However, due to considerable
heterogeneity in economic activities between African countries, one country can influence the
baseline results to a great extend. In Figure 4 I verify the sensitivity of the estimates when
leaving one country out as an exporter and importer and re-estimate the gravity equation in
36The coefficient actually increases when I only take recent years. [Results not shown]
19
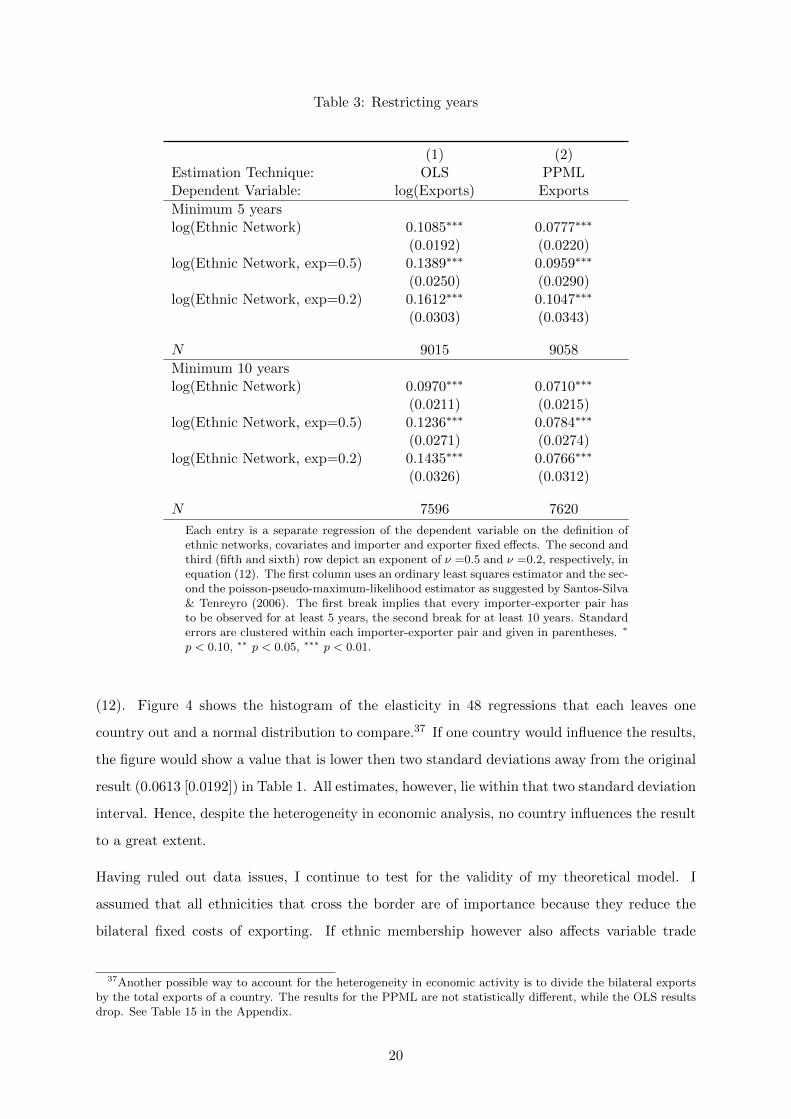
Table 3: Restricting years
(1) (2)Estimation Technique: OLS PPMLDependent Variable: log(Exports) Exports
Minimum 5 yearslog(Ethnic Network) 0.1085∗∗∗ 0.0777∗∗∗
(0.0192) (0.0220)log(Ethnic Network, exp=0.5) 0.1389∗∗∗ 0.0959∗∗∗
(0.0250) (0.0290)log(Ethnic Network, exp=0.2) 0.1612∗∗∗ 0.1047∗∗∗
(0.0303) (0.0343)
N 9015 9058
Minimum 10 yearslog(Ethnic Network) 0.0970∗∗∗ 0.0710∗∗∗
(0.0211) (0.0215)log(Ethnic Network, exp=0.5) 0.1236∗∗∗ 0.0784∗∗∗
(0.0271) (0.0274)log(Ethnic Network, exp=0.2) 0.1435∗∗∗ 0.0766∗∗∗
(0.0326) (0.0312)
N 7596 7620
Each entry is a separate regression of the dependent variable on the definition ofethnic networks, covariates and importer and exporter fixed effects. The second andthird (fifth and sixth) row depict an exponent of ν =0.5 and ν =0.2, respectively, inequation (12). The first column uses an ordinary least squares estimator and the sec-ond the poisson-pseudo-maximum-likelihood estimator as suggested by Santos-Silva& Tenreyro (2006). The first break implies that every importer-exporter pair hasto be observed for at least 5 years, the second break for at least 10 years. Standarderrors are clustered within each importer-exporter pair and given in parentheses. ∗
p < 0.10, ∗∗ p < 0.05, ∗∗∗ p < 0.01.
(12). Figure 4 shows the histogram of the elasticity in 48 regressions that each leaves one
country out and a normal distribution to compare.37 If one country would influence the results,
the figure would show a value that is lower then two standard deviations away from the original
result (0.0613 [0.0192]) in Table 1. All estimates, however, lie within that two standard deviation
interval. Hence, despite the heterogeneity in economic analysis, no country influences the result
to a great extent.
Having ruled out data issues, I continue to test for the validity of my theoretical model. I
assumed that all ethnicities that cross the border are of importance because they reduce the
bilateral fixed costs of exporting. If ethnic membership however also affects variable trade
37Another possible way to account for the heterogeneity in economic activity is to divide the bilateral exportsby the total exports of a country. The results for the PPML are not statistically different, while the OLS resultsdrop. See Table 15 in the Appendix.
20

Figure 4: Histogram of the coefficient when leaving one county out in the regression
010
2030
40P
erce
nt
0 .01 .02 .03 .04 .05 .06 .07 .08 .09 .1Coefficient if leaving one country out
The above shows the regression coefficients of log(Ethnic Network)in a PPML regression on exports.
costs, then the estimation equation would be misspecified. I aim to test the model by dropping
every ethnic connection and its network, when the ethnicity does not have an important border
crossing in its original area.38 Variable trade costs also include bribery at the border and if
ethnic membership decreases bribery payments, then these ethnic networks should be more
important than others. Thus, the estimated elasticities should be larger then the baseline
results. The results are shown in Table 4 where I re-estimate the baseline only using ethnicities
with border crossings. Using ordinary least squares the estimates drop significantly and vanish
when employing the PPML specification. The results for the PPML estimation show strong
evidence, while the others give at least weak evidence, for the correct specification of my model.
Ethnic population in every country today is calculated using the population shares in 1960
and multiplying them with the population figures from the year of observation. As there is
a lot of migration within Africa due to economic possibilities or conflicts, ethnic shares may
vary significantly during the years. Although I control for conflict, the resulting measurement
error might still be substantial in a subset of countries with large migration patterns. In the
following I propose an assessment of the severity of the measurement error in the ethnic network
variable. At first I will create the network variable in 1960 and leave it constant for all future
observations, factoring out population growth and variations in the ethnic shares. The resulting
elasticity in Table 5 is a reduced form effect of the ethnic network in 1960 on export flows in the
years 1989-2010. The results using the PPML estimator do not change significantly, supporting
the hypothesis that the measurement error is not substantial. In columns (1) and (3) where I
38I define border crossing as a main customs station at a relatively frequented, possibly paved, road.
21
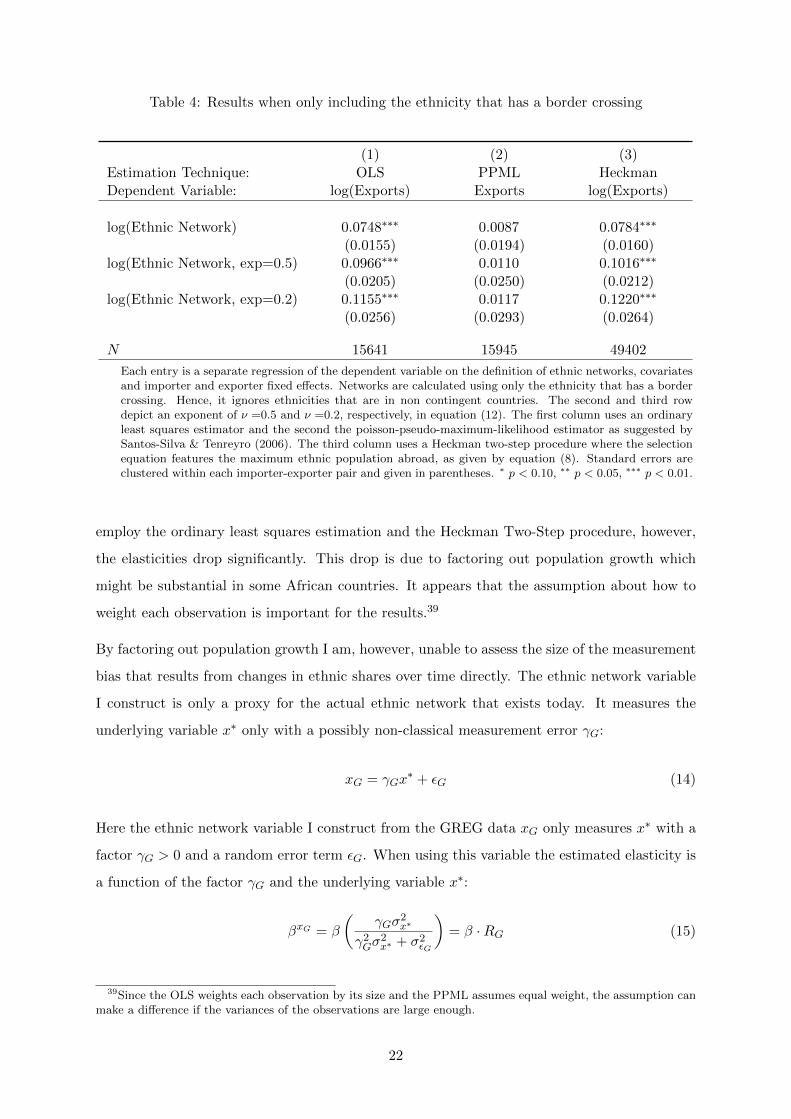
Table 4: Results when only including the ethnicity that has a border crossing
(1) (2) (3)Estimation Technique: OLS PPML HeckmanDependent Variable: log(Exports) Exports log(Exports)
log(Ethnic Network) 0.0748∗∗∗ 0.0087 0.0784∗∗∗
(0.0155) (0.0194) (0.0160)log(Ethnic Network, exp=0.5) 0.0966∗∗∗ 0.0110 0.1016∗∗∗
(0.0205) (0.0250) (0.0212)log(Ethnic Network, exp=0.2) 0.1155∗∗∗ 0.0117 0.1220∗∗∗
(0.0256) (0.0293) (0.0264)
N 15641 15945 49402
Each entry is a separate regression of the dependent variable on the definition of ethnic networks, covariatesand importer and exporter fixed effects. Networks are calculated using only the ethnicity that has a bordercrossing. Hence, it ignores ethnicities that are in non contingent countries. The second and third rowdepict an exponent of ν =0.5 and ν =0.2, respectively, in equation (12). The first column uses an ordinaryleast squares estimator and the second the poisson-pseudo-maximum-likelihood estimator as suggested bySantos-Silva & Tenreyro (2006). The third column uses a Heckman two-step procedure where the selectionequation features the maximum ethnic population abroad, as given by equation (8). Standard errors areclustered within each importer-exporter pair and given in parentheses. ∗ p < 0.10, ∗∗ p < 0.05, ∗∗∗ p < 0.01.
employ the ordinary least squares estimation and the Heckman Two-Step procedure, however,
the elasticities drop significantly. This drop is due to factoring out population growth which
might be substantial in some African countries. It appears that the assumption about how to
weight each observation is important for the results.39
By factoring out population growth I am, however, unable to assess the size of the measurement
bias that results from changes in ethnic shares over time directly. The ethnic network variable
I construct is only a proxy for the actual ethnic network that exists today. It measures the
underlying variable x∗ only with a possibly non-classical measurement error γG:
xG = γGx∗ + εG (14)
Here the ethnic network variable I construct from the GREG data xG only measures x∗ with a
factor γG > 0 and a random error term εG. When using this variable the estimated elasticity is
a function of the factor γG and the underlying variable x∗:
βxG = β
(γGσ
2x∗
γ2Gσ
2x∗ + σ2
εG
)= β ·RG (15)
39Since the OLS weights each observation by its size and the PPML assumes equal weight, the assumption canmake a difference if the variances of the observations are large enough.
22

Table 5: Results when omitting population growth
(1) (2) (3)Estimation Technique: OLS PPML HeckmanDependent Variable: log(Exports) Exports log(Exports)
log(Ethnic Network) 0.0619∗∗∗ 0.0463∗∗∗ 0.0677∗∗∗
(0.0076) (0.0105) (0.0078)log(Ethnic Network, exp=0.5) 0.0816∗∗∗ 0.0598∗∗∗ 0.0892∗∗∗
(0.0101) (0.0141) (0.0104)log(Ethnic Network, exp=0.2) 0.0997∗∗∗ 0.0709∗∗∗ 0.1091∗∗∗
(0.0125) (0.0174) (0.0129)
N 15641 15945 49402
Each entry is a separate regression of the dependent variable on the definition of ethnic networks, covariatesand importer and exporter fixed effects. Networks are calculated using the population in 1960. The secondand third row depict an exponent of ν =0.5 and ν =0.2, respectively, in equation (12). The first columnuses an ordinary least squares estimator and the second the poisson-pseudo-maximum-likelihood estimatoras suggested by Santos-Silva & Tenreyro (2006). The third column uses a Heckman two-step procedurewhere the selection equation features the maximum ethnic population abroad, as given by equation (8).Standard errors are clustered within each importer-exporter pair and given in parentheses. ∗ p < 0.10, ∗∗
p < 0.05, ∗∗∗ p < 0.01.
Where βxG is the regression coefficient in the baseline results.40 I can argue that ifσ2x∗
σ2xG
> γG,
the attenuation factor RG is less than unity and the estimated coefficient is downward biased.
However, I want to employ a method used by Krueger & Lindahl (2001) and use a second proxy
xM to factor out the attenuation factor directly. They assume a classical measurement error
γG = γM = 1 and regress two inputs for schooling on each other to obtain the attenuation
factor. I extend their method to non-classical measurement errors if either γG or γM is known.
Then, by regressing two inputs on each other I obtain:
βxMxG =cov(xG, xM )
var(xg)
p→ γGγMσ2x∗
γ2Gσ
2x∗ + σ2
εG
= γM ·RG (16)
Here, the resulting coefficient is a function of the attenuation factor RG and the non-classical
measurement error in the other data set γM . The advantage of this procedure is that I do not
need to know the variance of the underlying variable x∗ nor the variance of the error term σ2εG
in order to get an unbiased estimate for β. The necessary assumption is that the error terms
are uncorrelated (corr(εG, εM ) = 0).
Hence, I use the map in Figure 5 provided by Murdock (1959) that shows pre-colonial ethnic
distribution in Africa. This map has been used by Nunn & Wantchekon (2011), Michalopoulos
40Under the assumption that corr(εG, x∗) = corr(εG, xG) = 0.
23

Figure 5: Ethnic and country boundaries as provided by Murdock (1959)
& Papaioannou (2013) and Michalopoulos & Papaioannou (2014) in various applications. It
has on average more ethnic groups (25 vs 10.5), more ethnicities (835 vs 214) and a smaller
ethnicity share (2.6% vs 5.2%) than the GREG map, but the assumption on the error terms
corr(εG, εM ) = 0 are supported in two ways.41 First, the map shows ethnic distribution years
before the GREG map and second while the Atlas Narodov Mira was created by Russian sci-
entist, the Murdock map was published in America at the height of the cold war, almost at the
same time.
A further advantage of using the Murdock map as a secondary input is that Nunn & Wantchekon
(2011) give a correlation of 0.55 for the location of a respondent and its ethnicity as indicated
by the map. This correlation is the factor γM I need to factor out the attenuation bias RG.42
Thus, the true β can be estimated as:
β =βxG
βxG,xM· γM (17)
The results are shown in Table 6. As long as γM < βxMxG I estimate the coefficient with an
upward bias and vice versa if γM > βxMxG . However, using the correlation provided by Nunn
41Using the Murdock map yields qualitatively the same results, but the GREG map coincides exactly with thefirst population raster data which is why I chose to use it as a primary input.
42Since γM = cov(xM ,x∗)var(x∗) =
corr(xM ,x∗)σ2x∗
σ2x∗
= corr(xM , x∗)
24

Table 6: Attenuation factor R, R2 and the covariate adjusted attenuation factor R′.
(1) (2) (3)log(Ethnic Network) log(Ethnic Network,
exp=0.5)log(Ethnic Network,
exp=0.2)
βxMxG 0.5502 0.5575 0.5675R using γM = 0.55 1.0004 1.0136 1.0318R2 0.6089 0.6112 0.6104R′ cond. on cov. 1.0010 1.0350 1.0816
Estimated βxG 0.0613 0.0751 0.0822True β in PPML 0.0612 0.0726 0.0760
βxMxG is the regression coefficient from a regression that has the first row from the Murdock Data as anindependent variable and the GREG variable as a dependent variable. The second row estimates the atten-uation factor R using R = βxMxG/γM The R2 is from a regression using the GREG ethnic distance/network
as a independent variable on all covariates. The R′ = RG−R2
1−R2 when conditioning on covariates is a formulaprovided by Krueger & Lindahl (2001). Although only the coefficient from the poisson-pseudo-maximum-likelihood regression is reported, the attenuation factor R′ is the same for all estimated coefficients.
& Wantchekon (2011) results in no significant changes in the elasticities. I reject the existence
of a substantial measurement error and neglect it in further analyses.
Having discussed data quality issues and potential measurement errors I found strong support
for the coefficients in the baseline results. Ethnic networks have a strong positive effect on
bilateral exports and the resulting elasticity is of economic meaning. The preferred Poisson
Pseudo Maximum Likelihood specification yields the lowest elasticity, but is most robust to the
threats discussed here. Hence, I will almost exclusively employ the PPML specification when I
investigate the channels through which ethnic networks affect bilateral exports.
7 Channels
In this section I test the empirical predictions derived from the model in section 2. To test the
first prediction
Hypothesis 1 Ethnic networks are more important in countries with poorly enforced rules,
lower social norms and lower levels of trust
I use the Afrobarometer data that contain trust and corruption measures as used by Nunn &
Wantchekon (2011) and interact them with the ethnic network variables. Since the data is based
on a questionnaire the resulting value is ordinal and not directly interpretable. To circumvent
25
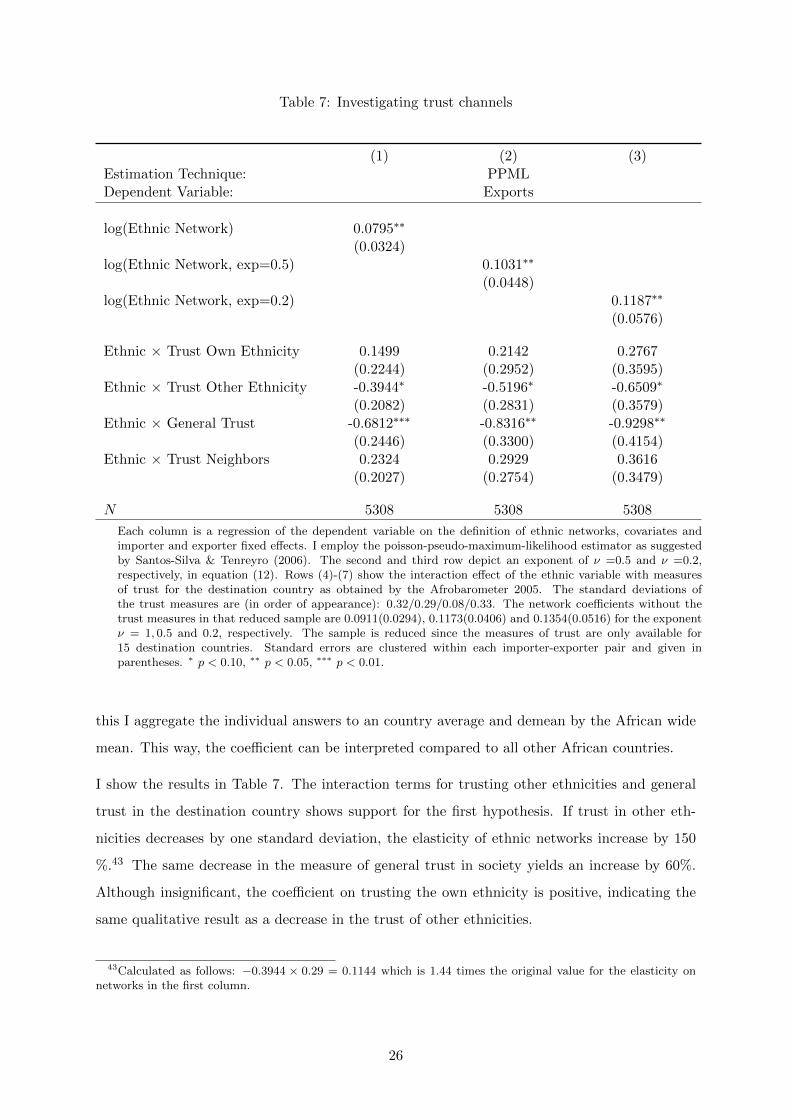
Table 7: Investigating trust channels
(1) (2) (3)Estimation Technique: PPMLDependent Variable: Exports
log(Ethnic Network) 0.0795∗∗
(0.0324)log(Ethnic Network, exp=0.5) 0.1031∗∗
(0.0448)log(Ethnic Network, exp=0.2) 0.1187∗∗
(0.0576)
Ethnic × Trust Own Ethnicity 0.1499 0.2142 0.2767(0.2244) (0.2952) (0.3595)
Ethnic × Trust Other Ethnicity -0.3944∗ -0.5196∗ -0.6509∗
(0.2082) (0.2831) (0.3579)Ethnic × General Trust -0.6812∗∗∗ -0.8316∗∗ -0.9298∗∗
(0.2446) (0.3300) (0.4154)Ethnic × Trust Neighbors 0.2324 0.2929 0.3616
(0.2027) (0.2754) (0.3479)
N 5308 5308 5308
Each column is a regression of the dependent variable on the definition of ethnic networks, covariates andimporter and exporter fixed effects. I employ the poisson-pseudo-maximum-likelihood estimator as suggestedby Santos-Silva & Tenreyro (2006). The second and third row depict an exponent of ν =0.5 and ν =0.2,respectively, in equation (12). Rows (4)-(7) show the interaction effect of the ethnic variable with measuresof trust for the destination country as obtained by the Afrobarometer 2005. The standard deviations ofthe trust measures are (in order of appearance): 0.32/0.29/0.08/0.33. The network coefficients without thetrust measures in that reduced sample are 0.0911(0.0294), 0.1173(0.0406) and 0.1354(0.0516) for the exponentν = 1, 0.5 and 0.2, respectively. The sample is reduced since the measures of trust are only available for15 destination countries. Standard errors are clustered within each importer-exporter pair and given inparentheses. ∗ p < 0.10, ∗∗ p < 0.05, ∗∗∗ p < 0.01.
this I aggregate the individual answers to an country average and demean by the African wide
mean. This way, the coefficient can be interpreted compared to all other African countries.
I show the results in Table 7. The interaction terms for trusting other ethnicities and general
trust in the destination country shows support for the first hypothesis. If trust in other eth-
nicities decreases by one standard deviation, the elasticity of ethnic networks increase by 150
%.43 The same decrease in the measure of general trust in society yields an increase by 60%.
Although insignificant, the coefficient on trusting the own ethnicity is positive, indicating the
same qualitative result as a decrease in the trust of other ethnicities.
43Calculated as follows: −0.3944 × 0.29 = 0.1144 which is 1.44 times the original value for the elasticity onnetworks in the first column.
26
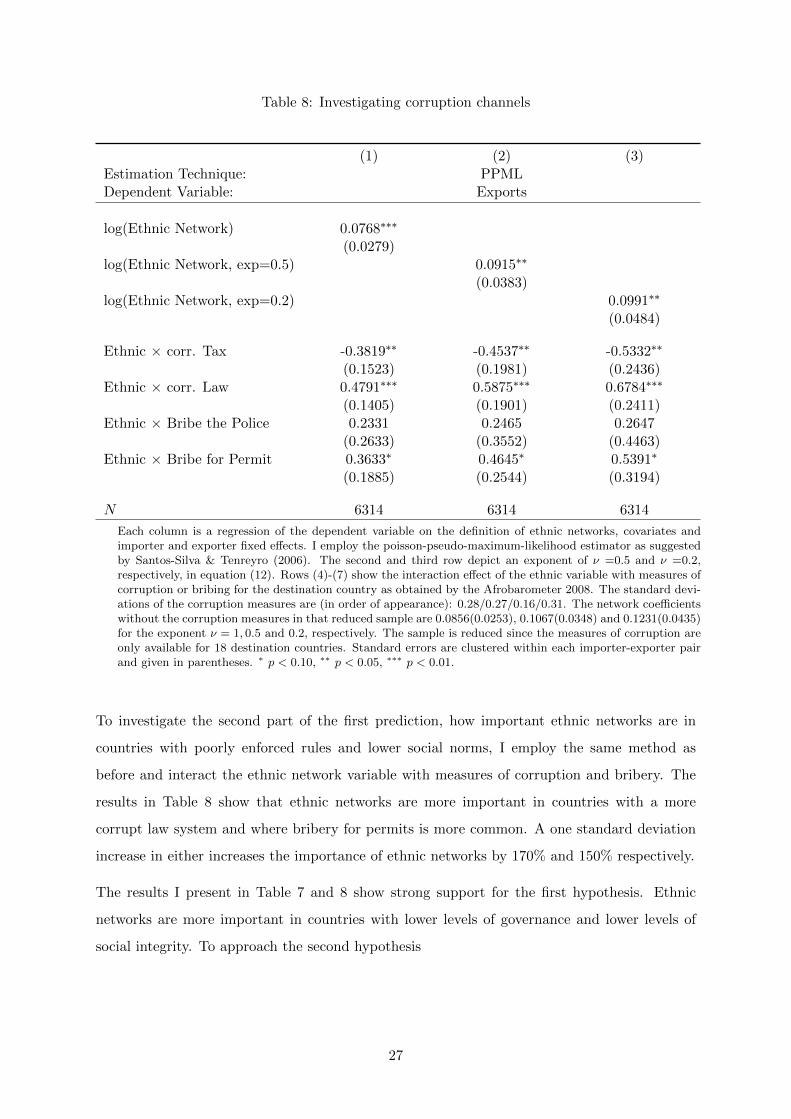
Table 8: Investigating corruption channels
(1) (2) (3)Estimation Technique: PPMLDependent Variable: Exports
log(Ethnic Network) 0.0768∗∗∗
(0.0279)log(Ethnic Network, exp=0.5) 0.0915∗∗
(0.0383)log(Ethnic Network, exp=0.2) 0.0991∗∗
(0.0484)
Ethnic × corr. Tax -0.3819∗∗ -0.4537∗∗ -0.5332∗∗
(0.1523) (0.1981) (0.2436)Ethnic × corr. Law 0.4791∗∗∗ 0.5875∗∗∗ 0.6784∗∗∗
(0.1405) (0.1901) (0.2411)Ethnic × Bribe the Police 0.2331 0.2465 0.2647
(0.2633) (0.3552) (0.4463)Ethnic × Bribe for Permit 0.3633∗ 0.4645∗ 0.5391∗
(0.1885) (0.2544) (0.3194)
N 6314 6314 6314
Each column is a regression of the dependent variable on the definition of ethnic networks, covariates andimporter and exporter fixed effects. I employ the poisson-pseudo-maximum-likelihood estimator as suggestedby Santos-Silva & Tenreyro (2006). The second and third row depict an exponent of ν =0.5 and ν =0.2,respectively, in equation (12). Rows (4)-(7) show the interaction effect of the ethnic variable with measures ofcorruption or bribing for the destination country as obtained by the Afrobarometer 2008. The standard devi-ations of the corruption measures are (in order of appearance): 0.28/0.27/0.16/0.31. The network coefficientswithout the corruption measures in that reduced sample are 0.0856(0.0253), 0.1067(0.0348) and 0.1231(0.0435)for the exponent ν = 1, 0.5 and 0.2, respectively. The sample is reduced since the measures of corruption areonly available for 18 destination countries. Standard errors are clustered within each importer-exporter pairand given in parentheses. ∗ p < 0.10, ∗∗ p < 0.05, ∗∗∗ p < 0.01.
To investigate the second part of the first prediction, how important ethnic networks are in
countries with poorly enforced rules and lower social norms, I employ the same method as
before and interact the ethnic network variable with measures of corruption and bribery. The
results in Table 8 show that ethnic networks are more important in countries with a more
corrupt law system and where bribery for permits is more common. A one standard deviation
increase in either increases the importance of ethnic networks by 170% and 150% respectively.
The results I present in Table 7 and 8 show strong support for the first hypothesis. Ethnic
networks are more important in countries with lower levels of governance and lower levels of
social integrity. To approach the second hypothesis
27

Table 9: Interaction effect with bilateral characteristics
(1) (2) (3) (4) (5)Estimation Technique: PPMLDependent Variable: Exports
log(Ethnic Network) 0.0613∗∗∗ 0.0650∗∗∗ 0.0909∗∗∗ 0.0727∗∗∗ 0.0944∗∗∗
(0.0192) (0.0186) (0.0192) (0.0190) (0.0194)Ethnic × River -0.0706 -0.0249
(0.0483) (0.0638)Ethnic × Border -0.1002∗∗∗ -0.0761∗
(0.0268) (0.0390)Ethnic × Language -0.0848∗∗∗ -0.0720∗∗
(0.0256) (0.0326)
N 15945 15945 15945 15945 15945
Each column is a separate regression of the dependent variable on the column variables, covari-ates and importer and exporter fixed effects. I employ the poisson-pseudo-maximum-likelihoodestimator as suggested by Santos-Silva & Tenreyro (2006). Standard errors are clustered withineach importer-exporter pair and given in parentheses. ∗ p < 0.10, ∗∗ p < 0.05, ∗∗∗ p < 0.01.
Hypothesis 2 Number of firms exporting is increasing in the number of ethnic connections
between two countries
I first look into how bilateral characteristics influence networks in Table 9. Including all inter-
action terms in column (5) the results show a negative impact of sharing a border and having
a larger network. The same qualitative result holds for sharing a language. Ethnic networks
become more important as distance between two countries increase and the official languages
differ. In light of these results I choose to investigate the selection channel in order to test the
second hypothesis.
Using disaggregated data at the 2-digit level I first investigate which products influence the
importance of ethnic networks in Table 10. I interact the main independent variable with
all sectors and estimate the baseline equation. The results show that semi and non durable
consumer goods influence the importance of ethnic networks, without changing the original
estimate significantly.44 Since foods are a separate category, the result indicate that historical
trade routes for food are not an important factor for todays staple consumption.45 Other
consumption goods are however affected, which hints at a preference channel through which
44Total number of sectors is 21, including food, industrial supplies, fuels, capital, passenger motor cars, con-sumer goods and other. In table 10 I omit insignificant interaction terms and product code dummies.
45Likely because non-market purchased food is coming from international companies.
28
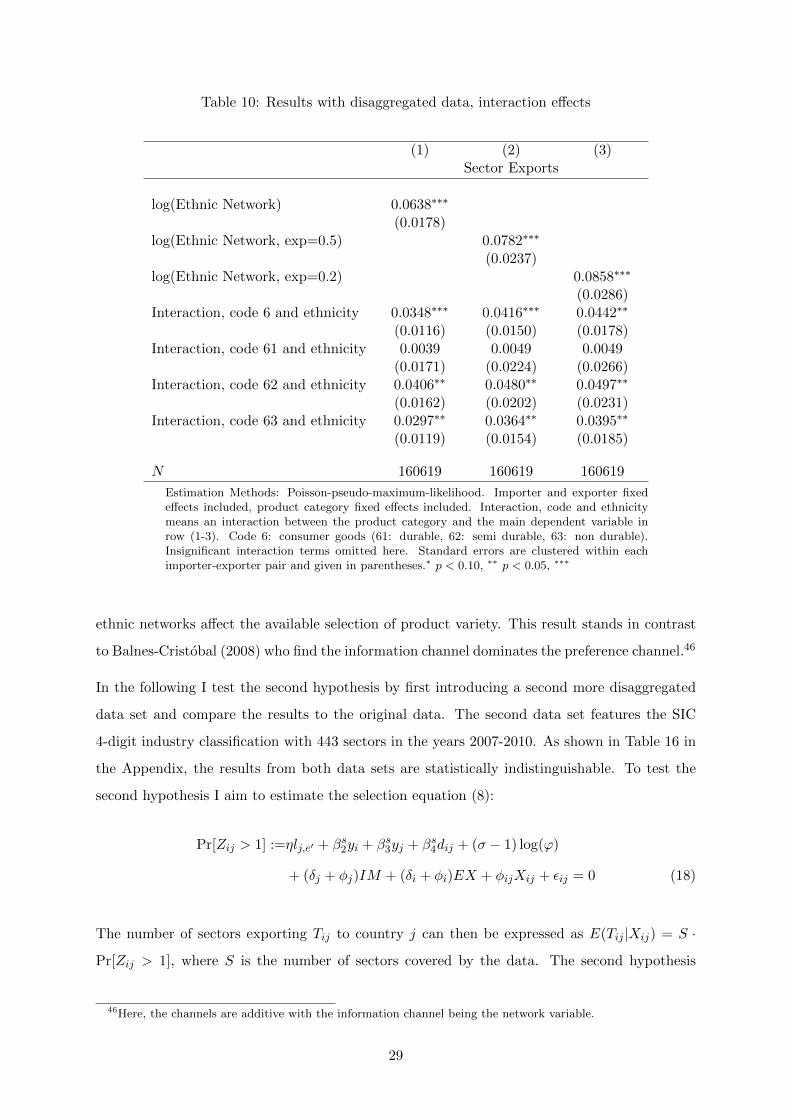
Table 10: Results with disaggregated data, interaction effects
(1) (2) (3)Sector Exports
log(Ethnic Network) 0.0638∗∗∗
(0.0178)log(Ethnic Network, exp=0.5) 0.0782∗∗∗
(0.0237)log(Ethnic Network, exp=0.2) 0.0858∗∗∗
(0.0286)Interaction, code 6 and ethnicity 0.0348∗∗∗ 0.0416∗∗∗ 0.0442∗∗
(0.0116) (0.0150) (0.0178)Interaction, code 61 and ethnicity 0.0039 0.0049 0.0049
(0.0171) (0.0224) (0.0266)Interaction, code 62 and ethnicity 0.0406∗∗ 0.0480∗∗ 0.0497∗∗
(0.0162) (0.0202) (0.0231)Interaction, code 63 and ethnicity 0.0297∗∗ 0.0364∗∗ 0.0395∗∗
(0.0119) (0.0154) (0.0185)
N 160619 160619 160619
Estimation Methods: Poisson-pseudo-maximum-likelihood. Importer and exporter fixedeffects included, product category fixed effects included. Interaction, code and ethnicitymeans an interaction between the product category and the main dependent variable inrow (1-3). Code 6: consumer goods (61: durable, 62: semi durable, 63: non durable).Insignificant interaction terms omitted here. Standard errors are clustered within eachimporter-exporter pair and given in parentheses.∗ p < 0.10, ∗∗ p < 0.05, ∗∗∗
ethnic networks affect the available selection of product variety. This result stands in contrast
to Balnes-Cristobal (2008) who find the information channel dominates the preference channel.46
In the following I test the second hypothesis by first introducing a second more disaggregated
data set and compare the results to the original data. The second data set features the SIC
4-digit industry classification with 443 sectors in the years 2007-2010. As shown in Table 16 in
the Appendix, the results from both data sets are statistically indistinguishable. To test the
second hypothesis I aim to estimate the selection equation (8):
Pr[Zij > 1] :=ηlj,e′ + βs2yi + βs3yj + βs4dij + (σ − 1) log(ϕ)
+ (δj + φj)IM + (δi + φi)EX + φijXij + εij = 0 (18)
The number of sectors exporting Tij to country j can then be expressed as E(Tij |Xij) = S ·
Pr[Zij > 1], where S is the number of sectors covered by the data. The second hypothesis
46Here, the channels are additive with the information channel being the network variable.
29
suggests that E(Tij |Xij) is a function of the maximum ethnicity in country j that has an
ethnic connection to the exporter i lj,e′ and the number of ethnic connections between the two
countries. Since ethnic connections open a doorstep into an export market they are expected
to positively affect the export decision of individual firms, and therewith sectors.47
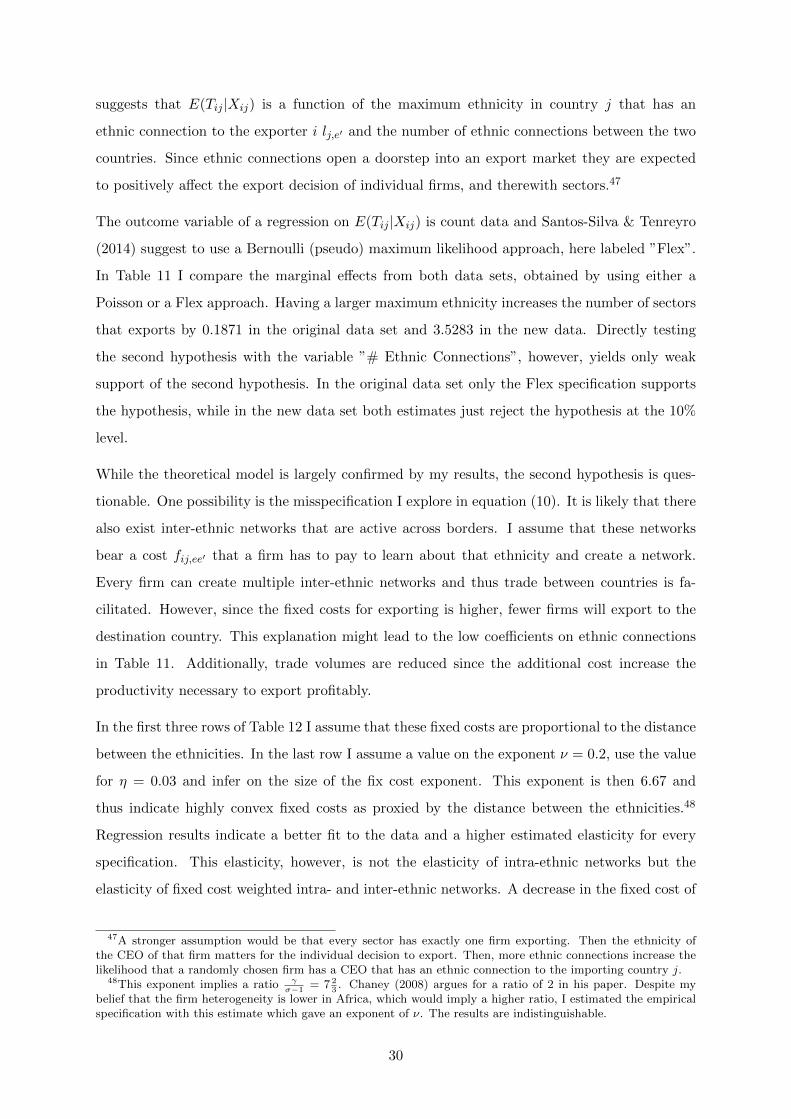
The outcome variable of a regression on E(Tij |Xij) is count data and Santos-Silva & Tenreyro
(2014) suggest to use a Bernoulli (pseudo) maximum likelihood approach, here labeled ”Flex”.
In Table 11 I compare the marginal effects from both data sets, obtained by using either a
Poisson or a Flex approach. Having a larger maximum ethnicity increases the number of sectors
that exports by 0.1871 in the original data set and 3.5283 in the new data. Directly testing
the second hypothesis with the variable ”# Ethnic Connections”, however, yields only weak
support of the second hypothesis. In the original data set only the Flex specification supports
the hypothesis, while in the new data set both estimates just reject the hypothesis at the 10%
level.
While the theoretical model is largely confirmed by my results, the second hypothesis is ques-
tionable. One possibility is the misspecification I explore in equation (10). It is likely that there
also exist inter-ethnic networks that are active across borders. I assume that these networks
bear a cost fij,ee′ that a firm has to pay to learn about that ethnicity and create a network.
Every firm can create multiple inter-ethnic networks and thus trade between countries is fa-
cilitated. However, since the fixed costs for exporting is higher, fewer firms will export to the
destination country. This explanation might lead to the low coefficients on ethnic connections
in Table 11. Additionally, trade volumes are reduced since the additional cost increase the
productivity necessary to export profitably.
In the first three rows of Table 12 I assume that these fixed costs are proportional to the distance
between the ethnicities. In the last row I assume a value on the exponent ν = 0.2, use the value
for η = 0.03 and infer on the size of the fix cost exponent. This exponent is then 6.67 and
thus indicate highly convex fixed costs as proxied by the distance between the ethnicities.48
Regression results indicate a better fit to the data and a higher estimated elasticity for every
specification. This elasticity, however, is not the elasticity of intra-ethnic networks but the
elasticity of fixed cost weighted intra- and inter-ethnic networks. A decrease in the fixed cost of
47A stronger assumption would be that every sector has exactly one firm exporting. Then the ethnicity ofthe CEO of that firm matters for the individual decision to export. Then, more ethnic connections increase thelikelihood that a randomly chosen firm has a CEO that has an ethnic connection to the importing country j.
48This exponent implies a ratio γσ−1
= 7 23. Chaney (2008) argues for a ratio of 2 in his paper. Despite my
belief that the firm heterogeneity is lower in Africa, which would imply a higher ratio, I estimated the empiricalspecification with this estimate which gave an exponent of ν. The results are indistinguishable.
30
Table 11: Extensive margin with count data
(1) (2)Estimation Technique: Poisson FlexDependent Variable: # of Sectors Active
Original Data:
Max. Ethnic Network Abroad β 0.2427∗∗∗ 0.1871∗∗∗
(0.0561) (0.0625)# Ethnic Connections 0.1204 0.2546∗
(0.1052) (0.1442)
N 15983 15983
SIC-4 Data:
Max. Ethnic Network Abroad β 1.7994∗∗∗ 3.5283∗∗∗
(0.5232) (1.0141)# Ethnic Connections 1.7557 3.6533
(1.0812) (2.2373)
N 2203 2203
Each entry is a separate regression of the dependent variable on the definition of ethnicnetworks, covariates and importer and exporter fixed effects. The coefficients show themarginal effect at means for the respective regression. The first column is a poissonregression on the number of active sectors and the second uses a Flex approach assuggested by Santos-Silva & Tenreyro (2014). The number of sectors in the originaldata is 21 and 443 in the SIC-4 data. I exclude zero trade flows. Standard errors areclustered within each importer-exporter pair and given in parentheses. ∗ p < 0.10, ∗∗
p < 0.05, ∗∗∗ p < 0.01.
network formation by one percent, increases trade volumes by 0.14 percent in the specification
with the lowest point estimate.
The above results suggest that ethnic networks are more important in countries that are less
trustful, less governed and more corrupt. Furthermore, I find some evidence that the number
of ethnic connections increases the amount of sectors that export. Investigating an extension
with ethnic dependent fixed costs greatly increases the elasticity and highlights another finding.
Ethnic networks can also exist between ethnicities, even though they are more costly to form.
Reducing these inter ethnic fixed costs can significantly increase trade flows and therewith
economic performance in African countries.
31

Table 12: Model extension with ethnic dependent fixed costs
(1) (2)Estimation Technique: OLS PPMLDependent Variable: log(Exports) Exports
log(Ethnic Network, linear fixed costs) 2.0665∗∗∗ 1.4422∗∗∗
(0.1111) (0.1889)log(Ethnic Network, exp=0.5, linear fixed costs) 2.0710∗∗∗ 1.4507∗∗∗
(0.1099) (0.1804)log(Ethnic Network, exp=0.2, linear fixed costs) 2.0499∗∗∗ 1.4237∗∗∗
(0.1086) (0.1722)log(Ethnic Network, exp=0.2, convex fixed costs†) 0.2641∗∗∗ 0.1406∗∗∗
(0.0146) (0.0212)
N 14978 15269
Each entry is a separate regression of the dependent variable on the definition of ethnic networks, covariatesand importer and exporter fixed effects. The first column uses an ordinary least squares estimator and thesecond the poisson-pseudo-maximum-likelihood estimator as suggested by Santos-Silva & Tenreyro (2006).In the first three rows I assume linear ethnic fixed costs, that is the exponent on fij,ee′ in the augmentedgravity equation 1 − γ
σ−1is equal to -1. In the last row I take a structural approach and first estimate
η = 0.03 and then assume that the exponent ν(γ−(σ−1))σ−1
= 0.2 and compute 1 − γσ−1
which I assume tobe -6.67. Standard errors are clustered within each importer-exporter pair and given in parentheses. ∗
p < 0.10, ∗∗ p < 0.05, ∗∗∗ p < 0.01.
8 Discussion
In the baseline result I estimate that the value added per additional network member is ap-
proximately 3.6 US$.49 Compared to the median value added per worker in PPP US$ to
non-exporting firms (6.5US$, Yoshino 2008), the 3.6 US$ gained by each network member is
substantial. These 3.6 US$ are non-exclusive to every firm and lead to more exports by already
exporting firms as well as to new firms entering the export market. If these networks were
shut down, the potential losses would amount to 17.4% of yearly export volumes.50 The effect
of networks on exports becomes stronger, the more recent the data.51 A part of this increase
is due to increased data quality and another by the increased population in Africa. Slowly
developing governance and social integrity failed to decrease the importance ethnic ties and
generate possibilities for all firms. As shown in Table 7 and 8 these factors can influence trade
volumes indirectly via the effectiveness of ethnic networks. Lower levels of governance decrease
49In 2010: An additional 26,000 member increase exports by 96,000 US$.50Calculated by predicting the trade flows without ethnic networks and correcting for small samples. Results
not shown.51Table 3 and not displayed results.
32
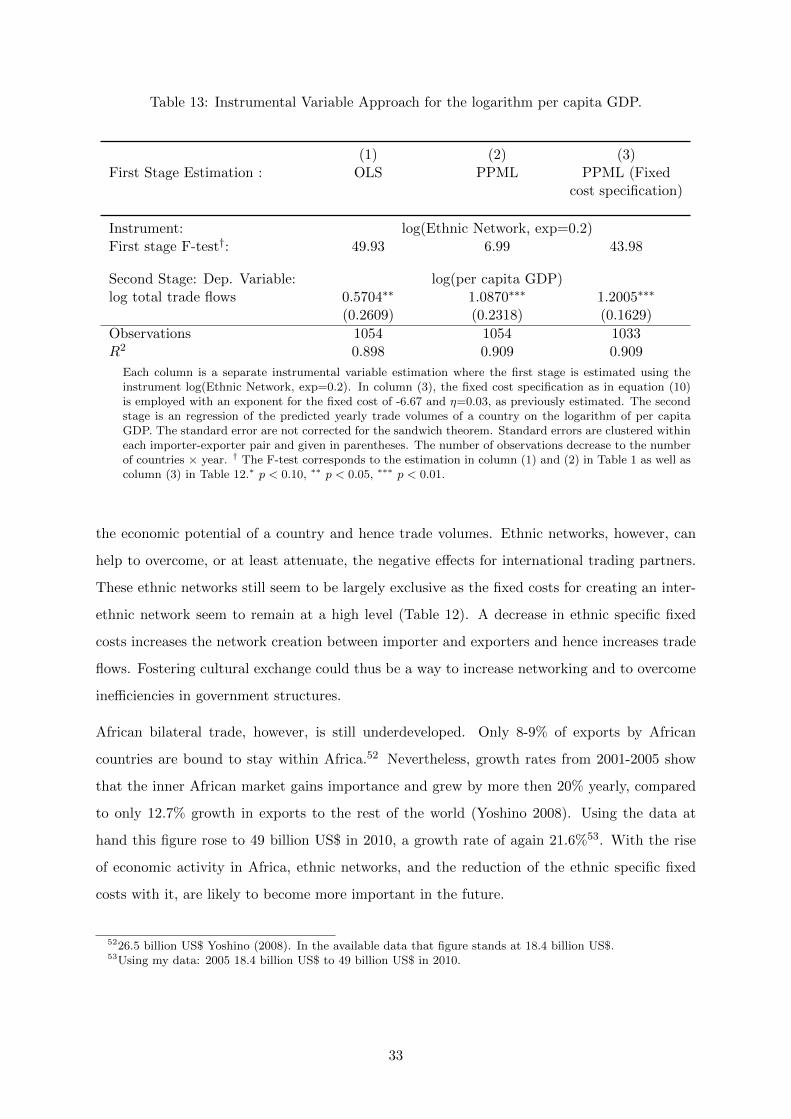
Table 13: Instrumental Variable Approach for the logarithm per capita GDP.
(1) (2) (3)First Stage Estimation : OLS PPML PPML (Fixed
cost specification)
Instrument: log(Ethnic Network, exp=0.2)First stage F-test†: 49.93 6.99 43.98
Second Stage: Dep. Variable: log(per capita GDP)log total trade flows 0.5704∗∗ 1.0870∗∗∗ 1.2005∗∗∗
(0.2609) (0.2318) (0.1629)
Observations 1054 1054 1033R2 0.898 0.909 0.909
Each column is a separate instrumental variable estimation where the first stage is estimated using theinstrument log(Ethnic Network, exp=0.2). In column (3), the fixed cost specification as in equation (10)is employed with an exponent for the fixed cost of -6.67 and η=0.03, as previously estimated. The secondstage is an regression of the predicted yearly trade volumes of a country on the logarithm of per capitaGDP. The standard error are not corrected for the sandwich theorem. Standard errors are clustered withineach importer-exporter pair and given in parentheses. The number of observations decrease to the numberof countries × year. † The F-test corresponds to the estimation in column (1) and (2) in Table 1 as well ascolumn (3) in Table 12.∗ p < 0.10, ∗∗ p < 0.05, ∗∗∗ p < 0.01.
the economic potential of a country and hence trade volumes. Ethnic networks, however, can
help to overcome, or at least attenuate, the negative effects for international trading partners.
These ethnic networks still seem to be largely exclusive as the fixed costs for creating an inter-
ethnic network seem to remain at a high level (Table 12). A decrease in ethnic specific fixed
costs increases the network creation between importer and exporters and hence increases trade
flows. Fostering cultural exchange could thus be a way to increase networking and to overcome
inefficiencies in government structures.
African bilateral trade, however, is still underdeveloped. Only 8-9% of exports by African
countries are bound to stay within Africa.52 Nevertheless, growth rates from 2001-2005 show
that the inner African market gains importance and grew by more then 20% yearly, compared
to only 12.7% growth in exports to the rest of the world (Yoshino 2008). Using the data at
hand this figure rose to 49 billion US$ in 2010, a growth rate of again 21.6%53. With the rise
of economic activity in Africa, ethnic networks, and the reduction of the ethnic specific fixed
costs with it, are likely to become more important in the future.
5226.5 billion US$ Yoshino (2008). In the available data that figure stands at 18.4 billion US$.53Using my data: 2005 18.4 billion US$ to 49 billion US$ in 2010.
33
From an employment perspective, ethnic networks have also an effect on GDP. If networks fa-
cilitate the access to export markets, general employment is likely to increase since exporting
firms have a larger workforce (Yoshino 2008, Page & Soderbom 2012). Hence, enabling pro-
ductive network members to set up their own firm might increase employment and lift people
out of poverty. There is some evidence that a larger number of exporters increase GDP growth
in African countries (Soderbom & Teal 2003). Since the way I model ethnic networks has no
direct effect on GDP besides the effect through export values, I instrument export values by
these networks to solve the reverse causality concerns between GDP and exports. The second
stage results I find in Table 13 show a positive and significant effect of export volumes on GDP
supporting the correlation found by Soderbom & Teal (2003). Firms use or create ethnic net-
works to facilitate exporting to new markets. The resulting knowledge and wealth spillovers
then impact per capita GDP in both countries positively. However, this is not the total effect
of ethnicities on GDP through conflicts or mistrust that are factored out In the way I create my
instrument and only partially covered by bilateral characteristics and importer and exporter
fixed effects in both stages of the regression.
The results I found for trust and corruption also support common empirical findings that invest-
ments in infrastructure and administration are needed to foster integration. Ethnic networks,
however, can help to overcome some of these barriers and account for some of the differences
regarding the export intensities of various countries. As Wood & Jordan (2000) for Uganda
and Zimbabwe show, Zimbabwe outperforms Uganda in terms of exports even though they are
predicted to have similar levels of manufacturing exports. The authors argue that this discrep-
ancy between prediction and reality can be explained by the lack of adequate infrastructure
in Uganda and investments in their export sector in Zimbabwe. Additionally, as I have shown
above, Zimbabwe profits from a larger ethnic network to surrounding countries and its positive
effect on trade flows.
9 Conclusion
The above analysis provides evidence that ethnic networks form and direct export flows between
African countries. By deriving a variant of a model based on the Chaney (2008) model I am
able to asses the importance of fix costs of exports as determinants of export flows.
The preferred specification suggests an elasticity of export flows to ethnic networks in importing
and exporting countries of 0.06 which translates into potential yearly losses of shutting down
that network of 17.4%. Using an approach by Krueger & Lindahl (2001) and adapting it to the
34
case of non-classical measurement error I am able to show that my proxy for ethnic networks
is not affected by an attenuation bias. I do find some evidence for the positive selection into
exporters, given ethnic connections and ethnic population size. In an extension with ethnic
dependent fix costs to form networks I show that these cost matter immensely for export vol-
umes. Finally, instrumenting trade volumes by ethnic networks I am able to establish a positive
relation between exports and per capita GDP growth.
Researchers having reliable ethnic population data can improve upon this reduced form ap-
proach by terms of an instrumental variable strategy. The ethnic network variable constructed
here is shown to have predictive power for bilateral trade flows and could thus be used as an
instrument in future research. Alongside Eaton et al. (2004), Fafchamps (2003), Guiso et al.
(2009) and Felbermayr & Toubal (2012) I argue that the main channel is through trust building
measures and that networks erode fixed costs of exporting. However, since these estimates are
based upon reported trade flows, the effect on the unreported trade flows between two villages
at the border are potentially larger. Therewith, further research like Aker et al. (2014) using a
spatial approach to identify study areas between ethnic groups can yield interesting results on
the effect of ethnic boundaries on socio economic outcomes within a country and informal trade
between countries. Understanding these networks in developing countries are of paramount im-
portance since Dunlevy (2006) shows that networks are more important in more corrupt regimes
and along with Bisin & Verdier (2000, 2001) cultural change and trust develop slowly implying
entry barriers to foreign markets for years to come.
35

10 References
Aker, J. C., Klein, M. W., O’Connell, S. A. & Yang, M. (2014), ‘Borders, ethnicity and trade’,
Journal of Development Economics 107(1), 1–16.
Alesina, A., Easterly, W. & Matuszeski, J. (2011), ‘Artificial states’, Journal of the European
Economic Association 25, 246–277.
Anderson, J. E. (1979), ‘A theoretical foundation for the gravity equation’, American Economic
Review 69(1), 106–116.
Axtell, R. L. (2001), ‘Zipf distribution of u.s. firm sizes’, Science 293(5536), 1818–1820.
Balnes-Cristobal, J. (2008), ‘Characteristics of immigrants and bilateral trade’, Revista de
Economıa Aplicada 48.
Bandyopadhyay, S., c. Coughlin, C. & Wall, H. J. (2008), ‘Ethnic networks and us exports’,
Review of International Economics 16, 199–213.
Bates, R. H. (2008), When Things Fell Apart: State Failure in Late-Century Africa, Cambridge
University Press.
Bisin, A. & Verdier, T. (2000), ‘’beyond the melting pot’: Cultural transmission, marriage and
the evolution of ethnic and religious traits.’, Quarterly Journal of Economics 115(3), 955–988.
Bisin, A. & Verdier, T. (2001), ‘The economics of cultural transmission and the dynamics of
preferences’, Journal of Economic Theory 97(2), 298–319.
Burgess, R., Jedwab, R., Miguel, E., Morjaria, A. & Pardo i Miguel, G. (2013), ‘The value of
democracy: Evidence from road building in kenya’, Working Paper .
Canavire, B., Javier, G. & Ehrlich, L. (2006), ‘The impact of migration on foreign trade: A
developing country approach’, Latin American Journal of Economic Development 6.
Chaney, T. (2008), ‘Distorted gravity: The intensive and extensive margins of international
trade’, American Economic Review 98(4), 1707–1721.
Combes, P.-P., Lafourcade, M. & Mayer, T. (2005), ‘The trade-creating effects of business and
social networks: evidence from france’, Journal of International Economics 66.
36

Dunlevy, J. A. (2006), ‘The influence of corruption and language on the protrade effect of immi-
grants: Evidence from the american states’, Review of Economics and Statistics 88(1), 182–
186.
Dunlevy, J. A. & Hutchinson, W. K. (1999), ‘The impact of immigration on american import
trade in the late nineteenth and ealry twentieth centuries’, Journal of Economic History
59, 1043–1062.
Eaton, J., Kortum, S. & Kramarz, F. (2004), ‘Dissecting trade: Firms, industries, and export
destinations’, American Economic Review 94(2), 150–154.
Eifert, B., Miguel, E. & Posner, D. N. (2010), ‘Political competition and ethnic identification
in africa’, American Journal of Political Science 54(2), 494–510.
Fafchamps, M. (2003), ‘Ethnicity and networks in african trade’, Contributions to Economic
Analysis and Policy 2(1).
Fafchamps, M. & Gubert, F. (2007), ‘Risk sharing and network formation’, American Economic
Review 97(2), 75–79.
Felbermayr, G. J., Jung, B. & Toubal, F. (2010), ‘Ethnic networks, information, and interna-
tional trade: Revisiting the evidence’, Annals of Economics and Statistics 98.
Felbermayr, G. J. & Toubal, F. (2012), ‘Revisiting the trade-migration nexus: Evidence from
new oecd data’, World Development 40(5), 928–937.
Francois, P., Rainer, I. & Trebbi, F. (2013), ‘How is power shared in africa’, Working Paper .
Gould, D. M. (1994), ‘Immigrant links to the home country: Empirical implications for u.s.
bilateral trade flows’, Review of Economics and Statistics 76, 302–316.
Grossman, G. M., Helpman, E. & Szeidl, A. (2006), ‘Optimal integration strategies for the
multinational firm’, Journal of International Economics 70(1), 216–238.
Guiso, L., Sapienza, P. & Zingales, L. (2009), ‘Cultural biases in economic exchanges’, Quarterly
Journal of Economics 124(3), 1095–1131.
Helpman, E., Melitz, M. & Rubinstein, Y. (2008), ‘Estimating trade flows: Trading partners
and trading volumes’, Quarterly Journal of Economics 123(2), 441–487.
Hensel, P. R. (2009), ‘Icow colonial history data set, version 0.4’,
http://www.icow.org/colhist.html .
37

Herander, M. G. & Saavedra, L. A. (2005), ‘Exports and the structure of immigrant-based
networks: The role of geographic proximity’, Review of Economics and Statistics 87, 323–
335.
Krautheim, S. (2012), ‘Heterogenous firms, exporter networks and the effect of distance on
international trade’, Journal of International Economics 87(1), 27–35.
Krueger, A. B. & Lindahl, M. (2001), ‘Education for growth: Why and for whom?’, Journal of
Economic Literature 39.
McKenzie, D. & Rapoport, H. (2007), ‘Network effects and the dynamics of migration and
inequality: theory and evidence from mexico’, Journal of development Economics 84(1), 1–
24.
Melitz, M. J. (2003), ‘the impact of trade on intra-industry reallocations and aggregate industry
productivity’, Econometrica 71(6), 1695–1725.
Michalopoulos, S. & Papaioannou, E. (2013), ‘Pre-colonial ethnic institutions and contemporary
african development’, Econometrica 81(1), 113–152.
Michalopoulos, S. & Papaioannou, E. (2014), ‘National institutions and subnational develop-
ment in africa’, Quarterly Journal of Economics 129(1), 151–213.
Murdock, G. (1959), Africa: Its Peoples and Their Culture History, New York: McGraw-Hill.
Nunn, N. (2008), ‘The long-term effects of africa’s slave trades’, Quarterly Journals of Eco-
nomics 123(1), 139–176.
Nunn, N. & Puga, D. (2012), ‘Ruggedness: The blessing of bad geography in africa’, Review of
Economics and Statistics 94(1), 20–36.
Nunn, N. & Wantchekon, L. (2011), ‘The slave trade and the origins of mistrust in africa’,
American Economic Review 101(7), 3221–3252.
Oezden, C., Parsons, C. R., Schiff, M. & Walmsley, T. L. (2012), ‘Where on earth is every-
body? the evolution of global bilateral migration 1960-2000’, World Bank Economic Review
25(1), 12–56.
Olken, B. & Barron, P. (2009), ‘The simple economics of extortion: Evidence from trucking in
aceh’, Journal of Political Economy 117(3), 417–452.
38

Page, J. & Soderbom, M. (2012), ‘Is small beautiful? small enterprise, aid and employment in
africa’, Working Paper .
Partridge, J. & Furtan, H. (2008), ‘Immigration wave effects on canada’s trade flows’, Canadian
Public Policy 34(2), 193–214.
Peri, G. & Requena-Silvente, F. (2010), ‘The trade creation effect of immigrants: evidence from
the remarkable case of spain’, Canadian Journal of Economics 43(4), 1433–1459.
Rauch, J. E. (1999), ‘Networks versus markets in international trade’, Journal of International
Economics 48.
Rauch, J. E. & Trindade, V. (2002), ‘Ethnic chinese networks in international trade’, Review of
Economics and Statistics 84(1), 116–130.
Santos-Silva, J. & Tenreyro, S. (2006), ‘The log of gravity’, Review of Economics and Statistics
88(4), 641–658.
Santos-Silva, J. & Tenreyro, S. (2014), ‘Estimating the extensive margin of trade’, Journal of
International Economics 93(2), 67–75.
Soderbom, M. & Teal, F. (2003), ‘Are manufacturing exports the key to economic success in
africa’, Journal of African Economies 12, 1–29.
Svensson, J. (2003), ‘Who must pay bribes and how much? evidence from a cross section of
firms’, Quarterly Journal of Economics 118(1), 207–230.
United Nations (2002), ‘World urbanization prospects: The 2001 revision: Iv: Urbanization
patterns and rural population growth at the country level’, UN .
Weidmann, N. B., rod, J. K. & Cedermann, L.-E. (2010), ‘Representic ethnic groups in space:
A new dataset’, Journal of Peace Research 47(4).
White, R. (2007), ‘Immigrant-trade links, transplanted home bias and network effects’, Applied
Economics 39.
Wood, A. & Jordan, K. (2000), ‘Why does zimbabwe export manufactures and uganda not?
econometrics meets history’, Journal of Development Studies 37, 91–116.
Woodruff, C. & Zenteno, R. (2007), ‘Migration networks and microenterprises in mexico’, Jour-
nal of Development Economics 82(2), 509 – 528.
39

Yoshino, Y. (2008), ‘Domestic constraints, firm characteristics, and geographical diversification
of firm-level manufacturing exports in africa’, World Bank Policy Research Working Paper
4575.
40

11 Appendix
Table 14: Summary Statistcs of outcome and control variables (GREG)
Variable Mean Std. Dev. Min. Max. N
Exports 21606.27 113007.351 0 3361112.5 15961Ethnic Connection 0.194 0.395 0 1 49446log(Ethnic Network) 2.175 4.767 -1.076 19.402 49446log(Ethnic Network, exp=0.5) 1.651 3.634 -1.117 15.135 49446log(GDP) 22.252 1.518 18.542 26.619 49446Common Border 0.083 0.275 0 1 49446Part of the Border is a River 0.046 0.21 0 1 49446Same Language 0.059 0.235 0 1 49446log(Pop.) 8.918 1.317 5.893 11.981 49446log(Distance) 7.909 0.954 -0.368 9.013 49402Exporting Countries 48 0 48 48 49446Importing Countries 48 0 48 48 49446Number of ethnic connections 9.087 5.373 0 21 49446Colonial Ties 0.24 0.427 0 1 49446No. of ethnicities 10.578 7.456 1 33 49446Area of Home Country 580107.806 583216.593 1862 2381741 49446Ruggedness index 0.978 1.145 0.115 6.202 49446% Tropical climate 50.735 42.831 0 100 49446% Fertile soil 30.844 21.49 0 81.699 49446% Desert 6.449 14.616 0 74.857 49446No. of Conflicts in Destination 21.398 61.363 0 578 49446
41

Table 15: Results when the dependent variable is normalized by total exports
(1) (2)Estimation Technique: OLS PPMLDependent Variable: Share of Total Exports
log(Ethnic Network) 0.0006∗∗ 0.0445∗∗∗
(0.0003) (0.0168)log(Ethnic Network, exp=0.5) 0.0007∗ 0.0544∗∗
(0.0004) (0.0225)log(Ethnic Network, exp=0.2) 0.0007 0.0618∗∗
(0.0004) (0.0276)
N 15945 15945
Each entry is a separate regression of the dependent variable on the definition ofethnic networks, covariates and importer and exporter fixed effects. The secondand third row depict an exponent of ν =0.5 and ν =0.2, respectively, in equation(12). The first column uses an ordinary least squares estimator and the secondthe poisson-pseudo-maximum-likelihood estimator as suggested by Santos-Silva &Tenreyro (2006). The dependent variable is exports to an importer divided by thetotal exports in that year by the exporter. Standard errors are clustered withineach importer-exporter pair and given in parentheses. ∗ p < 0.10, ∗∗ p < 0.05, ∗∗∗
p < 0.01.
Table 16: Results with Disaggregated Data
(1) (2) (3)Estimation Technique: PPMLDependent Variable: Sector Exports Total Exports Sector ExportsData Set: Original Data SIC 4-digit
log(Ethnic Network) 0.0577∗∗∗ 0.0860∗∗∗ 0.0645∗∗∗
(0.0178) (0.0203) (0.0179)log(Ethnic Network, exp=0.5) 0.0711∗∗∗ 0.1025∗∗∗ 0.0773∗∗∗
(0.0237) (0.0269) (0.0229)log(Ethnic Network, exp=0.2) 0.0783∗∗∗ 0.1074∗∗∗ 0.0816∗∗∗
(0.0284) (0.0329) (0.0269)
N 160619 2203 116853Sector Fixed Effects Yes No Yes
Each entry is a separate regression of the dependent variable on the definition of ethnic networks, covariatesand importer and exporter fixed effects. The second and third row depict an exponent of ν =0.5 andν =0.2, respectively, in equation (12). The estimation technique is the poisson-pseudo-maximum-likelihoodestimator as suggested by Santos-Silva & Tenreyro (2006). The first column uses the original data set andsectoral exports with sector fixed effects. The second and third columns use the SIC revision with 4 digitclassification for the years 2007-2010. Standard errors are clustered within each importer-exporter pair andgiven in parentheses. ∗ p < 0.10, ∗∗ p < 0.05, ∗∗∗ p < 0.01.
42