the role of quantity vs. quality of education in promoting
TRANSCRIPT

IN DEGREE PROJECT TECHNOLOGY AND ECONOMICS,SECOND CYCLE, 30 CREDITS
, STOCKHOLM SWEDEN 2017
The role of quantity vs. quality of education in promoting economic growth
IULIIA ZABAVINA
KTH ROYAL INSTITUTE OF TECHNOLOGYSCHOOL OF INDUSTRIAL ENGINEERING AND MANAGEMENT

www.kth.se

Foreword
I would like to thank my supervisor Per Thulin for being so patient and supportiveduring the process of writing this thesis.
3

Contents
Foreword 5
Chapter 1. Introduction 7
Background . . . . . . . . . . . . . . . . . . . . . . . . . . . . . . . . . . . 7Sustainability aspects . . . . . . . . . . . . . . . . . . . . . . . . . . . . . . 9Structure of Thesis . . . . . . . . . . . . . . . . . . . . . . . . . . . . . . . 9
Chapter 2. Literature review 10
Chapter 3. Theoretical model 14
Chapter 4. Empirical Analysis 17
Methodology/Estimation strategy . . . . . . . . . . . . . . . . . . . . . . . 17Data description . . . . . . . . . . . . . . . . . . . . . . . . . . . . . . . . 17Empirical results . . . . . . . . . . . . . . . . . . . . . . . . . . . . . . . . 22
Chapter 5. Summary 26
Conclusion . . . . . . . . . . . . . . . . . . . . . . . . . . . . . . . . . . . . 26Suggestions for future research . . . . . . . . . . . . . . . . . . . . . . . . . 26
References 28
Appendix 32
4

Chapter 1. Introduction
Background
Today scholars and politicians view human capital in general and education in par-ticular as an important source of economic prosperity. Significant government fundsare allocated to improve the quality of education. According to the World Bank(World Development Indicators, 2017), over 14 percent of all government expendi-tures in the world were spent on education to improve both quantity and quality ofeducation in 2013. Therefore, it seems to be very important to understand how andif education can a↵ect economic growth.
Many studies were conducted to show the importance of education for economicgrowth and development. For example, some classic papers (Schultz, 1961, Denison,1962) show that education is an important factor for economic growth in westerncountries. Psacharopoulos (1984) showed that in developing countries the ”share” ofeducation in economic growth varies from 1 percent to 29 percent.
However, education can di↵er not only in the amount of time a student spendin the classroom, but also it can vary in e�ciency level or quality. Therefore, wheneducation is discussed it is important to keep in mind that there are two mainmeasures of education: quality and quantity.
Figure 1 shows that a positive relationship may exist between the amount ofyears spent in secondary school and economic growth (BarroLee dataset is used foreducation quantity and Penn World Tables for GDP per capita, years 1980 - 2010,OECD countries).
Hanushek and Woessmann (2008) show that even for developing countries educa-tion quantity is more important than quality. They claim that cognitive skills whichstudents develop in secondary school help them learn faster and find better solutionsin future life. Today, some international tests of education results (such as PISA)are available so it is possible to compare education quality across the countries. Theparticular question of interest is whether high test results of some talented studentsmay lead to higher economic growth?
Various scholars using quantity datasets emphasise that education has a signif-icant role in economic growth (Barro (1991), Islam (1995) etc.) There is no singleanswer for which countries and what type of education measure is more important.The intuition suggests that for OECD countries education quality might play a sig-nificant role, because in OECD countries the majority of students are involved in
5

Figure 1: Relationship between quantity of education and GDP per capita
schooling process and the average schooling time is already quite high. Therefore,the quality of schooling might become more significant for economic growth.
However, according to OECD [2012], there are up to 20 percent of people whoare 25-34 years old who have not attained upper secondary school in OECD. There-fore, the education quantity measure (average years in secondary school) might beimproved not only by adding an additional year in school but also reducing numberof students who drop out from school. It is unclear, if for developed economies nowa-days is more important to increase the quality of secondary education (measured byinternational tests) or increase the quantity of education (measured as an averagenumber of years in secondary school).
Therefore, the purpose of this paper is to investigate whether the quality andquantity of education in OECD countries have an influence on economic growth andhow significant it is.
A new dataset ’A New International Database on Education Quality: 1965-2010’by Nadir Altinok et. al., (which is used in this thesis) with quality data is now
6
available where quality of education is adjusted to make the data comparable betweencountries. The dataset is based on several international test results which werecompared across the countries to get a unique measurement of countries’ educationquality. Moreover, it becomes possible with the dataset not only compare the qualitymeasures but also make econometric models because of many available observationsfor a great number of countries. The dataset provides a number of unique educationquality measurements which are used in this study.
Only OECD countries are chosen to perform the analysis for several reasons.First, due to high values of both quality and quantity of education in OECD coun-tries, it is interesting to look at whether one variable has a bigger e↵ect on economicgrowth than another one, and which a↵ect these two variables might have on eachother. Second, more data of higher quality is available for OECD countries.
Sustainability aspects
Education (both quality and quantity) influences the social and economically sustain-able development by several ways. First, education might increase labor e�ciencyin the countries and therefore, might increase the economic growth and be the forceof economic development. More education might be a stimulus for creation for moreinnovation and new technologies which are also a source of economic growth.
Structure of Thesis
This thesis has the following structure:in Chapter 2 the literature review of previous studies are presented. The concepts
of quality and quantity of education are discussed and which education variables weremeasured by previous studies,
in Chapter 3 the theoretical model and estimation strategy is presented. It isshown how human capital in general and education quality and quantity are incor-porated into the augmented Solow model,
in Chapter 4 datasets which are used for estimation are described in this chapter.The elaborative description of education quality dataset is presented (due to impor-tance of understanding how the quality of education became comparable betweencountries). Summary statistics and correlation matrix are given in this chapter. Theempirical results on the basis of the chosen theoretical framework are presented,
finally, in Chapter 5, conclusions and suggestions for future research are presentedand discussed.
7

Chapter 2. Literature review
The Solow (1956) model became a foundation for future research and modelling ofeconomic growth. The model uses labour and physical capital as factors which a↵ectthe production function. It was shown that population growth and savings rate candetermine a steady-state level of GDP per capita in Solow model. However, thismodel had some limitations. Barro et al. (1992) argues Solow model did not cor-rectly predict magnitudes of the savings and population growth on income. Rapidtechnological changes made economists think more about what influence economicgrowth and how to achieve higher growth of GDP. Kuznets (1973, 1981) empha-sised that economies shifted from agricultural production to industrial and serviceproduction.
Thus, more educated workers are needed and formal education has more impor-tant role in economic development and GDP growth. Earlier Uzawa (1965) includedhuman capital to the production factors. Lucas (1988) used a concept of humancapital as well in his classical work. Mankiw, Romer, and Weil (1992) also includedhuman capital variable into the model and found out that such a model fits databetter than the original model.
Education is typically viewed as a proxy of human capital. Therefore, numer-ous studies were performed to estimate the relationship between education and eco-nomic growth. However, the results of testing various models are contradictory.Barro(1991) using primary and secondary school enrolment rates and OLS methodconcludes that education has a significant e↵ect on economic growth. Using sec-ondary enrolment rates and OLS method Mankiw et.al. (1992) also concludes thateducation is significant for economic growth. However, Nonneman and Vanhoudt(1996) used secondary school enrolment rates and OLS shows insignificance of thehuman capital for economic growth. By taking Mankiw, Romer and Weil (1992)model and claiming that results of this model for OECD countries are poor, theyextended the Mankiw’s model and showed that the results for OECD countries arenot significant as they were before. More studies found that education is insignificantfor economic growth (Kalaitzidakis et al. (2001), Maasoumi et al. (2007), Henderson(2010)). Kalaitzidakis et al. (2001), for example, use semiparametric partially linearregression approach to capture the e↵ect of nonlinearity of human capital betweencountries, but they got mixed results for di↵erent levels of schooling. They alsofound that higher levels of schooling of males are important for economic growth,but women’s education is significant only at low levels of schooling.
8

Education a↵ects economic growth through several channels. Behrman (1990),Psacharopoulos (1994) show that education influence earnings of workers, whichincreases demand and economic growth. Moreover, Benhabib and Spiegal (1994)show that better educated workers would lead to faster innovations and technologicalprogress. Mankiw, Romer, and Weil (1992) conclude that increase in human capitalleads to increase in productivity and thus a↵ects economic growth.
Breton (2004) shows that for developing countries quantity of education is moreimportant, whereas for developed countries quality of education is more significant.Moreover, Breton emphasises that quality measures might be ambiguous (for exam-ple, he shows di↵erent approaches to education: memorizing more facts vs. creativeapproach and less material remembered, therefore, quality measures are sometimesmisleading). Petrakis and Stamatakis (2002) showed that for developing countriesprimary and secondary schooling is more important than tertiary education. Tak-ing Barro-Lee education enrolment rates dataset Bils and Klenow (2000) show thatschooling explains up to one-third of di↵erences in economic growth between coun-tries.
Multiple studies (Self, Grabovski (2003); Pegkas, Tsamadias (2015)) when exam-ine influence of education on a specific country (taking into account mainly quantity)show high significance of education for economic growth. Pereira and Aubyn(2007)estimate which level of education is more important for Portugal and conclude thatincreasing education at all level except the tertiary level would lead to economicgrowth.
Hanushek et. al.(2008) estimate the e↵ects of quality of education rather thanquantity of education with cognitive skills. He claims that secondary and primaryeducation teaches students how to learn and formulate basic cognitive abilities whichlater is a significant factor for learning at workplace and being creative. He finds apositive relationship between quality of schooling and economic growth. Hanushekand Woessmann, L. (2010) elaborate their findings and claim that quality is moreimportant than quantity, and that skills e↵ect is complementary to quality of eco-nomic institutions as well. They use 12 international tests which were available incountries which voluntarily participated in them. Total 36 scores of combinationsbetween year-age are available in their analysis. The majority of testing is done inscience and math (due to it is easier to construct international tests in local languagesfor these subjects) and cognitive skills measurements available after these tests areused in Hanushek and Woessmann model.
9
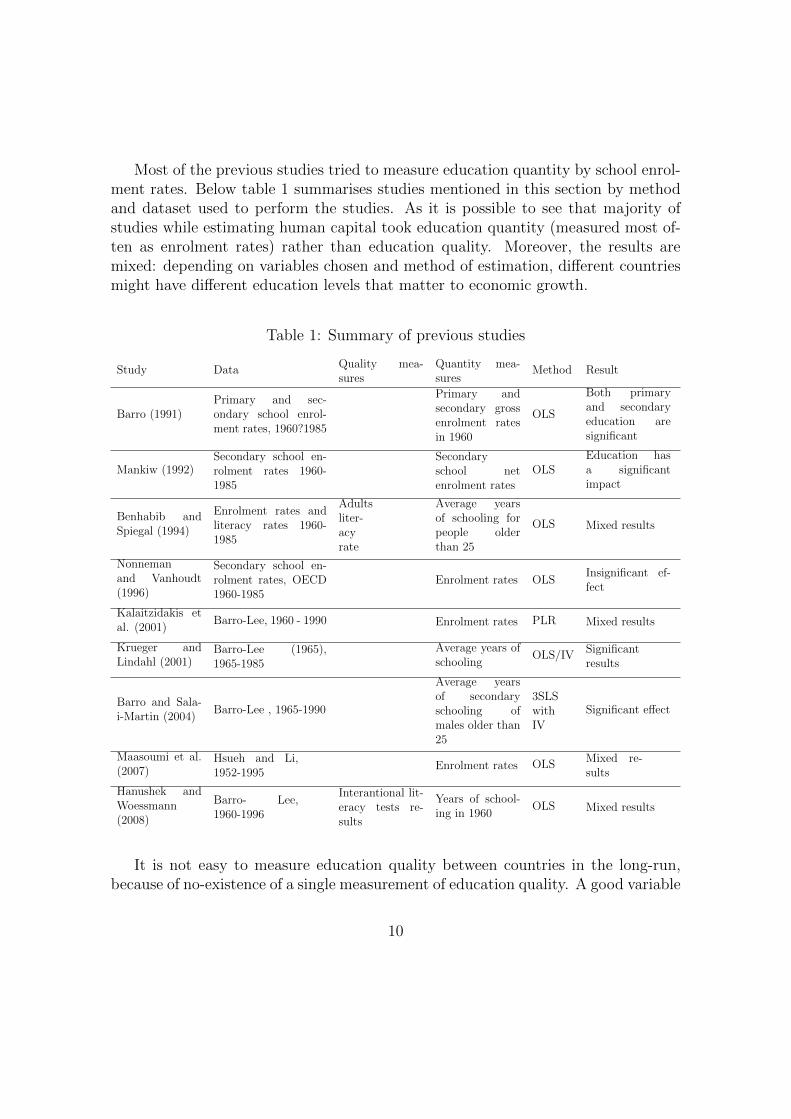
Most of the previous studies tried to measure education quantity by school enrol-ment rates. Below table 1 summarises studies mentioned in this section by methodand dataset used to perform the studies. As it is possible to see that majority ofstudies while estimating human capital took education quantity (measured most of-ten as enrolment rates) rather than education quality. Moreover, the results aremixed: depending on variables chosen and method of estimation, di↵erent countriesmight have di↵erent education levels that matter to economic growth.
Table 1: Summary of previous studies
Study Data Quality mea-sures
Quantity mea-sures
Method Result
Barro (1991)Primary and sec-ondary school enrol-ment rates, 1960?1985
Primary andsecondary grossenrolment ratesin 1960
OLS
Both primaryand secondaryeducation aresignificant
Mankiw (1992)Secondary school en-rolment rates 1960-1985
Secondaryschool netenrolment rates
OLSEducation hasa significantimpact
Benhabib andSpiegal (1994)
Enrolment rates andliteracy rates 1960-1985
Adultsliter-acyrate
Average yearsof schooling forpeople olderthan 25
OLS Mixed results
Nonnemanand Vanhoudt(1996)
Secondary school en-rolment rates, OECD1960-1985
Enrolment rates OLSInsignificant ef-fect
Kalaitzidakis etal. (2001)
Barro-Lee, 1960 - 1990 Enrolment rates PLR Mixed results
Krueger andLindahl (2001)
Barro-Lee (1965),1965-1985
Average years ofschooling
OLS/IV Significantresults
Barro and Sala-i-Martin (2004)
Barro-Lee , 1965-1990
Average yearsof secondaryschooling ofmales older than25
3SLSwithIV
Significant e↵ect
Maasoumi et al.(2007)
Hsueh and Li,1952-1995
Enrolment rates OLS Mixed re-sults
Hanushek andWoessmann(2008)
Barro- Lee,1960-1996
Interantional lit-eracy tests re-sults
Years of school-ing in 1960
OLS Mixed results
It is not easy to measure education quality between countries in the long-run,because of no-existence of a single measurement of education quality. A good variable
10

which measures education quality could be international test results, which are thesame for all countries. Nowadays, such an attempt is made by participating in PISAtests. However, PISA tests are available only for limited number of years.
Nevertheless, thanks to education quality dataset ”A New International Databaseon Education Quality: 1965-2010” by Nadir Altinok et. al. it is possible now tocompare countries in the long time horizon. In the dataset the adjustment of di↵erenttest measures were made. The US participated in the majority of the internationaltests. Therefore, the adjustment is mainly made by adjusting all other countries tothe US. Therefore, a new measure of adjusted test scores is available which might bea good proxy for quality of education. The dataset provides several quality measuresfor a great number of countries for 45 years. Therefore, it is not only gives thepossibility to have comparable quality measures but also make econometrics analysisdue to su�cient number of observations availability.
This paper attempts to estimate the influence of education on economic growthin the OECD countries. However, the main di↵erence from the previous studies isthat an attempt to use as proxy of human capital not only quantity of education butalso quality of education is made.
11

Chapter 3. Theoretical model
In order to show the theoretical background1, it is assumed here that human capitalin general and education in particular has an influence on economic growth throughthe increasing labour productivity.
One of the most common model using augmented Solow model is provided byMankiw at. al. (1992). In this model, technological e�ciency is represented as labore�ciency. Also human capital variable is added. Therefore, the production functiontakes the following form:
Y = K↵H�(AL)1�↵�� (1)
where Y represents GDP, K represents physical capital stock, L - labour force, A islabour e�ciency, and H represents human capital.
Rewriting this equation so that it becomes a growth per e↵ective units of labourform, using y = Y/AL k = K/AL h = H/AL:
y = k↵h� (2)
According to the Solow model, an economy will reach a steady state, where partialderivatives of the state variables with respect to time are zero. To find such a state,partial derivatives over time are introduced:
Capital accumulation function is given by:
K = skY � �K (3)
where � is a constant rate at which capital stock depreciates and sk is a savings rate.In the per e↵ective labour unit form:
k = sky � (n+ g + �)k (4)
where n is a population growth rate and g is a technical progress growth rate.Human capital accumulation function is given by (for simplicity it is assumed
that human and physical capital depreciate at the same rate):
h = shy � (n+ g + �)h (5)
where sh is a human capital growth rate.Deriving steady state from equations 2, 4 and 5:
1The full derivation of the model in the chapter see in Appendix 1
12

k⇤ =⇣ s1��
k s�hn+ g + �
⌘ 11�↵��
(6)
h⇤ =⇣ s↵hs
1�↵h
n+ g + �
⌘ 11�↵��
(7)
y⇤ =⇣k⇤⌘↵⇣
h⇤⌘�
(8)
The purpose of this paper is to estimate the e↵ect of education on economicgrowth. Therefore, the growth variable is needed rather than GDP in steady state.
Therefore, new variables are defined:
z = k/k (9)
x = h/h (10)
Inserting these variables in the production function equation 8, taking logs andtime derivatives produces the following result:
y/y = ↵z + �x (11)
Keeping in mind the fact that in steady state time derivatives are zero, equation11 can be rearranged as following
ln yt � ln y0 =↵(1� exp(��t))
1� ↵� �ln sk +
�(1� exp(��t))
1� ↵� �ln sh�
(↵ + �)(1� exp(��t))
1� ↵� �ln(n+ g + �)� (1� exp(��t) ln y0
(12)
Human capital variable is assumed to be the following:
sh = e�1u1+�2u2+�3u1u2 (13)
where u1 is education quantity and u2 is education quality.Thus, equation 12 becomes:
ln yt � ln y0 =↵(1� exp(��t))
1� ↵� �ln sk +
�(1� exp(��t))
1� ↵� �(�1u1 + �2u2 + �3u1u2)�
(↵ + �)(1� exp(��t))
1� ↵� �ln(n+ g + �)� (1� exp(��t)) ln y0
(14)
13

Therefore, the relationship between education quality and quantity and economicgrowth is found. �1 and �2 are assumed to have positive signs because it is expectedthat education quality and quantity have positive influence on GDP growth. It is notpossible to make an assumption about �3, because the coe�cient might be positiveor negative depending on whether quantity’s e↵ect is bigger or smaller.
14

Chapter 4. Empirical Analysis
In this section the methodology of research will be described, including data descrip-tion, estimation strategy and empirical results.
Estimation
To perform the empirical analysis equation 14 can be modified to the following:
ln yi,t+s� ln yi,t = �0+�1 ln sk,i,t+E+�3 ln(ni,t+g+�)+�4 ln yi,t+X�0+"k,i,t (15)
where t and s stands for time period, i stands for country;
sk = ln(st�4 + st�3 + st�2 + st�1 + st)/5); (16)
n = (ln(emplt)� ln(emplt�5))/5; (17)
and E = �1u1,i,t + �2u2,i,t + �3u1,i,tu2,i,t, X 0 are other control variables in the model.
Following Mankiw, Romer and Weil (1992) it is assumed that g + � equals 0.05 forall countries. The averages are taken to avoid short-term fluctuations influence onthe results.
The complete derivation of 14 is shown in the Appendix 1.
To perform empirical analysis a fixed e↵ect model for estimation of panel datasetsis chosen. In this model it is assumed that there is country’s heterogeneity which iscaptured by an intercept (Hill et. al., 2011).
Data description
The data for this paper is acquired from the following datasets:1. Education quality ”A New International Database on Education Quality:
1965-2010” by Nadir Altinok et. al. Their database in the beginning includes 150countries with quality scores for education. For the purposes of this thesis only 33OECD countries are left (United Kingdom and Estonia are not included due to lackof data). There are no universal tests which measure the quality of education inall these countries for such a long period, therefore, a new methodology is createdby the authors. The methodology is based on the adjustment and anchoring of thedi↵erent test to make them comparable. These tests include Programme for In-ternational Student Assessment (PISA), Progress in International Reading Literacy
15

Study (PIRLS) etc. The tests are supposed to measure literacy level, reading andmathematics skills of students. If a country participated in all tests then the averagescore is calculated for this country. If a country participated in only one or two teststhen the results compared and anchored to the US which participated in almost allinternational tests. Therefore, the US due to participation in most of the interna-tional tests is a good proxy for adjustment. For countries which can not be anchoredto the US the IEA surveys have been chosen for anchoring. Therefore, the qualityof education is measured by the performance in the international tests.
For the quality measure of education the proportion of students who reached thelevel of at least 600 points in the tests (adjusted measure), which therefore, cant takevalues from 0 to 1. Therefore, the lowest adjusted score the student could get was600, and the highest adjusted score is 683,94 (out of 700). According to Hanushekand Woessmann (2012), these students would be able to do more for the economicdevelopment and technological evolvement. In the database such a level is called”Innovation level”.
It is important to notice that the quality measure di↵ers from other previousstudies which considered quality measurements of education. One of the most pop-ular quality measure is literacy rates, however, as Breton (2004) notices this qual-ity measure might be misleading, especially in OECD countries. Due to almostcomplete literacy in OECD countries, another measurement of quality is preferable.Some other studies also use adjusted interantional test measurements (e.g. Kyria-cou (1974-1977) dataset). However, ”A New International Database on EducationQuality: 1965-2010” by Nadir Altinok et. al. is the first dataset which includes thislong period for almost all countries comparable to each other. Moreover, it includesmany variables which is possible to use in the studies (e.g. women’s scores, resultsin rural areas vs. results in urban areas etc). The quality measurement which isused in this study represents the proportion of students who achieved extraordinaryresults in tests.
2. Education quantity estimators were taken from Barro-Lee Educational At-tainment Data. The dataset contains observations for education quantity from 1950to 2010. For the quantity of education the average years of secondary schooling forpeople who are 25 and more years old were taken. The variable is taken because itis one of the most common measures of the quantity of education. 3. Penn Worldtables 9.0 are used to obtain the following variables:
- average annual growth rate of real GDP per person engaged over the comingfive years;
- average annual growth rate of number of workers over the last five years;- natural logarithm of growth rate of labor force, depreciation rate and techno-
16

logical progress over the last five years, where capital depreciation rate plus labourgrowth rate is assumed 0.05 for all countries;
- logarithm of GDP, 5 year lag;- trading or openness (import share + export share, average over 5 years).4. World Bank dataset ”World Development Indicators” for some additional
control variables:- gross capital formation (share of GDP), average over 5 years as a proxy for
investments as a percentage of GDP; par - government expenditures as a percentageof GDP, average over 5 years.
Mercan and Sezer (2014) include government expenditures in their model as animportant factor which might influence economic growth. Sachs & Warner (1999),Hanushek andWoessmann (2008) include trading variable in their models as a controlvariable in similar studies. Barro and Sala-iMartin (2004) include change in tradeterms as a control variable in their study. It is expected that trading has a positivee↵ect on economic growth. However, government expenditures might have positiveor negative e↵ect on economic growth.
Table 2 summarises the variables and its descriptions.Due to missing data in quality and quantity measures, the number of observations
in the final dataset is significantly decreased to 150 observations. Most observationsfor the first part of the panel (years 1965 - 1990) are missing. Therefore, in thedataset there are 33 OECD countries. On the figure 2 countries which are includedin the analysis are shown. Years 1965 - 2005 are analysed in this paper.
Figure 2: Countries which are included in the analysis
17

Table 2: Variables in the model
Variable Description Source
Annual growth
rate
Average annual growth rate of real
GDP per person engaged over the
coming five years
Penn World tables 9.0
Growth rate of
work force
Average annual growth rate of num-
ber of persons engaged over the last
five years, n
Penn World tables 9.0
E↵ective depreci-
ation
ln(n + g + �), Natural logarithm of
growth rate of labor force, deprecia-
tion rate and technological progress
over the last five years, where capi-
tal depreciation rate plus technolog-
ical progress are assumed 0.05 for all
countries
Penn World tables 9.0
GDP per capita GDP per capita Penn World tables 9.0
Government
expenditures
Total government expenditures as
percentage of GDP average over last
5 years, natural logarithm
World Bank Development Indicators
Trading
Import share of GDP + Export
share of GDP, average over last 5
years
Penn World Tables 9.0
Gross capital for-
mation
Natural logarithm of gross capital
formation share of GDP, average
over last 5 years
World Bank Development Indica-
tors
Quality of educa-
tion
Proportion of students who reached
the level of 600 points in the tests
Education quality ”A New Interna-
tional Database on Education Qual-
ity: 1965-2010” by Nadir Altinok et.
al.
Quantity of edu-
cation
Average years of secondary school-
ing for people who are 25 and more
years old
Barro-Lee Educational Attainment
Data
Interaction vari-
able
Quality * Quantity
18

Table 3 shows descriptive statistics of the data which are used for the regres-sion. From the summary, it is visible that the maximum proportion of students whoachieved highest results is 0.751 in South Korea in 2010 and minimum is 0.038 inChile in 2000. When it comes to average number of years of schooling the maximumlevel is 13.126 years in United States in 2010 whereas the minimum is 5.17 in Italyin 1970.
Table 3: Summary statistics
Variable Mean Std. Dev. Min. Max.
Annual growth rate 0.022 0.019 -0.019 0.083Gross capital formation -1.434 0.149 -1.795 -1.068GDP per capita 10.926 0.351 9.516 11.683E↵ective depreciation -2.862 0.229 -4.32 -2.329Quantity of education 9.788 1.831 5.17 13.126Quality of education 0.352 0.143 0.038 0.751Interaction variable 3.496 1.6 0.334 8.212Government expenditures -1.691 0.248 -2.245 -0.968Trading -2.603 1.187 -6.064 0.133
N 150
Table 4 is a correlation matrix between the variables. It is visible from the tablethat quality and quantity measures are negatively correlated with economic growthrate. However, quality and quantity measures are positively correlated with GDPper capita. GDP per capita has strong correlation with gross capital formation whichindicates that multicollinearity exists.
19
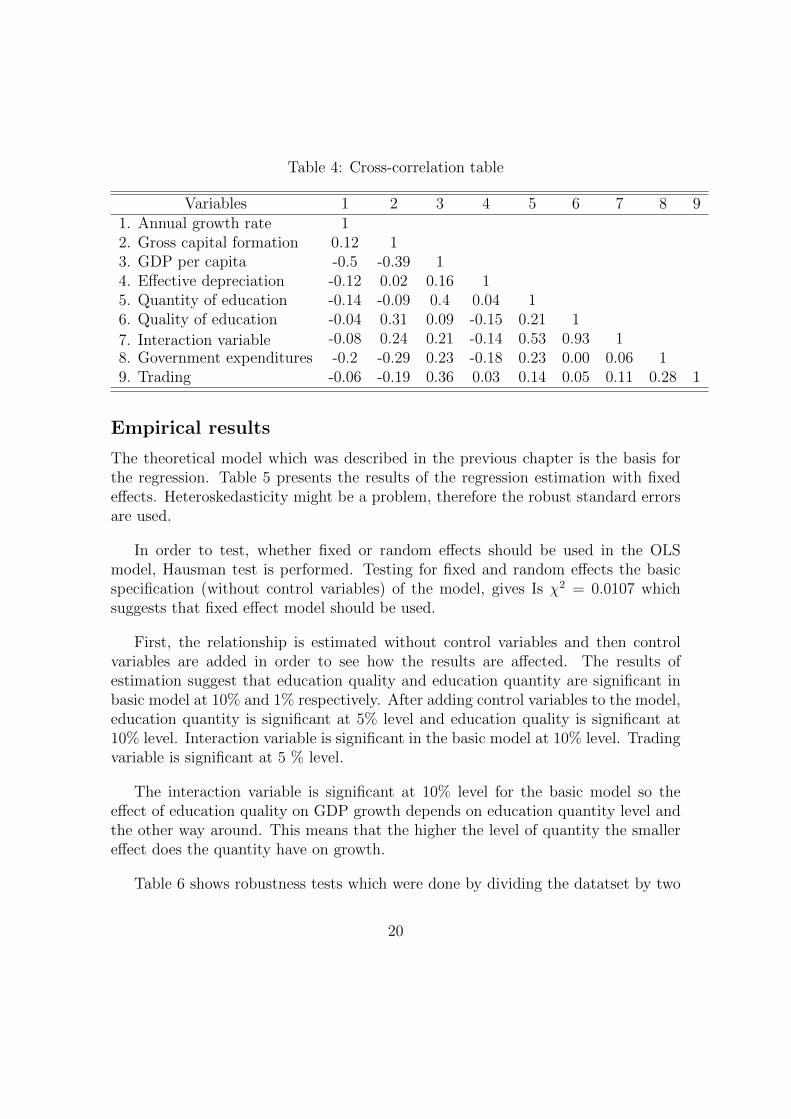
Table 4: Cross-correlation table
Variables 1 2 3 4 5 6 7 8 91. Annual growth rate 12. Gross capital formation 0.12 13. GDP per capita -0.5 -0.39 14. E↵ective depreciation -0.12 0.02 0.16 15. Quantity of education -0.14 -0.09 0.4 0.04 16. Quality of education -0.04 0.31 0.09 -0.15 0.21 17. Interaction variable -0.08 0.24 0.21 -0.14 0.53 0.93 18. Government expenditures -0.2 -0.29 0.23 -0.18 0.23 0.00 0.06 19. Trading -0.06 -0.19 0.36 0.03 0.14 0.05 0.11 0.28 1
Empirical results
The theoretical model which was described in the previous chapter is the basis forthe regression. Table 5 presents the results of the regression estimation with fixede↵ects. Heteroskedasticity might be a problem, therefore the robust standard errorsare used.
In order to test, whether fixed or random e↵ects should be used in the OLSmodel, Hausman test is performed. Testing for fixed and random e↵ects the basicspecification (without control variables) of the model, gives Is �2 = 0.0107 whichsuggests that fixed e↵ect model should be used.
First, the relationship is estimated without control variables and then controlvariables are added in order to see how the results are a↵ected. The results ofestimation suggest that education quality and education quantity are significant inbasic model at 10% and 1% respectively. After adding control variables to the model,education quantity is significant at 5% level and education quality is significant at10% level. Interaction variable is significant in the basic model at 10% level. Tradingvariable is significant at 5 % level.
The interaction variable is significant at 10% level for the basic model so thee↵ect of education quality on GDP growth depends on education quantity level andthe other way around. This means that the higher the level of quantity the smallere↵ect does the quantity have on growth.
Table 6 shows robustness tests which were done by dividing the datatset by two
20

subsets. The first column shows the regression with dataset from 1970 to 1990 years,and the second column shows years 1995 - 2005. Such a division is made in order tocheck whether one of the subsets would have di↵erent results due to less observationsavailable or other reasons.
Performing the robustness test shows that the results have changed significantlyfrom the previous model. First of all, education quality is no longer significant forboth periods. Education quantity is also insignificant in both models. The controlvariable of trading became significant for year 1995-2005 at 1% level.
As other studies such as Barro(1991), Mankiw (1992), Self & Grabovski (2003)have shown, the human capital is significant. However, mixed results regarding edu-cation quantity significance are obtained as well as many other researches (Kalaitzi-dakis et al. (2001), Maasoumi et al. (2007)). As it was mentioned before, pre-vious studies which used other quality of education measurements got mixed re-sults(Benhabib and Spiegal, 1994), (Hanushek and Woessman, 2008). The results ofthis thesis are also mixed.
21

Table 5: Regression table
(1) (2)Average annual growth rateof real GDP per person en-gaged over the coming fivey
Average annual growth rateof real GDP per person en-gaged over the coming fivey
Gross capital formation �0.0295 �0.0272(�1.97) (�1.62)
Lagged GDP per capita �0.0647⇤⇤⇤ �0.0648⇤⇤⇤
(�5.95) (�6.43)
E↵ective depreciation �0.00198 �0.00637(�0.19) (�0.66)
Education quantity 0.0132⇤⇤⇤ 0.00857⇤⇤
(5.75) (2.82)
Education quality 0.101⇤ 0.101⇤
(2.41) (2.25)
Interaction variable �0.0105⇤ �0.00951(�2.28) (�1.88)
Government expenditures 0.00459(0.31)
Trading 0.0131⇤⇤
(3.09)
Constant 0.553⇤⇤⇤ 0.629⇤⇤⇤
(5.11) (5.20)
Observations 150 150R2 0, 26 0, 31
t statistics in parentheses
⇤ p < 0.05, ⇤⇤ p < 0.01, ⇤⇤⇤ p < 0.001
22

Table 6: Regression table
(1) (2)Average annual growth rateof real GDP per person en-gaged over the coming fivey (1970-1990)
Average annual growth rateof real GDP per person en-gaged over the coming fivey (1995-2005)
Gross capital formation �0.00480 0.0263(�0.14) (0.97)
Lagged GDP per capita �0.0586 �0.137⇤⇤⇤
(�1.52) (�6.75)
E↵ective depreciation �0.0172 �0.00445(�1.08) (�0.51)
Education quantity 0.0227 0.00357(1.67) (0.76)
Education quality 0.0448 0.0275(0.64) (0.25)
Interaction variable �0.00705 �0.00477(�0.90) (�0.42)
Government expenditures �0.0220 0.0299(�1.04) (0.65)
Trading �0.0103 0.0285⇤⇤⇤
(�0.57) (5.49)
Constant 0.333 1.643⇤⇤⇤
(1.23) (6.11)
Observations 57 93R2 0, 19 0, 53
t statistics in parentheses
⇤ p < 0.05, ⇤⇤ p < 0.01, ⇤⇤⇤ p < 0.001
23

Chapter 5. Summary and suggestion for future re-
search
In this chapter the summary from the empirical analysis in the previous chapter isgiven. Finally, some suggestions for future research are presented.
Conclusion
This paper made an attempt to investigate whether the quality of education signifi-cantly a↵ects the economic growth of OECD countries. To do so the data between1965 and 2010 from several datasets was used. The quality of education was mea-sured as a proportion of students in the country which achieved very high levels(600 points and above) in the tests. ”A New International Database on EducationQuality: 1965-2010” by Nadir Altinok et. al. dataset was used to obtain comparabledata for education quality. In order to estimate the model, the OLS estimation withfixed e↵ects is used. Moreover, to solve the problem with heteroskedastisity, robuststandard errors are used.
Although many studies previously tried to investigate how and to which extenteducation a↵ects economic growth, it is problematic to estimate quality of educationdue to lack a unified measure of such a variable. However, the ”A New InternationalDatabase on Education Quality: 1965-2010” by Nadir Altinok et. al. adjusts thescore level in the international tests for all countries, so that it becomes possible toestimate the quality of education between countries.
The data which is used in this study is limited and more adjustments can be madein the future when bigger datasets are available. The potential limitation of the datafor quality of education is that adjustments made might have some inaccuraciesand distortions which make them less reliable. The variable which was used foreducation quality is is the proportion of students who achieved extraordinary resultsin the test. Estimation of general level of quality in a unified test might potentiallyprovide di↵erent results.
Suggestions for future research
The estimation of the model provided in this paper shows that quantity and qualityof education are not consistently significant in all performed models. As it wasmentioned in the previous sections, there are two ways to increase the quantity of
24

education: through increasing number of years in secondary school for all studentsor to ensure that all students complete the secondary school.
The main limitation of this thesis is small amount of observations and unbalancedpanel. Therefore, when more observations are available it is possible to make morestudies about whether quality and quantity of education a↵ect economic growth.
Moreover, the variables which are used for quantity and quality of education canbe more narrow if a researcher wants to estimate the e↵ects of education for men,women, urban or rural education. The data for developing countries was incompleteand short, therefore, with the availability of new observations, it would be possibleto include more countries in the analysis.
Dividing the dataset by two subsets also shows that the regression with earlyyears (1970-1990) is worse than the regression with years 1995 - 2005. It is shown inthe 6 that years 1985-1990 have 57 observations and 1995-2005 have 93 observations.Therefore, it is visible that less data are available for earlier periods. Therefore,longer time periods and better adjustments will improve the quality of results.
25

References
[1] Alderman, H., Behrman, J. R., Ross, D. R., Sabot, R. (1996). The returns toendogenous human capital in Pakistan?s rural wage labor market. Oxford Bulletinof Economics and Statistics, 58, 29?55.
[2] Barro, R. J. (1991). Economic growth in a cross-section of countries?, QuarterlyJournal of Economics, Vol. 106, pp. 407-443.
[3] Barro, R., Sala-i-Martin, X. (2004). Economic growth (2nd ed.). Cambridge, MA:MIT Press.
[4] Benhabib, J., Spiegel, M. M. (1994). The role of human capital in economicdevelopment: Evidence from aggregate cross country data. Journal of MonetaryEconomics, 34, 143-173.
[5] Bils, M., Klenow, P.J., 2000. Does Schooling Cause Growth? American EconomicReview 90, 1160?1183. doi:10.1257/aer.90.5.1160
[6] Breton, T. R. The Quality vs. the Quantity of Schooling: What Drives EconomicGrowth? SSRN Electronic Journal. http://doi.org/10.2139/ssrn.2497034
[7] Dension, E.F. (1962), Sources of Economic Growth in the United States andalternative Before Us, New York, Committee for Economic development.
[8] Feenstra, Robert C., Robert Inklaar and Marcel P. Timmer (2015), ”The NextGeneration of the Penn World Table” American Economic Review, 105(10), 3150-3182, available for download at www.ggdc.net/pwt
[9] Hanushek, E. A., Woessmann, L. (2008). The role of cognitive skills in economicdevelopment. Journal of Economic Literature, 46(3), 607-668.
[10] Hanushek, E., Wossmann, L. (2010). Education and Economic Growth. Inter-national Encyclopedia of Education, 245?252. http://doi.org/10.1016/b978-0-08-044894-7.01227-6
[11] Henderson, D. J. (2010). A test for multimodality of regression derivatives withan application to nonetric growth regressions, Journal of Applied Econometrics,Vol. 25, pp. 458-480.
[12] Islam, N. (1995). Growth empirics: a panel data approach, Quarterly Journalof Economics, Vol. 110, pp. 1127-1170.
26

[13] Kalaitzidakis, P., Mamuneas, T. P., Savvides, A. and Stengos, T. (2001). ?Mea-sures of human capital and nonlinearities in economic growth?, Journal of Eco-nomic Growth, Vol. 6, pp. 229-254.
[14] Kuznets, Simon (1973). Modern Economic Growth: Findings and Reflections.American Economic Review, 63, June, 247?258.
[15] Kuznets, Simon (1981). Modern Economic Growth and the Less DevelopedCountries. Conference on Experiences and Lessons of Economic Development inTaiwan. Taipei: Institute of Economics, Academia Sinica.
[16] Krueger, A., & Lindahl, M. (2001). Education for growth: Why and for whom?.Journal of Economic Literature, 39(4), 1101?1136.
[17] Luci-Greulich, A., Thevenon, O. (2014). Does economic advancement ’cause’ are-increase in fertility? An empirical analysis for OECD countries (1960-2007).European Journal of Population.
[18] Lucas, R. (1988). On the mechanics of economic development. Journal of Mon-etary Economics, 22, 3-42.
[19] Lucas, R. E. (1990). Why doesn’t capital flow from rich to poor countries?American Economic Review, 80, 92-96.
[20] Maasoumi, E., Racine, J. S. and Stengos, T. (2007). Growth and convergence:a profile of distribution dynamics and mobility, Journal of Econometrics, Vol. 136,pp. 483-508.
[21] Mankiw, N. G., Romer, D., Weil, D. R. (1992). A contribution to the empiricsof economic growth. Quarterly Journal of Economics, 107, 407-438.
[22] Dawood Mamoon, S. Mansoob Murshed (2009) Want economic growth withgood quality institutions? Spend on education, Education Economics, 17:4, 445-468
[23] Mehmet Mercan, Sevgi Sezer (2014) The e↵ect of education expenditure oneconomic growth: The case of Turkey. Procedia - Social and Behavioral Sciences109 (2014) 925 ? 930
[24] Nadir Altinok, Claude Diebolt, Jean-Luc De Meulemeester. A new Interna-tional Database on Education Quality: 1965-2010. 13066. Documents de travailde lIREDU, n2013-5, novembre 2013. 2012. ¡halshs-00910062¿
27

[25] Nonneman, W. and Vanhoudt, P. (1996). A further augmentation of the Solowmodel and the empirics of economics growth for OECD countries, Quarterly Jour-nal of Economics, Vol. 11, pp. 943-953.
[26] Pegkas, P., Tsamadias, C., 2015. Does formal education at all levels cause eco-nomic growth? Evidence from Greece. Review of Economic and Business Studies8. doi:10.1515/rebs-2016-0013
[27] Pereira, J.C.A., Aubyn, M.S., n.d. What Level of Education MattersMost for Growth? Evidence from Portugal. SSRN Electronic Journal.doi:10.2139/ssrn.715481
[28] Petrakis, P., Stamatakis, D., 2002. Growth and educational levels: a compar-ative analysis. Economics of Education Review 21, 513?521. doi:10.1016/s0272-7757(01)00050-4
[29] Psacharopoulos, G. (1984), The Contribution of Education to Economic Growth:International Comparisons, Cambridge, Ballinger Publishing Co.
[30] Romer, P. M. (1986). Increasing returns and long run growth. Journal of PoliticalEconomy, 94, 1002-1037.
[31] Romer, P. M. (1990). Endogenous technical change. Journal of Political Econ-omy, 98, 571-593.
[32] Sachs and Warner (1999) The Big Rush, Natural Resource Booms And Growth,Journal of Development Economics, 1999, v59(1,Jun), 43-76.
[33] Schultz, T. W. (1961). Investment in human capital. American Economic Re-view, 51, 1-17.
[34] Self, S., Grabowski, R., 2004. Does education at all levels cause growth? In-dia, a case study. Economics of Education Review 23, 47?55. doi:10.1016/s0272-7757(03)00045-1
[35] Solow, R. M. (1956). A contribution to the theory of economic growth. QuarterlyJournal of Economics, 70, 65-94.
[36] OECD (2012), Equity and Quality in Education: Support-ing Disadvantaged Students and Schools, OECD Publishing.http://dx.doi.org/10.1787/9789264130852-en
28

[37] World Bank (2017) World Development Indicators, [online] Availableat ¡http://data.worldbank.org/data-catalog/world-development-indicators¿ [Ac-cessed 8th of May, 2017]
[38] World Development Indicators (2017), [online] Available at¡http://data.worldbank.org/indicator/SE.XPD.TOTL.GB.ZS¿ [Accessed 17th ofAugust, 2017]
29

Appendix 1: Derivation of formulas
In this appendix the complete derivation of equation 14.
Y = K↵H�(AL)1�↵�� (18)
where Y represents GDP, K represents physical capital stock, L - labour force, A islabour e�ciency, and H represents human capital.
Rewriting this equation so that it becomes a growth per e↵ective units of labourform, using y = Y/AL k = K/AL h = H/AL:
y = k↵h� (19)
According to the Solow model, an economy will reach a steady state, where partialderivatives of the state variables with respect to time are zero. To find such a state,partial derivatives over time are introduced:
Capital accumulation function is given by:
K = skY � �K (20)
where � is a constant rate at which capital stock depreciates.In the per e↵ective labour unit form:
k = sky � (n+ g + �)k (21)
Human capital accumulation function is given by:
h = shy � (n+ g + �)h (22)
Deriving steady state from equations 2, 21 and 22:
k⇤ =⇣ s1��
k s�hn+ g + �
⌘ 11�↵��
(23)
h⇤ =⇣ s↵hs
1�↵h
n+ g + �
⌘ 11�↵��
(24)
y⇤ =⇣k⇤⌘↵⇣
h⇤⌘�
(25)
The purpose of this paper is to estimate the e↵ect of education on the economicgrowth. Therefore, the growth variable is needed rather than GDP in steady state.
30

Therefore, new variables are defined:
z = k/k = skk�(1�↵)h� � (n+ g + �) (26)
x = h/h = shk↵h�(1��) � (n+ g + �) (27)
which can be rewritten as following:
z = ske�(1�↵)lnke�lnh � (n+ g + �) (28)
x = she↵lnke�(1��)lnh � (n+ g + �) (29)
Inserting these variables in the production function equation 25, taking logs andtime derivatives produces the following result:
y/y = ↵z + �x (30)
Using the Taylor approximation of 31:
y/y = ↵(�(1�↵)ske�(1�↵)lnke�lnh(lnk�lnk⇤)+�ske
�(1�↵)lnke�lnh(lnh�lnh⇤))+�(↵she↵lnke�(1��)(lnk�lnk⇤)�(1��)she
↵lnke�(1��)lnh(lnh�lnh⇤))(31)
Using 29 and 28 and keeping in mind the fact that in steady state time derivativesare zero, the equation 31 can be rearranged as following:
y/y = (↵�(n+g+�)�↵(1�↵)(n+g+�))(lnk�lnk⇤+(↵�(n+g+�)��(1��)(n+g+�))(lnh�lnh⇤)(32)
Which can be simplified to:
y/y = �(lny⇤ � lny), (33)
where � = (1� ↵� �)(n+ g + �).In fact, 34 is a first order equation:
vt = �(v⇤ � vt), (34)
where vt = yt. Solving this equation:
vt = v⇤ + e��tv0 � e��tv⇤ (35)
If v0 is subtracted from both sides of 35:
vt � v0 = (1� e��tv⇤ � (1� e��t)v0, (36)
31

which is the same as:
lnyt � lny0 = (1� e1��t)lny⇤ � (1� e��t)lny0, (37)
Plugging in the steady state derivatives in 37 and making simplifications:
ln yt � ln y0 =↵(1� exp(��t))
1� ↵� �ln sk +
�(1� exp(��t))
1� ↵� �ln sh�
(↵ + �)(1� exp(��t))
1� ↵� �ln(n+ g + �)� (1� exp(��t) ln y0
(38)
Human capital variable (education) is assumed to have the following function:
sh = e�1u1+�2u2+�3u1u2 (39)
where u1 is education quantity and u2 is education quality.Therefore, the relationship between education quality and quantity and economic
growth is found. �1, �2, �3 are assumed to have positive signs because it is expectedthat education quality and quantity have positive influence on GDP growth, and atfixed amount of, say, quantity, more quality of education will give higher influenceon GDP growth.
32