the role of regional financial centres for development finance
TRANSCRIPT

The K4D helpdesk service provides brief summaries of current research, evidence, and lessons learned. Helpdesk reports are not rigorous or systematic reviews; they are intended to provide an introduction to the most important evidence related to a research question. They draw on a rapid desk-based review of published literature and consultation with subject specialists.
Helpdesk reports are commissioned by the UK Department for International Development and other Government departments, but the views and opinions expressed do not necessarily reflect those of DFID, the UK Government, K4D or any other contributing organisation. For further information, please contact [email protected].
Helpdesk Report
The role of regional financial centres for development finance
Maho Hatayama
Institute of Development Studies
29 January 2019
Question
What evidence exists on the role of regional financial centres in mobilising investment finance for
developing countries?
Contents
1. Summary
2. Role of financial centres
3. Role of regional financial centres
4. Country case studies
5. References
6. Annex

2
1. Summary
International and regional financial centres facilitate the flow of international investments in
developing countries. This review provides a brief summary of evidence available on the role of
selected regional financial centres in mobilising investment finance toward low- and middle-
income countries. It also provides a synthesis of the literature on the role of international financial
centres (IFCs) for development finance. Where available, it provides country case studies that
illustrate an overview of the selected centre’s role in investment mobilisation to developing
countries.
Overall, the financial centres contribute to enhancing public and private investment in developing
countries. This report has looked in particular at studies and data of 11 regional financial centres:
Egypt, Indonesia, Kenya, Lebanon, Malta, Mauritius, Morocco, Nigeria, Seychelles, South Africa
and Turkey. Among the selected examples, South Africa and Mauritius appear to be important
regional financial centres providing a large share of their investments in Africa and Asia.
Key findings include:
Role of IFCs
There are three ways that IFCs facilitate investment flows to developing countries:
mobilising foreign direct investment (FDI), facilitating private equity funds and
intermediating funds from development finance institutions (DFIs).
Empirical evidence confirms that IFCs contribute to stimulating additional investment
finance for developing countries.
Regional financial centres
Morocco, South Africa, Mauritius, Indonesia, Malta and Turkey are rated among the
world’s global financial centres by the Global Financial Centre Index.
Mauritius is a key source of investment for low- and lower-middle income
countries among the selected financial centres.
In addition to Mauritius, South Africa and Turkey contribute to mobilising investment
in middle-income countries.
For intra-regional investment in Africa, South Africa and Morocco provided more
investment in the region compared to other regional members.
South Africa, Morocco, Nigeria and Kenya have dominant positions in cross-
border banking in the continent.
Outside Africa, none of the selected financial centres was cited as a major source of
intra-regional investment.
Egypt and Indonesia appear to be major recipients of intra-regional investments.
Country-case studies
Mauritius: Mauritius directed most of its outward FDI to developing countries.
Mauritius’s investment is an important source of international financing for many
African countries and India as it accounted for a large share of total inward investment
in these countries.

3
South Africa: South Africa significantly contributed to inward FDI in least
developed and other developing countries in 2016. More than half of the outward
investment went to developing and transition countries.
Morocco: Empirical evidence confirms that a large share of FDI from Morocco was
directed to Sub-Saharan Africa. The investment focused on value-added sectors such
as banking and telecommunications.
Turkey: Turkey contributed to investment in landlocked developing countries such
as Ethiopia, Azerbaijan and Kazakhstan.
There is no commonly agreed definition of IFCs (EMPEA, 2015, p.42; IMF, 2007, p.4; UNCTAD,
2015, p.189; Waris, 2014, p.2). In this report, IFCs or financial centres refers to “a country or
jurisdiction that provide financial services to non-residents on a scale that is incommensurate
with the size and the financing of its domestic economy” (Bara & Le Roux, 2017, p.69)1. Regional
financial centres refers to financial centres that “have developed financial markets and
infrastructure and intermediate funds in and out of their region, but have relatively small domestic
economies” (IMF, 2000, para.12). As this report focuses on the financial activities of financial
centres, it also draws on evidence of studies that use other terms such as offshore financial
centres and investment hubs.
For the definition of “investment”, international investment statistics comprise different categories
of cross-border investment; namely direct investment, portfolio investment, financial derivatives
and other investment (mainly bank loans and deposits) (Fauser & Godar, 2016, p.3). Due to the
availability of studies, this report mainly focuses on FDI but also draws on evidence of other
types of investment.
There are limited empirical studies and statistics on cross-border capital flows between countries.
It is more difficult to find firm-level cross-border financial transactions. Many literature highlights
this limitation (Guichard, 2017, p.8; Lane & Milesi-Ferretti, 2010, p.3). Very few developing
countries provide information on the origin of the investments they receive and for which
purposes the investments are spent. Identified studies on investment flows mainly focuses on the
flow of FDI. It is also important to note that many countries do not report their bilateral investment
flows with financial centres for confidentiality reasons.
The lack of common definition and concepts of IFCs also reduce the comparability of studies.
The literature uses various terms including tax haven, offshore financial centres, conduits, and
investment hubs. There is a consensus in the literature that very little research has been done on
the role of financial centres for development finance while most studies focus on the link between
financial centres and tax evasion (see for example UNCTAD, 2015a). The academic literature on
regional financial centres is particularly limited than on international financial centres or offshore
financial centres. More empirical evidence is found in South Africa and Mauritius, while few case
studies exist in other countries.
1 Other characteristics of IFCs typically cited in the literature include: a high concentration of financial intermediaries and service providers, favourable tax regimes and other benefits for investors, well-developed regulatory and legislative frameworks, lack of effective exchange of information and transparency (Bara & Le Roux, 2017, p.68; EMPEA, 2015, p.69; IMF, 2000, para.12;UNCTAD, 2015a, p.214; Waris, 2014, p.2). IMF (2007) provides a comprehensive literature review of the definition of financial centres.

4
2. Role of financial centres
There are three ways in which IFCs can contribute to facilitating international capital movement
for developing countries. These include; mobilising foreign direct investment (FDI), facilitating
private equity funds, and intermediating funds by development finance institutions (DFIs).
Mobilising FDI
IFCs help private investors to mobilise investments for developing countries (Carter, 2017,
p.8; Hers et al., 2018, p.19; Tyson, 2019, p.30; UNCTAD, 2015a, p.189). For instance, United
Nations Conference on Trade and Development (UNCTAD) estimated the share of international
corporate investment (i.e. FDI) stock2 routed through 42 financial centres3 (UNCTAD, 2015a,
p.188). As of 2012, 30% of all international corporate investment stock in developing countries
was channelled through the financial centres, totalling more than $6.5 trillion (UNCTAD, 2015a,
p.189). The share of investment stock in Africa originated from the financial centres accounted
for 24% (UNCTAD, 2015a, p.199). There was an increase in the average share of investment
flows to developing economies routed through the financial centres from 21% (average 2001-
2004) to 26% (average 2010-2012) (UNCTAD, 2015a, p.199).
This result echoes the finding from a recent analysis of FDI stocks through five financial centres
(Ireland, Luxembourg, Mauritius, the Netherlands and Singapore) to developing countries. As of
February 20184, these five financial centres constituted 35% of total FDI stock in least developed
countries, and 23% of total FDI stock in developing and transition economies5 (Hers et al., 2018,
p.18). Together with other financial centres6, 41% of FDI stock in least developed economies
were channelled from these financial centres. In Sub-Saharan Africa, 45% of FDI stock
originated from these financial centres. Figure 1 shows the shares of FDI stock in developed and
developing economies coming from different source countries.
2 The analysis is based on data of bilateral corporate investment stock from the International Monetary Fund (IMF) Coordinated Direct Investment Survey 2012 and 2011 (UNCTAD, 2015b, p.5). 3 This report focuses on “offshore financial centres” including Anguilla, Antigua and Barbuda, Aruba, Austria, Bahamas, Bahrain, Belize, Bermuda, British Virgin Islands, Cayman Islands, Cook Islands, Cyprus, Dominica, Gibraltar, Grenada, Guernsey, Hungary, Isle of Man, Jersey, Liberia, Liechtenstein, Luxembourg, Malta, Marshall Islands, Mauritius, Monaco, Montserrat, Nauru, Netherlands Antilles, the Netherlands, Niue, Panama, Saint Kitts and Nevis, Saint Lucia, Saint Vincent and the Grenadines, Samoa, San Marino, Seychelles, Turks and Caicos Islands, US Virgin Islands and Vanuatu (UNCTAD, 2015b, p.8). 4 The primary data source is the IMF's Coordinated Direct Investment Survey (CDIS) database, supplemented by data from the OECD’s FDI Statistics (Benchmark Definition 4th Edition), the Central Bank of Mauritius, Singstat, the World Bank, and UNCTAD (Hers et al., 2018, p.8). 5 Country classification is based on the World Bank classification (Hers et al., 2018, p.18). 6 Andorra, Anguilla, Antigua and Barbuda, Aruba, Bahamas, Bahrain, Barbados, Belize, Bermuda, British Virgin Islands, Cayman Islands, Cook Islands, Jersey, Costa Rica, Cyprus, Dominica, Gibraltar, Grenada, Guernsey, Hong Kong, Isle of Man, Jordan, Lebanon, Liberia, Liechtenstein, Macau, Maldives, Malta, Marshal Islands, Monaco, Montserrat, Nauru, Netherlands Antilles, Niue, Panama, Samoa, San Marino, Singapore, St. Kitts and Nevis, St. Lucia, St. Vincent and Grenadines, Switzerland, Tonga, Turks and Caicos, U.S. Virgin Islands, Vanuatu
5
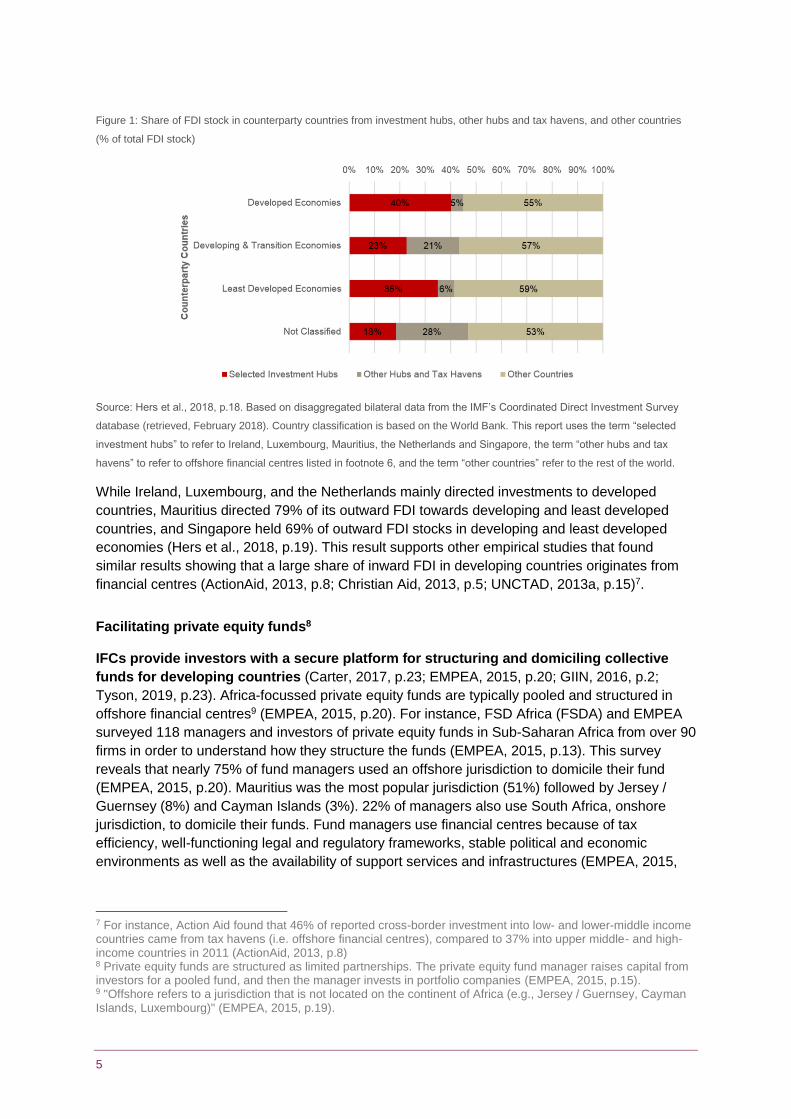
Figure 1: Share of FDI stock in counterparty countries from investment hubs, other hubs and tax havens, and other countries
(% of total FDI stock)
Source: Hers et al., 2018, p.18. Based on disaggregated bilateral data from the IMF’s Coordinated Direct Investment Survey
database (retrieved, February 2018). Country classification is based on the World Bank. This report uses the term “selected
investment hubs” to refer to Ireland, Luxembourg, Mauritius, the Netherlands and Singapore, the term “other hubs and tax
havens” to refer to offshore financial centres listed in footnote 6, and the term “other countries” refer to the rest of the world.
While Ireland, Luxembourg, and the Netherlands mainly directed investments to developed
countries, Mauritius directed 79% of its outward FDI towards developing and least developed
countries, and Singapore held 69% of outward FDI stocks in developing and least developed
economies (Hers et al., 2018, p.19). This result supports other empirical studies that found
similar results showing that a large share of inward FDI in developing countries originates from
financial centres (ActionAid, 2013, p.8; Christian Aid, 2013, p.5; UNCTAD, 2013a, p.15)7.
Facilitating private equity funds8
IFCs provide investors with a secure platform for structuring and domiciling collective
funds for developing countries (Carter, 2017, p.23; EMPEA, 2015, p.20; GIIN, 2016, p.2;
Tyson, 2019, p.23). Africa-focussed private equity funds are typically pooled and structured in
offshore financial centres9 (EMPEA, 2015, p.20). For instance, FSD Africa (FSDA) and EMPEA
surveyed 118 managers and investors of private equity funds in Sub-Saharan Africa from over 90
firms in order to understand how they structure the funds (EMPEA, 2015, p.13). This survey
reveals that nearly 75% of fund managers used an offshore jurisdiction to domicile their fund
(EMPEA, 2015, p.20). Mauritius was the most popular jurisdiction (51%) followed by Jersey /
Guernsey (8%) and Cayman Islands (3%). 22% of managers also use South Africa, onshore
jurisdiction, to domicile their funds. Fund managers use financial centres because of tax
efficiency, well-functioning legal and regulatory frameworks, stable political and economic
environments as well as the availability of support services and infrastructures (EMPEA, 2015,
7 For instance, Action Aid found that 46% of reported cross-border investment into low- and lower-middle income countries came from tax havens (i.e. offshore financial centres), compared to 37% into upper middle- and high-income countries in 2011 (ActionAid, 2013, p.8) 8 Private equity funds are structured as limited partnerships. The private equity fund manager raises capital from investors for a pooled fund, and then the manager invests in portfolio companies (EMPEA, 2015, p.15). 9 "Offshore refers to a jurisdiction that is not located on the continent of Africa (e.g., Jersey / Guernsey, Cayman Islands, Luxembourg)" (EMPEA, 2015, p.19).

6
p.43). They also provide a neutral location to pool and host funds from multiple investors, thus
facilitating the diversification and structuring of the pooled funds (Tyson, 2019, p.22). These
collected funds have been spent on low-income countries where investment barriers are high
(Tyson, 2019, p.26). For instance, a private company domiciled in Mauritius, collected their funds
from private investors and DFIs to invest in agricultural development projects in Cote d’Ivoire,
Mali and Niger, increasing incomes of more than 9,500 farmers (Tyson, 2019, p.24).
Intermediating funds from DFIs
IFCs also help DFIs to mobilise their development financing in developing countries
(Carter, 2017, p.8; Hers et al., 2018, p.23; Oxfam, 2016, p.14; Tyson, 2019, p.24). DFIs including
the International Finance Corporation, Norwegian Development Bank (Norfund), CDC Group and
the Dutch Development Bank (FMO), use financial centres for their fund management as they
provide reliable financial, judiciary and legal systems for investment (Tyson, 2019, pp.23-24). For
instance, out of the 38 fund commitments by the African Development Bank in 2014, the majority
of funds were legally domiciled in Mauritius (African Development Bank, 2014, p.18).
DFIs also use financial centres to facilitate co-financing with private investors as the use of
offshore financial centres reduces investment risks in developing countries, which encourages
investments from the private sector (Carter, 2017, p.16; Tyson, 2019, p.21). The pooling vehicles
such as private equity funds also allow DFIs to invest in smaller local businesses and diversify
risks in the event of default (Carter, 2017, p.16).
Identified literature emphasises that the amount of development finance for low-income countries
could decrease if DFIs cannot use financial centres as financial intermediaries of their
development funds (Tyson, 2019, p.25; UNCTAD, 2015, p.206). For instance, Norfund was
restricted on the use of offshore financial centres between 2009 and 2011. This restriction
resulted in decreasing the percentage of investments in Sub-Saharan Africa to 46% in 2011
compared to the 70% average for the 2009-2016 period (Tyson, 2019, p.25). In 2012, when a tax
information exchange agreement between Norway and Mauritius came into force, Norfund was
allowed to invest through companies domiciled in Mauritius (Carter, 2017, p.16). Consequently,
Norfund’s equity investments in Sub-Saharan Africa have increased and the percentage of
investment in Sub-Saharan Africa recovered to above 70%.
Stimulating additional investment for developing countries
In addition to enhancing investment movement for developing countries, there is empirical
evidence confirming that IFCs contribute to increasing investment finance for developing
countries. Tyson (2019, p.29) estimated the amount of additional finance passed through IFCs
that would otherwise not have been mobilised. The study revealed $1.6 trillion extra investment
finance for developing countries as a result of the use of IFCs between 2007 and 2014 (Tyson,
2019, p.29). The study also found that this additional finance was mainly channelled into financial
services and infrastructure sectors, which largely contribute to economic growth. For instance,
25.4% of IFC-intermediated finance10 went into the infrastructure sector while 10.6% of non-IFC
intermediated finance was spent on the same sector (see Figure 2) (Tyson, 2019, p.29). This
result can be explained by the fact that infrastructure development projects are capital-intensive
10IFC-intermediated finance refers to FDI and investment funds that were intermediated by IFCs (Mauritius and the British Virgin Islands).

7
and require long-term investments. Therefore, these funds are typically collected from various
DFIs and private investors and structured via IFCs (Tyson, 2019, p.29).
Figure 2: IFC-intermediated and non IFC-intermediated finance by sector in Africa and Middle East (% of total FDI and funds,
2007–2014, or total financial stock)
Source: Tyson, 2019, p.29
Overall, these studies highlight the conduit role of financial centres in mobilising public and
private investments to developing countries.
Rationale
The literature explains the rationale of the use of IFCs for international investment in developing
countries. Firstly, there is a high investment risk in developing countries because of weak legal
and political systems (EMPEA, 2015, p.16; GIIN, 2016, p.227; Hers et al., 2018, p.21; Tyson,
2019, p.22). The issues include corrupt judiciary, unpredictable legal processes, and political and
macroeconomic instability. IFCs can provide international investors with well-functioning legal
and judicial systems that mitigate these issues. Secondly, they provide a neutral location that
facilitate the pooling of funds from various donors and private investors (Tyson, 2019, p.23). The
tax neutrality of IFCs also ensures that private investors are not taxed a third time at fund level,
while they are only taxed in countries where they locate and where their investments are spent
(Tyson, 2019, p.23; UNCTAD, 2015, p.205). Hence, the use of IFCs reduces the cost and risks
of financing for developing countries (UNCTAD, 2015, p.206; Tyson, 2019, p.25).
3. Role of regional financial centres
This section provides available evidence on the performance of selected regional financial
centres in mobilising investment finance for developing countries. These countries include Egypt,
Indonesia, Kenya, Lebanon, Malta, Mauritius, Morocco, Nigeria, Seychelles, South Africa and
Turkey. For the remainder of this rapid review, “selected countries” or “selected financial centres”
refers to these 11 countries.
Status of the financial centres
Various initiatives exist for classifications and assessments of international financial centres. The
Global Financial Centre Index (GFCI) rates 110 cities into five areas of competitiveness:
business environment, human capital, infrastructure, financial sector development and reputation

8
(Z/Yen Group, 2018, p.11). The Organisation for Economic Co-operation and Development
(OECD) has reviewed over 100 jurisdictions to evaluate their compliance with the international
standard of transparency and exchange of information (EMPEA, 2015, p.71). The Tax Justice
Network has assessed 112 jurisdictions regarding their financial secrecy and the scale of their
offshore financial activities using the Financial Secrecy Index. Finally, The IMF lists 53
jurisdictions as offshore centres for inclusion in their assessment programme (EMPEA, 2015,
p.70). The status of the selected financial centres is summarised in Table 1.
In the GFCI, Casablanca ranked top compared to other financial centres. South Africa has the
best (i.e., lowest) score in terms of financial secrecy under the Financial Secrecy Index ranking.
South Africa and Mauritius are the only countries to be fully ‘compliant’ with the international
standard of exchange of information on request (EOIR) assessed by the OECD Global Forum
peer review exercise.
Table 1: Status of the selected financial centres
Country
The Global Financial Centres
Index Ranking (2018)
Financial Secrecy Index (2018) OECD Global
Forum Status
(As of October
2018)
IMF
(2008) If
listed as
offshore
centres
Secrecy
Score11
Global
Scale
Weight12
FSI
Value13
Egypt - - - - Not yet
Indonesia 76 (Jakarta) 61.45 0.05% 188.79 Largely compliant
Kenya Associate centre14 80.05 0.04% 378.35 Largely compliant
Lebanon - 72.03 0.51% 644.41 Provisionally
largely compliant15
x
Malta 88 60.53 0.71% 426.31 Largely compliant x
Mauritius 49 72.35 0.02% 223.47 Compliant x
Morocco 28 (Casablanca) - - - Largely compliant
Nigeria - - - - Largely compliant
Seychelles - 75.20 0.00% 125.26 - x
South Africa 38 (Cape Town) 57(Johannesburg)
56.10 0.18% 216.44 Compliant
Turkey 68 (Istanbul) 67.98 0.14% 353.89 Partially
Compliant
Source: Z/ Yen Group (2018, pp6-8); TJN (2018, pp1-2); OECD (2018, p.23)
11The Secrecy Scores are calculated based on 20 indicators relating to knowledge of beneficial ownership; corporate transparency; efficiency tax and financial regulation; and, international standards and cooperation (EMPEA, 2015, p.84). 12 The Global Scale Weight represents a jurisdiction's share in global financial services exports. It is based on an assessment of the size of each jurisdiction’s share of the global market for financial services provided to non-resident clients, are calculated based on IMF’s Balance of Payments Statistics (EMPEA, 2015, p.71). 13 The FSI Value is calculated by multiplying the cube of the Secrecy Score with the cube root of the Global Scale Weight. This value creates a ranking of each jurisdiction’s contribution to the ultimate global problem of financial secrecy (EMPEA, 2015, p.71). 14 The centre has not yet to achieve the number of assessments required to be listed in the main GFCI index (Z/ Yen Group, 2018, p.8). 15 The jurisdiction has been reviewed under the Fast-Track review procedure and assigned a provisional overall rating (OECD, 2018, p.23).
9
Investment in developing countries
Foreign Direct Investment
External sources of finance for developing economies comprise FDI, portfolio investment, bank
lending, official development assistance and remittances (UNCTAD, 2015c, p.4). FDI is the
largest external financing source for developing economies, accounting for 39% of total incoming
finance, followed by remittances (24%), portfolio investment (18%), ODA (11%) and other
investment (mainly bank lending) (9%) during 2013-2017 (UNCTAD, 2018, p.13). As FDI is a
critical financing source for developing countries, this section looks at evidence on the role of the
selected financial centres in channelling FDI in developing countries.
The IMF’s Coordinated Direct Investment Survey (CDIS), which collects bilateral data on inward
and outward FDI stocks, provides suggestive evidence of capital movements from the selected
countries to low- and middle-income countries. Figure 3 provides the volume of inward direct
investment stock in low- and lower-middle-income countries16 coming from the selected financial
centres. Table 2 and 3 provide the volume of inward investment from the selected countries in
different income groups and regions as of 2017.
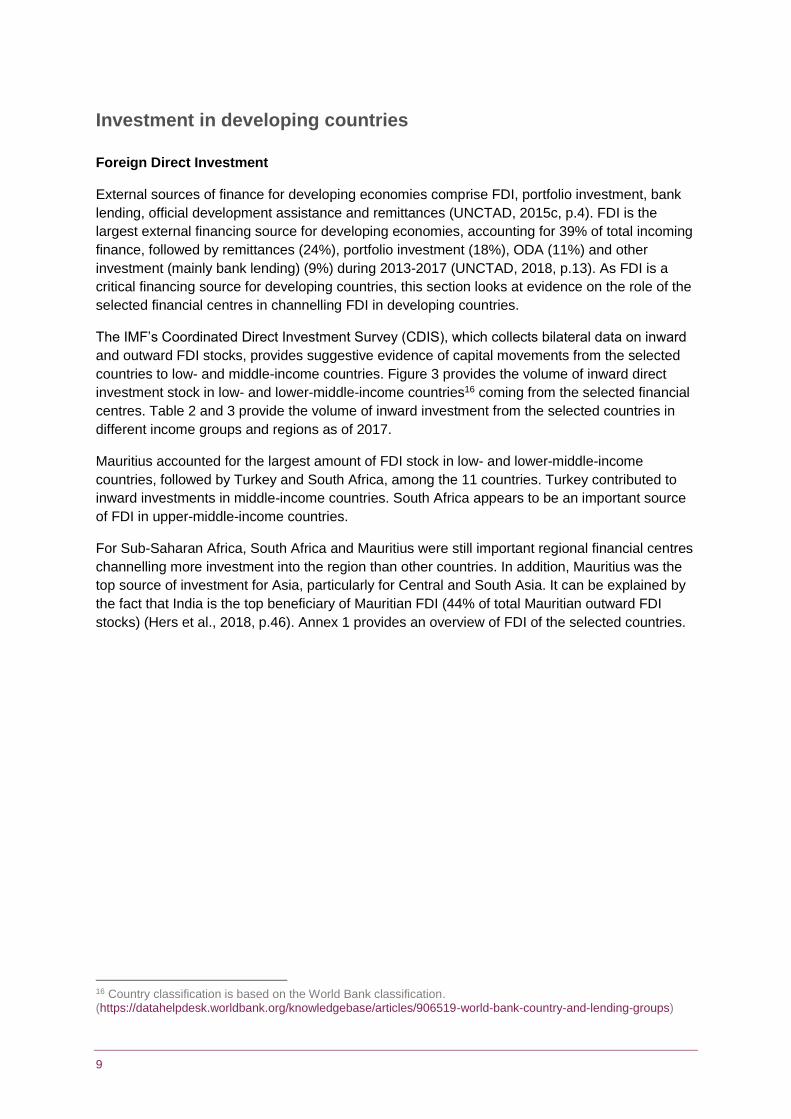
Mauritius accounted for the largest amount of FDI stock in low- and lower-middle-income
countries, followed by Turkey and South Africa, among the 11 countries. Turkey contributed to
inward investments in middle-income countries. South Africa appears to be an important source
of FDI in upper-middle-income countries.
For Sub-Saharan Africa, South Africa and Mauritius were still important regional financial centres
channelling more investment into the region than other countries. In addition, Mauritius was the
top source of investment for Asia, particularly for Central and South Asia. It can be explained by
the fact that India is the top beneficiary of Mauritian FDI (44% of total Mauritian outward FDI
stocks) (Hers et al., 2018, p.46). Annex 1 provides an overview of FDI of the selected countries.
16 Country classification is based on the World Bank classification. (https://datahelpdesk.worldbank.org/knowledgebase/articles/906519-world-bank-country-and-lending-groups)
10
Figure 3: Inward FDI to low- and lower-middle-income countries from the selected hubs in 2017(US$ millions)
Source: Author’s calculation based on IMF Coordinated Direct Investment Survey database, retrieved January 2019.
Table 2: Inward FDI stock in low-, lower middle- and upper-middle-income countries from the selected hubs in 2017 (US$
millions)
Low income Lower middle income Upper middle income
Mauritius 9,923 Mauritius 112,469 South Africa 184,242
South Africa 7,076 Turkey 17,041 Mauritius 20,094
Kenya 1,135 South Africa 5,962 Turkey 7,272
Morocco 660 Seychelles 4,658 Malta 6,135
Turkey 308 Morocco 1,263 Seychelles 4,621
Lebanon 115 Malta 1,103 Lebanon 2,310
Seychelles 97 Lebanon 734 Nigeria 1,927
Nigeria 87 Nigeria 504 Indonesia 1,596
Egypt 17 Indonesia 327 Kenya 1,077
Malta 2 Egypt 226 Egypt 725
Indonesia 0 Kenya 95 Morocco 61
World Total 49,806 World Total 835,600 World Total 3,553,458
Source: Author’s calculation based on IMF Coordinated Direct Investment Survey database, retrieved January 2019.
243
327
591
849
1,105
1,230
1,923
4,755
13,038
17,349
122,392
- 50,000 100,000 150,000
Egypt
Indonesia
Nigeria
Lebanon
Malta
Kenya
Morocco
Seychelles
South Africa
Turkey
Mauritius

11
Table 3: Inward FDI stock in each region17 from the selected countries in 2017 (US$ millions)
North Africa Sub-Saharan
Africa
Middle East Central and South
Asia
East Asia
South
Africa 266
South
Africa 29,970
Mauritius 6,937 Mauritius 117,308 Mauritius 28,977
Malta 143 Mauritius 13,946 Seychelles 250 Indonesia 19,230 South
Africa
20,132
Mauritius 60 Malta 4,480 South
Africa
219 Seychelles 5,075 Malta 9,871
Indonesia 16 Nigeria 2,439 Turkey 219 Malta 1,876 Seychelles 2,658
Lebanon 9 Kenya 2,282 Malta 209 Turkey 1,526 Indonesia 1,038
Source: Author’s calculation based on IMF Coordinated Direct Investment Survey database, retrieved January 2019. Top five
countries are listed among the selected countries in this table.
Figure 4 shows the volume of inward FDI stock in low- and lower-middle income countries from
the selected countries in 2013 and 2017. Compared to 2013, inward FDI from Indonesia, Malta,
Morocco and Turkey increased by more than double in 2017. In contrast, there was a significant
reduction of FDI stock from Egypt and Nigeria.
Figure 4: Inward FDI stock in low- and lower-middle-income countries from the selected countries, 2013 and 2017 (US$
billions)
Source: Author’s calculation based on IMF Coordinated Direct Investment Survey database, retrieved January 2019.
17 Country classification is based on the IMF regional classification (IMF, 2015a, p.114).
1.6 5.0 9.7 1.8
123.9
1.2 4.8 13.1 17.3
122.4
0.0
20.0
40.0
60.0
80.0
100.0
120.0
140.0
Kenya Seycelles South Africa Turkey Mauritius
2013 2017
0.7
0.1
1.2
0.7
0.4
0.1 0.2
0.3
0.6
0.8
1.1 1.1
-
0.2
0.4
0.6
0.8
1.0
1.2
1.4
Egypt Indonesia Nigeria Lebanon Malta Morocco
2013 2017

12
Cross-border banking activities
Another important consideration to measure the level of investments by selected countries is the
international investments made by their financial systems as it shows their capacity to provide
financial services (EMPEA, 2015, p.91). The Bank for International Settlements (BIS) locational
banking statistics measure international banking activities and provide data on deposits and
loans from internationally active banks located in the BIS reporting countries18 to counterparty
countries (more than 200 countries)19. This report was not able to identify any empirical studies
of capital flows of international banking activities in the selected countries to residents in
developing countries using the BIS database. However, the database captures assets and
liabilities of the selected countries to the BIS reporting banks. Therefore, it provides a broad
picture and a quantitative sense of importance of the role of these financial centres in
international financial intermediation (Lane & Milesi-Ferretti, 2010, p.9). Annex 2 summaries
external assets and liabilities of the selected countries in international banking20.
Intra-regional investment
This section reviews evidence on the relative role of selected financial centres in intra-regional
investment compared to other neighbouring economies. Where available, evidence on the
performance of the selected financial centres in cross-border banking is provided.
Africa21
South Africa provides the largest direct investment stakes in Africa compared to other
hubs. The World Investment Report 2018 estimated FDI stock in Africa held by source countries
using the UNCTAD FDI/MNE database 22(UNCTAD, 2018, p.38). The report illustrates that South
Africa placed fifth among the top 10 investors, providing US$ 24 billion to Africa as of 2016
(Table 4).
Table 4: Top 10 investor economies in Africa by FDI stock, 2016 (US$ billions)
Top 10 investor economies in Africa by FDI stock, 2016 (US$ billions)
1. United States (US) (57)
2. United Kingdom (UK) (55)
3. France (49)
4. China (40)
5. South Africa (24)
6. Italy (23)
7. Singapore (17)
8. India (14)
9. Hong Kong (13)
10. Switzerland (13)
Source: UNCTAD, 2018, p.38
18 Currently, 44 countries report the locational banking statistics (LBS). The LBS captures around 95% of all cross-border interbank business around the world. Among the selected countries, only South Africa, Indonesia and Turkey are BIS reporting countries. 19 See more details about the BIS. https://www.bis.org/statistics/bankstats.htm?m=6%7C31%7C69 20 In addition, World Bank Global Financial Development Report 2017/2018 provides useful information about financial system characteristics of each economy, including aspects of international banking (See World Bank, 2018, p.137). 21 “Africa” refers to all 54 countries comprising the African continent. “North Africa” refers to Morocco, Algeria, Tunisia, Libya, Egypt and Sudan (but not South Sudan). “Sub-Saharan Africa” refers to all African countries that are not constituents of North Africa. 22 www.unctad.org/fdistatistics

13
When it comes to capital investment23, Morocco was the third leading source country into
Africa by capital expenditure after China and the United Arab Emirates (UAE). Morocco invested
US$ 4.8 billion, accounting for 5% of the total capital investment in Africa in 2016 (African
Development Bank, OECD & UNDP, 2017, p.51; Financial Times, 2017, p.6). This finding
reflects the increasing capabilities of Moroccan firms in financial services, telecommunications
and manufacturing (UNCTAD, 2016, p.42). South Africa remains a significant source of
capital investment in Africa. In 2015-16, South Africa was responsible for a capital investment
of US$ 3.6 billion, funding about 60 projects. Kenya, Nigeria and Mauritius were also important
sources of intra-African investment, accounting for 51, 22 and 18 greenfield projects respectively,
over the same period (African Development Bank, 2018, p.13).
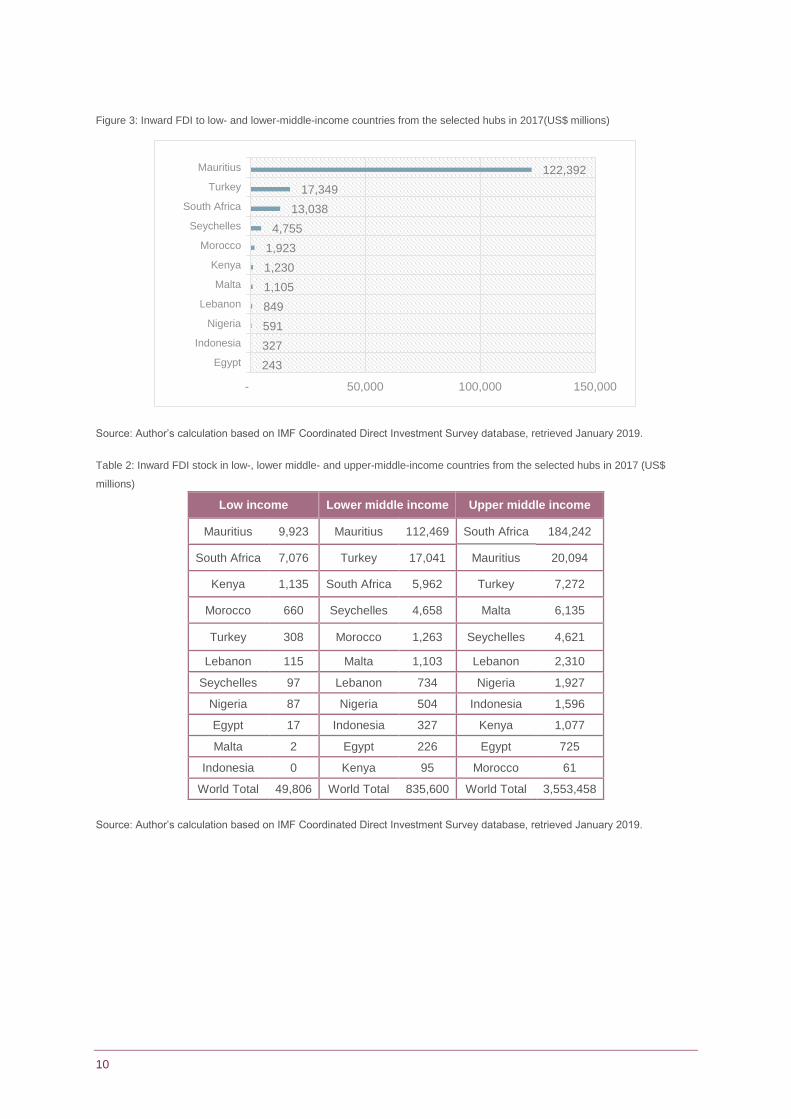
For international banking activities, there is a rapid expansion of pan-African banks in the
region (Beck et al., 2014, p.43; EMPEA, 2015, p.91; Enoch et al., 2015, p.7; UNCTAD, 2015a,
p.38; World Bank, 2016, p.163). Much literature cited that South Africa, Kenya, Nigeria and
Morocco have dominant positions in cross-border banking in Africa (Beck et al., 2014,
pp.31-32; Central Bank of Kenya, 2017, p.50; Enoch et al., 2015, pp.79-83). Beck et al. (2014)
listed ten major pan-African banks, of which, nine banks are owned by either South Africa,
Kenya, Nigeria or Morocco (See Table 5 and Figure 5). African cross-border banks hold a
significant share of assets in host country banking systems showing their systemic importance in
host countries.
Table 5: List of major African cross-border banks in 2011
Name Location (Majority ownership)
# of African countries in operation
# of countries with more than 10% of the host country's banking system assets held by the bank
Ecobank Togo (South Africa) 32 13
United Bank for Africa (UBA) Nigeria 19 2
Standard Bank Group (Stanbic) South Africa 18 9
Banque Marocaine du
Commerce Extérieur (BMCE)
Morocco
18 5
Banque Sahélo- Saharienne
pour l’Investissement et le
Commerce (BSIC)
Libya
14 2
Attijariwafa Bank Morocco 12 3
Banque Centrale Populaire du
Maroc (BCP)
Morocco 11 2
Barclays Africa Group South Africa (UK) 10 6
Access Bank Nigeria 9 -
Guaranty Trust Bank Ltd. Nigeria 9 -
Sources: Beck et al., 2014, p.42, p.43, p.46. The reference year is 2011; where 2011 data was not available, figures from 2009-
2012 were used instead. Note: Number of countries includes home country and representation through subsidiaries or
branches in African countries.
23 It refers to greenfield investment. Greenfield investment is a type of FDI that invest in the creation of a firm from scratch, or the extension of existing production capacity by non-resident investors. Data is based on the fDi Markets databases (https://www.fdimarkets.com/) from the Financial Times. The database tracks greenfield investment projects, which does not include mergers and acquisitions or other equity-based or non-equity investments (Financial Times, 2017, p.12).
14
Figure 5: Number of countries where pan-African banks operate, 1990-2013
Sources: Beck et al., 2014, p.39. Based on annual reports and websites of banks.
According to Enoch et al. (2015, p.81), Nigerian banks contributed to increasing bank branches
by 20% in Ghana during 2007 and 2008. They were also responsible for 26% and 35% of branch
growth in Sierra Leone and the Gambia respectively. These branches are increasingly outside of
the capital cities contributing to financial access across the countries (Enoch et al., 2015, p.81).
The country report published by IMF (2015b), also presents an overview of the cross-border
expansion of Moroccan banks in Sub-Saharan Africa. The international activity of the three
largest Moroccan banks (Attijariwafa, Banque Marocaine du Commerce Extérieur (BMCE) and
Banque Centrale Populaire (BCP)) accounted for 19% of total volume of activity of the financial
sector in Morocco as of 2013. The share of the Sub-Saharan African assets through cross-border
operation in the total assets was 9% for BCP, 20% for Attijariwafa, and 24% for BMCE (IMF,
2015b, p.3). While this report illustrates potential benefits of cross-border banks on host
countries by reaching underserved populations, it also highlights the lack of data and rigorous
studies of the impact of Moroccan banks on financial inclusion in Africa (IMF, 2015b, p.8).
Middle East and North Africa
None of the selected financial centres were cited in the identified literature as significant
sources of intra-regional investment in the Middle East region. The UAE plays a significant
role in mobilising investments in the region. For instance, the UAE contributed to 48.9% of the
total intra-Arab24 FDI by capital expenditures, followed by Kuwait (11.9%) and Bahrain (11.5%)
between 2003 and 2017 (Arab Investment and Export Credit Guarantee Corporation, 2018,
p.14). In contrast, Egypt was the top recipient among Arab countries by acquiring 25.9% of
the total intra-regional investments, followed by Saudi Arabia (9.6%) and Jordan (7.3%) over the
same period (Arab Investment and Export Credit Guarantee Corporation, 2018, p.14).
24 Algeria, Bahrain, Djibouti, Jordan, Egypt, Iraq, Kuwait, Lebanon, Libya, Morocco, Mauritania, Oman, Palestine, Qatar, Saudi Arabia, Sudan, Syria, Somalia, Tunisia, UAE, Yemen (http://dhaman.net/en/about-dhaman/member-countries/).

15
This finding broadly supports the study of UNCTAD (2013b) that examined intra-regional FDI
flows in the Organisation of the Islamic Cooperation (OIC) countries. UAE was also the largest
intra-OIC investor, accounting for about half of total intra-regional FDI25 during 2003-2012,
followed by Bahrain, Qatar, Kuwait and Saudi Arabia (UNCTAD, 2013b, p.7). Egypt was the
largest recipient, followed by Tunisia, Libya, Indonesia and Iraq (UNCTAD, 2013b, p.8).
Asia26
The literature reviewed does not provide evidence on the contribution of selected countries in
mobilising investment finance in the region. By contrast, many studies confirm that Indonesia is
a major destination of intra-regional investments (ASEAN & UNCTAD, 2018, p.26; ESCAP,
2018, p.58). According to the ASEAN Investment Report 2018, Indonesia is the largest recipient
of intra-regional investments among ASEAN countries since 2013, accounting for over 45% of
intra-ASEAN investments in 2017(ASEAN & UNCTAD, 2018, p.26). The largest source of intra-
regional investment came from Singapore (69%), followed by Malaysia and Thailand. This report
also reveals that many financial multinational enterprises invested in Indonesia in 2017-2018. It
includes Prudential (UK), Allianz (Germany), Woori Bank (Republic of Korea), HSBC (UK),
Standard Chartered (UK) and Bank of Tokyo-Mitsubishi UFJ (Japan) (ASEAN & UNCTAD, 2018,
pp.44-45).
This result is consistent with the findings of the Asia-Pacific Trade and Investment Report 2018
(ESCAP, 2018). It is found that Malaysia, Singapore and Thailand were the major intra-ASEAN
investors for greenfield FDI flows from 2015 to 2018, while Indonesia and Viet Nam received the
most significant share of greenfield FDI (ESCAP, 2018, p.58). Beyond ASEAN countries, the top
sources of intra-regional cross-border investments include Japan, Hong Kong and China (ADB,
2018, p.53), and the top destinations of investments are China, India and Singapore (ADB, 2018,
p.56).
Regarding cross-border banking activities within Asia, there was a rise of intra-regional shares of
bank claims and liabilities, pointing to an increasing role of regional bank lending (ADB, 2018,
p.69). However, the main sources and destinations of intra-regional cross-border lending were
Hong Kong, China and Singapore (ADB, 2018, pp.70-71).
4. Country case studies
This review found very limited information on the performance of the selected countries to
mobilise investment for developing countries. While central banks of the selected countries
provide reports and statistics including data on international investment position and balance of
payments (see Annex 3), very few agencies provide aggregated data on cross-border investment
by recipient countries, sectors and purposes. This limitation is widely cited by other literature
(Guichard, 2017, p.8; Lane & Milesi-Ferretti, 2010, p.3; UNCTAD, 2014, p.7).
Various databases from international organisations provide statistics that track cross-border
investment flows between countries. As there is no comprehensive data source that compiles
25 Based on data from UNCTAD cross-border mergers and acquisitions (M&A) database and fDi Markets (www.fDimarkets.com). FDI is comprised of greenfield investments and net-cross border M&As. Note that the nature of these two data sets is different. Therefore, some of these two investments are not equal to FDI inflows. It should be considered as an indication of FDI (UNCTAD, 2013b, p.8). 26 Asia refers to the 48 Asia and the Pacific members of the Asian Development Bank.

16
different categories of investment, the analysis of international investment flows needs to be put
together with a variety of data sources (Lane & Milesi-Ferretti, 2010, p.13). While these data
sources provide useful information on performances of the financial centres in international
financial intermediation, it was beyond the research scope of this rapid review to look at this raw
data in detail. Annex 4 summarises lists of databases of cross-border investment.
Mauritius
There is empirical evidence that Mauritius spends most of its investments in developing
countries. Hers et al. (2018) examined the role of Mauritius as a FDI hub between developed
and developing economies. They used FDI stock data from the IMF’s Coordinated Direct
Investment Survey (CDIS), augmented with data from the OECD’s FDI Statistics, the Central
Bank of Mauritius, the World Bank and UNCTAD to estimate investment flows between Mauritius
and counterpart countries (Hers et al., 2018, p.45). They found that Mauritius’ outward FDI
totalled US$ 234 billion in 2016, and 79% of outward FDI was directed to developing economies
and least developed economies (see Figure 6). The major beneficiaries are listed in Figure 7. In
contrast, inward FDI in Mauritius amounted to US$283 billion, of which 44% came from
developed economies (Hers et al., 2018, p.45).
Figure 6: Sources of inward FDI (left) and destinations of outward FDI (right) in Mauritius in 2016
Source: Hers et al., 2018, p.45. Based on data from the IMF’s Coordinated Direct Investment Survey database (retrieved,
February 2018).

17
Figure 7: Top 10 destinations of outward FDI from Mauritius
Source: Hers et al., 2018, p.46. Based on data from the IMF’s Coordinated Direct Investment Survey database (retrieved,
February 2018).
This study also argues that Mauritius is the dominant source of international investments
for many Sub-Saharan African countries and India. These African countries include Rwanda,
South Sudan, the Democratic Republic of Congo, Burundi, Zambia, and Uganda (Hers et al.,
2018, p.47). For instance, 90% of the total FDI stocks in Rwanda and 40% in India came from
Mauritius in 2016 (see Figure 8) (Hers et al., 2018, p.46). It is, however, important to note that
other recipient countries do not heavily rely on Mauritius’ FDI as it accounted for a small share of
the total FDI in these countries.
Figure 8: Importance of outward FDI from Mauritius for developing countries
Source: Hers et al., 2018, p.47. Based on data from the IMF’s Coordinated Direct Investment Survey database (retrieved,
February 2018).
This result supports the finding of Tyson (2019) showing that most activities of Mauritius
domiciled entities relate to FDI and fund-based investments to developing countries. She
18
examined firm-level activities in all of the Mauritius-domiciled entities in the International
Consortium of Investigative Journalists (ICIJ) database27 as of May 2018 (Tyson, 2019, p.12).
She categorised each entity by activity purposes to assess whether their operations bring value
to developing countries. It is found that between 2007 and 2014, 33% of Mauritius-domiciled
entities (i.e. companies, trusts and foundations) were involved in FDI to developing countries and
9% of the entities were emerging-market funds (a fund managed by investment funds or private
equity funds that invest in developing countries through subsidiaries in IFCs) (Tyson, 2019,
pp.12, 26, 28). FDI flowed into infrastructure, agricultural processing and manufacturing as well
as healthcare sectors (Tyson, 2019, p.28). Furthermore, the percentage of these activities (FDI
and emerging-market funds) increased from 47% to 78% between 2007 and 2014 (Tyson, 2019,
p.27). Other purposes of these entities, which are not related to developing countries, include
trusts and foundation28 (25%), tax structuring29 (14%) and illicit activity30 (5%).
South Africa
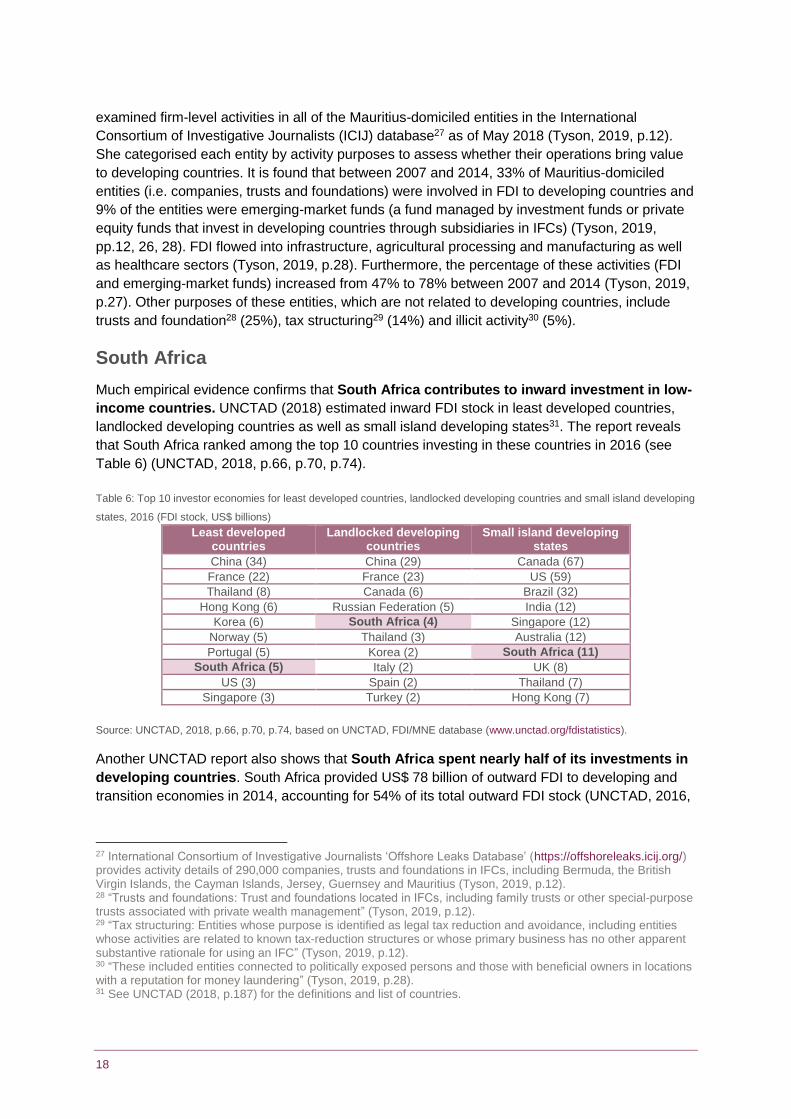
Much empirical evidence confirms that South Africa contributes to inward investment in low-
income countries. UNCTAD (2018) estimated inward FDI stock in least developed countries,
landlocked developing countries as well as small island developing states31. The report reveals
that South Africa ranked among the top 10 countries investing in these countries in 2016 (see
Table 6) (UNCTAD, 2018, p.66, p.70, p.74).
Table 6: Top 10 investor economies for least developed countries, landlocked developing countries and small island developing
states, 2016 (FDI stock, US$ billions)
Least developed countries
Landlocked developing countries
Small island developing states
China (34) China (29) Canada (67)
France (22) France (23) US (59)
Thailand (8) Canada (6) Brazil (32)
Hong Kong (6) Russian Federation (5) India (12)
Korea (6) South Africa (4) Singapore (12)
Norway (5) Thailand (3) Australia (12)
Portugal (5) Korea (2) South Africa (11)
South Africa (5) Italy (2) UK (8)
US (3) Spain (2) Thailand (7)
Singapore (3) Turkey (2) Hong Kong (7)
Source: UNCTAD, 2018, p.66, p.70, p.74, based on UNCTAD, FDI/MNE database (www.unctad.org/fdistatistics).
Another UNCTAD report also shows that South Africa spent nearly half of its investments in
developing countries. South Africa provided US$ 78 billion of outward FDI to developing and
transition economies in 2014, accounting for 54% of its total outward FDI stock (UNCTAD, 2016,
27 International Consortium of Investigative Journalists ‘Offshore Leaks Database’ (https://offshoreleaks.icij.org/) provides activity details of 290,000 companies, trusts and foundations in IFCs, including Bermuda, the British Virgin Islands, the Cayman Islands, Jersey, Guernsey and Mauritius (Tyson, 2019, p.12). 28 “Trusts and foundations: Trust and foundations located in IFCs, including family trusts or other special-purpose trusts associated with private wealth management” (Tyson, 2019, p.12). 29 “Tax structuring: Entities whose purpose is identified as legal tax reduction and avoidance, including entities whose activities are related to known tax-reduction structures or whose primary business has no other apparent substantive rationale for using an IFC” (Tyson, 2019, p.12). 30 “These included entities connected to politically exposed persons and those with beneficial owners in locations with a reputation for money laundering” (Tyson, 2019, p.28). 31 See UNCTAD (2018, p.187) for the definitions and list of countries.

19
p.12). Out of US$ 78 billion to developing countries, East Asian and African regions received
US$ 47 billion and US$ 26 billion respectively. Major beneficiary countries among developing
and transition economies included China (US$ 46 billion), Mozambique (US$ 2 billion),
Zimbabwe (US$ 2 billion), Botswana (US$1 billion) and Namibia (US$ 1 billion).
Additionally, many neighbouring countries heavily rely on the investments from South
Africa. World Bank (2016, p.166) analysed FDI stock from South Africa to neighbouring
countries between 2011 and 2013 using the IMF Coordinated Direct Investment Survey. It is
found that South Africa was the largest source of FDI for Botswana, Namibia, Lesotho and
Swaziland. It accounted for nearly 80% of total FDI inflows in these countries (World Bank, 2016,
p.163).
Morocco
Empirical studies show that Morocco placed a large share of its investment in Sub-Saharan
Africa. Berahab (2017) analysed the recipients and the structure of Moroccan FDI in Sub-
Saharan Africa using data from the Moroccan Office des Changes. This report shows that 40% of
outward FDI stock from Morocco went to Sub-Saharan Africa in 2015 (Berahab, 2017, p.6).
Between 2011 and 2015, the top FDI recipients included Ivory Coast, Mauritius and Mali.
Moroccan investments focused on sectors with high added value such as banking and
telecommunications (Berahab, 2017, p.6). Figure 9 shows the distribution of outward FDI per
sector and recipients.
Figure 9: Distribution of Moroccan FDI in Sub-Saharan Africa per sector (2015) and per recipients (2011-2015 average)
Source: Berahab, 2018, pp.6-7. Based on data from the Moroccan Office des Changes
This result reflects empirical evidence from a study by Abderrahim and Aggad (2018, p.8),
confirming that 62.9% of Morocco’s external investment was made in Sub-Saharan Africa
between 2008 and 2013. The banking sector attracted 41.6% of Moroccan FDI, followed by
telecommunications (Abderrahim & Aggad, 2018, p.9; Kingdom of Morocco, 2014, p.18). This
trend can be explained by the fact that Morocco has signed bilateral and regional agreements
with Sub-Saharan African countries for trade and investment promotion and protection
(Abderrahim & Aggad, 2018, p.8). Morocco's investments have also been facilitated by legislative
reforms that liberalised private investment abroad in 2014 (Kingdom of Morocco, 2014, pp.4-6).
Together these studies suggest that Morocco places vital importance on strengthening its
relations with other African countries through investment (Berahab, 2017, p.1; Kingdom of
Morocco, 2014, p.3).
31%
21%12%
11%
10%
9%
5%
1% Banking sector
Telecommunications
Industry
Real estate
Holdings
Other services
Commerce
Insurance
32%
17%13%
10%
9%
7%
5%4%
3% 0% 0%0% Ivory Coast
Mauritius
Mali
Cameroon
Nigeria
Senegal
Gabon
Congo
Togo
Burkina Faso
Guinea
Other

20
Turkey
Turkey contributed to mobilising investment in land-locked developing countries
(UNCTAD, 2018, p.70; UNCTAD, 2017, p.86). According to the World Investment Report 2018
(UNCTAD, 2018), Turkey ranked among the top 10 investor economies for landlocked
developing countries32 by FDI stock in 2016 (UNCTAD, 2018, p.70). Major landlocked recipients
of inward FDI include Kazakhstan, Ethiopia, Azerbaijan, Turkmenistan and Mongolia.
This result echoes the finding of the Central Bank of Turkey (2018) that provides monthly data on
outward FDI flows aggregated by destination countries. Table 8 provides the list of top five
recipient countries of outward FDI from Turkey in each region during 2016-2018, four of which
were also land-locked countries (Azerbaijan, Kazakhstan, Ethiopia and Uzbekistan).
Table 8: Top five recipient countries of outward FDI from Turkey, 2016-2018 average (US$ millions)
Africa Near and Middle East Asia
Algeria 80 Azerbaijan 548 Kazakhstan 93
Egypt 56 United Arab Emirates 113 China 62
Morocco 44 Iraq 113 Uzbekistan 30
South Africa 8 Georgia 42 India 18
Ethiopia 7 Saudi Arabia 11 South Korea 17
Source: Central Bank of Turkey, Balance of Payments statistics, November 2018. (*) provisional. Light red shades indicate low-
income countries; dark red shades indicate lower-middle-income countries, and no colour indicates higher middle- and high-
income countries. Bold means land-locked developing countries (UNCTAD classification).
This data also reveals that most of the recipient countries are classified as upper-middle income
or high-income countries while only Ethiopia is classified as a low-income country. In terms of the
distribution of investment by region, the majority of FDI went to Europe, North America and Near
and Middle East (Figure 10). It is clear that Africa and Asia received only a small share of Turkish
FDI. Figure 11 provides the volume of outward FDI in North Africa, Sub-Saharan Africa and Asia
between 2008 and 2018.
32 Landlocked developing countries include Afghanistan, Armenia, Azerbaijan, Bhutan, the Plurinational State of Bolivia, Botswana, Burkina Faso, Burundi, the Central African Republic, Chad, Ethiopia, Kazakhstan, Kyrgyzstan, the Lao People’s Democratic Republic, Lesotho, Republic of Macedonia, Malawi, Mali, the Republic of Moldova, Mongolia, Nepal, the Niger, Paraguay, Rwanda, South Sudan, Swaziland, Tajikistan, Turkmenistan, Uganda, Uzbekistan, Zambia and Zimbabwe.

21
Figure 10: The proportion of Turkish FDI abroad by region, 2017
Source: Central Bank of Turkey, Balance of Payments statistics, November 2018.
Figure 11: The volume of Turkish outward FDI flows in North Africa, Sub-Saharan Africa and Asia (US$ millions) 2008 -2018
Source: Central Bank of Turkey, Balance of Payments statistics, November 2018. (*) provisional
5. References
Abderrahim, T., & Aggad, F. (2018). Starting afresh: The Maghreb’s relations with sub-Saharan
Africa (Discussion Paper No. 225). Maastricht: The European Centre for Development Policy
Management (ECDPM). Retrieved from https://ecdpm.org/wp-content/uploads/DP-225-Starting-
afresh-Maghreb-relations-sub-Saharan-Africa-ECDPM-Apr-2018.pdf
ActionAid. (2013). How tax havens plunder the poor. Action Aid. Retrieved from
www.gfintegrity.org/wp-content/uploads/2014/05/ActionAidTax-Havens-May-2013.pdf.
African Development Bank. (2014). Mauritius Country Strategy Paper 2014 – 2018.
https://www.afdb.org/fileadmin/uploads/afdb/Documents/Project-and-Operations/2014-2018_-
_Mauritius_Country_Strategy_Paper.pdf
Europe48%
North Africa
2%
Sub Saharan
Africa0%
North America
24%
Near and Middle East23%
Asia3%
Oceania0%
185
34 35 32 4365
4413
57 7451
26
2 6 67
40
11
54
17
50
84 69
140141
223
214
153107
106
60
0
1,000
2,000
3,000
4,000
5,000
6,000
0
50
100
150
200
250
300
350
2008 2009 2010 2011 2012 2013 2014 2015 2016 2017(*)
2018(*)
North Africa Sub Saharan Africa Asia Total
22
African Development Bank. (2018). Africa-to-Africa Investment: a first look. African Development
Bank. Retrieved from https://www.afdb.org/en/news-and-events/african-development-bank-
launches-first-africa-to-africa-a2a-investment-report-18518/
African Development Bank, OECD, & UNDP. (2015). African Economic Outlook 2015. Paris:
OECD Publishing. https://doi.org/10.1787/aeo-2015-en
African Development Bank, OECD, & UNDP. (2016). African Economic Outlook 2016. Paris:
OECD Publishing. https://doi.org/10.1787/aeo-2016-en
African Development Bank, OECD, & UNDP. (2017). African Economic Outlook 2017. Paris:
OECD Publishing. https://doi.org/10.1787/aeo-2017-en
Asian Development Bank. (2017). Asian Economic Integration Report 2017: The era of financial
interconnectedness: how can Asia strengthen financial resilience? Manila, Philippines: Asian
Development Bank. https://www.adb.org/sites/default/files/publication/375196/aeir-2017.pdf
Asian Development Bank. (2018). Asian Economic Integration Report 2018: Toward Optimal
Provision of Regional Public Goods in Asia and the Pacific. Manila, Philippines: Asian
Development Bank. https://doi.org/10.22617/TCS179038-2
ASEAN, & UNCTAD. (2018). ASEAN Investment Report 2018 – Foreign Direct Investment and
the Digital Economy in ASEAN. Jakarta: ASEAN Secretariat. Retrieved from
https://asean.org/storage/2018/11/ASEAN-Investment-Report-2018-for-Website.pdf
BANK AL-MAGHRIB. (n.d.). Annual Report 2017. Retrieved 17 January 2019, from
http://www.bkam.ma/en/content/view/full/506680
Bank of Mauritius. (2018). Monthly Statistical Bulletin November 2018. Retrieved from
https://www.bom.mu/sites/default/files/pdf/Research_and_Publications/Monthly_Statistical_Bullet
in/msb_november_2018.pdf
Bara, A. & Roux, P. L. (2017). International financial centres, global finance and financial
development in the Southern Africa Development Community (SADC). Journal of Economics and
International Finance, 9(7), 68–79. https://doi.org/10.5897/JEIF2017.0849
Beck, T., Fuchs, M., Singer, D., & Witte, M. (2014). Making Cross-Border Banking Work for
Africa. Deutsche Gesellschaft für Internationale Zusammenarbeit (GIZ) GmbH and International
Bank for Reconstruction and Development / The World Bank. Retrieved from
https://openknowledge.worldbank.org/bitstream/handle/10986/20248/892020WP0Makin00Box38
5274B00PUBLIC0.pdf?sequence=1&isAllowed=y
Berahab, R. (2017). Relations between Morocco and sub- Saharan Africa: What is the potential
for trade and foreign direct investment? . Rabat, Morocco: OCP Policy Center. Retrieved from
http://www.ocppc.ma/sites/default/files/OCPPC-PB1704vEn.pdf
Capital Economics Ltd. (2014). Jersey’s Value to Africa. Capital Economics Ltd. Retrieved from
https://www.jerseyfinance.je/our-work/jerseys-value-to-africa/#.W4f1yOhKiUk
Carter, P. (2017). Why do Development Finance Institutions use offshore financial centres? (p.
47). London: ODI. Retrieved from https://www.odi.org/sites/odi.org.uk/files/resource-
documents/11832.pdf

23
Central Bank of Kenya. (2017). Bank Supervision Annual Report 2017. Central Bank of Kenya.
Retrieved from
https://www.centralbank.go.ke/uploads/banking_sector_annual_reports/849246690_2017%20An
nual%20Report.pdf
Central Bank of Turkey. (2018). Balance of payment statistics November 2018. Central Bank of
the Republic of Turkey Statistics Department Balance of Payments Division. Retrieved from
https://www.tcmb.gov.tr/wps/wcm/connect/2c897137-850e-4d15-9a2a-
c0d4735d9986/bop.pdf?MOD=AJPERES&CACHEID=ROOTWORKSPACE-2c897137-850e-
4d15-9a2a-c0d4735d9986-mwXJuB2
Christian Aid. (2013). Invested interests: The UK’s overseas territories hidden role in developing
countries (p. 20). Retrieved from www. christianaid.org.uk/Images/Invested-Interests-Christian-
Aid-tax-report.pdf.
EMPEA. (2015). Conduits of Capital Onshore Financial Centres and Their Relevance to African
Private Equity. EMPEA and FSD Africa. Retrieved from https://issuu.com/fsdafrica/docs/conduits-
of-capital-onshore-financi
Enoch, C., Mathieu, P., & Mecagni, M. (2015). Pan-African Banks : Opportunities and Challenges
for Cross-Border Oversight. Washington, DC: IMF. Retrieved from
https://www.imf.org/en/Publications/Departmental-Papers-Policy-Papers/Issues/2016/12/31/Pan-
African-Banks-Opportunities-and-Challenges-for-Cross-Border-Oversight-42781
ESCAP. (2018). Asia-Pacific Trade and Investment Report 2018. The Economic and Social
Commission for Asia and the Pacific (ESCAP). Retrieved from
https://www.unescap.org/sites/default/files/publications/APTIR%202018_4Jan19_0.pdf
Fauser, H., & Godar, S. (2016). Offshore wealth reconsidered: The development of offshore
wealth in the face of increasing international financial transparency. Greens/EFA Group -
European Parliament. Retrieved from https://www.greens-
efa.eu/legacy/fileadmin/dam/Documents/Studies/Taxation/Offshore_Wealth_Paper_FINAL.pdf
Financial Times. (2017). The Africa Investment Report 2017. London: The Financial Times Ltd.
Retrieved from http://itemsweb.esade.edu/wi/Prensa/TheAfricaInvestmentReport2017.pdf
GIIN. (2016). The Landscape for Impact Investing in Southern Africa. The Global Impact
Investing Network. Retrieved from https://thegiin.org/research/publication/southern-africa-report
Guichard, S. (2017). Findings of the recent literature on international capital flows: Implications
and suggestions for further research (OECD Economics Department Working Papers No. 1410).
Paris: OECD Publishing. https://doi.org/10.1787/2f8e1d6d-en
Hers, J., Joost Witteman, Ward Rougoor, & Buiren, K. van. (2018). The role of investment hubs
in FDI, economic development and trade: Ireland, Luxembourg, Mauritius, the Netherlands, and
Singapore. Amsterdam: SEO Economics. Retrieved from http://www.seo.nl/en/page/article/the-
role-of-investment-hubs-in-fdi-economic-development-and-trade/
Hines, J. (2009). International Financial Centers and the World Economy. London: The Society of
Trust and Estate Practitioners. Retrieved from
https://www.step.org/sites/default/files/Comms/reports/InternationalFinanceCentres.pdf

24
IMF. (2000). Offshore Financial Centers IMF Background Paper. Washington, DC: IMF.
Retrieved from https://www.imf.org/external/np/mae/oshore/2000/eng/back.htm#chart1
IMF. (2007). Concept of Offshore Financial Centers: In Search of An Operational Definition. IMF
Working Papers, 07(87), 1. https://doi.org/10.5089/9781451866513.001
IMF. (2008). Offshore Financial Centers - Report on the Assessment Program and Proposal for
Integration with the Financial Sector Assessment Program. Washington, DC: IMF. Retrieved from
https://www.imf.org/en/Publications/Policy-Papers/Issues/2016/12/31/Offshore-Financial-
Centers-Report-on-the-Assessment-Program-and-Proposal-for-Integration-PP4271
IMF. (2015a). Coordinated direct investment survey guide. Washington, DC: IMF. Retrieved from
http://data.imf.org/?sk=40313609-F037-48C1-84B1-E1F1CE54D6D5&sId=1390288795525
IMF. (2015b). Morocco : The Sub-Saharan Expansion of Moroccan Banks: Challenges and
Opportunities (Country Report No. 15/106). Washington, DC: IMF. Retrieved from
https://www.imf.org/external/pubs/ft/scr/2015/cr15106.pdf
Kingdom of Morocco. (2014). Moroccan-African relations: the ambition of “new borders”.
Kingdom of Morocco. Ministry of Economy and Finance. Retrieved from
https://www.finances.gov.ma/Docs/2014/DEPF/Relations%20Maroc-Afrique_vdd.pdf
Lane, P. R., & Milesi-Ferretti, G.-M. (2010). Cross-Border Investment in Small International
Financial Centers. IMF Working Papers, 10(38), 1. https://doi.org/10.5089/9781451962833.001
NSC. (2017). Coordinated Portfolio Investment Survey: 2016. National Statistics Office Malta.
Retrieved from
https://nso.gov.mt/en/News_Releases/View_by_Unit/Unit_A3/Balance_of_Payments/Documents/
2017/News2017_172.pdf
NSC. (2018). Direct Investment in Malta and Abroad: Jan-Dec 2017. National Statistics Office
Malta. Retrieved from
https://nso.gov.mt/en/News_Releases/View_by_Unit/Unit_A3/Balance_of_Payments/Pages/Dire
ct-Investment-in-Malta-and-Abroad.aspx
OECD. (2014). Recent FDI Trends in the MENA Region. Paris: OECD. Retrieved from
https://www.oecd.org/mena/competitiveness/Draft%20Note_FDI%20trends%20in%20MENA_De
c.%202014.pdf
OECD. (2018). Tax Transparency 2018: Report on Progress. Paris: OECD.
https://doi.org/10.1787/9789264223059-en
The Arab Investment and Export Credit Guarantee Corporation. (2018). Investment Climate in
Arab Countries Dhaman Investment Attractiveness Index (DIAI). The Arab Investment & Export
Credit Guarantee Corporation. Retrieved from http://dhaman.net/en/wp-
content/uploads/sites/3/2018/11/ClimateReport2018-En.pdf
TJN. (2018). Financial Secrecy Index - 2018 Results. Tax Justice Network. Retrieved from
https://www.financialsecrecyindex.com/introduction/fsi-2018-results

25
Tyson, J. E. (2019). International financial centres and development finance. London: ODI.
Retrieved from https://www.odi.org/publications/11263-international-financial-centres-and-
development-finance
UNCTAD. (2013a). World Investment Report 2013: Global Value Chains - Investment and Trade
for Development. New York and Geneva: United Nations. https://doi.org/10.18356/a3836fcc-en
UNCTAD. (2013b). Global Investment Trends Monitor No 14 Strengthening the links between
intra-OIC FDI and regional integration. New York and Geneva: United Nations. Retrieved from
https://unctad.org/en/PublicationsLibrary/webdiaeia2013d11_en.pdf
UNCTAD. (2014). Global Investment Trends Monitor No 17: FDI in small island development
states. New York and Geneva: United Nations. Retrieved from
https://unctad.org/en/PublicationsLibrary/webdiaeia2014d6_en.pdf
UNCTAD. (2015a). World Investment Report 2015: Reforming international investment
governance. New York and Geneva: United Nations. Retrieved from
https://unctad.org/en/PublicationsLibrary/wir2015_en.pdf
UNCTAD. (2015b). An FDI-driven approach to measuring the scale and economic impact of
BEPS (p. 28). New York and Geneva: United Nations. Retrieved from
https://unctad.org/en/PublicationChapters/wir2015ch5_Annex_II_en.pdf
UNCTAD. (2015c). Global Investment Trends Monitor No 20: Financing for development. New
York and Geneva: United Nations. Retrieved from
https://unctad.org/en/PublicationsLibrary/webdiaeia2015d3_en.pdf
UNCTAD. (2016). World Investment Report 2016: Investor Nationality - Policy Challenges. New
York and Geneva: United Nations. https://doi.org/10.18356/9d7da2eb-en
UNCTAD. (2017). World Investment Report 2017: Investment and the Digital Economy. New
York and Geneva: United Nations. https://doi.org/10.18356/e692e49c-en
UNCTAD. (2018). World Investment Report 2018: Investment and New Industrial Policies. New
York and Geneva: United Nations. https://doi.org/10.18356/ebb78749-en
Waris, A. (2014). Tax haven or international financial centre? The case of Kenya. Retrieved from
https://www.u4.no/publications/tax-haven-or-international-financial-centre-the-case-of-kenya
World Bank. (2018). Global Financial Development Report 2017/2018. Washington, DC: World
Bank. Retrieved from
https://openknowledge.worldbank.org/bitstream/handle/10986/28482/9781464811487.pdf
World Bank Group. (2016). Global Economic Prospects, January 2016 : Spillovers Amid Weak
Growth. Washington, DC: World Bank. Retrieved from
https://openknowledge.worldbank.org/handle/10986/23435
Z/Yen Group. (2018). The Global Financial Centres Index 23 London: Long Finance. Z/Yen
Group. Retrieved from
https://www.longfinance.net/media/documents/GFCI_24_final_Report_7kGxEKS.pdf

26
Acknowledgements
We thank the following experts who voluntarily provided suggestions for relevant literature or
other advice to the author to support the preparation of this report. The content of the report does
not necessarily reflect the opinions of any of the experts consulted.
Bruno Casella, United Nations Conference on Trade and Development
Elizabeth Cobb, Carleton University
Isya H. Kresnadi, United Nations Conference on Trade and Development
Johannes Hers, SEO Economic Research
Judith Tyson, Overseas Development Institute (ODI)
Maha El Masri, United Nations Conference on Trade and Development
Ward Rougoor, SEO Economic Research
Key websites
OECD The Global Forum on Transparency and Exchange of Information for Tax
Purposes: http://www.oecd.org/tax/transparency/about-the-global-forum/
Tax Justice Network: https://www.financialsecrecyindex.com/
The Global Financial Centres Index: https://www.longfinance.net/programmes/financial-
centre-futures/global-financial-centres-index/
Suggested citation
Hatayama, M. (2019).The role of regional financial centres for development finance. K4D
Helpdesk Report 522. Brighton, UK: Institute of Development Studies.

27
6. Annex
Annex 1: Overview of inward and outward FDI in selected countries
Gross positions
(US$ million)
Top five sources (US$ million)
Gross positions
(US$ million)
Top five destinations (US$ million)
Indonesia 240,104 Singapore 58,046 N/A
Netherlands 43,667
US 24,020
Japan 22,609
UK 21,324
Lebanon 2,180 Luxembourg 716 5,591 Turkey 1,495
France 287 France 776
Libya 197 Egypt 709
UAE 175 Jordan 433
Egypt 150 Luxembourg 423
Malta 203,551 Germany 35,430 73,981 Germany 12,718
Netherlands 24,847 UK 4,945
UK 14,123 Spain 1,699
Denmark 10,646 France 1,335
Jersey 5,707 Italy 1,146
Mauritius 333,281 US 64,261 268,454 India 99,768
Cayman Islands
52,738 Singapore 18,491
Singapore 27,738 Cayman Islands 9,118
India 23,724 UK 8,783
South Africa 18,603 South Africa 7,754
Morocco 31,351 France 12,360 4,532 France 885
UAE 10,644 Cote d'Ivoire 711
Spain 1,116 Luxembourg 366
Kuwait 969 Mauritius 318
Netherlands 828 Switzerland 197
Nigeria 78,322 Bermuda 13,639 N/A
Netherlands 13,278
France 8,847
UK 7,995
US 7,471
Seychelles 838 Mauritius 326 N/A
Cyprus 161
Russian Federation
115
UK 44
Virgin Islands 35

28
South Africa
156,103 UK 64,505 276,450 China 165,477
Netherlands 28,075 UK 24,334
US 10,459 Mauritius 11,422
Germany 7,623 Australia 8,840
China 7,290 US 7,782
Turkey 113,901 Netherlands 21,780 45,951 India 14,902
Germany 8,809 UK 3,893
Spain 8,494 Jersey 3,539
Russia 7,969 Japan 2,080
Azerbaijan 6,345 Malaysia 2,047
Source: IMF coordinated direct investment survey (CDIS), 2019. Data is not available for Egypt and Kenya.
Annex 2: Scale of international banking activities in selected financial centres
Country GDP
(US$ millions) (2017)33
Liabilities to the BIS reporting banks (US$ millions)
Liabilities to GDP
Claims on the BIS reporting banks (US$ millions)
Total Part bank
sector Total Part bank
sector
Turkey 851,549 59,826 38,797 5% 174,916 85,962
Lebanon 53,577 43,815 34,485 64% 9,917 6,128
Nigeria 375,745 41,246 30,604 8% 25,502 13,404
South Africa
348,872 39,090 21,617 6% 53,801 19,161
Egypt 235,369 24,881 12,693 5% 33,754 15,385
Indonesia 1,015,539 20,544 14,171 1% 114,114 36,913
Malta 12,518 18,484 5,634 45% 22,754 10,832
Mauritius 5,025 17,216 6,073 121% 21,431 2,913
Seychelles 1,498 12,619 216 14% 4,244 24
Kenya 79,263 9,431 5,444 7% 13,199 1,466
Morocco 109,709 9,021 6,206 6% 14,036 5,722
Source: Author’s calculation based on BIS locational banking statistics, retrieved January 2019.
Note: The database provides data for claims and liabilities of the BIS reporting banks on individual counterpart countries.
Counterparties are split into bank and no-bank sector. It is important to note the limitation of the data source. According to Lane
& Milesi-Ferretti (2010, p.4), “the data sources are indirect as the claims and liabilities were reported by the BIS reporting
countries. Therefore, the estimates can be seen as providing a broad order of magnitude of the financial intermediation role of
these countries rather than a precise assessment.”
33 https://data.worldbank.org/indicator/NY.GDP.MKTP.CD
29
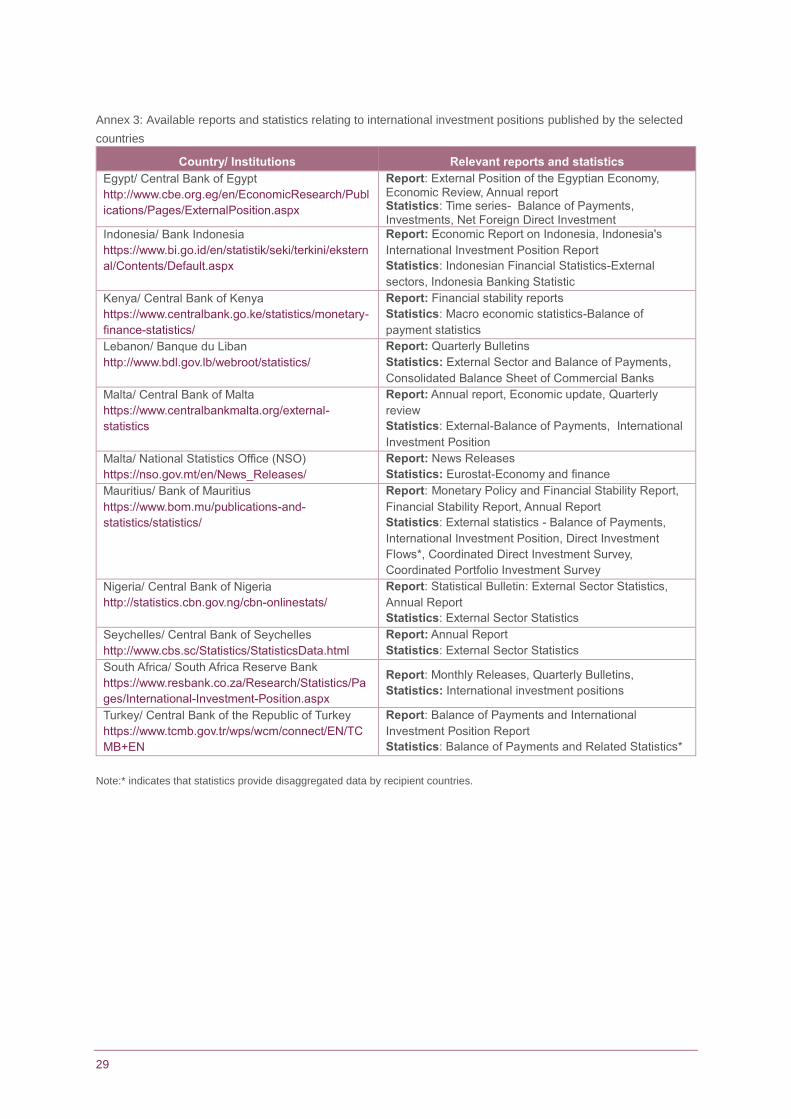
Annex 3: Available reports and statistics relating to international investment positions published by the selected
countries
Country/ Institutions Relevant reports and statistics
Egypt/ Central Bank of Egypt
http://www.cbe.org.eg/en/EconomicResearch/Publ
ications/Pages/ExternalPosition.aspx
Report: External Position of the Egyptian Economy,
Economic Review, Annual report Statistics: Time series- Balance of Payments,
Investments, Net Foreign Direct Investment
Indonesia/ Bank Indonesia
https://www.bi.go.id/en/statistik/seki/terkini/ekstern
al/Contents/Default.aspx
Report: Economic Report on Indonesia, Indonesia's
International Investment Position Report
Statistics: Indonesian Financial Statistics-External
sectors, Indonesia Banking Statistic
Kenya/ Central Bank of Kenya
https://www.centralbank.go.ke/statistics/monetary-
finance-statistics/
Report: Financial stability reports
Statistics: Macro economic statistics-Balance of
payment statistics
Lebanon/ Banque du Liban
http://www.bdl.gov.lb/webroot/statistics/
Report: Quarterly Bulletins
Statistics: External Sector and Balance of Payments,
Consolidated Balance Sheet of Commercial Banks
Malta/ Central Bank of Malta
https://www.centralbankmalta.org/external-
statistics
Report: Annual report, Economic update, Quarterly
review
Statistics: External-Balance of Payments, International
Investment Position
Malta/ National Statistics Office (NSO)
https://nso.gov.mt/en/News_Releases/
Report: News Releases
Statistics: Eurostat-Economy and finance
Mauritius/ Bank of Mauritius
https://www.bom.mu/publications-and-
statistics/statistics/
Report: Monetary Policy and Financial Stability Report,
Financial Stability Report, Annual Report
Statistics: External statistics - Balance of Payments,
International Investment Position, Direct Investment
Flows*, Coordinated Direct Investment Survey,
Coordinated Portfolio Investment Survey
Nigeria/ Central Bank of Nigeria
http://statistics.cbn.gov.ng/cbn-onlinestats/
Report: Statistical Bulletin: External Sector Statistics,
Annual Report
Statistics: External Sector Statistics
Seychelles/ Central Bank of Seychelles
http://www.cbs.sc/Statistics/StatisticsData.html
Report: Annual Report
Statistics: External Sector Statistics
South Africa/ South Africa Reserve Bank
https://www.resbank.co.za/Research/Statistics/Pa
ges/International-Investment-Position.aspx
Report: Monthly Releases, Quarterly Bulletins,
Statistics: International investment positions
Turkey/ Central Bank of the Republic of Turkey
https://www.tcmb.gov.tr/wps/wcm/connect/EN/TC
MB+EN
Report: Balance of Payments and International
Investment Position Report
Statistics: Balance of Payments and Related Statistics*
Note:* indicates that statistics provide disaggregated data by recipient countries.

30
Annex 4: Lists of data sources of statistics of investment flows
Investment types
Database
Foreign Direct Investment
IMF Coordinated Direct Investment Survey (CDIS): It provides bilateral data on inward and
outward FDI stocks. Each year, reporting countries report the amount of inward FDI and outward FDI (stocks) from and to counterparty countries. http://data.imf.org/CDIS
UNCTAD FDI statistics: UNCTAD's Bilateral FDI Statistics provides up-to-date and
systematic FDI data for 206 economies around the world, covering inflows, outflows, inward stock and outward stock by region and economy. https://unctad.org/en/pages/DIAE/DIAE.aspx
OECD FDI statistics: A comprehensive set of statistics on FDI into and out of OECD countries.
The data are presented in a standardised format combining sectoral and geographical breakdowns for flow and stock data since 1982. https://data.oecd.org/fdi/fdi-flows.htm
FDI Markets database by the Financial Times: It provides database cross-border greenfield
investments covering 179 countries. https://www.fdimarkets.com/
Portfolio investment
IMF Coordinated Portfolio Investment Survey (CPIS): It provides data on its holdings of
portfolio investment securities of an economy. Data are separately requested for equity and investment fund shares, long-term debt instruments, and short-term debt instruments. http://data.imf.org/CPIS
Emerging Portfolio Fund Research (EPFR) data: It provides fund flow and asset allocation
data to financial institutions around the world to track both traditional and alternative funds domiciled globally. https://www.epfrglobal.com/countryflows.aspx
Other investment including loans, deposits and others
BIS international banking statistics (locational statistics): The database provides cross-
border data on loans and deposits measuring international banking activity, focusing on the location of the banking office. It captures outstanding financial assets and liabilities of internationally active banks located in reporting countries on counterparties residing in more than 200 countries. Data sets are reported at a country, rather than individual bank level. https://www.bis.org/statistics/bankstats.htm
Thomson Reuters’s Securities Data Corporation (SDC) Platinum database: It provides
the syndicated loan flows data and consists of direct cross-border lending through which a group of financial intermediaries provides funds to a single borrower. https://www.refinitiv.com/en/products/sdc-platinum-financial-securities
About this report
This report is based on twelve days of desk-based research. The K4D research helpdesk provides rapid
syntheses of a selection of recent relevant literature and international expert thinking in response to specific
questions relating to international development. For any enquiries, contact [email protected].
K4D services are provided by a consortium of leading organisations working in international development, led by
the Institute of Development Studies (IDS), with Education Development Trust, Italy, University of Leeds Nuffield
Centre for International Health and Development, Liverpool School of Tropical Medicine (LSTM), University of
Birmingham International Development Department (IDD) and the University of Manchester Humanitarian and
Conflict Response Institute (HCRI).
This report was prepared for the UK Government’s Department for International
Development (DFID) and its partners in support of pro-poor programmes. It is licensed for
non-commercial purposes only. K4D cannot be held responsible for errors or any
consequences arising from the use of information contained in this report. Any views and
opinions expressed do not necessarily reflect those of DFID, K4D or any other contributing
organisation. © DFID - Crown copyright 2019.