the role of religion in the 2016 american presidential … role of religion in the 2016 american...
TRANSCRIPT

ARTIKEL
DOI 10.1007/s41682-017-0007-5Z Religion Ges Polit (2017) 1:133–162
The role of religion in the 2016 american presidentialelection
Corwin E. Smidt
Published online: 14 March 2017© Springer Fachmedien Wiesbaden 2017
Abstract This article analyzes patterns of continuity and change in the presidentialvoting patterns of the American electorate, particularly as it relates to the role ofreligion in American presidential politics. Given American cultural values relatedto wanting their political leaders to be religious, it seeks to ascertain how Trumpcould, in light of these cultural values, still capture the Republican nomination andthen defeat Clinton in the general election. So doing, this study seeks to addresswhether the election of Trump reflects a major shift in American electoral politics.
Keywords The 2016 presidential election · Religion in American culture ·Evangelical Protestants · American voting behavior · Religion and candidate choice
The American presidential election of 2016 exhibited important patterns of stabilityand change – resulting in the election of Donald Trump, a candidate who had neverheld any public office prior to his election. His candidacy and style of campaigningwere highly unconventional; the statements he made and the political positions hearticulated were highly controversial; and, his election to the office was, in manyways, surprising.
This article seeks to examine certain aspects of the patterns of continuity andchange in the presidential voting patterns of the American electorate – particularlyas it relates to the role of religion in American presidential politics. The largerunderlying question that this analysis seeks to address is whether the election ofTrump reflects a fundamental, long-term, shift in the coalitional basis of Americanparty politics, marking the advent of a new chapter in American politics, or whether
C. E. Smidt (�)The Henry Institute, Calvin College, 3201 Burton St. SE, Grand Rapids, MI 49546, USAE-Mail: [email protected]
K

134 C. E. Smidt
it reflects a distinctive outcome within a largely continuing and relatively stableelectoral foundation of American party politics.
1 The role of religion in american electoral behavior
Scholars have long recognized that American society is highly religious when ex-amined in comparison to most other European countries. Regardless of whether oneexamines cross-national religious differences in terms of religious beliefs, levelsof religious salience, patterns of religious affiliation, or participation in religiousactivities, Americans typically rank at the top, or near the top, of most religiouscharacteristics under examination (see, e. g., Smidt et al. 2010, table 1.1).
Because religion is so embedded within American life, it has the potential toshape American public life in a variety of ways – including its political life.1 In fact,religion serves to shape the political behavior of the American people in at leastthree different ways.
First, given its relative importance, religion has long served as “a fundamentalcategory of identity and association” (Warner 1993, p. 1059). As a result, religionshapes patterns of social interaction and perception among the American peoplethat, in turn, serve to color their political preferences, mold their partisan identi-ties, and affect their voting decisions. Religious affiliation has historically been themost important way by which religion shapes American electoral politics, as one’sreligious group or faith tradition has largely served as the basis for one’s party af-filiation and vote choice.2 However, because there are so many different religiousdenominations operating within American life,3 scholars have employed differentclassification schemes by which to make these affiliations more manageable for pur-poses of analyses. Over the past several decades, scholars have increasingly used theconcept of religious tradition to classify adherents based on their denominationalaffiliation (Layman 2001, p. 60),4 with respondents typically being placed within
1 The notion of public life entails both civic and political life. For an analysis of the role of religion inAmerican civic life, see Smidt et al. (2008) and Putnam and Campbell (2010).2 Obviously, factors other than religion can also shape and color partisan preferences and voting decisions.Race and ethnicity, gender, marital status, education, can all do so in the American context. However,even with regard to these other factors, religion still operates to affect these preferences and decisions. Inother words, though Latino and white voters differ in terms of their voting preferences, Latinos affiliatedwith evangelical Protestant denominations differ in their voting preference from Latinos affiliated with theRoman Catholic Church.3 Though the precise number varies, there are more 300 denominations which operate within Americanreligious life.4 The concept of religious tradition is based on sociological affiliation. This means, for example, thatthe respondents falling within the category of evangelical Protestant are different from those who will-ingly self-classify themselves as “born again or evangelical Christians.” Though affiliation measures arefrequently equated with identity measures, they capture somewhat different segments of the Americanelectorate. For example, by affiliation, Roman Catholics cannot be classified a evangelicals, but with theidentity measure many Catholics can be found within the “born again or evangelical Christian” category.Moreover, analysts frequently treat “born again” and “evangelical” as equivalent constructs, but each termscaptures different segments of the electorate. See, for example, Smidt (2013, ch. 2).
K

The role of religion in the 2016 american presidential election 135
Table 1 Republican Presidential Voting Patterns by Religious Tradition over Time. (Source: Universityof Akron, National Surveys of Religion and Politics)
1996 (in %)(N = 4037)
2000 (in %)(N = 4004)
2004 (in %)(N = 4000)
2008 (in %)(N = 4000)
2012 (in %)(N = 2002)
Evangelical Protestants 65 70 75 72 75
Mainline Protestants 51 57 51 50 50
Black Protestants 10 7 17 5 2
Roman Catholics 44 44 50 46 50
Unaffiliated 34 38 28 27 23
Other Faith Traditions 30 35 43 41 50
one of the following categories: evangelical Protestants, mainline Protestants, BlackProtestants, Roman Catholics, the religiously unaffiliated, and a catch-all categoryof “other.” This classification scheme has been used not only because of the parsi-mony it provides, but because it has proven to be, even when controlling for othervariables, a relatively powerful predictor of many important political attitudes andbehavior (Kellstredt et al. 1996; Kohut et al. 2000; Layman and Green 2005; Guthet al. 2006; Green 2007; Smidt et al. 2010).
Table 1 presents the percentage of those within each of the major religious tradi-tions who voted for the Republican presidential candidate in each of the presidentialelections between 1996 and 2012. Clearly, members of different religious traditionstend to cast their ballots in different ways. On the one hand, evangelical Protestantsvote heavily Republican, with the percentage of their vote given to the Republicancandidate for president increasing over the time examined. Those affiliated withBlack Protestant churches have largely voted Democratic (as shown by the lowpercentages in Republican voting), particularly during the two elections in whichBarack Obama was the nominee of the Democratic Party. Likewise, the percentageof the religiously unaffiliated who report that they have voted for the Republicanpresidential candidates has, since the advent of the new millennium, declined dra-matically. On the other hand, mainline Protestants and Roman Catholics have tendedto split their vote more evenly across party lines. Part of the reason that Catholics ap-pear to split their vote more evenly is the presence of a sizable number of Hispanicswithin their ranks, as race and ethnicity, along with religion, affect voting decisions.As a result, white Catholics vote somewhat differently than either Latino Catholicsor African American Catholics. But, religious affiliation also colors the ways inwhich race and ethnicity matter, as evangelical Protestant Latinos vote differentlythan Roman Catholic Latinos and as white evangelical Protestants vote differentlythan white Roman Catholics (Smidt 2013, table 7.6).
Second, religion can foster certain constraints or parameters within which Ameri-can political life operates. And, while the vast majority of Americans favor separationof church and state, they also typically favor certain forms of religious involvementin American political life – generally differentiating in their evaluations betweenand among the political involvement of religious people, religious leaders, religiousgroups, and religious institutions – with Americans being far more supportive ofcertain, rather than other, forms of such involvement in politics.
K
136 C. E. Smidt
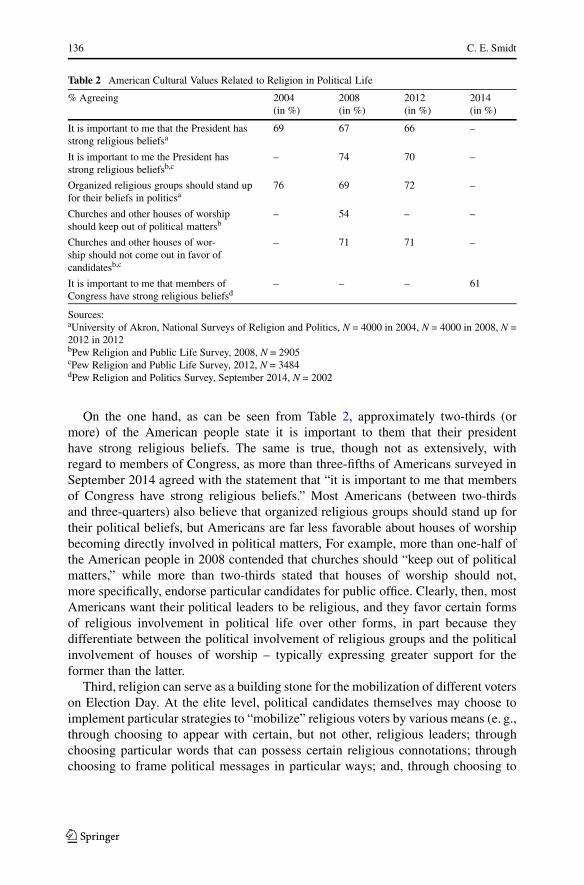
Table 2 American Cultural Values Related to Religion in Political Life
% Agreeing 2004(in %)
2008(in %)
2012(in %)
2014(in %)
It is important to me that the President hasstrong religious beliefsa
69 67 66 –
It is important to me the President hasstrong religious beliefsb,c
– 74 70 –
Organized religious groups should stand upfor their beliefs in politicsa
76 69 72 –
Churches and other houses of worshipshould keep out of political mattersb
– 54 – –
Churches and other houses of wor-ship should not come out in favor ofcandidatesb,c
– 71 71 –
It is important to me that members ofCongress have strong religious beliefsd
– – – 61
Sources:aUniversity of Akron, National Surveys of Religion and Politics, N = 4000 in 2004, N = 4000 in 2008, N =2012 in 2012bPew Religion and Public Life Survey, 2008, N = 2905cPew Religion and Public Life Survey, 2012, N = 3484dPew Religion and Politics Survey, September 2014, N = 2002
On the one hand, as can be seen from Table 2, approximately two-thirds (ormore) of the American people state it is important to them that their presidenthave strong religious beliefs. The same is true, though not as extensively, withregard to members of Congress, as more than three-fifths of Americans surveyed inSeptember 2014 agreed with the statement that “it is important to me that membersof Congress have strong religious beliefs.” Most Americans (between two-thirdsand three-quarters) also believe that organized religious groups should stand up fortheir political beliefs, but Americans are far less favorable about houses of worshipbecoming directly involved in political matters, For example, more than one-half ofthe American people in 2008 contended that churches should “keep out of politicalmatters,” while more than two-thirds stated that houses of worship should not,more specifically, endorse particular candidates for public office. Clearly, then, mostAmericans want their political leaders to be religious, and they favor certain formsof religious involvement in political life over other forms, in part because theydifferentiate between the political involvement of religious groups and the politicalinvolvement of houses of worship – typically expressing greater support for theformer than the latter.
Third, religion can serve as a building stone for the mobilization of different voterson Election Day. At the elite level, political candidates themselves may choose toimplement particular strategies to “mobilize” religious voters by various means (e. g.,through choosing to appear with certain, but not other, religious leaders; throughchoosing particular words that can possess certain religious connotations; throughchoosing to frame political messages in particular ways; and, through choosing to
K

The role of religion in the 2016 american presidential election 137
mobilize religious voters).5 Similarly, the leaders of religious interest groups mayalso choose to mobilize their members on behalf of particular candidates by issuingpublic statements on policy matters, by distributing information to their membersas a means of influencing voting decisions and policy, and by providing politicalactivists to aid party and candidate efforts to get their supporters to the polls onElection Day (e. g., Wilcox and Sigelman 2001; Guth et al. 2007).
Though religion can shape American electoral outcomes in a variety of ways, thisexamination of the role of religion in the 2016 presidential election will focus onthe ways in which members of different religious traditions voted in the most recentpresidential elections and on the way(s) in which religion affiliation has shaped, andcontinues to shape, individual decisions in choosing which presidential candidatesto support during both the presidential selection and election process. In particular,it will try to address why Donald Trump, a candidate hardly known for his personalreligiosity, won the election in large part through the substantial support providedhim by many highly religious American voters.
2 Change and continuity in american electoral politics
No presidential election starts totally afresh from the previous one, as presidentialelections are marked by a great deal of continuity. First, the relative size of majorsocial groups in the electorate does not change markedly from one election tothe next. This continuity matters because many social groups largely support oneor the other of the major political parties. For example, African Americans havelong been strong supporters of the Democratic Party and its candidates. However,the proportion of African Americans within the American electorate changes onlymarginally over a four-year period, as does the proportion of all other major socialdemographic groups in the electorate, including women, union members, and thecollege educated.
On the other hand, over a larger span in time, the social demographics of theAmerican electorate can change rather dramatically. For example, over the lasttwo decades, the percentage of whites within the American electorate has beendeclining: whites comprised 85% of the American electorate in 1988, but only 72%of the electorate in 2012 (Diggles 2013, p. 3). Thus, Democratic candidate MichaelDukakis won 40% of the white vote in the 1988 presidential election and lost theelection to Republican President George H.W. Bush by 315 electoral college votes,whereas a quarter century later, President Obama won just 39% of the white voteand defeated Republican candidate Mitt Romney by 126 electoral votes in 2012.
Likewise, the relative proportion of Americans affiliated with different religioustraditions does not change dramatically from one election to the next. Using themassive 2014 Pew Religious Landscape Survey (N = 35,701) to assess the size ofthe various religious traditions prior to the 2016 presidential election, one finds thatevangelical Protestants represent the largest bloc of religious voters, comprising one-
5 For a discussion of the four elite-driven linkages between religion and politics – namely, posturing,signaling, framing, and mobilizing – see Smidt et al. (2010, pp. 12–15).
K
138 C. E. Smidt
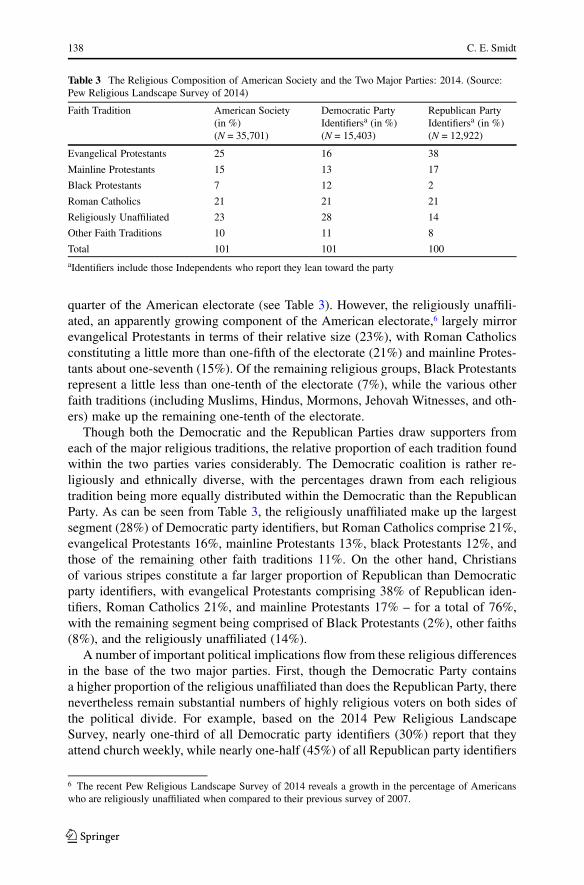
Table 3 The Religious Composition of American Society and the Two Major Parties: 2014. (Source:Pew Religious Landscape Survey of 2014)
Faith Tradition American Society(in %)(N = 35,701)
Democratic PartyIdentifiersa (in %)(N = 15,403)
Republican PartyIdentifiersa (in %)(N = 12,922)
Evangelical Protestants 25 16 38
Mainline Protestants 15 13 17
Black Protestants 7 12 2
Roman Catholics 21 21 21
Religiously Unaffiliated 23 28 14
Other Faith Traditions 10 11 8
Total 101 101 100aIdentifiers include those Independents who report they lean toward the party
quarter of the American electorate (see Table 3). However, the religiously unaffili-ated, an apparently growing component of the American electorate,6 largely mirrorevangelical Protestants in terms of their relative size (23%), with Roman Catholicsconstituting a little more than one-fifth of the electorate (21%) and mainline Protes-tants about one-seventh (15%). Of the remaining religious groups, Black Protestantsrepresent a little less than one-tenth of the electorate (7%), while the various otherfaith traditions (including Muslims, Hindus, Mormons, Jehovah Witnesses, and oth-ers) make up the remaining one-tenth of the electorate.
Though both the Democratic and the Republican Parties draw supporters fromeach of the major religious traditions, the relative proportion of each tradition foundwithin the two parties varies considerably. The Democratic coalition is rather re-ligiously and ethnically diverse, with the percentages drawn from each religioustradition being more equally distributed within the Democratic than the RepublicanParty. As can be seen from Table 3, the religiously unaffiliated make up the largestsegment (28%) of Democratic party identifiers, but Roman Catholics comprise 21%,evangelical Protestants 16%, mainline Protestants 13%, black Protestants 12%, andthose of the remaining other faith traditions 11%. On the other hand, Christiansof various stripes constitute a far larger proportion of Republican than Democraticparty identifiers, with evangelical Protestants comprising 38% of Republican iden-tifiers, Roman Catholics 21%, and mainline Protestants 17% – for a total of 76%,with the remaining segment being comprised of Black Protestants (2%), other faiths(8%), and the religiously unaffiliated (14%).
A number of important political implications flow from these religious differencesin the base of the two major parties. First, though the Democratic Party containsa higher proportion of the religious unaffiliated than does the Republican Party, therenevertheless remain substantial numbers of highly religious voters on both sides ofthe political divide. For example, based on the 2014 Pew Religious LandscapeSurvey, nearly one-third of all Democratic party identifiers (30%) report that theyattend church weekly, while nearly one-half (45%) of all Republican party identifiers
6 The recent Pew Religious Landscape Survey of 2014 reveals a growth in the percentage of Americanswho are religiously unaffiliated when compared to their previous survey of 2007.
K

The role of religion in the 2016 american presidential election 139
do so (data not shown).7 As a result, American party politics does not fully mirrorthe more highly secular-religious divide that is sometimes found in other Westerndemocratic societies.
At the same time, however, the more wide-spread distribution of religious tra-ditions within the Democratic than Republican Party has important implicationsfor Democratic presidential candidates. The greater religious diversity of the partymakes it more difficult, or at least more challenging, for Democratic than Republi-can presidential candidates to employ religiously-based language to signal, posture,or frame their political appeals or to mobilize their base on religious grounds. Fur-thermore, given the substantial number of the religiously unaffiliated within theDemocratic ranks, any such religious appeals may simply prove to be counter-pro-ductive as well.8
Finally, the partisan identifications of voters are typically rather stable. Conse-quently, the percentages of Democrats and Republicans in the electorate do not shiftmuch over a short period of time. In fact, as can be seen from Table 4, the ag-gregated distribution of partisan identifications within the United States has hardlyshifted over the past twenty years.9 And, as many voters (approximately 90%) casttheir ballots in line with their partisan identifications, the percentage of votes thatthe candidate of either major party is likely to receive falls within a certain rangegiven the distribution of these partisan identifications within the electorate.10
Nevertheless, despite these elements of continuity, there were signs that the forth-coming presidential race might well result in a change in partisan control of the pres-idency. Certainly, after eight years of Democratic control of the executive branch,the Republican Party had an excellent chance to capture the presidency. After all,only once since 1952 had any political party maintained control of the presidencyfor three consecutive terms,11 as after eight years of one party controlling the presi-dency, the prevailing sentiment tends to be that “it is time for a change.” Moreover,the 2016 presidential election marked only the second time since 1952 in which
7 The level of weekly church attendance reported among Democratic party identifiers is enhanced by theweekly attendance reported by African Americans and Hispanics. Among white, non-Hispanic Democrats,22% report they attend religious services weekly; the corresponding figures among Hispanic and AfricanAmerican Democrats is 36% and 47%, respectively. According to Michael Wear, the former director ofObama’s faith-outreach efforts, the Democratic Party is effectively composed of three major groups of rel-atively equivalent size: religiously unaffiliated people, white Christians who are largely cultural Christians,and people of color (blacks, Asians, Latinos) who are religious, (Green 2016).8 However, in the 2008 presidential election, Barack Obama and the Democratic Party did find ways inwhich to make such religious appeals and enable the party to appear less hostile toward religion in general.See Smidt et al. (2010).9 What has changed, however, is the growing alignment of ideological orientations and partisan identifica-tions, with more Republican partisan identifiers now classifying themselves as political conservative andmore Democratic party identifiers classifying themselves as liberals. (See Pew Research Center Report,June 12 2014).10 On the other hand, not all identifiers of each party turn out to vote. For example, based on the PewReligious Landscape Survey of 2007, more than one-fifth of all Democrats and Republicans reported thatthey had not voted in the previous presidential election. Obviously, being able to mobilize these partisan,but absent, voters to cast ballots in the next election either for or against some candidate can also changethe election outcome in different ways.11 This occurred when Republican captured the presidential elections of 1980, 1984, and 1988.
K

140 C. E. Smidt
Table 4 The Distribution of Partisan Identification in the United States: 1996–2012. (Source: Universityof Akron, National Surveys of Religion and Politics)
PartisanIdentifica-tion
1992(in %)(N = 4001)
1996(in %)(N = 4037)
2000(in %)(N = 4004)
2004(in %)(N = 4000)
2008(in %)(N = 4000)
2012(in %)(N = 2002)
StrongRepublican
13 14 14 19 13 13
Weak Re-publican
13 15 15 10 14 15
Independent,leaningRepublican
11 14 12 10 10 12
Independent 19 14 15 17 17 18
Independent,leaningDemocrat
12 15 13 11 10 9
WeakDemocrat
14 14 14 12 17 15
StrongDemocrat
19 15 17 21 19 18
Total 101 101 100 100 100 100
neither a sitting President nor a sitting Vice-President was a nominee of one of themajor parties – more fully equalizing the political status of the two nominees andenhancing the relative status of the candidate of the party out of power.
Second, prospects for possible Republican success in the 2016 presidential raceseemed brighter following the electoral victories that Republicans experienced inthe 2014 congressional elections. In the aftermath of these elections, Republicanscaptured full control of Congress,12 suggesting that the partisan tide was turningtoward the Republicans and that they were well poised for victory in 2016.
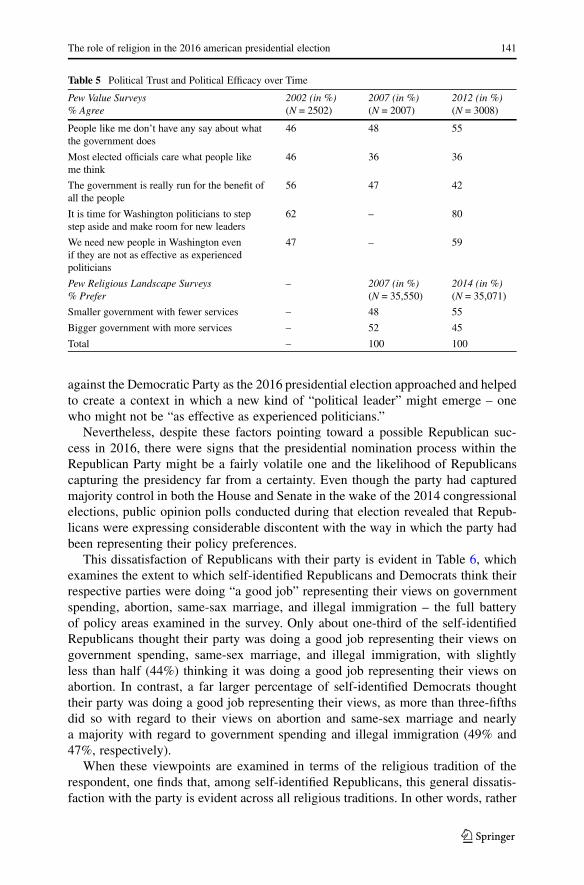
Third, over the course of the past decade, the American people had been express-ing far more anger and exasperation toward their political institutions and electedleaders and voicing a growing dissatisfaction with the way the government, particu-larly the national government, was being run. In fact, for more than a decade, mostAmericans have thought that their country was headed in the wrong, rather than theright, direction.13 And, between 2002 and 2012, there had been a rather marked in-crease in the percentage of Americans who called for new kinds of political leaders– even new leaders who might not be “as effective as experienced politicians” (seeTable 5). Finally, prior to Obama’s election in 2008, a majority of Americans (52%)expressed a preference for a larger government with more services, but, prior tothe 2016 election, an even larger majority (55%) expressed a preference for smallergovernment with fewer services (see Table 5). All these changing sentiments worked
12 In the 2014 election, Republicans achieved a net gain of 13 House seats, increasing their majority in theHouse of Representatives to 247 of the House 435 seats, while they achieved a net gain of 9 Senate seats,enabling them to hold a majority of Senate seats (54 out of 100 seats).13 See the historical trends on the question as revealed by the Gallup Polls. http://www.gallup.com/poll/1669/general-mood-country.aspx.
K
The role of religion in the 2016 american presidential election 141
Table 5 Political Trust and Political Efficacy over Time
Pew Value Surveys% Agree
2002 (in %)(N = 2502)
2007 (in %)(N = 2007)
2012 (in %)(N = 3008)
People like me don’t have any say about whatthe government does
46 48 55
Most elected officials care what people likeme think
46 36 36
The government is really run for the benefit ofall the people
56 47 42
It is time for Washington politicians to stepstep aside and make room for new leaders
62 – 80
We need new people in Washington evenif they are not as effective as experiencedpoliticians
47 – 59
Pew Religious Landscape Surveys% Prefer
– 2007 (in %)(N = 35,550)
2014 (in %)(N = 35,071)
Smaller government with fewer services – 48 55
Bigger government with more services – 52 45
Total – 100 100
against the Democratic Party as the 2016 presidential election approached and helpedto create a context in which a new kind of “political leader” might emerge – onewho might not be “as effective as experienced politicians.”
Nevertheless, despite these factors pointing toward a possible Republican suc-cess in 2016, there were signs that the presidential nomination process within theRepublican Party might be a fairly volatile one and the likelihood of Republicanscapturing the presidency far from a certainty. Even though the party had capturedmajority control in both the House and Senate in the wake of the 2014 congressionalelections, public opinion polls conducted during that election revealed that Repub-licans were expressing considerable discontent with the way in which the party hadbeen representing their policy preferences.
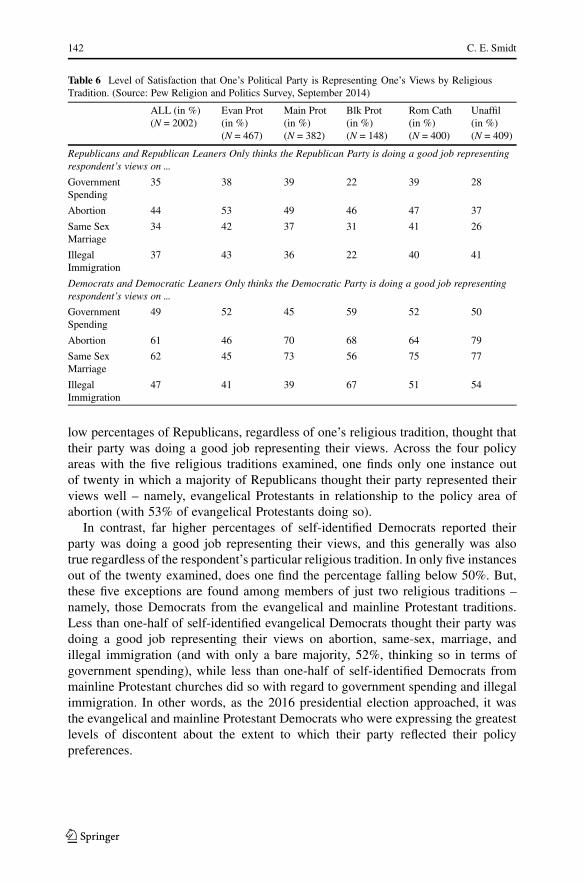
This dissatisfaction of Republicans with their party is evident in Table 6, whichexamines the extent to which self-identified Republicans and Democrats think theirrespective parties were doing “a good job” representing their views on governmentspending, abortion, same-sax marriage, and illegal immigration – the full batteryof policy areas examined in the survey. Only about one-third of the self-identifiedRepublicans thought their party was doing a good job representing their views ongovernment spending, same-sex marriage, and illegal immigration, with slightlyless than half (44%) thinking it was doing a good job representing their views onabortion. In contrast, a far larger percentage of self-identified Democrats thoughttheir party was doing a good job representing their views, as more than three-fifthsdid so with regard to their views on abortion and same-sex marriage and nearlya majority with regard to government spending and illegal immigration (49% and47%, respectively).
When these viewpoints are examined in terms of the religious tradition of therespondent, one finds that, among self-identified Republicans, this general dissatis-faction with the party is evident across all religious traditions. In other words, rather
K
142 C. E. Smidt
Table 6 Level of Satisfaction that One’s Political Party is Representing One’s Views by ReligiousTradition. (Source: Pew Religion and Politics Survey, September 2014)
ALL (in %)(N = 2002)
Evan Prot(in %)(N = 467)
Main Prot(in %)(N = 382)
Blk Prot(in %)(N = 148)
Rom Cath(in %)(N = 400)
Unaffil(in %)(N = 409)
Republicans and Republican Leaners Only thinks the Republican Party is doing a good job representingrespondent’s views on ...
GovernmentSpending
35 38 39 22 39 28
Abortion 44 53 49 46 47 37
Same SexMarriage
34 42 37 31 41 26
IllegalImmigration
37 43 36 22 40 41
Democrats and Democratic Leaners Only thinks the Democratic Party is doing a good job representingrespondent’s views on ...
GovernmentSpending
49 52 45 59 52 50
Abortion 61 46 70 68 64 79
Same SexMarriage
62 45 73 56 75 77
IllegalImmigration
47 41 39 67 51 54
low percentages of Republicans, regardless of one’s religious tradition, thought thattheir party was doing a good job representing their views. Across the four policyareas with the five religious traditions examined, one finds only one instance outof twenty in which a majority of Republicans thought their party represented theirviews well – namely, evangelical Protestants in relationship to the policy area ofabortion (with 53% of evangelical Protestants doing so).
In contrast, far higher percentages of self-identified Democrats reported theirparty was doing a good job representing their views, and this generally was alsotrue regardless of the respondent’s particular religious tradition. In only five instancesout of the twenty examined, does one find the percentage falling below 50%. But,these five exceptions are found among members of just two religious traditions –namely, those Democrats from the evangelical and mainline Protestant traditions.Less than one-half of self-identified evangelical Democrats thought their party wasdoing a good job representing their views on abortion, same-sex, marriage, andillegal immigration (and with only a bare majority, 52%, thinking so in terms ofgovernment spending), while less than one-half of self-identified Democrats frommainline Protestant churches did so with regard to government spending and illegalimmigration. In other words, as the 2016 presidential election approached, it wasthe evangelical and mainline Protestant Democrats who were expressing the greatestlevels of discontent about the extent to which their party reflected their policypreferences.
K
The role of religion in the 2016 american presidential election 143
3 Religion and the campaigns to capture the party nomination
Perhaps it was the anticipation of likely Republican success in the 2016 presidentialelection that prompted so many Republicans to announce their candidacy for theoffice. The number of announced Republican aspirants was exceedingly large –17 candidates in all. Not only was this large number of candidates highly unusual,but the Republican Party also chose to inaugurate a substantial number of candidatesdebates well before the first presidential primary in New Hampshire on February 9,2016. These debates started on August 6, 2015, with a record audience viewing thefirst debate (Flint 2015) and with a total of eight televised debates being held prior tothe New Hampshire primary.14 Given the finite amount of time that could be devotedto any debate and the large number of Republican candidates, certain difficultiesresulted in relationship to holding these debates.15 And, the large numbers alsocreated difficulties for the candidates themselves – specifically in terms of receivingpersonal media coverage and getting their particular messages heard. Moreover,by the time of the New Hampshire primary, only five Republican candidates hadwithdrawn from the race, leaving an unusually large number of 12 Republicancandidates still competing for the nomination.16
On the other hand, even though President Obama was constitutionally prohib-ited from seeking re-election and Vice-President Biden did not choose to seek thenomination of the Democratic Party, very few Democrats announced their candi-dacy for the office of President, with only two Democratic candidates remainingby the time of the first presidential primary – Hillary Clinton and Bernie Sanders.17
Moreover, Sanders was largely an outsider to the Democratic Party – initially be-
14 The Republican Party had held 5 nationally televised debates in 2015, with an additional three televiseddebates in early 2016, for a total of 8 televised debates prior to the New Hampshire primary on February 9,2016.15 These difficulties entailed: (a) the need to limit the number of candidates present on stage for thesedebates, (b) the need to establish criteria for selecting which candidates were to be selected for the prime-time, and which for the less than prime-time, debates, and (c) and the limited number of questions thatcould be directed toward each of the candidates. Given the large number of candidates, a two-tiered systemof debates was employed initially, with those candidates exhibiting the lowest percentages of support byRepublican party identifiers being grouped together in one debate prior to and those with higher levels ofsupport whose debate occurred during “prime time” in terms of potential audience size. Even with the two-tiered system, the large numbers of responses given to each question meant less time that could be devotedto additional questions.16 The announced list included: Jeb Bush, Ben Carson, Ted Cruz, John Kasich, Jim Gilmore, Marco Rubio,Donald Trump, Rick Perry, Scott Walker, Bobby Jindal, Lindsey Graham, George Pataki, Mike Huckabee,Rick Santorum, Rand Paul, Carley Fiorina, and Chris Christie. Only Pataki, Graham, Jindal, Walker, andPerry had withdrawn from the race prior to the first presidential primary in early February, 2016. In con-trast, in 2008, the total number of announced Republican candidates was 12, with only six candidatescompeting by the advent of the first presidential primary in early February 2008. In contrast, in the lastpresidential election following eight years of Democratic control of the presidency (i. e., the 2000 presi-dential election), there had been 13 announced candidates initially, but only five candidates remained inthe race by the time of the New Hampshire primary.17 Lincoln Chaffee, Jim Webb, and Martin O’Malley participated, along with Hillary Clinton and BernieSanders, in the first Democratic presidential debate held on October 13, 2015, but only Clinton and Sandersremained in the race and participated in the fifth Democratic presidential debate held on February 4, 2016,five days before the New Hampshire primary.
K

144 C. E. Smidt
ing elected mayor of Burlington, Vermont, as a socialist, and then elected to theSenate as an Independent – while Clinton had become, over the previous severaldecades, a nationally recognized political figure who was a well-entrenched withinthe Democratic Party.
4 Perceived candidate religiosity
It has usually been advantageous within American politics to be perceived as be-ing religious, as evaluations about the religiosity of candidates shape the extent towhich candidates are viewed favorably (Smidt et al. 2010, p. 80). These perceptionsof religiosity are colored by the partisan identifications of the respondent. But, evenafter controlling for these identifications, the patterns remain consistent: the greaterthe perception of being religious, the more likely respondents report favorable eval-uations of the candidates; and these effects enjoy their greatest advantage amongthose who do not identify with the candidate’s political party (Smidt et al. 2010,pp. 81–83).
Not surprisingly, voters tend to be somewhat less informed about the religiouscharacteristics of candidates during the early months of a presidential campaign;still, they are not totally uniformed about the matter either. And, so when Americanswere asked at the beginning of 2016 about their perceptions of the religiosity of thevarious candidates competing for the presidency (see Table 7),18 nearly two-thirdsof all Americans reported that they perceived Cruz and Rubio to be either somewhator very religious, with nearly one-quarter responding that they did not really knowanything about the religiosity of either candidate. On the other hand, only about one-half of Americans (48%) indicated that they thought Clinton was somewhat or veryreligious, with nearly an equivalent percentage reporting they thought she was either“not too” or “not at all” religious. Few Americans, however, viewed either Trumpor Sanders as being very religious (only 5% did so). But many more Americans feltthey were better able to evaluate the religiosity of Trump than Sanders, and, in sodoing, a full three-fifths of all Americans reported that they viewed Trump as notbeing very religious.
Party identifiers generally perceive their party’s candidates as being more religiousthan those who do not identify with the party. And these patterns are also evidentin Table 7, as Democrats viewed Clinton and Sanders to be more religious than didRepublicans, and Republicans viewed Cruz, Rubio, and Trump to be more religiousthat did Democrats. Still, even after controlling for the partisan identifications of therespondents, Democrats still viewed Cruz and Rubio to be more religious than theyviewed either Clinton or Sanders to be. And, while Republicans viewed Trump to bemore religious than did Democrats, far more Republicans viewed Trump to be “nottoo” or “not at all” religious than viewed him to be religious. In other words, while
18 Given the large number of candidates running at the time of the survey, I have arbitrarily limited myanalysis of candidates to the two major Democratic candidates and three major Republican candidates:Cruz, Rubio, and Trump.
K

The role of religion in the 2016 american presidential election 145
Table 7 Perceptions of the Religiosity of Presidential Candidates. (Source: Pew Research Center,January 16, 2016 survey)
Very Reli-gious(in %)
SomewhatReligious(in %)
Not Too/ Not atAll Religious(in %)
Don’tKnow(in %)
Total(in %)
(N)
All respondents
Clinton 10 38 43 9 100 (N = 2009)
Sanders 5 34 35 26 100 (N = 2009)
Cruz 25 40 12 22 99 (N = 2009)
Rubio 16 46 13 26 101 (N = 2009)
Trump 5 25 60 10 100 (N = 2009)
Self-identified Democrats
Clinton 14 51 27 8 100 (N = 593)
Sanders 6 41 31 22 100 (N = 593)
Cruz 25 37 15 22 99 (N = 593)
Rubio 15 45 14 26 100 (N = 593)
Trump 5 15 71 9 100 (N = 593)
Self-identified Republicans
Clinton 6 21 65 7 99 (N = 538)
Sanders 5 26 44 25 100 (N = 538)
Cruz 30 46 7 17 100 (N = 538)
Rubio 20 50 11 19 100 (N = 538)
Trump 5 39 47 9 100 (N = 538)
partisan identifications may serve to color perceptions of a candidate’s religiosity,they do not necessarily fully distort them.19
5 Religion and perceived candidate favorability
The extent to which Americans expressed favorable ratings of Hillary Clinton haddeclined since she had served as the First Lady. As seen in Table 8, nearly three-fifthsof all Americans (59%) evaluated her favorably in the early 1990s, but less than one-half (47%) did so in September 2015. Moreover, this decline in favorability occurredacross each of the major religious traditions, but particularly so among evangelicaland mainline Protestants.
Nevertheless, despite Clinton’s overall negative evaluations, her favorability rat-ings were still more positive than those received at the same time by Ted Cruz, MarcoRubio, and Donald Trump (see Table 8), as only a little more than one-quarter (Cruz)to a little more than one-third (Rubio) of all Americans expressed favorable views
19 Unfortunately, the Pew survey from which Table 7 is drawn did not ask respondents whether they heldfavorable assessments of the various candidates. Instead they asked their assessments of the extent to whichsuch candidates might make a great, good, fair, or poor president. Though related, the two assessments areanalytically distinct, as one can have a favorable assessment of a candidate yet think such a person wouldnot necessarily make a great president.
K

146 C. E. Smidt
Table 8 Level of Favorable Overall Opinion of Selected Candidates by Religious Tradition. (Source:Public Religion Research Institute 2015 American Values Survey, September)
ALLa
(in %)(N = 2695)
Evan Prot(in %)(N = 559)
Main Prot(in %)(N = 587)
Blk Prot(in %)(N = 238)
Rom Cath(in %)(N = 517)
Unaffil(in %)(N = 520)
Among all respondents
1994–95 (Pew Religion and Politics)
Hillary Clinton 59 48 58 83 62 63
2015 – September
Hillary Clinton 47 29 39 80 55 56
Bernie Sanders 52 33 45 51 45 75
Ted Cruz 28 43 32 15 38 9
Marco Rubio 37 47 43 23 46 16
Donald Trump 32 47 39 16 33 19
Among self-identified Democrats only
Hillary Clinton 80 78 73 86 79 81
Bernie Sanders 67 62 67 50 52 87
Among self-identified Republicans only
Ted Cruz 51 51 57 b 52 36
Marco Rubio 64 57 73 b 66 73
Donald Trump 58 64 57 b 55 54aN’s listed are for the 2015 American Values SurveybN = less than 10
of these three major Republican candidates. Once again, the favorability ratings ofthe three Republican candidates also varied considerably by religious tradition, withevangelical Protestants giving the highest and the religiously unaffiliated the lowestlevels of favorability ratings for each Republican candidate.
When one shifts the analysis from Americans as a whole to how members ofeach major political party evaluated the candidates of their party, such favorabilityratings change. Clinton’s favorability ratings among self-identified Democrats weremore positive than Sanders (80% favorable vs. 67% favorable, respectively), withevangelical Protestant, Black Protestant, and Roman Catholic Democrats being farmore favorable of Hillary Clinton than Bernie Sanders. And, while the religiouslyunaffiliated were highly favorable of both Clinton and Sanders, they were somewhatmore favorable of Sanders than Clinton. Overall, Clinton’s favorability ratings amongDemocrats varied modestly across the various religious traditions (a 13% difference),whereas Sanders’ evaluations varied far more greatly (a 37% difference).
Republicans at the time were far less enamored with their candidates than were theDemocrats. Among self-identified Republicans, Marco Rubio received the highestoverall favorability rating (64%), followed by Trump (58%) and then Cruz (51%).These favorability ratings also varied across the religious tradition of which theRepublican respondents were a part. But, overall, however, the favorability ratingsexpressed by Republicans varied only modestly across religious traditions, withTrump’s ratings varying the least (a 10% difference) and Cruz’s the greatest (a 19%
K
The role of religion in the 2016 american presidential election 147
difference), in large part because of relatively low favorability rating Cruz receivedamong religiously unaffiliated Republicans.
6 Religion and candidate preference
During the early months of the campaign, Donald Trump made a number of highlycontroversial statements that captured significant media attention.20 These statementswere not only at odds with the organizational efforts of the Republican Party toexpand the party’s base in the wake of the growing racial and ethnic diversity ofthe American electorate,21 but they violated “standards of political correctness” andoffended segments of the population whose votes Republicans would seemingly needif they wished to capture the White House. On the other hand, these controversialstatements enabled Trump to dominate media attention and crowd out coverage of theother Republican candidates, with the media willingly providing Trump considerablefree time of campaign coverage. As noted by Leslie Moonves, the CEO of CBStelevision, “It may not be good for America, but it’s damn good for CBS ... I’venever seen anything like this, and this is going to be a very good year for us. Sorry.It’s a terrible thing to say. But, bring it on Donald. Keep going” (Bond 2016).
During the early stages of the nomination process, candidate preferences amongRepublican voters remained widely split among the numerous Republican candi-dates. Certainly, Trump was a widely-recognized figure, and, with 30% citing himas their preferred candidate, he led the field in being the most widely preferredcandidate among Republican voters (data not shown).22
Yet, even without his controversial statements and somewhat bullish demeanor atthe Republican debates, Trump hardly constituted the type of political leader thatwould attract the votes of the Republican Party’s religious base. Currently marriedto his third wife, Trump was reticent to talk about his religious faith (Burke 2016).When asked to cite his favor Bible verse, he declined to do so; nor did he appear tobe an active member of the Presbyterian church he claimed to attend (Taylor 2016).And, though he believes in God, Trump does not remember ever asking God forforgiveness (Scott 2015).
Certainly, in these early stages of the campaign, Trump was far from the preferredchoice among weekly church-attending Republicans – and this was true regardlessof one’s religious tradition. As shown in Table 9, weekly church-attending, evan-
20 Among these controversial statements were the following: he called for banning immigrants based ontheir religious beliefs; he promised to build a wall between Mexico and the United States and to deport12 million people who had entered the US illegally; he contended that a judge could not do his job due tohis ethnicity; he childishly attacked his Republican opponents’ wives; and, he spread unfounded conspiracytheories about his primary opponents.21 In the wake of its loss in the presidential election of 2012, the Republican National Committee, and itsChairman Reince Priebus, laid out a plan for extensive outreach to women, Hispanic, and African Amer-ican voters. See http://abcnews.go.com/Politics/OTUS/rnc-completes-autopsy-2012-loss-calls-inclusion-policy/story?id=18755809 Accessed Dec. 15, 2016.22 This figure was obtained from the Public Religion Research Institute’s American Values Survey of 2015,conducted September 11 to October 4, 2015.
K

148 C. E. Smidt
Table 9 Presidential Candidate Choice within Each Political Party by Level of Church Attendance andControlling for Religious Tradition. (Source: Public Religion Research Institute 2015 American ValuesSurvey, September)
Evan. Prot.Monthlyor less(in %)(N =241)
Evan.Prot.Weekly(in %)(N =317)
Main.Prot.Monthlyor less(in %)(N =462)
Main.Prot.Weekly(in %)(N =125)
Blk. Prot.Monthlyor less(in %)(N =127)
Blk.Prot.Weekly(in %)(N =109)
Rom.Cath.Monthlyor less(in %)(N =339)
Rom.Cath.Weekly(in %)(N =178)
Democrats: Preferred Choice
Clinton 63 48 50 36 65 72 54 48
Sanders 16 18 23 31 13 8 18 9
Other 22 34 27 44 23 20 28 43
Total 101 100 100 100 101 100 100 100
Republicans: Preferred Choice
Cruz 5 10 3 4 a a 3 9
Rubio 6 7 9 28 a a 9 14
Trump 44 25 32 19 a a 31 19
Other 44 59 56 50 a a 57 58
Total 99 101 100 101 a a 100 100aLess than 10 respondents
gelical Republicans were far less supportive of Trump than evangelical Republicanswho attended church far less regularly, as too were Republicans from the mainlineProtestant and Roman Catholic faith traditions.23
In most of the early primaries, Trump captured only about one-third of the Re-publican primary votes. But, with the large number of Republican candidates stillcompeting for the nomination, his vote totals enabled him to claim victory in theseprimaries, since no other candidate could attain a similar level of support. And,with the party’s largely “winner-take-all” allocation of delegates to their nominatingconvention,24 Trump won delegates to the Republican convention out of proportionto the votes he received.25
23 The effects of church attendance on candidate preference was not limited to the Republican Party. Levelof reported church attendance also shaped the ways in which Democrats expressed preferences for HillaryClinton, with weekly church-attending Democrats generally expressing less support for her candidacythan co-religionists who attended less frequently. Only among Black Protestants did weekly-churchingrespondents express higher support for the Clinton candidacy than did their co-religionists who attendedchurch less frequently.24 In contrast to the Democratic Party, the Republican Party does not allocate delegates on a propor-tional basis of the votes received in the primary election. In most states, the winner of the primary getseither all of the delegates of the state or all of the delegates within a congressional district by carry-ing the state or the congressional district. See, for example, http://www.realclearpolitics.com/epolls/2016/president/republican_delegate_count.html.25 Of all votes casts in the 2016 Republican presidential primaries, Trump received 44% of all votes cast– with his vote totals expanding in later primaries as other candidates began dropping out the race. Hesecured 62% of all the delegates (with some of these delegates being secured in states that did not holdprimaries). With about 30% of Americans expressing Republican partisan identifications, and assumingthat about 40% of the party’s base turn out to cast votes in these presidential primaries, Trump captured
K
The role of religion in the 2016 american presidential election 149
In the wake of his controversial statements and early primary victories, “estab-lishment” Republicans began to be concerned about the damage that Trump mightdo to the future of the Republican Party, not only as a candidate but particularlyso as its possible nominee. As a result, a number of Republican officials began tospeak out against Trump and sought to create momentum among the party’s baseand office-holders to be “Never Trump” Republicans.26 Nevertheless, in the end,Trump secured the largest vote total of any Republican in presidential primary his-tory, though a record number of votes were also cast against him – making him oneof the few eventual nominees of the party ever to receive less than half of the votescast in the party’s primary (Bump 2016).
Trump largely cruised to the nomination, pushing aside all other Republican can-didates in his wake, but the same was not true with regard to Clinton in capturingthe Democratic nomination. Even though she was the presumptive nominee of theparty, Clinton had difficulty securing sufficient primary votes to eliminate Sandersas a rival for the nomination. In fact, Clinton actually secured more primary votesin 2008 when she lost the nomination than she did in 2016 (Bump 2016). And,despite all her qualifications and long history in the parry, Sanders won just aboutas many delegates as Clinton in the primary process, as Democrats award delegateson a proportional voting basis. Consequently, were it not for the presence of the so-called “superdelegates”27 who were overwhelmingly pledged to Clinton, the Demo-cratic national convention might very well have had a contested roll call vote –one in which negotiations at the convention between the candidates and particulardelegates would have determined the ultimate outcome.
Clearly, in the end, both “outside” candidates (Trump and Sanders) did extremelywell in the presidential primaries, suggesting that there was considerable discontentwithin the electorate with “politics as usual.” But, given the differences in party rulesgoverning the nomination process – proportional allocation of delegates and thepresence of superdelegates for the Democratic Party and a combination of differentstate-level “winner-take-all” allocations in the Republican Party without the presenceof any superdelegates – Hillary Clinton was able to turn back her challenge to thenomination whereas the Republican “establishment” was unable to turn back thechallenge of Donald Trump in securing the party’s nomination.
the Republican nomination by winning the support of just 5.3% of the American electorate (0.30 × 0.40 ×0.44 = 0.0528).26 The “Never Trump” campaign was the informal name given to the concerted effort on the part of someRepublicans and other prominent conservatives to prevent Donald Trump from obtaining the party’s pres-idential nomination. The effort gained momentum following the “Super Tuesday” primaries when Trumpscored seven victories across the nine state presidential primaries hold on March 15, 2016.27 Democratic party rules specify that all sitting Democratic governors, U.S. Senators, and Congressmenserve as delegates to the national convention, as do certain “distinguished party leaders” (e. g., current andformer presidents and vice presidents, retired House and Senate Democratic leaders). Finally, all membersof the Democratic National Committee, as well as the chairs and vice chairs of each state’s DemocraticParty organization also serve as delegates to the national convention. In 2016, superdelegates accountedfor approximately 15% of all delegates to the Democratic national convention. See Desilver (2016).
K
150 C. E. Smidt
7 Religion and the general election campaign
As the Republican Party’s nominee for President, Donald Trump was clearly a veryunusual and controversial candidate. Between August 2001 and September 2009,he was a registered Democrat in New York (Peoples 2016), and several years be-fore his presidential bid, he indicated to CNN that he “probably identified moreas a Democratic” (Lasky 2015) Moreover, he was the first candidate in the pastseventy-five years to capture the nomination of his party without ever having heldpublic office (the last being Wendell Willkie in 1944). Trump was hardly a socialconservative in a party that attracted social conservatives, and he was hardly a fiscalconservative in a party that touted fiscal conservatism. Furthermore, he seemed tobe the very antithesis of a candidate who would appeal the single largest componentof the Republican coalition – namely, evangelical Christians. And, as the nomineeof the Republican Party, he exhibited the highest negative rating of any major partycandidate in polling history (Saad 2016).
As the Democratic Party’s nominee, Hillary Clinton was the first female nomi-nated by a major political office for the office of President. As the wife of formerPresident Bill Clinton, a former U.S. Senator from New York, and former Secretaryof State under President Obama, Clinton clearly possessed far more political expe-rience than Trump. However, during her candidacy for president, public revelationswere made about the fact that she chose to use a private email server during hertenure as Secretary of State and that she continued to do so despite warnings relatedto such use (Calabresi 2016; Bradner 2016) To make matters worse, she first choseto downplay what she had done, and then in the wake of the continuing controversyabout her use of the server, she issued differing public iterations of what she haddone. Moreover, further controversy surrounded her tenure as Secretary of State asto whether she may have used her office to fill the coffers of the Clinton Founda-tion. As a result, by the time the Democratic Convention opened, two-thirds of theAmerican people (68%) believed she was neither honest or trustworthy (Angiesta2016).
Though Clinton’s favorability ratings had declined since she left her office asSecretary of State (Newport 2016), these new revelations only further eroded herfavorability ratings. As can be seen in Table 10, a majority of Americans (51%)reported negative rating of Clinton in early November 2015, but a half year later aneven larger percentage of Americans did so (57%), with the percentage expressingpositive ratings dropping from 46–41%. In fact, had Trump not been the nomineeof the GOP, she would have exhibited the highest negative rating of any major partynominee in polling history.
Given the two nominees of the major parties, the campaign narratives were honedaccordingly. Trump’s campaign message emphasized that he represented changefrom the failed policies of the Obama administration, while Clinton’s emphasizedthat she was the qualified and competent candidate who could be trusted to handlethe powers associated with the Office of the President. Though each narrative hadits particular strength, each had important weaknesses. For Clinton, the underlyingmessage was that she represented continuity and more of the same – a third term for
K

The role of religion in the 2016 american presidential election 151
Table 10 Favorability Rating of Clinton and Trump over Time. (Source: ABC/Washington Post surveys,http://www.realclearpolitics.com/epolls/other/president/clintontrumpfavorability.html)
Hillary Clinton Donald Trump
Positive Negative Positive Negative
November 4–8, 2015 46 51 38 59
January 6–10, 2016 48 49 35 62
March 3–6, 2016 46 52 30 67
May 16–19, 2016 41 57 40 57
June 8–12, 2016 43 56 31 69
July 11–14, 2016 40 57 34 62
August 1–4, 2016 46 52 36 61
August 24–28, 2016 38 59 37 60
September 19–22, 2016 39 57 38 57
September 28–30, 2016 43 55 37 61
October 10–13, 2016 42 56 37 62
October 26–29, 2016 38 60 39 58
November 2–5, 2016 42 56 38 60
the present occupant of the office. For Trump, the underlying concern was whetherhe represented too much change or even a risky kind of change.
Despite the wariness that many evangelical leaders had expressed about the Trumpcandidacy,28 most evangelical voters had, by the time of the Republican Convention,largely rallied to his side. Trump’s level of support among white evangelical votersin July was similar to that which Romney had enjoyed at the time of RepublicanConvention in the 2012 presidential election – with 78% reporting that they werelikely to vote for Trump in November (Pew Research Center Report, July 13 2016).This support for Trump among evangelicals was not based on any enthusiasm theyhad for the candidate, as a majority of white evangelicals (55%) expressed dissat-isfaction with the resulting choice of presidential candidates provided by the twomajor parties (Pew Research Center Report, July 13 2016).
Moreover, evangelical Protestants, in particular, preferred a candidate who hadnot served in Washington, D.C (see Table 11). At the beginning of 2016, nearlyone-third of all Americans (31%) indicated that they would be less likely to supporta candidate for president if he/she had already served as an elected official. But,nearly one-half (45%) of all white evangelical Protestants did so, as did nearly two-fifths of mainline Protestants (38%). Clearly, given these sentiments, evangelical andmainline Protestants would be far more likely than those affiliated with other faithtraditions to find Trump’s lack of national political experience appealing.
Still, other aspects of Trump’s life seemingly worked against his appeal amongevangelical and mainline Protestants. As shown in Table 11, evangelical Protestantswere far more likely than those affiliated with other religious traditions to say inJanuary of 2016 they would be less likely to vote for a candidate for president if that
28 Though there some evangelical leaders opposed Trump earlier in the nomination process, many moreevangelical leaders openly opposed Trump during the election campaign – particularly after the 2005 videosurfaced of his bragging about his sexual exploits. See Posner (2016) and Derrick (2016).
K

152 C. E. Smidt
Table 11 Acceptance of Politicians’ Personal Characteristics by Religion over Time
2011 (in %)(N = 1066)
2016 (in %)(N = 1034)
% Less likely to support a candidate for president who had been an elected official in Washington formany yearsa
All Americans – 31
Evangelical Protestant – 45
Mainline Protestant – 38
Roman Catholic – 16
Black Protestant – 26
Religiously Unaffiliated – 28
% Less likely to support a candidate for president who had an extramarital affair in the pasta
All Americans – 38
Evangelical Protestant – 51
Mainline Protestant – 38
Roman Catholic – 26
Black Protestant – 42
Religiously Unaffiliated – 26
% Agree that an elected official who commits an immoral act in their personal life can still behave ethi-cally and fulfill their duties in public and professional lifeb
All Americans 44 61
Evangelical Protestant 30 72
Mainline Protestant 38 60
Roman Catholic 42 58
Religiously Unaffiliated 63 60aSource: Pew Research Center, January 16, (2016 survey)bSources: Public Religion Research Institute/Religious News Survey of June 2011, and Public Religion Re-search Institute/Brookings Survey of October 2016. The reported data are taken directly from the report is-sued. See http://www.prri.org/research/prri-brookings-oct-19-poll-politics-election-clinton-double-digit-lead-trump/
person had had an extramarital affair in the past. Since Trump had bragged abouthaving sex with multiple married women, one might expect that these acknowledgedsexual indiscretions might serve as a possible barrier to Trump winning the samelevel of support from the party’s religious base that previous Republican nomineeshad received. In addition, just a couple weeks before Election Day, a 2005 videosurfaced of Trump boasting about his sexual predations, with a number of womensubsequently coming forward to accuse him of sexual assault and leading a numberof evangelical leaders to publicly abandon their support of Trump (Posner 2016).
Yet, as Election Day approached, a new survey revealed that evangelical Protes-tants were far more willing than others to agree that someone who had committed animmoral act in their personal life could, nevertheless, still behave ethically and fulfillthe duties of their office in public life: whereas about 60% of those affiliated withthe other large religious traditions agreed accordingly, 72% of evangelical Protes-tants did so. Whether this “discrepancy” between the responses given to extramaritalaffairs in January and those given to immoral acts in October represented a majorchange in perspective over the nine months or was simply the result of employing
K

The role of religion in the 2016 american presidential election 153
a different, though related, question is unclear. What is clear, however, is that per-spectives expressed by evangelicals in October 2016 were far different from thoseexpressed by evangelicals only five years earlier, as in 2011, only 30% of evan-gelicals had responded accordingly – a remarkable shift in their assessment overa relatively short period of time.29 Mainline Protestants and Roman Catholics alsoexhibited a similar change in perspective, but their shift was not nearly as dramatic;only the religiously unaffiliated exhibited relative continuity in their assessments, as63% agreed with the statement in 2011 and 60% did so in late 2016.30
8 Religion and the election outcome
Though these shifts in perspective did not cause Trump to be elected, they certainlyhelped to facilitate his election. And, perhaps somewhat surprisingly given the veryunusual nature of the 2016 election campaign, the 2016 presidential exit pollingresults31 revealed that the voting patterns of those affiliated with the major Americanreligious traditions basically reflected their past voting patterns – with the politicalalignment of the major religious traditions – and the strength of those alignments –largely remaining unchanged.
Historically, Protestants, and more particularly mainline Protestants, have servedas the religious bulwark of the coalition of voters supporting Republican presidentialcandidates (Kellstedt et al. 2007). However, between 1940 and 2004, voting forGOP presidential candidates dropped among mainline Protestants, while evangelicalProtestants, who were largely Democratic in their partisan identification until thelate 1970s, had become since the 1984 election the strongest supporters of GOPcandidates (Kellstedt et al. 2007, pp. 271–275).
Unfortunately, because of the way in which the questions are asked in exit polls, itis impossible to differentiate clearly between the voting patterns of evangelical andmainline Protestants from these data. Although these polls ask Christian respon-dents whether they consider themselves to be either a “born-again or evangelicalChristian,”32 the resulting group includes not only Protestants, but Catholics, Mor-mons, and any other voter who claims to be a Christian and responds affirmativelyto the question (Smith and Martinez 2016). Hence, the percentages reported in thelower portion of Table 12 concerning white, born-again or evangelical Christianscannot be directly compared to figures reported in earlier tables related to evangeli-
29 Given the fact that some Christians have come to the conclusion that America now represents a “post-Christian” culture, perhaps some evangelicals simply came to believe that neither major candidate wasnecessarily a “Christian” candidate and felt less constrained to vote against Trump simply on religiousgrounds.30 Though one may be tempted to attribute such changes to allowing one’s partisanship to override one’sprinciples, the data do not permit such a conclusion. It is unclear just when during the campaign season,this shift in perspective occurred.31 I am writing the remaining portions of this article in late December 2016. Since most national polls willnot be released for scholarly analysis for at least several more months, I must rely on reported results ofthe exit poll conducted on Election Day.32 See footnote 4.
K

154 C. E. Smidt
Table 12 Presidential Vote by Religious Affiliation and Race over Time: Exit Polls. (Source:http://www.pewresearch.org/fact-tank/2016/11/09/how-the-faithful-voted-a-preliminary-2016-analysis/)
2004 2008 2012 2016
Dem.in(%)
Rep.in(%)
Dem.in(%)
Rep.in(%)
Dem.in(%)
Rep.in(%)
Dem.in(%)
Rep.in(%)
Protestant 40 59 45 54 42 57 39 58
Catholic 47 52 54 45 50 48 45 52
White Catholic 43 56 47 52 40 59 37 60
Hispanic Catholic 65 33 72 26 75 21 67 26
Jewish 74 25 78 21 69 30 71 24
Other Faiths 74 23 73 22 74 23 62 29
Religious Unaffili-ated
67 31 75 23 70 26 68 26
White, born-againor evangelicalChristiana
21 78 24 74 21 78 16 81
a“White, born-again or evangelical Christian” includes both Protestants and non-Protestants (e. g.,Catholics, Mormons, etc.) who self-identify as born-again or evangelical Christians
cal Protestants. Nevertheless, since this question format for identifying “born-againor evangelical” Christians has been used in previous exit polls, one can compare theresults obtained in 2016 with those obtained in previous presidential election exitpolls.
When examining Table 12, one can see that 58% of Protestants (a broad categorythat includes evangelical and mainline Protestants, as well as Black Protestants)reported casting their ballots for Trump in 2016, largely reflecting the same levelof support Romney received from Protestants in 2012 (57%). On the other hand,Protestants were slightly less likely to report that they had voted for Clinton in2016 (39%) than for Obama in 2012 (42%), indicating also that a somewhat higherpercentage of Protestants voted for third party candidates in 2016 than in 2012.
For many decades, Roman Catholics were a major component of the Democraticcoalition. But, in more recent presidential elections, Catholics have tended to splittheir ballots more evenly between Democratic and Republican presidential candi-dates. And, in 2016, Catholics once again split their ballots more evenly betweenTrump and Clinton than did Protestants, as Trump won 52% of the Catholic votecompared to Clinton’s 45%. However, Trump’s margin of victory actually repre-sented a reversal from the two previous presidential elections, as Democrats hadpreviously captured the Catholic vote in both 2008 and 2012.
However, the Catholic vote in America differs in terms of its ethnic and racialcomposition, and this continued to be the case in 2016, as white and HispanicCatholics moved in different partisan directions. Just days before the election, someanalysts contended that white Catholics were less likely to cast Republican presiden-tial ballots in 2016 than they had done in the previous several elections (Shellnutt2016). Yet, in the end, white Catholics overwhelmingly voted for Trump (60%) justas white Catholics had done for Romney in 2012 (59%), while Hispanic Catholicsoverwhelmingly voted for Clinton (67%).
K
The role of religion in the 2016 american presidential election 155
But, once again, the story is not simply the level of support that Trump received inrelationship to Romney. Rather, another major component of the story the failure ofClinton to attract the same level of support that Obama had in 2012. Whereas 40% ofwhite Catholics voted for Obama in 2012, only 37% did so for Clinton in 2016. And,this drop in Catholic support for the Democratic candidate between 2012 and 2016was even more evident among Hispanic Catholics, as Clinton received only 67%of the Hispanic Catholic vote compared to Obama’s 75% in 2012. In fact, despiteTrump’s pledge to build a border wall between the United States and Mexico andhis comments about Mexico sending “criminals” and “rapists” to America, Trumpactually gathered a greater percentage of votes (5%) among Hispanic Catholics thanRomney had in 2012.33
Jews and those of other non-Christian faiths also continued to vote heavily Demo-cratic in 2016. Jews voted overwhelmingly for Clinton (71%), slightly exceeding thepercentage they had cast for Obama in 2012 (69%). And, while those who identifiedwith faiths other than Christianity or Judaism also strongly favored Clinton overTrump (62% to 29%, respectively), their level of support for Trump was not onlygreater than it had been for Romney (29% versus 23%, respectively), but the levelof support for Clinton fell well below what Obama received in 2012 (62% versus74%, respectively) – with a substantial percentage (9%) thereby casting their ballotsfor a third party candidate in 2016.
Those who claimed no religious affiliation were also among the strongest Clintonsupporters: 68% of their ranks voted for her in 2016. But, once again, the level ofsupport that Clinton received from the religiously unaffiliated did not match the levelthat Obama had received in 2012 or 2008. And, although there was considerablespeculation during the course of the campaign about the extent to which Trump’slevel of support among “born again or evangelical Christians” might be substantiallylower from what previous Republican presidential candidates had captured, Trumpactually garnered a slightly larger level of support from this group than Romney haddone in 2012.34
Exit polls also revealed another pattern that exhibited continuity with other recentpresidential elections – namely, that those who attend religious services on a weeklybasis, regardless of their faith tradition, vote heavily Republican, whereas thosewho attend religious services on a more sporadic basis split their vote more evenlybetween the two major parties, and those who never attend religious services voteheavily Democratic (Smith and Martinez 2016). This so-called “God Gap” in votingwas coined in the aftermath of the 2004 presidential election when a number ofdifferent studies examined the relationship between attendance at worship servicesand vote choice (e. g., Campbell 2007; Rozell and Whitney 2007, chs. 2–5).
What is notable about this “God Gap” pattern in voting is that it reflects a newkind of religious cleavage in American politics – one based more on religious beliefs
33 Among all Hispanics, regardless of their religious affiliation, Trump received 29% of the vote comparedto Romney 27%, but Clinton received only 65% of the Hispanic vote to Obama’s 71% in 2012 (Cillizza2016).34 Exit polling also revealed that the religious makeup of the electorate remained largely the same acrossthe 2012 and 2016 presidential elections. See Smith and Martinez (2016).
K

156 C. E. Smidt
and behavior – with the religious divide shifting from one in which those affiliatedwith different religious traditions are on different sides of the political divide to onein which religious traditionalists, regardless of one’s particular religious tradition,are located on one side of the divide and religious “modernists” and secularists areon the other (Kohut et al. 2000; Green 2007; Smidt et al. 2010). In the wake ofObama’s victory in 2008, scholarly attention largely shifted away from the religiousbases of American voting – and the relative effects of the so-called “God Gap” inAmerican politics.35 Unfortunately, the exit polling data do not permit an assessmentof the relative importance of these different means by which religion serves to shapepresidential voting in American politics. But, analyses of presidential voting basedon other survey data collected following each of the presidential elections between1996 and 2012 reveal that, while religious traditionalism has diminished the effectsthat religious affiliation has had on voting for president, it has not eliminated itsimportance. Hence, both orders are currently operating, with the relative effects ofreligious tradition outweighing religious traditionalism in some elections and thereverse being true in other elections (see Appendix, Table 14).36 Though it cannotbe answered here, the ultimate question is whether this coexistence will largelycontinue to be evident in future elections or whether one particular religious orderwill ultimately come to dominate and largely replace the other order.
9 Conclusions
For many Americans, the 2016 presidential election largely amounted to a choicebetween a candidate they did not trust (Clinton) and a candidate they did not like(Trump). Not surprisingly, therefore, the exit polls revealed that a larger percentageof Americans voted for third-party candidates in 2016 than had occurred in theprevious three elections (see Table 12). However, despite the fact that the vastmajority of Americans viewed both candidates unfavorably, most also realize thatcasting a ballot for a third-party candidate indirectly contributes to the election ofone of the major party candidates. Consequently, in choosing between “the lesserof two evils,” the American people exhibited considerable continuity in terms of
35 For one study that seeks to assess the relative importance of the “God Gap” as a factor in shaping theoutcome of the 2008 presidential election, see Smidt et al. (2010).36 The analysis presented in Appendix, Table 14, is a Multiple Classification Analysis, a procedure whichaccommodates the use of categorical variables in multivariate analyses and which provides a single sum-mary beta value for a categorical variable as a whole. The measure of religious traditionalism is based ona composite measure of the same four religious beliefs and three religious behaviors across each of thedifferent presidential elections. As can be seen from Appendix, Table 14, race clearly mattered in shapingvoting decisions in the 2008 and 2012 presidential election campaigns, though religious tradition rivaledrace as an explanatory factor (top portion of the table). And, religious traditionalism as a factor shapingvoting decisions for president declined in relative importance between the 2004 and the 2008 presidentialelections – but it hardly disappeared, as it remained relatively equivalent to the level of influence exhibitedby religious tradition affiliation and its strength in shaping the 2008 presidential vote mirrored the patternsfound in the presidential elections of 1996 and 2000 (bottom portion of the table). However, the importanceof religious traditionalism jumped significantly in 2012, and, as a result, its strength mirrored what wasevident in the 2004 presidential election when the term “God Gap” was coined.
K

The role of religion in the 2016 american presidential election 157
how they chose to cast their ballots. Trump’s victory therefore was not the resultof any dramatic change in the political preferences of the American electorate; tobe sure, there were some slight shifts in voting patterns across the two elections,and these shifts were certainly significant in terms of their results. Yet, despite thecampaign’s unusual nature, both the political alignments of the major demographicgroups (including those associated with the major religious traditions) – and thestrength of those alignments – largely remained unchanged in the 2016 election.
Perhaps, in hind sight, this continuity in voting patterns should not have beentoo surprising. Previous research (Smidt 2015) has shown that, over the past severaldecades, there has been a decline in “swing voting” in American presidential elec-tions. Given the level of polarization in American politics, even those who claim tobe independents now behave more like partisans and repeatedly vote for the sameparty, and, as a result, the percentage of American voting for a different party acrosssuccessive elections has diminished over time and has never been lower. Accord-ingly, the persuasion of “undecided voters” in election campaigns has become lessof a factor in shaping election outcomes, as the mobilization of voters (or the lackthereof) has become more important.
In many ways, this was an election that Hillary Clinton should have won. The factthat FBI Director James Comey chose to notify Congress days before the electionthat he was reopening the inquiry into her private emails certainly did not help hercause, but it unclear whether this necessarily cost her the election.37 Despite the factthat the Clinton campaign outspent the Trump campaign by a 2:1 margin (Bill etal. 2016), she failed to convince enough voters that she was the best candidate torepresent their interests. Clearly, she captured the popular vote. Still, her campaignnot only failed to rally needed voters in a number of crucial states – particularlyin the Midwest and Pennsylvania – but the focus of her campaign, largely basedon social and cultural issues rather than economic issues, seemingly galvanized andmobilized many whites in these crucial states, particularly in rural areas, to come tothe polls and vote for her opponent. A number of explanations have been advanced toaccount for the failure of the Clinton campaign – including the particular messagesthe campaign chose to advance, the tactical decisions made by her campaign staff,white racism, and the failure of identity-based politics (e. g., Ball 2016; Dovere 2016;Lilla 2016; Green 2016; Luhby 2016). Though there may be merit to a number ofthe explanations advanced, any suggestion that Clinton lost because of a resurgencein white racism is far too simplistic an explanation as many of the crucial rural,largely white, counties in the Midwest that Trump captured in 2016 and helped flittheir states from the Democratic to the Republican column Obama had won in both2008 and 2012.
Elections won at the margins. In the end, despite the fact that the Clinton coalitionof voters mirrored the Obama coalition of voters, Clinton was unable to sustain thesame level of support that Obama received from the various components of that
37 The exit polls do not reveal any substantial swing to Trump during the course of the last week of theelection campaign. Among those who made their voting decision during the last week of the campaign,Trump captured 45% of the vote, Clinton 42%, with the remaining 13% being cast for third party candi-dates. See http://edition.cnn.com/election/results/exit-polls/national/president.
K

158 C. E. Smidt
coalition. Although whites constituted a slightly smaller segment of the electoratein the 2016 election (70%) than in 2012 election (72%), Trump won the white voteby a record margin and this record margin was then coupled with nonwhites givingClinton a lower percentage of their vote than what they had given Obama (Cillizza2016). Nor did the fact that Clinton was the first female nominee of a major partynecessarily accrue her any major advantage in terms gender voting – as women werea slightly smaller segment of the electorate in 2016 (52%) than in 2012 (53%) andher margin of victory over Trump (12 percentage points) among women was onlyone percentage point higher than that garnered by Obama in 2012 (Cillizza 2016).38
In 2008, Obama was the candidate of change. But, in 2016, Trump representedthe candidate for change, while Clinton represented a continuation of the currentcourse – a third term of an “Obama Administration.” Many Americans, however,were tired of “politics as usual” and wanted to “shake things up.” Trump did nothesitate to say what he thought (though it often appeared that he hardly thoughtbefore he spoke). And, the fact that he would not budge from his statements whenchallenged about them seemingly convinced voters that Trump spoke his mind andwouldn’t lie to them, whereas other politicians simply said what they thought wouldhelp them get elected.
In the end, a little more than one in seven voters stated that neither Clinton norTrump were qualified to be president (see Table 13). And, the preference among thesevoters who “held their nose” and cast a ballot for one of the major party candidateswas to have someone without previous political experience serve as president ratherthan someone who had been in politics for decades, as this group of voters brokeheavily for Trump over Clinton (69% to 15%, respectively).
Other evidence also points to the election being largely driven by a desire forchange. When provided with four candidate qualities and asked which of the fourmattered the most in shaping their vote, the most commonly given answer by voters
Table 13 Presidential Voting Decision by Factors Shaping Personal Presidential Vote. (Source: 2016 ExitPolls, N = 24,558, http://edition.cnn.com/election/results/exit-polls/national/president)
Vote in 2016 Presidential Election
Percent ofPublic
Clinton(in %)
Trump(in %)
Other(in %)
Total(in %)
Who is qualified to serve as President? – – – –
Both are 5 22 71 7 100
Only Clinton 46 94 2 4 100
Only Trump 32 1 98 1 100
Neither are 15 15 66 19 100
What qualities of leaders matters most? – – – –
Can bring needed change 39 14 82 3 99
Cares about people like me 15 57 34 8 99
Has good judgment 20 65 25 9 99
Has the right experience 22 90 7 3 100
38 The exit poll data also reveal that Clinton won handily over Trump among unmarried women (63%versus 32%, respectively), but that she barely carried the vote among the larger segment of married women(49% versus 47%).
K

The role of religion in the 2016 american presidential election 159
in the exit poll was the candidate who “can bring about needed change,” with nearlyfour in ten (39%) responding accordingly. And, among this plurality of voters, Trumpcaptured 83% of their vote to just 14% for Clinton (see Table 13).
So. in conclusion, it would appear that the election of Trump does not reflect anymajor shift in the political alignment of those associated with the major religioustraditions in American life – nor in the religious coalition of votes won by eachparty’s nominee. There were certainly important defections from the winning ele-ments of the Obama coalition, but these shifts were marginal in nature and hardlymarked the advent of a new chapter in American electoral politics. Perhaps thepresidency of Donald Trump will ultimately result in such a change, but the votingpatterns of the election of 2016 do not, as yet, reflect such a fundamental shift in thepartisan alignment of different religious traditions nor in the compositional makeupreligiously of each party’s electoral coalition of voters.
K
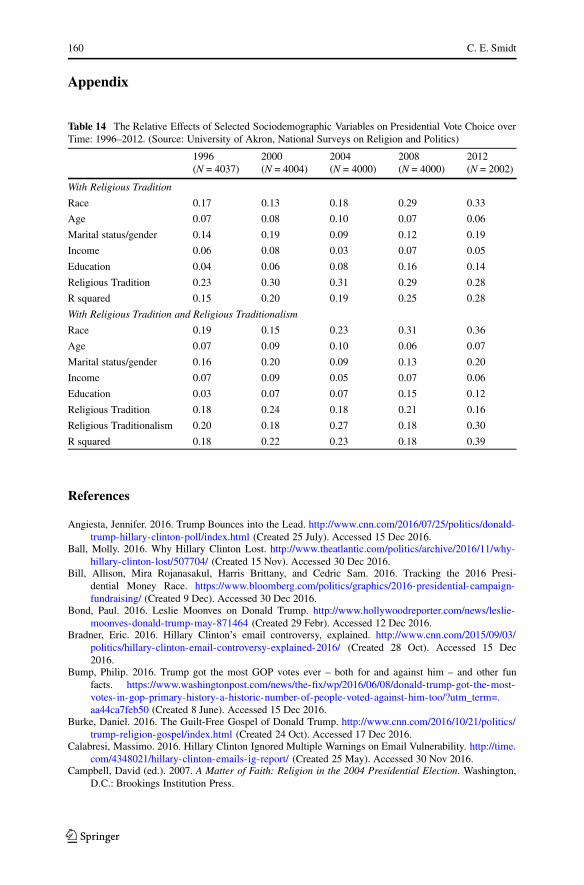
160 C. E. Smidt
Appendix
Table 14 The Relative Effects of Selected Sociodemographic Variables on Presidential Vote Choice overTime: 1996–2012. (Source: University of Akron, National Surveys on Religion and Politics)
1996(N = 4037)
2000(N = 4004)
2004(N = 4000)
2008(N = 4000)
2012(N = 2002)
With Religious Tradition
Race 0.17 0.13 0.18 0.29 0.33
Age 0.07 0.08 0.10 0.07 0.06
Marital status/gender 0.14 0.19 0.09 0.12 0.19
Income 0.06 0.08 0.03 0.07 0.05
Education 0.04 0.06 0.08 0.16 0.14
Religious Tradition 0.23 0.30 0.31 0.29 0.28
R squared 0.15 0.20 0.19 0.25 0.28
With Religious Tradition and Religious Traditionalism
Race 0.19 0.15 0.23 0.31 0.36
Age 0.07 0.09 0.10 0.06 0.07
Marital status/gender 0.16 0.20 0.09 0.13 0.20
Income 0.07 0.09 0.05 0.07 0.06
Education 0.03 0.07 0.07 0.15 0.12
Religious Tradition 0.18 0.24 0.18 0.21 0.16
Religious Traditionalism 0.20 0.18 0.27 0.18 0.30
R squared 0.18 0.22 0.23 0.18 0.39
References
Angiesta, Jennifer. 2016. Trump Bounces into the Lead. http://www.cnn.com/2016/07/25/politics/donald-trump-hillary-clinton-poll/index.html (Created 25 July). Accessed 15 Dec 2016.
Ball, Molly. 2016. Why Hillary Clinton Lost. http://www.theatlantic.com/politics/archive/2016/11/why-hillary-clinton-lost/507704/ (Created 15 Nov). Accessed 30 Dec 2016.
Bill, Allison, Mira Rojanasakul, Harris Brittany, and Cedric Sam. 2016. Tracking the 2016 Presi-dential Money Race. https://www.bloomberg.com/politics/graphics/2016-presidential-campaign-fundraising/ (Created 9 Dec). Accessed 30 Dec 2016.
Bond, Paul. 2016. Leslie Moonves on Donald Trump. http://www.hollywoodreporter.com/news/leslie-moonves-donald-trump-may-871464 (Created 29 Febr). Accessed 12 Dec 2016.
Bradner, Eric. 2016. Hillary Clinton’s email controversy, explained. http://www.cnn.com/2015/09/03/politics/hillary-clinton-email-controversy-explained-2016/ (Created 28 Oct). Accessed 15 Dec2016.
Bump, Philip. 2016. Trump got the most GOP votes ever – both for and against him – and other funfacts. https://www.washingtonpost.com/news/the-fix/wp/2016/06/08/donald-trump-got-the-most-votes-in-gop-primary-history-a-historic-number-of-people-voted-against-him-too/?utm_term=.aa44ca7feb50 (Created 8 June). Accessed 15 Dec 2016.
Burke, Daniel. 2016. The Guilt-Free Gospel of Donald Trump. http://www.cnn.com/2016/10/21/politics/trump-religion-gospel/index.html (Created 24 Oct). Accessed 17 Dec 2016.
Calabresi, Massimo. 2016. Hillary Clinton Ignored Multiple Warnings on Email Vulnerability. http://time.com/4348021/hillary-clinton-emails-ig-report/ (Created 25 May). Accessed 30 Nov 2016.
Campbell, David (ed.). 2007. A Matter of Faith: Religion in the 2004 Presidential Election. Washington,D.C.: Brookings Institution Press.
K

The role of religion in the 2016 american presidential election 161
Cillizza, Chris. 2016. The 13 amazing findings in the 2016 exit poll. https://www.washingtonpost.com/news/the-fix/wp/2016/11/10/the-13-most-amazing-things-in-the-2016-exit-poll/?utm_term=.9e27e19e106e (Created 10 Nov). Accessed 20 Dec 2016.
Derrick, J.C. 2016. Evangelical Backlash against Trump Grows. https://world.wng.org/2016/10/trump_faces_growing_evangelical_backlash (Created 13 Oct). Accessed 14 Dec 2016.
Desilver, Drew. 2016. Who are the Democratic superdelegates? http://www.pewresearch.org/fact-tank/2016/05/05/who-are-the-democratic-superdelegates/ (Created 5 May). Accessed 30 Nov 2016.
Diggles, Michelle. 2013. The New Electorate and the Future of the Democratic Party. http://www.thirdway.org/report/the-new-electorate-and-the-future-of-the-democratic-party (Created 19 Sept). Accessed12 Nov 2016.
Dovere, Edward-Isaac. 2016. How Clinton Lost Michigan – and blew the election. http://www.politico.com/story/2016/12/michigan-hillary-clinton-trump-232547 (Created 14 Dec). Accessed 30 Dec2016.
Flint, Joe. 2015. Republican Debate Audience Was the Biggest Ever for a Non-Sports Cable Event. http://www.wsj.com/articles/republican-debate-audience-was-the-biggest-ever-for-a-nonsports-cable-event-1438992539 (Created 7 Aug). Accessed 12 Dec 2016.
Green, Emma. 2016. Democrats Have a Religion Problem. https://www.theatlantic.com/politics/archive/2016/12/democrats-have-a-religion-problem/510761/ (Created 29 Dec). Accessed 31 Dec 2016.
Green, John. 2007. The Faith Factor: How Religion Influences American Elections. Westport: Praeger.Guth, James, Lyman Kellstedt, Corwin E. Smidt, and John Green. 2006. Religious Influences in the 2004
Presidential Election. Presidential Studies Quarterly 36(June):223–242.Guth, James, Lyman Kellstedt, John Green, and Corwin E. Smidt. 2007. Getting the Spirit: Religious and
Partisan Mobilization in the 2004 Elections. In Interest Group Politics, 7th edn., ed. Allan J. Cigler,Burdett A. Loomis, 157–181. Washington, D.C.: CQ Press.
Kellstredt, Lyman, John Green, James Guth, and Corwin E. Smidt. 1996. Grasping the Essentials: TheSocial Embodiment of Religion and Political Behavior. In Religion and the Culture Wars, ed. JohnGreen, James Guth, Corwin E. Smidt, and Lyman Kellstedt, 174–192. Lanham: Rowman & Little-field.
Kellstedt, Lyman, John Green, Corwin Smidt, and James Guth. 2007. Faith Transformed: Religion andAmerican Politics from FDR to George W. Bush. In Religion and American Politics: From the Colo-nial Period to the Present, 2nd edn., ed. Mark Noll, Kuke Harlow, 269–295. New York: OxfordUniversity Press.
Kohut, Andrew, John Green, Scott Keeter, and Rober Toth. 2000. The Diminishing Divide: Religion’sChanging Role in American Politics. Washington, D.C.: Brookings Institution Press.
Lasky, Ed. 2015. Is Trump a Democrat? http://www.americanthinker.com/articles/2015/12/is_trump_a_democrat.html (Created 14 Dec). Accessed 3 Dec 2016.
Layman, Geoffrey. 2001. The Great Divide: Religion and Cultural Conflict in American Party Politics.New York: Columbia University Press.
Layman, Geoffrey, and John C. Green. 2005. Wars and Rumors of Wars: The Contexts of Cultural Conflictin American Political Behavior. British Journal of Political Science 36(1):61–89.
Lilla, Mark. 2016. The End of Identity Liberalism. http://www.nytimes.com/2016/11/20/opinion/sunday/the-end-of-identity-liberalism.html?_r=0 (Created 18 Nov). Accessed 10 Dec 2016.
Luhby, Tami. 2016. How Hillary Lost. http://www.cnn.com/2016/11/09/politics/clinton-votes-african-americans-latinos-women-white-voters/ (Created 9 Nov). Accessed 26 Dec 2016.
Newport, Frank. 2016. Clinton’s Image at Lowest Point in Two Decades. http://www.gallup.com/poll/193913/clinton-image-lowest-point-two-decades.aspx (Created 25 July). Accessed 8 Dec 2016.
Peoples, Steve. 2016. Grand Old Party? Donald Trump remaking GOP in his image. http://www.msn.com/en-us/news/politics/grand-old-party-donald-trump-remaking-gop-in-his-image/ar-BBxKzTK?ocid=se (Created 31 Dec). Accessed 31 Dec 2016. Associated Press.
Pew Research Center Report. 2014. Political Polarization in the American Public. http://www.people-press.org/2014/06/12/political-polarization-in-the-american-public/ (Created 12 June). Accessed 3Dec 2016.
Pew Research Center Report. 2016. Evangelicals Rally to Trump, Religious ‘Nones’ Back Clinton. http://www.pewforum.org/2016/07/13/evangelicals-rally-to-trump-religious-nones-back-clinton/ (Created13 July). Accessed 8 Dec 2016.
Posner, Sarah. 2016. The Religious Right’s Trump Schism. http://www.nytimes.com/2016/10/19/opinion/campaign-stops/the-religious-rights-trump-schism.html?_r=0 (Created 19 Oct). Accessed 16 Dec2016.
K

162 C. E. Smidt
Putnam, Robert, and David Campbell. 2010. American Grace: How Religion Divides and Unites Us. NewYork: Simon & Schuster.
Rozell, Mark, and Gleaves Whitney. 2007. Religion and the Bush Presidency. Boulder: Palgrave MacMil-lan.
Saad, Lydia. 2016. Trump Leads Clinton in Historically Bad Image Ratings. http://www.gallup.com/poll/193376/trump-leads-clinton-historically-bad-image-ratings.aspx (Created 1 July). Accessed 8 Dec2016.
Scott, Eugene. 2015. Trump believes in God, but hasn’t sought forgiveness. http://www.cnn.com/2015/07/18/politics/trump-has-never-sought-forgiveness/ (Created 18 July). Accessed 12 Dec 2016.
Shellnutt, Kate. 2016. Trump Ends Evangelicals and Catholics Together. http://www.christianitytoday.com/gleanings/2016/october/trump-ends-evangelicals-catholics-together-voting-clinton.html (Cre-ated 28 Oct). Accessed 27 Dec 2016.
Smidt, Corwin D. 2015. Polarization and the Decline of the American Floating Voter. American Journalof Political Science doi:10.1111/ajps.12218.
Smidt, Corwin E. 2013. American Evangelicals Today. New York: Rowman & Littlefield.Smidt, Corwin E., Kevin den Dulk, James Penning, Stephen Monsma, and Douglas Koopman. 2008. Pew,
Prayers & Participation: Religion & Civic Responsibility in America. Washington, D.C.: GeorgetownUniversity Press.
Smidt, Corwin E., Kevin den Dulk, Brian Froehle, James Penning, Stephen Monsma, and Douglas Koop-man. 2010. The Disappearing God Gap?: Religion in the 2008 Presidential Election. New York:Oxford University Press.
Smith, Gregory, and Jessica Martinez. 2016. How the Faithful Voted: A Preliminary 2016 Analysis. http://www.pewresearch.org/fact-tank/2016/11/09/how-the-faithful-voted-a-preliminary-2016-analysis/(Created 9 Nov). Accessed 20 Dec 2016.
Taylor, Jessica. 2016. Citing Two Corinthians, Trump Struggles to Make the Sale to Evangelicals. http://www.npr.org/2016/01/18/463528847/citing-two-corinthians-trump-struggles-to-make-the-sale-to-evangelicals (Created 18 Jan). Accessed 20 Dec 2016.
Warner, R. Stephen. 1993. Work in Progress toward a New Paradigm for the Sociological Study of Religionin the United States. American Journal of Sociology 98:1044–1093.
Wilcox, Clyde, and Lee Sigelman. 2001. Political Mobilization in the Pews: Religious Contacting andElectoral Turnout. Social Science Quarterly 82(September):524–535.
K