the shape of recovery: what’s next?
TRANSCRIPT

The Shape of Recovery:
What’s Next?

22
Panelists
Leon LaBrecque
JD, CPA, CFP®, CFA
Chief Growth Officer
248.918.5905
Matt Pullar
Vice President, Private Client
Services
216.774.1192

3
As an independent financial services firm, our salaried, non-commission professionals have access to a variety of solutions and resources and our recommendations are based solely on what works best for you, not us.
About Sequoia Financial Group

1. What are we monitoring?
2. What are we hearing from our
investment partners?
3. What are we recommending?
Financial Market Update
4
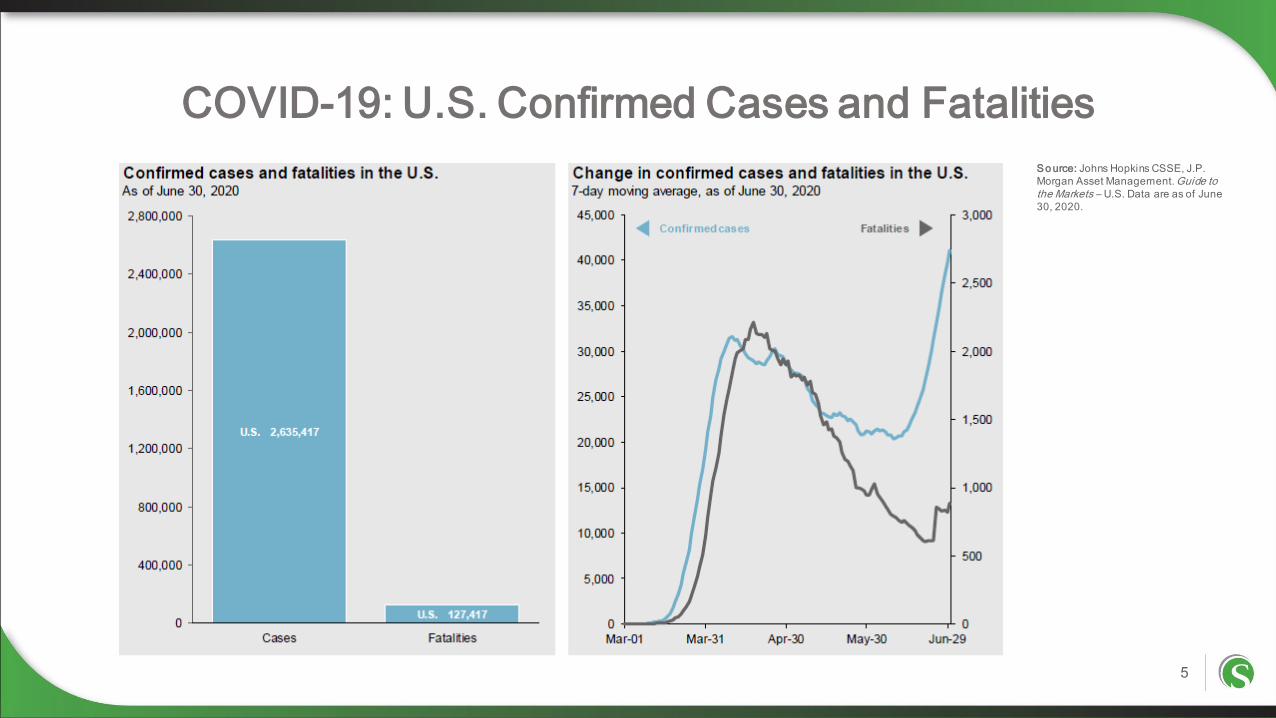
COVID-19: U.S. Confirmed Cases and Fatalities
5
So urce: Johns Hopkins CSSE, J.P.
Morgan Asset Management. Guide to the Markets – U.S. Data are as of June
30, 2020.
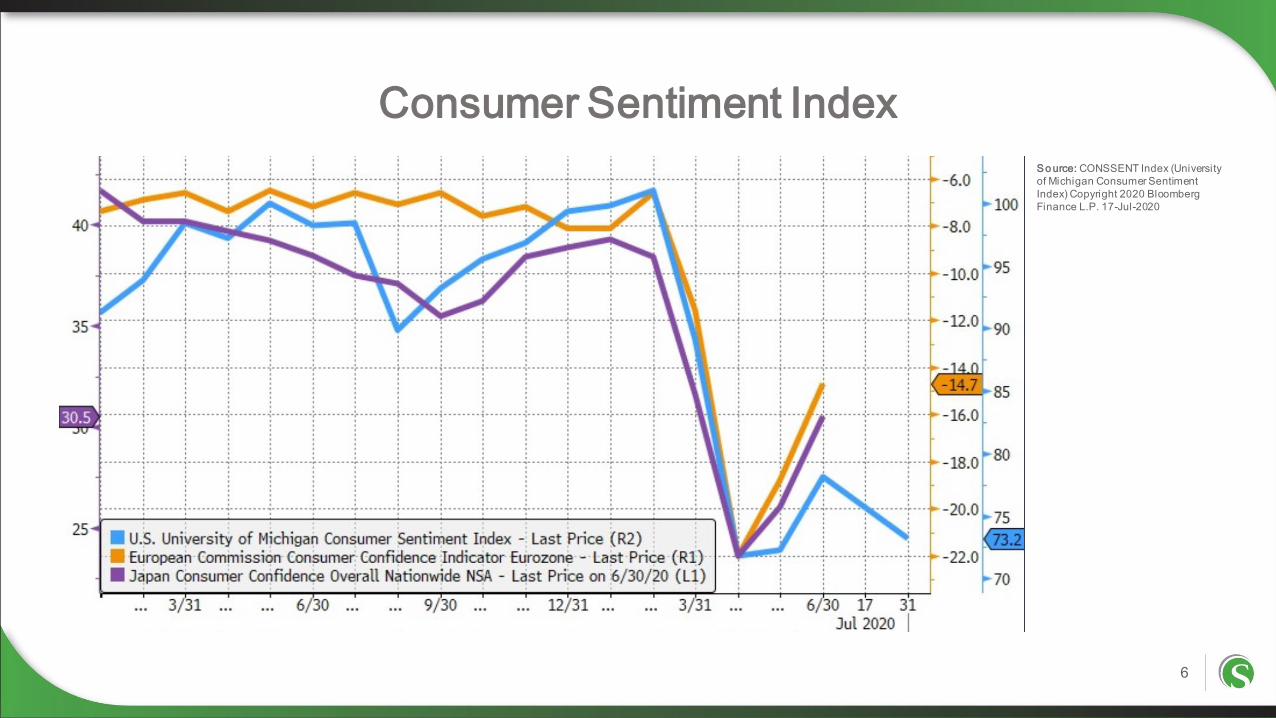
Consumer Sentiment Index
6
So urce: CONSSENT Index (University
of Michigan Consumer Sentiment
Index) Copyright 2020 Bloomberg
Finance L.P. 17-Jul-2020
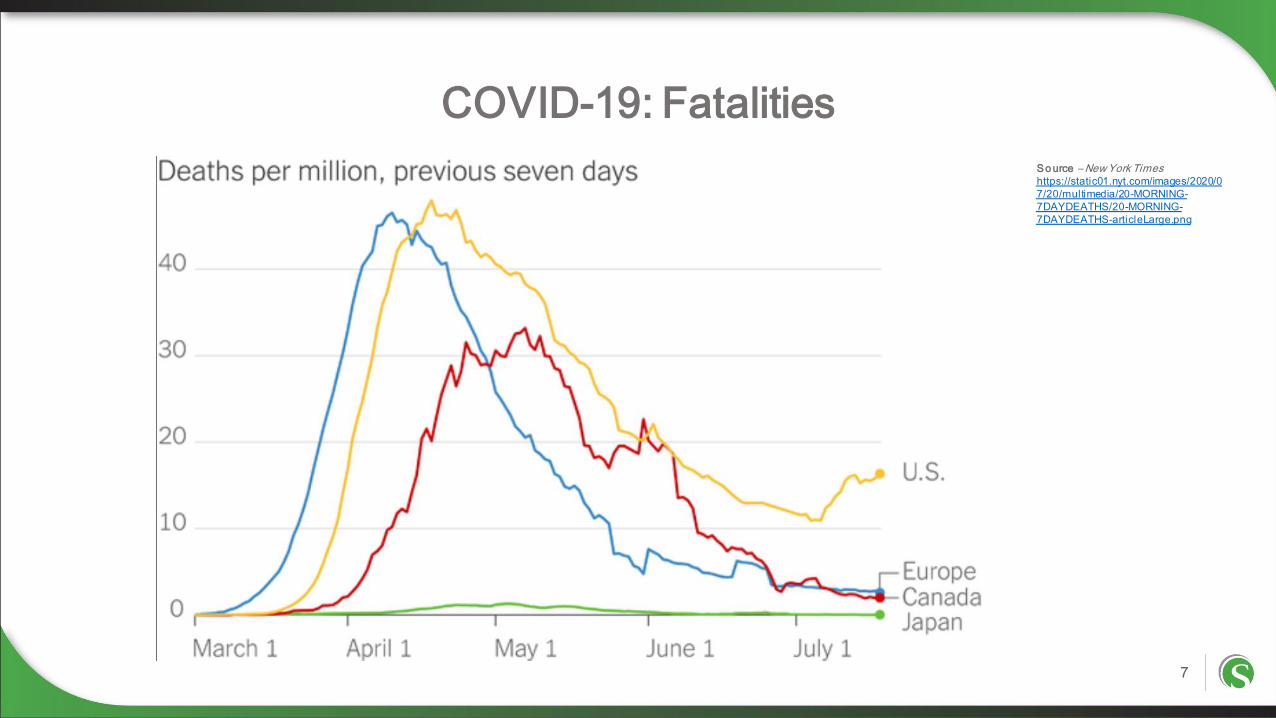
COVID-19: Fatalities
7
So urce – New York Times https://static01.nyt.com/images/2020/0
7/20/multimedia/20-MORNING-
7DAYDEATHS/20-MORNING-
7DAYDEATHS-articleLarge.png

High-Frequency Economic Activity
8
So urce: Apple Inc., FlightRadar24,
Mortgage Bankers Association (MBA),
OpenTable, STR, Transportation
Security Administration (TSA), J.P.
Morgan Asset Management. *Driving
directions and total global fl ights are 7-
day moving averages and are
compared to a pre-pandemic baseline.
Guide to the Markets – U.S. Data are
as of June 30, 2020.
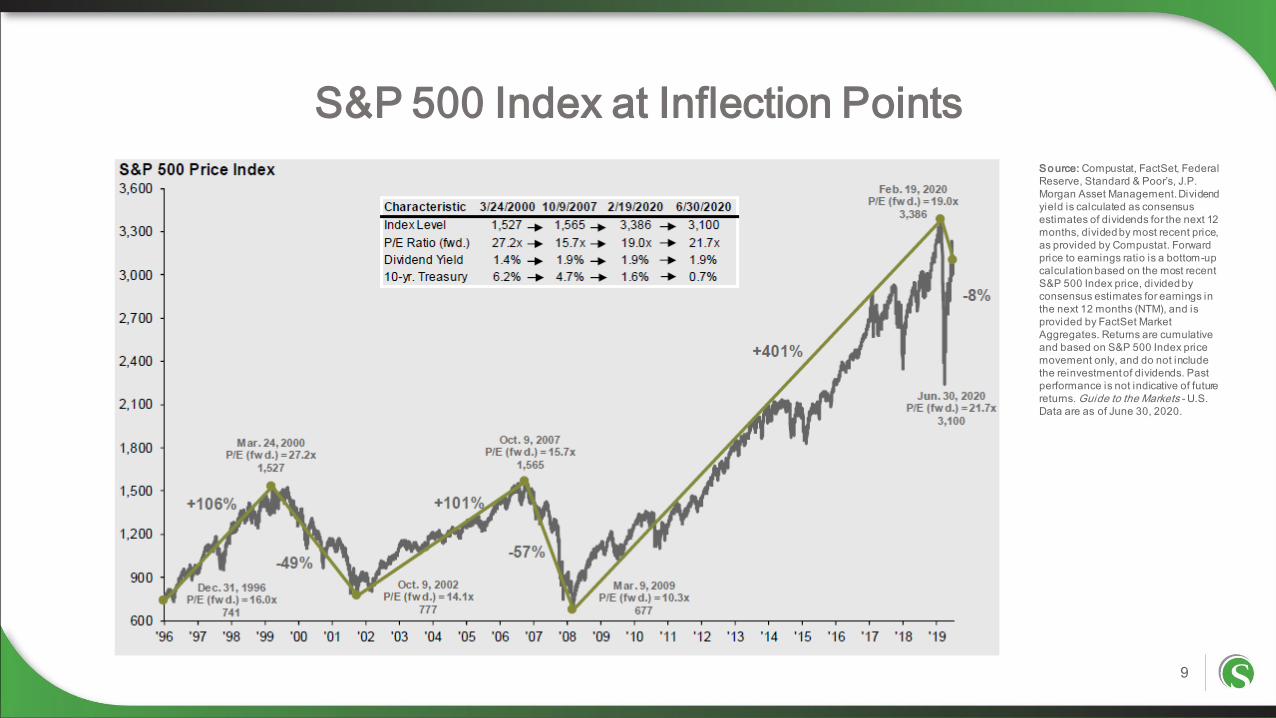
S&P 500 Index at Inflection Points
9
So urce: Compustat, FactSet, Federal
Reserve, Standard & Poor’s, J.P.
Morgan Asset Management. Dividend
yield is calculated as consensus
estimates of dividends for the next 12
months, divided by most recent price,
as provided by Compustat. Forward
price to earnings ratio is a bottom-up
calculation based on the most recent
S&P 500 Index price, divided by
consensus estimates for earnings in
the next 12 months (NTM), and is
provided by FactSet Market
Aggregates. Returns are cumulative
and based on S&P 500 Index price
movement only, and do not include
the reinvestment of dividends. Past
performance is not indicative of future
returns. Guide to the Markets - U.S.
Data are as of June 30, 2020.

S&P 500 Valuation Measures
10
So urce: FactSet, FRB, Robert Shiller,
Standard & Poor’s, Thomson Reuters,
J.P. Morgan Asset Management. Price
to earnings is price divided by
consensus analyst estimates of
earnings per share for the next 12
months as provided by IBES since July
1995, and FactSet for June 30, 2020.
Current next 12-months consensus
earnings estimates are $143. Average
P/E and standard deviations are
calculated using 25 years of IBES
history. Shiller’s P/E uses trailing 10-
years of inflation-adjusted earnings as
reported by companies. Dividend yield
is calculated as the next 12-months
consensus dividend divided by most
recent price. Price to book ratio is the
price divided by book value per share.
Price to cash flow is price divided by
NTM cash flow. EY minus Baa yield is
the forward earnings yield (consensus
analyst estimates of EPS over the next
12 months divided by price) minus the
Moody’s Baa seasoned corporate bond
yield. Std. dev. over-/under-valued is
calculated using the average and
standard deviation over 25 years for
each measure. Guide to the Markets –U.S. Data are as of June 30, 2020.

Bear Markets and Subsequent Bull Runs
11
So urce: FactSet, NBER, Robert Shiller,
Standard & Poor’s, J.P. Morgan Asset
Management.*A bear market is defined
as a 20% or more decline from the
previous market high. The related
market return is the peak to trough
return over the cycle. Periods of
“Recession” are defined using NBER
business cycle dates. “Commodity
spikes” are defined as movement in oil
prices of over 100%over an 18-month
period. Periods of “Extreme Valuations”
are those where S&P 500 last 12-
months P/E levels were approximately
two standard deviations above long-run
averages, or time periods where equity
market valuations appeared expensive
given the broader macroeconomic
environment. “Aggressive Fed
Tightening” is defined as Federal
Reserve monetary tightening that was
unexpected and/or significant in
magnitude. Bear and Bull returns are
price returns. Guide to the Markets –U.S. Data are as of June 30, 2020.
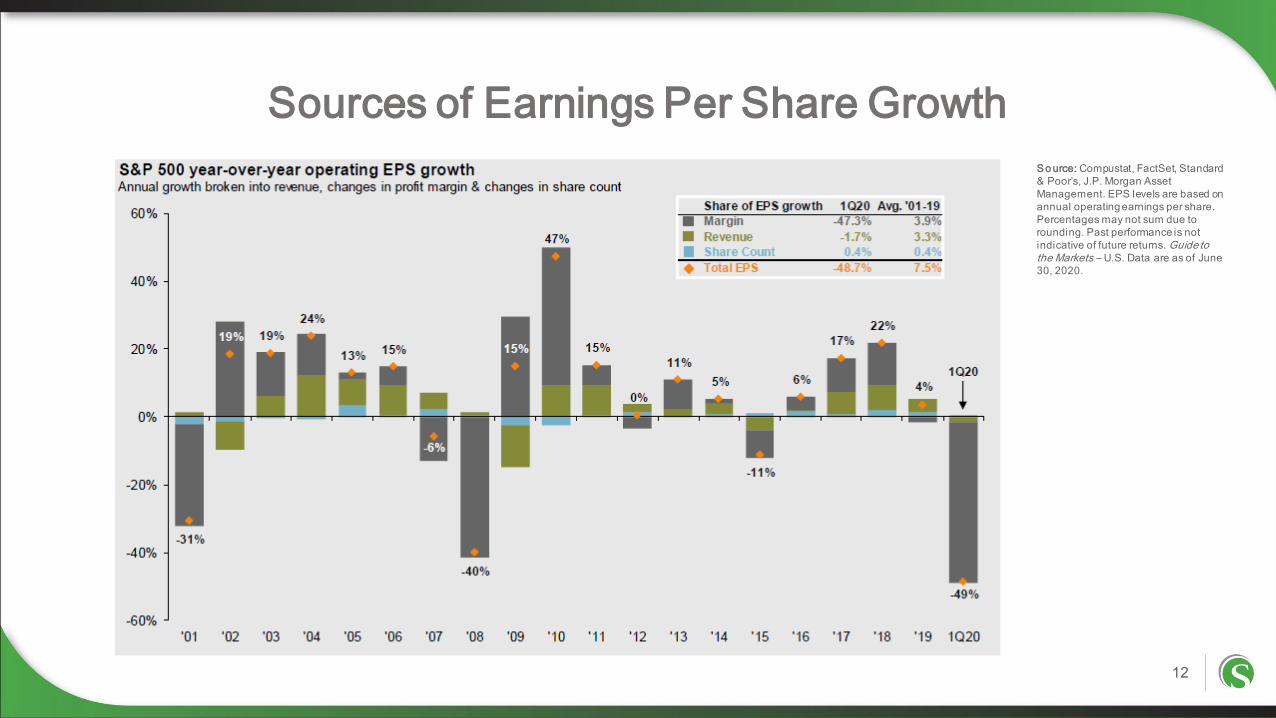
Sources of Earnings Per Share Growth
12
So urce: Compustat, FactSet, Standard
& Poor’s, J.P. Morgan Asset
Management. EPS levels are based on
annual operating earnings per share.
Percentages may not sum due to
rounding. Past performance is not
indicative of future returns. Guide to the Markets – U.S. Data are as of June
30, 2020.
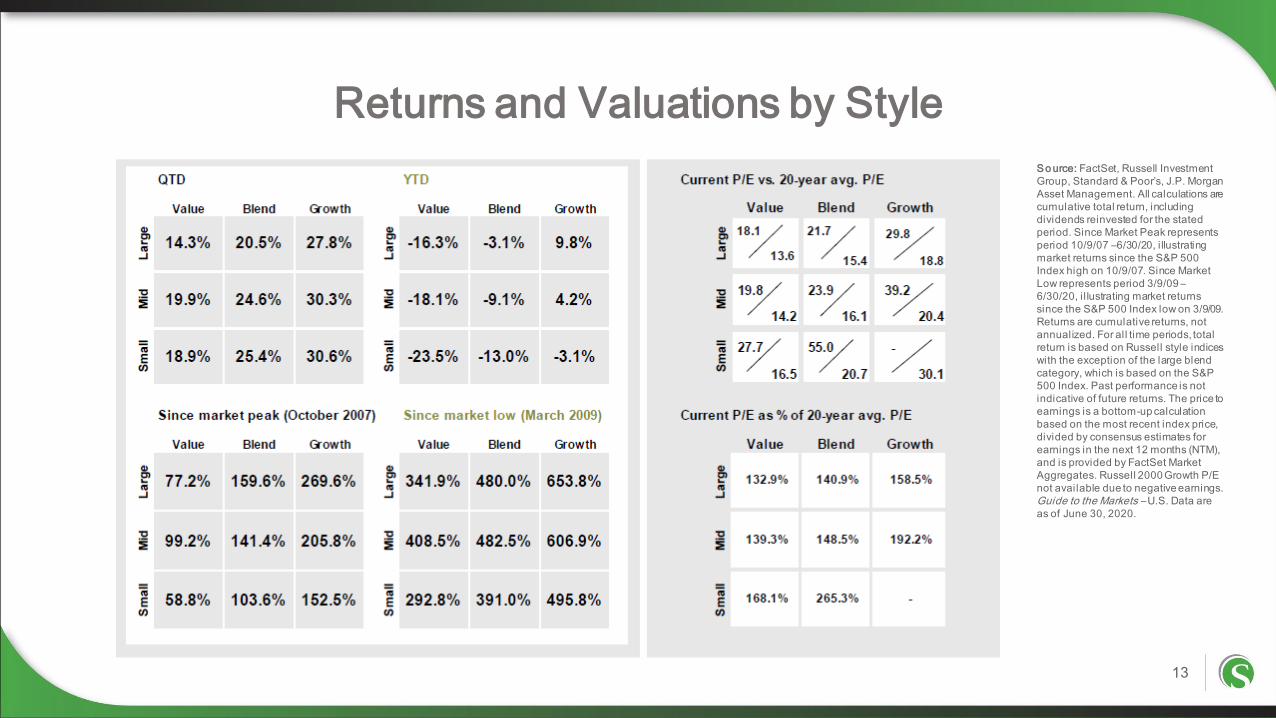
Returns and Valuations by Style
13
So urce: FactSet, Russell Investment
Group, Standard & Poor’s, J.P. Morgan
Asset Management. All calculations are
cumulative total return, including
dividends reinvested for the stated
period. Since Market Peak represents
period 10/9/07 –6/30/20, i llustrating
market returns since the S&P 500
Index high on 10/9/07. Since Market
Low represents period 3/9/09 –
6/30/20, i l lustrating market returns
since the S&P 500 Index low on 3/9/09.
Returns are cumulative returns, not
annualized. For all time periods, total
return is based on Russell style indices
with the exception of the large blend
category, which is based on the S&P
500 Index. Past performance is not
indicative of future returns. The price to
earnings is a bottom-up calculation
based on the most recent index price,
divided by consensus estimates for
earnings in the next 12 months (NTM),
and is provided by FactSet Market
Aggregates. Russell 2000 Growth P/E
not available due to negative earnings.
Guide to the Markets – U.S. Data are
as of June 30, 2020.
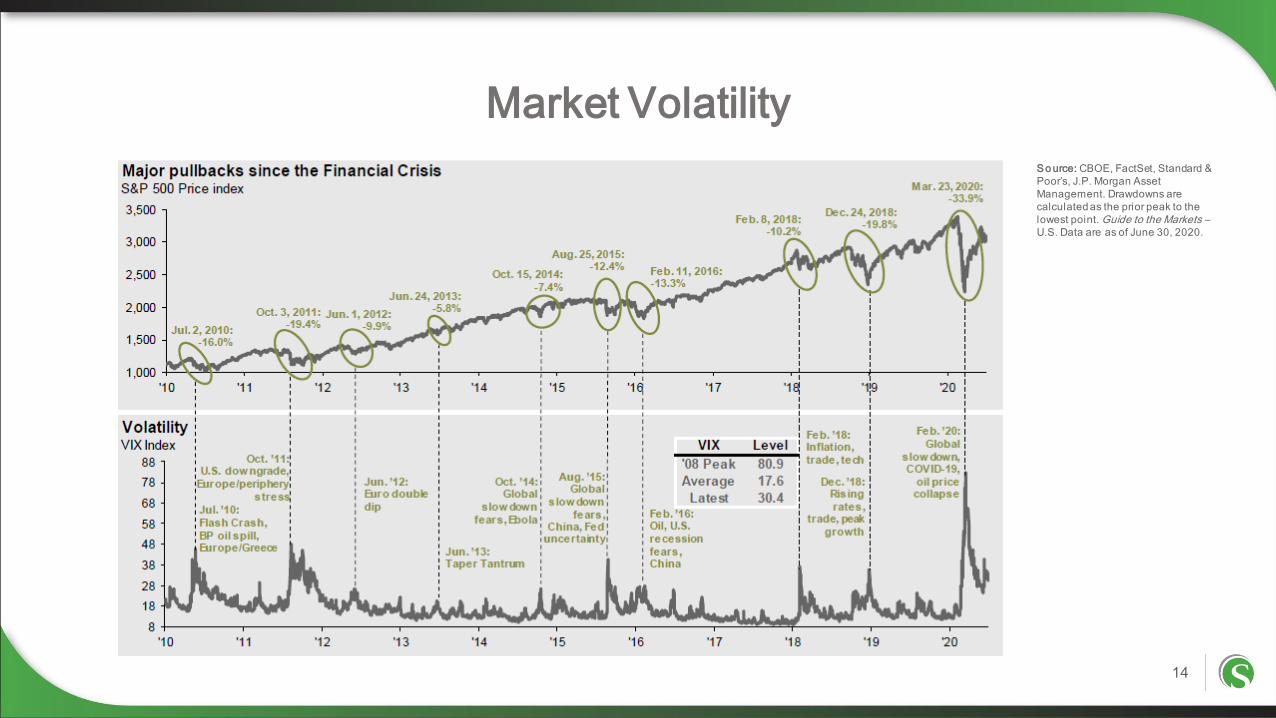
Market Volatility
14
So urce: CBOE, FactSet, Standard &
Poor’s, J.P. Morgan Asset
Management. Drawdowns are
calculated as the prior peak to the
lowest point. Guide to the Markets –U.S. Data are as of June 30, 2020.
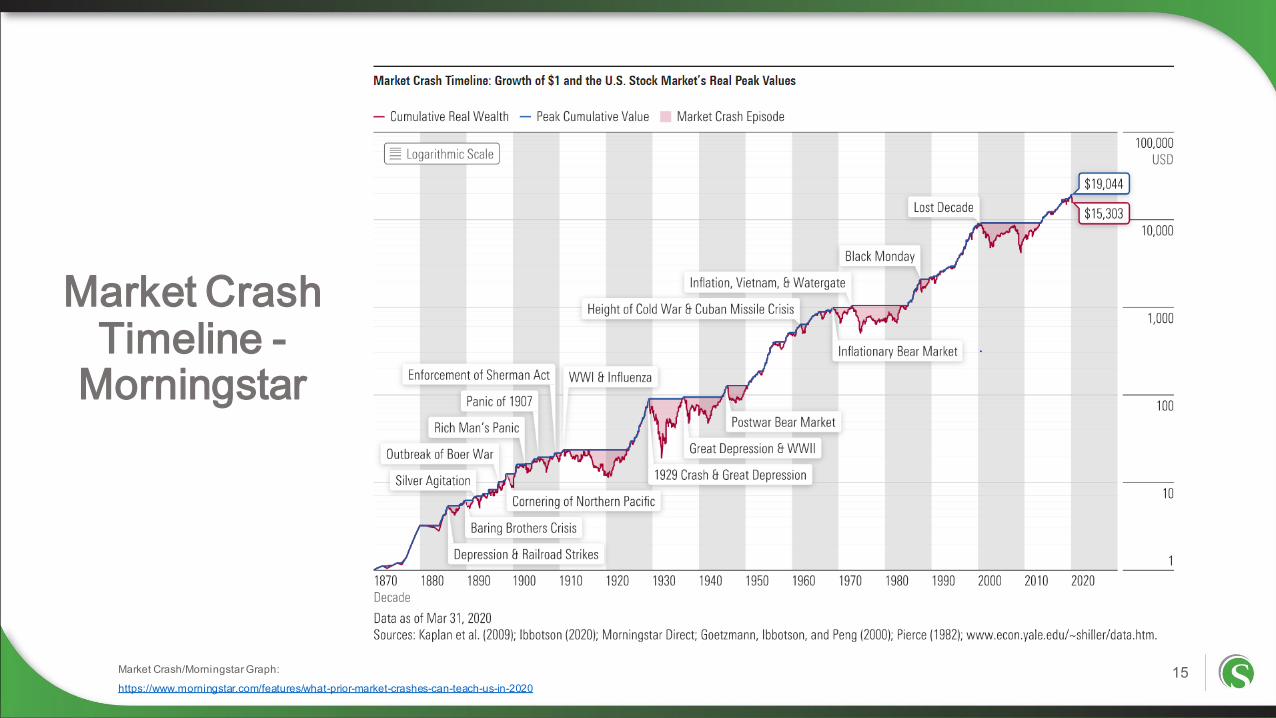
Market Crash Timeline -
Morningstar
15Market Crash/Morningstar Graph:
https://www.morningstar.com/features/what-prior-market-crashes-can-teach-us-in-2020
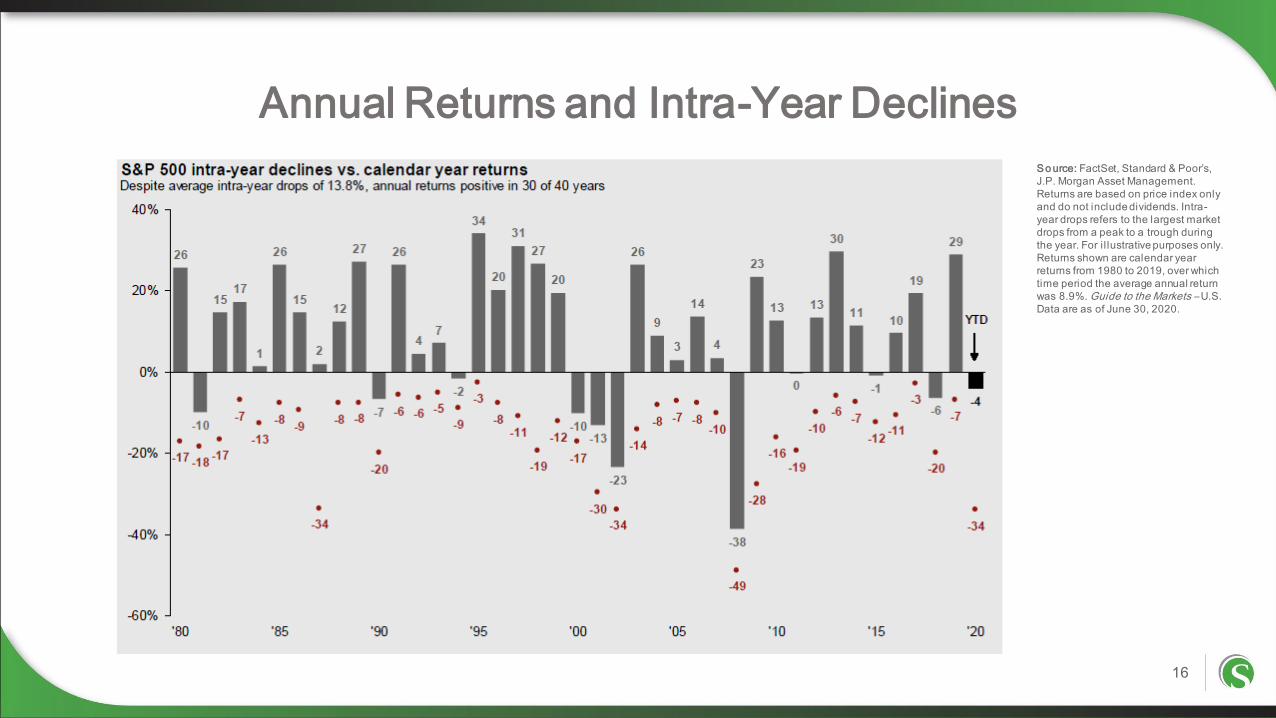
Annual Returns and Intra-Year Declines
16
So urce: FactSet, Standard & Poor’s,
J.P. Morgan Asset Management.
Returns are based on price index only
and do not include dividends. Intra-
year drops refers to the largest market
drops from a peak to a trough during
the year. For i l lustrative purposes only.
Returns shown are calendar year
returns from 1980 to 2019, over which
time period the average annual return
was 8.9%. Guide to the Markets – U.S.
Data are as of June 30, 2020.
17
What are we recommending?
Slightly defensive positioning given stock market rally since March low
Underweight International stocks relative to global benchmark
Re-balance periodically
Revisit investment strategy within the context of your overall financial plan
Financial Market Update

1. Prospective shape of the recovery? V, U, W, or L?
2. How is this different from other disasters?
3. What is the new paradigm?
4. How much will this really cost?
5. How will we pay for it?
6. What changes?
7. What are the second and third level effects of the crisis?
Questions
18
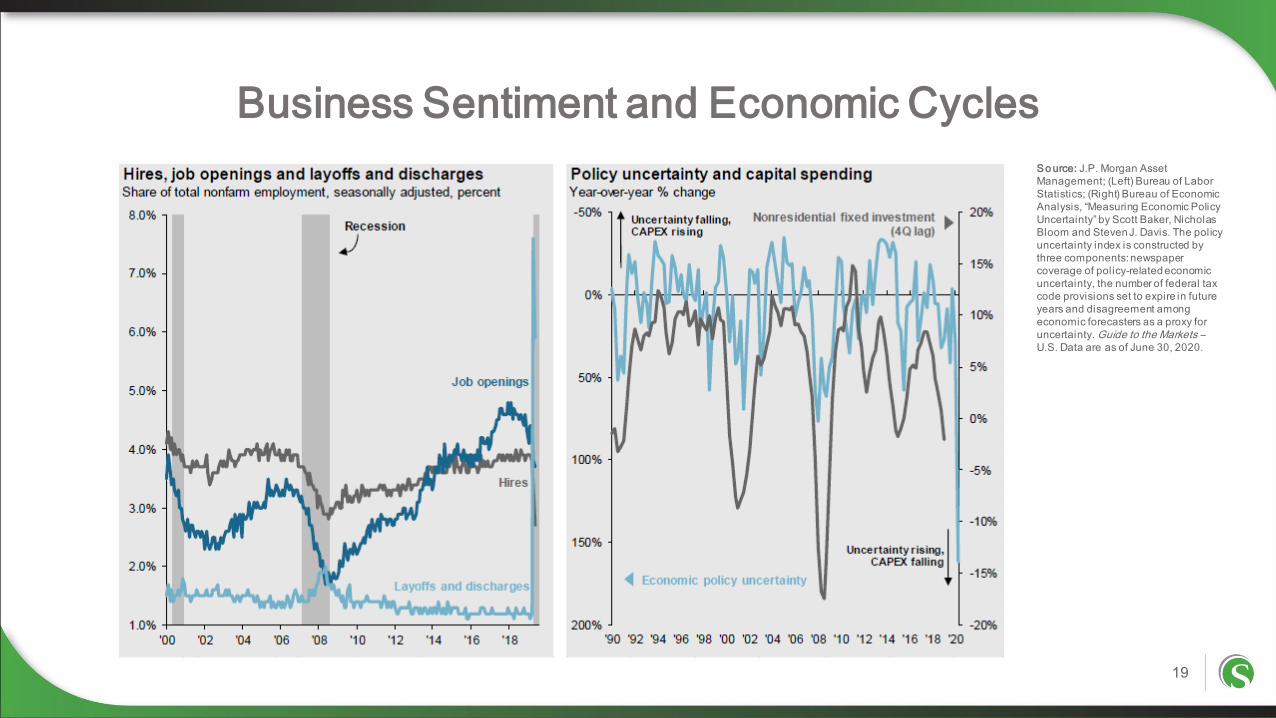
Business Sentiment and Economic Cycles
19
So urce: J.P. Morgan Asset
Management; (Left) Bureau of Labor
Statistics; (Right) Bureau of Economic
Analysis, “Measuring Economic Policy
Uncertainty” by Scott Baker, Nicholas
Bloom and Steven J. Davis. The policy
uncertainty index is constructed by
three components: newspaper
coverage of policy-related economic
uncertainty, the number of federal tax
code provisions set to expire in future
years and disagreement among
economic forecasters as a proxy for
uncertainty. Guide to the Markets –U.S. Data are as of June 30, 2020.
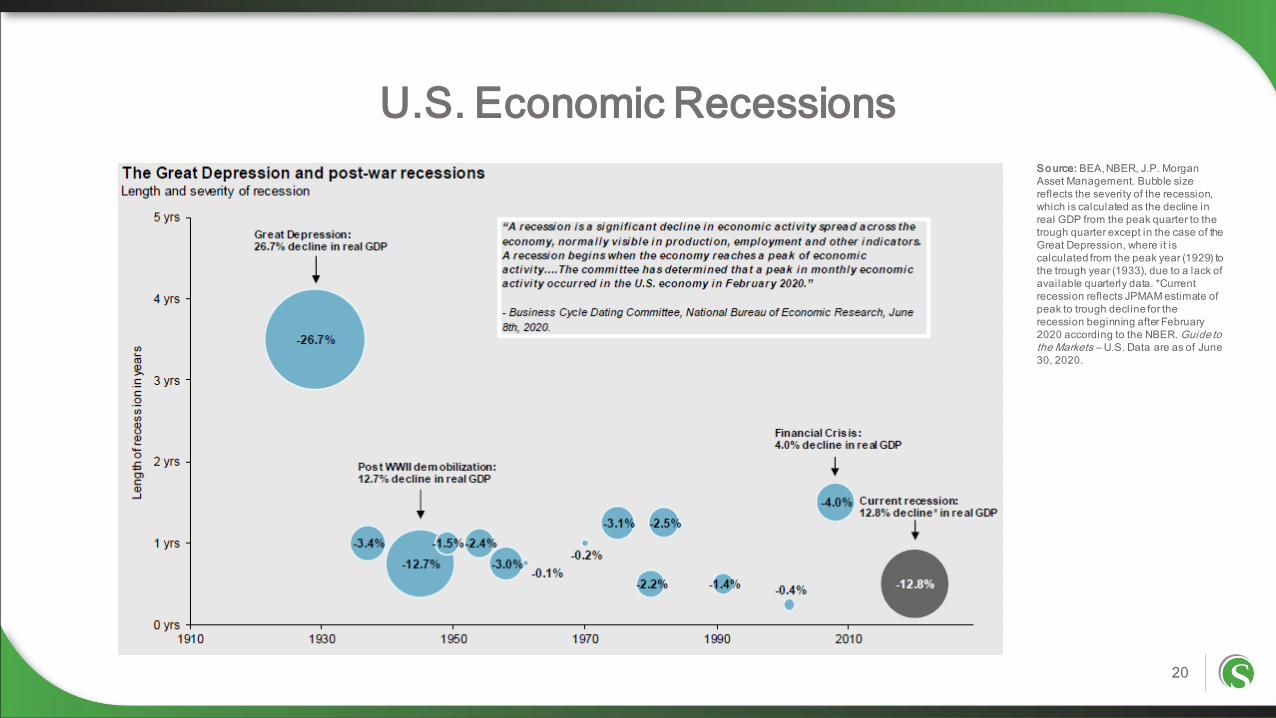
U.S. Economic Recessions
20
So urce: BEA, NBER, J.P. Morgan
Asset Management. Bubble size
reflects the severity of the recession,
which is calculated as the decline in
real GDP from the peak quarter to the
trough quarter except in the case of the
Great Depression, where it is
calculated from the peak year (1929) to
the trough year (1933), due to a lack of
available quarterly data. *Current
recession reflects JPMAM estimate of
peak to trough decline for the
recession beginning after February
2020 according to the NBER. Guide to the Markets – U.S. Data are as of June
30, 2020.

GDP/Per Capita PPP
21
Depression of 1920-21
Recession of 1937-38
Recession of 1949,
Fed Tightening
Recessio…
Beginning of WW1
Post WW1 Recession
The Great Depression
Beginning of WW2
Reduced Government
Spend from WW2
$-
$2,000
$4,000
$6,000
$8,000
$10,000
$12,000
$14,000
$16,000
$18,000
$20,000
1910 1915 1920 1925 1930 1935 1940 1945 1950 1955
US GDP Data:
https://www.rug.nl/ggdc/historicaldevelopment/maddison/releases/maddison-project-database-2018

GDP/Per Capita PPP & Top Tax Bracket
22
Depression of 1920-21
Recession of 1937-38
Recession of 1949,
Fed Tightening
Recession of 1953
Beginning of WW1
Post WW1 Recession
The Great Depression
Beginning of WW2
Reduced Government
Spend from WW2
0%
10%
20%
30%
40%
50%
60%
70%
80%
90%
100%
$-
$2,000
$4,000
$6,000
$8,000
$10,000
$12,000
$14,000
$16,000
$18,000
$20,000
1910 1915 1920 1925 1930 1935 1940 1945 1950 1955
US Top Marginal Tax Rate Data:
https://fred.stlouisfed.org/series/IITTRHB

GDP/Per Capita PPP & Debt/GDP
23
Depression of 1920-21
Recession of 1937-38
Recession of 1949,
Fed Tightening
Recessio…
Beginning of WW1
Post WW1 Recession
The Great Depression
Beginning of WW2
Reduced Government
Spend from WW2
0%
20%
40%
60%
80%
100%
120%
140%
$-
$2,000
$4,000
$6,000
$8,000
$10,000
$12,000
$14,000
$16,000
$18,000
$20,000
1910 1915 1920 1925 1930 1935 1940 1945 1950 1955
US Debt/GDP Data:
https://data.imf.org/?sk=806ED027-520D-497F-9052-63EC199F5E63&sId=1390030341854
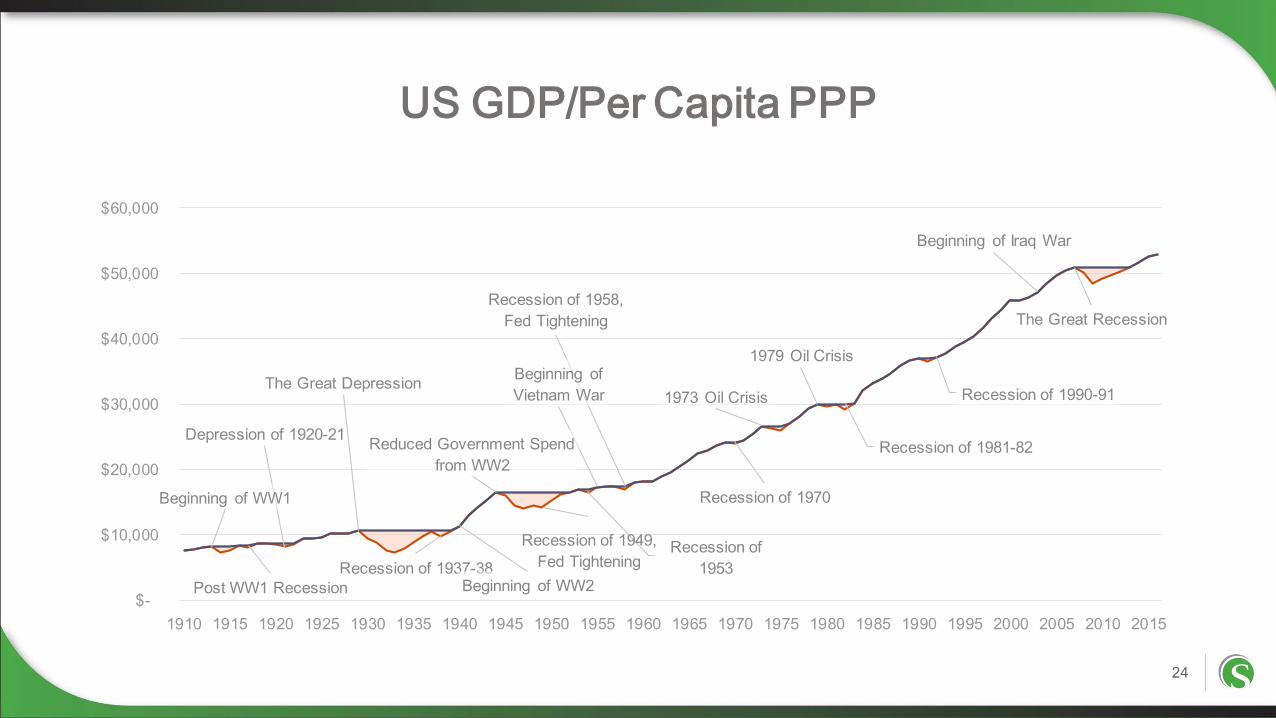
US GDP/Per Capita PPP
24
Depression of 1920-21
Recession of 1937-38
Recession of 1949,
Fed TighteningRecession of
1953
Beginning of WW1
Post WW1 Recession
The Great Depression
Beginning of WW2
Reduced Government Spend
from WW2
Beginning of
Vietnam War
Recession of 1958,
Fed Tightening
Recession of 1970
1973 Oil Crisis
1979 Oil Crisis
Recession of 1981-82
Recession of 1990-91
Beginning of Iraq War
The Great Recession
$-
$10,000
$20,000
$30,000
$40,000
$50,000
$60,000
1910 1915 1920 1925 1930 1935 1940 1945 1950 1955 1960 1965 1970 1975 1980 1985 1990 1995 2000 2005 2010 2015
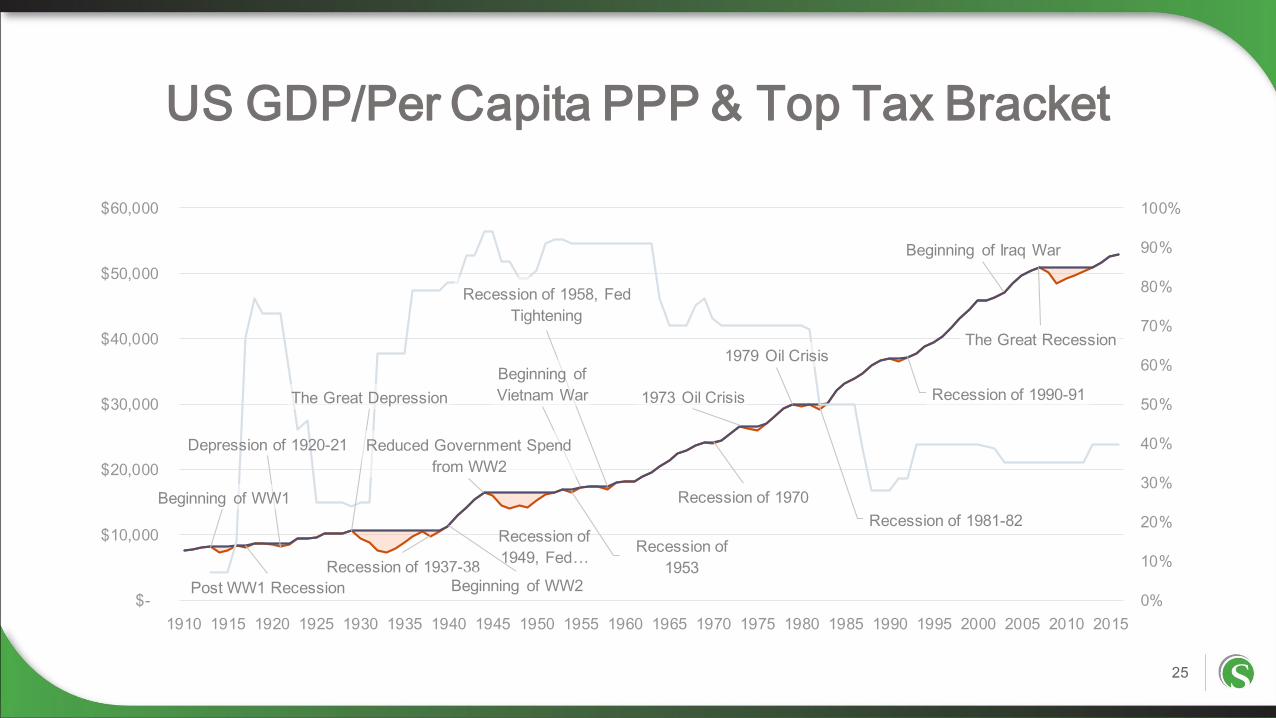
US GDP/Per Capita PPP & Top Tax Bracket
25
Depression of 1920-21
Recession of 1937-38
Recession of
1949, Fed …Recession of
1953
Beginning of WW1
Post WW1 Recession
The Great Depression
Beginning of WW2
Reduced Government Spend
from WW2
Beginning of
Vietnam War
Recession of 1958, Fed
Tightening
Recession of 1970
1973 Oil Crisis
1979 Oil Crisis
Recession of 1981-82
Recession of 1990-91
Beginning of Iraq War
The Great Recession
0%
10%
20%
30%
40%
50%
60%
70%
80%
90%
100%
$-
$10,000
$20,000
$30,000
$40,000
$50,000
$60,000
1910 1915 1920 1925 1930 1935 1940 1945 1950 1955 1960 1965 1970 1975 1980 1985 1990 1995 2000 2005 2010 2015
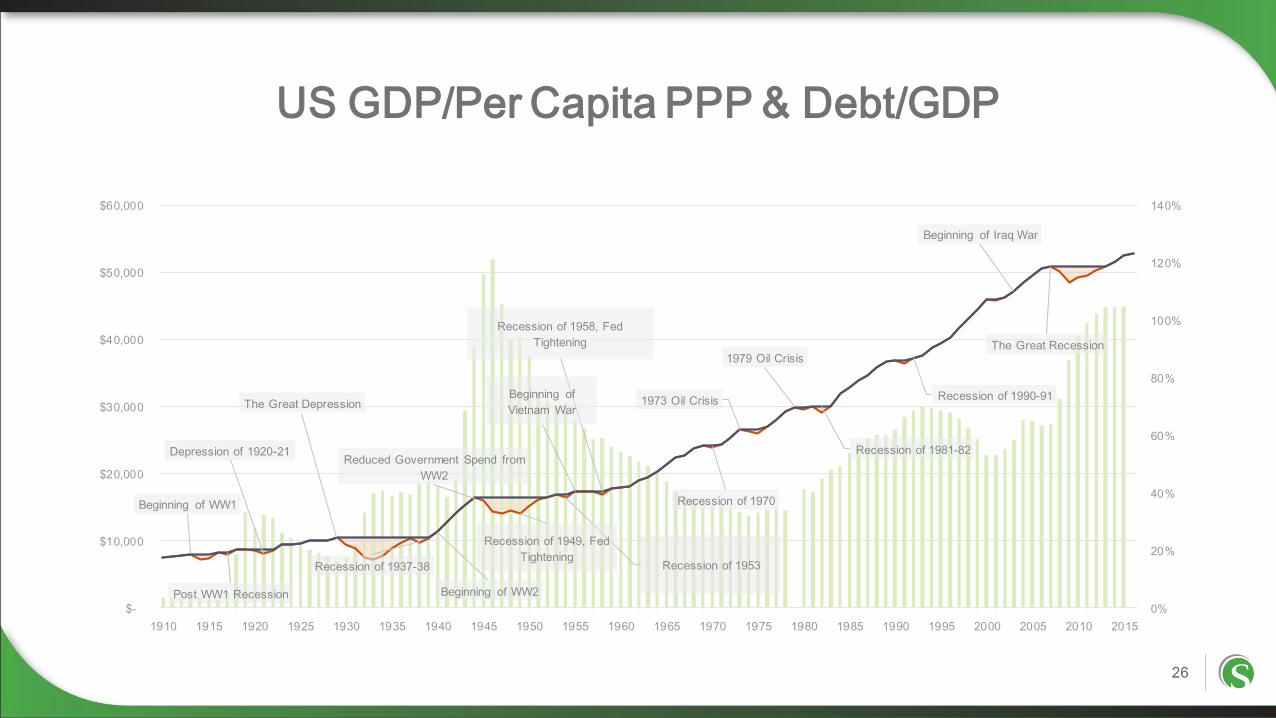
US GDP/Per Capita PPP & Debt/GDP
26
Depression of 1920-21
Recession of 1937-38
Recession of 1949, Fed
TighteningRecession of 1953
Beginning of WW1
Post WW1 Recession
The Great Depression
Beginning of WW2
Reduced Government Spend from
WW2
Beginning of
Vietnam War
Recession of 1958, Fed
Tightening
Recession of 1970
1973 Oil Crisis
1979 Oil Crisis
Recession of 1981-82
Recession of 1990-91
Beginning of Iraq War
The Great Recession
0%
20%
40%
60%
80%
100%
120%
140%
$-
$10,000
$20,000
$30,000
$40,000
$50,000
$60,000
1910 1915 1920 1925 1930 1935 1940 1945 1950 1955 1960 1965 1970 1975 1980 1985 1990 1995 2000 2005 2010 2015

Federal Finances
27
So urce: CBO, J.P. Morgan Asset
Management. JPMAM estimates
include costs of CPRSA, FFCR,
CARES and PPPHCE Acts, signed into
law on March 6, 18 and 27 and April 24
as estimated by CBO. Charts on right
add impacts of these acts, interest cost
of additional debt, an assumed extra
$1 tri l l ion in further acts in 2020 and
2021 and recession impacts on
revenues, spending and GDP.
Congressional Budget Office (CBO)
March 2020 Baseline Budget Forecast.
Note: Years shown are fiscal years
(Oct. 1 through Sep. 30). Guide to the Markets – U.S. Data are as of June 30,
2020.

The Federal Reserve Balance Sheet
28
So urce: FactSet, Federal Reserve, J.P.
Morgan Investment Bank, J.P. Morgan
Asset Management. Currently, the
balance sheet contains $4.2 tri llion in
Treasuries and $1.9 tri l lion in MBS.
The end balance forecast is $4.7 tri llion
in Treasuries and $2.2 tri ll ion in MBS
by December 2020. *Balance sheet
forecast assumes the Federal Reserve
maintains its current pace of purchases
of Treasuries and MBS through
December 2020 as outlined in the June
2020 FOMC meeting. **Loans include
primary, secondary and seasonal
loans, maiden lane securities and
loans extended through newly
established corporate credit facilities.
Loan figures shown are max usage
over the QE period referenced and are
not growth of loan portfolio over the
period. ***QE4 is ongoing and the
expansion figures are as of the most
recent Wednesday close as reported
by the Federal Reserve. Guide to the Markets – U.S. Data are as of June 30,
2020.
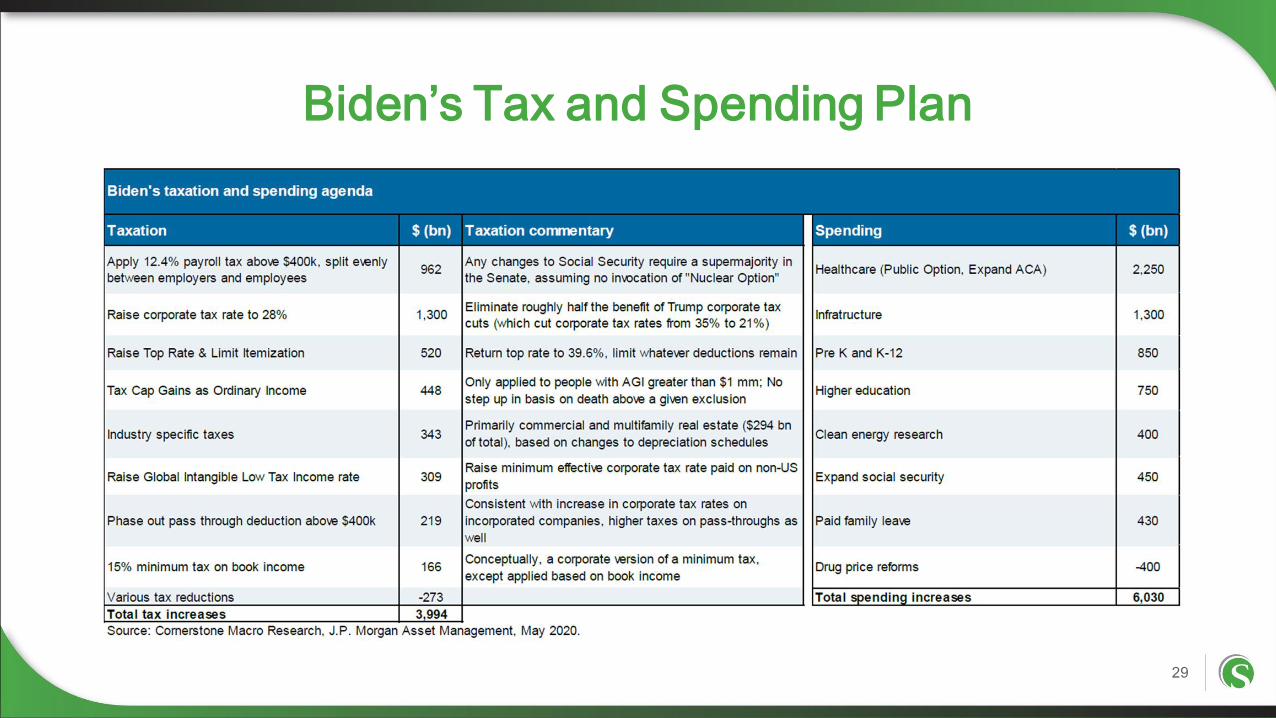
Biden’s Tax and Spending Plan
29

Comparison of Tax Plans
30
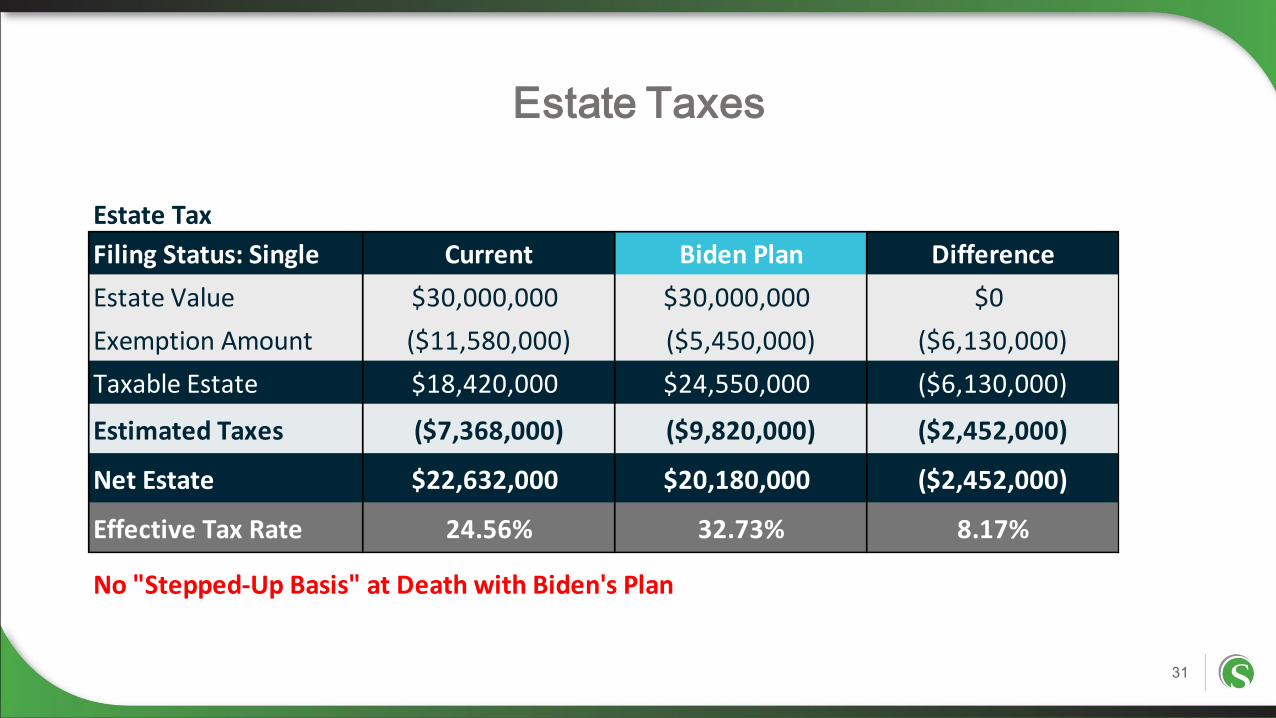
Estate Tax
Filing Status: Single Current Biden Plan Difference
Estate Value $30,000,000 $30,000,000 $0
Exemption Amount ($11,580,000) ($5,450,000) ($6,130,000)
Taxable Estate $18,420,000 $24,550,000 ($6,130,000)
Estimated Taxes ($7,368,000) ($9,820,000) ($2,452,000)
Net Estate $22,632,000 $20,180,000 ($2,452,000)
Effective Tax Rate 24.56% 32.73% 8.17%
No "Stepped-Up Basis" at Death with Biden's Plan
Estate Taxes
31
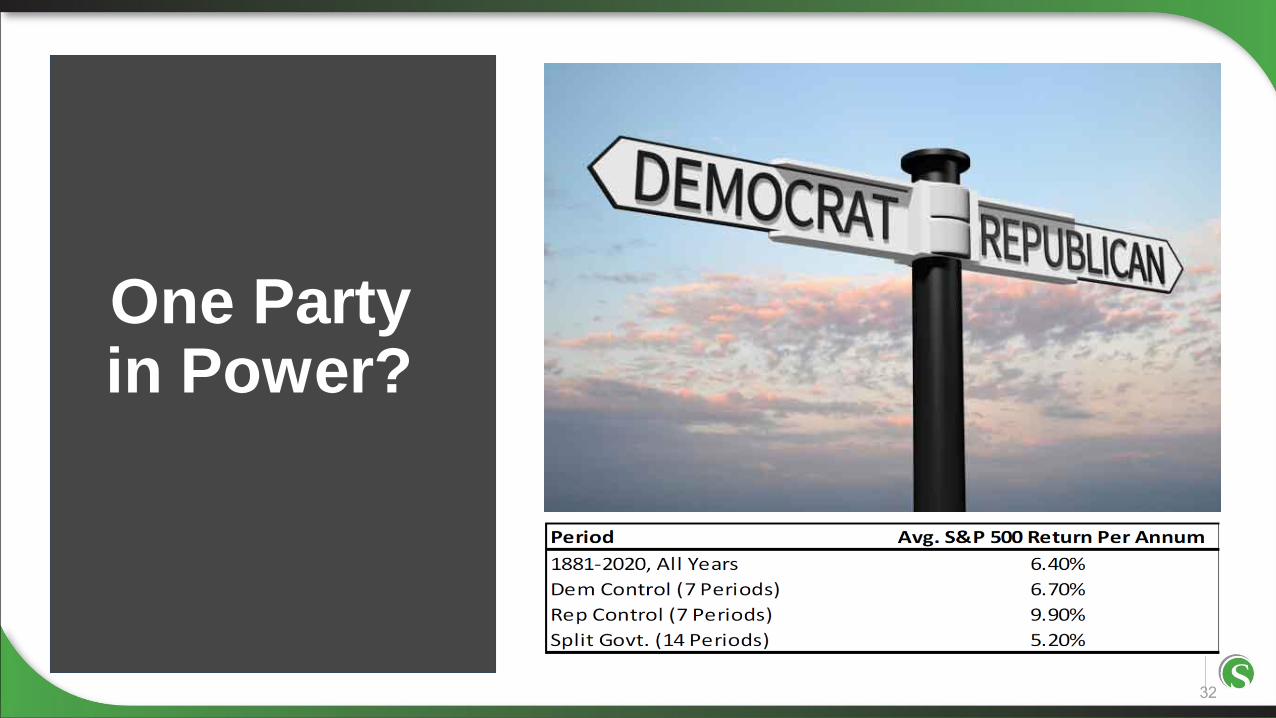
One Party in Power?
32

Extend your investment timeframe
Understand your liquidity needs
Evaluate capacity to shift your investment objective
Determine if current planning opportunities are a fit for you (ex., Roth conversions, intrafamily loans, wealth transfers)
The Intersection of Financial Planning
& Investment Strategy
33

34
Next Steps
Talk with your advisor
Review or establish your financial plan
Review your current investment strategy in the context of your plan
• Evaluate liquidity/cash buffer
• Analyze how you are invested based on what you are investing for

3535
Questions & Answers
FOR MORE INFORMATION VISIT:
COVID-19:
PODCAST:
TALK TO AN ADVISOR:
sequoia-financial.com/COVID-19-RESOURCES
sequoia-financial.com/PODCASTS
sequoia-financial.com/TALK
Leon LaBrecque
JD, CPA, CFP®, CFA
Chief Growth Officer
248.918.5905
Matt Pullar
Vice President, Private Client
Services
216.774.1192

This material does not constitute tax, legal, investment or any other type of professional advice. You should consult with a qualified tax, legal or financial advisor prior to making a decision. The financial instruments discussed in this brochure may not be suitable for all investors and investors must make their own investment decisions based upon their specific financial situations and investment objectives. Information has been obtained from sources believed to be reliable, but we do not guarantee their accuracy or completeness. While we have taken great care in the preparation of these materials, we cannot be responsible for clerical, computational, or other errors. Except where otherwise indicated herein, the information provided herein is based on matters as they exist as of the date of preparation, and may not be updated or otherwise revised to reflect information that subsequently becomes available, or changes occurring after the date hereof.
Investment advisory services offered through Sequoia Financial Advisors, LLC, an SEC Registered Investment Advisor. Registration as an investment advisor does not imply a certain level of skill or training.
©2020, Sequoia Financial Group, all rights reserved.
Disclosures
36

3500 Embassy Pkwy | Suite 100 | Akron, OH 44333
888.225.3777
sequoia-financial.com