the six sigma handbook revised and expanded - thomas pyzdek - v2 - #1/2
DESCRIPTION
Part 1/2 - From the begin to the End of Chapt. 11. ------------------------------------- Introduction: ========== The goal of this book remains the same as for the first edition, namely, to provide you with the comprehensive guidance and direction necessary to realize Six Sigma’s promise, while avoiding traps and pitfalls commonly encountered. In this book you will find a complete overview of the management and organization of Six Sigma, the philosophy which underlies Six Sigma, and those problem solving techniques and statistical tools most often used in Six Sigma. It is not intended to be an ASQ certification study guide, although it includes coverage of most of the topics included in the ASQ body of knowledge. Rather it is intended as a guide for champions, leaders, ‘‘belts,’’ team members and others interested in using the Six Sigma approach to make their organizations more efficient, more effective, or both. In short, it is a user’s manual, not a classroom textbook.TRANSCRIPT


TheSix SigmaHandbook
Revised and Expanded
A Complete Guidefor Green Belts, Black Belts,andManagers at All Levels
THOMAS PYZDEK
McGraw-HillNew York Chicago San Francisco Lisbon London Madrid Mexico City Milan
New Delhi San Juan Seoul Singapore Sydney Toronto

Copyright © 2003 by The McGraw-HIll Companies, Inc. All rights reserved. Manufactured in the United States ofAmerica. Except as permitted under the United States Copyright Act of 1976, no part of this publication may bereproduced or distributed in any form or by any means, or stored in a database or retrieval system, without the priorwritten permission of the publisher.
0-07-141596-3
The material in this eBook also appears in the print version of this title: 0-07-141015-5.
All trademarks are trademarks of their respective owners. Rather than put a trademark symbol after every occur-rence of a trademarked name, we use names in an editorial fashion only, and to the benefit of the trademarkowner, with no intention of infringement of the trademark. Where such designations appear in this book, theyhave been printed with initial caps.
McGraw-Hill eBooks are available at special quantity discounts to use as premiums and sales promotions, or foruse in corporate training programs. For more information, please contact George Hoare, Special Sales, [email protected] or (212) 904-4069.
TERMS OF USEThis is a copyrighted work and The McGraw-Hill Companies, Inc. (“McGraw-Hill”) and its licensors reserve allrights in and to the work. Use of this work is subject to these terms. Except as permitted under the Copyright Actof 1976 and the right to store and retrieve one copy of the work, you may not decompile, disassemble, reverseengineer, reproduce, modify, create derivative works based upon, transmit, distribute, disseminate, sell, publishor sublicense the work or any part of it without McGraw-Hill’s prior consent. You may use the work for yourown noncommercial and personal use; any other use of the work is strictly prohibited. Your right to use the workmay be terminated if you fail to comply with these terms.
THE WORK IS PROVIDED “AS IS”. McGRAW-HILL AND ITS LICENSORS MAKE NO GUARANTEESOR WARRANTIES AS TO THE ACCURACY, ADEQUACY OR COMPLETENESS OF OR RESULTS TO BEOBTAINED FROM USING THE WORK, INCLUDING ANY INFORMATION THAT CAN BE ACCESSEDTHROUGH THE WORK VIA HYPERLINK OR OTHERWISE, AND EXPRESSLY DISCLAIM ANY WAR-RANTY, EXPRESS OR IMPLIED, INCLUDING BUT NOT LIMITED TO IMPLIED WARRANTIES OFMERCHANTABILITY OR FITNESS FOR A PARTICULAR PURPOSE. McGraw-Hill and its licensors do notwarrant or guarantee that the functions contained in the work will meet your requirements or that its operationwill be uninterrupted or error free. Neither McGraw-Hill nor its licensors shall be liable to you or anyone else forany inaccuracy, error or omission, regardless of cause, in the work or for any damages resulting therefrom.McGraw-Hill has no responsibility for the content of any information accessed through the work. Under no cir-cumstances shall McGraw-Hill and/or its licensors be liable for any indirect, incidental, special, punitive, conse-quential or similar damages that result from the use of or inability to use the work, even if any of them has beenadvised of the possibility of such damages. This limitation of liability shall apply to any claim or cause whatso-ever whether such claim or cause arises in contract, tort or otherwise.
DOI: 10.1036/0071415963

Want to learn more?
We hope you enjoy this McGraw-Hill eBook! If you’d like moreinformation about this book, its author, or related books andwebsites, please click here.

^ ^ ^
ContentsPreface xiiiIntroduction xvi
Part I Six Sigma Implementation and Management 1
Chapter 1 Building the Six Sigma Infrastructure 3What is Six Sigma? 3
Why Six Sigma? 4The Six Sigma philosophy 6The change imperative 11Change agents and their effects on organizations 13
Implementing Six Sigma 20Timetable 22Infrastructure 25Six Sigma deployment and management 31Six Sigma communication plan 31Six Sigma organizational roles and responsibilities 35Selecting the ‘‘Belts’’ 38Integrating Six Sigma and related initiatives 49Deployment to the supply chain 51
Change agent compensation and retention 54Chapter 2 Six Sigma Goals and Metrics 56
Attributes of good metrics 56Six Sigma versus traditional three sigma performance 58The balanced scorecard 61
Measuring causes and effects 62Information systems 64
For more information about this title, click here.
Copyright 2003 by The McGraw-Hill Companies, Inc. Click Here for Terms of Use.

Customer perspective 65Internal process perspective 67Innovation and learning perspective 69Financial perspective 70
Strategy deployment plan 71Information systems requirements 74
Integrating Six Sigma with other information systemstechnologies 74OLAP, data mining, and Six Sigma 79
Dashboard design 79Dashboards for scale data 81Dashboards for ordinal data 84Dashboards for nominal data 87
Setting organizational key requirements 89Benchmarking 91
Chapter 3 Creating Customer-Driven Organizations 97Elements of customer-driven organizations 97
Becoming a customer- and market-driven enterprise 98Elements of the transformed organization 98
Surveys and focus groups 102Strategies for communicating with customers and employees 102Surveys 103Focus groups 113Other customer information systems 114
Calculating the value of retention of customers 116Complaint handling 118
Kano model of customer expectations 119Customer expectations, priorities, needs, and ‘‘voice’’ 119Garden variety Six Sigma only addresses half of the Kanocustomer satisfaction model 120
Quality function deployment (QFD) 121Data collection and review of customer expectations, needs,requirements, and specifications 123
The Six Sigma process enterprise 125Examples of processes 126The source of conflict 128A resolution to the conflict 129Process excellence 130
Using QFD to link Six Sigma projects to strategies 132The strategy deployment matrix 133Deploying differentiators to operations 136
iv Contents
Deploying operations plans to projects 138Linking customer demands to budgets 140
Structured decision-making 140Category importance weights 145Subcategory importance weights 146Global importance weights 147
Chapter 4 Training for Six Sigma 150Training needs analysis 150The strategic training plan 152
Training needs of various groups 153Post-training evaluation and reinforcement 162
Chapter 5 Six Sigma Teams 167Six Sigma teams 167Process improvement teams 168Work groups 169
Quality circles 169Other self-managed teams 170Team dynamics management, including con£ict resolution 171
Stages in group development 172Common problems 173Member roles and responsibilities 173
Facilitation techniques 178When to use an outside facilitator 178Selecting a facilitator 178Principles of team leadership and facilitation 179Facilitating the group task process 181Facilitating the group maintenance process 182
Team performance evaluation 182Team recognition and reward 184
Chapter 6 Selecting and Tracking Six Sigma Projects 187Choosing the right projects 188
Customer value projects 188Shareholder value projects 189Other Six Sigma projects 189
Analyzing project candidates 189Benefit-cost analysis 189A system for assessing Six Sigma projects 190Other methods of identifying promising projects 198Throughput-based project selection 201Multi-tasking and project scheduling 205Summary and preliminary project selection 208
Contents v

Tracking Six Sigma project results 208Financial results validation 211Financial analysis 212Lessons learned capture and replication 233
Part II Six Sigma Tools and Techniques 235
Chapter 7 Introduction to DMAIC and Other ImprovementModels 237
DMAIC, DMADV and learning models 237Design for Six Sigma project framework 239Learning models 241PDCA 243Dynamic models of learning and adaptation 245
The Define Phase
Chapter 8 Problem Solving Tools 252Process mapping 252
Cycle time reduction through cross-functional processmapping 253Flow charts 254
Check sheets 255Process check sheets 256Defect check sheets 257Stratified defect check sheets 257Defect location check sheets 258Cause and effect diagram check sheets 259
Pareto analysis 259How to perform a Pareto analysis 259Example of Pareto analysis 260
Cause and e¡ect diagrams 2617M tools 264
Affinity diagrams 264Tree diagrams 265Process decision program charts 265Matrix diagrams 268Interrelationship digraphs 268Prioritization matrices 269Activity network diagram 273Other continuous improvement tools 273
vi Contents

The Measure Phase
Chapter 9 Basic Principles of Measurement 277Scales of measurement 277Reliability and validity of data 280
Definitions 280Overview of statistical methods 283
Enumerative versus analytic statistical methods 283Enumerative statistical methods 287Assumptions and robustness of tests 290Distributions 291Probability distributions for Six Sigma 293Statistical inference 310Hypothesis testing/Type I and Type II errors 315
Principles of statistical process control 318Terms and concepts 318Objectives and benefits 319Common and special causes of variation 321
Chapter 10 Measurement Systems Analysis 325R&R studies for continuous data 325
Discrimination, stability, bias, repeatability,reproducibility, and linearity 325Gage R&R analysis using Minitab 337Output 338Linearity 341
Attribute measurement error analysis 346Operational definitions 348Example of attribute inspection error analysis 350
Respectability and pairwise reproducibility 352Minitab attribute gage R&R example 356
The Analyze Phase
Chapter 11 Knowledge Discovery 361Knowledge discovery tools 361
Run charts 361Descriptive statistics 368Histograms 371Exploratory data analysis 381
Establishing the process baseline 385Describing the process baseline 387
Contents vii
SIPOC 383Process for creating a SIPOC diagram 389SIPOC example 390
Chapter 12 Statistical Process Control Techniques 393Statistical process control (SPC) 393
Types of control charts 393average and range, average and sigma, control charts forindividual measurements, control charts for proportiondefective, control chart for count of defectives, controlcharts for average occurrences-per-unit, control chartsfor counts of occurrences-per unit
Short-run SPC 430control chart selection, rational subgroup sampling,control charts interpretation
EWMA 453EWMA charts 453SPC and automatic process control 465
Minitab example of EWMAChapter 13 Process Capability Analysis 467
Process capability analysis (PCA) 467How to perform a process capability study 467Statistical analysis of process capability data 471Process capability indexes 472Interpreting capability indexes 473Example of capability analysis using normally distributedvariables data 475
Estimating process yield 484Rolled throughput yield and sigma level 484Normalized yield and sigma level 487
Chapter 14 Statistical Analysis of Cause and E¡ect 490Testing common assumptions 490
Continuous versus discrete data 490Independence assumption 492Normality assumption 493Equal variance assumption 496
Regression and correlation analysis 496Scatter plots 496Correlation and regression 502
Analysis of categorical data 514Chi-square, tables 514
viii Contents

Logistic regression 516binary logistic regression, ordinal logistic regression,and nominal logistic regression
Non-parametric methods 528Guidelines on when to use non-parametric tests 533
Minitab’s nonparametric tests
The Improve Phase
Chapter 15 Managing Six Sigma Projects 534Useful project management tools and techniques 535
Project planning 536Project charter 538Work breakdown structures 541Feedback loops 543Performance measures 544
Gantt charts 544Typical DMAIC project tasks and responsibilities 545PERT-CPM-type project management systems 545Resources 552Resource conflicts 552
Cost considerations in project scheduling 552Relevant stakeholders 556Budgeting 558
Project management implementation 560Management support and organizational roadblocks 560Short-term (tactical) plans 565Cross-functional collaboration 566Continuous review and enhancement of quality process 567Documentation and procedures 568
Chapter 16 Risk Assessment 571Reliability and safety analysis 571
Reliability analysis 571Risk assessment tools 590
Fault free analysis 591Safety analysis 591
Failure mode and e¡ect analysis (FMEA) 596FMEA process 597
Statistical tolerancing 600Assumptions of formula 605Tolerance intervals 606
Contents ix
x Contents
Chapter 17 Design of Experiments (DOE) 607Terminology 608
Definitions 608Power and sample size 610
Example 610Design characteristics 610Types of design 611
One-factor 614Examples of applying common DOEmethods using software 616
Two-way ANOVA with no replicates 617Two-way ANOVA with replicates 618Full and fractional factorial 621
Empirical model building and sequential learning 624Phase 0: Getting your bearings 626Phase I: The screening experiment 627Phase II: Steepest ascent (descent) 631Phase III: The factorial experiment 633Phase IV: The composite design 636Phase V: Robust product and process design 640
Data mining, arti¢cial neural networks and virtual processmapping 644
Example 646
The Control Phase
Chapter 18 Maintaining Control After the Project 649Business process control planning 649
How will we maintain the gains made? 649Tools and techniques useful for control planning 651
Using SPC for ongoing control 652Process control planning for short and small runs 655
Strategies for short and small runs 655Preparing the short run process control plain (PCP) 656
Process audit 658Selecting process control elements 658The single part process 660Other elements of the process control plan 661
PRE-Control 661Setting up PRE-Control 662Using PRE-Control 663

Contents xi
Beyond DMAIC
Chapter 19 Design for Six Sigma (DFSS) 665Preliminary steps 665De¢ne 667
Identify CTQs 667Beyond customer requirementsLidentifying ‘‘delighters’’ 667UsingAHP todetermine the relative importance of theCTQs 668
Measure 670Measurement plan 671
Analyze 671Using customer demands to make design decisions 674Using weighted CTQs in decision-making 678Pugh concept selection method 681
Design 682Predicting CTQ performance 682Process simulation 685Virtual DOE using simulation software 699Design phase cross-references 703
Verify 703Pilot run 704Transition to full-scale operations 704Verify phase cross-references 704
Chapter 20 Lean Manufacturing and Six Sigma 705Introduction to Lean andmuda 705What is value to the customer? 706
Example: Weld dents 706The value definition 707Kinds of waste 708
What is the value stream? 708Value stream mapping 710
How do we make value £ow? 711Example of Takt time calculation 712Spaghetti charts 712
How do we make value £ow at the pull of the customer? 713Tools to help improve flow 714
5S; constraint management; level loading; pullsystems; flexible process; lot size reduction
How can we continue towards perfection? 716KAIZEN 717
Becoming Lean: A tactical perspective 720Six Sigma and Lean 721

Appendix 724Table 19Glossary of basic statistical terms 724Table 29Area under the standard normal curve 730Table 39Critical values of the t-distribution 733Table 49Chi-square distribution 735Table 59F distribution (a ¼ 1%Þ 738Table 69F distribution (a ¼ 5%) 740Table 79Poisson probability sums 742Table 89Tolerance interval factors 746Table 99Durbin-Watson test bounds 750Table 109y factors for computing AOQL 754Table 119Control chart constants 755Table 129Control chart equations 757Table 139Table of d�2 values 759Table 149Power functions for ANOVA 761Table 159Factors for short run control charts for
individuals, X-bar, and R charts 770Table 169Signi¢cant number of consecutive highest or
lowest values from one stream of a multiple-streamprocess 772
Table 179Sample customer survey 773Table 189Process s levels and equivalent PPM quality levels 777Table 199Black Belt e¡ectiveness certi¢cation 778Table 209Green Belt e¡ectiveness certi¢cation 791Table 219AHP using Microsoft ExcelTM 804
References 806Index 814
xii Contents

^ ^ ^
PrefaceFirst, a basic question: just what are organizations anyway? Why do they
exist? Some experts believe that the reason organizations exist is because of thehigh cost of executing transactions in the marketplace. Within an organizationwe can reallocate resources without the need to negotiate contracts, formallytransfer ownership of assets, and so on. No need for lawyers, the managers dothings on their own authority. The question is: how should they do this? In thefree market prices tell us how to allocate resources, but prices don’t exist insideof an organization. We must come up with some alternative.Transaction costs aside, organizations exist to serve constituencies.
Businesses have shareholders or private owners. The equivalent for non-profitsare contributors. Organizations also serve ‘‘customer’’ constituencies. In otherwords, they produce things that other people want. Businesses must producethings that people are willing and able to buy for their own benefit. Non-profitsmust produce things that contributors are willing and able to buy for the benefitof others. Both types of organizations must do one thing: create value. The out-put must be of greater value than the inputs needed to produce it. If the outputserves the constituencies well, the organization is effective. If it creates addedvalue with a minimum of resources, it is efficient. (It is a common misconcep-tion that non-profits don’t need to be efficient. But the only difference betweena for-profit and a not-for-profit is that the ‘‘surplus’’ created by adding value isused for different purposes. A not-for-profit that produces negative value (i.e.,spends more for its output than contributors are willing to pay) will not surviveany more than a business posting continuous losses.) Boards of directors evalu-ate the effectiveness and efficiency of management and have the authority andduty to direct and replace inefficient or ineffective managers.
Copyright 2003 by The McGraw-Hill Companies, Inc. Click Here for Terms of Use.

Six Sigma’s role in all of this is to help management produce the maximumvalue while using minimum resources. It does this by rationalizing manage-ment. By this I mean that it applies scientific principles to processes and pro-ducts. By using the Six Sigma DMAIC� approach processes or products areimproved in the sense that they are more effective, more efficient, or both. Ifno process or product exists, or if existing processes or products are deemedbeyond repair, then design for Six Sigma (DFSS) methods are used to createeffective and efficient processes or products. Properly applied, Six Sigma mini-mizes the negative impact of politics on the organization. Of course, in anyundertaking involving human beings, politics can never be completely elimi-nated. Even in the best of Six Sigma organizations there will still be the occa-sional Six Sigma project where data-based findings are ignored because theyconflict with the preconceived notions of a powerful figure in the organization.But this will be the exception rather than the rule.It should be obvious by now that I don’t view Six Sigma either as a panacea or
as a mere tool. The companies that have successfully implemented Six Sigmaare well-known, including GE, Allied Signal, Intuit, Boeing Satellite Systems,American Express and many others. But the picture isn’t entirely rosy, failuresalso exist, most notably Motorola, the company that invented Six Sigma.��
Running a successful business is an extremely complicated undertaking and itinvolves much more than Six Sigma. Any organization that obsesses on SixSigma to the exclusion of such things as radical innovation, solid financial man-agement, a keen eye for changing external factors, integrity in accounting, etc.can expect to find itself in trouble some day. Markets are akin to jungles, andmuch danger lurks. Six Sigma can help an organization do some things better,but there are places where Six Sigma doesn’t apply. I seriously doubt that SixSigma would’ve helped Albert Einstein discover relativity or Mozart composea better opera. Recognizing the limits of Six Sigma while exploiting its strengthsis the job of senior leadership.If you are working in a traditional organization, deploying Six Sigma will
rock your world. If you are a traditional manager, you will be knocked so farout of your comfort zone that you will literally lose sleep trying to figure outwhat’s happening. Your most cherished assumptions will be challenged byyour boss, the accepted way of doing things will no longer do. A new full-time,temporary position will be created which has a single mission: change the orga-
xiv Preface
�Define, Measure, Analyze, Improve, Control.��Whether Six Sigma has anything to dowithMotorola’s recent problems is hotly debated. But it is undeniable thatMotorola
relied heavily on Six sigma and that it has had difficulties in recent years. Still, Motorola is a fine company with a long and
splendid history, and I expect to see it back on top in the not too distant future.
nization. People with the word ‘‘belt’’ in their job title will suddenly appear,speaking an odd new language of statistics and project management. Whatused to be your exclusive turf will be identified as parts of turf-spanning pro-cesses; your budget authority may be usurped by new ‘‘Process Owners.’’ Thenew change agents will prowl the hallowed halls of your department, continu-ously stirring things up as they poke here and peek there, uncovering ineffi-ciency and waste in places where you never dreamed improvement waspossible. Your data will be scrutinized and once indispensable reports will bediscontinued, leaving you feeling as if you’ve lost the star you use to naviage.New reports, mostly graphical, will appear with peculiar lines on them labeled‘‘control limits’’ and ‘‘process mean.’’ You will need to learn the meaning ofsuch terms to survive in the new organization; in some organizations youwon’t be eligible for advancement until you are a trained ‘‘belt.’’ In others, youwon’t even be allowed to stay.When done properly, the result of deploying Six Sigma is an organization
that does a better job of serving owners and customers. Employees who adaptto the new culture are better paid and happier. The work environment is excit-ing and dynamic and change becomes a way of life. Decisions are based on rea-son and rationality, rather than on mysterious back-room politics.However, when done half-heartedly, Six Sigma (or any other improvement
initiative) is a colossal waste of money and time. The message is clear: do itright, or don’t do it at all.It has been nearly two decades since Six Sigma began and the popularity of
the approach continues to grow. As more and more firms adopt Six Sigma astheir organizational philosophy, they also adapt it to their own unique circum-stances. Thus, Six Sigma has evolved. This is especially true in the way SixSigma is used to operationalize the organization’s strategy. Inspired leaders,such as JackWelch and Larry Bossidy, have incorporated Six Sigma into the fab-ric of their businesses and achieved results beyond the predictions of the mostenthusiastic Six Sigma advocate. Six Sigma has also been expanded frommerelyimproving existing processes to the design of new products and processes thatstart life at quality and performance levels near or above Six Sigma. Six Sigmahas also been integrated with that other big productivity movement, LeanManufacturing. In this second edition I attempt to capture these new develop-ments and show how the new Six Sigma works.
Preface xv

^ ^ ^
IntroductionThe goal of this book remains the same as for the first edition, namely, to pro-
vide you with the comprehensive guidance and direction necessary to realizeSix Sigma’s promise, while avoiding traps and pitfalls commonly encountered.In this book youwill find a complete overview of themanagement and organiza-tion of Six Sigma, the philosophy which underlies Six Sigma, and those problemsolving techniques and statistical tools most often used in Six Sigma. It is notintended to be an ASQ certification study guide, although it includes coverageof most of the topics included in the ASQ body of knowledge. Rather it isintended as a guide for champions, leaders, ‘‘belts,’’ team members and othersinterested in using the Six Sigma approach to make their organizations moreefficient, more effective, or both. In short, it is a user’s manual, not a classroomtextbook.Compared to the first edition, you will find less discussion of theory. I love
theory, but Six Sigma is quite hard-nosed in its bottom-line emphasis and Iknow that serious practitioners are more interested in how to use the tools andtechniques to obtain results than in the theory underlying a particular tool.(Of course, theory is provided to the extent necessary to understand the properuse and limitations of a given tool.) Minitab and other software are used exten-sively to illustrate how to apply statistical techniques in a variety of situationsencountered during Six Sigma projects. I believe that one of the major differ-ences between Six Sigma and previous initiatives, such as TQM, is the integra-tion of powerful computer-based tools into the training. Many actual examplesare used, making this book something of a practical guide based on the schoolof hard knocks.Several different constituencies can benefit from this book. To serve these
constituents I separate the book into different parts. Part I is aimed at senior
Copyright 2003 by The McGraw-Hill Companies, Inc. Click Here for Terms of Use.
leaders and those managers who are charged with developing strategies anddeploying the Six Sigma systems within the organization. In Part I you willfind a high level presentation of the philosophy behind Six Sigma, but I getdown to the nuts and bolts very quickly. By this I mean identifying how SixSigma will change the organization, and answer such questions as what are thenew positions that will be created? What knowledge, skills, abilities and perso-nal attributes should those filling these positions possess? What personnelassessment criteria should be used, and how can these criteria be used to evalu-ate candidates? Do we need to formally test applicants? What are the specificresponsibilities of people in the organization with respect to Six Sigma?Unless such issues are carefully considered and addressed, Six Sigma will fail.There’s no real point to training Black Belts, Green Belts, and other parts ofthe Six Sigma infrastructure if the supporting superstructure isn’t in place.Part I also addresses the issue of linking Six Sigma to the enterprise’s strategic
goals and objectives. Six Sigma is not Management By Objectives, but MBOdidn’t fail because it was an entirely bad idea. What was missing from MBOwas an understanding that results are process-driven and the development of aresource pool and the building of an infrastructure that was dedicated to drivingthe change necessary to accomplish the objectives. With Six Sigma one doesn’tachieve objectives by directly manipulating results, but by changing the waythings are done. The driving force behind this change are the ‘‘belts,’’ who arehighly trained full- and part-time change agents. These people lead and supportprojects, and it is the projects that drive change. But not just any projects willdo. Projects must be derived from the needs of the enterprise and its customers.This is accomplished via a rigorous flow-down process that starts at the top ofthe organization. In addition to describing the mechanisms that accomplishthis linkage, Part I describes the importance of rewards and incentives to suc-cess. In short, Six Sigma becomes the way senior leaders reach their goals.Part II presents the tools and techniques of Six Sigma. Six Sigma provides
an improvement framework known as Define-Measure-Analyze-Improve-Control (DMAIC), and I have elected to organize the technical material withinthe DMAIC framework. It is important to note that this isn’t always the bestway to first learn these techniques. Indeed, as a consultant I find that the BlackBelt trainee often needs to use tools from the improve or control phase whileshe is still working in the define or measure phase of her project. Also,DMAIC is often used to establish ‘‘tollgates’’ at the end of each phase to helpwith project tracking, but there is usually considerable back-and-forth move-ment between the phases as the project progresses and one often finds that a‘‘closed gate’’ must be kept at least partially ajar. Still, DMAIC serves the impor-tant purpose of providing a context for a given tool and a structure for thechange process.
Introduction xvii

The presentation of DMAIC is followed by design for Six Sigma (DFSS)principles and practices. The DFSS methodology focuses on the Define-Measure-Analyze-Design-Verify (DMADV) approach, which builds on thereader’s understanding of DMAIC. DFSS is used primarily when there is noprocess in existence, or when the existing process is to be completely redesigned.Finally, a chapter on Lean Manufacturing provides the reader with an over-
view of this important topic and discusses its relationship to Six Sigma.
DMAIC overview. The De¢ne phase of the book covers process mapping and £owcharting,project charter development, problem solving tools, and the so-called 7Mtools.
. Measure covers the principles of measurement, continuous and discretedata, scales of measurement, an overview of the principles of variation,and repeatability-and-reproducibility (RR) studies for continuous anddiscrete data.
. Analyze covers establishing a process base line, how to determine processimprovement goals, knowledge discovery, including descriptive andexploratory data analysis and datamining tools, the basic principles of sta-tistical process control (SPC), specialized control charts, process capabil-ity analysis, correlation and regression analysis, analysis of categoricaldata, and non-parametric statistical methods.
. Improve covers project management, risk assessment, process simula-tion, design of experiments (DOE), robust design concepts (includingTaguchi principles), and process optimization.
. Control covers process control planning, using SPC for operationalcontrol, and PRE-control.
DFSS covers the DMADV framework for process design, statistical toleran-cing, reliability and safety, using simulation software to analyze variation andrisk, and performing ‘‘virtual DOE’’ using simulation software and artificialneural networks.Lean covers the basic principles of Lean, Lean tools and techniques, and a
framework for deployment. It also discusses the considerable overlap betweenLean and Six Sigma and how to integrate the two related approaches to achieveprocess excellence.
xviii Introduction
^ ^ ^PART
I
Six Sigma Implementationand Management
Copyright 2003 by The McGraw-Hill Companies, Inc. Click Here for Terms of Use.

This page intentionally left blank.

^ ^ ^CHAPTER
1
Building the Six SigmaInfrastructure
WHAT IS SIX SIGMA?This section provides a 10,000 foot overview of Six Sigma. Subsequent sec-
tions elaborate and provide additional information on tools and techniques.Six Sigma is a rigorous, focused and highly effective implementation of pro-
ven quality principles and techniques. Incorporating elements from the workofmany quality pioneers, Six Sigma aims for virtually error free business perfor-mance. Sigma, s, is a letter in the Greek alphabet used by statisticians to mea-sure the variability in any process. A company’s performance is measured bythe sigma level of their business processes. Traditionally companies acceptedthree or four sigma performance levels as the norm, despite the fact that theseprocesses created between 6,200 and 67,000 problems permillion opportunities!The Six Sigma standard of 3.4 problems per million opportunities* is a responseto the increasing expectations of customers and the increased complexity ofmodern products and processes.If you’re looking for new techniques, don’t bother. Six Sigma’s magic isn’t in
statistical or high-tech razzle-dazzle. Six Sigma relies on tried and true methodsthat have been around for decades. In fact, Six Sigma discards a great deal of
*Statisticians note: the area under the normal curve beyond Six Sigma is 2 parts-per-billion. In calculating failure rates for SixSigma purposes we assume that performance experienced by customers over the life of the product or process will be muchworse than internal short-term estimates predict. To compensate, a ‘‘shift’’ of 1.5 sigma from the mean is added before calcu-lating estimated long-term failures. Thus, youwill find 3.4 parts-per-million as the area beyond 4.5 sigma on the normal curve.
Copyright 2003 by The McGraw-Hill Companies, Inc. Click Here for Terms of Use.
the complexity that characterized Total Quality Management (TQM). By oneexpert’s count, there were over 400 TQM tools and techniques. Six Sigmatakes a handful of provenmethods and trains a small cadre of in-house technicalleaders, known as Six Sigma Black Belts, to a high level of proficiency in theapplication of these techniques. To be sure, some of the methods Black Beltsuse are highly advanced, including up-to-date computer technology. But thetools are applied within a simple performance improvement model known asDefine-Measure-Analyze-Improve-Control, or DMAIC. DMAIC is describedbriefly as follows:
D De¢ne the goals of the improvement activity.
M Measure the existing system.
A Analyze the system to identify ways to eliminate the gapbetween the current performance of the system orprocess and the desired goal.
I Improve the system.
C Control the new system.
Why Six Sigma?When a Japanese firm took over a Motorola factory that manufactured
Quasar television sets in the United States in the 1970s, they promptly setabout making drastic changes in the way the factory operated. Under Japanesemanagement, the factory was soon producing TV sets with 1/20th as manydefects as they had produced under Motorola’s management. They did thisusing the same workforce, technology, and designs, and did it while loweringcosts, making it clear that the problem was Motorola’s management. It took awhile but, eventually, even Motorola’s own executives finally admitted ‘‘Ourquality stinks’’ (Main, 1994).It took until nearly the mid-1980s before Motorola figured out what to do
about it. Bob Galvin, Motorola’s CEO at the time, started the company onthe quality path known as Six Sigma and became a business icon largely as aresult of what he accomplished in quality at Motorola. Using Six SigmaMotorola became known as a quality leader and a profit leader. AfterMotorola won the Malcolm Baldrige National Quality Award in 1988 thesecret of their success became public knowledge and the Six Sigma revolutionwas on. Today it’s hotter than ever. Even though Motorola has been struggling
4 BUILDING THE SIX SIGMA INFRASTRUCTURE

the past few years, companies such as GE and AlliedSignal have taken up theSix Sigma banner and used it to lead themselves to new levels of customer ser-vice and productivity.It would be a mistake to think that Six Sigma is about quality in the tradi-
tional sense. Quality, defined traditionally as conformance to internal require-ments, has little to do with Six Sigma. Six Sigma is about helping theorganization make more money by improving customer value and efficiency.To link this objective of Six Sigma with quality requires a new definition ofquality. For Six Sigma purposes I define quality as the value added by a pro-ductive endeavor. Quality comes in two flavors: potential quality and actualquality. Potential quality is the known maximum possible value added perunit of input. Actual quality is the current value added per unit of input. Thedifference between potential and actual quality is waste. Six Sigma focuseson improving quality (i.e., reducing waste) by helping organizations produceproducts and services better, faster and cheaper. There is a direct correspon-dence between quality levels and ‘‘sigma levels’’ of performance. For example,a process operating at Six Sigma will fail to meet requirements about 3 timesper million transactions. The typical company operates at roughly foursigma, which means they produce roughly 6,210 failures per million transac-tions. Six Sigma focuses on customer requirements, defect prevention, cycletime reduction, and cost savings. Thus, the benefits from Six Sigma go straightto the bottom line. Unlike mindless cost-cutting programs which also reducevalue and quality, Six Sigma identifies and eliminates costs which provide novalue to customers, waste costs.For non-Six Sigma companies, these costs are often extremely high.
Companies operating at three or four sigma typically spend between 25 and 40percent of their revenues fixing problems. This is known as the cost of quality,or more accurately the cost of poor quality. Companies operating at Six Sigmatypically spend less than 5 percent of their revenues fixing problems (Figure1.1). COPQ values shown in Figure 1.1 are at the lower end of the range ofresults reported in various studies. The dollar cost of this gap can be huge.General Electric estimated that the gap between three or four sigma and SixSigma was costing them between $8 billion and $12 billion per year.One reason why costs are directly related to sigma levels is very simple: sigma
levels are a measure of error rates, and it costs money to correct errors. Figure1.2 shows the relationship between errors and sigma levels. Note that the errorrate drops exponentially as the sigma level goes up, and that this correlateswell to the empirical cost data shown in Figure 1.1. Also note that the errorsare shown as errors per million opportunities, not as percentages. This isanother convention introduced by Six Sigma. In the past we could tolerate per-centage error rates (errors per hundred opportunities), today we cannot.
What Is Six Sigma? 5

The Six Sigma philosophySix Sigma is the application of the scientific method to the design and opera-
tion of management systems and business processes which enable employeesto deliver the greatest value to customers and owners. The scientific methodworks as follows:1. Observe some important aspect of the marketplace or your business.2. Develop a tentative explanation, or hypothesis, consistent with your
observations.3. Based on your hypothesis, make predictions.4. Test your predictions by conducting experiments or making further
careful observations. Record your observations. Modify your hypothesisbased on the new facts. If variation exists, use statistical tools to helpyou separate signal from noise.
5. Repeat steps 3 and 4 until there are no discrepancies between the hypoth-esis and the results from experiments or observations.
At this point you have a viable theory explaining an important relationship inyour market or business. The theory is your crystal ball, which you can use topredict the future. As you can imagine, a crystal ball is a very useful thing tohave around. Furthermore, it often happens that your theory will explain thingsother than the thing you initially studied. Isaac Newton’s theory of gravitymay have begun with the observation that apples fell towards the earth, butNewton’s laws of motion explained a great deal about the way planets movedabout the sun. By applying the scientific method over a period of years you willdevelop a deep understanding of what makes your customer and your businesstick.
6 BUILDING THE SIX SIGMA INFRASTRUCTURE
Figure 1.1. Cost of poor quality versus sigma level.
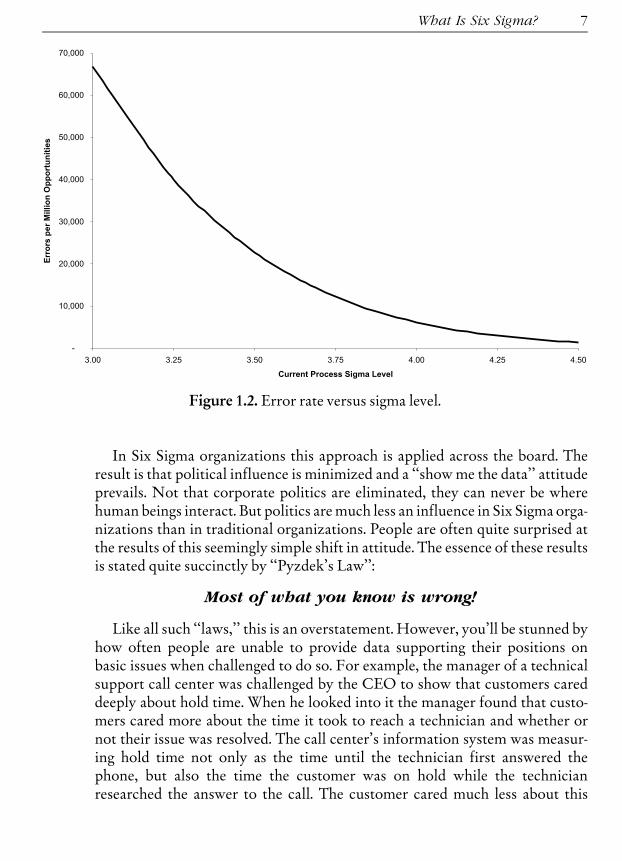
In Six Sigma organizations this approach is applied across the board. Theresult is that political influence is minimized and a ‘‘showme the data’’ attitudeprevails. Not that corporate politics are eliminated, they can never be wherehuman beings interact. But politics aremuch less an influence in Six Sigma orga-nizations than in traditional organizations. People are often quite surprised atthe results of this seemingly simple shift in attitude. The essence of these resultsis stated quite succinctly by ‘‘Pyzdek’s Law’’:
Most of what you know is wrong!
Like all such ‘‘laws,’’ this is an overstatement. However, you’ll be stunned byhow often people are unable to provide data supporting their positions onbasic issues when challenged to do so. For example, the manager of a technicalsupport call center was challenged by the CEO to show that customers careddeeply about hold time. When he looked into it the manager found that custo-mers cared more about the time it took to reach a technician and whether ornot their issue was resolved. The call center’s information system was measur-ing hold time not only as the time until the technician first answered thephone, but also the time the customer was on hold while the technicianresearched the answer to the call. The customer cared much less about this
What Is Six Sigma? 7
Figure 1.2. Error rate versus sigma level.

‘‘hold time’’ because it helped with the resolution of the issue. This fundamentalchange in focus made a great deal of difference in the way the call center oper-ated.
The Six Sigma philosophy focuses the attention of everyone on the stakeholdersfor whom the enterprise exists. It is a cause-and-effect mentality. Well-designedmanagement systems and business processes operated by happy employeescause customers and owners to be satisfied or delighted. Of course, none ofthis is new. Most leaders of traditional organizations honestly believe that thisis what they already do. What distinguishes the traditional approach from SixSigma is the degree of rigor.
JUST DO IT!Six Sigma organizations are not academic institutions. They compete in the
fast-paced world of business and they don’t have the luxury of taking years tostudy all aspects of a problem before deciding on a course of action. A valuableskill for the leader of a Six Sigma enterprise, or for the sponsor of a Six Sigmaproject, is to decidewhen enough information has been obtained towarrant tak-ing a particular course of action and moving on. Six Sigma leadership is veryhard-nosed when it comes to spending the shareholder’s dollars and projectresearch tends to be tightly focused on delivering information useful for man-agement decision-making. Once a level of confidence is achieved, managementmust direct the Black Belt to move the project from the Analyze phase to the
8 BUILDING THE SIX SIGMA INFRASTRUCTURE
What we know
We all know that there was a surge in births nine months after theNovember1965 New York City power failure, right? After all, theNew York T|mes said soin a story that ran August 8, 1966. If that’s not prestigious enough for you, con-sider that the source quoted in the T|mes article was the city’s Mt. SinaiHospital, one of the best.
What the data show
The newspaper compared the births on August 8, 1965 with those on August8, 1966. This one-day comparison did indeed show an increase year-over-year.However, J. Richard Udry, director of the Carolina Population Center at theUniversity of North Carolina, studied birthrates at several NewYork City hos-pitals between July 27 and August 14, 1966. His ¢nding: the birthrate ninemonths after the blackout was slightly below the ¢ve-year average.

Improve phase, or from the Improve phase to the Control phase. Projects areclosed and resources moved to new projects as quickly as possible.Six Sigma organizations are not infallible, they make their share of mistakes
and miss some opportunities they might have found had they taken time toexplore more possibilities. Still, they make fewer mistakes than their traditionalcounterparts and scholarly research has shown that they perform significantlybetter in the long run.
WHAT’S IMPORTANT?While working with an aerospace client, I was helping an executive set up a
system for identifying potential Six Sigma projects in his area. I asked ‘‘Whatare your most important metrics? What do you focus on?’’ ‘‘That’s easy,’’ heresponded. ‘‘We just completed our monthly ops review so I can show you.’’He then called his secretary and asked that she bring the ops review copies.
Soon the secretary came in lugging three large, loose-leaf binders filled withcopies of PowerPoint slides. This executive and his staff spend one very longday each month reviewing all of these metrics, hoping to glean some directionto help them plan for the future. This is not focusing, it’s torture!Sadly, this is not an isolated case. Over the years I’ve worked with thousands
of people in hundreds of companies and this measurement nightmare is com-monplace, even typical. The human mind isn’t designed to make sense of suchvast amounts of data. Crows can track three or four people, beyond that theylose count.* Like crows, we can only hold a limited number of facts in ourminds at one time. We are simply overwhelmed when we try to retain toomuch information. One study of information overload found the following(Waddington, 1996):
. Two-thirds of managers report tension with work colleagues, and loss ofjob satisfaction because of stress associated with information overload.
. One-third of managers su¡er from ill health, as a direct consequence ofstress associated with information overload. This ¢gure increases to 43%among senior managers.
. Almost two-thirds (62%) of managers testify that their personal relation-ships su¡er as a direct result of information overload.
. 43% of managers think important decisions are delayed, and the ability tomake decisions is a¡ected as a result of having too much information.
. 44% believe the cost of collating information exceeds its value to business.
What Is Six Sigma? 9
*See Joe Wortham, ‘‘Corvus brachyhynchos,’’ http://www.usd.edu/�jwortham/corvus/corvus.html.
Clearly, more information isn’t always better.When pressed, nearly every executive or manager will admit that there are
a half-dozen or so measurements that really matter. The rest are either deriva-tives or window dressing. When asked what really interested him, my clientimmediately turned to a single slide in the middle of one of the binders.There were two ‘‘Biggies’’ that he focused on. The second-level drill downinvolved a half-dozen major drivers. Tracking this number of metrics is wellwithin the abilities of humans, if not crows! With this tighter focus the execu-tive could put together a system for selecting good Six Sigma projects andteam members.Six Sigma activities focus on the few things thatmatter most to three key con-
stituencies: customers, shareholders, and employees. The primary focus is oncustomers, but shareholder interests are not far behind. The requirements ofthese two groups are determined using scientific methods, of course. But thescience of identifying what people want is not fully mature, so the data are sup-plemented with a great deal of personal contact at all levels of the organization.Employee requirements are also aggressively sought. Well-treated employeesstay longer and do a better job.
DOCUMENTED BENEFITSFocus comes from two perspectives: down from the top-level goals and up
from problems and opportunities. The opportunities meet the goals at the SixSigma project. Six Sigma projects link the activities of the enterprise to itsimprovement goals. The linkage is so tight that in a well-run enterprise peopleworking on Six Sigma projects can tell you which enterprise objectives will beimpacted by their project, and senior leaders are able to measure the impact ofSix Sigma on the enterprise in clear and meaningful terms. The costs and bene-fits of Six Sigma are monitored using enterprise-wide tracking systems that canslice and dice the data in many different ways. At any point in time an executivecan determine if Six Sigma is pulling its weight. In many TQM programs of thepast people were unable to point to specific bottom-line benefits, so interest gra-dually waned and the programs were shelved when times got tough. Six Sigmaorganizations know precisely what they’re getting for their investment.Six Sigma also has an indirect benefit on an enterprise, and one that is sel-
dom measured. That benefit is its impact on the day-to-day way of doingthings. Six Sigma doesn’t operate in a vacuum. When people observe SixSigma getting dramatic results, they naturally modify the way they approachtheir work. Seat-of-the-pants management doesn’t sit well (pardon the pun!)in Six Sigma organizations that have reached ‘‘critical mass.’’ Critical massoccurs when the organization’s culture has changed as a result of Six Sigma
10 BUILDING THE SIX SIGMA INFRASTRUCTURE
being successfully deployed in a large segment of the organization. The initialclash of cultures has worked itself out and those opposed to the Six Sigmaway have either left, converted, or learned to keep quiet.There is also a ‘‘dark side’’ to Six Sigma that needs to be discussed. There are
parts of the enterprise that don’t lend themselves to scientific rigor. For exam-ple, successful R&D involves a good deal of original creative thinking. The‘‘R’’ (research) part of R&D may actually suffer from too much rigor and theSix Sigma focus on defects. Cutting edge research is necessarily trial and errorand requires a high tolerance for failure. The chaos of exploring new ideas isnot something to be managed out of the system, it is to be expected and encour-aged. To the extent that it involves process design and product testing, SixSigma may be able to make a contribution to the ‘‘D’’ (development) part ofR&D. The point is to selectively apply Six Sigma to those areas where it willprovide a benefit.A second aspect of Six Sigma’s dark side is that some companies obsess on it
to the exclusion of other important aspects of the business. Business is a com-plex undertaking and leading a business enterprise requires creativity, innova-tion, and intuition. While it’s all well and good to be ‘‘data driven,’’ leadersneed to heed their inner voice as well. Keep in mind that some of the mostimportant things are unmeasured and immeasurable. Challenge counterintui-tive data and subject it to a gut check. It may be that the counterintuitive resultrepresents a startling breakthrough in knowledge, but it may simply be wrong.Here’s an example. A software client had a technical support call center to
help their customers solve problems with the software. Customer surveys werecollected and the statistician made an amazing discovery; hold time didn’t mat-ter! The data showed that customer satisfaction was the same for customersserved immediately and for those on hold for an hour or more. Discussionsbegan along the lines of how many fewer staff would be required due to thisnew information. Impressive savings were forecast.Fortunately, the support center manager hadn’t left his skepticism at the
front door. He asked for additional data, which showed that the abandon rateincreased steadily as people were kept on hold. The surveys were given only tothose people who had waited for service. These people didn’t mind waiting.Those who hung up the phone before being served apparently did. In fact,when a representative sample was obtained, excessive hold timewas the numberone complaint.
The change imperativeSix Sigma is not a completely newway tomanage an enterprise, but it is a very
different way. In essence, Six Sigma forces change to occur in a systematic way.
What Is Six Sigma? 11

In traditional organizations the job of management is to design systems to cre-ate and deliver value to customers and shareholders. This is, of course, a never-ending task. Competitors constantly innovate in an attempt to steal your custo-mers. Customers continuously change their minds about what they want.Capital markets offer investors new ways to earn a return on their investment.The result is an imperative to constantly change management systems.Despite the change imperative, most enterprises resist change until there are
obvious signs that current systems are failing one or more stakeholder groups.Perhaps declining market share makes it clear that your products or services arenot as competitive as they once were. Or maybe your customers are still loyal,but customer complaints have reached epidemic proportions. Or your shareprice may be trending ominously downward. Traditional organizations watchfor such signs and react to them. Change occurs, as it must, but it does so in anatmosphere of crisis and confusion. Substantial lossmay result before theneededredesign is complete. Peoplemay lose their jobs or even their careers.Many orga-nizations that employ these reactionary tactics don’t survive the shock.The Six Sigma enterprise proactively embraces change by explicitly incor-
porating change into their management systems. Full- and part-time changeagent positions are created and a complete infrastructure is created. As contra-dictory as it sounds, the infrastructure is designed to make change part of theroutine. New techniques are used to monitor changing customer, shareholder,and employee inputs, and to rapidly integrate the new information by changingbusiness processes. The approach employs sophisticated computer modeling,mathematics, and statistical analysis tominimize unneeded tampering by separ-ating signal from noise. These analytical techniques are applied to stakeholderinputs and to enterprise and process metrics at all levels.As a consequence of deploying Six Sigma, people require a great deal of train-
ing. Communication systems are among the first things that need to be changedso people know what to make of the new way of doing things. Think about it;when Six Sigma is deployed the old reports are no longer used. Six Sigmarequires that internal data be presented only if there is a direct linkage to a stake-holder. The phrase ‘‘How do you know?’’ is heard repeatedly.
. ‘‘Nice report on on-time deliveries, Joan, but showme why you think thisis important to the customer. If it is, I want to see a chart covering thelast 52 weeks, and don’t forget the control limits.’’
. ‘‘This budget variance report is worthless! I want to see performanceacross time, with control limits.’’
. ‘‘Have these employee survey results been validated? What is the reliabil-ity of the questions? What are the main drivers of employee satisfaction?How do you know?’’
. ‘‘How do your dashboards relate to the top-level dashboards?’’
12 BUILDING THE SIX SIGMA INFRASTRUCTURE

Add to this the need to do more than simply operate the system you workwith. Six Sigma demands that you constantly look for ways to improve your sys-tems. This often means that systems are eliminated entirely. In the face of thisinsecurity, employees watch like a hawk for signs of leadership inconsistency.Trust is essential. Leaders who don’t communicate a clear and consistentmessage and walk the talk will be faced with stiff resistance to Six Sigma.The need for a well-designed approach to making the transition from a tradi-
tional organization to a Six Sigma organization is clear. This is the subject ofPart I of this book. It is the foundation building phase. If it isn’t done properly,then the DMAIC approach and all of the tools and techniques presented laterin the book will be of little use.
Change agents and their effects on organizationsMANAGING CHANGEExperts agree: change is difficult, disruptive, expensive, and a major cause of
error. Given these problems, it’s reasonable to ask: Why change? Here are themost common reasons organizations choose to face the difficulties involvedwith change:
. LeadershipLSome organizations choose to maintain product or serviceleadership as a matter of policy. Change is a routine.
. CompetitionLWhen competitors improve their products or servicessuch that their o¡ering provides greater value than yours, you are forcedto change. Refusal to do sowill result in the loss of customers and revenuesand can even lead to complete failure.
. Technological advancesLE¡ectively and quickly integrating new tech-nology into an organization can improve quality and e⁄ciency and pro-vide a competitive advantage. Of course, doing so involves changingmanagement systems.
. Training requirementsLMany companies adopt training programswithout realizing that many such programs implicitly involve change.For example, a company that provides employees with SPC trainingshould be prepared to implement a process control system. Failure to doso leads to morale problems and wastes training dollars.
. Rules and regulationsLChange can be forced on an organization frominternal regulators via policy changes and changes in operating proce-dures. Government and other external regulators and rule-makers (e.g.,ISO for manufacturing, JCAHO for hospitals) can also mandate change.
. Customer demandsLCustomers, large and small, have the annoyinghabit of refusing to be bound by your policies. The nice customers will
What Is Six Sigma? 13

demand that you change your policy and procedures. The really nastycustomers don’t say anything at all, they simply go somewhere else to dobusiness.
Johnson (1993b, p. 233) gives the following summary of change management:1. Change will meet resistance for many di¡erent reasons.2. Change is a balance between the stable environment and the need to
implement TQM [Six Sigma]. Change can be painful while it providesmany improvements.
3. There are four times change can most readily be made by the leader:when the leader is new on the job, receives new training, has new tech-nology, or when outside pressures demand change.
4. Leaders must learn to implement change they deem necessary, changesuggested from above their level, and change demanded from abovetheir level.
5. There are all kinds of reaction to change. Some individuals will resist,some will accept, and others will have mixed reactions.
6. There is a standard process that supports the implementation of change.Some of the key requirements for change are leadership, empathy, andsolid communications.
7. It is important that each leader become a change leader. This requiresself-analysis and the will to change those things requiring change.
ROLESChange requires new behaviors from everyone involved. However, four spe-
cific roles commonly appear during most successful change processes(Hutton, 1994, pp. 2^4):
. O⁄cial change agent. An o⁄cially designated person who has primaryresponsibility for helping management plan and manage the change pro-cess [Sometimes called ‘‘Champions.’’]
. Sponsors. Sponsors are senior leaders with the formal authority to legit-imize the change. The sponsor makes the change a goal for the organi-zation and ensures that resources are assigned to accomplish it. Nomajor change is possible without committed and suitably placed sponsors.
. Advocate. An advocate for change is someone who sees a need for changeand sets out to initiate the process by convincing suitable sponsors. Thisis a selling role. Advocates often provide the sponsor with guidance andadvice. Advocates may or may not hold powerful positions in the organi-zation.
. Informal change agent. Persons other than the o⁄cial change agent whovoluntarily help plan and manage the change process. While the contri-
14 BUILDING THE SIX SIGMA INFRASTRUCTURE
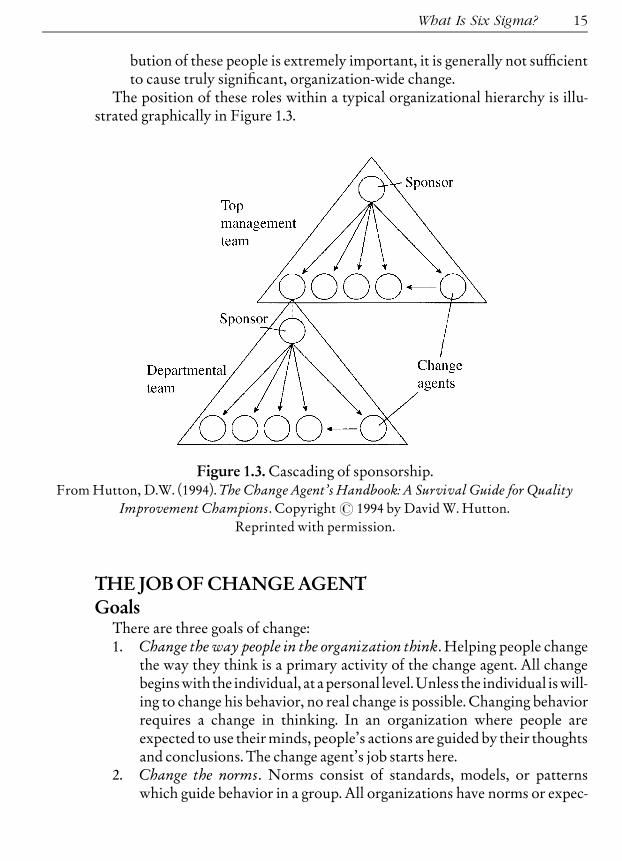
bution of these people is extremely important, it is generally not su⁄cientto cause truly signi¢cant, organization-wide change.
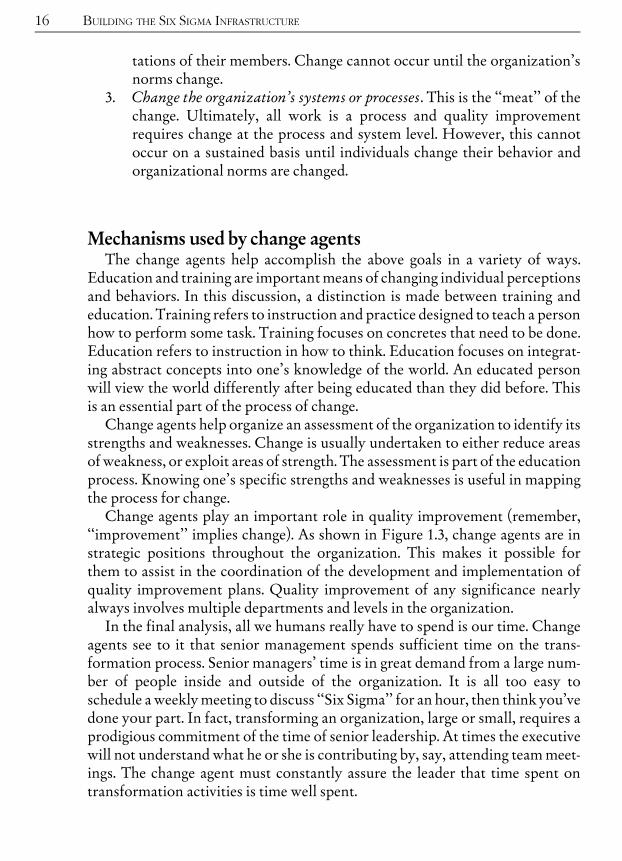
The position of these roles within a typical organizational hierarchy is illu-strated graphically in Figure 1.3.
THE JOB OF CHANGE AGENTGoalsThere are three goals of change:1. Change the way people in the organization think. Helping people change
the way they think is a primary activity of the change agent. All changebeginswith the individual, at apersonal level.Unless the individual iswill-ing to change his behavior, no real change is possible. Changing behaviorrequires a change in thinking. In an organization where people areexpected to use theirminds, people’s actions are guided by their thoughtsand conclusions. The change agent’s job starts here.
2. Change the norms. Norms consist of standards, models, or patternswhich guide behavior in a group. All organizations have norms or expec-
What Is Six Sigma? 15
Figure 1.3. Cascading of sponsorship.FromHutton, D.W. (1994). The Change Agent’s Handbook: A Survival Guide for Quality
Improvement Champions. Copyright# 1994 by David W. Hutton.Reprinted with permission.
tations of their members. Change cannot occur until the organization’snorms change.
3. Change the organization’s systems or processes. This is the ‘‘meat’’ of thechange. Ultimately, all work is a process and quality improvementrequires change at the process and system level. However, this cannotoccur on a sustained basis until individuals change their behavior andorganizational norms are changed.
Mechanisms used by change agentsThe change agents help accomplish the above goals in a variety of ways.
Education and training are importantmeans of changing individual perceptionsand behaviors. In this discussion, a distinction is made between training andeducation. Training refers to instruction and practice designed to teach a personhow to perform some task. Training focuses on concretes that need to be done.Education refers to instruction in how to think. Education focuses on integrat-ing abstract concepts into one’s knowledge of the world. An educated personwill view the world differently after being educated than they did before. Thisis an essential part of the process of change.Change agents help organize an assessment of the organization to identify its
strengths and weaknesses. Change is usually undertaken to either reduce areasof weakness, or exploit areas of strength. The assessment is part of the educationprocess. Knowing one’s specific strengths and weaknesses is useful in mappingthe process for change.Change agents play an important role in quality improvement (remember,
‘‘improvement’’ implies change). As shown in Figure 1.3, change agents are instrategic positions throughout the organization. This makes it possible forthem to assist in the coordination of the development and implementation ofquality improvement plans. Quality improvement of any significance nearlyalways involves multiple departments and levels in the organization.In the final analysis, all we humans really have to spend is our time. Change
agents see to it that senior management spends sufficient time on the trans-formation process. Senior managers’ time is in great demand from a large num-ber of people inside and outside of the organization. It is all too easy toschedule a weeklymeeting to discuss ‘‘Six Sigma’’ for an hour, then think you’vedone your part. In fact, transforming an organization, large or small, requires aprodigious commitment of the time of senior leadership. At times the executivewill not understand what he or she is contributing by, say, attending teammeet-ings. The change agent must constantly assure the leader that time spent ontransformation activities is time well spent.
16 BUILDING THE SIX SIGMA INFRASTRUCTURE

One way of maximizing the value of an executive’s time investment is for theexecutive to understand the tremendous power of certain symbolic events.Some events generate stories that capture the essence of management’s com-mitment (or lack of it) to the change being undertaken. People repeat storiesand remember them far better than proclamations and statements. For exam-ple, there’s a story told by employees of a large U.S. automotive firm that goesas follows:
In the early 1980s the company was just starting their quality improve-ment e¡ort. At a meeting between upper management and a famous qual-ity consultant, someone casually mentioned that quality levels wereseasonalLquality was worse in the summer months. The consultantasked why this should be so. Were di¡erent designs used? Were themachines di¡erent? How about the suppliers of raw materials? Theanswer to each of these questions was ‘‘No.’’ An investigation revealedthat the problem was vacations. When one worker went on vacation,someone else did her job, but not quite as well. And that ‘‘someone’’ alsovacated a job, which was done by a replacement, etc. It turned out thatthe one person going on vacation lead to six people doing jobs they didnot do routinely. The solution was to have a vacation shutdown of twoweeks. This greatly reduced the number of people on new jobs andbrought summer quality levels up to the quality levels experienced therest of the year.This worked ¢ne for a couple of years since there was a recession in the
auto industry and there was plenty of excess capacity. However, one sum-mer the senior executives were asked by the ¢nance department to recon-sider their shutdown policy. Demand had picked up and the companycould sell every car it could produce. The accountants pointed out thatthe shutdown would cost $100 million per day in lost sales.The vice president of the truck division asked if anything had been done
to address the cause of the quality slippage in the summer. No, nothinghad been done. The president asked the sta¡ ‘‘If we go back to the old pol-icy, would quality levels fall like they did before?’’ Yes, he was told, theywould. ‘‘Then we stay with our current policy and shut down the plantsfor vacations,’’ the President announced.The President was challenged by the vice president of ¢nance. ‘‘I know
we’re committed to quality, but are you sure you want to lose $1.4 billionin sales just to demonstrate our commitment?’’ The President replied,‘‘Frank, I’m not doing this to ‘demonstrate’ anything. We almost lost ourcompany a few years back because our quality levels didn’t match ouroverseas competition. Looking at this as a $1.4 billion loss is just the kind
What Is Six Sigma? 17

of short-term thinking that got us in trouble back then. I’m making thisdecision to savemoney.’’
This story had tremendous impact on the managers who heard it, and itspread like wildfire throughout the organization. It demonstrated manythings simultaneously: senior leadership’s commitment to quality, politicalparity between operations and finance, how seemingly harmless policiescan have devastating effects, an illustration of how short-term thinking haddamaged the company in the past, and how long-term thinking worked in aspecific instance, etc. It is a story worth 100 speeches and mission state-ments.
Leadership support activitiesThe change agent provides technical guidance to the leadership team. This
guidance takes the form of presenting management with alternative strategiesfor pursuing the transformation, education on methods that can be used toimplement the strategies, and selection of key personnel for key transformationjobs.Change agents help to monitor the status of quality teams and quality pro-
jects relating to the transformation (see Chapter 15 for a complete discussionof project management). In addition to being a vehicle for local quality improve-ment, projects can be used as one of the mechanisms for actually implementingthe transformation. If used in this way, it is important that projects be properlychartered to align the project activities with the goals of the transformation.All teams, chartered or not, must avoid projects and methods that conflictwith the goals of the transformation. Project team membership must be care-fully planned to assure that both task and groupmaintenance roles are properlyfilled. Project charters must clearly identify the scope of the project to preventthe confusion between teams that results from overlapping charters.Change agents also serve as coaches to senior leaders. Culture involves innu-
merable subtle characteristics and behaviors that become unconsciously‘‘absorbed’’ into one’s being. At times, it is nearly impossible for the individualexecutive to see how his or her behavior or relationships are interpreted byothers. The change agent must quietly advise leadership on these issues.The press of day-to-day business, combined with the inherent difficulties of
change, make it easy to let time slip by without significant progress. Keepingoperations going is a full-time job, and current problems present themselveswith an urgency that meeting a future goal can’t match. Without the constantreminders from change agents that goals aren’t being met, the leadership cansimply forget about the transformation. It is the change agent’s job to become
18 BUILDING THE SIX SIGMA INFRASTRUCTURE

the ‘‘conscience’’ of the leadership and to challenge them when progress fallsshort of goals.
Change networksChange agents should work to develop an internal support network. The net-
work provides resources to support the change process by disseminating educa-tion and guidance. The network’s tasks will eventually be subsumed by normaloperations, but in the early stages of the transformation it is vital that the net-work exist since the control of resources is determined by the existing infra-structure and may be difficult to divert to the change process. Usually, themembers of the network are formal and informal change agents in variousareas of the organization.Once the network has been established, it is the change agent’s job to assure
that the activities in the network are consistent with and in support of the orga-nization’s vision. For example, if a hospital has a vision where physicians obtainreal-time clinical information and decision support at the patient’s bedside,then a financially based and centralized information system is inconsistentwith that vision. The change agent, especially the formal change agent, providesleadership andmoral support to networkmembers, whomay otherwise feel iso-lated and vulnerable. Change agents ensure that members of the networkreceive the education and guidance they need. Finally, the change agent acts asa conduit and a stimulant to maintain regular communication in the network.This may take the form of setting up an email list, scheduling lunches fornetwork members, etc.
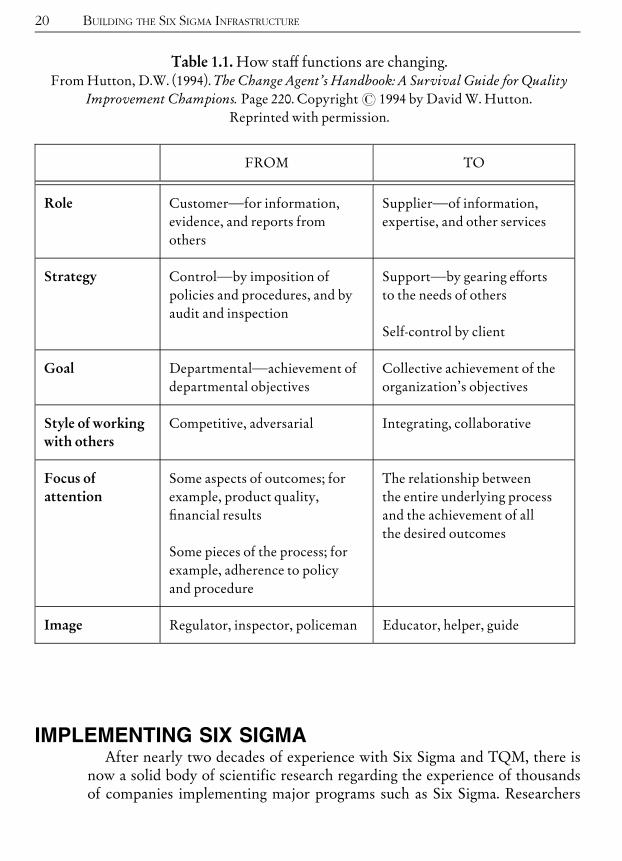
Transforming sta¡ functionsTable 1.1 illustrates the contrast between the way that staff functions used
to operate under the traditional system of management, and the way they canoperate more effectively.There are several ways in which change agents can assist staff functions in
transforming their roles:. Collaborate with sta¡ functions.. Encourage sta¡ functions to take a proactive approach to change.. Make support functions partners in the support network.. Encourage sta¡ members to become role models.. Help sta¡ functions develop transition plans that are aligned and inte-grated with the overall transformation plan.
. Encourage sta¡ members to share their concerns.
What Is Six Sigma? 19
IMPLEMENTING SIX SIGMAAfter nearly two decades of experience with Six Sigma and TQM, there is
now a solid body of scientific research regarding the experience of thousandsof companies implementing major programs such as Six Sigma. Researchers
20 BUILDING THE SIX SIGMA INFRASTRUCTURE
Table 1.1. How sta¡ functions are changing.FromHutton, D.W. (1994). The Change Agent’s Handbook: A Survival Guide for Quality
Improvement Champions. Page 220. Copyright# 1994 by David W. Hutton.Reprinted with permission.
FROM TO
Role CustomerLfor information,evidence, and reports fromothers
SupplierLof information,expertise, and other services
Strategy ControlLby imposition ofpolicies and procedures, and byaudit and inspection
SupportLby gearing e¡ortsto the needs of others
Self-control by client
Goal DepartmentalLachievement ofdepartmental objectives
Collective achievement of theorganization’s objectives
Style of workingwith others
Competitive, adversarial Integrating, collaborative
Focus ofattention
Some aspects of outcomes; forexample, product quality,¢nancial results
Some pieces of the process; forexample, adherence to policyand procedure
The relationship betweenthe entire underlying processand the achievement of allthe desired outcomes
Image Regulator, inspector, policeman Educator, helper, guide

have found that successful deployment of Six Sigma involves focusing on a smallnumber of high-leverage items. The steps required to successfully implementSix Sigma are well-documented.1. Successful performance improvement must begin with senior leader-
ship. Start by providing senior leadership with training in the philoso-phy, principles, and tools they need to prepare their organization forsuccess. Using their newly acquired knowledge, senior leaders directthe development of a management infrastructure to support Six Sigma.Simultaneously, steps are taken to ‘‘soft-wire’’ the organization and tocultivate an environment where innovation and creativity can £ourish.This involves reducing levels of organizational hierarchy, removing pro-cedural barriers to experimentation and change, and a variety of otherchanges designed to make it easier to try new things without fear ofreprisal.
2. Systems are developed for establishing close communication with custo-mers, employees, and suppliers. This includes developing rigorousmeth-ods of obtaining and evaluating customer, owner, employee, andsupplier input. Base line studies are conducted to determine the startingpoint and to identify cultural, policy, and procedural obstacles tosuccess.
3. Training needs are rigorously assessed. Remedial basic skills educa-tion is provided to assure that adequate levels of literacy and numer-acy are possessed by all employees. Top-to-bottom training isconducted in systems improvement tools, techniques, and philoso-phies.
4. A framework for continuous process improvement is developed, alongwith a system of indicators for monitoring progress and success. SixSigma metrics focus on the organization’s strategic goals, drivers, andkey business processes.
5. Business processes to be improved are chosen by management, and bypeople with intimate process knowledge at all levels of the organization.Six Sigma projects are conducted to improve business performancelinked to measurable ¢nancial results. This requires knowledge of theorganization’s constraints.
6. Six Sigma projects are conducted by individual employees and teamslead by Green Belts and assisted by Black Belts.
Although the approach is simple, it is by no means easy. But the results jus-tify the effort expended. Research has shown that firms that successfullyimplement Six Sigma perform better in virtually every business category,including return on sales, return on investment, employment growth, andshare price increase.
Implementing Six Sigma 21

TimetableSix Sigma’s timeline is usually very aggressive. Typically, companies look for
an improvement rate of approximately 10� every two years, measured interms of mistakes or errors using defects per million opportunities (DPMO).*The subject of DPMO is treated in greater detail elsewhere in this book. Forour purposes here, think of DPMO as the organization’s overall performanceas observed by customers. While calculating this can become very complicated,for illustration we will look at a very simple example. Assume that you havethe data on key processes in a technical support call center operation shown inTable 1.2. It is very important to understand that the requirements shown inthis table are derived from customer input. For example, in Table 1.2, the 5 min-ute hold time requirement assumes that we have surveyed customers andfound that they are willing to accept hold times of 5 minutes or less. Likewise,we have data to indicate that support engineers rated higher than 5 are accepta-ble to customers. ‘‘Problem resolved’’ means that the customer told us hisproblem was resolved.A Six Sigma program on a typical timetable would seek to reduce the overall
DPMO from approximately 58,000 to about 5,800 in two years time. Thiswould improve the sigma level from 3.1 to around 4.0 (see Figure 1.2).Remember, Six Sigma corresponds to aDPMOof 3.4, so there’s still a way to go.
22 BUILDING THE SIX SIGMA INFRASTRUCTURE
*This is about twice the rate of improvement reported by companies using TQM. For example, Baldrige winner Milliken &Co. implemented a ‘‘ten-four’’ improvement program requiring reductions in key adverse measures by a factor of ten everyfour years.
Table 1.2. Process defect rates.
Process ElementCalls
HandledCalls MeetingRequirement DPMO
SigmaLevel
Hold time< 5 minutes
120,000 110,000 83,333 2.9
SE rating> 5 119,000 118,000 8,403 3.9
Problem resolved 125,000 115,000 80,000 2.9
Total 364,000 343,000 57,692 3.1
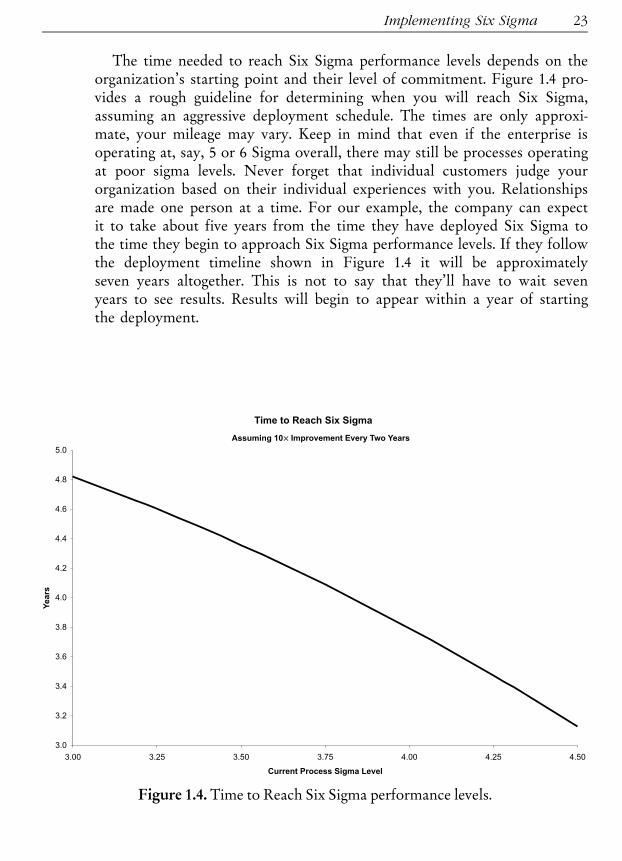
The time needed to reach Six Sigma performance levels depends on theorganization’s starting point and their level of commitment. Figure 1.4 pro-vides a rough guideline for determining when you will reach Six Sigma,assuming an aggressive deployment schedule. The times are only approxi-mate, your mileage may vary. Keep in mind that even if the enterprise isoperating at, say, 5 or 6 Sigma overall, there may still be processes operatingat poor sigma levels. Never forget that individual customers judge yourorganization based on their individual experiences with you. Relationshipsare made one person at a time. For our example, the company can expectit to take about five years from the time they have deployed Six Sigma tothe time they begin to approach Six Sigma performance levels. If they followthe deployment timeline shown in Figure 1.4 it will be approximatelyseven years altogether. This is not to say that they’ll have to wait sevenyears to see results. Results will begin to appear within a year of startingthe deployment.
Implementing Six Sigma 23
×
Figure 1.4. Time to Reach Six Sigma performance levels.
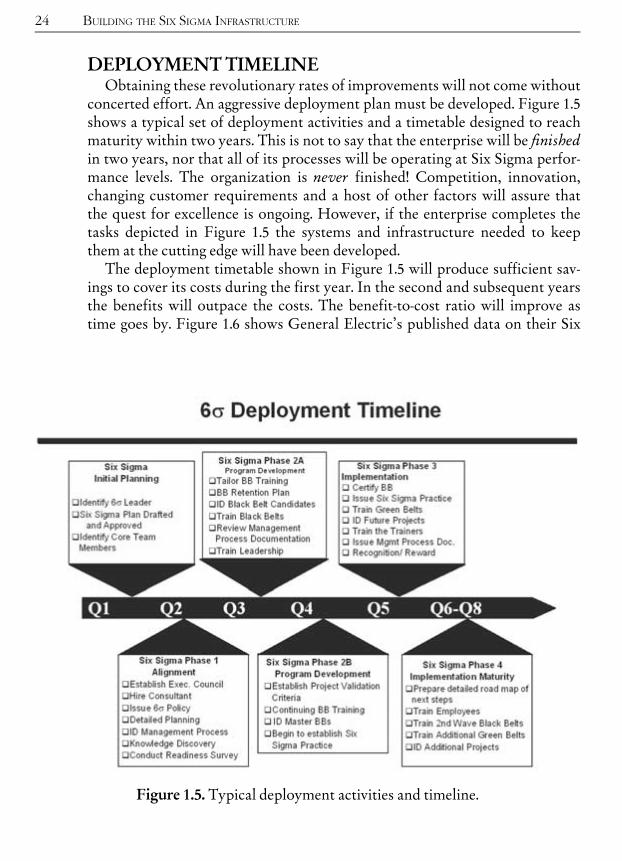
DEPLOYMENT TIMELINEObtaining these revolutionary rates of improvements will not come without
concerted effort. An aggressive deployment plan must be developed. Figure 1.5shows a typical set of deployment activities and a timetable designed to reachmaturity within two years. This is not to say that the enterprise will be finishedin two years, nor that all of its processes will be operating at Six Sigma perfor-mance levels. The organization is never finished! Competition, innovation,changing customer requirements and a host of other factors will assure thatthe quest for excellence is ongoing. However, if the enterprise completes thetasks depicted in Figure 1.5 the systems and infrastructure needed to keepthem at the cutting edge will have been developed.The deployment timetable shown in Figure 1.5 will produce sufficient sav-
ings to cover its costs during the first year. In the second and subsequent yearsthe benefits will outpace the costs. The benefit-to-cost ratio will improve astime goes by. Figure 1.6 shows General Electric’s published data on their Six
24 BUILDING THE SIX SIGMA INFRASTRUCTURE
Figure 1.5. Typical deployment activities and timeline.
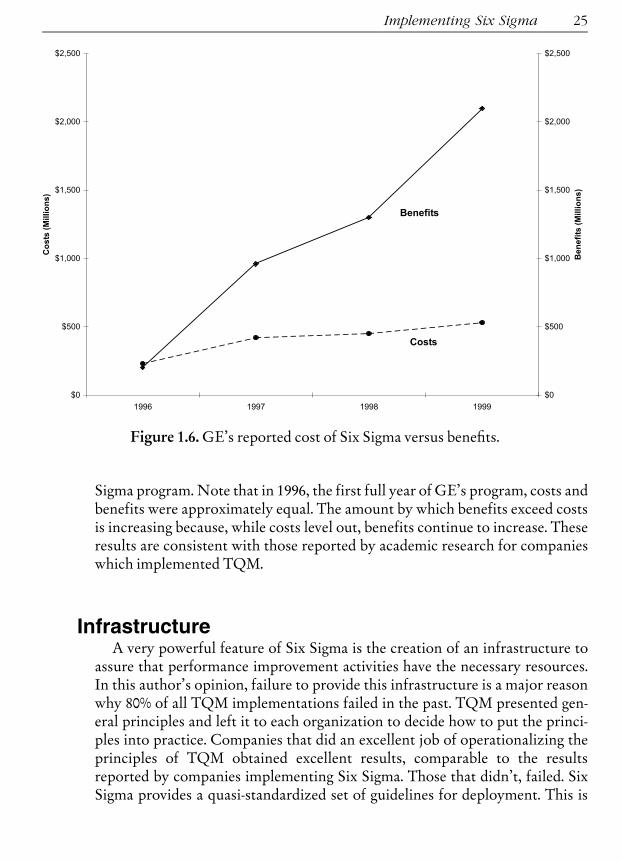
Sigma program. Note that in 1996, the first full year of GE’s program, costs andbenefits were approximately equal. The amount by which benefits exceed costsis increasing because, while costs level out, benefits continue to increase. Theseresults are consistent with those reported by academic research for companieswhich implemented TQM.
InfrastructureA very powerful feature of Six Sigma is the creation of an infrastructure to
assure that performance improvement activities have the necessary resources.In this author’s opinion, failure to provide this infrastructure is a major reasonwhy 80% of all TQM implementations failed in the past. TQM presented gen-eral principles and left it to each organization to decide how to put the princi-ples into practice. Companies that did an excellent job of operationalizing theprinciples of TQM obtained excellent results, comparable to the resultsreported by companies implementing Six Sigma. Those that didn’t, failed. SixSigma provides a quasi-standardized set of guidelines for deployment. This is
Implementing Six Sigma 25
Figure 1.6. GE’s reported cost of Six Sigma versus bene¢ts.
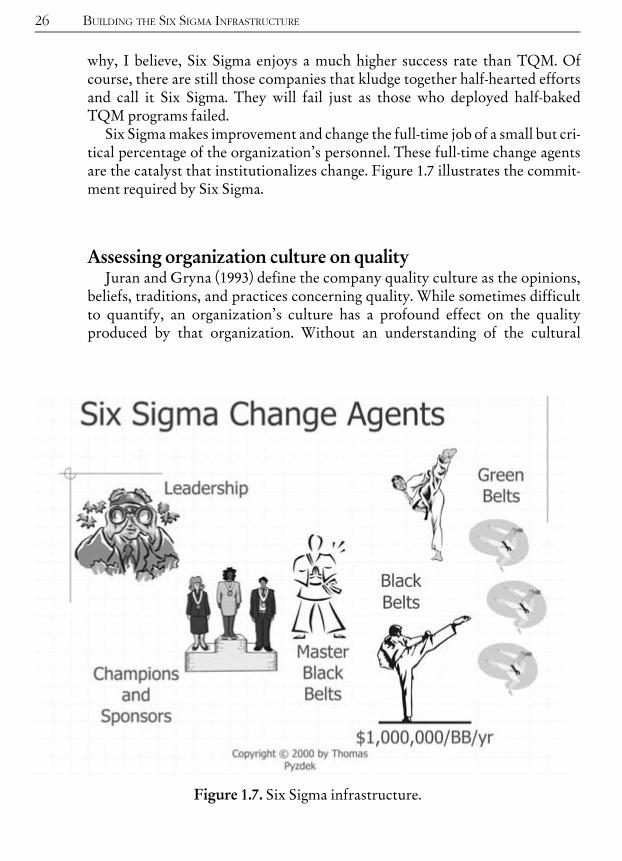
why, I believe, Six Sigma enjoys a much higher success rate than TQM. Ofcourse, there are still those companies that kludge together half-hearted effortsand call it Six Sigma. They will fail just as those who deployed half-bakedTQM programs failed.Six Sigmamakes improvement and change the full-time job of a small but cri-
tical percentage of the organization’s personnel. These full-time change agentsare the catalyst that institutionalizes change. Figure 1.7 illustrates the commit-ment required by Six Sigma.
Assessing organization culture on qualityJuran and Gryna (1993) define the company quality culture as the opinions,
beliefs, traditions, and practices concerning quality. While sometimes difficultto quantify, an organization’s culture has a profound effect on the qualityproduced by that organization. Without an understanding of the cultural
26 BUILDING THE SIX SIGMA INFRASTRUCTURE
Figure 1.7. Six Sigma infrastructure.

aspects of quality, significant and lasting improvements in quality levels areunlikely.Two of the most common means of assessing organization culture is the
focus group and the written questionnaire. These two techniques are discussedin greater detail below. The areas addressed generally cover attitudes, percep-tions, and activities within the organization that impact quality. Because of thesensitive nature of cultural assessment, anonymity is usually necessary. Theauthor believes that it is necessary for each organization to develop its own setof questions. The process of getting the questions is an education in itself. Onemethod for getting the right questions that has produced favorable results inthe past is known as the critical-incident technique. This involves selecting asmall representative sample (n � 20) from the group you wish to survey andasking open-ended questions, such as:
‘‘Which of our organization’s beliefs, traditions and practices have abene¢cial impact on quality?’’‘‘Which of our organization’s beliefs, traditions and practices have a detri-mental impact on quality?’’
The questions are asked by interviewers who are unbiased and the respon-dents are guaranteed anonymity. Although usually conducted in person orby phone, written responses are sometimes obtained. The order in which thequestions are asked (beneficial/detrimental) is randomized to avoid bias inthe answer. Interviewers are instructed not to prompt the respondent in anyway. It is important that the responses be recorded verbatim, using therespondent’s own words. Participants are urged to provide as many responsesas they can; a group of 20 participants will typically produce 80^100responses.The responses themselves are of great interest and always provide a great deal
of information. In addition, the responses can be grouped into categories andthe categories examined to glean additional insight into the dimensions of theorganization’s quality culture. The responses and categories can be used todevelop valid survey items and to prepare focus-group questions. The follow-up activity is why so few people are needed at this stageLstatistical validity isobtained during the survey stage.
LEADERSHIPSix Sigma involves changing major business value streams that cut across
organizational barriers. It provides the means by which the organization’s stra-tegic goals are to be achieved. This effort cannot be lead by anyone other thanthe CEO, who is responsible for the performance of the organization as a
Implementing Six Sigma 27
whole. Six Sigma must be implemented from the top down. Lukewarm leader-ship endorsement is the number 1 cause of failed Six Sigma attempts.Conversely, I don’t know of a single case where top leadership fully embracedSix Sigma (or TQM, for that matter) that hasn’t succeeded. Six Sigma has zerochance of success when implemented without leadership from the top. Thisis because of the Six Sigma focus on cross-functional, even enterprise-wideprocesses. Six Sigma is not about local improvements, which are the onlyimprovements possible when top-level support is lacking.
CHAMPIONS AND SPONSORSSix Sigma champions are high-level individuals who understand Six Sigma
and are committed to its success. In larger organizations Six Sigma will belead by a full-time, high-level champion, such as an Executive Vice President.In all organizations, champions also include informal leaders who use SixSigma in their day-to-day work and communicate the Six Sigma message atevery opportunity. Sponsors are owners of processes and systems who helpinitiate and coordinate Six Sigma improvement activities in their areas ofresponsibilities.
BLACK BELTCandidates for Black Belt status are technically oriented individuals held in
high regard by their peers. They should be actively involved in the process oforganizational change and development. Candidates may come from a widerange of disciplines and need not be formally trained statisticians or analysts.However, because they are expected to master a wide variety of technical toolsin a relatively short period of time, Black Belt candidates will probably possessa background in college-level mathematics, the basic tool of quantitative analy-sis. Coursework in statistical methods should be considered a strong plus oreven a prerequisite. As part of their training, Black Belts typically receive 160hours of classroom instruction, plus one-on-one project coaching from MasterBlack Belts or consultants. The precise amount of training varies considerablyfrom firm to firm. In the financial sector Black Belts generally receive threeweeks of training, while Black Belts in large research facilities may get as muchas six weeks of training.Successful candidates will be comfortable with computers. At a minimum,
they should be proficient with one or more operating systems, spreadsheets,database managers, presentation programs, and word processors. As part oftheir training they will also be required to become proficient in the use of oneor more advanced statistical analysis software packages and probably simula-
28 BUILDING THE SIX SIGMA INFRASTRUCTURE
tion software. Six Sigma Black Belts work to extract actionable knowledge froman organization’s information warehouse. To assure access to the needed infor-mation, Six Sigma activities should be closely integrated with the informationsystems of the organization. Obviously, the skills and training of Six SigmaBlack Belts must be enabled by an investment in software and hardware. Itmakes no sense to hamstring these experts by saving a few dollars on computersor software.
GREEN BELTGreen Belts are Six Sigma project leaders capable of forming and facilitating
Six Sigma teams and managing Six Sigma projects from concept to completion.Green Belt training consists of five days of classroom training and is conductedin conjunction with Six Sigma projects. Training covers project management,quality management tools, quality control tools, problem solving, and descrip-tive data analysis. Six Sigma champions should attend Green Belt training.Usually, Six Sigma Black Belts help Green Belts define their projects prior tothe training, attend training with their Green Belts, and assist them with theirprojects after the training.
MASTER BLACK BELTThis is the highest level of technical and organizational proficiency. Master
Black Belts provide technical leadership of the Six Sigma program. Thus,they must know everything the Black Belts knows, as well as additional skillsvital to the success of the Six Sigma program. The additional skill might bedeep understanding of the mathematical theory on which the statistical meth-ods are based. Or, perhaps, a gift for project management, coaching skills tohelp Black Belts, teaching skills, or program organization at the enterpriselevel. Master Black Belts must be able to assist Black Belts in applying themethods correctly in unusual situations, especially advanced statistical meth-ods. Whenever possible, statistical training should be conducted only by qua-lified Master Black Belts or equivalently skilled consultants. If it becomesnecessary for Black Belts and Green Belts to provide training, they shouldonly do so under the guidance of Master Black Belts. Otherwise the familiar‘‘propagation of error’’ phenomenon will occur, i.e., Black Belt trainers passon errors to Black Belt trainees who pass them on to Green Belts, who passon greater errors to team members. Because of the nature of the Master’sduties, all Master Black Belts must possess excellent communication andteaching skills.
Implementing Six Sigma 29
STAFFING LEVELS AND EXPECTED RETURNSAs stated earlier in this chapter, the number of full-time personnel devoted to
Six Sigma is not large as a percentage of the total work force. Mature Six Sigmaprograms, such as those of General Electric, Johnson & Johnson, AlliedSignal,and others average about one percent of their workforce as Black Belts, withconsiderable variation in that number. There is usually about one MasterBlack Belt for every ten Black Belts, or about one Master Black Belt per 1,000employees. A Black Belt will typically complete 5 to 7 projects per year, usuallyworking with teams. Project teams are often lead by Green Belts, who, unlikeBlack Belts and Master Black Belts, are not employed full time in the SixSigma program. Green Belts usually devote between 5 and 10 percent of theirtime to Six Sigma project work.Black Belts are highly prized employees and are often recruited for key man-
agement positions elsewhere in the company. After Six Sigma has been in placefor three or more years, the number of former Black Belts in management posi-tions tends to be greater than the number of active Black Belts. These peopletake the rigorous, customer-driven, process-focused Six Sigma approach withthemwhen theymove tonew jobs.The ‘‘Six Sigmaway’’ soonbecomespervasive.Estimated savings per project vary from organization to organization.
Reported results average about $150,000 to $243,000. Some industries just start-ing their Six Sigma programs average as high as $700,000 savings per project,although these projects usually take longer. Note that these are not the hugemega-projects pursued by reengineering. Still, by completing 5 to 7 projectsper year per Black Belt the company will add in excess of $1 million per yearper Black Belt to its bottom line. For a company with 1,000 employees thenumbers would look something like this:
Master Black Belts: 1Black Belts: 10Projects: 50 to 70 (5 to 7 per Black Belt)Estimated saving: $9 million to $14.6 million (i.e., $14,580 savings
per employee)
Do the math for your organization and see what Six Sigma could do for you.Because Six Sigma savingsLunlike traditional slash and burn cost cuttingLimpact only non-value-added costs, they flow directly to your company’s bot-tom line. Traditional, income-statement based cost cutting inevitably hurtsvalue-adding activities. As a result, the savings seldom measure up to expecta-tions and revenues often suffer as well. The predicted bottom-line impact isnot actually realized. Firms engaging in these activities hurt their prospects forfuture success and delay their recovery.
30 BUILDING THE SIX SIGMA INFRASTRUCTURE

Six Sigma deployment and managementSix Sigma deployment is the actual creation of an organization that embodies
the Six Sigma philosophy. Doing this involves asking a series of questions,then answering these questions for organizational units. The deployment pro-cess is outlined in Figure 1.8.Creating an organization to carry out this process is no easy task. Traditional
organizations are structured to carry out routine tasks, while Six Sigma is allabout non-routine activity. Look at the action words in Figure 1.8: improve,increase, eliminate, reduce, breakthrough. These are challenging things to do inany environment, and nearly impossible in an enterprise focused on carryingout routine assignments. The job of the leadership team is to transform the orga-nization’s culture so that Six Sigma will flourish. It’s a tough job, but not animpossible one. Think of it as writing a book. No one sits down and writes abook as a single unit. Books are organized into smaller sub-units, such as sec-tions, chapters, pages, and paragraphs. Similarly, deploying Six Sigma involvessub-units, such as those shown in Figure 1.9.Although leadership is ultimately responsible for creating the Six Sigma
Deployment Manual, they will not have the time to write it themselves.Writing the manual is itself a project, and it should be treated as such. A formalcharter should be prepared and responsibility for writing the deployment man-ual should be assigned by senior leadership to a project sponsor. The sponsorshould be a senior leader, either the CEO or a member of the CEO’s staff. Anaggressive deadline should be set. The plan itself is the deliverable, and therequirements should be clearly defined. The CEO and the Executive Six SigmaCouncil must formally accept the plan.All of the subjects in the table of contents in Figure 1.9 are discussed in this
book. Some are covered in several pages, while others take an entire chapter ormore. Although you won’t be able to get all of your answers from a singlebook, or from any number of books, the material you will find here shouldgive you enough information to start the journey. You will encounter enoughchallenges along the way that perhaps the word ‘‘adventure’’ would be moreappropriate!
Six Sigma communication planSuccessful implementation of Six Sigma will only happen if the leadership’s
vision and implementation plans are clearly understood and embraced byemployees, shareholders, customers, and suppliers. Because it involves culturalchange, Six Sigma frightens many people. Good communications are an anti-dote to fear. Without it rumors run rampant and morale suffers. Although
Implementing Six Sigma 31

32 BUILDING THE SIX SIGMA INFRASTRUCTURE
1. Deployment goals1.1. Business level
1.1.1. Increase shareholder value1.1.2. Increase revenues1.1.3. Improve market share1.1.4. Increase profitability and ROI
1.2. Operations level1.2.1. Eliminate ‘‘hidden factory’’ (i.e., resources used because things
were not done right the first time)1.2.2. Improve rolled throughput yield and normalized yield1.2.3. Reduce labor costs1.2.4. Reduce material costs
1.3. Process level1.3.1. Improve cycle time1.3.2. Reduce resource requirements1.3.3. Improve output volume1.3.4. Improve process yield (ratio of inputs to outputs)1.3.5. Reduce defects1.3.6. Reduce variability1.3.7. Improve process capability
2. Identify key value streams2.1. Which processes are critical to business performance?2.2. How do processes deliver value to customers?
3. Determine metrics and current performance levels3.1. How will we measure key value streams?3.2. Are our measurements valid, accurate, and reliable?3.3. Are the processes stable (i.e., in statistical control)?
3.3.1. If not, why not?3.3.2. What are the typical cycle times, costs, and quality opportu-
nities of these processes?3.3.3. What is the short- and long-term process capability?
3.4. Detailed as-is and should-be process maps for critical processes3.5. How does current performance relate to benchmark or best-in-class
performance?4. Breakthrough to new performance levels
4.1. Which variables make the most difference?4.2. What are the best settings for these variables?4.3. Can the process be redesigned to become more robust?4.4. Can product be redesigned to become more robust and/or more easily
produced?5. Standardize on new approach
5.1. Write procedures describing how to operate the new process5.2. Train people in the new approach5.3. When necessary, use SPC to control process variation5.4. Modify inventory, cost accounting, and other business systems to
assure that improved process performance is reflected in bids, orderquantities, inventory trigger points, etc.
Figure 1.8. Six Sigma deployment process outline.
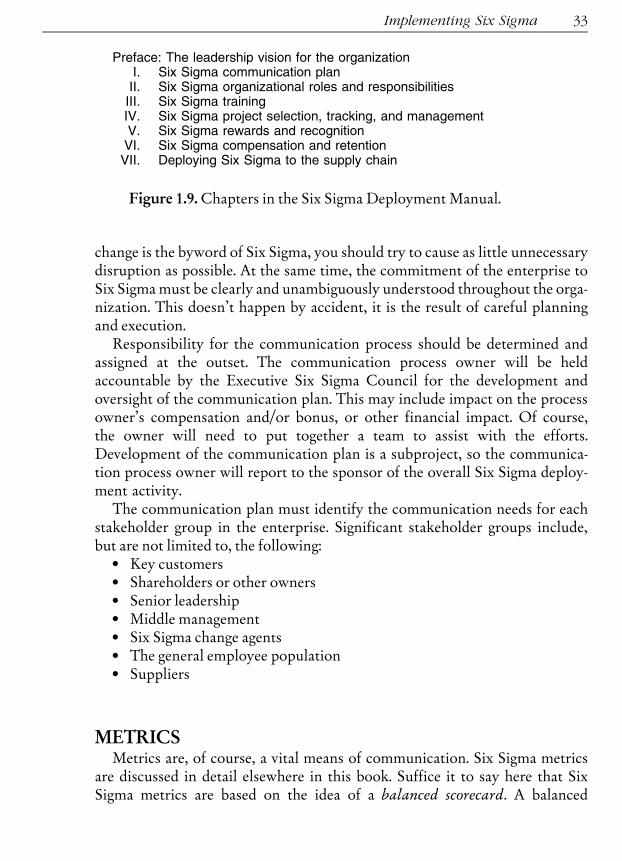
change is the byword of Six Sigma, you should try to cause as little unnecessarydisruption as possible. At the same time, the commitment of the enterprise toSix Sigmamust be clearly and unambiguously understood throughout the orga-nization. This doesn’t happen by accident, it is the result of careful planningand execution.Responsibility for the communication process should be determined and
assigned at the outset. The communication process owner will be heldaccountable by the Executive Six Sigma Council for the development andoversight of the communication plan. This may include impact on the processowner’s compensation and/or bonus, or other financial impact. Of course,the owner will need to put together a team to assist with the efforts.Development of the communication plan is a subproject, so the communica-tion process owner will report to the sponsor of the overall Six Sigma deploy-ment activity.The communication plan must identify the communication needs for each
stakeholder group in the enterprise. Significant stakeholder groups include,but are not limited to, the following:
. Key customers
. Shareholders or other owners
. Senior leadership
. Middle management
. Six Sigma change agents
. The general employee population
. Suppliers
METRICSMetrics are, of course, a vital means of communication. Six Sigma metrics
are discussed in detail elsewhere in this book. Suffice it to say here that SixSigma metrics are based on the idea of a balanced scorecard. A balanced
Implementing Six Sigma 33
Preface: The leadership vision for the organizationI. Six Sigma communication planII. Six Sigma organizational roles and responsibilitiesIII. Six Sigma trainingIV. Six Sigma project selection, tracking, and managementV. Six Sigma rewards and recognitionVI. Six Sigma compensation and retentionVII. Deploying Six Sigma to the supply chain
Figure 1.9. Chapters in the Six Sigma Deployment Manual.

scorecard is like the instrument panel in the cockpit of an airplane. It displaysinformation that provides a complete view of the way the organizationappears to its customers and shareholders, as well as a picture of key internalprocesses and the rate of improvement and innovation. Balanced scorecardsalso provide the means of assuring that Six Sigma projects are addressingkey business issues.
COMMUNICATIONS MEDIACommunicating the Six Sigma message is a multimedia undertaking. The
modern organization has numerous communications technologies at its dis-posal. Keep in mind that communication is a two-way affair; be sure to pro-vide numerous opportunities for upward and lateral as well as downwardcommunication. Here are some suggestions to accomplish the communica-tions mission:
. All-hands launch event, with suitable pomp and circumstance
. Mandatory sta¡ meeting agenda item
. House organs (newsletters, magazines, etc.)
. Web site content on Six Sigma (Internet and Intranet)
. Highly visible links to enterprise Six Sigma web site on home page
. Six Sigma updates in annual report
. Stock analyst updates on publicly announced Six Sigma goals
. Intranet discussion forums
. Two-way email communications
. Surveys
. Suggestion boxes
. V|deotape or DVD presentations
. Closed circuit satellite broadcasts by executives, with questions andanswers
. All-hands discussion forums
. Posters
. Logo shirts, gear bags, keychains, co¡ee mugs, and other accessories
. Speeches and presentations
. Memoranda
. Recognition events
. Lobby displays
. LettersThe list goes on. Promoting Six Sigma awareness is, in fact, an internal mar-
keting campaign. A marketing expert, perhaps from your company’s marketingorganization, should be consulted. If your organization is small, a good bookon marketing can provide guidance (e.g., Levinson et al. (1995)).
34 BUILDING THE SIX SIGMA INFRASTRUCTURE
COMMUNICATION REQUIREMENTS ANDRESPONSIBILITIESFor each group, the communication process owner should determine the
following:1. Who is primarily responsible for communication with this group?2. What are the communication needs for this group? For example, key
customers may need to know how Six Sigma will bene¢t them; employ-ees may need to understand the process for applying for a change agentposition such as Black Belt.
3. What communication tools, techniques andmethodswill be used? Theseinclude meetings, newsletters, email, one-on-one communications, websites, etc.
4. What will be the frequency of communication? Remember, repetitionwill usually be necessary to be certain the message is received and under-stood.
5. Who is accountable for meeting the communication requirement?6. How will we measure the degree of success? Who will do this?The requirements and responsibilities can be organized using tables, such as
Table 1.3.
Six Sigma organizational roles and responsibilitiesSix Sigma is the primary enterprise strategy for process improvement. To
make this strategy a success it is necessary not only to implement Six Sigma,but also to institutionalize it as a way of doing business. It is not enough totrain a few individuals to act as champions for Six Sigma. To the contrary, sucha plan virtually guarantees failure by placing the Six Sigma activities somewhereother than the mainstream. After all, isn’t process improvement an ongoingpart of the business?
LEADERSHIP ROLES AND RESPONSIBILITIESLeadership’s primary role is to create a clear vision for Six Sigma success and
to communicate their vision clearly, consistently, and repeatedly throughoutthe organization. In other words, leadership must lead the effort.The primary responsibility of leadership is to assure that Six Sigma goals,
objectives, and progress are properly aligned with those of the enterprise as awhole. This is done by modifying the organization in such a way that personnelnaturally pursue Six Sigma as part of their normal routine. This requires thecreation of new positions and departments, and modifying the reward, recogni-
Implementing Six Sigma 35

36 BUILDING THE SIX SIGMA INFRASTRUCTURE
Table 1.3. Six Sigma communications plan and requirements matrix.
Group Method Frequency Accountability
Senior Leadership
Requirement
Program strategy,goals and high-level program plan
� Senior sta¡meetings
� Seniorleadershiptraining
�At leastmonthly
� Start ofprogram
�CEO� Six Sigma Director� Trainingdepartment
Metrics/statusperformance toprogram plan
� Senior sta¡meetings
�At leastmonthly
� Six Sigma Director
Middle Management
Program strategy, goalsand management-levelprogram plan
�Regular £owdown ofupper levelsta¡ meetingnotes/£owdown;newsletter
�Managementtraining
�At leastmonthly forsta¡meetings;newsletterpiece every 2weeks duringprogramrollout, asneededthereafter
� Prior to 1stwave of SixSigmaprojects
� Senior Leadershipfor sta¡ meeting£ow down
� Internalcommunicationsvia core team forcompanynewsletter
� Trainingdepartment
Etc. for customers, owners, stock analysts, change agents, bargaining unit, exemptemployees, suppliers, or other stakeholder group.

tion, incentive, and compensation systems for other positions. Leadership mustdecide such key issues as:
. How will leadership organize to support Six Sigma? (E.g., Executive SixSigma Council, designation of an executive Six Sigma champion, creationof Director of Six Sigma, where will the new Six Sigma function report?Etc.)
. At what rate do we wish to make the transition from a traditional to a SixSigma enterprise?
. What will be our resource commitment to Six Sigma?
. What new positions will be created? To whom will they report?
. Will Six Sigma be a centralized or a decentralized function?
. What level of ROI validation will we require?
. Howwill Six Sigma be integrated with other process excellence initiatives,such as Lean?
. Will we create a cross-functional core team to facilitate deployment?Whowill be on the team? To whom will they be accountable?
. How will leadership monitor the success of Six Sigma?
. How will executive support of Six Sigma be assessed?
TYPICAL ROLES AND RESPONSIBILITIESAlthough each organization will develop its own unique approach to Six
Sigma, it is helpful to know how successful companies have achieved theirsuccess. Most importantly, successful Six Sigma deployment is always a top-down affair. I know of no case where Six Sigma has had a major impact onoverall enterprise performance that was not fully embraced and activelylead by top management. Isolated efforts at division or department levelsare doomed from the outset. Like flower gardens in a desert, they may flour-ish and produce a few beautiful results for a time, but sustaining the resultsrequires immense effort by local heroes in constant conflict with the main-stream culture, placing themselves at risk. Sooner or later, the desert willreclaim the garden. Six Sigma shouldn’t require heroic effortLthere arenever enough heroes to go around. Once top management has accepted itsleadership responsibility the organizational transformation process canbegin.A key decision is whether Black Belts will report to a central Six Sigma
organization or to managers located elsewhere in the organization. Theexperience of most successful Six Sigma enterprises is that centralized report-ing is best. Internal studies by one company that experimented with bothtypes of reporting revealed the results shown in Table 1.4. The major reasonfor problems with the decentralized approach was disengaging people from
Implementing Six Sigma 37

routine work and firefighting. Six Sigma is devoted to change, and it seemschange tends to take a back seat to current problems. To be sure, the BlackBelt possesses a skill set that can be very useful in putting out fires. Also,Black Belts tend to be people who excel at what they do. This combinationmakes it difficult to resist the urge to pull the Black Belt off of his or her pro-jects ‘‘just for a while.’’ In fact, some organizations have trouble getting theBlack Belt out of their current department and into the central organization.In one case the CEO intervened personally on behalf of the Black Belts tobreak them loose. Such stories are testimony to the difficulties encounteredin making drastic cultural changes.The transformation process involves new roles and responsibilities on the
part of many individuals in the organization. In addition, new change agentpositions must be created. Table 1.5 lists some typical roles and responsi-bilities.Obviously, the impact on budgets, routines, existing systems, etc. is sub-
stantial. Six Sigma is not for the faint-hearted. It isn’t hard to see why it takes anumber of years for Six Sigma to become ‘‘mature.’’ The payoff, however,makes the effort worthwhile. Half-hearted commitments take nearly as mucheffort and produce negligible results, or even negative impacts.
Selecting the ‘‘Belts’’Past improvement initiatives, such as TQM, shared much in common with
Six Sigma. TQM also had management champions, improvement projects,sponsors, etc. One of the main differences in the Six Sigma infrastructure isthe creation of more formally defined change agent positions. Some observerscriticize this practice as creating corps of ‘‘elites,’’ especially Black Belts andMaster Black Belts. However, I believe this criticism is invalid. Let’s examine
38 BUILDING THE SIX SIGMA INFRASTRUCTURE
Table 1.4. Black Belt certi¢cation versus reporting arrangement.
Where Black Belt ReportedBlack Belts Successfully
Certi¢ed
Local organization 40%
Centralized Six Sigmaorganization
80%
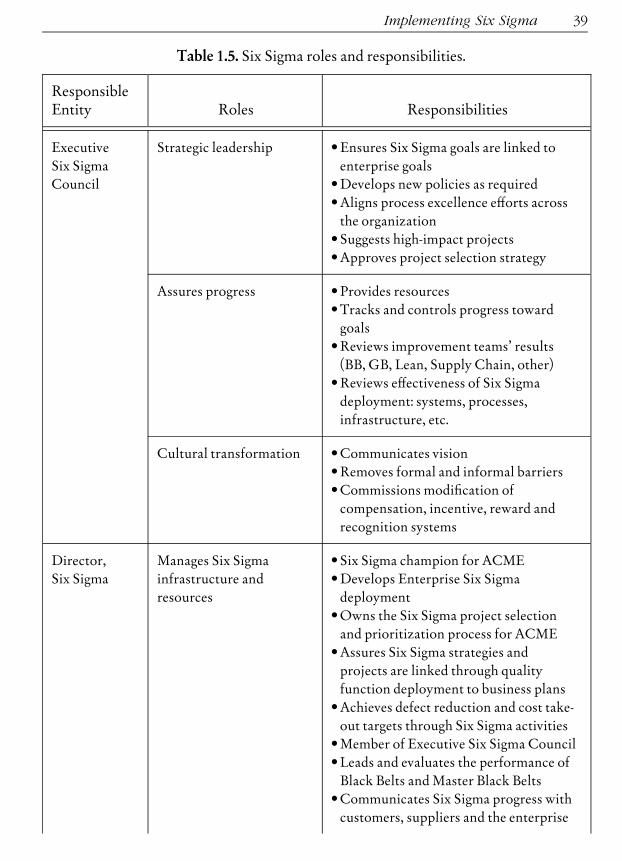
Implementing Six Sigma 39
Table 1.5. Six Sigma roles and responsibilities.
ResponsibleEntity Roles Responsibilities
ExecutiveSix SigmaCouncil
Strategic leadership . Ensures Six Sigma goals are linked toenterprise goals
.Develops new policies as required
.Aligns process excellence e¡orts acrossthe organization
. Suggests high-impact projects
.Approves project selection strategy
Assures progress . Provides resources.Tracks and controls progress towardgoals
.Reviews improvement teams’ results(BB, GB, Lean, Supply Chain, other)
.Reviews e¡ectiveness of Six Sigmadeployment: systems, processes,infrastructure, etc.
Cultural transformation .Communicates vision.Removes formal and informal barriers.Commissions modi¢cation ofcompensation, incentive, reward andrecognition systems
Director,Six Sigma
Manages Six Sigmainfrastructure andresources
. Six Sigma champion for ACME
.Develops Enterprise Six Sigmadeployment
.Owns the Six Sigma project selectionand prioritization process for ACME
.Assures Six Sigma strategies andprojects are linked through qualityfunction deployment to business plans
.Achieves defect reduction and cost take-out targets through Six Sigma activities
.Member of Executive Six Sigma Council
. Leads and evaluates the performance ofBlack Belts and Master Black Belts
.Communicates Six Sigma progress withcustomers, suppliers and the enterprise

40 BUILDING THE SIX SIGMA INFRASTRUCTURE
ResponsibleEntity Roles Responsibilities
.Champions Six Sigma reward andrecognition, as appropriate
Six SigmaCerti¢cationBoard
Certi¢es Black Belts
Board representativesinclude Master BlackBelts and key Six Sigmaleaders
.Works with local units to customizeBlack Belt and Green Belt requirementsto ¢t business needs
.Develops and implements systems forcertifying Black Belts and Green Belts
.Certi¢es Black Belts
Six SigmaCore Team
Cross-functional SixSigma team
Part-time change agent
. Provides input into policies andprocedures for successfulimplementation of Six Sigma acrossACME
. Facilitates Six Sigma activities such astraining, special recognition events,Black Belt testing, etc.
Master BlackBelt
Enterprise Six Sigmaexpert
Permanent full-timechange agent
Certi¢ed Black Belt withadditional specializedskills or experienceespecially useful indeployment of Six Sigmaacross the enterprise
.Highly pro¢cient in using Six Sigmamethodology to achieve tangiblebusiness results
. Technical expert beyond Black Belt levelon one or more aspects of processimprovement (e.g., advanced statisticalanalysis, project management,communications, programadministration, teaching, projectcoaching)
. Identi¢es high-leverage opportunities forapplying the Six Sigma approach acrossthe enterprise
. Basic Black Belt training
.Green Belt training
.Coach/Mentor Black Belts
. Participates on ACME Six SigmaCerti¢cation Board to certify Black Beltsand Green Belts
Table 1.5. Six Sigma roles and responsibilities (continued)

Implementing Six Sigma 41
ResponsibleEntity Roles Responsibilities
Black Belt Six Sigma technical expert
Temporary, full-timechange agent (will returnto other duties aftercompleting a two to threeyear tour of duty as aBlack Belt)
. Leads business process improvementprojects where Six Sigma approach isindicated
. Successfully completes high-impactprojects that result in tangible bene¢tsto the enterprise
.Demonstrated mastery of Black Beltbody of knowledge
.Demonstrated pro¢ciency at achievingresults through the application of the SixSigma approach
. Internal Process ImprovementConsultant for functional areas
.Coach/Mentor Green Belts
.Recommends Green Belts forCerti¢cation
Green Belt Six Sigma projectoriginator
Six Sigma project leader
Part-time Six Sigmachange agent. Continuesto perform normal dutieswhile participating on SixSigma project teams
Six Sigma champion inlocal area
.Demonstrated mastery of Green Beltbody of knowledge
.Demonstrated pro¢ciency at achievingresults through the application of the SixSigma approach
.Recommends Six Sigma projects
. Participates on Six Sigma project teams
. Leads Six Sigma teams in localimprovement projects
.Works closely with other continuousimprovement leaders to apply formaldata analysis approaches to projects
.Teaches local teams, shares knowledgeof Six Sigma
. Successful completion of at least one SixSigma project every 12 months tomaintain their Green Belt certi¢cation
Six SigmaImprovementTeam
Primary ACME vehiclefor achieving Six Sigmaimprovements
.Completes chartered Six Sigma projectsthat deliver tangible results
. Identi¢es Six Sigma project candidates
Table 1.5. Six Sigma roles and responsibilities (continued)

42 BUILDING THE SIX SIGMA INFRASTRUCTURE
ResponsibleEntity Roles Responsibilities
ACMELeaders andManagers
Champions for Six Sigma . Ensures £ow-down and follow-throughon goals and strategies within theirorganizations
. Plans improvement projects
.Charters or champions charteringprocess
. Identi¢es teams or individuals requiredto facilitate Six Sigma deployment
. Integrates Six Sigma with performanceappraisal process by identifyingmeasurable Six Sigma goals/objectives/results
. Identi¢es, sponsors and directs SixSigma projects
.Holds regular project reviews inaccordance with project charters
. Includes Six Sigma requirements inexpense and capital budgets
. Identi¢es and removes organizationaland cultural barriers to Six Sigmasuccess
.Rewards and recognizes team andindividual accomplishments (formallyand informally)
.Communicates leadership vision
.Monitors and reports Six Sigma progress
.Validates Six Sigma project results
.Nominates highly quali¢ed Black Beltand/or Green Belt candidates
ProjectSponsor
Charter and support SixSigma project teams
. Sponsor is ultimately responsible for thesuccess of sponsored projects
.Actively participates in projects
.Assures adequate resources are providedfor project
Table 1.5. Six Sigma roles and responsibilities (continued)

the commonly proposed alternatives to creating a relatively small group ofhighly trained technical experts:
. Train the masses. This is the ‘‘quality circles’’ approach, where people inthe lowest level of the organizational hierarchy are trained in the use ofbasic tools and set loose to solve problems without explicit direction
Implementing Six Sigma 43
ResponsibleEntity Roles Responsibilities
. Personal review of progress
. Identi¢es and overcomes barriers andissues
. Evaluates and accepts deliverable
‘‘Matrixed’’ProjectManager
Manages Six Sigmaresources dedicated to aparticular area (e.g., teamsof Black Belts on specialassignment)
Champions Six SigmaBlack Belt team
. Provides day-to-day direction for SixSigma project Black Belt and teamactivities
. Provides local administrative support,facilities, and materials
.Conducts periodic reviews of projects
. Provides input on Black Beltperformance appraisals
.Makes/implements decisions based onrecommendations of Six Sigma BlackBelts
Six SigmaImprovementTeamMember
Learns and applies SixSigma tools to projects
.Actively participates in team tasks
.Communicates well with other teammembers
.Demonstrates basic improvement toolknowledge
.Accepts and executes assignments asdetermined by team
Table 1.5. Six Sigma roles and responsibilities (continued)
from leadership. When this approach was actually tried in America in the1970s the results were disappointing. The originators of the quality circlesidea, the Japanese, reported considerably greater success with theapproach. This was no doubt due to the fact that Japanese circles wereintegrated into decades old company-wide process improvement activ-ities, while American ¢rms typically implemented circles by themselves.Indeed, when Six Sigma deployments reach a high level of maturity,more extensive training is often successful.
. Train themanagers. This involves training senior andmiddlemanagementin change agent skills. This isn’t a bad idea of itself. However, if the basicstructure of the organization doesn’t change, there is no clear way toapply the newly acquired skills. Training in and of itself does nothing tochange an organization’s environment. Historically, trained managersreturn to pretty much the same job. As time goes by their skills atrophyand their self-con¢dence wanes. If opportunities to apply their knowledgedo arise, they often fail to recognize it or, if they do recognize it, fail to cor-rectly apply the approach. This is natural for a person trying to do some-thing di¡erent for the ¢rst time. The full-time change agents in Six Sigmalearn by doing. By the end of their tenure, they can con¢dently apply SixSigma methodology to a wide variety of situations.
. Use the experts in other areas. The tools of Six Sigma are not new. In fact,Industrial Statisticians, ASQ Certi¢ed Quality Engineers, Certi¢edReliability Engineers, Certi¢ed Quality Technicians, Systems Engineers,Industrial Engineers, Manufacturing Engineers and other specialistsalready possess a respectable level of expertise in many Six Sigma tools.Some have a level of mastery in some areas that exceeds that of BlackBelts. However, being a successful change agent involves a great dealmore than mastery of technical tools. Black Belts, Green Belts, andMaster Black Belts learn tools and techniques in the context of followingthe DMAIC approach to drive organizational change. This is very di¡er-ent than using the same techniques in routine daily work. Quality ana-lysts, for example, generally work in the quality department aspermanent, full-time employees. They report to a single boss and havewell-de¢ned areas of responsibility. Black Belts, in contrast, go out andseek projects rather than work on anything routine. They report to manydi¡erent people, who use di¡erent criteria to evaluate the Black Belt’s per-formance. They are accountable for delivering measurable, bottom-lineresults. Obviously, the type of person who is good at one job may not besuitable for the other.
. Create permanent change agent positions. Another option to the BlackBeltposition is to make the job permanent. After all, why not make maximum
44 BUILDING THE SIX SIGMA INFRASTRUCTURE

use of the training by keeping the person in the Black Belt job inde¢nitely?Furthermore, as Black Belts gain experience they become more pro¢cientat completing projects. There are, however, arguments against thisapproach.Having temporaryBlackBelts allowsmore people to go throughthe position, thus increasing the number of people in management withBlack Belt experience. Since Black Belts work on projects that impactmany di¡erent areas of the enterprise, they have a broad, process-orientedperspective that is extremely valuable in top management positions. Thecontinuous in£ux of new blood into Black Belt and Green Belt positionskeeps the thinking fresh and prevents the ‘‘them-versus-us’’ mentality thatoften developswithin functional units.NewBlackBelts have di¡erent net-works of contacts throughout the organization, which leads to projects inareas thatmight otherwise bemissed. Permanent BlackBelts would almostcertainly bemoreheavily in£uencedby their full-timeboss than temporaryBlack Belts, thus leading to amore provincial focus.
BLACK BELTSThere are usually many more Black Belt candidates than there are positions.
Thus, although there are minimum requirements, those selected generallyexceed the minimums by a considerable degree. The process for selecting BlackBelts should be clearly defined. This assures consistency and minimizes thepossibility of bias and favoritism.The next question is, what’s important to the success of a Black Belt? I
worked with a group of consultants andMaster Black Belts to answer this ques-tion. We came up with a list of seven success factors, then used Expert Choice2000 software* to calculate relative importance weights for each category. Theresults are shown in Figure 1.10.The weights are, of course, subjective and only approximate. You may feel
free to modify them if you feel strongly that they’re incorrect. Better yet, youmay want to identify your own set of criteria and weights. The important thingis to determine the criteria and then develop a method of evaluating candidateson each criterion. The sum of the candidate’s criterion score times the criterionweight will give you an overall numerical assessment that can be useful in sort-ing out those candidates with high potential from those less likely to succeedas Black Belts. Of course, the numerical assessment is not the only input intothe selection decision, but it is a very useful one.
Implementing Six Sigma 45
*Expert Choice 2000 is a software package that converts pairwise comparisons into relative weights using the AnalyticHierarchy Process. The AHP is described elsewhere in this book. See http://www.expertchoice.com/ for details.

You may be surprised to see the low weight given to math skills. The ratio-nale is that Black Belts will receive 200 hours of training, much of it focusedon the practical application of statistical techniques using computer softwareand requiring very little actual mathematics. Software automates the analysis,making math skills less necessary. The mathematical theory underlying a tech-nique is not discussed beyond the level necessary to help the Black Belt prop-erly apply the tool. Black Belts who need help with a particular tool haveaccess to Master Black Belts, other Black Belts, consultants, professors, anda wealth of other resources. Most statistical techniques used in Six Sigma arerelatively straightforward and often graphical; spotting obvious errors isusually not too difficult for trained Black Belts. Projects seldom fail due to alack of mathematical expertise. In contrast, the Black Belt will often have torely on their own abilities to deal with the obstacles to change they will inevi-tably encounter. Failure to overcome the obstacle will often spell failure ofthe entire project.Figure 1.11 provides an overview of a process for the selection of Black Belt
candidates.
46 BUILDING THE SIX SIGMA INFRASTRUCTURE
Figure 1.10. Black Belt success factors and importance weights.
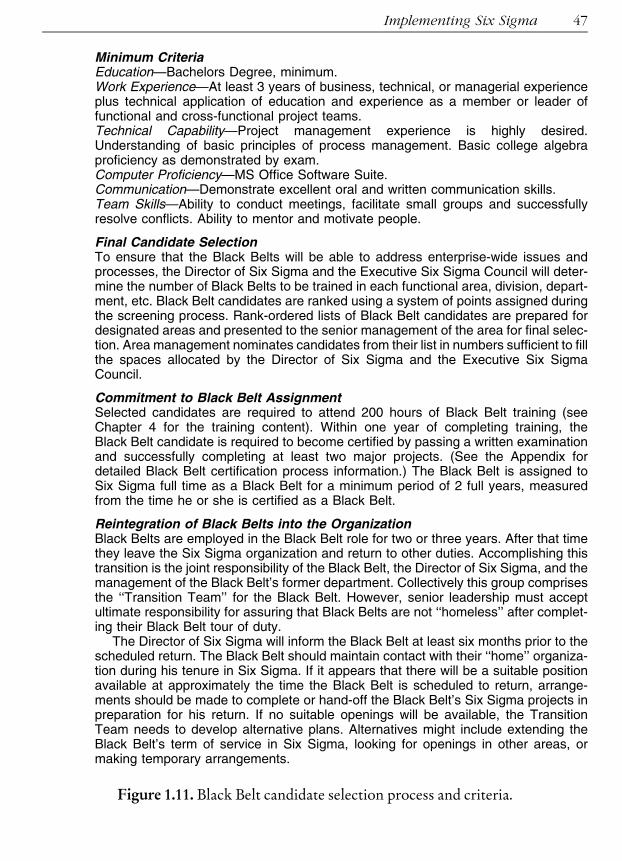
Implementing Six Sigma 47
Minimum CriteriaEducation—Bachelors Degree, minimum.Work Experience—At least 3 years of business, technical, or managerial experienceplus technical application of education and experience as a member or leader offunctional and cross-functional project teams.Technical Capability—Project management experience is highly desired.Understanding of basic principles of process management. Basic college algebraproficiency as demonstrated by exam.Computer Proficiency—MS Office Software Suite.Communication—Demonstrate excellent oral and written communication skills.Team Skills—Ability to conduct meetings, facilitate small groups and successfullyresolve conflicts. Ability to mentor and motivate people.
Final Candidate SelectionTo ensure that the Black Belts will be able to address enterprise-wide issues andprocesses, the Director of Six Sigma and the Executive Six Sigma Council will deter-mine the number of Black Belts to be trained in each functional area, division, depart-ment, etc. Black Belt candidates are ranked using a system of points assigned duringthe screening process. Rank-ordered lists of Black Belt candidates are prepared fordesignated areas and presented to the senior management of the area for final selec-tion. Area management nominates candidates from their list in numbers sufficient to fillthe spaces allocated by the Director of Six Sigma and the Executive Six SigmaCouncil.
Commitment to Black Belt AssignmentSelected candidates are required to attend 200 hours of Black Belt training (seeChapter 4 for the training content). Within one year of completing training, theBlack Belt candidate is required to become certified by passing a written examinationand successfully completing at least two major projects. (See the Appendix fordetailed Black Belt certification process information.) The Black Belt is assigned toSix Sigma full time as a Black Belt for a minimum period of 2 full years, measuredfrom the time he or she is certified as a Black Belt.
Reintegration of Black Belts into the OrganizationBlack Belts are employed in the Black Belt role for two or three years. After that timethey leave the Six Sigma organization and return to other duties. Accomplishing thistransition is the joint responsibility of the Black Belt, the Director of Six Sigma, and themanagement of the Black Belt’s former department. Collectively this group comprisesthe ‘‘Transition Team’’ for the Black Belt. However, senior leadership must acceptultimate responsibility for assuring that Black Belts are not ‘‘homeless’’ after complet-ing their Black Belt tour of duty.
The Director of Six Sigma will inform the Black Belt at least six months prior to thescheduled return. The Black Belt should maintain contact with their ‘‘home’’ organiza-tion during his tenure in Six Sigma. If it appears that there will be a suitable positionavailable at approximately the time the Black Belt is scheduled to return, arrange-ments should be made to complete or hand-off the Black Belt’s Six Sigma projects inpreparation for his return. If no suitable openings will be available, the TransitionTeam needs to develop alternative plans. Alternatives might include extending theBlack Belt’s term of service in Six Sigma, looking for openings in other areas, ormaking temporary arrangements.
Figure 1.11. Black Belt candidate selection process and criteria.

GREEN BELTSGreen Belts are change agents who work part time on process improve-
ment. The bulk of the Green Belt’s time is spent performing their normalwork duties. Although most experts (including me) advocate that the GreenBelt spend 10% to 20% of their time on projects, the time a typical GreenBelt spends on projects in a given year is more like 2% to 5%. A Green Beltwill usually complete one or two major projects per year. Also, unlike BlackBelt projects, Green Belt projects may address processes that are not cross-functional. Few Green Belt projects cover enterprise-wide processes.However, since there are usually more Green Belts than Black Belts by a fac-tor of 2� to 5�, these Green Belt projects have a tremendous impact onthe enterprise. Also, it is common to have a Black Belt coordinating a ‘‘port-folio’’ of ‘‘Green Belt projects’’* that, taken together, cover a cross-functionalprocess.Figure 1.12 provides an overview of a process for the selection of Green Belt
candidates.
MASTER BLACK BELTSMaster Black Belts are recruited from the ranks of Black Belts. The process
is usually less formal and less well defined than that for Black Belts orGreen Belts and there is a great deal of variability between companies.Master Black Belt candidates usually make their interest known to SixSigma leadership. Leadership selects candidates based on the needs of theenterprise and Six Sigma’s role in meeting those needs. For example, in theearly stages of deployment Master Black Belt candidates with excellent orga-nizational skills and the ability to communicate the leadership’s Six Sigmavision may be preferred. Intermediate deployments might favor candidateswho excel at project selection and Black Belt coaching. Mature Six Sigma pro-grams might look for Master Black Belts with training ability and advancedstatistical know-how. Master Black Belts often have advanced technicaldegrees and extensive Black Belt experience. Many organizations provideMaster Black Belts with additional training. Certification requirements forMaster Black Belts varies with the organization. Many organizations do notcertify Master Black Belts.
48 BUILDING THE SIX SIGMA INFRASTRUCTURE
*Personally, I would prefer that the term ‘‘Six Sigma project’’ be used instead of Black Belt project or Green Belt project.However, I bow to common usage in this book.

Integrating Six Sigma and related initiativesAt any given time most companies have numerous activities underway to
improve their operations. For example, the company might be pursuing one ormore of the following:
. TQM
. Lean manufacturing
. Lean service
. Continuous improvement
. Kaizen
. Business process reengineering
. Theory of constraints
. Variation reductionThe list can be extended indefinitely. Six Sigma can’t simply be thrown into
the mix without causing tremendous confusion. People will find themselves inconflict with one another over jurisdiction, resources, and authority.Leadership must give careful thought as to how the various overlapping activ-ities can best be organized to optimize their impact on performance. An‘‘umbrella concept’’ often provides the needed guidance to successfully inte-grate the different but related efforts. One concept that I’ve found to be particu-larly useful is that of ‘‘Process Excellence’’ (PE).
Implementing Six Sigma 49
Minimum CriteriaEducation—High school or equivalent.Work Experience—At least 3 years of business, technical, or managerial experience.Technical Capability—High school algebra proficiency as demonstrated by a passinggrade in an algebra course.Computer Proficiency—Word processing, presentation and spreadsheet software.Team Skills—Willingness to lead meetings, facilitate small groups and successfullyresolve conflicts. Ability to mentor and motivate people.
Final Candidate SelectionBased on the organizational need for Green Belts, as determined by the Director ofSix Sigma and the Executive Six Sigma Council, Green Belt training allotments areprovided to Master Black Belts, Black Belts and/or General Managers. Green Beltcandidacy requires the consent of the candidate’s management.
CommitmentEach Green Belt candidate selected will be required to complete a 40 hour Green Belttraining course, and to lead at least one successful Six Sigma project every 12months, or participate on at least two successful Six Sigma projects every 12 months.Green Belt certification is accomplished as described in the Appendix.
Figure 1.12. Green Belt candidate selection process and criteria.
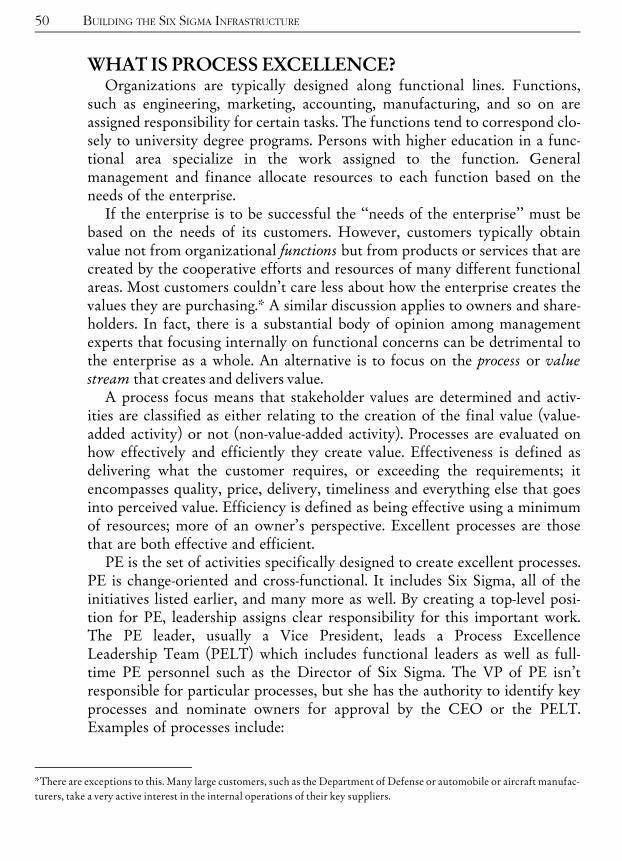
WHAT IS PROCESS EXCELLENCE?Organizations are typically designed along functional lines. Functions,
such as engineering, marketing, accounting, manufacturing, and so on areassigned responsibility for certain tasks. The functions tend to correspond clo-sely to university degree programs. Persons with higher education in a func-tional area specialize in the work assigned to the function. Generalmanagement and finance allocate resources to each function based on theneeds of the enterprise.If the enterprise is to be successful the ‘‘needs of the enterprise’’ must be
based on the needs of its customers. However, customers typically obtainvalue not from organizational functions but from products or services that arecreated by the cooperative efforts and resources of many different functionalareas. Most customers couldn’t care less about how the enterprise creates thevalues they are purchasing.* A similar discussion applies to owners and share-holders. In fact, there is a substantial body of opinion among managementexperts that focusing internally on functional concerns can be detrimental tothe enterprise as a whole. An alternative is to focus on the process or valuestream that creates and delivers value.A process focus means that stakeholder values are determined and activ-
ities are classified as either relating to the creation of the final value (value-added activity) or not (non-value-added activity). Processes are evaluated onhow effectively and efficiently they create value. Effectiveness is defined asdelivering what the customer requires, or exceeding the requirements; itencompasses quality, price, delivery, timeliness and everything else that goesinto perceived value. Efficiency is defined as being effective using a minimumof resources; more of an owner’s perspective. Excellent processes are thosethat are both effective and efficient.PE is the set of activities specifically designed to create excellent processes.
PE is change-oriented and cross-functional. It includes Six Sigma, all of theinitiatives listed earlier, and many more as well. By creating a top-level posi-tion for PE, leadership assigns clear responsibility for this important work.The PE leader, usually a Vice President, leads a Process ExcellenceLeadership Team (PELT) which includes functional leaders as well as full-time PE personnel such as the Director of Six Sigma. The VP of PE isn’tresponsible for particular processes, but she has the authority to identify keyprocesses and nominate owners for approval by the CEO or the PELT.Examples of processes include:
50 BUILDING THE SIX SIGMA INFRASTRUCTURE
*There are exceptions to this. Many large customers, such as the Department of Defense or automobile or aircraft manufac-turers, take a very active interest in the internal operations of their key suppliers.

. Order ful¢llment
. Coordinating improvement activities of Six Sigma, Lean, etc.
. Customer contact with the company
. Handling public relations emergencies
. Getting ideas for improvement projects
. Matching improvement projects with customer needs
. Innovating
. Communicating with the outside world
. Communicating internally
. Identifying talent
. Handling customer problems
. Avoiding legal disputesIn other words, the VP of PE has a ‘‘meta-process’’ responsibility. She is
responsible for the process of identifying and improving processes. PE activitiessuch as Six Sigma, Lean, etc. provide PE with resources to direct toward theorganization’s goal of developing internal processes that give it a competitiveadvantage in securing the best employees, delivering superior customer value,and earning a premium return for its investors.
Deployment to the supply chainIn the early part of the twentieth century Henry Ford pursued a great vision
by building the Ford River Rouge Complex. By 1927 the Rouge was handlingall production of Ford automobiles. It was truly a marvel. The Rouge was thelargest single manufacturing complex in the United States, with peak employ-ment of about 120,000. Here Henry Ford achieved self-sufficiency and verticalintegration in automobile production, a continuous work flow from iron oreand other raw materials to finished automobiles. The complex included dockfacilities, blast furnaces, open-hearth steel mills, foundries, a rolling mill, metalstamping facilities, an engine plant, a glass manufacturing building, a tireplant, and its own power house supplying steam and electricity.On June 2, 1978, the Rouge was listed a National Historic Landmark. From
state-of-the-art wonder to historical curiosity in just fifty years.A related historical artifact is the idea that a firm can produce quality pro-
ducts or services by themselves. This may’ve been the case in the heyday of theRouge, when the entire ‘‘supply chain’’ was a single, vertically integrated behe-moth entity, but it is certainly no longer true. In today’s world fully 50^80% ofthe cost of a manufactured product is in purchased parts and materials. Whenthe customer forks over her good money for your product, she doesn’t differ-entiate between you and your suppliers.
Implementing Six Sigma 51
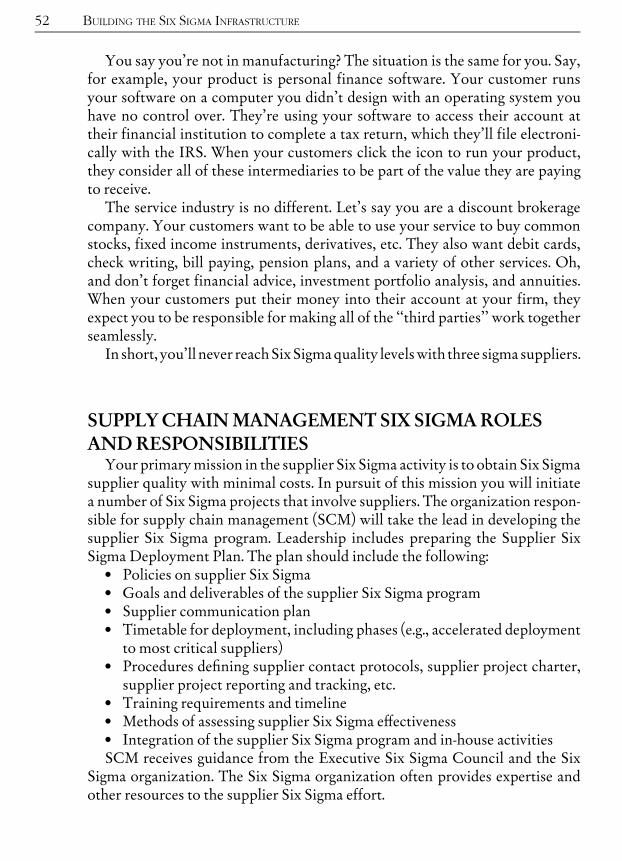
You say you’re not in manufacturing? The situation is the same for you. Say,for example, your product is personal finance software. Your customer runsyour software on a computer you didn’t design with an operating system youhave no control over. They’re using your software to access their account attheir financial institution to complete a tax return, which they’ll file electroni-cally with the IRS. When your customers click the icon to run your product,they consider all of these intermediaries to be part of the value they are payingto receive.The service industry is no different. Let’s say you are a discount brokerage
company. Your customers want to be able to use your service to buy commonstocks, fixed income instruments, derivatives, etc. They also want debit cards,check writing, bill paying, pension plans, and a variety of other services. Oh,and don’t forget financial advice, investment portfolio analysis, and annuities.When your customers put their money into their account at your firm, theyexpect you to be responsible for making all of the ‘‘third parties’’ work togetherseamlessly.In short, you’ll never reachSix Sigmaquality levelswith three sigma suppliers.
SUPPLY CHAIN MANAGEMENT SIX SIGMA ROLESAND RESPONSIBILITIESYour primarymission in the supplier Six Sigma activity is to obtain Six Sigma
supplier quality with minimal costs. In pursuit of this mission you will initiatea number of Six Sigma projects that involve suppliers. The organization respon-sible for supply chain management (SCM) will take the lead in developing thesupplier Six Sigma program. Leadership includes preparing the Supplier SixSigma Deployment Plan. The plan should include the following:
. Policies on supplier Six Sigma
. Goals and deliverables of the supplier Six Sigma program
. Supplier communication plan
. Timetable for deployment, including phases (e.g., accelerated deploymentto most critical suppliers)
. Procedures de¢ning supplier contact protocols, supplier project charter,supplier project reporting and tracking, etc.
. Training requirements and timeline
. Methods of assessing supplier Six Sigma e¡ectiveness
. Integration of the supplier Six Sigma program and in-house activitiesSCM receives guidance from the Executive Six Sigma Council and the Six
Sigma organization. The Six Sigma organization often provides expertise andother resources to the supplier Six Sigma effort.
52 BUILDING THE SIX SIGMA INFRASTRUCTURE

SCM should sponsor or co-sponsor supplier Six Sigma projects. In somecases SCM will lead the projects, often with supplier personnel taking a co-leadership role. In others they will assist Black Belts or Green Belts workingon other projects that involve suppliers. Full SCM sponsorship is usuallyrequired when the project’s primary focus is on the supplier’s product or pro-cess. For example, a Six Sigma project chartered to reduce the number oflate deliveries of a key product. Projects involving suppliers, but not focusedon them, can be co-sponsored by SCM. For example, a project involving theredesign of an order fulfillment process that requires minor changes to thesupplier’s web ordering form. SCM assistance can take a number of differentforms, e.g.:
. Acting as a liaison between the internal team members and suppliers
. Negotiating funding and budget authority for supplier Six Sigma projects
. Estimating and reporting supplier project savings
. Renegotiating contract terms
. Resolving con£icts
. De¢ning responsibility for action items
. Scheduling supplier visits
. De¢ning procedures for handling of proprietary supplier information
. Responding to supplier requests for assistance with Six SigmaIn addition to SCM, other elements within your organization play important
supporting roles. Usually Black Belts will come from the Six Sigma organiza-tion, although some larger enterprises assign a team of Black Belts to work onSCM projects full time. Green Belts often come from organizations sponsoringsupplier-related projects. Team members are assigned from various areas, aswith any Six Sigma project.
SUPPLIER RESPONSIBILITIESNever forget that the supplier’s processes are owned and controlled by the
supplier, not by you. As the customer you certainly have the final say in therequirements, but ultimate responsibility for the process itself should remainwith the supplier. To do otherwisemay have legal ramifications, such as liabilityand warranty implications. Besides these issues is the simple human tendencyof caring less when someone else is responsible. Six Sigma teams also need tobe careful aboutmaking it clear that only SCMhas the authority tomake officialrequests for change. It can be embarrassing if a Black Belt makes a suggestionthat the supplier believes to be a formal requirement to change. SCM mayreceive a new bid, price change, complaint letter, etc. from the supplier oversuch misunderstandings. Supplier relationships are often quite fragile and‘‘Handle with care’’ is a good motto for the entire Six Sigma team to follow.
Implementing Six Sigma 53

In addition to accepting responsibility for their processes, suppliers mustoften take the lead role in Six Sigma teams operating in supplier facilities.Supplier leadership must support Six Sigma efforts within their organizations.Suppliers must agree to commit the resources necessary to successfully com-plete projects, including personnel and funding.
CHANGE AGENT COMPENSATION AND RETENTIONExperienced Certified Black Belts and Master Black Belts are in great
demand throughout the manufacturing and services sectors.* Small wonder.Here are people who have proven that they can effect meaningful change in acomplex environment. Since organizations exist in a competitive world, stepsmust be taken to protect the investment in these skilled change agents, or theywill be lured away by other organizations, perhaps even competitors. The mostcommon (and effective) actions involve compensation and other financialincentives, such as:
. Bonuses
. Stock options
. Results sharing
. Payment of dues to professional societies
. Pay increasesThere are also numerous non-financial and quasi-financial rewards. For
example, Black Belts reentering the workforce after their tour of duty oftenenter positions that pay significantly higher than the ones they left when becom-ing Black Belts. In fact, in some companies the Black Belt position is viewed asa step on the fast track to upper management positions. Also, change is ‘‘news’’and it is only natural that the names of Master Black Belts and Black Beltsinvolved in major change initiatives receive considerable publicity on companyweb sites as well as in newsletters, recognition events, project fairs, etc. Even ifthey don’t receive formal recognition, Six Sigma projects often generate a greatdeal of internal excitement and discussion. The successful Black Belt usuallyfinds that his work has earned him a reputation that makes him a hot commod-ity when it’s time to end his Black Belt career.There are, of course, innumerable complexities and details to be decided and
worked out. Usually these issues are worked out by a team of individuals withmembers from Human Resources, the Six Sigma Core Team, and other areasof the organization. The team will address such issues as:
54 BUILDING THE SIX SIGMA INFRASTRUCTURE
*AlthoughGreen Belts are also highly trained change agents, they are not full-time change agents andwewill not discuss theircompensation here.

. What pay grade is to be assigned to the Black Belt and Master Black Beltpositions?
. Should the pay grade be determined by the pay grade of the candidate’s jobprior to becoming a Black Belt?
. Should the Black Belt pay grade be guaranteed when the Black Belt leavesthe Black Belt position to return to the organization?
. Howdowe determine eligibility for the various rewards? For example, arethere key events such as acceptance as a Black Belt candidate, completionof training, completion of ¢rst project, successful certi¢cation, etc.?
. What about Black Belts who were certi¢ed by other organizations or thirdparties?
. Do we provide bene¢ts to Green Belts as well? If so, what and how?
. Who will administer the bene¢ts package?The plan will be of great interest to Black Belt candidates. If not done prop-
erly, the organization will find it difficult to recruit the best people.
Change Agent Compensation and Retention 55

^ ^ ^CHAPTER
2
Six Sigma Goals and MetricsATTRIBUTES OF GOOD METRICS
The choice of what to measure is crucial to the success of the organization.Improperly chosen metrics lead to suboptimal behavior and can lead peopleaway from the organization’s goals instead of towards them. Joiner (1994) sug-gests three systemwide measures of performance: overall customer satisfaction,total cycle time, and first-pass quality. An effective metric for quantifying first-pass quality is total cost of poor quality (later in this chapter). Once chosen,the metrics must be communicated to the members of the organization. Tobe useful, the employee must be able to influence the metric through hisperformance, and it must be clear precisely how the employee’s performanceinfluences the metric.Rose (1995) lists the following attributes of good metrics:. They are customer centered and focused on indicators that provide valueto customers, such as product quality, service dependability, and time-liness of delivery, or are associated with internal work processes thataddress system cost reduction, waste reduction, coordination and teamwork, innovation, and customer satisfaction.
. They measure performance across time, which shows trends rather thansnapshots.
. They provide direct information at the level at which they are applied.No further processing or analysis is required to determine meaning.
. They are linked with the organization’s mission, strategies, and actions.They contribute to organizational direction and control.
. They are collaboratively developed by teams of people who provide,collect, process, and use the data.
Copyright 2003 by The McGraw-Hill Companies, Inc. Click Here for Terms of Use.

Rose also presents a performance measurement model consisting of eightsteps:
. Step 1: performance categoryLThis category is the fundamental divi-sion of organizational performance that answers the question: What dowe do? Sources for determining performance categories include an organi-zation’s strategic vision, core competencies, or mission statement. Anorganization will probably identify several performance categories.These categories de¢ne the organization at the level at which it is beingmeasured.
. Step 2: performance goalLThe goal statement is an operational de¢ni-tion of the desired state of the performance category. It provides the targetfor the performance category and, therefore, should be expressed in expli-cit, action-oriented terms. An initial goal statement might be right on themark, so complex that it needs further division of the performance cate-gory, or so narrowly drawn that it needs some combination of perfor-mance categories. It might be necessary to go back and forth between theperformance goals in this step and the performance categories in step 1before a satisfactory result is found for both.
. Step 3: performance indicatorLThis is the most important step in themodel because this is where progress toward the performance goal is dis-closed. Here irrelevant measures are swept aside if they do not respondto an organizational goal. This is where the critical measuresLthose thatcommunicate what is important and set the course toward organizationalsuccessLare established. Each goal will have one or more indicators, andeach indicator must include an operational de¢nition that prescribes theindicator’s intent and makes its role in achieving the performance goalclear. The scope of the indicator might be viewed di¡erently at variouslevels in the organization.
. Step 4: elements of measureLThese elements are the basic componentsthat determine how well the organization meets the performanceindicator. They are the measurement data sourcesLwhat is actuallymeasuredLand are controlled by the organization. Attempting to mea-sure things that are beyond organizational control is a futile diversion ofresources and energy because the organization is not in a position torespond to the information collected. This would be best handled in thenext step.
. Step 5: parametersLThese are the external considerations that in£uencethe elements of measure in some way, such as context, constraint, andboundary. They are not controlled by the organization but are powerfulfactors in determining how the elements of measure will be used. Ifmeasurement data analysis indicates that these external considerations
Attributes of Good Metrics 57

present serious roadblocks for organizational progress, a policy changeaction could be generated.
. Step 6: means of measurementLThis step makes sense out of thepreceding pieces. A general, how-to action statement is written thatdescribes how the elements of measure and their associated parameterswill be applied to determine the achievement level in the performanceindicator. This statement can be brief, but clarifying intent is more impor-tant than the length.
. Step 7: notional metricsLIn this step, conceptual descriptions of possi-ble metrics resulting from the previous steps are put in writing. This stepallows everyone to agree on the concept of how the information compiledin the previous steps will be applied to measuring organizational perfor-mance. It provides a basis for validating the process and for subsequentlydeveloping speci¢c metrics.
. Step 8: speci¢c metricsLIn this ¢nal step, an operational de¢nition anda functional description of the metrics to be applied are written. Thede¢nition and description describe the data, how they are collected,how they are used, and, most importantly, what the data mean or howthey a¡ect organizational performance. A prototype display of real orimaginary data and a descriptive scenario that shows what actionsmight be taken as a result of the measurement are also made. This laststep is the real test of any metric. It must identify what things need tobe done and disclose conditions in su⁄cient detail to enable subsequentimprovement actions.
Rose presents an application of his model used by the U.S. Army MaterielCommand, which is shown in Figure 2.1.
SIX SIGMA VERSUS TRADITIONAL THREE SIGMAPERFORMANCE
The traditional quality model of process capability differed from Six Sigmain two fundamental respects:1. It was applied only to manufacturing processes, while Six Sigma is
applied to all important business processes.2. It stipulated that a ‘‘capable’’ process was one that had a process standard
deviation of no more than one-sixth of the total allowable spread,where Six Sigma requires the process standard deviation be no morethan one-twelfth of the total allowable spread.
These differences are far more profound than one might realize. By address-ing all business processes Six Sigma not only treats manufacturing as part of a
58 SIX SIGMA GOALS AND METRICS

larger system, it removes the narrow, inward focus of the traditional approach.Customers care about more than just how well a product is manufactured.Price, service, financing terms, style, availability, frequency of updates andenhancements, technical support, and a host of other items are also important.Also, Six Sigma benefits others besides customers. When operations becomemore cost-effective and the product design cycle shortens, owners or investorsbenefit too. When employees become more productive their pay can beincreased. Six Sigma’s broad scope means that it provides benefits to all stake-holders in the organization.The second point also has implications that are not obvious. Six Sigma is,
basically, a process quality goal, where sigma is a statistical measure of vari-ability in a process. As such it falls into the category of a process capabilitytechnique. The traditional quality paradigm defined a process as capable ifthe process’s natural spread, plus and minus three sigma, was less than theengineering tolerance. Under the assumption of normality, this three sigmaquality level translates to a process yield of 99.73%. A later refinement consid-ered the process location as well as its spread and tightened the minimumacceptance criterion so that the process mean was at least four sigma from
Six Sigma Versus Traditional Three Sigma Performance 59
Figure 2.1. Organizational performance metrics.From ‘‘A performance measurement model,’’ by Kenneth H. Rose.Quality Progress,
February 1995, p. 65. Reprinted by permission.

the nearest engineering requirement. Six Sigma requires that processes oper-ate such that the nearest engineering requirement is at least Six Sigma fromthe process mean.Six Sigma also applies to attribute data, such as counts of things gone wrong.
This is accomplished by converting the Six Sigma requirement to equivalentconformance levels, as illustrated in Figure 2.2.One of Motorola’s most significant contributions was to change the discus-
sion of quality from one where quality levels were measured in percent (parts-per-hundred), to a discussion of parts-per-million or even parts-per-billion.Motorola correctly pointed out that modern technology was so complex thatold ideas about ‘‘acceptable quality levels’’ could no longer be tolerated.Modern business requires near perfect quality levels.One puzzling aspect of the ‘‘official’’ Six Sigma literature is that it states that
a process operating at Six Sigma will produce 3.4 parts-per-million (PPM) non-conformances. However, if a special normal distribution table is consulted(very few go out to Six Sigma) one finds that the expected non-conformancesare 0.002 PPM (2 parts-per-billion, or PPB). The difference occurs becauseMotorola presumes that the process mean can drift 1.5 sigma in either direction.The area of a normal distribution beyond 4.5 sigma from the mean is indeed 3.4PPM. Since control charts will easily detect any process shift of this magnitude
60 SIX SIGMA GOALS AND METRICS
Figure 2.2. Sigma levels and equivalent conformance rates.

in a single sample, the 3.4 PPM represents a very conservative upper bound onthe non-conformance rate.In contrast to Six Sigma quality, the old three sigma quality standard of
99.73% translates to 2,700 PPM failures, even if we assume zero drift. For pro-cesses with a series of steps, the overall yield is the product of the yields of the dif-ferent steps. For example, if we had a simple two step process where step #1had a yield of 80% and step#2 had a yield of 90%, then the overall yield wouldbe 0:8� 0:9 ¼ 0:72 ¼ 72%. Note that the overall yield from processes invol-ving a series of steps is always less than the yield of the step with the lowestyield. If three sigma quality levels (99.97% yield) are obtained from every stepin a ten step process, the quality level at the end of the process will contain26,674 defects per million! Considering that the complexity of modern pro-cesses is usually far greater than ten steps, it is easy to see that Six Sigma qualityisn’t optional, it’s required if the organization is to remain viable.The requirement of extremely high quality is not limited to multiple-stage
manufacturing processes. Consider what three sigma quality would mean ifapplied to other processes:
. Virtually no modern computer would function.
. 10,800,000 mishandled healthcare claims each year.
. 18,900 lost U.S. savings bonds every month.
. 54,000 checks lost each night by a single large bank.
. 4,050 invoices sent out incorrectly each month by a modest-sized telecom-munications company.
. 540,000 erroneous call detail records each day from a regional telecommu-nications company.
. 270,000,000 (270 million) erroneous credit card transactions each year inthe United States.
With numbers like these, it’s easy to see that the modern world demandsextremely high levels of error free performance. Six Sigma arose in response tothis realization.
THE BALANCED SCORECARDGiven the magnitude of the difference between Six Sigma and the traditional
three sigma performance levels, the decision to pursue Six Sigma performanceobviously requires a radical change in the way things are done. The organizationthat makes this commitment will never be the same. Since the expenditure oftime and resources will be huge, it is crucial that Six Sigma projects and activ-ities are linked to the organization’s top-level goals. It is even more importantthat these be the right goals. An organization that uses Six Sigma to pursue thewrong goals will just get to the wrong place more quickly. The organization’s
The Balanced Scorecard 61
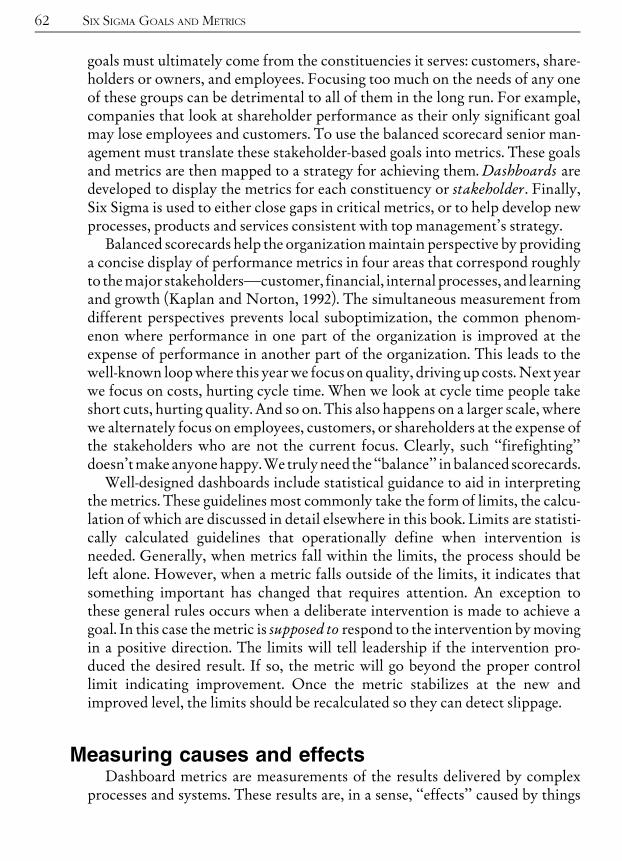
goals must ultimately come from the constituencies it serves: customers, share-holders or owners, and employees. Focusing too much on the needs of any oneof these groups can be detrimental to all of them in the long run. For example,companies that look at shareholder performance as their only significant goalmay lose employees and customers. To use the balanced scorecard senior man-agement must translate these stakeholder-based goals into metrics. These goalsand metrics are then mapped to a strategy for achieving them. Dashboards aredeveloped to display the metrics for each constituency or stakeholder. Finally,Six Sigma is used to either close gaps in critical metrics, or to help develop newprocesses, products and services consistent with top management’s strategy.Balanced scorecards help the organizationmaintain perspective by providing
a concise display of performance metrics in four areas that correspond roughlyto themajor stakeholdersLcustomer, financial, internal processes, and learningand growth (Kaplan and Norton, 1992). The simultaneous measurement fromdifferent perspectives prevents local suboptimization, the common phenom-enon where performance in one part of the organization is improved at theexpense of performance in another part of the organization. This leads to thewell-known loopwhere this yearwe focus on quality, driving up costs.Next yearwe focus on costs, hurting cycle time. When we look at cycle time people takeshort cuts, hurting quality. And so on. This also happens on a larger scale, wherewe alternately focus on employees, customers, or shareholders at the expense ofthe stakeholders who are not the current focus. Clearly, such ‘‘firefighting’’doesn’tmake anyonehappy.We trulyneed the ‘‘balance’’ in balanced scorecards.Well-designed dashboards include statistical guidance to aid in interpreting
the metrics. These guidelines most commonly take the form of limits, the calcu-lation of which are discussed in detail elsewhere in this book. Limits are statisti-cally calculated guidelines that operationally define when intervention isneeded. Generally, when metrics fall within the limits, the process should beleft alone. However, when a metric falls outside of the limits, it indicates thatsomething important has changed that requires attention. An exception tothese general rules occurs when a deliberate intervention is made to achieve agoal. In this case the metric is supposed to respond to the intervention bymovingin a positive direction. The limits will tell leadership if the intervention pro-duced the desired result. If so, the metric will go beyond the proper controllimit indicating improvement. Once the metric stabilizes at the new andimproved level, the limits should be recalculated so they can detect slippage.
Measuring causes and effectsDashboard metrics are measurements of the results delivered by complex
processes and systems. These results are, in a sense, ‘‘effects’’ caused by things
62 SIX SIGMA GOALS AND METRICS

taking place within the processes. For example, ‘‘cost per unit’’ might be ametric on a top-level dashboard. This is, in turn, composed of the cost of materi-als, overhead costs, labor, etc. Cost of materials is a ‘‘cause’’ of the cost perunit. Cost of materials can be further decomposed into, say, cost of raw materi-als, cost of purchased sub-assemblies, etc. and so on. At some level we reach a‘‘root cause,’’ or most basic reason behind an effect. Black Belts and GreenBelts learn numerous tools and techniques to help them identify these rootcauses. However, the dashboard is the starting point for the quest.In Six Sigma work, results are known as ‘‘Ys’’ and root causes are known as
‘‘Xs.’’ Six Sigma’s historical roots are technical and its originators generallycame from engineering and scientific backgrounds. In the mathematics taughtto engineers and scientists equations are used that often express a relationshipin the form:
Y ¼ f Xð Þ ð2:1ÞThis equation simply means that the value identified by the letter Y is deter-
mined as a function of some other value X. The equation Y = 2X means that ifwe know what X is, we can find Y if we multiply X by 2. If X is the temperatureof a solution, then Y might be the time it takes the solution to evaporate.Equations can become more complicated. For example, Y = f(X1, X2) indicatesthat the value Y depends on the value of two different X variables. You shouldthink of the X in Equation 2.1 as including any number of X variables. Therecan be many levels of dashboards encountered between the top-level Y, calledthe ‘‘Big Y,’’ and the root cause Xs. In Six Sigma work some special notationhas evolved to identify whether a root cause is being encountered, or an inter-mediate result. Intermediate results are sometimes called ‘‘Little Ys.’’In these equations think of Y as the output of a process and the Xs as inputs.
The process itself is symbolized by the f(). The process can be thought of as atransfer function that converts inputs into outputs in some way. An analogy isa recipe. Here’s an example:
Corn Crisp Recipe12 servings
34cup yellow stone-ground cornmeal
1 cup boiling water12teaspoon salt
3 tablespoons melted butter
Preheat the oven to 4008F. Stir the cornmeal and boiling water together in alarge glass measuring cup. Add the salt and melted butter. Mix well and
The Balanced Scorecard 63

pour onto a cookie sheet. Using a spatula, spread the batter out as thin as youpossibly canLthe thinner the crisper. Bake the cornmeal for half an hour oruntil crisp and golden brown. Break into 12 roughly equal pieces.
Here the Big Y is the customer’s overall satisfaction with the finished corncrisp. Little Ys would include flavor ratings, ‘‘crunchiness’’ rating, smell, fresh-ness, and other customer-derived metrics that drive the Big Y. Xs that drive thelittle Ys might include thinness of the chips, the evenness of the salt, the size ofeach chip, the color of the chip, and other measurements on the finished pro-duct. Xs could also be determined at each major step, e.g., actual measurementof the ingredients, the oven temperature, the thoroughness of stirring, howmuch the water cools before it is stirred with the cornmeal, actual bake time,etc. Xs would also include the oven used, the cookware, utensils, etc.Finally, the way different cooks follow the recipe is the transfer function or
actual process that converts the ingredients into corn crisps. Numerous sourcesof variation (more Xs) can probably be identified by observing the cooks inaction. Clearly, even such a simple process can generate some very interestingdiscussions. If you haven’t developed dashboards it might be worthwhile to doso for the corn crisps as a practice exercise.Figure 2.3 illustrates how dashboard metrics flow down until eventually
linking with Six Sigma projects.
Information systemsBalanced scorecards begin with the highest level metrics. At any given level,
dashboards will display a relatively small number of metrics. While this allowsthe user of the dashboard to focus on key items, it also presents a problemwhen the metric goes outside a control limit for reasons other than deliberatemanagement action. When this happens the question is: Why did this metricchange? Information systems (IS) can help answer this question by providing‘‘drill down’’ capability. Drill down involves disaggregating dashboard metricsinto their component parts. For example, a cost-per-unit metric can be decom-posed by division, plant, department, shift, worker, week, etc. These compo-nents of the higher-level metric are sometimes already on dashboards at lowerlevels of the organization, in which case the answer is provided in advance.However, if the lower-level dashboard metrics can’t explain the situation,other exploratory drill downs may be required. On-line analytic processing(OLAP) cubes often ease the demands on the IS caused by drill down requests.This raises an important point: in Six Sigma organizations the IS must be
accessed by many more people. The attitude of many IS departments is ‘‘Thedata systems belong to us. If you want some data, submit a formal request.’’ In
64 SIX SIGMA GOALS AND METRICS
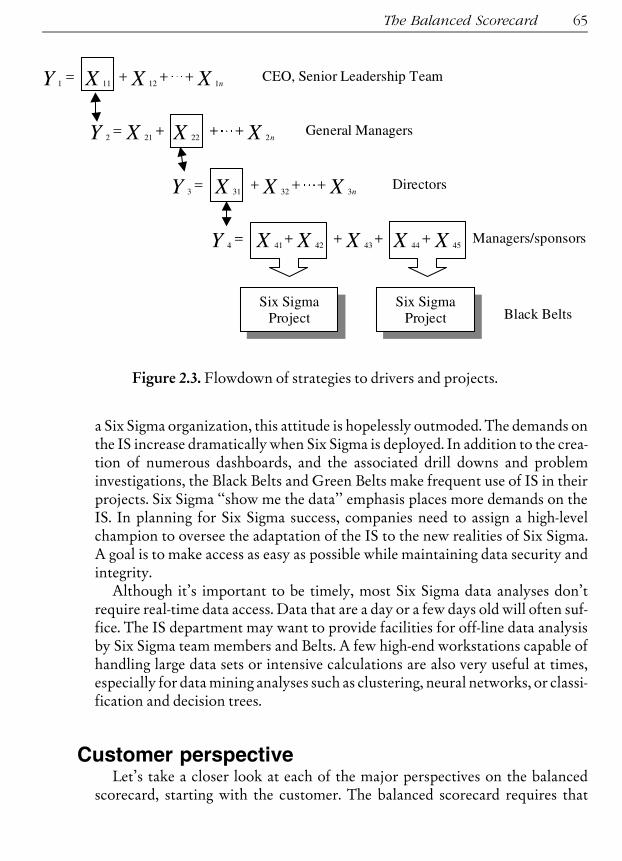
a Six Sigma organization, this attitude is hopelessly outmoded. The demands onthe IS increase dramatically when Six Sigma is deployed. In addition to the crea-tion of numerous dashboards, and the associated drill downs and probleminvestigations, the Black Belts and Green Belts make frequent use of IS in theirprojects. Six Sigma ‘‘show me the data’’ emphasis places more demands on theIS. In planning for Six Sigma success, companies need to assign a high-levelchampion to oversee the adaptation of the IS to the new realities of Six Sigma.A goal is to make access as easy as possible while maintaining data security andintegrity.Although it’s important to be timely, most Six Sigma data analyses don’t
require real-time data access. Data that are a day or a few days old will often suf-fice. The IS department may want to provide facilities for off-line data analysisby Six Sigma team members and Belts. A few high-end workstations capable ofhandling large data sets or intensive calculations are also very useful at times,especially for datamining analyses such as clustering, neural networks, or classi-fication and decision trees.
Customer perspectiveLet’s take a closer look at each of the major perspectives on the balanced
scorecard, starting with the customer. The balanced scorecard requires that
The Balanced Scorecard 65
Figure 2.3. Flowdown of strategies to drivers and projects.
management translate their vague corporate mission (‘‘Acme will be #1 inproviding customer value’’) into specific measures of factors that matter tocustomers. The customer scorecard answers the question: ‘‘How do our custo-mers view us?’’To answer this, you must ask yourself two related questions: What things do
customers consider when evaluating us? How do we know? While the onlytrue way to answer these questions is to communicate with real customers, it iswell established that customers in general tend to consider four broad categoriesof factors when evaluating an organization:
. Quality. How well do you keep your promises by delivering error freeservice or defect free product. Did I receive what I ordered? Was itundamaged? Are your promised delivery times accurate? Do you honoryour warranty or pay your claims without a hassle?
. Timeliness. How fast is your service? How long does it take to have myorder delivered? Do improvements appear in a timely manner?
. Performance and service. How do your products and services helpme? Arethey dependable?
. Value. What is the cost of buying and owning your product or service? Is itworth it?
The first step in the translation is to determine preciselywhat customers con-sider when evaluating your organization. This can be done by communicatingwith customers via one-on-one contacts, focus groups, questionnaires, chatrooms, forums, etc. Management should see the actual, unvarnished wordsused by customers to describe what they think about the company, its products,and its services. Once management is thoroughly familiar with their target cus-tomer, they need to articulate their customer goals in words meaningful tothem. For example, management might say:
. We will cut the time required to introduce a new product from 9 monthsto 3 months.
. We will be the best in the industry for on-time delivery.
. We will intimately involve our customers in the design of our next majorproduct.
These goals must be operationalized by designating metrics to act as surro-gates for the goals. Think of the goals themselves as latent or hidden constructs.The objective is to identify observable things directly related to the goals thatcan be measured. These are indicators that help guide you towards your goals.Table 2.1 shows examples of how the goals mentioned above might be operatio-nalized.These goals are key requirements that employees will be asked to achieve. It is
crucial that they not be set arbitrarily. More will be said about this later in thischapter (see ‘Setting organizational key requirements’).
66 SIX SIGMA GOALS AND METRICS

Internal process perspectiveIn the Internal Process section of the balanced scorecard we develop metrics
that help answer the question: What internal processes must we excel at?Internal process excellence is linked to customer perceived value, but the link-age is indirect and imperfect. It is often possible to hide internal problemsfrom customers by throwing resources at problems; for example, increasedinspection and testing. Also, customer perceived value is affected by factorsother than internal processes such as price, competitive offerings, etc.Similarly, internal operations consume resources so they impact the share-holders. Here again, the linkage is indirect and imperfect. For example, some-times it is in the organization’s strategic interest to drive up costs in order tomeet critical short-term customer demands or to head off competitive movesin the market. Thus, simply watching the shareholder or customer dashboardswon’t always give leadership a good idea of how well internal processes areperforming. A separate dashboard is needed for this purpose.This section of the scorecard gives operational managers the internal direc-
tion they need to focus on customer needs. Internal metrics should be chosento support the leadership’s customer strategy, plus knowledge of what custo-mers need from internal operations. Process maps should be created that showthe linkage between suppliers, inputs, process activities, outputs and customers(SIPOC). SIPOC is a flowcharting technique that helps identify those processes
The Balanced Scorecard 67
Table 2.1. Operationalizing goals.
Goal Candidate Metrics
We will cut the time required tointroduce a new product from 9 monthsto 3 months
.Average time to introduce a new productfor most recent month or quarter
.Number of new products introduced inmost recent quarter
We will be the best in the industry foron-time delivery
. Percentage of on-time deliveries
. Best in industry on-time delivery percentagedivided by our on-time delivery percentage
. Percentage of late deliveries
We will intimately involve ourcustomers in the design of our nextmajor product
.Number of customers on design team(s)
.Number of customer suggestionsincorporated in new design

that have the greatest impact on customer satisfaction; it is covered elsewhere inthis book.Companies need to identify and measure their core competencies. These are
areas where the companymust excel. It is the source of their competitive advan-tage. Goals in these areas must be ambitious and challenging. This where you‘‘Wow’’ your customer. Other key areas will pursue goals designed to satisfycustomers, perhaps by maintaining competitive performance levels. Table 2.2shows how core competencies might drive customer value propositions. Themetrics may be similar for the different companies, but the goals will differ sig-nificantly. For example, Company A would place greater emphasis on the timerequired to develop and introduce new services. Companies B and C wouldnot ignore this aspect of their internal operations, but their goals would be lessambitious in this area than Company A’s. Company A is the industry bench-mark for innovation.Of course, it is possible that your competitor will try to leapfrog you in your
core competency, becoming the new benchmark and stealing your customers.Or you may find that your customer base is dwindling and the market for yourparticular competency is decreasing. Leadership must stay on the alert for suchdevelopments and be prepared to react quickly. Most companies will fight tomaintain their position of industry leadership as long as there is an adequatemarket. Six Sigma can help in this battle because Six Sigma projects are usually
68 SIX SIGMA GOALS AND METRICS
Table 2.2. Customer value proposition versus core competency.
Internal Process Company A Company B Company C
Innovation X
Customerrelationshipmanagement
X
Operations andlogistics
X
Customer valueproposition
Product or serviceattributes
Flexibility,customization
Cost,dependability
‘‘X’’ indicates the company’s core competency.
of short duration strategically speaking, and Black Belts offer a resource that canbe redeployed quickly to where they are most needed.
Innovation and learning perspectiveIn the Innovation and Learning Perspective section of the balanced scorecard
we develop metrics that help answer the question: Can we continue to improveand create value? Success is a moving target. What worked yesterday may failmiserably tomorrow. Previous sections of the balanced scorecard have identi-fied the metrics the leadership considers to be most important for success inthe near future. But the organization must be prepared to meet the new andchanging demands that themore distant future will surely bring. Building share-holder value is especially dependent on the company’s ability to innovate,improve, and learn. The intrinsic value of a business is the discounted value ofthe cash that can be taken out of the business during its remaining life (Buffett,1996). Intrinsic value is directly related to a company’s ability to create new pro-ducts and processes, to improve operating efficiency, to discover and developnew markets, and to increase revenues and margins. Companies able to do thiswell will throw off more cash over the long term than companies that do itpoorly. The cash generated can be withdrawn by the owners, or reinvested inthe business.Innovation and learning were the areas addressed by the continuous
improvement (CI) initiatives of the past. Devotees of CI will be happy tolearn that it’s alive and well in the Six Sigma world. However, CI projectswere often local in scope, while most Black Belt Six Sigma projects are cross-functional. Many so-called Green Belt projects (Six Sigma projects that don’thave a dedicated Black Belt on the project team) are reminiscent of the CIprojects in the past. Also, CI tended to focus narrowly on work processes,while Green Belt projects cover a broader range of business processes, pro-ducts, and services. A well-designed Six Sigma program will have a mix ofGreen Belt and Black Belt projects addressing a range of enterprise and localprocess improvement issues.Dashboards designed to measure performance in the area of Innovation and
Learning often address three major areas: employee competencies, technology,and corporate culture. These are operationalized in a wide variety of ways.One metric is the average rate of improvement in the sigma level of an organiza-tional unit. Six Sigma attempts to reduce mistakes, errors, and defects by a fac-tor of 10 every two years, which translates to about 17% per month. Thisbreakthrough rate of improvement is usually not attained instantly and ametricof the actual rate is a good candidate for including on the Innovation andLearning dashboard. The rate of improvement is a measure of the overall matur-
The Balanced Scorecard 69
ity of the Six Sigma initiative. Other Innovation and Learningmetric candidatesmight include such things as:
. Results of employee feedback
. R&D cycle time
. Closure of gaps identi¢ed in the training needs audit
Financial perspectiveObsession with financial metrics has been the undoing of many improve-
ment initiatives. When senior leaders look only at results they miss the factthat these results come from a complex chain of interacting processes that effec-tively and efficiently produce value for customers. Only by providing valuethat customers are willing to pay for can an enterprise generate sales, and onlyby creating these values at a cost less than their price can it produce profits forowners. For many companies the consequence of looking only at short-termfinancial results has been a long-term decline in business performance. Manycompanies have gone out of business altogether.The result of this unfortunate history is that many critics have advocated the
complete abandonment of the practice of using financial metrics to guide lea-dership action. The argument goes something like this: since financial resultsare determined by a combination of customer satisfaction and the way the orga-nization runs its internal operations, if we focus on these factors the financialperformance will follow in due course. This is throwing the baby out with thebathwater. The flaw in the logic is that it assumes that leaders and managersknow precisely how customer satisfaction and internal operational excellencelead to financial results. This arrogance is unjustified. Too often we learn in ret-rospect that we are focusing on the wrong things and the financial results failto materialize. For example, we may busily set about improving the throughputof a process that already has plenty of excess capacity. All we get from this effortis more excess capacity. Many Six Sigma improvements don’t result in bottom-line impact because management fails to take the necessary steps such asreducing excess inventory, downsizing extra personnel, selling off unneededequipment, etc. As Toyota’s Taiichi Ohno says:
If , as a result of labor saving, 0.9 of a worker is saved, it means nothing. Atleast one person must be saved before a cost reduction results. Therefore,we must attain worker saving.
Taiichi OhnoToyota Production System: Beyond Large-Scale Production
The truth is, it’s very difficult to lay people off and a poor reward for peoplewho may have participated in creating the improvement. Most managers agree
70 SIX SIGMA GOALS AND METRICS

that this is the worst part of their job. However, simply ignoring the issue isn’tthe best way to deal with it. Plans must be made before starting a project foradjusting to the consequences of success. If there will be no bottom-line impactbecause there are to be no plans to convert the savings into actual reductionsin resource requirements, the project shouldn’t be undertaken in the firstplace.On the other hand, plans can often bemade at the enterprise level for deal-ing with the positive results of Six Sigma by such means as hiring moratoriums,early retirement packages, etc. Better still are plans to increase sales or to growthe business to absorb the new capacity. This can often be accomplished bymodifying the customer value proposition through more reliable products,lower prices, faster delivery time, lower cycle times, etc. These enhancementsare made possible as a result of the Six Sigma improvements.There are other ways to go wrong if financial results are not explicitly moni-
tored. We may blindly pour resources into improving customer satisfaction asmeasured by a faulty or incomplete survey. Or the competition may discover anew technology that makes ours obsolete. The list of things that can break thelink between internal strategies and financial performance is endless. Financialperformance metrics provide us with the feedback we need to assure that wehaven’t completely missed the boat with our assumptions.Actual metrics for monitoring financial performance are numerous. The top-
level dashboard will often include metrics in the areas of improved efficiency(e.g., cost per unit, asset utilization) or improved effectiveness (e.g., revenuegrowth, market share increase, profit per customer).
STRATEGY DEPLOYMENT PLANUnlike traditional measurement systems, which tend to have a control bias,
balanced scorecards are based on strategy. The idea is to realize the leadershipvision using a set of linked strategies. Metrics operationalize these strategiesand create a bond between the activities of the organization and the vision ofthe leadership.Figure 2.4 illustrates these principles for a hypothetical organization. Things
that will actually be measured are shown in rectangles. The dashboard metricsappear on the left side of the figure. The strategy deployment planmakes it clearthat themetrics are not ends in themselves, they aremerelymeasurements of big-ger items of interest. These unobserved, or latent constructs are shown in ellipsesand are inferred from the metrics. This perspective helps leadership understandthe limitations ofmetrics, as well as their value. If, for example, all of themetricsleading to shareholder perceived value are strongly positive, but surveys of theshareholders (Voice of Shareholder) indicate shareholder dissatisfaction, thenthe dashboardmetrics are obviously inadequate and need to be revised.
Strategy Deployment Plan 71
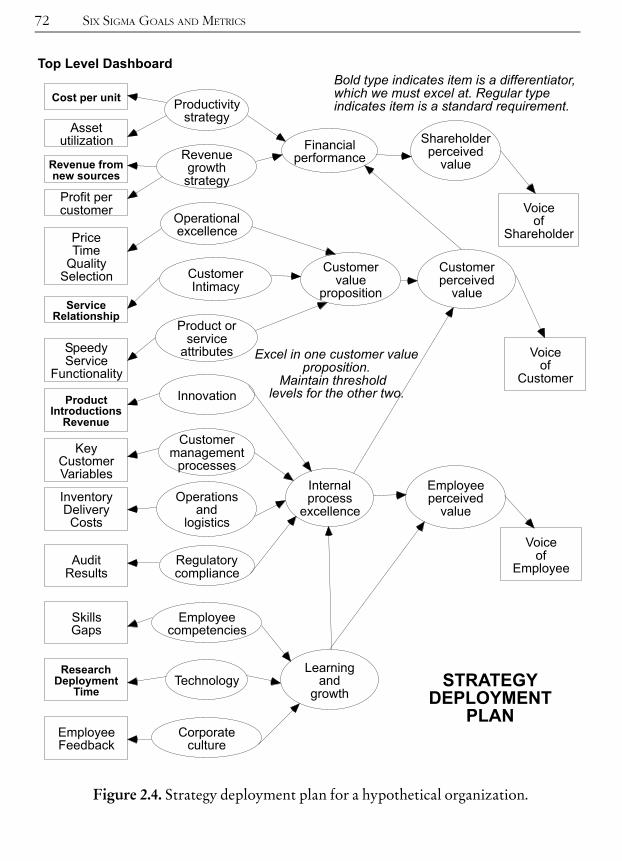
72 SIX SIGMA GOALS AND METRICS
Figure 2.4. Strategy deployment plan for a hypothetical organization.
The organization is pursuing a particular strategy and emphasizing certaindashboard metrics, which are shown in boldface type. Goals for these metricswill be set very high in an attempt to differentiate this organization from itscompetition. Goals for other metrics (key requirements) will be set to achievecompetitiveness. Usually this means to maintain historical levels for thesemetrics.The organization’s leaders believe their core competencies are in the areas of
technology and customer service. They want their customers to think of them as
The company to go to for the very best products completely customized tomeet extremely demanding needs.
However, note that the organization’s differentiators are:1. Cost per unit2. Revenues from new sources3. [Customer] service relationship4. Product introductions, [new product] revenues5. Research deployment timeIt appears that item 1 is inconsistent with the leadership vision. Most peo-
ple would be confused if asked to achieve benchmark status for items 2^5 aswell as for item 1. The plan indicates that the productivity strategy for thisorganization should be reevaluated. Unless the company is losing its marketdue to uncompetitive prices, or losing its investors due to low profits, item 1should probably be a key requirement maintained at historical levels. If costsare extremely out of line, cost per unit might be the focus of a greater thannormal amount of attention to bring it down to reasonable levels. However,it should not be shown as a differentiator on the strategic dashboard. Thecompany has no desire to become a cost leader in the eyes of customers orshareholders.Six Sigma plays a vital role in achieving the leadership vision by providing the
resources needed to facilitate change where it is needed. Six Sigma projects arelinked to dashboard metrics through the project selection process discussedelsewhere in this book. The process involves calculating the expected impact ofthe project on a dashboard metric. The metrics used for Six Sigma projects aretypically on a lower-level dashboard, but since the lower-level dashboardmetrics flow down from the top level, the linkage is explicit. The process beginsby identifying the gap between the current state and the goal for each top-leveldashboard metric; Master Black Belts commonly assist with this activity. SixSigma projects impacting differentiator dashboard metrics which show largegaps are prime candidates. This determination is usually done by Master BlackBelts. This information is also very useful in selecting Black Belt candidates.Candidates with backgrounds in areas where high-impact projects will be
Strategy Deployment Plan 73

pursued may be given preference over equally qualified candidates from else-where in the organization.
INFORMATION SYSTEMS REQUIREMENTSSix Sigma technical leaders work to extract actionable knowledge from an
organization’s information warehouse. To assure access to the needed infor-mation, Six Sigma activities should be closely integrated with the informationsystems (IS) of the organization. Obviously, the skills and training of SixSigma technical leaders must be supplemented by an investment in softwareand hardware. It makes little sense to hamstring these experts by saving a fewdollars on computers or software. Six Sigma often requires the analysis of hugeamounts of data using highly sophisticated algorithms. The amount of timerequired to perform the analysis can be considerable, even with today’sadvanced processing equipment. Without state-of-the-art tools, the situation isoften hopeless.
Integrating Six Sigma with other informationsystems technologies
There are three information systems topics that are closely related to SixSigma activities:
. Data warehousing
. On-line Analytic Processing (OLAP)
. Data miningThe first topic relates to what data is retained by the organization, and there-
fore available for use in Six Sigma activities. It also impacts on how the data isstored, which impacts on ease of access for Six Sigma analyses. OLAP enablesthe analysis of large databases by persons who may not have the technical back-ground of a Six Sigma technical leader. Data mining involves retrospective ana-lysis of data using advanced tools and techniques. Each of these subjects willbe discussed in turn.
DATA WAREHOUSINGData warehousing has progressed rapidly. Virtually non-existent in 1990,
now every large corporation has at least one data warehouse and some have sev-eral. Hundreds of vendors offer data warehousing solutions, from software tohardware to complete systems. Few standards exist and there are as many datawarehousing implementations as there are data warehouses. However, themultitiered approach to data warehousing is a model that appears to be gaining
74 SIX SIGMA GOALS AND METRICS

favor and recent advances in technology and decreases in prices have made thisoption more appealing to corporate users.Multitiereddatawarehousing architecture focuses onhow thedata areused in
the organization. While access and storage considerations may require sum-marization of data into multiple departmental warehouses, it is better for SixSigma analysis if the warehouse keeps all of the detail in the data for historicalanalysis. Themajor components of this architecture are (Berry andLinoff, 1997):
. Source systems are where the data come from.
. Data transport and cleansingmove data between di¡erent data stores.
. The central repository is the main store for the data warehouse.
. Themetadata describes what is available and where.
. Data marts provide fast, specialized access for end users and applications.
. Operational feedback integrates decision support back into the opera-tional systems.
. End users are the reason for developing the warehouse in the ¢rst place.Figure 2.5 illustrates the multitiered approach.Every data warehouse includes at least one of these building blocks. The data
originates in the source systems and flows to the end users through the variouscomponents. The components can be characterized as hardware, software, andnetworks. The purpose is to deliver information, which is in turn used to createnew knowledge, which is then acted on to improve business performance. Inother words, the data warehouse is ultimately a component in a decision-support system.
OLAPOn-line analytic processing, or OLAP, is a collection of tools designed to
provide ordinary users with a means of extracting useful information fromlarge databases. These databases may or may not reside in a data warehouse.If they do, then the user obtains the benefit of knowing the data has alreadybeen cleansed, and access is likely to be more efficient. OLAP consists ofclient-server tools that have an advanced graphical interface that accessesdata arranged in ‘‘cubes.’’ The cube is ideally suited for queries that allowusers to slice-and-dice the data in any way they see fit. OLAP tools havevery fast response times compared to SQL queries on standard relationaldatabases.The basic unit of OLAP is the cube.AnOLAP cube consists of subcubes that
summarize data from one ormore databases. Each cube is composed ofmultipledimensions which represent different fields in a database. For example, anOLAP cube might consist of warranty claims arranged by months, products,and region, as shown in Figure 2.6.
Information Systems Requirements 75

DATA MININGData mining is the exploration and analysis by automatic or semi-automatic
means of large quantities of data in order to uncover useful patterns. These pat-terns are studied in order to develop performance rules, i.e., new and betterways of doing things. Data mining, as used in Six Sigma, is directed towardimproving customer satisfaction, lowering costs, reducing cycle times, andincreasing quality.Data mining is a grab-bag of techniques borrowed from various disciplines.
Like Six Sigma, data mining alternates between generating questions via knowl-
76 SIX SIGMA GOALS AND METRICS
Figure 2.5. The multitiered approach to data warehousing.FromData Mining Techniques for Marketing, Sales, and Customer Support, by Michael J.A.Berry and Gordon Lino¡, New York, John W|ley and Sons, 1997. Used by permission of the
publisher.

edge discovery, and testing hypotheses via designed experiments. Six Sigma anddata mining both look for the same things in evaluating data, namely classifi-cation, estimation, prediction, a⁄nity grouping, clustering and description.However, data mining tends to use a di¡erent set of tools than traditional SixSigma tools and therefore it o¡ers another way to look for improvement oppor-tunities. Also, where Six Sigma tends to focus on internal business processes,data mining looks primarily at marketing, sales, and customer support. Sincethe object of Six Sigma is, ultimately, to improve customer satisfaction, theexternal focus of data mining provides both feed forward data to the Six Sigmaprogram and feed back data on its success.Data mining is a process for retrospectively exploring business data. There is
growing agreement on the steps involved in such a process and any differencesrelate only to the detailed tasks within each stage.*
Goal definitionLThis involves defining the goal or objective for the datamining project. This should be a business goal or objective which nor-mally relates to a business event such as arrears inmortgage repayment,customer attrition (churn), energy consumption in a process, etc. Thisstage also involves the design of how the discovered patterns will resultin action that leads to business improvement.
Data selectionLThis is the process of identifying the data needed for thedata mining project and the sources of these data.
Data preparationLThis involves cleansing the data, joining/mergingdata sources and the derivation of new columns (fields) in the datathrough aggregation, calculations or text manipulation of existingdata fields. The end result is normally a flat table ready for theapplication of the data mining itself (i.e. the discovery algorithmsto generate patterns). Such a table is normally split into two data
Information Systems Requirements 77
Figure 2.6. An OLAP cube.
*http://www.attar.com/tutor/deploy.htm.
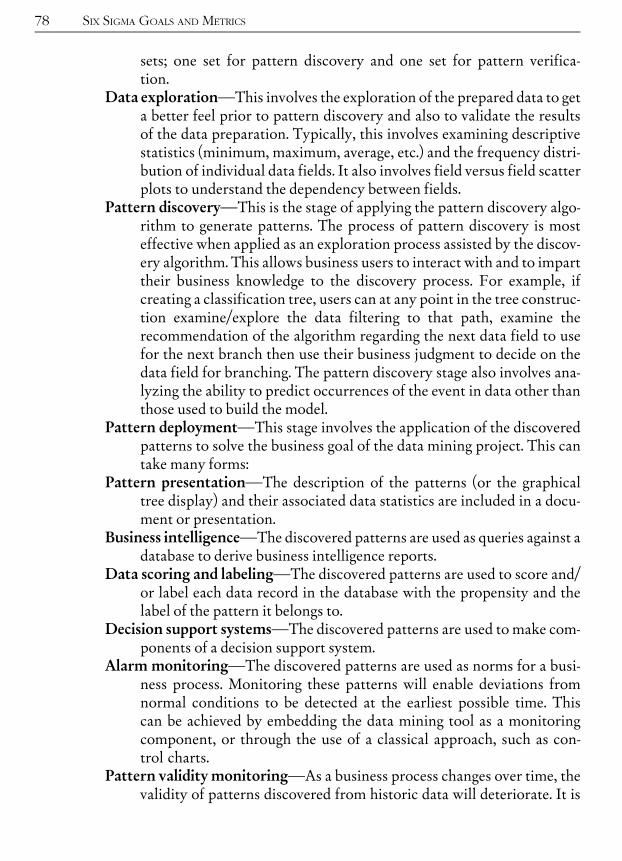
sets; one set for pattern discovery and one set for pattern verifica-tion.
Data explorationLThis involves the exploration of the prepared data to geta better feel prior to pattern discovery and also to validate the resultsof the data preparation. Typically, this involves examining descriptivestatistics (minimum, maximum, average, etc.) and the frequency distri-bution of individual data fields. It also involves field versus field scatterplots to understand the dependency between fields.
Pattern discoveryLThis is the stage of applying the pattern discovery algo-rithm to generate patterns. The process of pattern discovery is mosteffective when applied as an exploration process assisted by the discov-ery algorithm. This allows business users to interact with and to imparttheir business knowledge to the discovery process. For example, ifcreating a classification tree, users can at any point in the tree construc-tion examine/explore the data filtering to that path, examine therecommendation of the algorithm regarding the next data field to usefor the next branch then use their business judgment to decide on thedata field for branching. The pattern discovery stage also involves ana-lyzing the ability to predict occurrences of the event in data other thanthose used to build the model.
Pattern deploymentLThis stage involves the application of the discoveredpatterns to solve the business goal of the data mining project. This cantake many forms:
Pattern presentationLThe description of the patterns (or the graphicaltree display) and their associated data statistics are included in a docu-ment or presentation.
Business intelligenceLThe discovered patterns are used as queries against adatabase to derive business intelligence reports.
Data scoring and labelingLThe discovered patterns are used to score and/or label each data record in the database with the propensity and thelabel of the pattern it belongs to.
Decision support systemsLThe discovered patterns are used to make com-ponents of a decision support system.
Alarm monitoringLThe discovered patterns are used as norms for a busi-ness process. Monitoring these patterns will enable deviations fromnormal conditions to be detected at the earliest possible time. Thiscan be achieved by embedding the data mining tool as a monitoringcomponent, or through the use of a classical approach, such as con-trol charts.
Pattern validity monitoringLAs a business process changes over time, thevalidity of patterns discovered from historic data will deteriorate. It is
78 SIX SIGMA GOALS AND METRICS

therefore important to detect these changes at the earliest possible timeby monitoring patterns with new data. Significant changes to thepatterns will point to the need to discover new patterns from morerecent data.
OLAP, data mining, and Six SigmaOLAP is not a substitute for data mining. OLAP tools are a powerful means
for reporting on data, while data mining focuses on finding hidden patterns indata. OLAP helps users explore theories they already have by quickly present-ing data to confirm or disconfirm ad hoc hypotheses, obviously a valuableknowledge discovery tool for Six Sigma teams. It is, essentially, a semi-auto-mated means of analysis. OLAP and data mining are complementary, and bothapproaches complement the standard arsenal of tools and techniques used inSix Sigma. Both OLAP and data mining are used for retrospective studies, thatis, they are used to generate hypotheses by examining past data. Designedexperiments help users design prospective studies, that is, they test the hypoth-eses generated by OLAP and data mining. Used together, Six Sigma, datamining and OLAP comprise a powerful collection of business improvementtools.
DASHBOARD DESIGNStrategies are operationalized by metrics which are displayed on dash-
boards. Dashboard displays should be designed to provide the needed infor-mation in a way that is standardized throughout the organization. A processowner at any level of the organization should be able to look at any dashboardand quickly recognize the meaning of the data. The purpose of data displaysis to accelerate the learning cycle. The strategy deployment plan is merely ahypothesis. Science-based management requires that we test this hypothesisto determine if it is in reasonable agreement with the facts, and take actionor revise the strategy deployment plan or the strategy accordingly. The cycleworks as follows:1. Formulate a strategy (hypothesis).2. Develop metrics to operationalize the strategy.3. Deploy the strategy.4. Collect data for the metrics.5. Analyze the data to extract information regarding the e¡ectiveness of the
strategy deployment plan. This includes the use of statistical tools andtechniques, graphs and charts, discussion of results, etc.
Dashboard Design 79

6. Think about the result indicated by the information and whether it vali-dates or invalidates the strategy and/or the metrics used to operation-alize it.
7. Take appropriate action. This may be no action (the null option),revision of the strategy, revision of the metrics, or some other steps.
This process is illustrated in Figure 2.7.Dashboard metrics should embody all of the general principles of good
metrics discussed earlier. More specifically, dashboards should:. Display performance over time.. Include statistical guidelines to help separate signal (variation from anidenti¢able cause) from noise (variation similar to random £uctuations).
. Show causes of variation when known.
. Identify acceptable and unacceptable performance (defects).
. Be linked to higher-level dashboards (goals and strategies) or lower-leveldashboards (drivers) to guide strategic activity within the organization.
Although all dashboards should conform to these guidelines, different dash-board formats are needed for data on different scales of measurement (seeChapter 9). Because of the nature of measurement scales, some data containmore information than other data. For example, we might be interested in thesize of a hole that will have a bushing pressed into it. If the hole is too large, thebushing will be loose and it will wear out quickly. If the hole is too small thebushing won’t fit at all. Assume that there are three different methods availablefor checking the hole size.Method #1 is a hole gage that measures the actual size of the hole. These
data are called ratio data. This measurement scale contains the most infor-mation. Interval data such as time and temperature are often treated as ifthey were ratio data, which is usually acceptable for dashboards. In our dis-cussions of dashboards we will refer to both ratio and interval data as scaledata.Method #2 is a set of four pin gages. One set of two pins determines if the
hole is smaller than the minimum requirement, or larger than the maximumrequirement. For example, if the hole size requirement is 1.000 to 1.010, thenthis set will determine if the hole is smaller than 1.000 or larger than 1.010.Another set of two pins determines if the hole is in themiddle half of the require-ment range. For example, if the hole size requirement is 1.000 to 1.010, then
80 SIX SIGMA GOALS AND METRICS
Figure 2.7. The learning cycle.

this set of pins will determine if the hole is smaller than 1.0025 or larger than1.0075. Thus, hole sizes will be classified by this measurement system as:
Best:Middle half of requirements.Acceptable:Not in middle half, but still meets requirements.Reject:Does not meet requirements.
These data are called ordinal data. That is, themeasurements can be placed inan order of preference. Ordinal data don’t contain as much information asratio data or interval data. For example, we can calculate the precise differencebetween two hole sizes if we know their measurements, but we can’t do so ifwe only know the hole size classification.Method#3 is a single pair of go/not-go pin gages: pins will be used to deter-
mine if the hole meets the requirements or not. These are nominal data.Nominal data have less information than ratio, interval or ordinal data.Although dashboards are discussed in some detail and examples shown and
interpreted, there are no hard and fast rules for dashboards. Any dashboardthat displays metrics derived from strategic goals and conforming to the princi-ples of good metrics described above is acceptable, providing it supplies theinformation needed to make good decisions in a timely manner. You shouldavoid cookbook dashboard development and design dashboards that help youassure that your strategies are being effectively deployed and accomplishingyour ultimate goals.
Dashboards for scale dataData on these measurement scales contain the maximum amount of infor-
mation. In fact, as the examples above show, it is a simple matter to deriveordinal or nominal metrics from scale data, but one cannot go in reverse. Totake advantage of the information contained in scale data they should beviewed in a variety of different ways on the dashboards. Figure 2.8 providesguidelines.These different, but related views give a detailed picture of the performance
of the metric. If annotated and linked to driver dashboards, the reason why themetric did what it did should be relatively easy to determine.
EXAMPLE OF SCALE DATA DASHBOARDFigure 2.9 shows a dashboard for a fictitious customer service call center. The
metric is speed of answer, which was decided upon based on customer input. Itwas determined from actual customer information that customers viewed
Dashboard Design 81
speed-to-answer times in excess of 6 minutes to be unacceptable, so this isdefined as the requirement.
Process central tendency: The chart in Quad I shows the average speed toanswer (ASA) for the most recent month. The dashed lines are statisticallycalculated ‘‘limits,’’ which define the normal range of variability in ASA forthis process (for additional information on averages’ charts, see Chapter12). The chart indicates that the process ASA is stable and averaging 3.2minutes.
Distribution of calls: ASA is a good indicator of overall process control, butindividual customers have individual experiences, so the average doesn’t meanmuch to them. The histogram in Quad II gives a better indication of the indivi-dual customer’s experience in the most recent week. The bar labeled ‘‘More’’indicates the calls not meeting the customer requirement; it’s a pretty big bar.
82 SIX SIGMA GOALS AND METRICS
QUAD ICENTRAL TENDENCYOVERTIMEProcess Behavior Chart of the metricin time order. E.g., by hour, day, week,or month. Generally an averages chartor equivalent. Learn by studying time-related patterns, outliers, etc.
QUAD IIRECENT PERFORMANCEDISTRIBUTION PATTERNHistogram showing distribution of themetric for the most recent timeperiod. E.g., histogram of the mostrecent month. The requirementshould be drawn on the histogram toidentify defects. Learn by studying thefrequency distribution pattern.
QUAD IIIREQUIREMENTS PERSPECTIVEOVER TIMEA Process Behavior Chart of the rateof defects or defectives in time-order.Learn by studying defect patterns.
QUAD IVOUTLIEROR ‘‘TAILS’’PERSPECTIVEA chart showing the distribution ofindividual defectives, such as a dotplotor box-and-whiskers charts. I.e., an‘‘ungrouping’’ of the defect datashown as grouped by the histogram.Learn by studying process changesdesigned to improve extremely poorcustomer experiences.
Figure 2.8. Layout of a scale data dashboard.

Despite a process average of 3.2 minutes, approximately 15% of the callsanswered this week were not answered within 6 minutes.
Defectives over time: Okay, so we failed to meet the customer requirements15% of the time during this week. Is that due to some special circumstancethat only happened once? The chart in Quad III shows the pattern of defec-tives over time; the dashed lines are limits for the percent not meetingrequirements. The chart shows that the defective rate is stable and averaging15%.
Outlier or tails perspective: Finally, a box-and-whiskers chart, or boxplots(see Chapter 11) is shown in Quad IV. The time scale is chopped off (trun-cated) at 6 minutes, since we are interested in learning about calls that failedto meet the requirement. In the plot, an ‘‘*’’ or an ‘‘o’’ is an individual callthat is considered an outlier. The chart indicates that some people wait avery long time for the phone to be answered, but most get an answer within10 minutes.
Dashboard Design 83
Figure 2.9. Example of a scale data dashboard.

INTERPRETATIONIt is important to note that although the speed-to-answer metric indicates a
stable process mean, this may not be what management wants to see. In thiscase, it’s very unlikely that management will be satisfied with a process that con-sistently makes 15% of the customers wait too long for their call to be answered.This metric is a good candidate for one or more Six Sigma projects. The projectBlack Belt will no doubt drill down to lower level dashboards to attempt to iden-tify drivers to address during the project. For example, are there differences bydepartment? By technician?The interpretation of the dashboard also depends on the strategy it operatio-
nalizes. In this example, if the company is pursuing a strategy where processexcellence is a primary driver, then the 6minute requirement might not be suffi-cient. Instead of asking customers what level of service would satisfy them, thefocus might be on the level of service that would delight them. Perhaps the com-pany’s leadership believes that some customers (e.g., professionals) would paya premium price to have the phone answered immediately, in which case themetric of interest might be ‘‘percentage of calls not answered within threerings.’’ Staff levels could be increased because of the increased prices paid bythese premier customers.
Dashboards for ordinal dataFigure 2.10 provides guidelines for ordinal data dashboards. These different,
but related views give a detailed picture of the performance of the metric. Ifannotated and linked to driver dashboards, the reason why the metric did whatit did should be relatively easy to determine.
EXAMPLE OF ORDINAL DATA DASHBOARDFigure 2.11 shows a dashboard from a customer survey metric measuring
how easy it is for the customer to contact the call center.Process central tendency: The chart in Quad I shows the weekly average ease
of contact scores. This is the same type of chart used in Quad I for scale datadashboards, and it is used the same way.
Distribution of ratings: Quad II shows the distribution of actual customerratings. The customers had to choose a response on a five-point scale; highernumbered responses are better. Previous research had determined that custo-mers who gave a response below 4 were less likely to remain customers thanthose who scored easy-to-contact a 4 or better, so that’s where the defect line isdrawn on the bar chart. Note that this isn’t a histogram because the data are
84 SIX SIGMA GOALS AND METRICS

not grouped. The bar at, say, 2 indicates the number of customers who ratedeasy-to-contact a 2. A large number of customers in this example rate ease ofcontact very low.
Defectives over time: Quad III for ordinal data is a process behaviorchart of the defective rate, just like it is in the scale data dashboard. Sincedefective rates are pass/fail data (did or did not meet the requirement), itis a nominal measurement and we can convert the ordinal data into nom-inal data for this chart. This chart shows that the defective rate for thiscall center is stable at 48%; i.e., we consistently fail to meet the customerrequirement.
Outlier or tails perspective: Since we are analyzing the voice of the customer,leadership wanted to use Quad IV to display some actual customer comments.(Comments can also be statistically analyzed.) The comments highlight someproblem areas that could become Six Sigma projects. Other problem areashave obvious solutions and can be addressed without Six Sigma projects.Don’t use a hammer to swat a fly!
Dashboard Design 85
QUAD ICENTRAL TENDENCYOVERTIMEProcess Behavior Chart of the metricin time order. E.g., by hour, day, week,or month. Generally an averages chartor equivalent. Learn by studying time-related patterns, outliers, etc.
QUAD IIRECENT PERFORMANCEDISTRIBUTION PATTERNBar chart showing distribution of themetric for the most recent timeperiod. E.g., bar chart of the mostrecent month. The requirementshould be drawn on the bar chart toidentify defects. Learn by studying thefrequency distribution pattern.
QUAD IIIREQUIREMENTS PERSPECTIVEOVER TIMEA Process Behavior Chart of the rateof defects or defectives in time-order.Learn by studying defect patterns.
QUAD IVADDITIONAL INFORMATIONText, drawings, links to otherdocuments, photos, maps or otherinformation that lends meaning to thedata.
Figure 2.10. Layout of an ordinal data dashboard.

INTERPRETATIONLike speed-to-answer, the dashboard for easy-to-contact indicates a stable
process mean at an unacceptable performance level. It may be that manage-ment is responsible for this situation, which is usually the case when a processis stable. The Six Sigma project may require a new process design. Stabilitymeans that there’s no point in looking for ‘‘problems.’’ If management isn’thappy with the results, the problem is the process itself. The process redesignshould be linked to the overall strategy. This means, for example, if the strat-egy is to make the customer relationship a differentiator, then the goal foreasy-to-contact should be set at or near a benchmark level. If it is a require-ment, then the goal should be set near the industry average. However, keepin mind that if the industry average is awful, then differentiation should berelatively easy to attain.
86 SIX SIGMA GOALS AND METRICS
Defects
�
Figure 2.11. Example of an ordinal data dashboard.

Dashboards for nominal dataNominal data, such as pass-fail, yes-no, acceptable-unacceptable, met goal-
didn’t meet goal, are based on rates (e.g., failure rates), counts or proportionsof counts. Unlike scale or ordinal data, nominal data can’t be further brokendown into numbers on other scales. Typically, nominal data dashboards showdefect metrics or, equivalently, success metrics. In many cases where defectivesor failures are measured, non-defectives or non-failures provide identical infor-mation.Figure 2.12 provides guidelines for nominal data dashboards. Since there are
limits to how much information can be obtained by analyzing nominal datadirectly, nominal data dashboards focus on providing background details.Also, since nominal metrics are so often measures of process failure, you maywish to devote part of the dashboard to descriptions of action being taken toimprove the metric.
QUAD IREQUIREMENTS PERSPECTIVEOVER TIMEA Process Behavior Chart of the rateof defects or defectives in time-order.Learn by studying defect patterns.
QUAD IIADDITIONAL INFORMATIONA graph or table providing additionalinformation regarding the metric.
QUAD IIIADDITIONAL INFORMATIONA graph or table providing additionalinformation regarding the metric.
QUAD IVADDITIONAL INFORMATIONAction plans, responsibilities,timetables, etc. for improving themetric.
Figure 2.12. Layout of a nominal data dashboard.
EXAMPLE OF NOMINAL DATA DASHBOARDFigure 2.13 shows a dashboard from a customer survey metric measuring
the rate at which customer issues were unresolved after they spoke with atechnician. Obviously, this can be considered a failure in terms of customerservice.
Defectives over time: Quad I for nominal data is a process behavior chart ofthe defective rate. This chart appears on the dashboards for scale and ordinaldata too, but in later quads. In this example the chart shows that the non-resolu-tion rate for this call center is not stable. During one week the rate of unresolved
Dashboard Design 87
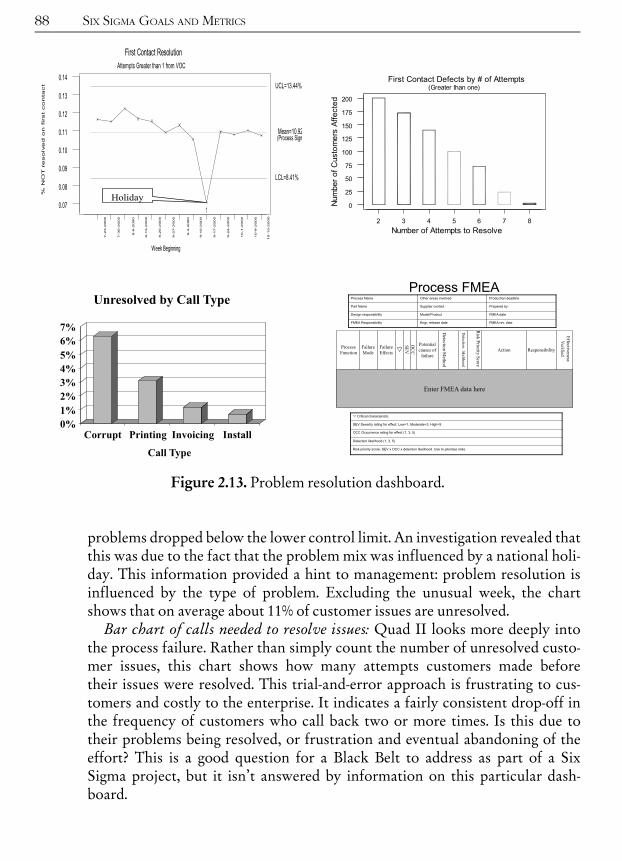
problems dropped below the lower control limit. An investigation revealed thatthis was due to the fact that the problem mix was influenced by a national holi-day. This information provided a hint to management: problem resolution isinfluenced by the type of problem. Excluding the unusual week, the chartshows that on average about 11% of customer issues are unresolved.
Bar chart of calls needed to resolve issues: Quad II looks more deeply intothe process failure. Rather than simply count the number of unresolved custo-mer issues, this chart shows how many attempts customers made beforetheir issues were resolved. This trial-and-error approach is frustrating to cus-tomers and costly to the enterprise. It indicates a fairly consistent drop-off inthe frequency of customers who call back two or more times. Is this due totheir problems being resolved, or frustration and eventual abandoning of theeffort? This is a good question for a Black Belt to address as part of a SixSigma project, but it isn’t answered by information on this particular dash-board.
88 SIX SIGMA GOALS AND METRICS
Figure 2.13. Problem resolution dashboard.

Pareto analysis by call type: Tipped off by the holiday week outlier, leader-ship asked for an analysis by call type. This information is shown in Quad III.Corrupt data files account for nearly half of the unresolved customer issues,suggesting a possible area to be addressed by a Six Sigma project.
Process FMEA: FMEA stands for Failure Mode and Effects Analysis. As thename suggests, FMEA is a tool that can be used to identify the way in whichthe process fails. Quad IV could be used to display such information. Once aproject is underway to address issues identified by the FMEA, Quad IV couldbe used to track the project’s progress. FMEA is discussed in Chapter 16.
INTERPRETATIONThis dashboard shows that there is a real opportunity to improve customer
satisfaction. The key information is contained in the process behavior chart inQuad I. The long-term rate of unresolved issues of 11% is costing the companya lot of money, and frustrating customers. Each call beyond the first is purewaste.
SETTING ORGANIZATIONAL KEY REQUIREMENTSPlans, budgets, goals and targets are key requirements set by the leadership
for the organization. If not done properly, the behavior driven by these keyrequirements may not be anywhere close to what the leadership desires, orexpects. Key requirements are used to assess employee performance, which islinked to promotions, pay increases, bonuses andmany other things that peoplecare about a great deal. People will try hard to meet the key requirements, butif the process they must work with makes it impossible to do so they will oftencheat (see sidebar, Gaming the System).The most common flaw in goal setting, in my opinion, is the tendency to
set goals that are merely wishes and hopes. The leadership looks at a metricand pontificates on what a ‘‘good’’ level of performance would be for it.If enough heads nod around the conference table, this becomes that metric’starget.A better way to arrive at goals for key requirements is to examine the actual
history of the metric over time. This information should be plotted on a processbehavior chart. If the metric falls within the calculated limits the bulk of thetime, then the process is considered predictable. Typically, unless the metric isoperationalizing a differentiation strategy, the goal for predictable processeswill be to maintain the historical levels. These metrics will not appear on thedashboards that the leadership reviews on a routine basis. However, theirperformance is monitored by process owners and the leadership is informed if
Setting Organizational Key Requirements 89

90 SIX SIGMA GOALS AND METRICS
Gaming the SystemIt has been said that the managers of factories in the former Soviet Union didn’t fail
to meet their numerical targets, rather that they met them too well. Is the quota formy shoe factory 100,000 pairs of shoes? Here are 100,000 pairs of baby shoes, the easiestto make. Change the quota to 10,000 pounds of shoes and the shoe factory managerwill deliver 500 pairs of concrete boots. One advantage of balanced scorecards is thatthey make it more di⁄cult to get away with ‘‘gaming the system’’ like this. Gaming thesystem involves the manipulation of metrics to reach numerical targets, rather thanactually achieving the goals themselves. Of course, balanced scorecards can’t solve theproblems inherent in communism, and the situation in our companies is nowhere nearas bad. But we’ve all seen similar behavior when managers are given metrics for theirlocal area and inadequate information about how the metrics ¢t into the grand schemeof things.
Another common game that gets played is ‘‘denominator management.’’ Denominatormanagement is the practice of manipulating the base of a metric, rather than doing thework necessary to change the underlying reality. Is my metric defects-per-million-opportu-nities? Well, reducing defects is di⁄cult and time-consuming. I’ll just manipulate the num-ber of opportunities. Table 2.3 below shows a few examples of this, creative gamers cancome up with many more!
Table 2.3. Examples of denominator management.
Intent Denominator Management Approach
1. Reduce defective circuitboards
2. Reduce customer billingproblems
3. Improve time to introducenew products
4. Reduce setup costs5. Improve process yields
1. Count the number of components notthe number of circuit boards
2. Count the lines (or words) on billingstatements not the number ofstatements
3. Develop simple products4. Increase batch sizes5. Produce more simple parts
By linking the metric to the strategic goal and by simultaneously monitoring all key dif-ferentiator metrics on the stakeholder dashboards, gaming is minimized. Six Sigma’s ratio-nalization of management also makes gaming more di⁄cult. If, despite repeated warnings,some people persist in gaming the system, and assuming they are given the resources theyneed to meet the key requirements, they should be disciplined or terminated. Gaming isinherently dishonest and it has no place in the Six Sigma organization.
the process behavior becomes unpredictable. In other words, the reporting is onan exception basis.If process behavior charts indicate that a key requirement metric is not
predictable, an investigation into the reason should ensue and the cause of theunpredictability should be corrected.Finally, if the key requirement metric is so far from generally accepted
standards of performance that it demands action, a short-term projectshould be commissioned to address the issue. The project team shouldfocus on identifying why performance is so far below the norm and onwhat needs to be done to remedy the situation. This is not a strategicfocus, but a remedial one, and it should not distract the leadership frompursuing their vision.Goal setting for differentiators is another matter entirely. Unlike key
requirements, the historical level of performance for differentiators is unaccep-table by definition. Leadership doesn’t want to maintain differentiator perfor-mance, it wants to improve it dramatically. Setting goals for differentiators isdiscussed next.
BenchmarkingBenchmarking is a topic of general interest in Six Sigma. Thus, the dis-
cussion here goes beyond the use of benchmarking in project managementalone.Benchmarking is a popular method for developing requirements and setting
goals. In more conventional terms, benchmarking can be defined as measuringyour performance against that of best-in-class companies, determining howthe best-in-class achieve those performance levels, and using the informationas the basis for your own company’s targets, strategies, and implementation.Benchmarking involves research into the best practices at the industry, firm,
or process level. Benchmarking goes beyond a determination of the ‘‘industrystandard;’’ it breaks the firm’s activities down to process operations and looksfor the best-in-class for a particular operation. For example, to achieve improve-ment in their parts distribution process Xerox Corporation studied the retailerL.L. Bean.Benchmarking goes beyond the mere setting of goals. It focuses on practices
that produce superior performance. Benchmarking involves setting up partner-ships that allow both parties to learn from one another. Competitors can alsoengage in benchmarking, providing they avoid proprietary issues.Benchmarking projects are like any othermajor project. Benchmarkingmust
have a structured methodology to ensure successful completion of thoroughand accurate investigations. However, it must be flexible to incorporate new
Setting Organizational Key Requirements 91
and innovative ways of assembling difficult-to-obtain information. It is a dis-covery process and a learning experience. It forces the organization to take anexternal view, to look beyond itself.
THE BENCHMARKING PROCESSCamp (1989) lists the following steps for the benchmarking process:1. Planning
1.1. Identify what is to be benchmarked1.2. Identify comparative companies1.3. Determine data collection method and collect data
2. Analysis2.1. Determine current performance ‘‘gap’’2.2. Project future performance levels
3. Integration3.1. Communicate benchmark ¢ndings and gain acceptance3.2. Establish functional goals
4. Action4.1. Develop action plans4.2. Implement speci¢c actions and monitor progress4.3. Recalibrate benchmarks
5. Maturity5.1. Leadership position attained5.2. Practices fully integrated into process
The first step in benchmarking is determining what to benchmark. To focusthe benchmarking initiative on critical issues, begin by identifying the processoutputs most important to the customers of that process (i.e., the key qualitycharacteristics). This step applies to every organizational function, since eachone has outputs and customers. The QFD/customer needs assessment is anatural precursor to benchmarking activities.
GETTING STARTED WITH BENCHMARKINGThe essence of benchmarking is the acquisition of information. The process
begins with the identification of the process that is to be benchmarked. Theprocess chosen should be one that will have a major impact on the success ofthe business.Once the process has been identified, contact a business library and request
a search for the information relating to your area of interest. The library willidentify material from a variety of external sources, such as magazines,journals, special reports, etc. You should also conduct research using the
92 SIX SIGMA GOALS AND METRICS

Internet and other electronic networking resources. However, be prepared topare down what will probably be an extremely large list of candidates (e.g.,an Internet search on the word ‘‘benchmarking’’ produced 20,000 hits).Don’t forget your organization’s internal resources. If your company has an‘‘Intranet’’ use it to conduct an internal search. Set up a meeting with peoplein key departments, such as R&D. Tap the expertise of those in your companywho routinely work with customers, competitors, suppliers, and other ‘‘out-side’’ organizations. Often your company’s board of directors will have anextensive network of contacts.The search is, of course, not random. Look for the best of the best, not the
average firm. There are many possible sources for identifying the elites. Oneapproach is to build a compendium of business awards and citations of meritthat organizations have received in business process improvement. Sources toconsider are Industry Week’s Best Plant’s Award, National Institute ofStandards and Technology’s Malcolm Baldrige Award, USA Today andRochester Institute of Technology’s Quality Cup Award, EuropeanFoundation for Quality Management Award, Occupational Safety and HealthAdministration (OSHA), Federal Quality Institute, Deming Prize,Competitiveness Forum, Fortune magazine, United States Navy’s BestManufacturing Practices, to name just a few. You may wish to subscribe to an‘‘exchange service’’ that collects benchmarking information and makes it avail-able for a fee. Once enrolled, you will have access to the names of other sub-scribersLa great source for contacts.Don’t overlook your own suppliers as a source for information. If your com-
pany has a program for recognizing top suppliers, contact these suppliers andsee if they are willing to share their ‘‘secrets’’ with you. Suppliers are predis-posed to cooperate with their customers; it’s an automatic door-opener. Alsocontact your customers. Customers have a vested interest in helping you do abetter job. If your quality, cost, and delivery performance improve, your cus-tomers will benefit. Customers may be willing to share some of their insightsas to how their other suppliers compare with you. Again, it isn’t necessary thatyou get information about direct competitors. Which of your customer’ssuppliers are best at billing? Order fulfillment? Customer service? Keep yourfocus at the process level and there will seldom be any issues of confidentiality.An advantage to identifying potential benchmarking partners through your cus-tomers is that you will have a referral that will make it easier for you to startthe partnership.Another source for detailed information on companies is academic research.
Companies often allow universities access to detailed information for researchpurposes. While the published research usually omits reference to the specificcompanies involved, it often provides comparisons and detailed analysis of
Setting Organizational Key Requirements 93
what separates the best from the others. Such information, provided by expertswhose work is subject to rigorous peer review, will often save you thousandsof hours of work.After a list of potential candidates is compiled, the next step is to choose the
best three to five targets. A candidate that looked promising early in the processmight be eliminated later based on the following criteria (Vaziri, 1992):
. Not the best performer
. Unwilling to share information and practices (i.e., doesn’t view the bench-marking process as a mutually bene¢cial learning opportunity)
. Low availability and questionable reliability of information on thecandidate
As the benchmarking process evolves, the characteristics of the most desir-able candidates will be continually refined. This occurs as a result of a clearerunderstanding of your organization’s key quality characteristics and criticalsuccess factors and an improved knowledge of the marketplace and otherplayers.This knowledge and the resulting actions tremendously strengthen an
organization.
WHY BENCHMARKING EFFORTS FAILThe causes of failed benchmarking projects are the same as those for other
failed projects (DeToro, 1995):. Lack of sponsorshipLA team should submit to management a one- tofour-page benchmarking project proposal that describes the project, itsobjectives, and potential costs. If the team can’t gain approval for the pro-ject or get a sponsor, it makes little sense to proceed with a project that’snot understood or appreciated or that is unlikely to lead to correctiveaction when completed.
. Wrong people on teamLWho are the right people for a benchmarkingteam? Individuals involved in benchmarking should be the same oneswho own or work in the process. It’s useless for a team to addressproblems in business areas that are unfamiliar or where the team has nocontrol or in£uence.
. Teams don’t understand their work completelyLIf the benchmarkingteam didn’t map, £owchart, or document its work process, and if it didn’tbenchmark with organizations that also documented their processes,there can’t be an e¡ective transfer of techniques. The intent in everybenchmarking project is for a team to understand how its process worksand compare it to another company’s process at a detailed level. Theexchange of process steps is essential for improved performance.
94 SIX SIGMA GOALS AND METRICS

. Teams take on too muchLThe task a team undertakes is often so broadthat it becomes unmanageable. This broad area must be broken into smal-ler, more manageable projects that can be approached logically. A sug-gested approach is to create a functional £owchart of an entire area, suchas production or marketing, and identify its processes. Criteria can thenbe used to select a process to be benchmarked that would best contributeto the organization’s objectives.
. Lack of long-term management commitmentLSince managers aren’tas familiar with speci¢c work issues as their employees, they tend tounderestimate the time, cost, and e¡ort required to successfully completea benchmarking project. Managers should be informed that while it’simpossible to know the exact time it will take for a typical benchmarkingproject, there is a rule of thumb that a team of four or ¢ve individualsrequires a third of their time for ¢ve months to complete a project.
. Focus on metrics rather than processesLSome ¢rms focus their bench-marking e¡orts on performance targets (metrics) rather than processes.Knowing that a competitor has a higher return on assets doesn’t meanthat its performance alone should become the new target (unless an under-standing exists about how the competitor di¡ers in the use of its assetsand an evaluation of its process reveals that it can be emulated or sur-passed).
. Not positioning benchmarking within a larger strategyLBenchmark-ing is one of many Six Sigma toolsLsuch as problem solving, processimprovement, and process reengineeringLused to shorten cycle time,reduce costs, and minimize variation. Benchmarking is compatible withand complementary to these tools, and they should be used together formaximum value.
. Misunderstanding the organization’s mission, goals, and objectivesLAll benchmarking activity should be launched by management as part ofan overall strategy to ful¢ll the organization’s mission and vision by ¢rstattaining the short-term objectives and then the long-term goals.
. Assuming every project requires a site visitLSu⁄cient information isoften available from the public domain, making a site visit unnecessary.This speeds the benchmarking process and lowers the cost considerably.
. Failure to monitor progressLOnce benchmarking has been completedfor a speci¢c area or process benchmarks have been established andprocess changes implemented, managers should review progress inimplementation and results.
The issues described here are discussed in other parts of this chapter and inother parts of this book. The best way of dealing with them is to prevent theiroccurrence by carefully planning and managing the project from the outset.
Setting Organizational Key Requirements 95
This list can be used as a checklist to evaluate project plans; if the plans don’tclearly preclude these problems, then the plans are not complete.
THE BENEFITS OF BENCHMARKINGThe benefits of competitive benchmarking include:. Creating a culture that values continuous improvement to achieve excel-lence
. Enhancing creativity by devaluing the not-invented-here syndrome
. Increasing sensitivity to changes in the external environment
. Shifting the corporate mind-set from relative complacency to a strongsense of urgency for ongoing improvement
. Focusing resources through performance targets set with employee input
. Prioritizing the areas that need improvement
. Sharing the best practices between benchmarking partners
SOME DANGERS OF BENCHMARKINGBenchmarking is based on learning from others, rather than developing new
and improved approaches. Since the process being studied is there for all tosee, benchmarking cannot give a firm a sustained competitive advantage.Although helpful, benchmarking should never be the primary strategy forimprovement.Competitive analysis is an approach to goal setting used by many firms. This
approach is essentially benchmarking confined to one’s own industry.Although common, competitive analysis virtually guarantees second-ratequality because the firmwill always be following their competition. If the entireindustry employs the approach it will lead to stagnation for the entire industry,setting them up for eventual replacement by outside innovators.
96 SIX SIGMA GOALS AND METRICS

^ ^ ^CHAPTER
3
Creating Customer-DrivenOrganizations
ELEMENTS OF CUSTOMER-DRIVEN ORGANIZATIONSThe proper place of the customer in the organization’s hierarchy is illu-
strated in Figure 3.1.Note that this perspective is precisely the opposite of the traditional view of
the organization. The difficulties involved in making such a radical changeshould not be underestimated.
Figure 3.1. The ‘‘correct’’ view of the company organization chart.FromMarketing Management: Analysis, Planning, Implementation, and Control, Figure 1^7,p. 21, by Philip Kotler, copyright# 1991 by Prentice-Hall, Inc. Reprinted by permission.
Copyright 2003 by The McGraw-Hill Companies, Inc. Click Here for Terms of Use.

Becoming a customer- and market-drivenenterprise
Edosomwan (1993) defines a customer- and market-driven enterprise as onethat is committed to providing excellent quality and competitive products andservices to satisfy the needs and wants of a well-defined market segment. Thisapproach is in contrast to that of the traditional organization, as shown inTable 3.1.The journey from a traditional to a customer-driven organization has been
made by enough organizations to allow us to identify a number of distinct mile-stones that mark the path to success. Generally, the journey begins with recog-nition that a crisis is either upon the organization, or imminent. This wrenchesthe organization’s leadership out of denial and forces them to abandon thestatus quo.When the familiar ways of the past are no longer acceptable, the result is a
feeling of confusion among the leaders. At this stage the leadership must answersome very basic questions:
. What is the organization’s purpose?
. What are our values?
. What does an organization with these values look like?A ‘‘value’’ is that which one acts to gain and/or keep. It presupposes an entity
capable of acting to achieve a goal in the face of an alternative. Values are notsimply nice-sounding platitudes, they represent goals. Pursuing the organiza-tion’s values implies building an organization which embodies these values.This is the leadership’s vision, to create a reality where their values have beenachievedAfter the vision has been clearly developed, the next step is to develop a
strategy for building the new organization (see Chapter 1). The process ofimplementing the strategic plan is the turnaround stage.
Elements of the transformed organizationCustomer-driven organizations share certain common features.. Flattened hierarchiesLGetting everyone closer to the customer involvesreducing the number of bureaucratic ‘‘layers’’ in the organization struc-ture. It also involves the ‘‘upside-down’’ perspective of the organizationstructure shown in Figure 3.1. The customer comes ¢rst, not the boss.Everyone serves the customer.
. Risk-takingLCustomers’ demands tend to be unpredictable.Responsiveness requires that organizations be willing to change quickly,
98 CREATING CUSTOMER-DRIVEN ORGANIZATIONS

Elements of Customer-Driven Organizations 99
Table 3.1. Traditional organizations vs. customer-driven organizations.From Customer and Market-Driven Quality Management, Table 1.1, by Johnson A.
Edosomwan, copyright# 1993 by ASQ. Reprinted by permission.
TRADITIONALORGANIZATIONS
CUSTOMER-DRIVENORGANIZATIONS
Product and serviceplanning
^ Short-term focus^ Reactionary management^ Management by objectivesplanning process
^ Long-term focus^ Prevention-based management^ Customer-driven strategicplanning process
Measures ofperformance
^ Bottom-line ¢nancial results^ Quick return on investment
^ Customer satisfaction^ Market share^ Long-term pro¢tability^ Quality orientation^ Total productivity
Attitudes towardcustomers
^ Customers are irrational anda pain
^ Customers are a bottleneckto pro¢tability
^ Hostile and careless^ ‘‘Take it or leave it’’ attitude
^ Voice of the customer isimportant
^ Professional treatment andattention to customers isrequired
^ Courteous and responsive^ Empathy and respectfulattitude
Quality of productsand services
^ Provided according toorganizational requirements
^ Provided according tocustomer requirements andneeds
Marketing focus ^ Seller’s market^ Careless about lostcustomers due to poorcustomer satisfaction
^ Increased market share and¢nancial growth achieved
Processmanagementapproach
^ Focus on error and defectdetection
^ Focus on error and defectprevention

which involves uncertainty and risk Customer-driven organizationsencourage risk-taking in a variety of ways. One important aspect is tocelebrate mistakes made by individuals who engage in risky behavior.Bureaucratic impediments such as excessive dependence on written pro-cedures are minimized or eliminated. Employees are encouraged to acton their own best judgments and not to rely on formal approvalmechanisms.
. CommunicationLDuring the transformation the primary task of theleadership team is the clear, consistent, and unambiguous transmissionof their vision to others in the organization. One way this is done isthrough ‘‘internal marketing’’ which involves using the principles of mar-keting to get the message to the target ‘‘market’’: the employees. It is vitalthat the leaders’ actions are completely consistent with their words. The
100 CREATING CUSTOMER-DRIVEN ORGANIZATIONS
TRADITIONALORGANIZATIONS
CUSTOMER-DRIVENORGANIZATIONS
Product and servicedelivery attitude
^ It is OK for customers towait for products andservices
^ It is best to provide fast time-to market products andservices
People orientation ^ People are the source ofproblems and are burdens onthe organization
^ People are an organization’sgreatest resource
Basis for decision-making
^ Product-driven^ Management by opinion
^ Customer-driven^ Management by data
Improvementstrategy
^ Crisis management^ Management by fear andintimidation
^ Continuous processimprovement
^ Total process management
Mode of operation ^ Career-driven andindependent work
^ Customers, suppliers, andprocess owners have nothingin common
^Management-supportedimprovement
^ Teamwork between suppliers,process owners, and customerspracticed
Table 3.1 continued

assistance of outside consultants may be helpful in identifying inconsis-tencies.Leaders should realize that their behavior carries tremendous symbolic
meaning. This can contribute to the failure of convincing employees; a sin-gle action which is inconsistent with the stated message is su⁄cient todestroy all credibility. On the plus side, an action that clearly shows a com-mitment to the vision can help spread the word that ‘‘They’re serious thistime.’’ The leadership should seek out stories that capture the essence ofthe new organization and repeat these stories often. For example,Nordstrom employees all hear the story of the sales clerk who allowedthe customer to return a tire (Nordstrom’s doesn’t sell tires). This storycaptures the essence of the Nordstrom ‘‘rule book’’ which states:
Rule#1LUse your own best judgment.Rule #2LThere are no other rules.
Leaders should expect to devote a minimum of 50% of their time to commu-nication during the transition.
. Boards of directorsLIt is vital to obtain the enthusiastic endorsement ofthe new strategy by the board. Management cannot focus their attentionuntil this support has been received. This will require that managementeducate their board and ask them for their approval. However, boardsare responsible for governance, not management. Don’t ask the board toapprove tactics. This bogs down the board, sti£es creativity in the ranks,and slows the organization down.
. UnionsLIn the transformed organization, everyone’s job changes. Ifthe organization’s employees are unionized, changing jobs requiresthat the union become management’s partner in the transformationprocess. In the £at organization union employees will have greaterauthority. Union representatives should be involved in all phases ofthe transformation, including planning and strategy development. Bygetting union input, the organization can be assured that during collec-tive bargaining the union won’t undermine the company’s ability tocompete or sabotage the strategic plan. Unions also play a role in audit-ing the company’s activities to assure that they comply with contractsand labor laws.
. Measuring resultsLIt is important that the right things be measured.The ‘‘right things’’ are measurements that determine that you are deliv-ering on your promises to customers, investors, employees, and otherstakeholders. You must also measure for the right reasons. This meansthat measurements are used to learn about how to improve, not forjudgment. Finally, you must measure the right way. Measurements
Elements of Customer-Driven Organizations 101
should cover processes as well as outcomes. Data must be availablequickly to the people who use them. Measurements must be easy tounderstand.
. Rewarding employeesLCare must be taken to avoid punishing withrewards. Rewarding individuals with ¢nancial incentives for simplydoing their jobs well implies that the employee wouldn’t do the jobwithout the reward. It is inherently manipulative. The result is todestroy the very behavior you seek to encourage (Kohn, 1993). The mes-sage is that rewards should not be used as control mechanisms.Employees should be treated like adults and provided with adequateand fair compensation for doing their jobs. Recognizing exceptional per-formance or e¡ort should be done in a way that encourages cooperationand team spirit, such as parties and public expressions of appreciation.Leaders should assure fairness: e.g., management bonuses and workerpay cuts don’t mix.
SURVEYS AND FOCUS GROUPSThere are any number of reasons why a firm may wish to communicate with
its customers. A primary reason is the evaluation of the customer’s perceptionof the firm’s product and service quality and its impact on customer satisfaction.The purpose may be to get an idea of the general condition of quality and satis-faction, or a comparison of the current levels with the firm’s goals. A firmmight wish to conduct employee surveys and focus groups to assess the organi-zation’s quality structure.
Strategies for communicating with customers andemployees
There are four primary strategies commonly used to obtain informationfrom or about customers and employees:
. sample surveys
. case studies
. ¢eld experiments
. available dataWith sample surveys, data are collected from a sample of a universe to
estimate the characteristics of the universe, such as their range or dispersion,the frequency of occurrence of events, or the expected values of importantuniverse parameters. The reader should note that these terms are consistentwith the definition of enumerative statistical studies described in Chapter 9.
102 CREATING CUSTOMER-DRIVEN ORGANIZATIONS

This is the traditional approach to such surveys. However, if survey resultsare collected at regular intervals, the results can be analyzed using the qualitycontrol tools described in Part II to obtain information on the underlyingprocess. The process excellence leader should not be reticent in recommend-ing that survey budgets be allocated to conducting small, routine, periodicsurveys rather than infrequent ‘‘big studies.’’ Without the information avail-able from time-ordered series of data, it will not be possible to learn aboutprocesses which produce changes in customer satisfaction or perceptions ofquality.A case study is an analytic description of the properties, processes, condi-
tions, or variable relationships of either single or multiple units under study.Sample surveys and case studies are usually used to answer descriptive ques-tions (‘‘How do things look?’’) and normative questions (‘‘How well do thingscompare with our requirements?’’). A field experiment seeks the answer to acause-and-effect question (‘‘Did the change result in the desired outcome?’’).Use of available data as a strategy refers to the analysis of data previously col-lected or available from other sources. Depending on the situation, availabledata strategies can be used to answer all three types of questions: descriptive,normative, and cause-and-effect. Original data collection strategies such asmail questionnaires are often used in sample surveys, but they may also beused in case studies and field experiments.
SURVEYSSurvey development consists of the followingmajor tasks (GAO, 1986, p. 15):1. initial planning of the questionnaire2. developing the measures3. designing the sample4. developing and testing the questionnaire5. producing the questionnaire6. preparing and distributing mailing materials7. collecting data8. reducing the data to forms that can be analyzed9. analyzing the dataFigure 3.2 shows a typical timetable for the completion of these tasks.
GUIDELINES FOR DEVELOPING QUESTIONSThe axiom that underlies the guidelines shown below is that the question-
writer(s) must be thoroughly familiar with the respondent group and mustunderstand the subject matter from the perspective of the respondent group.
Surveys and Focus Groups 103

This is often problematic for the employee when the respondent group is thecustomer; methods for dealing with this situation are discussed below. Thereare eight basic guidelines for writing good questions:1. Ask questions in a format that is appropriate to the questions’ purpose
and the information required.2. Make sure the questions are relevant, proper, and quali¢ed as needed.3. Write clear, concise questions at the respondent’s language level.4. Give the respondent a chance to answer by providing a comprehensive
list of relevant, mutually exclusive responses from which to choose.5. Ask unbiased questions by using appropriate formats and item construc-
tions and by presenting all important factors in the proper sequence.6. Get unbiased answers by anticipating and accounting for various
respondent tendencies.7. Quantify the response measures where possible.8. Provide a logical and unbiased line of inquiry to keep the reader’s
attention and make the response task easier.The above guidelines apply to the form of the question. Using the critical
incident technique to develop good question content is described below.
104 CREATING CUSTOMER-DRIVEN ORGANIZATIONS
Figure 3.2. Typical completion times for major questionnaire tasks.FromDeveloping and Using Questionnaires, Transfer Paper 7, p. 15, Washington, DC:
GAO Program Evaluation and Methodology Division.

RESPONSE TYPESThere are several commonly used types of survey responses.
. Open-ended questionsLThese are questions that allow therespondents to frame their own response without any restrictionsplaced on the response. The primary advantage is that such ques-tions are easy to form and ask using natural language, even if thequestion writer has little knowledge of the subject matter.Unfortunately, there are many problems with analyzing theanswers received to this type of question. This type of question ismost useful in determining the scope and content of the survey,not in producing results for analysis or process improvement.
. Fill-in-the-blank questionsLHere the respondent is provided withdirections that specify the units in which the respondent is to answer.The instructions should be explicit and should specify the answer units.This type of question should be reserved for very speci¢c requests, e.g.,‘‘What is your age on your last birthday?_____________ (age in years).’’
. Yes/No questionsLUnfortunately, yes/no questions are very popular.Although they have some advantages, they have many problems and fewuses. Yes/no questions are ideal for dichotomous variables, such as defec-tive or not defective. However, too often this format is used when themea-sure spans a range of values and conditions, e.g., ‘‘Were you satis¢ed withthe quality of your new car (yes/no)?’’ A yes/no response to such ques-tions contains little useful information.
. Ranking questionsLThe ranking format is used to rank options accord-ing to some criterion, e.g., importance. Ranking formats are di⁄cult towrite and di⁄cult to answer. They give very little real information andare very prone to errors that can invalidate all the responses. They shouldbe avoided whenever possible in favor of more powerful formats and for-mats less prone to error, such as rating.When used, the number of rankingcategories should not exceed ¢ve.
. Rating questionsLWith this type of response, a rating is assigned on thebasis of the score’s absolute position within a range of possible values.Rating scales are easy to write, easy to answer, and provide a level of quan-ti¢cation that is adequate formost purposes. They tend to produce reason-ably valid measures. Here is an example of a rating format:
For the following statement, check the appropriate box:The workmanship standards provided by the purchaser are
& Clear& Marginally adequate& Unclear
Surveys and Focus Groups 105

. Guttman formatLIn the Guttman format, the alternatives increase incomprehensiveness; that is, the higher-valued alternatives include thelower-valued alternatives. For example,
Regarding the benefit received from training in quality improvement:& No bene¢t identi¢ed& Identi¢ed bene¢t& Measured bene¢t& Assessed bene¢t value in dollar terms& Performed cost/bene¢t analysis
. Likert and other intensity scale formatsLThese formats are usuallyused to measure the strength of an attitude or an opinion. For example,
Please check the appropriate box in response to the following statement:‘‘The customer service representative was knowledgeable.’’
& Strongly disagree& Disagree& Neutral& Agree& Strongly agree
Intensity scales are very easy to construct. They are best used whenrespondents can agree or disagree with a statement. A problem is thatstatements must be worded to present a single side of an argument. Weknow that the respondent agrees, but we must infer what he believes. Tocompensate for the natural tendency of people to agree, statements areusually presented using the converse as well, e.g., ‘‘The customer servicerepresentative was not knowledgeable.’’When using intensity scales, use an odd-numbered scale, preferably
with ¢ve or seven categories. If there is a possibility of bias, order thescale in a way that favors the hypothesis you want to disprove and handi-caps the hypothesis you want to con¢rm. This way you will con¢rm thehypothesis with the bias against youLa stronger result. If there is nobias, put the most undesirable choices ¢rst.
. Semantic di¡erential formatLIn this format, the values that span therange of possible choices are not completely identi¢ed; only the endpoints are labeled. For example,
Indicate the number of times you initiated communication with your custo-mer in the past month.
few & & & & & & & many
106 CREATING CUSTOMER-DRIVEN ORGANIZATIONS

The respondentmust infer that the range is divided into equal intervals.The range seems to work well with seven categories.Semantic di¡erentials are veryusefulwhenwedonothave enough infor-
mation to anchor the intervals between the poles. However, they are verydi⁄cult to write well and if not writtenwell the results are ambiguous.
SURVEY DEVELOPMENT CASE STUDY*
This actual case study involves the development of a mail survey at a commu-nity hospital. The same process has been successfully used by the author to developcustomer surveys for clientele in a variety of industries.
The study of service quality and patient satisfaction was performed at a 213 bedcommunity hospital in the southwestern United States. The hospital is a non-pro¢t, publicly funded institution providing services to the adult community;pediatric services are not provided. The purpose of the study was to:
1. Identify the determinants of patient quality judgments.2. Identify internal service delivery processes that impacted patient quality
judgments.3. Determine the linkage between patient quality judgments and intent-to-
patronize the hospital in the future or to recommend the hospital toothers.
To conduct the study, the author worked closely with a core team of hospitalemployees, and with several ad hoc teams of hospital employees. The core teamincluded the Nursing Administrator, the head of the Quality ManagementDepartment, and the head of Nutrition Services.**
The team decided to develop their criteria independently. It was agreed thatthe best method of getting information was directly from the target group, in-patients. Due to the nature of hospital care services, focus groups were notdeemed feasible for this study. Frequently, patients must spend a considerableperiod of time convalescing after being released from a hospital, making itimpossible for them to participate in a focus group soon after discharge. Whilethe patients are in the hospital, they are usually too sick to participate. Somepatients have communicable diseases, which makes their participation in focusgroups inadvisable.
Since memories of events tend to fade quickly (Flanagan, 1954, p. 331), the teamdecided that patients should be interviewed within 72 hours of discharge. The
Surveys and Focus Groups 107
*The survey referenced by this case study is located in the Appendix.**The nutrition services manager was very concerned that she get sufficient detail on her particular service. Thus, the criticalincident interview instrument she used included special questions relating to food service.

target patient population was, therefore, all adults treated as in-patients and dis-charged to their homes. The following groups were not part of the study: familiesof patients who died while in the hospital, patients discharged to nursing homes,patients admitted for psychiatric care.*
The team used the Critical Incident Technique (CIT) to obtain patient com-ments. The CIT was ¢rst used to study procedures for selection and classi¢cationof pilot candidates in World War II (Flanagan, 1954). A bibliography assembledin 1980 listed over seven hundred studies about or using the CIT (Fivars, 1980).Given its popularity, it is not surprising that the CIT has also been used to evaluateservice quality.
CIT consists of a set of speci¢cally de¢ned procedures for collecting observa-tions of human behavior in such a way as to make them useful in addressing practi-cal problems. Its strength lies in carefully structured data collection and dataclassi¢cation procedures that produce detailed information not available throughother research methods. The technique, using either direct observation or recalledinformation collected via interviews, enables researchers to gather ¢rsthandpatient-perspective information. This kind of self-report preserves the richness ofdetail and the authenticity of personal experience of those closest to the activitybeing studied. Researchers have concluded that the CIT produces informationthat is both reliable and valid.
This study attempted to follow closely the ¢ve steps described by Flanagan ascrucial to the CIT: 1) establishment of the general aim of the activity studied;2) development of a plan for observers or interviewers; 3) collection of data; 4) ana-lysis (classi¢cation) of data; and 5) interpretation of data.
Establishment of the general aim of the activity studiedThe general aim is the purpose of the activity. In this case the activity
involves the whole range of services provided to in-patients in the hospital.This includes every service activity between admission and discharge.** Fromthe service provider’s perspective the general aim is to create and manage servicedelivery processes in such a way as to produce a willingness by the patient toutilize the provider’s services in the future. To do this the service providermust know which particular aspects of the service are remembered by thepatient.
Our general aim was to provide the service provider with information on whatpatients remembered about their hospital stay, both pleasant and unpleasant.This information was to be used to construct a new patient survey instrument
108 CREATING CUSTOMER-DRIVEN ORGANIZATIONS
*The team was unable to obtain a Spanish-speaking interviewer, which meant that some patients that were candidates werenot able to participate in the survey.**Billing was not covered in the CIT phase of the study because patients had not received their bills within 72 hours.

that would be sent to recently discharged patients on a periodic basis. The informa-tion obtained would be used by the managers of the various service processes asfeedback on their performance, from the patient’s perspective.
Interview planInterviewers were provided with a list of patients discharged within the past 3
days. The discharge list included all patients. Non-psychiatric patients whowere discharged to ‘‘home’’ were candidates for the interview. Home was de¢nedas any location other than the morgue or a nursing home. Interviewers wereinstructed to read a set of predetermined statements. Patients to be called wereselected at random from the discharge list. If a patient could not be reached,the interviewer would try again later in the day. One interview form was pre-pared per patient. To avoid bias, 50% of the interview forms asked the patientto recall unpleasant incidents ¢rst and 50% asked for pleasant incidents ¢rst.Interviewers were instructed to record the patient responses using the patient’sown words.
Collection of dataFour interviewers participated in the data collection activity, all were manage-
ment level employees of the hospital. Three of the interviewers were female, onewas male. The interviews were conducted when time permitted during the inter-viewer’s normal busy work day. The interviews took place during the September1993 time period. Interviewers were given the instructions recommended byHayes (1992, pp. 14^15) for generating critical incidents.
A total of 36 telephone attempts were made and 23 patients were reached. Ofthose reached, three spoke only Spanish. In the case of one of the Spanish-speakingpatients a family member was interviewed. Thus, 21 interviews were conducted,which is slightly greater than the 10 to 20 interviews recommended by Hayes(1992, p. 14). The 21 interviews produced 93 critical incidents.
Classi¢cation of dataThe Incident Classi¢cation System required by CIT is a rigorous, carefully
designed procedure with the end goal being to make the data useful to the problemat hand while sacri¢cing as little detail as possible (Flanagan, 1954, p. 344). Thereare three issues in doing so: 1) identi¢cation of a general framework of referencethat will account for all incidents; 2) inductive development of major area and sub-area categories that will be useful in sorting the incidents; and 3) selection of themost appropriate level of speci¢city for reporting the data.
The critical incidents were classi¢ed as follows:1. Each critical incident was written on a 3�5 card, using the patient’s own
words.
Surveys and Focus Groups 109

2. The cards were thoroughly shu¥ed.3. Ten percent of the cards (10 cards) were selected at random, removed from
the deck and set aside.4. Two of the four teammembers left the roomwhile the other two grouped the
remaining 83 cards and named the categories.5. The ten cards originally set aside were placed into the categories found in
step 4.6. Finally, the two members not involved in the initial classi¢cation were told
the names of the categories. They then took the reshu¥ed 93 cards andplaced them into the previously determined categories.
The above process produced the following dimensions of critical incidents:. Accommodations (5 critical incidents). Quality of physician (14 critical incidents). Care provided by sta¡ (20 critical incidents). Food (26 critical incidents). Discharge process (1 critical incident). Attitude of sta¡ (16 critical incidents). General (11 critical incidents)
Interpretation of dataInterjudge agreement, the percentage of critical incidents placed in the same
category by both groups of judges, was 93.5%. This is well above the 80% cuto¡value recommended by experts. The setting aside of a random sample and tryingto place them in established categories is designed to test the comprehensivenessof the categories. If any of the withheld items were not classi¢able it would be anindication that the categories do not adequately span the patient satisfactionspace. However, the team experienced no problem in placing the withheld criticalincidents into the categories.
Ideally, a critical incident has two characteristics: 1) it is speci¢c and 2) itdescribes the service provider in behavioral terms or the service product with speci-¢c adjectives (Hayes, 1992, p. 13). Upon reviewing the critical incidents in theGeneral category, the team determined that these items failed to have one or bothof these characteristics. Thus, the 11 critical incidents in the General categorywere dropped. The team also decided to merge the two categories ‘‘Care providedby sta¡’’ and ‘‘Attitude of sta¡’’ into the single category ‘‘Quality of sta¡ care.’’Thus, the ¢nal result was a ¢ve dimensionmodel of patient satisfaction judgments:Food, Quality of physician, Quality of sta¡ care, Accommodations, andDischarge process.
A rather obvious omission in the above list is billing. This occurred because thepatients had not yet received their bill within the 72 hour time frame. However,the patient’s bill was explained to the patient prior to discharge. This item is
110 CREATING CUSTOMER-DRIVEN ORGANIZATIONS
included in the Discharge process dimension. The team discussed the billing issueand it was determined that billing complaints do arise after the bills are sent, sug-gesting that billing probably is a satisfaction dimension. However, the teamdecided not to include billing as a survey dimension because 1) the time lag was solong that waiting until bills had been received would signi¢cantly reduce the abil-ity of the patient to recall the details of their stay; 2) fear that the patient’s judg-ments would be overwhelmed by the recent receipt of the bill; and 3) a systemalready existed for identifying patient billing issues and adjusting the billingprocess accordingly.
Survey item developmentAs stated earlier, the general aim was to provide the service provider with
information on what patients remembered about their hospital stay, both plea-sant and unpleasant. This information was then to be used to construct a newpatient survey instrument that would be sent to recently discharged patients ona periodic basis. The information obtained would be used by the managers ofthe various service processes as feedback on their performance, from thepatient’s perspective.
The core team believed that accomplishing these goals required that the man-agers of key service processes be actively involved in the creation of the surveyinstrument. Thus, ad hoc teams were formed to develop survey items for each ofthe dimensions determined by the critical incident study. The teams were givenbrief instruction by the author in the characteristics of good survey items. Teamswere required to develop items that, in the opinion of the core team, met ¢ve cri-teria: 1) relevance to the dimension being measured; 2) concise; 3) unambiguous;4) one thought per item; and 5) no double negatives. Teams were also shown thespeci¢c patient comments that were used as the basis for the categories andinformed that these comments could be used as the basis for developing surveyitems.
Writing items for the questionnaire can be di⁄cult. The process of developingthe survey items involved an average of three meetings per dimension, with eachmeeting lasting approximately two hours. Ad hoc teams ranged in size from fourto eleven members. The process was often quite tedious, with considerable debateover the precise wording of each item.
The core team discussed the scale to be used with each ad hoc team. The coreteam’s recommended response format was a ¢ve point Likert-type scale. The con-sensus was to use a ¢ve point agree-disagree continuum as the response format.Item wording was done in such a way that agreement represented better perfor-mance from the hospital’s perspective.
In addition to the response items, it was felt that patients should have anopportunity to respond to open-ended questions. Thus, the survey also included
Surveys and Focus Groups 111

general questions that invited patients to comment in their own words. The bene-¢ts of having such questions is well known. In addition, it was felt that these ques-tions might generate additional critical incidents that would be useful invalidating the survey.
The resulting survey instrument contained 50 items and three open-ended ques-tions and is included in the Appendix.
Survey administration and pilot studyThe survey was to be tested on a small sample. It was decided to use the total
design method (TDM) to administer the survey (Dillman, 1983). Although thetotal design method is exacting and tedious, Dillman indicated that its use wouldassure a high rate of response. Survey administration would be handled by theNursing Department.
TDM involves rather onerous administrative processing. Each survey form isaccompanied by a cover letter, which must be hand-signed in blue ink. Follow upmailings are done 1, 3 and 7 weeks after the initial mailing. The 3 and 7 week followups are accompanied by another survey and another cover letter. No ‘‘bulk proces-sing’’ is allowed, such as the use of computer-generated letters or mailing labels.Dillman’s research emphasizes the importance of viewing the TDM as a comple-tely integrated approach (Dillman, 1983, p. 361).
Because the hospital in the study is small, the author was interested in obtainingmaximum response rates. In addition to following the TDM guidelines, he recom-mended that a $1 incentive be included with each survey. However, the hospitaladministrator was not convinced that the additional $1 per survey was worthwhile.It was ¢nally agreed that to test the e¡ect of the incentive on the return rate $1would be included in 50% of the mailings, randomly selected.
The hospital decided to perform a pilot study of 100 patients. The patientsselected were the ¢rst 100 patients discharged to home starting April 1, 1994. Thereturn information is shown in Table 3.2.
Although the overall return rate of 49% is excellent for normal mail-surveyprocedures, it is substantially below the 77% average and the 60% ‘‘minimum’’reported by Dillman. As possible explanations, the author conjectures thatthere may be a large Spanish-speaking constituency for this hospital. As men-tioned above, the hospital is planning a Spanish version of the survey for thefuture.
The survey respondent demographics were analyzed and compared to thedemographics of the non-respondents to assure that the sample group was repre-sentative. A sophisticated statistical analysis was performed on the responses toevaluate the reliability and validity of each item. Items with low reliability coe⁄-cients or questionable validity were reworded or dropped.
112 CREATING CUSTOMER-DRIVEN ORGANIZATIONS
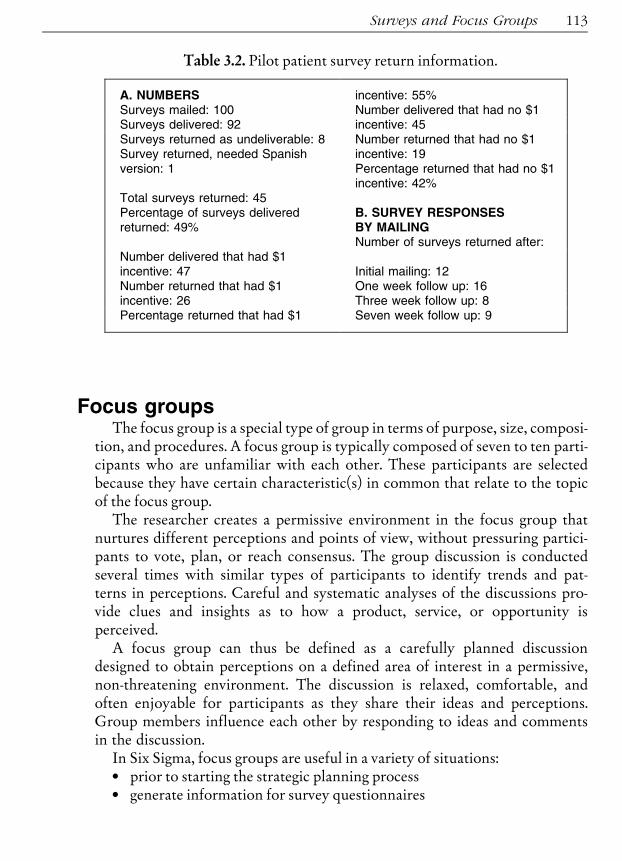
Focus groupsThe focus group is a special type of group in terms of purpose, size, composi-
tion, and procedures. A focus group is typically composed of seven to ten parti-cipants who are unfamiliar with each other. These participants are selectedbecause they have certain characteristic(s) in common that relate to the topicof the focus group.The researcher creates a permissive environment in the focus group that
nurtures different perceptions and points of view, without pressuring partici-pants to vote, plan, or reach consensus. The group discussion is conductedseveral times with similar types of participants to identify trends and pat-terns in perceptions. Careful and systematic analyses of the discussions pro-vide clues and insights as to how a product, service, or opportunity isperceived.A focus group can thus be defined as a carefully planned discussion
designed to obtain perceptions on a defined area of interest in a permissive,non-threatening environment. The discussion is relaxed, comfortable, andoften enjoyable for participants as they share their ideas and perceptions.Group members influence each other by responding to ideas and commentsin the discussion.In Six Sigma, focus groups are useful in a variety of situations:. prior to starting the strategic planning process. generate information for survey questionnaires
Surveys and Focus Groups 113
Table 3.2. Pilot patient survey return information.
A. NUMBERS incentive: 55%Surveys mailed: 100 Number delivered that had no $1Surveys delivered: 92 incentive: 45Surveys returned as undeliverable: 8 Number returned that had no $1Survey returned, needed Spanishversion: 1
incentive: 19Percentage returned that had no $1incentive: 42%
Total surveys returned: 45Percentage of surveys deliveredreturned: 49%
B. SURVEY RESPONSESBY MAILINGNumber of surveys returned after:
Number delivered that had $1incentive: 47 Initial mailing: 12Number returned that had $1 One week follow up: 16incentive: 26 Three week follow up: 8Percentage returned that had $1 Seven week follow up: 9

. needs assessment, e.g., training needs
. test new program ideas
. determine customer decision criteria
. recruit new customers
FOCUS GROUP ADVANTAGESThe focus group is a socially oriented research procedure. The advantage of
this approach is that members stimulate one another, which may produce agreater number of comments than would individual interviews. If necessary,the researcher can probe for additional information or clarification. Focusgroups produce results that have high face validity, i.e., the results are in the par-ticipant’s own words rather than in statistical jargon. The information isobtained at a relatively low cost, and can be obtained very quickly.
FOCUS GROUP DISADVANTAGESThere is less control in a group setting than with individual interviews. When
group members interact, it is often difficult to analyze the resulting dialogue.The quality of focus group research is highly dependent on the qualificationsof the interviewer. Trained and skilled interviewers are hard to find. Group-to-group variation can be considerable, further complicating the analysis. Finally,focus groups are often difficult to schedule.
Other customer information systems. Complaint and suggestion systems typically provide all customers with aneasy-to-use method of providing favorable or unfavorable feedback tomanagement. Due to selection bias, these methods do not provide statisti-cally valid information. However, because they are a census rather than asample, they provide opportunities for individual customers to havetheir say. These are moments of truth that can be used to increase cus-tomer loyalty. They also provide anecdotes that have high face validityand are often a source of ideas for improvement.
. Customer panels are composed of a representative group of customerswho agree to communicate their attitudes periodically via phone calls ormail questionnaires. These panels are more representative of the range ofcustomer attitudes than customer complaint and suggestion systems. Tobe e¡ective, the identity of customers on the panel must be withheldfrom the employees serving them.
114 CREATING CUSTOMER-DRIVEN ORGANIZATIONS

. Mystery shoppers are employees who interact with the system as do realcustomers.Theidentityofthemysteryshopperiswithheldfromemployees.
Once customer feedback has been obtained, it must be used to improve pro-cess and product quality. A system for utilizing customer feedback is shown inFigure 3.3.1. Local managers and employees serve customers’ needs on a daily basis,
using locally modi¢ed procedures along with general corporate policiesand procedures.
2. By means of a standardized and locally sensitive questionnaire, deter-mine the needs and attitudes of customers on a regular basis.
3. Comparing ¢nancial data, expectations, and past attitude information,determine strengths and weaknesses and their probable causes.
4. Determine where and how e¡ort should be applied to correct weak-nesses and preserve strengths. Repeat the process by taking actionLstep 1Land maintain it to attain a steady state or to evolve in terms ofcustomer changes.
Surveys and Focus Groups 115
Figure 3.3. System for utilizing customer feedback.From Daltas, A.J. (1977). ‘‘Protecting service markets with consumer feedback,’’
Cornell Hotel and Restaurant Administration Quarterly, May, pp. 73^77.
5. A similar process can take place at higher levels, using aggregated datafrom the ¢eld and existing policy £ows of the organization.
Although this system was developed by marketing specialists, note that itincorporates a variation of the classical Shewhart quality improvement PDCA(Plan-Do-Check-Act) cycle (see Chapter 7).
CALCULATING THE VALUE OF RETENTION OFCUSTOMERS
Customers have value. This simple fact is obvious when one looks at acustomer making a single purchase. The transaction provides revenue andprofit to the firm. However, when the customer places a demand on thefirm, such as a return of a previous purchase or a call for technical support,there is a natural tendency to see this as a loss. At these times it is impor-tant to understand that customer value must not be viewed on a short-term transaction-by-transaction basis. Customer value must be measuredover the lifetime of the relationship. One method of calculating the lifetimevalue of a loyal customer, based on work by Frederick Reichheld of Bainand Co. and the University of Michigan’s Claes Fornell, is as follows(Stewart, 1995):1. Decide on ameaningful period of time over which to do the calculations.
This will vary depending on your planning cycles and your business: Alife insurer should track customers for decades, a disposable diapermaker for just a few years, for example.
2. Calculate the pro¢t (net cash £ow) customers generate each year.Track several samplesLsome newcomers, some old-timersLto ¢ndout how much business they gave you each year, and how much itcost to serve them. If possible, segment them by age, income, saleschannel, and so on. For the ¢rst year, be sure to subtract the cost ofacquiring the pool of customers, such as advertising, commissions,back-o⁄ce costs of setting up a new account. Get speci¢c numbersLpro¢t per customer in year one, year two, etc.Lnot averages for allcustomers or all years. Long-term customers tend to buy more, paymore (newcomers are often lured by discounts), and create less baddebt.
3. Chart the customer ‘‘life expectancy,’’ using the samples to ¢nd out howmuch your customer base erodes each year. Again, speci¢c ¢gures arebetter than an average like ‘‘10% a year’’; old customers are much lesslikely to leave than freshmen. In retail banking, 26% of account holdersdefect in the ¢rst year; in the ninth year, the rate drops to 9%.
116 CREATING CUSTOMER-DRIVEN ORGANIZATIONS

4. Once you know the pro¢t per customer per year and the customer-retention ¢gures, it’s simple to calculate net present value (NPV).Pick a discount rateLif you want a 15% annual return on assets, usethat. In year one, the NPV will be pro¢t 1.15. Next year, NPV =(year-two pro¢t � retention rate) (1.15)2. In year n, the last year inyour ¢gures, the NPV is the n year’s adjusted pro¢t (1.15)n. Thesum of the years one through n is how much your customer isworthLthe net present value of all the pro¢ts you can expect fromhis tenure.
This is very valuable information. It can be used to find out how much tospend to attract new customers, and which ones. Better still, you can exploitthe leverage customer satisfaction offers. Take your figures and calculate howmuch more customers would be worth if you increased retention by 5%.Figure 3.4 shows the increase in customer NPV for a 5% increase in retentionfor three industries.Once the lifetime value of the customer is known, it forms the basis of loy-
alty-based managementSM of the customer relationship. According toReichheld (1996), loyalty-based management is the practice of carefully select-ing customers, employees, and investors, and then working hard to retainthem. There is a tight, cause-and-effect connection between investor, employeeand customer loyalty. These are the human assets of the firm.
Calculating the Value of Retention of Customers 117
Figure 3.4. Increase in customer NPV for a 5% increase in customer retention.
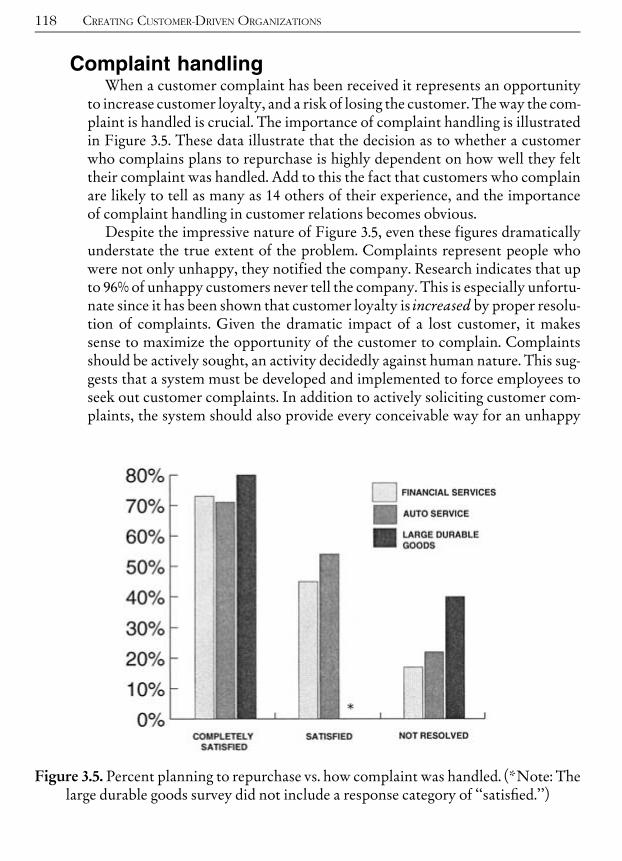
Complaint handlingWhen a customer complaint has been received it represents an opportunity
to increase customer loyalty, and a risk of losing the customer. Theway the com-plaint is handled is crucial. The importance of complaint handling is illustratedin Figure 3.5. These data illustrate that the decision as to whether a customerwho complains plans to repurchase is highly dependent on how well they felttheir complaint was handled. Add to this the fact that customers who complainare likely to tell as many as 14 others of their experience, and the importanceof complaint handling in customer relations becomes obvious.Despite the impressive nature of Figure 3.5, even these figures dramatically
understate the true extent of the problem. Complaints represent people whowere not only unhappy, they notified the company. Research indicates that upto 96% of unhappy customers never tell the company. This is especially unfortu-nate since it has been shown that customer loyalty is increased by proper resolu-tion of complaints. Given the dramatic impact of a lost customer, it makessense to maximize the opportunity of the customer to complain. Complaintsshould be actively sought, an activity decidedly against human nature. This sug-gests that a system must be developed and implemented to force employees toseek out customer complaints. In addition to actively soliciting customer com-plaints, the system should also provide every conceivable way for an unhappy
118 CREATING CUSTOMER-DRIVEN ORGANIZATIONS
Figure 3.5. Percent planning to repurchase vs. how complaint was handled. (*Note: Thelarge durable goods survey did not include a response category of ‘‘satis¢ed.’’)

customer to contact the company on their own, including toll-free hotlines,email, comment cards, etc.
KANO MODEL OF CUSTOMER EXPECTATIONSCustomer expectations, priorities, needs, and‘‘voice’’
Although customers seldom spark true innovation (for example, they areusually unaware of state-of-the art developments), their input is extremely valu-able. Obtaining valid customer input is a science itself. Market research firmsuse scientific methods such as critical incident analysis, focus groups, contentanalysis and surveys to identify the ‘‘voice of the customer.’’ Noritaki Kanodeveloped the following model of the relationship between customer satisfac-tion and quality (Figure 3.6).The Kano model shows that there is a basic level of quality that customers
assume the product will have. For example, all automobiles have windows andtires. If asked, customers don’t even mention the basic quality items, they takethem for granted. However, if this quality level isn’t met the customer will bedissatisfied; note that the entire ‘‘Basic Quality’’ curve lies in the lower half ofthe chart, representing dissatisfaction. However, providing basic quality isn’tenough to create a satisfied customer.
Kano Model of Customer Expectations 119
Figure 3.6. Kano model.
The ‘‘ExpectedQuality’’ line represents those expectations which customersexplicitly consider. For example, the length of time spent waiting in line at acheckout counter. The model shows that customers will be dissatisfied if theirquality expectations are not met; satisfaction increases as more expectationsare met.The ‘‘Exciting Quality’’ curve lies entirely in the satisfaction region. This is
the effect of innovation. Exciting quality represents unexpected quality items.The customer receives more than they expected. For example, Cadillac pio-neered a system where the headlights stay on long enough for the owner towalk safely to the door. When first introduced, the feature excited people.Competitive pressure will constantly raise customer expectations. Today’s
exciting quality is tomorrow’s basic quality. Firms that seek to lead the mar-ket must innovate constantly. Conversely, firms that seek to offer standardquality must constantly research customer expectations to determine thecurrently accepted quality levels. It is not enough to track competitors sinceexpectations are influenced by outside factors as well. For example, thequality revolution in manufacturing has raised expectations for service qualityas well.
Garden variety Six Sigma only addresses half ofthe Kano customer satisfaction model
Some people, including your author, believe that even Six Sigma doesn’t gofar enough. In fact, even ‘‘zero defects’’ falls short. Defining quality as only thelack of non-conforming product reflects a limited view of quality. Motorola, ofcourse, never intended to define quality as merely the absence of defects.However, some have misinterpreted the Six Sigma program in this way.One problem with ‘‘garden variety’’ Six Sigma is that it addresses only half
of the Kano model. By focusing on customer expectations and prevention ofnon-conformances and defects, Six Sigma addresses the portion of the Kanomodel on and below the line labeled ‘‘Expected Quality.’’ While there is noth-ing wrong with improving these aspects of business performance, it will notassure that the organization remains viable in the long term. Long-term suc-cess requires that the organization innovate. Innovation is the result of crea-tive activity, not analysis. Creativity is not something that can be done ‘‘bythe numbers.’’ In fact, excessive attention to a rigorous process such as SixSigma can detract from creative activities if not handled carefully. As dis-cussed above, the creative organization is one which exhibits variability,redundancy, quirky design, and slack. It is vital that the organization keepthis Paradox in mind.
120 CREATING CUSTOMER-DRIVEN ORGANIZATIONS

QUALITY FUNCTION DEPLOYMENT (QFD)Once information about customer expectations has been obtained, tech-
niques such as quality function deployment (QFD) can be used to link thevoice of the customer directly to internal processes.Tactical quality planning involves developing an approach to implementing
the strategic quality plan. One of the most promising developments in thisarea has been policy deployment. Sheridan (1993) describes policy deploymentas the development of a measurement-based system as a means of planning forcontinuous quality improvement throughout all levels of an organization.Originally developed by the Japanese, American companies also use policydeployment because it clearly defines the long-range direction of companydevelopment, as opposed to short-term.QFD is a customer-driven process for planning products and services. It
starts with the voice of the customer, which becomes the basis for settingrequirements. QFD matrices, sometimes called ‘‘the house of quality,’’ aregraphical displays of the result of the planning process. QFD matricesvary a great deal and may show such things as competitive targets andprocess priorities. The matrices are created by interdepartmental teams,thus overcoming some of the barriers which exist in functionally organizedsystems.QFD is also a system for design of a product or service based on customer
demands, a system that moves methodically from customer requirements tospecifications for the product or service. QFD involves the entire company inthe design and control activity. Finally, QFD provides documentation for thedecision-making process. The QFD approach involves four distinct phases(King, 1987):Organization phaseLManagement selects the product or service to be
improved, the appropriate interdepartmental team, and de¢nes the focusof the QFD study.
Descriptive phaseLThe team de¢nes the product or service from several dif-ferent directions such as customer demands, functions, parts, reliability,cost, and so on.
Breakthrough phaseLThe team selects areas for improvement and ¢ndsways to make them better through new technology, new concepts, bet-ter reliability, cost reduction, etc., and monitors the bottleneck process.
Implementation phaseLThe team de¢nes the new product and how it will bemanufactured.
QFD is implemented through the development of a series of matrices. In itssimplest form QFD involves a matrix that presents customer requirements asrows and product or service features as columns. The cell, where the row and
Quality Function Deployment (QFD) 121

column intersect, shows the correlation between the individual customerrequirement and the product or service requirement. This matrix is sometimescalled the ‘‘requirement matrix.’’ When the requirement matrix is enhanced byshowing the correlation of the columns with one another, the result is calledthe ‘‘house of quality.’’ Figure 3.7 shows one commonly used house of qualitylayout.The house of quality relates, in a simple graphical format, customer require-
ments, product characteristics, and competitive analysis. It is crucial that thismatrix be developed carefully since it becomes the basis of the entire QFD pro-cess. By using the QFD approach, the customer’s demands are ‘‘deployed’’ tothe final process and product requirements.One rendition of QFD, called theMacabe approach, proceeds by developing
a series of four related matrices (King, 1987): product planning matrix, partdeployment matrix, process planning matrix, and production planning matrix.Each matrix is related to the previous matrix as shown in Figure 3.8.Figure 3.9 shows an example of an actual QFDmatrix.
122 CREATING CUSTOMER-DRIVEN ORGANIZATIONS
Figure 3.7. The house of quality.

Data collection and review of customerexpectations, needs, requirements, andspecifications
Another approach to QFD is based on work done by Yoji Akao. Akao (1990,pp. 7^8) presents the following 11-step plan for developing the quality planand quality design, using QFD.
1. First, survey both the expressed and latent quality demands of consu-mers in your target marketplace. Then decide what kinds of ‘‘things’’to make.
2. Study the other important characteristics of your target market andmake a demanded quality function deployment chart that re£ectsboth the demands and characteristics of that market.
3. Conduct an analysis of competing products on the market, which wecall a competitive analysis. Develop a quality plan and determine theselling features (sales points).
Quality Function Deployment (QFD) 123
Figure 3.8. QFDmethodology: Macabe approach.

124 CREATING CUSTOMER-DRIVEN ORGANIZATIONS
Figure 3.9. QFDmatrix for an aerospace ¢rm.FromWahl, P.R. and Bersbach, P.L. (1991), ‘‘TQMAppliedLCradle to Grave,’’
ASQ 45th Quality Congress Transactions. Reprinted with permission.

4. Determine the degree of importance of each demanded quality.5. List the quality elements and make a quality elements deployment
chart.6. Make a quality chart by combining the demanded quality deployment
chart and the quality elements deployment chart.7. Conduct an analysis of competing products to see how other compa-
nies perform in relation to each of these quality elements.8. Analyze customer complaints.9. Determine the most important quality elements as indicated by custo-
mer quality demands and complaints.10. Determine the speci¢c design quality by studying the quality character-
istics and converting them into quality elements.11. Determine the quality assurance method and the test methods.
THE SIX SIGMA PROCESS ENTERPRISEI am often asked ‘‘Will Six Sigma work for. . .’’ where the blank is ‘‘health
care,’’ ‘‘oil exploration,’’ ‘‘custom-built homes,’’ etc. The list is unending. Mytypical response is that, if a process is involved, Six Sigma may be able to helpyou improve it. Personally, I don’t believe that everything will benefit from theapplication of Six Sigma rigor. There are some things that aren’t processes,such as pure creativity, love and unstructured play. I don’t believe a chess grand-master would benefit from the advice of a Black Belt applying DMAIC to hismoves, nor would his equivalent in the R&D area. There are other things thatare processes, but processes so poorly understood that we don’t know enoughabout them to use the Six Sigma approach to improve them, such as pureresearch, social relationships, criminal behavior, or curing substance abuse.However, the vast majority of processes encountered in business, non-profitorganizations, and government services fall into the category of processes thatcan be improved by the application of Six Sigma methods.But what exactly is a ‘‘process’’? There is a tendency to narrowly interpret the
term process to refer to a manufacturing operation that converts raw materialsinto finished products. That’s true, of course. But as I use the term processthroughout this book it has amuch broadermeaning. In this book process refersto any activity or set of activities that transform inputs to create values for stake-holders. The inputs can be labor, expertise, raw materials, products, transac-tions, or services that someone is willing to pay more for than they cost tocreate. In other words, the process adds value to the inputs. Said another way,the process is the act of creating value. The value can be a cured disease, a tastybanana split, a great movie, a successfully completed credit card transaction,or a cold soda purchased at a convenience store.
The Six Sigma Process Enterprise 125

Reengineering, the process redesign fad so popular in the early 1990s, hasbecome associated in the minds of many with brutal downsizing. Many aca-demics condemned it as heartless and cold. But the problem wasn’t causedby reengineering. Reengineering (and Six Sigma) focus attention on brokenand inefficient processes. The truth is, this focus enabled companies to oper-ate faster and more efficiently and to use information technology more pro-ductively. It gave employees more authority and a clearer view of how theirwork fit into the broader scheme of things. Customers benefited from lowerprices, higher quality and better services, and investors enjoyed a higher rateof return. And, more germane to our discussion of processes, reengineeringtaught business leaders to see their organizations not as control structures,but as processes that deliver value to customers in a way that creates profitsfor shareholders.
Examples of processesMany business leaders think of their organizations as extremely complex.
From a process perspective, this is seldom the case, at least at the high levels.For example, Texas Instruments was able to break its $4 billion semiconductorbusiness into six core processes:1. Strategy development.2. Product development.3. Customer design and support.4. Manufacturing capability development.5. Customer communication.6. Order ful¢llment.A large financial software company described its four core processes in plain
English as:1. Provide good products at good prices.2. Acquire customers and maintain good relations with them.3. Make it easy to buy from us.4. Provide excellent service and support after the sale.Both of these companies have thousands of employees and generate billions
of dollars in sales. Yet what they do for customers is really very simple. Oncethe basic (core) processes have been identified, the relationship between themshould be determined and drawn on a process map. (Process mapping is dis-cussed in greater detail in Part II of this handbook.) The process map presentsemployees with a simple picture that illustrates how the enterprise serves itscustomers. It is the basis for identifying subprocesses and, eventually, SixSigma projects. Table 3.3 gives some examples of high-level processes and sub-processes.
126 CREATING CUSTOMER-DRIVEN ORGANIZATIONS

The truth is, it’s the organizational structure that’s complicated, not thebusiness itself. The belief that the business is complicated results from a mis-placed internal perspective by its leaders and employees. In a traditionalorganization tremendous effort is wasted trying to understand what needsto be done when goals are not well defined and people don’t know howtheir work relates to the organization’s purpose. A process focus is oftenthe first real ‘‘focus’’ an employee experiences, other than pleasing one’ssuperiors.
The Six Sigma Process Enterprise 127
Table 3.3. Examples of high-level processes and subprocesses.
Core Process Subprocess
Product development .R&D.Design creation. Prototype development.Design production support
Marketing . Inspiration, concept discovery.Customer identi¢cation.Developing market strategies.Concept production support.Customer acquisition and maintenance
Product creation .Manufacturing. Procurement. Installation
Sales and service . Ful¢llment (orderc payment). Pre-sale customer support. Installation and front-line service.Usage
Meta-processes . Process excellence (Six Sigma).Voice of customer.Voice of shareholder.Voice of employee

The source of conflictManagement structures, since the time of Alfred P. Sloan in the 1920s and
1930s, are designed to divide work into discrete units with clear lines of respon-sibility and authority. While this approach produced excellent results for atime, it has inherent flaws that became quite apparent by 1980. Organizationsput leadership atop a pyramid-shaped control system designed to carry outtheir strategies. Control of the resources needed to accomplish this resided inthe vertical pillars, known as ‘‘functions’’ or ‘‘divisions.’’ This command-and-control approach is depicted in Figure 3.10.This arrangement creates ‘‘turf’’ where, much like caste systems, activities
within a given area are the exclusive domain of that area. Personnel in engineer-ing, for example, are not allowed to engage in activities reserved to the financegroup, nor is finance allowed to ‘‘meddle’’ in engineering activities. These turfsare jealously guarded. In such a structure employees look to the leadership totell them what to do and to obtain the resources needed to do it. This upward-inward focus is the antithesis of an external-customer focus. As Figure 3.10 alsoshows, customer value is created by processes that draw resources from severaldifferentparts of theorganization andendat a customer contact point. If anorga-nizationwants to be customer-focused, then itmust change the traditional struc-ture so its employees look across the organization at processes. As you mightexpect, this calls for a radical rethinking of the way the enterprise operates.As long as control of resources and turf remain entirely with the functional
units, the enterprise will remain focused inwardly. Goals will be unit-based,rather than process-based. In short, Six Sigma (or any other process-orientedinitiative) will not work. Functional department leaders have both the incentiveand the ability to thwart cross-functional process improvement efforts. Thisdoesn’t mean that these people are ‘‘bad.’’ It’s simply that their missions are
128 CREATING CUSTOMER-DRIVEN ORGANIZATIONS
Figure 3.10. Traditional command-and-control organizational structure.

defined in such a way that they are faced with a dilemma: pursue the missionassigned to my area to the best of my ability, or support an initiative thatdetracts from it but benefits the enterprise as a whole. Social scientists call this‘‘the tragedy of the commons.’’ It is in the best interest of all fishermen not tooverharvest the fishing grounds, but it is in the interest of each individual fisher-man to get all he can from this ‘‘common resource.’’ Similarly, it is in the bestinterest of the enterprise as a whole to focus on customers, but it is in each func-tional leader’s best interest to pursue his or her provincial self-interest. Afterall, if every other functional manager tries to maximize the resources devotedto their area and I don’t, I’ll lose my department’s share of the resources. Self-interest wins hands down.
A resolution to the conflictSome companiesLsuch as IBM, Texas Instruments, Owens Corning, and
DukePowerLhave successfullymade the transition fromthe traditional organi-zational structure to an alternative system called the ‘‘Process Enterprise’’(Hammer and Stanton, 1999). In these companies the primary organizationalunit is not the functional department, but the process development team. Thesecross-functional teams, like the reengineering teams of old, have full responsibil-ity for a major business process. For example, a product development teamwouldwork together in the same location to build the product development pro-cess from concept to launch. They would produce the design, documentation,trainingmaterials, advertising, etc. In a Process Enterprise authority and controlof resources is redistributed in a manner that achieves a balance of powerbetween the process-focused and structure-focused aspects of the enterprise.ThedifferencesbetweenProcessEnterprisesandtraditionalorganizationsare
fundamental. In the Process Enterprise a new position is created, that of ProcessOwner or Business Process Executive (BPE). The BPE position is permanent.BPEs are assigned from the senior-most executive body and given responsibilityfor designing and deploying the process, as well as control over all expendituresand supporting technology. They establish performance metrics, set and distri-bute budgets, and train the front-line workers who perform the process work.However, the people who perform the process work report to unit heads, notBPEs. In the Process Enterprise process goals are emphasized over unit goals.Process performance is used as a basis for compensation and advancement.
A NEW WAY TO MANAGEIn a Process Enterprise lines of authority are less well defined. BPEs and
functional unit managers are expected to work together to resolve disagree-
The Six Sigma Process Enterprise 129

ments. The BPE doesn’t exert direct control over the workers, but because hecontrols budgets and sets goals by which unit managers will be evaluated, hedoes have a good deal of influence. The unit managers have to see to it that theprocess designs are sound, the resource allocation sufficient, and the goalsclear and fair. In short, managing in a Process Enterprise places a premium oncollaboration and cooperation.One tool that has been developed to help clarify the different roles and
responsibilities is the Decision Rights Matrix (Hammer and Stanton, 1999,p. 113). This matrix specifies the roles the different managers play for eachmajor decision, such as process changes, personnel hiring, setting budgets, andso on. For example, on a given decision must a given manager:
. Make the decision?
. Be noti¢ed in advance?
. Be consulted beforehand?
. Be informed after the fact?The Decision Rights Matrix serves as a roadmap for the management team,
especially in the early stages of the transition from traditional organizationto Process Enterprise. Eventually team members will internalize the matrixrules.BPEs must also work together. Processes overlap and process handoffs are
critical. Often the same worker works with different processes. To avoid ‘‘hori-zontal turf wars’’ senior leadership needs to set enterprise goals and developcompensation and incentive systems that promote teamwork and cooperationbetween process owners.
Process excellenceThe need for interprocess cooperation highlights the fact that no process is
an island. From the customer’s perspective, it’s all one process. Overall excel-lence requires that the entire business be viewed as the customer sees it. Oneway to accomplish this is to set up a separate process with a focus of overallprocess excellence. For the sake of discussion, let’s call this ProcessExcellence (PEX). PEX will have a BPE and it will be considered anothercore business process. The mission of PEX is to see to it that all business pro-cesses accomplish the enterprise goals as they relate to customers, share-holders, and employees. PEX is also concerned with helping BPEs improvetheir processes, both internally and across the process boundaries. In otherwords, PEX is a meta-process, a process of processes. BPEs, unit managers,and Process Excellence leaders work together through Process ExcellenceLeadership Teams (PELTs) to assure that the needs of the major stakeholdergroups are met (Figure 3.11).
130 CREATING CUSTOMER-DRIVEN ORGANIZATIONS

SIX SIGMA AND THE PROCESS ENTERPRISEOnce the decision is made to become a Six Sigma Process Enterprise, the
question of how to integrate the Six Sigma infrastructure will arise. Here aremy recommendations:1. Designate Process Excellence (PEX) as one of the enterprise’s core
processes and select a BPE.2. Master Black Belts will report to PEX. The Master Black Belts will have
an enterprise-wide perspective. They will be concerned with the internalprocesses in PEX, as well as the overall value creation and deliveryproduced by the cooperative e¡orts of the core processes.
3. Black Belts will report to the BPEs, but the budget for the Black Beltscomes from Process Excellence. This gives PEX in£uence which helpsmaintain the enterprise perspective, but leaves day-to-day managementand control with the Black Belt’s customers, the BPEs.
4. BPEs have PEX goals, tied to incentives. PEX incentives are in the PEXbudget.
5. Unit managers have process-based incentives. Process incentives are inthe BPE’s budgets.
The Six Sigma Process Enterprise 131
Figure 3.11. Process Enterprise roles and responsibilities.

6. The PEX leader and BPEs should collaboratively create a DecisionRights Matrix identifying:. The roles and responsibilities of PEX, BPEs, and unit managers. Forexample, hiring, budgets, project selection.
. Who makes the decision in the areas just described?
. Who must be consulted in decision-making?
. What is the communication plan?7. PEX helps develop a BPE Coordination Plan addressing such interpro-
cess issues as:. Where do the core processes overlap?. How will cross-process Six Sigma projects be chartered and coordi-nated?
. Who will assure that overlapping activities and hando¡s are coordi-nated? (PEX plays a facilitation role here.)
. When is standardization across processes best and when isn’t it? Theprocess intersections should be invisible to customers (e.g., custo-mers shouldn’t have to provide the same information more thanonce; single form information for ordering of products, supportplans, registration, etc.). However, diversity may be necessary toserve unique customer needs.
Youmay have noticed that having Black Belts reporting to BPEs instead of toPEX seems to contradict the advice given in the first chapter where I stronglyrecommended having the Black Belts report centrally. However, there is a criti-cal difference. The traditional organizational structure was assumed inChapter 1, so if the Black Belts didn’t report to the Six Sigma organization(referred to here as PEX) they would have been reporting to the unit managers.I am not recommending that they report to unit managers, but to BPEs. BPEsare process owners, which gives them a much different perspective than theunit manager. This perspective, unlike that of unit managers, meshes very wellwith the Six Sigma focus on process improvement.
USING QFD TO LINK SIX SIGMA PROJECTS TOSTRATEGIES
A common problem with Six Sigma is that there is a cognitive disconnectbetween the Six Sigma projects and top leadership’s strategic goals. In the pre-vious chapter we discussed the development of Strategy Deployment Plans.StrategyDeployment Plans are simplemaps showing the linkage between stake-holder satisfaction, strategies, andmetrics. However, thesemaps are inadequateguides to operational personnel trying to relate their activities to the vision of
132 CREATING CUSTOMER-DRIVEN ORGANIZATIONS
their leadership. Unfortunately, more complexity is required to communicatethe strategic message throughout the organization. We will use QFD for thispurpose. An example, based on the Strategy Deployment Plan shown inChapter 2 (Figure 2.4, page 72), will illustrate the process.
The strategy deployment matrixThe first QFD matrix will be based directly on the Strategy Deployment
Plan. If you take a more detailed look at the Strategy Deployment Plan you’llnotice that the situation is oversimplified. For example, the strategy for opera-tional excellence is related to operations and logistics, but the StrategyDeployment Plan doesn’t show this (except indirectly through the link betweeninternal process excellence and customer perceived value). A Six Sigma projectaddressing inventory levels would have an impact on both strategies, but itwouldn’t be possible to measure the impact from the Strategy DeploymentPlan alone. QFD will help us make this evaluation explicit. A completed PhaseI Strategy Deployment Matrix is shown in Figure 3.12.The process for developing the Strategy Deployment Matrix is:1. Create a matrix of the strategies and metrics.2. Determine the strength of the relationship between each strategy and
metric.3. Calculate a weight indicating the relative importance of the metric.To begin we create a matrix where the rows are the strategies (what we want
to accomplish) and the columns are the dashboard metrics (how we will opera-tionalize the strategies and monitor progress). Note that this is the typicalwhat-how QFD matrix layout, just with a different spin. In each cell (intersec-tion of a row and a column) wewill place a symbol assigning a weight to the rela-tionship between the row and the column. The weights and symbols used areshown in Figure 3.13.The weights are somewhat arbitrary and you can choose others if you desire.
These particular values increase more-or-less exponentially, which places ahigh emphasis on strong relationships, the idea being that we are looking forclear priorities. Weights of 1-2-3 would treat the different relationship strengthsas increasing linearly. Choose the weighting scheme you feel best fits yourstrategy.After the relationships have been determined for each cell, we are ready to
calculate scores for each row. Remember, the rows represent strategies. Forexample, the first row represents our productivity strategy. The StrategyDeployment Plan indicated that the productivity strategy was operationalizedby the metrics cost-per-unit and asset utilization, and a strong relationship (()is shown between these metrics and the productivity strategy. However, QFD
Using QFD to Link Six Sigma Projects to Strategies 133
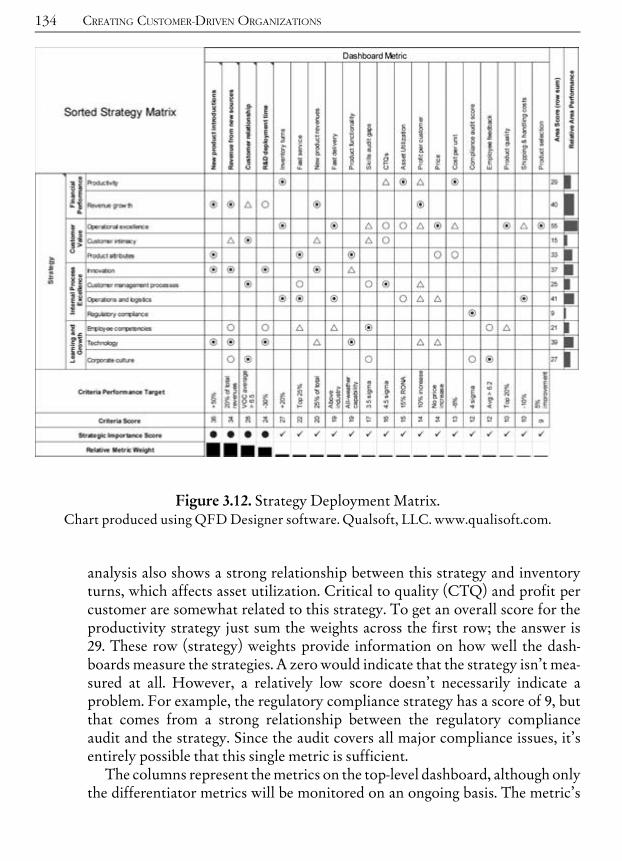
analysis also shows a strong relationship between this strategy and inventoryturns, which affects asset utilization. Critical to quality (CTQ) and profit percustomer are somewhat related to this strategy. To get an overall score for theproductivity strategy just sum the weights across the first row; the answer is29. These row (strategy) weights provide information on how well the dash-boards measure the strategies. A zero would indicate that the strategy isn’t mea-sured at all. However, a relatively low score doesn’t necessarily indicate aproblem. For example, the regulatory compliance strategy has a score of 9, butthat comes from a strong relationship between the regulatory complianceaudit and the strategy. Since the audit covers all major compliance issues, it’sentirely possible that this single metric is sufficient.The columns represent themetrics on the top-level dashboard, although only
the differentiator metrics will be monitored on an ongoing basis. The metric’s
134 CREATING CUSTOMER-DRIVEN ORGANIZATIONS
Figure 3.12. Strategy Deployment Matrix.Chart produced using QFDDesigner software. Qualsoft, LLC. www.qualisoft.com.
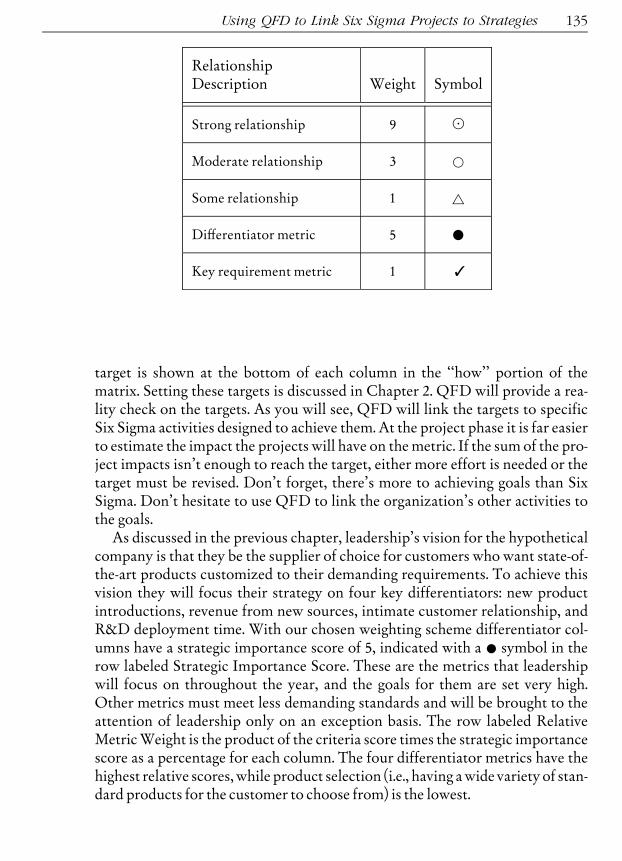
target is shown at the bottom of each column in the ‘‘how’’ portion of thematrix. Setting these targets is discussed in Chapter 2. QFD will provide a rea-lity check on the targets. As you will see, QFD will link the targets to specificSix Sigma activities designed to achieve them. At the project phase it is far easierto estimate the impact the projects will have on themetric. If the sum of the pro-ject impacts isn’t enough to reach the target, either more effort is needed or thetarget must be revised. Don’t forget, there’s more to achieving goals than SixSigma. Don’t hesitate to use QFD to link the organization’s other activities tothe goals.As discussed in the previous chapter, leadership’s vision for the hypothetical
company is that they be the supplier of choice for customers who want state-of-the-art products customized to their demanding requirements. To achieve thisvision they will focus their strategy on four key differentiators: new productintroductions, revenue from new sources, intimate customer relationship, andR&D deployment time. With our chosen weighting scheme differentiator col-umns have a strategic importance score of 5, indicated with a * symbol in therow labeled Strategic Importance Score. These are the metrics that leadershipwill focus on throughout the year, and the goals for them are set very high.Other metrics must meet less demanding standards and will be brought to theattention of leadership only on an exception basis. The row labeled RelativeMetricWeight is the product of the criteria score times the strategic importancescore as a percentage for each column. The four differentiator metrics have thehighest relative scores, while product selection (i.e., having awide variety of stan-dard products for the customer to choose from) is the lowest.
Using QFD to Link Six Sigma Projects to Strategies 135
RelationshipDescription Weight Symbol
Strong relationship 9 (
Moderate relationship 3 *
Some relationship 1 ~
Di¡erentiator metric 5 *
Key requirement metric 1 [

It is vital when using QFD to focus on only the most important columns!
Columns identified with a" in the row labeled Strategic Importance Scoreare not part of the organization’s differentiation strategy. This isn’t to say thatthey are unimportant. What it does mean is that targets for these metrics willprobably be set at or near their historical levels as indicated by process behaviorcharts. The goals will be to maintain these metrics, rather than to drive them tonew heights. An organization has only limited resources to devote to change,and these resources must be focused if they are to make a difference that willbe noticed by customers and shareholders. This organization’s complete dash-board has twentymetrics, which can hardly be considered a ‘‘focus.’’ By limitingattention to the four differentiators, the organization can pursue the strategythat their leadership believes will make them stand out in the marketplace forcustomer and shareholder dollars.*
Deploying differentiators to operationsQFD most often fails because the matrices grow until the analysis becomes
burdensome. As the matrix grows like Topsy and becomes unwieldy, the teamperforming QFD begins to sense the lack of focus being documented by theQFD matrix. Soon, interest begins to wane and eventually the effort grinds toa halt. This too, is avoided by eliminating" key requirements from the strategydeployment matrix. We will create a second-level matrix linked only to the dif-ferentiators. This matrix relates the differentiator dashboard metrics to depart-mental support strategies and it is shown in Figure 3.14.To keep things simple, we only show the strategy linkage for three depart-
ments: engineering, manufacturing, and marketing; each department can pre-pare its own QFD matrix. Notice that the four differentiator metric columnsnow appear as rows in the matrix shown in Figure 3.14. These are the QFD‘‘whats.’’ The software automatically brings over the criteria performance tar-get, criteria scores, and relative criteria scores for each row. This information isused to evaluate the strategy support plans for the three departments.The support plans for the three departments are shown as columns, theQFD
‘‘hows,’’ or how these three departments plan to implement the strategies. Therelationship between the whats and hows is determined as described above.For each column the sum of the relationship times the row criteria score is cal-culated and shown in the score row near the bottom of the chart. This informa-
136 CREATING CUSTOMER-DRIVEN ORGANIZATIONS
*The key requirements probably won’t require explicit support plans. However, if they do QFD can be used to evaluate theplans. Key requirements QFD should be handled separately.

tion will be used to select and prioritize Six Sigma projects in the next phase ofthe QFD.Figure 3.14 also has a roof, which shows correlations between the whats. This
is useful in identifying related Six Sigma projects, either within the same depart-
Using QFD to Link Six Sigma Projects to Strategies 137
Figure 3.14. Phase II matrix: di¡erentiators.Chart produced using QFDDesigner software. Qualsoft, LLC. www.qualisoft.com.
ment or in different departments. For example, there is a strong relationshipbetween the two engineering activities: faster prototype development andimprove concept-to-design cycle time. Perhaps faster prototype developmentshould be a subproject under the broad heading of improve concept-to-designcycle time. This also suggests that ‘‘improve concept-to-design cycle time’’ mayhave too large a scope. The marketing strategy of ‘‘improve ability to respondto changing customer needs’’ is correlated with three projects in engineeringand manufacturing. When a strategy support plan involves many cross-func-tional projects it may indicate the existence of a core process. This suggests aneed for high-level sponsorship, or the designation of a process owner to coordi-nate projects.
Deploying operations plans to projectsFigure 3.15 is aQFDmatrix that links the department plans to Six Sigma pro-
jects. (In reality this may require additional flow down steps, but the numberof steps should be kept as small as possible.) The rows are the departmentplans. The software also carried over the numeric relative score from the bottomrow of the previous matrix, which is a measure of the relative impact of thedepartment plan on the overall differentiator strategy. The far right column,labeled ‘‘Goal Score’’ is the sum of the relationships for the row. For this exam-ple only the top five department plans are deployed to Six Sigma projects. Bysumming the numeric relative scores we can determine that these five plansaccount for 86% of the impact. In reality you will also only capture the biggesthitters, although there’s nothing magic about the number five.There are three Black Belts shown, and eight projects. Each project is shown
as a column in thematrix. The relationship between the project and each depart-mental plan is shown in the matrix. The bottom row shows the ‘‘ProjectImpact Score,’’ which is the sum of the relationships for the project’s columntimes the row’s numeric relative score.
INTERPRETATIONSince the numeric relative scores are linked to department plans, which are
linked to differentiator metrics, which are linked to strategies, the projectimpact score measures the project’s impact on the strategy. The validity ofthese ‘‘carry-over scores’’ has been questioned (Burke et al., 2002). Through theStrategy Deployment Plan we can trace the need for the project all the wayback to stakeholders (Figure 3.16). This logical thread provides those engagedin Six Sigma projects with an anchor to reality and the meaning behind theiractivities.
138 CREATING CUSTOMER-DRIVEN ORGANIZATIONS

The Goal Score column can also be used to determine the support Six Sigmaprovides for each department plan. Note that the marketing plan to ‘‘Identifytarget markets for new products’’ isn’t receiving any support at all from SixSigma projects (assuming that these eight projects are all of the Six Sigma pro-jects). This may be okay, or it may not be. It all depends on how important theplan is to the strategic objectives, and what other activities are being pursuedto implement the plan. The Executive Six Sigma Council may wish to examineproject QFD matrices to determine if action is necessary to reallocate SixSigma resources.The Project Impact Score row is useful in much the same way. This row can
be rank-ordered to see which projects have the greatest impact on the strategy.It is also useful in identifying irrelevant projects. The projectMike L is pursuingto improve ‘‘Pin manufacturing capability’’ has no impact on any of the depart-
Using QFD to Link Six Sigma Projects to Strategies 139
Figure 3.15. Phase III matrix: Six Sigma projects.Chart produced using QFDDesigner software. Qualsoft, LLC. www.qualisoft.com.
Figure 3.16. Linkage between Six Sigma projects and stakeholders.

mental plans. Unless it impacts some other strategy support plan that isn’tshown in the QFD matrix, it should be abandoned as a Six Sigma project. Theproject may still be something the manufacturing department wants to pursue,perhaps to meet a goal for a key requirement. However, as a general rule SixSigma projects requiring a Black Belt should focus on plans that have a directlinkage to differentiator strategies.
LINKING CUSTOMER DEMANDS TO BUDGETSOnce customershavemade their demandsknown, it is important that thesebe
translated into internal requirements and specifications. The term ‘‘translation’’is used to describe this process because the activity literally involves interpretingthewords in one language (the customer’s) into those of another (the employee).For example, regarding the door of her automobile the customer might say ‘‘Iwant the door to close completely when I push it, but I don’t want it swingingclosed from just the wind.’’ The engineer working with this requirement mustconvert it into engineering terminology such as pounds of force required tomove the door from an open to a closed position, the angle of the door when it’sopened, and so on. Care must be taken to maintain the customer’s intentthroughout the development of internal requirements. The purpose of specifica-tions is to transmit the voice of the customer throughout the organization.In addition to the issue of maintaining the voice of the customer, there is the
related issue of the importance assigned to each demand by the customer.Design of products and services always involves tradeoffs: gasoline economysuffers as vehicle weight increases, but safety improves as weight increases.The importance of each criterion must be determined by the customer. Whendifferent customers assign different importance to criteria, design decisionsare further complicated.It becomes difficult to choose from competing designs in the face of ambigu-
ity and customer-to-customer variation. Add to this the differences betweeninternal personnel and objectivesLdepartment vs. department, designer vs.designer, cost vs. quality, etc.L and the problem of choosing a design alter-native quickly becomes complex. A rigorous process for deciding whichalternative to settle on is helpful in dealing with the complexity.
Structured decision-making*The first step in deciding upon a course of action is to identify the goal. For
example, let’s say you’re the owner of the Product Development process for a
140 CREATING CUSTOMER-DRIVEN ORGANIZATIONS
* Use of this approach in designing for six sigma is discussed in Chapter 19.
company that sells software to help individuals manage their personal finances.The product, let’s call it DollarWise, is dominant in its market and your com-pany is well respected by its customers and competitors, in large part becauseof this product’s reputation. The business is profitable and the leadershipnaturally wants to maintain this pleasant set of circumstances and to buildon it for the future. The organization has committed itself to a strategy ofkeeping DollarWise the leader in its market segment so it can capitalize onits reputation by launching additional new products directed towards otherfinancially oriented customer groups, such as small businesses. They havedetermined that Product Development is a core process for deploying thisstrategy.As the process owner, or Business Process Executive, you have control of the
budget for product development, including the resources to upgrade the exist-ing product. Although it is still considered the best personal financial softwareavailable, DollarWise is getting a little long in the tooth and the competitionhas steadily closed the technical gap. You believe that a major product upgradeis necessary and want to focus your resources on those things that matter mostto customers. Thus, your goal is:
GOAL: Determine where to focus product upgrade resources
Through a variety of ‘‘listening posts’’ (focus groups, user laboratories, inter-net forums, trade show interviews, conference hospitality suites, surveys, let-ters, technical support feedback, etc.), you have determined that customers askquestions and make comments like the following:
. Can I link a DollarWise total to a report in my word processor?
. I have a high speed connection and I’d like to be able to download big data-bases of stock information to analyze with DollarWise.
. I like shortcut keys so I don’t have to always click around in menus.
. I only have a 56K connection and DollarWise is slow on it.
. I use the Internet to pay bills through my bank. I’d like to do this usingDollarWise instead of going to my bank’s web site.
. I want an interactive tutorial to help me get started.
. I want printed documentation.
. I want the installation to be simple.
. I want the user interface to be intuitive.
. I want to be able to download and reconcile my bank statements.
. I want to be able to upgrade over the Internet.
. I want to manage my stock portfolio and track my ROI.
. I’d like to have the reports I run every month saved and easy to update.
. It’s a pain to set up the di¡erent drill downs every time I want to analyzemy spending.
Linking Customer Demands to Budgets 141

. It’s clunky to transfer information between DollarWise and Excel.
. When I have a minor problem, I’d like to have easy-to-use self-help avail-able on the Internet or in the help ¢le.
. When it’s a problem I can’t solve myself, I want reasonably priced, easy toreach technical support.
. You should bemaking patches and bug-¢xes available free on the Internet.The first step in using this laundry list of comments is to see if there’s an
underlying structure embedded in them. If these many comments address onlya few issues, it will simplify the understanding of what the customer actuallywants from the product. While there are statistical tools to help accomplishthis task (e.g., structural equationmodeling, principal components analysis, fac-tor analysis), they are quite advanced and require that substantial data be col-lected using well-designed survey instruments. An alternative is to create an‘‘affinity diagram,’’ which is a simple procedure described elsewhere in thistext (see page 314). After creating the affinity diagram, the following structurewas identified:1. Easy to learn.
1.1. I want the installation to be simple.1.2. I want an interactive tutorial to help me get started.1.3. I want printed documentation.1.4. I want the user interface to be intuitive.
2. Easy to use quickly after I’ve learned it well.2.1. I like shortcut keys so I don’t have to always click around inmenus.2.2. I’d like to have the reports I run every month saved and easy to
update.2.3. It’s a pain to set up the di¡erent drill downs every time I want to
analyze my spending.3. Internet connectivity.
3.1. I use the Internet to pay bills through my bank. I’d like to do thisusing DollarWise instead of going to my bank’s web site.
3.2. I only have a 56K connection and DollarWise is slow on it.3.3. I have a high speed connection and I’d like to be able to download
big databases of stock information to analyze with DollarWise.3.4. I want to be able to download and reconcile my bank statements.3.5. I want to manage my stock portfolio and track my ROI.
4. Works well with other software I own.4.1. It’s clunky to transfer information between DollarWise and
Excel.4.2. Can I link a DollarWise total to a report in my word processor?
5. Easy to maintain5.1. I want to be able to upgrade over the Internet.
142 CREATING CUSTOMER-DRIVEN ORGANIZATIONS

5.2. You should be making patches and bug-¢xes available free on theInternet.
5.3. When I have a minor problem, I’d like to have easy-to-use self-helpavailable on the Internet or in the help ¢le.
5.4. When it’s a problem I can’t solve myself, I want reasonably priced,easy to reach technical support.
The reduced model shows that five key factors are operationalized by themany different customer comments (Figure 3.17).Next, we must determine importance placed on each item by customers.
There are a number of ways to do this.. Have customers assign importance weights using a numerical scale (e.g.,‘‘How important is ‘Easy self-help’ on a scale between 1 and 10?’’).
. Have customers assign importance using a subjective scale (e.g., unimpor-tant, important, very important, etc.).
. Have customers ‘‘spend’’ $100 by allocating it among the various items. Inthese cases it is generally easier for the customer to ¢rst allocate the $100to the major categories, then allocate another $100 to items within eachcategory.
. Have customers evaluate a set of hypothetical product o¡erings and indi-cate their preference for each product by ranking the o¡erings, assigninga ‘‘likely to buy’’ rating, etc. The product o¡erings include a carefullyselected mix of items chosen from the list of customer demands. The listis selected in such a way that the relative value the customer places oneach item in the o¡ering can be determined from the preference values.This is known as conjoint analysis, an advanced technique that is coveredin most texts on marketing statistics.
. Have customers evaluate the items in pairs, assigning a preference ratingto one of the items in each pair, or deciding that both items in a pairare equally important. This is less tedious if the major categories areevaluated ¢rst, then the items within each category. The evaluation canuse either numeric values or descriptive labels that are converted tonumeric values. The pairwise comparisons can be analyzed to deriveitem weights using a method known as the Analytic HierarchicalProcess (AHP) to determine the relative importance assigned to all ofthe items.
All of the above methods have their advantages and disadvantages. The sim-ple methods are easy to use but less powerful (i.e., the assigned weights are lesslikely to reflect actual weights). Themore advanced conjoint and AHPmethodsrequire special skills to analyze and interpret properly. We will illustrate theuse of AHP for our hypothetical software product. AHP is a powerful tech-nique that has been proven in a wide variety of applications. In addition to its
Linking Customer Demands to Budgets 143

144 CREATING CUSTOMER-DRIVEN ORGANIZATIONS
���� ����� � ������ �
���� ������� �� ����
���� ������ ������
���� �� ��� ���
���� ���� �� ��
���� ���� ����� � ��
���� !��"
���� #$�
���� %�&� ��� �����
���� � �� �� �� ����
��#� '���& � �� ��
���� ()�� ������
���� * �� +��"
#��� ���� ,�&����
#��� -� ���� -�)�
#��� (��� ��� %��
#��� . � ��� ���� �/���
���� ����� ������
Figure 3.17. Customer demand model.

use in determining customer importance values, it is useful for decision-making in general.
Category importance weightsWe begin our analysis by making pairwise comparisons at the top level. The
affinity diagram analysis identified five categories: easy to learn, easy to usequickly after I’ve learned it, internet connectivity, works well with other soft-ware I own, and easy to maintain. Arrange these items in a matrix as shown inFigure 3.18.For our analysis we will assign verbal labels to our pairwise comparisons;
the verbal responses will be converted into numerical values for analysis.Customers usually find it easier to assign verbal labels than numeric labels.All comparisons are made relative to the customer’s goal of determiningwhich product he will buy, which we assume is synonymous with our goalof determining where to focus product upgrade efforts. The highlighted cellin the matrix compares the ‘‘easy to learn’’ attribute and the ‘‘easy to usequickly after I’ve learned it’’ attribute. The customer must determine whichis more important to him, or if the two attributes are of equal importance.In Figure 3.18 this customer indicates that ‘‘easy to learn’’ is moderately to
Linking Customer Demands to Budgets 145
Figure 3.18. Matrix of categories for pairwise comparisons.Created using Expert Choice 2000 Software, www.expertchoice.com.*
*Although the analysis is easier with special software, you can obtain a good approximation using a spreadsheet. See theAppendix for details.

strongly preferred over ‘‘easy to use quickly after I’ve learned it’’ and the soft-ware has placed a +4 in the cell comparing these two attributes. (The scalegoes from ^9 to +9, with ‘‘equal’’ being identified as a +1.) The remainingattributes are compared one by one, resulting in the matrix shown in Figure3.19. The shaded bars over the attribute labels provide a visual display of therelative importance of each major item to the customer. Numerically, theimportance weights are:*
. Easy to learn: 0.264 (26.4%)
. Easy to use quickly after I’ve learned it: 0.054 (5.4%)
. Internet connectivity: 0.358 (35.8%)
. Works well with other software I own: 0.105 (10.5%)
. Easy to maintain: 0.218 (21.8%)These relative importance weights can be used in QFD as well as in the AHP
process that we are illustrating here. In our allocation of effort, we will want toemphasize those attributes with high importance weights over those withlower weights.
Subcategory importance weightsThe process used for obtaining category importance weights is repeated for
the items within each category. For example, the items interactive tutorial,good printed documentation, and intuitive interface are compared pairwisewithin the category ‘‘easy to learn.’’ This provides weights that indicate theimportance of each item on the category. For example, within the ‘‘easy tolearn’’ category, the customer weights might be:
. Interactive tutorial: 11.7%
. Good documentation: 20.0%
. Intuitive interface: 68.3%
146 CREATING CUSTOMER-DRIVEN ORGANIZATIONS
���� ����
����
����
Figure 3.19. Completed top-level comparison matrix.
*See the Appendix for an example of how to derive approximate importance weights using Microsoft Excel.

If there were additional levels below these subcategories, the process wouldbe repeated for them. For example, the intuitive interface subcategory mightbe subdivided into ‘‘number of menus,’’ ‘‘number of submenus,’’ ‘‘menu itemseasily understood,’’ etc. The greater the level of detail, the easier the translationof the customer’s demands into internal specifications. The tradeoff is that theprocess quickly becomes tedious and may end up with the customer beingasked for input he isn’t qualified to provide. In the case of this example, we’dprobably stop at the second level.
Global importance weightsThe subcategory weights just obtained tell us how much importance the
item has with respect to the category, not with respect to the ultimate goal.Thus, they are often called local importance weights. However, the subcate-gory weights don’t tell us the impact of the item on the overall goal, whichis called its global impact. This is determined by multiplying the subcate-gory item weight by the weight of the category in which the item resides.The global weights for our example are shown in Table 3.4 in descendingorder.The global importance weights are most useful for the purpose of allocat-
ing resources to the overall goal: Determine where to focus product upgradeefforts. For our example, Internet connectivity obviously has a huge customerimpact. ‘‘Easy to use quickly after I’ve learned it’’ has relatively low impact.‘‘Easy to learn’’ is dominated by one item: the user interface. These weightswill be used to assess different proposed upgrade plans. Each plan will beevaluated on each subcategory item and assigned a value depending on howwell it addresses the item. The values will be multiplied by the global weightsto arrive at an overall score for the plan. The scores can be rank-ordered toprovide a list that the process owner can use when making resource alloca-tion decisions. Or, more proactively, the information can be used to developa plan that emphasizes the most important customer demands. Table 3.5shows part of a table that assesses project plans using the global weights.The numerical rating used in the table is 0=No Impact, 1=Some Impact,3=Moderate Impact, 5=High Impact. Since the global weights sum to 1(100%), the highest possible score is 5. Of the five plans evaluated, Plan Chas the highest score. It can be seen that Plan C has a high impact on thesix most important customer demands. It has at least a moderate impact on10 of the top 11 items, with the exception of ‘‘Reasonably priced advancedtechnical support.’’ These items account for almost 90% of the customerdemands.
Linking Customer Demands to Budgets 147
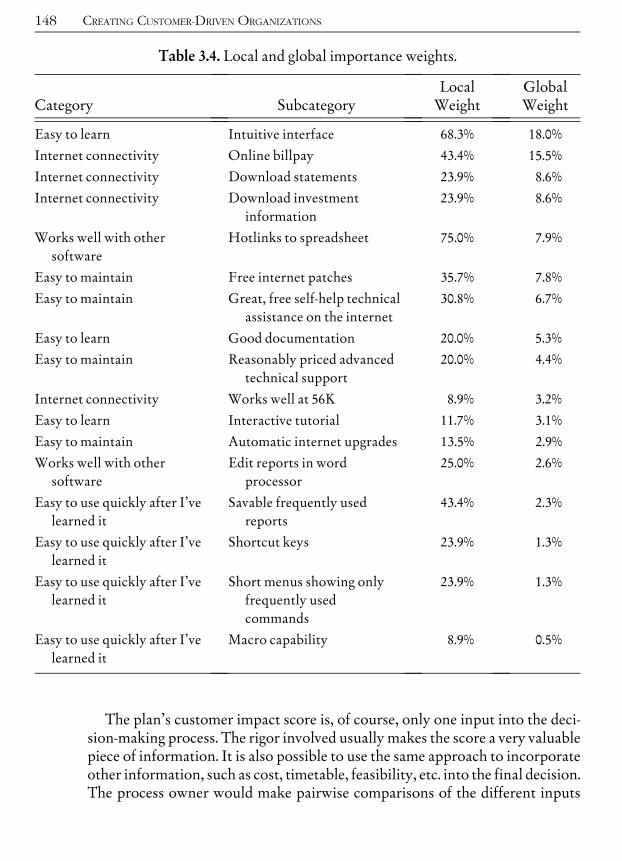
The plan’s customer impact score is, of course, only one input into the deci-sion-making process. The rigor involved usually makes the score a very valuablepiece of information. It is also possible to use the same approach to incorporateother information, such as cost, timetable, feasibility, etc. into the final decision.The process owner would make pairwise comparisons of the different inputs
148 CREATING CUSTOMER-DRIVEN ORGANIZATIONS
Table 3.4. Local and global importance weights.
Category SubcategoryLocalWeight
GlobalWeight
Easy to learn Intuitive interface 68.3% 18.0%
Internet connectivity Online billpay 43.4% 15.5%
Internet connectivity Download statements 23.9% 8.6%
Internet connectivity Download investmentinformation
23.9% 8.6%
Works well with othersoftware
Hotlinks to spreadsheet 75.0% 7.9%
Easy to maintain Free internet patches 35.7% 7.8%
Easy to maintain Great, free self-help technicalassistance on the internet
30.8% 6.7%
Easy to learn Good documentation 20.0% 5.3%
Easy to maintain Reasonably priced advancedtechnical support
20.0% 4.4%
Internet connectivity Works well at 56K 8.9% 3.2%
Easy to learn Interactive tutorial 11.7% 3.1%
Easy to maintain Automatic internet upgrades 13.5% 2.9%
Works well with othersoftware
Edit reports in wordprocessor
25.0% 2.6%
Easy to use quickly after I’velearned it
Savable frequently usedreports
43.4% 2.3%
Easy to use quickly after I’velearned it
Shortcut keys 23.9% 1.3%
Easy to use quickly after I’velearned it
Short menus showing onlyfrequently usedcommands
23.9% 1.3%
Easy to use quickly after I’velearned it
Macro capability 8.9% 0.5%
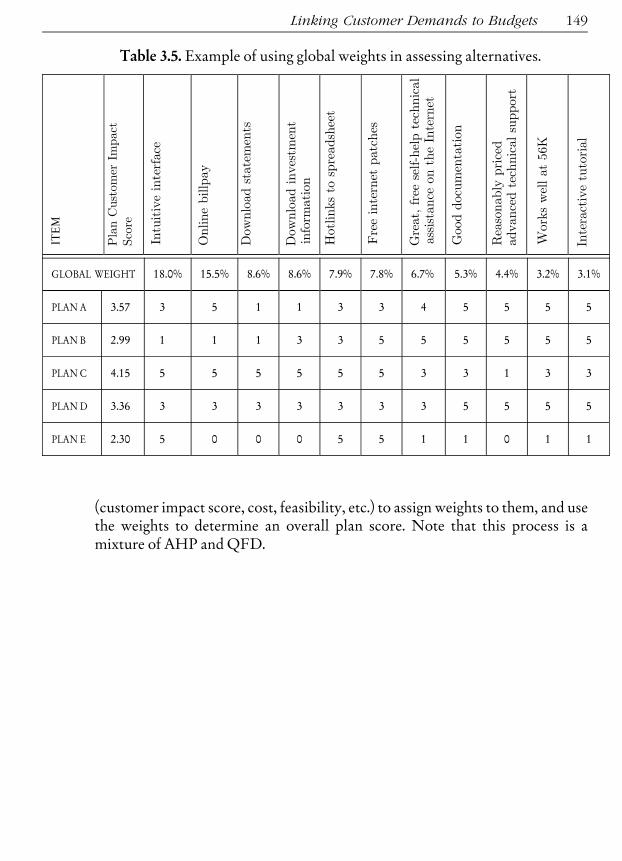
(customer impact score, cost, feasibility, etc.) to assign weights to them, and usethe weights to determine an overall plan score. Note that this process is amixture of AHP and QFD.
Linking Customer Demands to Budgets 149
Table 3.5. Example of using global weights in assessing alternatives.ITEM
Pla
nC
ust
omer
Impac
tSco
re
Intu
itiv
ein
terf
ace
Online
billp
ay
Dow
nlo
ad
state
men
ts
Dow
nlo
ad
inves
tmen
tin
form
ati
on
Hotl
inks
tosp
readsh
eet
Fre
ein
tern
etpatc
hes
Gre
at,
free
self-h
elp
tech
nic
al
ass
ista
nce
on
the
Inte
rnet
Good
docu
men
tati
on
Rea
sonably
pri
ced
advance
dte
chnic
alsu
pport
Work
sw
ellat
56K
Inte
ract
ive
tuto
rial
GLOBAL WEIGHT 18.0% 15.5% 8.6% 8.6% 7.9% 7.8% 6.7% 5.3% 4.4% 3.2% 3.1%
PLAN A 3.57 3 5 1 1 3 3 4 5 5 5 5
PLAN B 2.99 1 1 1 3 3 5 5 5 5 5 5
PLAN C 4.15 5 5 5 5 5 5 3 3 1 3 3
PLAND 3.36 3 3 3 3 3 3 3 5 5 5 5
PLAN E 2.30 5 0 0 0 5 5 1 1 0 1 1

^ ^ ^CHAPTER
4
Training for Six SigmaEducation (teaching people how to think differently) and training (teaching
people how to do things differently) are vital elements in Six Sigma success.Although education and training are different, for simplicity we will refer toboth as simply ‘‘training.’’The Six Sigma organization is unlike the traditional organization and the
knowledge, skills and abilities (KSAs) required for success in the new organiza-tion are different than those possessed by most employees. The new KSAsneed to be identified and plans need to be developed to assure that employeesacquire them. The investment required is likely to be significant; careful plan-ning is required to assure a good ROI.
TRAINING NEEDS ANALYSISThe first step in the development of the strategic training plan is a training
needs assessment. The training needs assessment provides the backgroundnecessary for designing the training program and preparing the training plan.The assessment proceeds by performing a task-by-task audit to determinewhat the organization is doing, and comparing it to what the organizationshould be doing. The assessment process focuses on three major areas:
Process auditLAll work is a process. Processes are designed to add values toinputs and deliver values to customers as outputs. Are they operating asdesigned? Are they operated consistently? Are they measured at key controlpoints? If so, do the measurements show statistical control? The answers to
Copyright 2003 by The McGraw-Hill Companies, Inc. Click Here for Terms of Use.

these questions, alongwith detailed observations of how the process is operated,are input to the development of the training plan.
Assessment of knowledge, skills and abilitiesLIn all probability, there willbe deficiencies (opportunities for improvement) observed during the processaudits. Some of these deficiencies will involve employee KSAs. The first prin-ciple of self-control is that employees must know what they are doing.Management’s job doesn’t end by simply giving an employee responsibility fora particular process or task, they must also provide the employee with theopportunity to acquire the KSAs necessary to successfully perform their newduties. This means that if the employee is asked to assume new duties as a mem-ber of a Six Sigma improvement team, they are given training in team skills, ifthey are to keep a control chart, they receive training in the maintenance andinterpretation of the charts, etc. Since employees are expected to contribute tothe implementation of the organization’s strategic plan, they should be toldwhat the plan is, and how their job contributes to the plan.
Assessment of employee attitudesLAttitudes are emotions that reflect aresponse to something taking place within an organization. A person’s attitudeis, in essence, a judgment about the wisdom of a particular course of events. Ifan employee’s attitude is not positive, they will not use their KSAs to help theorganization as effectively as they could. Negative employee attitudes aboutthe direction being taken by the organization indicate that the employee eitherquestions the wisdom of the proposed changes, or doubts the sincerity of theleadership. Regardless, it represents a problem that must be addressed by thetraining plan.
Theassessments above canbeconductedusing audits or the survey techniquesdescribed inChapter 3.Assessments canbe conductedby either internal or exter-nal personnel. In general, employees are more likely to be open and honestwhen confidentiality is assured, which is more likely when assessments are con-ducted by outside parties. However, internal assessments can reveal valuableinformation if proper safeguards are observed to assure the employee’s privacy.It is important that follow-up assessments be made to determine if the train-
ing conducted closed the gap between the ‘‘is’’ and the ‘‘should be.’’ The followup will also provide a basis for additional training. Reassessment should be con-ducted first to assure that the desired KSAs were acquired by the target groupof employees, then the process should be reassessed to determine if the newKSAs improved the process as predicted. It’s common to discover that wemade a mistake in assuming that the root cause of the process ‘‘is/should-be’’gap is a KSA deficiency. If the reassessments indicate that the KSA gap wasclosed but the process gap persists, another approach must be taken to closethe process gap.
Training Needs Analysis 151

THE STRATEGIC TRAINING PLANThe strategic training plan is a project plan describing in detail how the gaps
identified in the training needs analysis will be addressed. As with any projectplan, the strategic training plan includes a charter containing a detailed descrip-tion of the training deliverables, major activities to be undertaken, responsibil-ity for each major activity, resources required, deadlines and timetables, etc. Inmost organizations the plan describes several major subprojects, such as theleadership training project, the Green Belt, Black Belt and Master Black Belttraining project, and so on.In the traditional organization, the training department is another ‘‘silo,’’
with its own budget and special interests to protect. In this system the trainingplans are often not tied to strategic plans. Instead, these plans tend to serve theneeds of the trainers and others in the training department, rather than servingthe needs of the organization as a whole. The effect on the organization’s perfor-mance is the same as when any organizational unit pursues its own best interestrather than the organization’s interests: negative return on investment,damaged morale, etc.In Six Sigma organizations training plans are tied directly to the current and
future needs of external customers. These needs are, in turn, the driver behindthe organization’s strategic plan. The strategic training plan provides the meansofdeveloping theknowledge, skills, andabilities thatwillbeneededbyemployeesin the organization in the future. The people who develop the strategic plan alsocommission the development of the strategic training plan. In many organiza-tions, Six Sigma training is a subproject of the Six Sigma deployment plan. Thetraining timetable must be tightly linked to the timetable for overall Six Sigmadeployment. Providing training either too early or too late is a mistake. Whentraining is provided too early, the recipient will forget much of what he haslearnedbefore it is needed.When it is provided too late, thequality of the employ-ee’sworkwill suffer.When it comes to training, just-in-time delivery is the goal.The Six Sigma training plan must include a budget. The Six Sigma training
budget lists those resources that are required to provide the training. The train-ing budget traditionally includes a brief cost/benefit analysis. Cost/benefit ana-lysis for training, as for all expenditures for intangibles, is challenging.Estimating cost is usually simple enough. Examples of training costs include:
. trainer salaries
. consulting fees
. classroom space and materials
. lost time from the job
. sta¡ salaries
. o⁄ce space of training sta¡
152 TRAINING FOR SIX SIGMA
Estimating benefits with the same degree of precision is problematic. It isusually counterproductive to attempt to get high precision in such estimates.Instead, most organizations settle for rough figures on the value of the traineeto the company. Some examples of training benefits include:
. improved e⁄ciency
. improved quality
. increased customer satisfaction
. improved employee morale
. lower employee turnover
. increased supplier loyaltyIt isn’t enough to support training in the abstract. Training budgets are tangi-
ble evidence of management support for the goals expressed in the trainingplan. In addition, management support is demonstrated by participating in thedevelopment of the strategic training plan. In most cases, senior managementdelegates the development of annual training plans and budgets to the trainingdepartment staff.
Training needs of various groupsLEADERSHIP TRAININGLeaders should receive guidance in the art of ‘‘visioning.’’ Visioning
involves the ability to develop a mental image of the organization at a futuretime. Without a vision, there can be no strategy; how can you develop a strat-egy without knowing where it is supposed to lead? The future organizationwill more closely approximate the ideal organization, where ‘‘ideal’’ is definedas that organization which completely achieves the organization’s values.How will such an organization ‘‘look’’? What will its employees do? Whowill be its customers? How will it behave towards its customers, employees,and suppliers? Developing a lucid image of this organization will help the lea-der see how she should proceed with her primary duty of transforming thepresent organization. Without such an image in her mind, the executive willlead the organization through a maze with a thousand dead ends.Conversely, with her vision to guide her, the transformation process will pro-ceed on course. This is not to say that the transformation is ever ‘‘easy.’’ Butwhen there is a leader with a vision, it’s as if the organization is followingan expert scout through hostile territory. The destination is clear, but thejourney is still difficult.Leaders need to be masters of communication. Fortunately, most leaders
already possess outstanding communication skills; few rise to the top withoutthem. However, training in effective communication is still wise, even if it is
The Strategic Training Plan 153

only refresher training for some. Also, when large organizations are involved,communications training should include mass communication media, such asvideo, radio broadcasts, print media, etc. Communicating with customers,investors, and suppliers differs from communicatingwith employees and collea-gues, and special training is often required. Communication principles are dis-cussed in the previous chapter.When an individual has a vision of where he wants to go himself, he can
pursue this vision directly. However, when dealing with an organization, sim-ply having a clear vision is not enough. The leader must communicate thevision to the other members of the organization. Communicating a vision isa much different task than communicating instructions or concrete ideas.Visions of organizations that embody abstract values are necessarily abstractin nature. To effectively convey the vision to others, the leader must convertthe abstractions to concretes. One way to do this is by living the vision. Theleader demonstrates her values in every action she takes, every decision shemakes, which meetings she attends or ignores, when she pays rapt attentionand when she doodles absentmindedly on her notepad. Employees who aretrying to understand the leader’s vision will pay close attention to the beha-vior of the leader.Another way to communicate abstract ideas is to tell stories. In organizations
there is a constant flow of events. Customers encounter the organizationthrough employees and systems, suppliers meet with engineers, literally thou-sands of events take place every day. From time to time an event occurs that cap-tures the essence of the leader’s vision. A clerk provides exceptional customerservice, an engineer takes a risk and makes a mistake, a supplier keeps the linerunning through amighty effort. These are concrete examples of what the leaderwants the future organization to become. She should repeat these stories toothers and publicly recognize the people who made the stories. She should alsocreate stories of her own, even if it requires staging an event. There is nothingdishonest about creating a situation with powerful symbolic meaning andusing it to communicate a vision. For example, Nordstrom has a story about asales clerk who accepted a customer return of a defective tire. This story has tre-mendous symbolic meaning because Nordstrom doesn’t sell tires! The storyillustratesNordstrom’s policy of allowing employees to use their own best judg-ment in all situations, even if they make ‘‘mistakes,’’ and of going the extramile to satisfy customers. However, it is doubtful that the event ever occurred.This is irrelevant. When employees hear this story during their orientationtraining, the message is clear. The story serves its purpose of clearly communi-cating an otherwise confusing abstraction.Leaders need training in conflict resolution. In their role as process owner in
a traditional organization, leaders preside over a report-based hierarchy trying
154 TRAINING FOR SIX SIGMA
to deliver value through processes that cut across several functional areas. Theinevitable result is competition for limited resources, which creates conflict.Of course, the ideal solution is to resolve the conflict by designing organizationswhere there is no such destructive competition.Until then, the leader can expectto find a brisk demand for his conflict-resolution services.Finally, leaders should demonstrate strict adherence to ethical principles.
Leadership involves trust, and trust isn’t granted to one who violates a moralcode that allows people to live and work together. Honesty, integrity, andother moral virtues should be second nature to the leader.
BLACK BELT TECHNICAL TRAINING CURRICULABlack Belts are expected to deliver tangible results on projects selected to
have a measurable impact on the organization’s bottom line. This is a big orderto fill. The means of accomplishing it is an approach (DMAIC or DFSS) and aset of techniques that collectively are known as the Six Sigma method. BlackBelts receive from three to six weeks of training in the technical tools of SixSigma. Three week curricula are usually given to Black Belts working in serviceor transaction-based businesses, administrative areas, or finance. Four weekprograms are common for manufacturing environments.* Six weeks of trainingare provided for Black Belts working in R&D or similar environments. Figure4.1 shows the curriculum used for courses in General Electric for personnelwith finance backgrounds who will be applying Six Sigma to financial, generalbusiness, and eCommerce processes. Figure 4.2 shows GE’s curriculum for themore traditional manufacturing areas.Some training companies offer highly compressed two week training
courses, but I don’t recommend this. My experience with coaching Black Belts,as well as student feedback I have received from attendees of four and fiveweek training programs, indicates that these are compressed plenty already!Even with the six week courses, in some weeks students receive the equivalentof two semesters of college-level applied statistics in just a few days. Humansrequire a certain ‘‘gestation period’’ to grasp challenging new concepts andstuffing everything into too short a time period is counterproductive.
SIMULTANEOUS TRAINING AND APPLICATIONIn general, Black Belts are hands-on oriented people selected primarily
for their ability to get things done. Tools and techniques are provided to
The Strategic Training Plan 155
*A fifth week of training in Lean Manufacturing is often provided for Black Belts working in manufacturing.
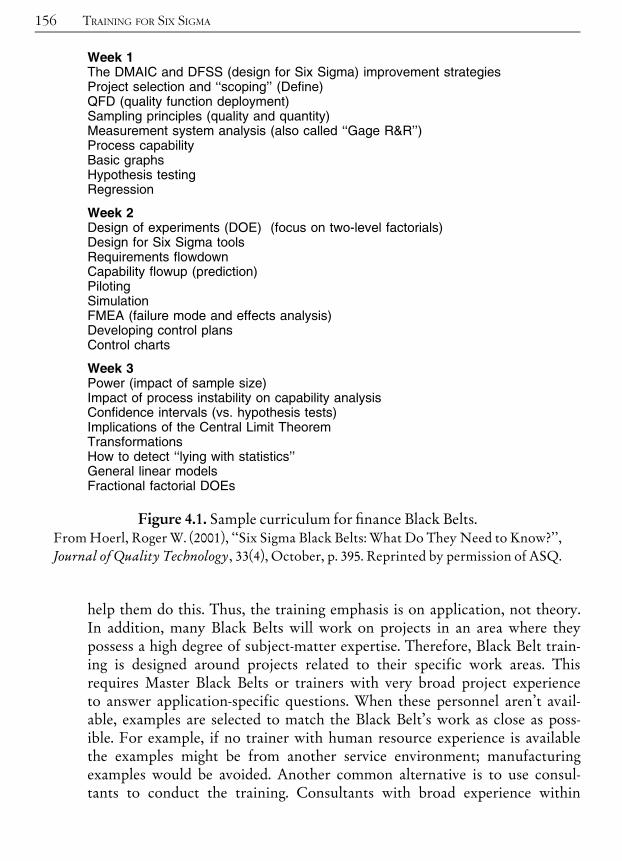
help them do this. Thus, the training emphasis is on application, not theory.In addition, many Black Belts will work on projects in an area where theypossess a high degree of subject-matter expertise. Therefore, Black Belt train-ing is designed around projects related to their specific work areas. Thisrequires Master Black Belts or trainers with very broad project experienceto answer application-specific questions. When these personnel aren’t avail-able, examples are selected to match the Black Belt’s work as close as poss-ible. For example, if no trainer with human resource experience is availablethe examples might be from another service environment; manufacturingexamples would be avoided. Another common alternative is to use consul-tants to conduct the training. Consultants with broad experience within
156 TRAINING FOR SIX SIGMA
Week 1The DMAIC and DFSS (design for Six Sigma) improvement strategiesProject selection and ‘‘scoping’’ (Define)QFD (quality function deployment)Sampling principles (quality and quantity)Measurement system analysis (also called ‘‘Gage R&R’’)Process capabilityBasic graphsHypothesis testingRegression
Week 2Design of experiments (DOE) (focus on two-level factorials)Design for Six Sigma toolsRequirements flowdownCapability flowup (prediction)PilotingSimulationFMEA (failure mode and effects analysis)Developing control plansControl charts
Week 3Power (impact of sample size)Impact of process instability on capability analysisConfidence intervals (vs. hypothesis tests)Implications of the Central Limit TheoremTransformationsHow to detect ‘‘lying with statistics’’General linear modelsFractional factorial DOEs
Figure 4.1. Sample curriculum for ¢nance Black Belts.FromHoerl, Roger W. (2001), ‘‘Six Sigma Black Belts: What Do They Need to Know?’’,Journal of Quality Technology, 33(4), October, p. 395. Reprinted by permission of ASQ.
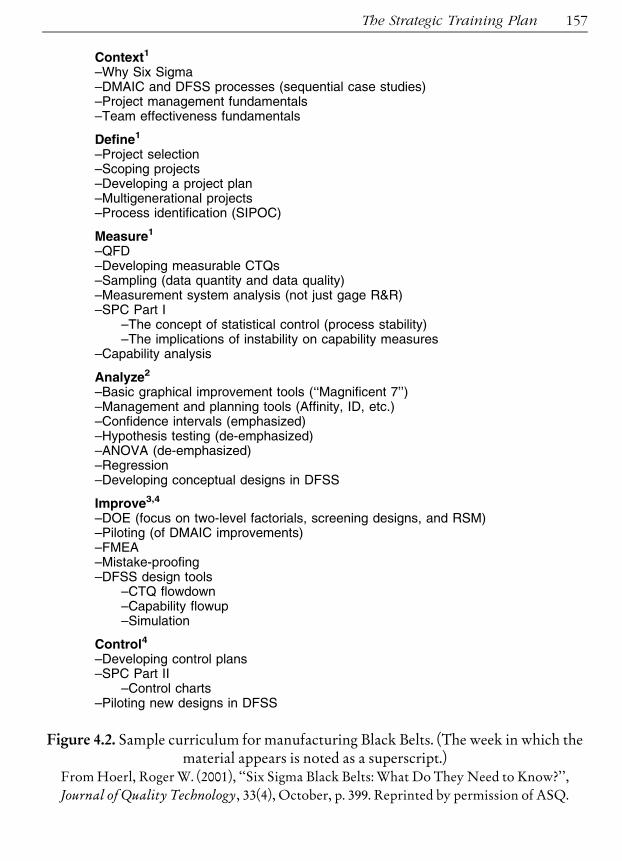
The Strategic Training Plan 157
Context1
–Why Six Sigma–DMAIC and DFSS processes (sequential case studies)–Project management fundamentals–Team effectiveness fundamentals
Define1
–Project selection–Scoping projects–Developing a project plan–Multigenerational projects–Process identification (SIPOC)
Measure1
–QFD–Developing measurable CTQs–Sampling (data quantity and data quality)–Measurement system analysis (not just gage R&R)–SPC Part I
–The concept of statistical control (process stability)–The implications of instability on capability measures
–Capability analysis
Analyze2
–Basic graphical improvement tools (‘‘Magnificent 7’’)–Management and planning tools (Affinity, ID, etc.)–Confidence intervals (emphasized)–Hypothesis testing (de-emphasized)–ANOVA (de-emphasized)–Regression–Developing conceptual designs in DFSS
Improve3,4
–DOE (focus on two-level factorials, screening designs, and RSM)–Piloting (of DMAIC improvements)–FMEA–Mistake-proofing–DFSS design tools
–CTQ flowdown–Capability flowup–Simulation
Control4
–Developing control plans–SPC Part II
–Control charts–Piloting new designs in DFSS
Figure 4.2. Sample curriculum for manufacturing Black Belts. (The week in which thematerial appears is noted as a superscript.)
FromHoerl, Roger W. (2001), ‘‘Six Sigma Black Belts: What Do They Need to Know?’’,Journal of Quality Technology, 33(4), October, p. 399. Reprinted by permission of ASQ.
the enterprise as well as with other organizations can sometimes offerinsights.Black Belts must work on projects while they are being trained. Typically,
the training classes are conducted at monthly intervals and project work ispursued between classes. One of the critical differences between Six Sigmaand other initiatives is the emphasis on using the new skills to get tangibleresults. It is relatively easy to sit in a classroom and absorb the conceptswell enough to pass an exam. It’s another thing entirely to apply the newapproach to a real-world problem. For one thing, there are other peopleinvolved. The Black Belt has to be able to use her change agent skills torecruit sponsors and team members and to get these people to work togetheron a project with a challenging goal and a tight timetable. The Black Belt isnot yet comfortable with her new skills and she’s reluctant to go in front ofothers to promote this new approach. But it won’t get any easier. DuringBlack Belt training she’ll have the moral support of many others in the samesituation. The instructors can provide coaching and project-specific trainingand advice. Because she’s new, people will be more forgiving than at anyfuture time. In short, there’s no better time to get her feet wet than duringthe training.
GREEN BELT TRAINING CURRICULUMThe curriculum for Green Belts is for a one week course (Figure 4.3). The
same material is sometimes covered in two weeks. The primary differencebetween the one and two week courses is the way in which in-class exercisesare handled. In some companies Green Belts are provided with their owncopies of software for statistical analysis, project planning, flowcharting, etc.and expected to be able to use the software independently. In others, theGreen Belt is not expected to be proficient in the use of the software, butrelies on Black Belts for this service. In the former case, Green Belt trainingis extended to provide the necessary hands-on classroom experience usingthe software.
‘‘SOFT SKILLS’’ TRAINING FOR CHANGE AGENTS‘‘Belts’’ seldom do solitary work. In nearly all cases they work with teams,
sponsors, leadership, etc. Seldom does the Black Belt have any authority todirect any member of the team. Thus, as a full-time change agent, the BlackBelt needs excellent interpersonal skills. Other change agents also need trainingin soft skills. In addition to mastering a body of technical knowledge, Belts andother change agents need to be able to:
158 TRAINING FOR SIX SIGMA

The Strategic Training Plan 159
Opening commentsRed bead demoIntroduction to Six SigmaThe DMAIC and DFSS improvement strategiesLean manufacturing
DefineProject selection, scope, and charterTeaming exerciseKanoProcess mapping, SIPOCFMEADefine gate criteria (how to close the Define phase)
MeasureCTx: CTQ, CTC, CTSData collection, scales, distributions, yieldsMeasurement systems–SPC Part I
–The concept of statistical control (process stability)–The implications of instability on capability measures
Measure gate criteria
AnalyzeScatter plotsOther 7M toolsRun chartsDistributionsBox plotsConfidence intervalsDesign of experiments (DOE)Analyze gate criteria
ImproveBenchmarking–SPC Part II
–Process behavior chartsChange toolsForce field analysisProject planning and management (improvement planning)Improve gate criteria
ControlProcess control planning matrixProcess FMEAProcess control planControl gate criteria
Figure 4.3. Sample curriculum for Green Belts.
. Communicate e¡ectively verbally and in writing
. Communicate e¡ectively in both public and private forums
. Work e¡ectively in small group settings as both a participant and a leader
. Work e¡ectively in one-on-one settings
. Understand and carry out instructions from leaders and sponsorsToo many people believe that so-called soft skills are less important than
technical skills. Others think that, while soft skills are important, they are easierto master. Neither of these beliefs are correct. Soft skills are neither less impor-tant nor easier to master, they are just different. In my experience, a changeagent deficient in soft skills will nearly always be ineffective. They are usuallyfrustrated and unhappy souls who don’t understand why their technically brilli-ant case for change doesn’t cause instantaneous compliance by all parties. Thegood news is that if the person is willing to apply as much time and effort tosoft-skill acquisition andmastery as they applied to honing their technical skills,they will be able to develop proficiency.Soft skills are employed in a variety of ways, such as:
CoachingLAcoach doesn’t simply tell the players what to do, he or she clearlyexplains how to do it. A baseball pitching coach studies the theory of pitchingand the individual pitcher and provides guidance on how to hold the ball, thewindup, the delivery, etc. The coach is constantly trying to ¢nd ways to helpthe pitcher do a better job. In Six Sigma work there is a coaching chain: leaderscoach champions and sponsors, champions and sponsors coach Master BlackBelts, Master Black Belts coach Black Belts, Black Belts coach Green Belts, andGreen Belts coach team members. Each link in the chain helps the next linklearn more about doing their job right.MentoringLThementor understands the organization to such a degree that hehas acquired deep wisdom regarding the way it works. This allows him to seerelationships that are not apparent to others. The mentor helps the changeagent avoid organizational obstacles and to negotiate the barriers. Mentoringisn’t so much about the mentor blazing a trail for the change agent as it isabout providing the change agent with a map for getting things done e¡ectively.NegotiationLChange agents must negotiate with others in the organization,as well as with suppliers and customers, to acquire the resources necessary toaccomplish his department’s goals. Obtaining these resources without engen-dering ill will requires negotiating skill and diplomacy.Con£ict resolutionLThe change agent must coordinate the activities of manypeople, and do so without line authority over any of them. When these peoplecannot resolve their own di¡erences, the change agent must provide guidance.
Change agents should also receive training in the fundamentals of account-ing and finance. Such information is essential to such activities as cost/benefit
160 TRAINING FOR SIX SIGMA
analysis, budgeting, and quality costs. The goal isn’t to make them accountants,but to familiarize them with basic concepts.Finally, change agents should possess certain technical skills that are crucial
to their ability to carry out Six Sigma projects. Change agents must understandenough about measurement issues in the social sciences to be able to measurethe effectiveness of their employee and customer projects. Deming lists anunderstanding of theory of variation as one of the cornerstones of his systemof profound knowledge. This requires rudimentary statistical skills. Changeagents without this training will misdiagnose problems, see trends where noneexist, overreact to random variation, and in general make poor decisions.
FACILITATOR SKILLSFacilitating group activities requires that the change agent possess certain
unique skills. It is unlikely that an individual who is not already a facilitatorwill already possess the needed skills. Thus, it is likely that facilitator trainingwill be needed for change agents. A good part of the facilitator’s job involvescommunicating with people who are working on teams. This role involves thefollowing skills:
Communication skillsLQuite simply, the change agent who cannot commu-nicate well is of little use to the modern organization.Meeting management skillsLSchedule the meeting well ahead of time. Besure that key people are invited and that they plan to attend. Prepare an agendaand stick to it! Start on time. State the purpose of the meeting clearly at the out-set. Take minutes. Summarize from time to time. Actively solicit input fromthose less talkative. Curtail the overly talkative members. Manage con£icts.Make assignments and responsibilities explicit and speci¢c. End on time.Presentation skillsLKnow why you are speaking to this audience (inform/educate or convince/persuade); perform the task; solicit the desired audienceresponse.Presentation preparationLPrepare a list of every topic you want to cover.Cull the list to those select few ideas that are most important. Number yourpoints. Analyze each major point. Summarize.Use of visual aidsLA visual aid in a speech is a pictorial used by a speaker toconvey an idea. Well-designed visual aids add power to a presentation byshowing the idea more clearly and easily than words alone. Whereas only10% of presented material is retained from a verbal presentation after 3 days,65% is retained when the verbal presentation is accompanied by a visual aid.However, if the visual aids are not properly designed, they can be distractingand even counterproductive. ASQ reports that poor visuals generate more
The Strategic Training Plan 161

negative comment from conference attendees than any other item. Changeagents must be sensitive to non-verbal communication. There is much moreto communication than mere words. Facilitators should carefully observe pos-ture and body movements, facial expressions, tone of voice, ¢dgeting, etc. Ifthe facilitator sees these non-verbal signals he should use them to determinewhether or not to intervene. For example, a participant who shakes his headwhen hearing a particular message should be asked to verbalize the reasonswhy he disagrees with the speaker. A person whose voice tone indicates sar-casm should be asked to explain the rationale behind his attitude. A wall-£ower who is squirming during a presentation should be asked to tell thegroup her thoughts. Facilitators should be active listeners. Active listeninginvolves certain key behaviors:
. look at the speaker
. concentrate on what the speaker is saying, not on how you will respond toit
. wait until the speaker is ¢nished before responding
. focus on the main idea, rather than on insigni¢cant details
. keep emotional reactions under controlBecause all of the work of facilitators involves groups, facilitators should
have an in-depth understanding of group dynamics and the team process (seeChapter 5). Also, because the groups and teams involved are usually workingon Six Sigma improvement projects, the facilitator should be well versed inproject management principles and techniques (see Chapters 6 and 15).
Post-training evaluation and reinforcementTraining is said to have ‘‘worked’’ if it accomplishes its objectives. Since the
training objectives are (or should be) derived from the strategic plan, the ulti-mate test is whether or not the organization has accomplished its strategicobjectives. However, training is only one of dozens of factors that determine ifan organization accomplishes its strategic objectives, and one that is often farremoved in time from the final result. To assess training effectiveness we needmore direct measures of success, andwe need tomeasure near the time the train-ing has been completed.Except in academic settings, imparting knowledge or wisdom is seldom the
ultimate goal of training. Instead, it is assumed that the knowledge or wisdomwill result in improved judgments, lower costs, better quality, higher levels ofcustomer satisfaction, etc. In other words, the training will produce observableresults. These results were the focus of the training plan development and train-ing needs analysis described earlier in this chapter. Training evaluation requiresthat they be converted to training measurables or objectives.
162 TRAINING FOR SIX SIGMA

Regardless of the format of the presentation, the basic unit of training is thelesson. A lesson is a discrete ‘‘chunk’’ of information to be conveyed to a learner.The training objectives form the basis of each lesson, and the lessons provideguidance for development of measurements of success.Lesson plans provide the basis for measurement at the lowest level. The
objectives in the lesson plan are specific and the lesson is designed to accomplishthese specific objectives. The assumption is that by accomplishing the set ofobjectives for each lesson, the objectives of the seminar or other training activitywill be met. A further assumption is that by meeting the objectives of all of thetraining activities, the objectives of the training plan will be met. Finally, it isassumed that by meeting the objectives of the training plan, the objectives ofthe strategic plan (or strategic quality plan) will be met, or at least will not becompromised due to training inadequacies. All of these assumptions should besubjected to evaluation.
EVALUATIONThe evaluation process involves four elements (Kirkpatrick, 1996):1. ReactionLHow well did the conferees like the program? This is
essentially customer satisfaction measurement. Reaction is usuallymeasured using comment sheets, surveys, focus groups and othercustomer communication techniques. See Chapter 3 for additionalinformation on these topics.
2. LearningLWhat principles, facts, and techniques were learned? Whatattitudes were changed? It is entirely possible that conferees reactfavorably to training, even if learning does not occur. The learning ofeach conferee should be quanti¢ed using pre- and post-tests to identifylearning imparted by the training. Results should be analyzed usingproper statistical methods. In exceptional cases, e.g., evaluating a con-sulting company for a large training contract, a formal designed experi-ment may be justi¢ed.
3. BehaviorLWhat changes in behavior on-the-job occurred? If the con-feree leaves the SPC presentation and immediately begins to e¡ectivelyapply control charts where none were used before, then the traininghad the desired e¡ect on behavior. However, if the conferee’s tests indi-cate that she gained competence in the subject matter from the training,but no change in behavior took place, the training investment waswasted. Note that behavior change is dependent on a great number offactors besides the training, e.g., management must create systemswhere the newly learned behaviors are encouraged.
The Strategic Training Plan 163

4. ResultsLWhat were the tangible results of the program in terms ofreduced cost, improved quality, improved quantity, etc.? This is the realpayback on the training investment. The metrics used for measuringresults are typically built into the action plans, project plans, budgets,etc. Again, as with behavior change, there are many factors other thantraining that produce the desired results.
Phillips adds a fifth item to the above list (Phillips, 1996, p. 316):5. Return on investment (ROI)LDid the monetary value of the results
exceed the cost for the program?
Phillips considers these five items to be different levels of evaluation. Eachevaluation level has a different value, as shown in Figure 4.4.Due to the difficulty and cost involved, it is impractical and uneconomical to
insist that every program be evaluated at all five levels. Sampling can be used toobtain evaluations at the higher levels. As an example, one large electric utilityset the sampling targets in Table 4.1.Where sampling is used, programs should be selected using a randomization
procedure such as random numbers tables. ROI calculations are not difficultand they are described in Chapter 4. However, to make the results credible,finance and accounting personnel should be involved in calculating financialratios of this type.
164 TRAINING FOR SIX SIGMA
Figure 4.4. Characteristics of evaluation levels.From Phillips, J.J. (1996), ‘‘Measuring the Results of Training,’’ in Craig, R.L., editor in chief,The ASTD Training & Development Handbook: A Guide to Human Resources Development.
New York: McGraw-Hill, p. 317.

REINFORCEMENTWhen the subject of reinforcement is raised, monetary remuneration usually
comes to mind first. Skill-based pay is gaining favor in some quarters for a vari-ety of reasons:
. encourage employees to acquire additional skills
. reward people for training and education
. as a reaction to the negative aspects of performance-based payWhile skill-based pay may have merit, cash awards and other such ‘‘rewards’’
are of dubious value and should probably not be used.Rather than assuming that employees will only engage in training if they
receive an immediate tangible reward, research and experience indicate thatmost employees find value in training that helps them better achieve their per-sonal, job, and career goals. Thus, reinforcement is accomplished by providingthe trainee with the opportunity to use the skills they learned. Proficiency isgainedwith practice soon after the learning has taken place.Management shouldprovide an environment where the new skills can be honed without pressureand distraction. The ‘‘just-in-time’’ (JIT) principle applies here. Don’t providetraining for skills that won’t be used in the near future.People who have just learned something new, be it a job skill or a new phi-
losophy such as quality focus, often have questions arise as they attempt to inte-grate their new knowledge into their daily thoughts and routine. User groupsare very helpful. A user group consists of a number of people who have receivedsimilar training. User groups meet from time to time to discuss their under-
The Strategic Training Plan 165
Table 4.1. Targets for percentages of programs to be evaluated.From Phillips, J.J. (1996), ‘‘Measuring the Results of Training,’’ in Craig,R.L., editor in chief, The ASTD Training & Development Handbook: A
Guide to Human Resources Development.New York: McGraw-Hill, p. 317.
LEVEL PERCENTAGE
Participant’s satisfaction 100
Learning 70
On-the-job-applications (behavior) 50
Results 10
ROI 5

standing of the material with others. The focus of the group varies from ‘‘Howare you using this?’’ to ‘‘I don’t understand this’’ to ‘‘Here’s what I am doing!’’At times, well-versed speakers will be invited to clarify particular aspects of thesubject. Presentations of successful applications may be made. Managementcan encourage user groups by providing facilities, helping with administrativedetails, and, especially, by attending their meetings on occasion.Electronic forums are gaining in popularity. Trainers will often make them-
selves available to answer questions via email. Forum subscribers will sendtheir questions or comments to a ‘‘list server.’’ The list server then automaticallybroadcasts the question or comment to other subscribers on the list. Every sub-scriber receives every user’s message, along with the responses to the message.This often produces ‘‘threads.’’ A thread is an exchange of information on a par-ticular topic. E.g., subscriber A has a question about using control charts onfinancial data, subscriber B responds, then C responds to B and so on. Thesethreads look remarkably like a free-wheeling face-to-face discussion. The resultis that a great deal of learning takes place in a format that everyone finds to bemore natural (and more interesting) than a traditional classroom environment.
REFRESHERSLearning that isn’t used right away tends to fade. Even when just-in-time
training (JITT) is used, it is unlikely that every skill will be put to immediateand routine use. It is wise to plan for periodic refresher courses to hone the skillsacquired during prior training. A refresher course is usually shorter, faster, andmore intense than new learning. Instructors need not have the same subjectmat-ter mastery as those teaching newmaterial. In fact, it may not even be necessaryto have an instructor available. Media such as video and audio tape programs,CD ROM, slide presentations, etc., may be sufficient. These self-study mediaoffer a number of cost and scheduling advantages.If in-house instructors are used, they may be available to answer occasional
questions from previous trainees. Of course, when the instructor is not a full-time trainer, this must be strictly limited. There are a number of ways to reducethe demands on the trainer’s time while still answering most of the questionsfrom participants. If the need is not urgent, the question may be asked usingmail or an online forum. House newsletters or bulletins can be used to provideanswers to frequently asked questions. More companies now have ‘‘Intranets’’where such information is made available. The trainee may be able to findan Internet news group devoted to the subject of their concern. There arethousands of news groups covering a huge variety of subjects, many relating toquality and training.
166 TRAINING FOR SIX SIGMA
^ ^ ^CHAPTER
5
Six Sigma TeamsSix Sigma teams working on projects are the primary means of deploying Six
Sigma and accomplishing the goals of the enterprise. Six Sigma teams are some-times lead by the Black Belt, but the team leader is often the Green Belt or aSix Sigma championwho has a passion for the project. Six Sigma teams are com-posed of groups of individuals who bring authority, knowledge, skills, abilitiesand personal attributes to the project. There is nothing particularly specialabout Six Sigma teams compared with other work teams. They are people withdifferent backgrounds and talents pursuing a common short-term goal. Like allgroups of people, there are dynamics involved that must be understood if themission of the team is to be accomplished. This chapter addresses the subjectof what members, Black Belts, Green Belts, sponsors, champions, facilitators,and leaders can do to assure that Six Sigma teams are successful. It is not adiscussion of project management techniques; these are covered elsewhere inthis book. Instead, this chapter focuses on:
. Stages in learning to work as a team
. The di¡erence between group maintenance roles and group task roles
. Identifying and encouraging productive roles essential to team success
. Identifying and discouraging counterproductive behavior on teams
. Facilitating team meetings
. Dealing constructively with con£icts
. Evaluating, recognizing and rewarding teams
SIX SIGMA TEAMSThe structure ofmodern organizations is based on the principle of division of
labor. Most organizations today consist of a number of departments, each
Copyright 2003 by The McGraw-Hill Companies, Inc. Click Here for Terms of Use.

devoted to their own specialty. A fundamental problem is that the separate func-tional departments tend to optimize their own operations, often to the detri-ment of the organization as a whole.Traditional organizations, in effect, create barriers between departments.
Departmental managers are often forced to compete for shares of limitedbudgets; in other words, they are playing a ‘‘zero sum game’’ where anothermanager’s gain is viewed as their department’s loss. Behavioral research hasshown that people engaged in zero sum games think in terms of win-lose. Thisleads to self-destructive, cut-throat behavior. Overcoming this tendencyrequires improved communication and cooperation between departments.Interdepartmental teams are groups of people with the skills needed to deli-
ver the value desired. Processes are designed by the team to create the value inan effective and efficient manner. Management must see to it that the neededskills exist in the organization. It is also management’s job to see that theyremove barriers to cooperation.There are two ways to make improvements: improve performance given the
current system, or improve the system itself. Much of the time improving per-formance given the current system can be accomplished by individuals workingalone. For example, an operator might make certain adjustments to themachine. Studies indicate that this sort of action will be responsible for about5%^15% of the improvements. The remaining 85%^95% of all improvementswill require changing the system itself. This is seldom accomplished by indivi-duals working alone. It requires group action. Thus, the vast majority of SixSigma improvement activity will take place in a group setting. As with nearlyeverything, the group process can be made more effective by acquiring a betterunderstanding of the way it works.
PROCESS IMPROVEMENT TEAMSManagement of cross-functional projects is discussed in Chapter 15. In this
section we will focus on the team aspect of process improvement activity.Process improvement teams focus on improving one or more important
characteristics of a process, e.g., quality, cost, cycle time, etc. The focus is on anentire process, rather than on a particular aspect of the process. A process is anintegrated chain of activities that add value. A process can be identified by itsbeginning and ending states, e.g., manufacturing’s beginning state is procure-ment, its ending state is shipment. Methods of analyzing and characterizingprocess are discussed throughout this book. Usually several departments areinvolved in any given value-added process.Process improvement teams work on both incremental improvement
(KAIZEN) and radical change (breakthrough). The team is composed of mem-
168 SIX SIGMA TEAMS

bers who work with the process on a routine basis. Team members typicallyreport to different bosses, and their positions can be on different levels of theorganization’s hierarchy.Process improvement projects must be approved by the process owner,
usually a senior leader in the organization. Process improvement teams mustbe chartered and authorized to pursue process improvement. All of this fallsin the area of project management. Project management is discussed inChapter 15.
WORK GROUPSWork groups focus on improvement within a particular work area. The work
area is usually contained within a single department or unit. The processowner is usually the department manager. Team members are usually at thesame level within the organization’s hierarchy and they usually report to oneboss.Work groupmembers are trained in the use of quality control techniques and
supported by management. The idea is that all workers have an important con-tribution to make to the quality effort and the work group is one mechanismfor allowing them the opportunity to make their contribution.
Quality circlesAn example of a work group is the quality circle. Quality circles originated
in Japan and Japanese companies continue to use quality circles on a massivescale. Quality circles were tried on a massive scale in America, with only lim-ited success. However, the quality circle is the historical forerunner of themodern quality improvement work team; a study of them reveals a greatdeal about the success factors needed for successful use of other types ofwork groups.Quality circles (circles) are local groups of employees who work to con-
tinuously improve those processes under their direct control. Here are somenecessary steps that must be completed before circles can succeed:
. Management from the top level to the supervisory level must have a clearidea of their organization’s purpose. Everyone in the organization mustbe committed to helping the organization achieve its purpose.
. Senior leadership must have an e¡ective organization for dealing withcompany-wide issues such as quality, cost, cycle time, etc. (e.g., the cross-functional form discussed earlier).
. Attention must be focused on processes rather than on internal politicsand reporting relationships.
Work Groups 169
. Personnel involved must be trained in cooperation skills (e.g., team work,group dynamics, communication and presentation skills). This applies toarea supervisors and managers, not just circle members.
. Personnel involved must be trained in problem-solving skills (e.g., thetraditional QC tools, the 7M tools, brainstorming, etc.).
. Circle participation must be encouraged by local management.This author believes that circles have an important place and that they can
succeed anywhere providing the proper corporate environment exists. Thisenvironment did not exist in Western business organizations in the 1970s, andfor the most part still does not exist. Merely grafting quality circles onto a tradi-tional command-and-control hierarchy won’t work. There were many reasonswhy quality circles failed in America; they are the same reasons why workgroups fail to this day.1. The quality circle in an American ¢rm was isolated, not part of a
company-wide quality control e¡ort. As a result, circles were usuallyunable to deal successfully with problems involving other areas of thecompany. There were no resources in other areas to draw upon.
2. Key management personnel moved about too frequently and circleswere not provided with consistent leadership and managementsupport.
3. Employees transferred in and out of circle work areas too frequently.Without stability in the membership, circles never developed into e¡ec-tive groups. Building e¡ective teams takes time.
OTHER SELF-MANAGED TEAMSIn addition to process-improvement teams and work groups, there are many
other types of teams and groups involved to some extent in Six Sigma. Self-man-aged teams are a way to reintegrate work and flatten themanagement hierarchy.If properly implemented and managed, the result can be improved quality andproductivity. If poorly implemented and managed, the result can be addedproblems.Self-managed teams are often given some of the responsibilities that, in tra-
ditional organizations, are reserved to management. This includes the authorityto plan and schedule work, hiring, performance assessment, etc. This is essen-tially a reversal of over 90 years of scientific management. While difficult toimplement successfully, the result is a leaner, more efficient organization,higher employeemorale, and better quality. Several preconditions are necessaryto assure success:
170 SIX SIGMA TEAMS

1. Communicate and listenLEncourage two-way, honest, open, frequentcommunication. The more informed employees are, the more secureand motivated they will be.
2. Train employeesLAn empowering culture is built on the bedrock ofcontinuing education in every form imaginable. If an employee doesn’tknow what to do, how to do it right, or most important, why it is donea certain way and what di¡erence it makes, don’t expect him to feel oract empowered.
3. Team employeesLNo one has found a technological alternative tocooperation when it comes to building a positive work climate. Teamsmake it possible for people to participate in decision-making and imple-mentation that directly a¡ects them.
4. Trust employeesLSupport team decisions even if they aren’t the out-comes you had in mind. Trust teams with information and allow themto fail.
5. FeedbackLFind people doing things right. Recognize e¡orts as well asresults by ¢nding ways to frequently and creatively say thank you.Share the glory in every way possible. Give frequent speci¢c perfor-mance feedback (good news as well as bad).
TEAM DYNAMICS MANAGEMENT, INCLUDINGCONFLICT RESOLUTION
Conflict management is a duty shared by the facilitator and the team leader.The facilitator can assist the leader by assuring that creative conflict is not re-pressed, but encouraged. Explore the underlying reasons for the conflict. If‘‘personality disputes’’ are involved that threaten to disrupt the team meeting,arrange one-on-one meetings between the parties and attend the meetings tohelp mediate.The first step in establishing an effective group is to create a consensus
decision rule for the group, namely:
No judgment may be incorporated into the group decision until it meets atleast tacit approval of every member of the group.
This minimum condition for group movement can be facilitated by adoptingthe following behaviors:
. Avoid arguing for your own position. Present it as lucidly and logically aspossible, but be sensitive to and consider seriously the reactions of thegroup in any subsequent presentations of the same point.
Team Dynamics Management, Including Conflict Resolution 171
. Avoid ‘‘win-lose’’ stalemates in the discussion of opinions. Discard thenotion that someone must win and someone must lose in the discussion;when impasses occur, look for the next most acceptable alternative forall the parties involved.
. Avoid changing your mind only to avoid con£ict and to reach agreementand harmony. Withstand pressures to yield which have no objective orlogically sound foundation. Strive for enlightened £exibility; but avoidoutright capitulation.
. Avoid con£ict-reducing techniques such as the majority vote, averaging,bargaining, coin-£ipping, trading out, and the like. Treat di¡erences ofopinion as indicative of an incomplete sharing of relevant informationon someone’s part, either about task issues, emotional data, or gut levelintuitions.
. View di¡erences of opinion as both natural and helpful rather than as a hin-drance in decision-making. Generally, the more ideas expressed, thegreater the likelihood of con£ict will be; but the richer the array ofresources will be as well.
. View initial agreement as suspect. Explore the reasons underlying appar-ent agreements; make sure people have arrived at the same conclusionsfor either the same basic reasons or for complementary reasons beforeincorporating such opinions into the group decision.
. Avoid subtle forms of in£uence and decision modi¢cation. E.g., when adissenting member ¢nally agrees, don’t feel that he must be rewarded byhaving his own way on some subsequent point.
. Be willing to entertain the possibility that your group can achieve all theforegoing and actually excel at its task. Avoid doomsaying and negativepredictions for group potential.
Collectively, the above steps are sometimes known as the ‘‘consensustechnique.’’ In tests it was found that 75% of the groups who wereinstructed in this approach significantly outperformed their best individualresources.
Stages in group developmentGroups of many different types tend to evolve in similar ways. It often helps
to know that the process of building an effective group is proceeding normally.Bruce W. Tuckman (1965) identified four stages in the development of a group:forming, storming, norming, and performing.During the forming stage a group tends to emphasize procedural matters.
Group interaction is very tentative and polite. The leader dominates the
172 SIX SIGMA TEAMS

decision-making process and plays a very important role in moving the groupforward.The storming stage follows forming. Conflict between members, and
betweenmembers and the leader, are characteristic of this stage. Members ques-tion authority as it relates to the group objectives, structure, or procedures. Itis common for the group to resist the attempts of its leader tomove them towardindependence. Members are trying to define their role in the group.It is important that the leader deal with the conflict constructively. There are
several ways in which this may be done:. Do not tighten control or try to force members to conform to theprocedures or rules established during the forming stage. If disputes overprocedures arise, guide the group toward new procedures based on agroup consensus.
. Probe for the true reasons behind the con£ict and negotiate a more accep-table solution.
. Serve as a mediator between group members.
. Directly confront counterproductive behavior.
. Continue moving the group toward independence from its leader.During the norming stage the group begins taking responsibility, or owner-
ship, of its goals, procedures, and behavior. The focus is on working togetherefficiently. Group norms are enforced on the group by the group itself.The final stage is performing.Members have developed a sense of pride in the
group, its accomplishments, and their role in the group. Members are confidentin their ability to contribute to the group and feel free to ask for or give assis-tance.
Common problemsTable 5.1 lists some common problemswith teams, along with recommended
remedial action (Scholtes, 1988).
Member roles and responsibilitiesPRODUCTIVE GROUP ROLESThere are two basic types of roles assumed by members of a group: task roles
and group maintenance roles. Group task roles are those functions concernedwith facilitating and coordinating the group’s efforts to select, define, andsolve a particular problem. The group task roles shown in Table 5.2 are generallyrecognized.
Team Dynamics Management, Including Conflict Resolution 173

174 SIX SIGMA TEAMS
Table 5.1. Common team problems and remedial action.
PROBLEM ACTION
Floundering � Review the plan� Develop a plan for movement
The expert � Talk to o¡ending party in private� Let the data do the talking� Insist on consensus decisions
Dominating participants � Structure participation� Balance participation� Act as gate-keeper
Reluctant participants � Structure participation� Balance participation� Act as gate-keeper
Using opinions instead offacts
� Insist on data� Use scienti¢c method
Rushing things � Provide constructive feedback� Insist on data� Use scienti¢c method
Attribution (i.e., attributingmotives to people withwhom we disagree)
� Don’t guess at motives� Use scienti¢c method� Provide constructive feedback
Ignoring some comments � Listen actively� Train team in listening techniques� Speak to o¡ending party in private
Wanderlust � Follow a written agenda� Restate the topic being discussed
Feuds � Talk to o¡ending parties in private� Develop or restate groundrules

Another type of role played in small groups are the group maintenance roles.Group maintenance roles are aimed at building group cohesiveness and group-centered behavior. They include those behaviors shown in Table 5.3.
Team Dynamics Management, Including Conflict Resolution 175
Table 5.2. Group task roles.
ROLE I.D. DESCRIPTION
Initiator Proposes new ideas, tasks, or goals; suggests procedures orideas for solving a problem or for organizing the group.
Information seeker Asks for relevant facts related to the problem beingdiscussed.
Opinion seeker Seeks clari¢cation of values related to problem orsuggestion.
Information giver Provides useful information about subject under discussion.
Opinion giver O¡ers his/her opinion of suggestions made. Emphasis is onvalues rather than facts.
Elaborator Gives examples.
Coordinator Shows relationship among suggestions; points out issues andalternatives.
Orientor Relates direction of group to agreed-upon goals.
Evaluator Questions logic behind ideas, usefulness of ideas, orsuggestions.
Energizer Attempts to keep the group moving toward an action.
Procedure technician Keeps group from becoming distracted by performing suchtasks as distributing materials, checking seating, etc.
Recorder Serves as the group memory.
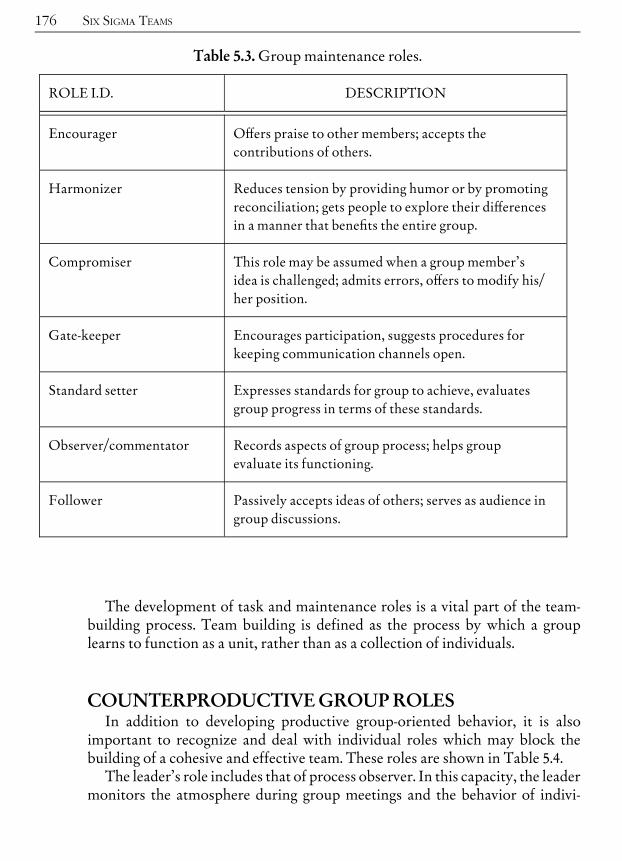
The development of task and maintenance roles is a vital part of the team-building process. Team building is defined as the process by which a grouplearns to function as a unit, rather than as a collection of individuals.
COUNTERPRODUCTIVE GROUP ROLESIn addition to developing productive group-oriented behavior, it is also
important to recognize and deal with individual roles which may block thebuilding of a cohesive and effective team. These roles are shown in Table 5.4.The leader’s role includes that of process observer. In this capacity, the leader
monitors the atmosphere during group meetings and the behavior of indivi-
176 SIX SIGMA TEAMS
Table 5.3. Group maintenance roles.
ROLE I.D. DESCRIPTION
Encourager O¡ers praise to other members; accepts thecontributions of others.
Harmonizer Reduces tension by providing humor or by promotingreconciliation; gets people to explore their di¡erencesin a manner that bene¢ts the entire group.
Compromiser This role may be assumed when a group member’sidea is challenged; admits errors, o¡ers to modify his/her position.
Gate-keeper Encourages participation, suggests procedures forkeeping communication channels open.
Standard setter Expresses standards for group to achieve, evaluatesgroup progress in terms of these standards.
Observer/commentator Records aspects of group process; helps groupevaluate its functioning.
Follower Passively accepts ideas of others; serves as audience ingroup discussions.

duals. The purpose is to identify counterproductive behavior. Of course, onceidentified, the leader must tactfully and diplomatically provide feedback to thegroup and its members. The success of Six Sigma is, to a great extent, dependenton the performance of groups.
MANAGEMENT’S ROLEPerhaps themost important thingmanagement can do for a group is to give it
time to become effective. This requires, among other things, that management
Team Dynamics Management, Including Conflict Resolution 177
Table 5.4. Counterproductive group roles.
ROLE I.D. DESCRIPTION
Aggressor Expresses disapproval by attacking the values, ideas, orfeelings of other. Shows jealousy or envy.
Blocker Prevents progress by persisting on issues that have beenresolved; resists attempts at consensus; opposes withoutreason.
Recognition-seeker Calls attention to himself/herself by boasting, relatingpersonal achievements, etc.
Confessor Uses group setting as a forum to air personal ideologiesthat have little to do with group values or goals.
Playboy Displays lack of commitment to group’s work bycynicism, horseplay, etc.
Dominator Asserts authority by interrupting others, using £attery tomanipulate, claiming superior status.
Help-seeker Attempts to evoke sympathy and/or assistance fromother members through ‘‘poor me’’ attitude.
Special-interest pleader Asserts the interests of a particular group. This group’sinterest matches his/her self-interest.
work to maintain consistent group membership. Group members must not bemoved out of the group without very good reason. Nor should there be a con-stant stream of new people temporarily assigned to the group. If a group is toprogress through the four stages described earlier in this chapter, to the crucialperforming stage, it will require a great deal of discipline from both the groupand management.Another area wheremanagementmust help is creating an atmosphere within
the company where groups can be effective.
FACILITATION TECHNIQUESWhen to use an outside facilitator
It is not always necessary to have an outside party facilitate a group or team.While facilitators can often be of benefit, they may also add cost and the use offacilitators should, therefore, be carefully considered. The following guidelinescan be used to determine if outside facilitation is needed (Schuman, 1996):1. Distrust or biasLIn situations where distrust or bias is apparent or sus-
pected, groups should make use of an unbiased outsider to facilitate(and perhaps convene) the group.
2. IntimidationLThe presence of an outside facilitator can encourage theparticipation of individuals who might otherwise feel intimidated.
3. RivalryLRivalries between individuals and organizations can bemitigated by the presence of an outside facilitator.
4. Problem de¢nitionLIf the problem is poorly de¢ned, or is de¢neddi¡erently by multiple parties, an unbiased listener and analyst canhelp construct an integrated, shared understanding of the problem.
5. Human limitsLBringing in a facilitator to lead the group process letsmembers focus on the problem at hand, which can lead to better results.
6. Complexity or noveltyLIn a complex or novel situation, a processexpert can help the group do a better job of working together intellec-tually to solve the problem.
7. TimelinesLIf a timely decision is required, as in a crisis situation, theuse of a facilitator can speed the group’s work.
8. CostLA facilitator can help the group reduce the cost of meetingLa signi¢cant barrier to collaboration.
Selecting a facilitatorFacilitators should possess four basic capabilities (Schuman, 1996):
178 SIX SIGMA TEAMS
1. He or she should be able to anticipate the complete problem-solving anddecision-making processes.
2. He or she should use procedures that support both the group’s social andcognitive process.
3. He or she should remain neutral regarding content issues and values.4. He or she should respect the group’s need to understand and learn from
the problem solving process.Facilitation works best when the facilitator:. Takes a strategic and comprehensive view of the problem-solving anddecision-making processes and selects, from a broad array, the speci¢cmethods that match the group’s needs and the tasks at hand.
. Supports the group’s social and cognitive processes, freeing the groupmembers to focus their attention on substantive issues.
. Is trusted by all group members as a neutral party who has no biases orvested interest in the outcome.
. Helps the group understand the techniques being used and helps thegroup improve its own problem-solving processes.
Principles of team leadership and facilitationHuman beings are social by nature. People tend to seek out the company of
other people. This is a great strength of our species, one that enabled us to riseabove and dominate beasts much larger and stronger than ourselves. It is thisability that allowed men to control herds of livestock to hunt swift antelope,and to protect themselves against predators. However, as natural as it is tobelong to a group, there are certain behaviors that can make the group functionmore (or less) effectively than their members acting as individuals.We will define a group as a collection of individuals who share one or more
common characteristics. The characteristic shared may be simple geography,i.e., the individuals are gathered together in the same place at the same time.Perhaps the group shares a common ancestry, like a family.Modern society con-sists of many different types of groups. The first group we join is, of course,our family. We also belong to groups of friends, sporting teams, churches,PTAs, and so on. The groups differ in many ways. They have different purposes,different time frames, and involve varying numbers of people. However, alleffective groups share certain common features. In their work, JoiningTogether, Johnson and Johnson (1999) list the following characteristics of aneffective group:
. Group goals must be clearly understood, be relevant to the needs of groupmembers, and evoke from every member a high level of commitment totheir accomplishment.
Facilitation Techniques 179

. Group members must communicate their ideas and feelings accuratelyand clearly. E¡ective, two-way communication is the basis of all groupfunctioning and interaction among group members.
. Participation and leadership must be distributed among members. Allshould participate, and all should be listened to. As leadership needsarise, members should all feel responsibility for meeting them. The equal-ization of participation and leadership makes certain that all memberswill be involved in the group’s work, committed to implementing thegroup’s decisions, and satis¢ed with their membership. It also assuresthat the resources of every member will be fully utilized, and increasesthe cohesiveness of the group.
. Appropriate decision-making procedures must be used £exibly if they areto be matched with the needs of the situation. There must be a balancebetween the availability of time and resources (such as member’s skills)and the method of decision-making used for making the decision. Themost e¡ective way of making a decision is usually by consensus (seebelow). Consensus promotes distributed participation, the equalizationof power, productive controversy, cohesion, involvement, and commit-ment.
. Power and in£uence need to be approximately equal throughout thegroup. They should be based on expertise, ability, and access to infor-mation, not on authority. Coalitions that help ful¢ll personal goals shouldbe formed among group members on the basis of mutual in£uence andinterdependence.
. Con£icts arising from opposing ideas and opinions (controversy) are to beencouraged . Controversies promote involvement in the group’s work,quality, creativity in decision-making, and commitment to implementingthe group’s decisions. Minority opinions should be accepted and used.Con£icts prompted by incompatible needs or goals, by the scarcity of aresource (money, power), and by competitiveness must be negotiated ina manner that is mutually satisfying and does not weaken the cooperativeinterdependence of group members.
. Group cohesion needs to be high. Cohesion is based on members likingeach other, each member’s desire to continue as part of the group, thesatisfaction of members with their group membership, and the level ofacceptance, support, and trust among the members. Group norms sup-porting psychological safety, individuality, creativeness, con£icts ofideas, growth, and change need to be encouraged.
. Problem-solving adequacy should be high. Problems must be resolvedwith minimal energy and in a way that eliminates them permanently.Procedures should exist for sensing the existence of problems, inventing
180 SIX SIGMA TEAMS

and implementing solutions, and evaluating the e¡ectiveness of the solu-tions. When problems are dealt with adequately, the problem-solving abil-ity of the group is increased, innovation is encouraged, and groupe¡ectiveness is improved.
. The interpersonal e¡ectiveness of members needs to be high.Interpersonal e¡ectiveness is a measure of how well the consequences ofyour behavior match intentions.
These attributes of effective groups apply regardless of the activity in whichthe group is engaged. It really doesn’t matter if the group is involved in a studyof air defense, or planning a prom dance. The common element is that there isa group of human beings engaged in pursuit of group goals.
Facilitating the group task processTeam activities can be divided into two subjects: task-related and main-
tenance-related. Task activities involve the reason the team was formed, itscharter, and its explicit goals.The facilitator should be selected before the team is formed and he or she
should assist in identifying potential team members and leaders, and in devel-oping the team’s charter. The subject of team formation and project charteringis discussed in detail in Chapter 15.The facilitator also plays an important role in helping the team develop spe-
cific goals based on their charter. Goal-setting is an art and it is not unusual tofind that team goals bear little relationship to what management actually hadin mind when the team was formed. Common problems are goals that are tooambitious, goals that are too limited and goals that assume a cause and effectrelationship without proof. An example of the latter would be a team charteredto reduce scrap assuming that Part X had the highest scrap loss (perhaps basedon a week’s worth of data) and setting as its goal the reduction of scrap for thatpart. The facilitator can provide a channel of communication between theteam and management.Facilitators can assist the team leader in creating a realistic schedule for the
team to accomplish its goals. The issue of scheduling projects is covered inChapter 15.Facilitators should assure that adequate records are kept on the team’s pro-
jects. Records should provide information on the current status of the project.Records should be designed to make it easy to prepare periodic status reportsfor management. The facilitator should arrange for clerical support with suchtasks as designing forms, scheduling meetings, obtaining meeting rooms, secur-ing audio visual equipment and office supplies, etc.
Facilitation Techniques 181

Other activities where the facilitator’s assistance is needed include:Meeting managementLSchedule the meeting well ahead of time. Be sure
that key people are invited and that they plan to attend. Prepare an agendaand stick to it! Start on time. State the purpose of the meeting clearly at theoutset. Take minutes. Summarize from time-to-time. Actively solicit inputfrom those less talkative. Curtail the overly talkative members. Manage con-flicts. Make assignments and responsibilities explicit and specific. End ontime.
CommunicationLThe idea that ‘‘the quality department’’ can ‘‘assure’’ or‘‘control’’ quality is now recognized as an impossibility. To achieve quality thefacilitator must enlist the support and cooperation of a large number of peopleoutside of the team. The facilitator can relay written and verbal communicationbetween the team and others in the organization. Verbal communication is valu-able even in the era of instantaneous electronic communication. A five minutephone call can provide an opportunity to ask questions and receive answersthat would take a week exchanging email and faxes. Also, the team meeting isjust one communication forum, the facilitator can assist teammembers in com-municating with one another between meetings by arranging one-on-one meet-ings, acting as a go-between, etc.
Facilitating the group maintenance processStudy the group process. The facilitator is in a unique position to stand
back and observe the group at work. Are some members dominating thegroup? Do facial expressions and body language suggest unspoken disagree-ment with the team’s direction? Are quiet members being excluded from thediscussion?When these problems are observed, the facilitator should provide feedback
and guidance to the team. Ask the quiet members for their ideas and input. Askif anyone has a problem with the team’s direction. Play devil’s advocate todraw out those with unspoken concerns.
TEAM PERFORMANCE EVALUATIONEvaluating team performance involves the same principles as evaluating
performance in general. Before one can determine how well the team’s taskhas been done, a baseline must be established and goals must be identified.Setting goals using benchmarking and other means is discussed elsewhere inthis book (see Chapter 2). Records of progress should be kept as the teampursues its goals.
182 SIX SIGMA TEAMS

Performance measures generally focus on group tasks, rather than on inter-nal group issues. Typically, financial performance measures show a paybackratio of between 2:1 and 8:1 on team projects. Some examples of tangibleperformance measures are:
. productivity
. quality
. cycle time
. grievances
. medical usage (e.g., sick days)
. absenteeism
. service
. turnover
. dismissals
. counseling usageMany intangibles can also be measured. Some examples of intangibles
effected by teams are:. employee attitudes. customer attitudes. customer compliments. customer complaintsThe performance of the team process should also be measured. Project
failure rates should be carefully monitored. A p chart can be used to evalu-ate the causes of variation in the proportion of team projects that succeed.Failure analysis should be rigorously conducted.Aubrey and Felkins (1988) list the effectiveness measures shown below:. leaders trained. number of potential volunteers. number of actual volunteers. percent volunteering. projects started. projects dropped. projects completed/approved. projects completed/rejected. improved productivity. improved work environment. number of teams. inactive teams. improved work quality. improved service. net annual savings
Team Performance Evaluation 183
TEAM RECOGNITION AND REWARDRecognition is a form of employee motivation in which the company iden-
tifies and thanks employees who have made positive contributions to the com-pany’s success. In an ideal company, motivation flows from the employees’pride of workmanship. When employees are enabled by management to dotheir jobs and produce a product or service of excellent quality, they will bemotivated.The reason recognition systems are important is not that they improve work
by providing incentives for achievement. Rather, they make a statement aboutwhat is important to the company. Analyzing a company’s employee recogni-tion system provides a powerful insight into the company’s values in action.These are the values that are actually driving employee behavior. They are notnecessarily the same as management’s stated values. For example, a companythat claims to value customer satisfaction but recognizes only sales achieve-ments probably does not have customer satisfaction as one of its values inaction.Public recognition is often better for two reasons:1. Some (but not all) people enjoy being recognized in front of their collea-
gues.2. Public recognition communicates a message to all employees about the
priorities and function of the organization.The form of recognition can range from a pat on the back to a small gift to a
substantial amount of cash. When substantial cash awards become an estab-lished pattern, however, it signals two potential problems:1. It suggests that several top priorities are competing for the employee’s
attention, so that a large cash award is required to control the employee’schoice.
2. Regular, large cash awards tend to be viewed by the recipients as part ofthe compensation structure, rather than as a mechanism for recognizingsupport of key corporate values.
Carder and Clark (1992) list the following guidelines and observationsregarding recognition:
Recognition is not a method by which management can manipulate employ-ees. If workers are not performing certain kinds of tasks, establishing a recogni-tion program to raise the priority of those tasks might be inappropriate.Recognition should not be used to get workers to do something they are not cur-rently doing because of conflicting messages from management. A more effec-tive approach is for management to first examine the current system ofpriorities. Only by working on the system can management help resolve theconflict.
184 SIX SIGMA TEAMS

Recognition is not compensation. In this case, the award must representa significant portion of the employee’s regular compensation to have sig-nificant impact. Recognition and compensation differ in a variety ofways:
. Compensation levels should be based on long-term considerations such asthe employee’s tenure of service, education, skills, and level of responsibil-ity. Recognition is based on the speci¢c accomplishments of individualsor groups.
. Recognition is £exible. It is virtually impossible to reduce pay levels oncethey are set, and it is di⁄cult and expensive to change compensation plans.
. Recognition is more immediate. It can be given in timely fashion andtherefore relate to speci¢c accomplishments.
. Recognition is personal. It represents a direct and personal contactbetween employee and manager. Recognition should not be carried outin such a manner that implies that people of more importance (managers)are giving something to people of less importance (workers).
Positive reinforcement is not always a goodmodel for recognition. Just becausethe manager is using a certain behavioral criterion for providing recognition, itdoesn’t mean that the recipient will perceive the same relationship betweenbehavior and recognition.
Employees should not believe that recognition is based primarily on luck. Anearly sign of this is cynicism. Employees will tell you that management saysone thing but does another.
Recognition meets a basic human need. Recognition, especially public recog-nition, meets the needs for belonging and self-esteem. In this way, recognitioncan play an important function in the workplace. According to AbrahamMaslow’s theory, until these needs for belonging and self-esteem are satisfied,self-actualizing needs such as pride in work, feelings of accomplishment,personal growth, and learning new skills will not come into play.
Recognition programs should not create winners and losers. Recognition pro-grams should not recognize one group of individuals time after time whilenever recognizing another group. This creates a static ranking system, with allof the problems discussed earlier.
Recognition should be given for efforts, not just for goal attainment.According to Imai (1986), a manager who understands that a wide varietyof behaviors are essential to the company will be interested in criteriaof discipline, time management, skill development, participation, morale,and communication, as well as direct revenue production. To be able toeffectively use recognition to achieve business goals, managers mustdevelop the ability to measure and recognize such process accomplish-ments.
Team Recognition and Reward 185

Employee involvement is essential in planning and executing a recognitionprogram. It is essential to engage in extensive planning before instituting arecognition program or before changing a bad one. The perceptions and expec-tations of employees must be surveyed.
186 SIX SIGMA TEAMS

^ ^ ^CHAPTER
6
Selecting and Tracking SixSigma Projects*
The best Six Sigma projects begin not inside the business but outside it,focused on answering the question: How can we make the customer morecompetitive?What is critical to the customer’s success? Learning the answerto that question and learning how to provide the solution is the only focuswe need.
Jack Welch, CEO, General Electric
This chapter covers the subject of Six Sigma project selection. Project man-agement, monitoring, results capture, and lessons learned capture and dissemi-nation are discussed in Chapter 15. Projects are the core activity drivingchange in the Six Sigma organization. Although change also takes place due toother efforts, such asKaizen, project-based change is the force that drives break-through and cultural transformation. In a typical Six Sigma organizationabout one percent of the workforce is engaged full time in change activities,and each of these change agents will complete between three and seven projectsin a year. In addition there are another five percent or so part-time changeagents, each of whom will complete about two smaller projects per year. Themathematics translate to about 500 major projects and 1,000 smaller projects
*Some of the material in this chapter is from The Six Sigma Project Planner, by Thomas Pyzdek.# 2003 by McGraw-Hill.
Copyright 2003 by The McGraw-Hill Companies, Inc. Click Here for Terms of Use.
in an organization with 10,000 employees in any given year. Clearly, learninghow to effectively deal with projects is critical to Six Sigma success.
CHOOSING THE RIGHT PROJECTSProjects must be focused on the right goals. This is the responsibility of the
senior leadership, e.g., the project sponsor, Executive Six Sigma Council orequivalent group. Senior leadership is the only group with the necessary author-ity to designate cross-functional responsibilities and allow access to interdepart-mental resources. Six Sigma projects will impact one of the major stakeholdergroups: customers, shareholders, or employees. Although it is possible to calcu-late the impact of any given project on all three groups, I recommend that initi-ally projects be evaluated separately for each group. This keeps the analysisrelatively simple and assures that a good stakeholder mix is represented in theproject portfolio.
Customer value projectsMany, if notmost Six Sigma projects are selected because they have a positive
impact on customers. To evaluate such projects one must be able to determinethe linkage between business processes and customer-perceived value. Chapter3 discussed how to create organizations that are customer-driven, which isessential. Customer-driven organizations, especially process enterprises, focuson customer value as a matter of routine. This focus will generate many SixSigma customer value projects in the course of strategy deployment. However,in addition to the strategy-based linkage of Six Sigma projects described inChapter 3, there is also a need to use customer demands directly to generatefocused Six Sigma projects. The techniques for obtaining this linkage are thesame as those used in Chapter 3. The difference is that the focus here is not onstrategy deployment or budgeting, but on Six Sigma improvement projectsfocused on specific customer demands.Learning what customers value is primarily determined by firsthand contact
with customers through customer focus groups, interviews, surveys, etc. Theconnection between customer-perceived value and business processes, or ‘‘cus-tomer value streams,’’ is established through business process mapping (seeChapter 8) and quality function deployment (QFD). The Executive Six SigmaCouncil and project sponsors should carefully review the results of these effortsto locate the ‘‘lever points’’ where Six Sigma projects will have the greatestimpact on customer value.
188 SELECTING AND TRACKING SIX SIGMA PROJECTS
Shareholder value projectsSix Sigma provides a ‘‘double-whammy’’ by addressing both efficiency and
revenues. Revenue is impacted by improving the customer value proposition,which allows organizations to charge premium prices for superior quality, or tokeepprices competitive and increase sales volumeandmarket share due to super-ior quality. Improved efficiency is achieved by reducing the cost of poor quality,reducing cycle time, or eliminating waste in business processes. To determinewhichSixSigmaprojects address the issueof business process efficiency evaluatethe high-level business process maps (including SIPOC) and flow charts.
Other Six Sigma projectsSome Six Sigma projects address intangibles, such as employee morale, regu-
latory concerns, or environmental issues. These projects can be just as impor-tant as those which address customer or shareholder value.
ANALYZING PROJECT CANDIDATESYou now have a list of candidate Six Sigma projects. Assuming that the orga-
nization has limited resources, the next task is to select a subset of these projectsto fund and staff.Projects cost money, take time, and disrupt normal operations and standard
routines. For these reasons projects designed to improve processes should belimited to processes that are important to the enterprise. Furthermore, projectsshould be undertaken only when success is highly likely. Feasibility is deter-mined by considering the scope and cost of a project and the support it receivesfrom the process owner. In this section a number of techniques and approachesare presented to help identify those projects that will be chosen for Six Sigma.
Benefit-cost analysisBenefit-cost analysis can be as elaborate or as simple as the magnitude of the
project expenditures demands. The Six Sigma manager is advised that mostsuch analyses are easier to ‘‘sell’’ to senior management if done by (or reviewedand approved by) experts in the finance and accounting department. The plainfact is that the finance department has credibility in estimating cost and benefitthat the Six Sigma department, and any other department, lacks. The bestapproach is to get the finance department to conduct the benefit-cost analysiswith support from the other departments involved in the project. We will pro-vide an overview of some principles and techniques that are useful in benefit-cost analysis.
Analyzing Project Candidates 189

A fundamental problem with performing benefit-cost analysis is that, in gen-eral, it is easier to accurately estimate costs than benefits. Costs can usually bequantified in fairly precise terms in a budget. Costs are claims on resources thefirm already has. In contrast, benefits are merely predictions of future events,which may or may not actually occur. Also, benefits are often stated in unitsother than dollars, making the comparison of cost and benefit problematic. Theproblem is especially acute where quality improvement projects are concerned.For example, a proposed project may involve placing additional staff on a custo-mer ‘‘hot line.’’ The cost is easy to compute: X employees at a salary of $Y each,equipment, office space, supervision, etc. The benefit is much more difficult todetermine. Perhaps data indicate that average time on hold will be improved,but the amount of the improvement and the probability that it will occur arespeculations. Even if the time-on-hold improvement were precise, the impacton customer satisfactionwould be an estimate. And the association between cus-tomer satisfaction and revenues is yet another estimate. Still, the intelligentman-ager will realize that despite these difficulties, reasonable cause-and-effectlinkages can be established to form the basis for benefit-cost analysis. Such isoften the best one can expect. To compensate for the uncertainties associatedwith estimates of benefits, itmakes sense to demand a relatively high ratio of ben-efit to cost. For example, it is not unusual to have senior leadership demand aROI of 100% in the first year on a Six Sigma project. Rather than becoming dis-tressed at this ‘‘injustice,’’ the Black Belt should realize that such demands are aresponse to the inherent difficulties in quantifying benefits.
A system for assessing Six Sigma projectsAssessing Six Sigma projects is an art as well as a science. It is also critical to
the success of Six Sigma, and to the individual Black Belt. Far too many BlackBelts fail because they are not discriminating enough in their selection of pro-jects. If project selection is systematically sloppy, the entire Six Sigma effortcan fail.The approach offered here is quantitative in the sense that numbers are deter-
mined and an overall project score calculated. It is subjective to a degree becauseit requires interpretation of the situation, estimating probabilities, costs, andcommitments, etc. However, the rigor that goes with completing this assess-ment process will help youmake better judgments regarding projects. The num-bers (weights, scores, acceptable length of projects, dollar cutoffs, etc.) arestrictly my own personal judgments; feel free to assign your own values orthose of your leadership. The scale ranges from 0 to 9 for each criterion, andthe weights sum to 1.00, so the highest possible weighted score for a project is 9.
190 SELECTING AND TRACKING SIX SIGMA PROJECTS

The Six Sigma department or Process Excellence function can compile sum-mary listings of project candidates from these assessments. Sorting the list indescending order provides a guide to the final decision as to which projects topursue. Each Black Belt or Green Belt will probably have their own list, whichcan also be sorted and used to guide their choices.
Analyzing Project Candidates 191
Worksheet 1. Six Sigma project evaluation.
Project Name: Date of Assessment:
Black Belt: Master Black Belt:
Weighted Overall Project Score: Project Number:
Criteria Score WeightWeightedScore*
1. Sponsorship 0.23
2. Benefits (specify main beneficiary)& 2.1 External Customer:& 2.2 Shareholder:& 2.3 Employee or internal customer:& 2.4 Other (e.g., supplier, environment):
OverallBenefit Score
0.19
3. Availability of resources other than team 0.16
4. Scope in terms of Black Belt Effort 0.12
5. Deliverable 0.09
6. Time to complete 0.09
7. Team membership 0.07
8. Project Charter 0.03
9. Value of Six Sigma Approach 0.02
TOTAL (sum of weighted score column) 1.00
Note: Any criterion scores of zero must be addressed before project is approved.
*Weighted score¼ project’s score for each criterion times the weight.

192 SELECTING AND TRACKING SIX SIGMA PROJECTS
Worksheet 2. Six Sigma project evaluation guidelines.
1.0 Sponsorship
Score Interpretation
9 Director-level sponsor identified, duties specified and sufficienttime committed and scheduled
3 Director-level sponsor identified, duties specified and sufficienttime committed but not scheduled
1 Willing Director-level sponsor who has accepted charterstatement
0 Director-level sponsor not identified, or sponsor has notaccepted the charter
2.0 Stakeholder Benefits*‘‘Tangible and verifiable benefits for a major stakeholder’’
2.1 Stakeholder: External Customer2.1.1 Customer Satisfaction
Score Interpretation
9 Substantial and statistically significant increase in overallcustomer satisfaction or loyalty
3 Substantial and statistically significant increase in amajorsubcategory of customer satisfaction
1 Substantial and statistically significant increase in a focusedarea of customer satisfaction
0 Unclear or non-existent customer satisfaction impact
*Note: Several stakeholder benefit categories are shown in section 2. At least one stakeholder category is required. Show ben-
efit scores for each category, then use your judgment to determine an overall benefit score for the project.
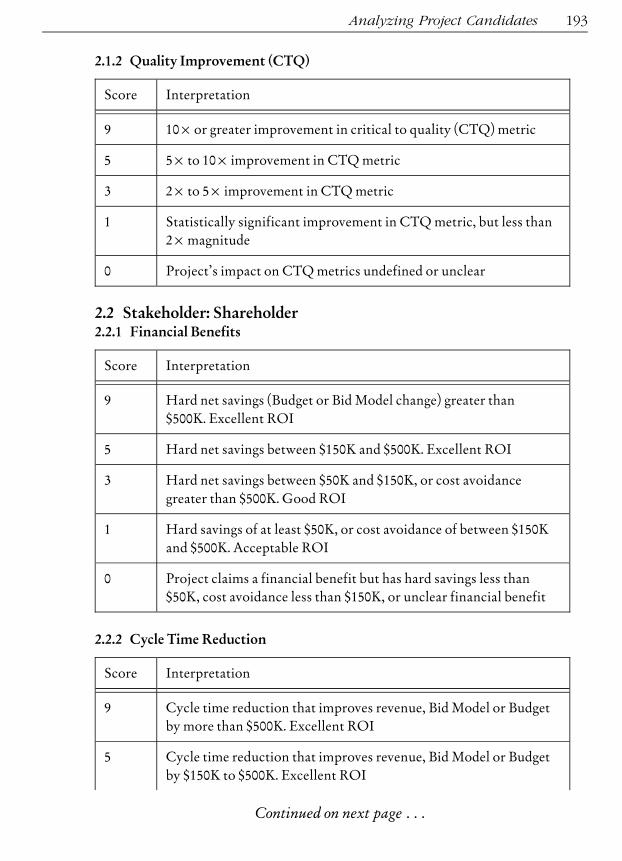
Analyzing Project Candidates 193
2.1.2 Quality Improvement (CTQ)
Score Interpretation
9 10� or greater improvement in critical to quality (CTQ) metric
5 5� to 10� improvement in CTQmetric
3 2� to 5� improvement in CTQmetric
1 Statistically significant improvement in CTQmetric, but less than2�magnitude
0 Project’s impact on CTQmetrics undefined or unclear
2.2 Stakeholder: Shareholder2.2.1 Financial Benefits
Score Interpretation
9 Hard net savings (Budget or Bid Model change) greater than$500K. Excellent ROI
5 Hard net savings between $150K and $500K. Excellent ROI
3 Hard net savings between $50K and $150K, or cost avoidancegreater than $500K. Good ROI
1 Hard savings of at least $50K, or cost avoidance of between $150Kand $500K. Acceptable ROI
0 Project claims a financial benefit but has hard savings less than$50K, cost avoidance less than $150K, or unclear financial benefit
2.2.2 Cycle Time Reduction
Score Interpretation
9 Cycle time reduction that improves revenue, Bid Model or Budgetby more than $500K. Excellent ROI
5 Cycle time reduction that improves revenue, Bid Model or Budgetby $150K to $500K. Excellent ROI
Continued on next page . . .

194 SELECTING AND TRACKING SIX SIGMA PROJECTS
3 Cycle time reduction that improves revenue, Bid Model or Budgetby $50K to $150K, or creates a cost avoidance of more than $500K.Good ROI
1 Cycle time reduction that results in cost avoidance between $150Kand $500K. Acceptable ROI
0 Project claims a cycle time improvement but has hard savings lessthan $50K, cost avoidance less than $150K, or unclear financialbenefit from the improvement in cycle time
2.2.3 Revenue Enhancement
Score Interpretation
9 Significant increase in revenues, excellent ROI
3 Moderate increase in revenues, good ROI
1 Increase in revenues with acceptable ROI
0 Unclear or non-existent revenue impact
2.3 Stakeholder: Employee or Internal Customer2.3.1 Employee Satisfaction
Score Interpretation
9 Substantial and statistically significant increase in overallemployee satisfaction
3 Substantial and statistically significant increase in a major elementof employee satisfaction
1 Substantial and statistically significant increase in a focused areaof employee satisfaction
0 Unclear or non-existent employee satisfaction impact
2.2.2 (cont.)

Analyzing Project Candidates 195
2.4 Stakeholder: Other2.4.1 Specify Stakeholder: _____________________________________________________________________________________________________________________________________________
Benefits
Score Interpretation
9
5
3
1
0 Unclear or non-existent benefit
3.0 Availability of Resources Other Than Team
Score Interpretation
9 Needed resources available when needed
3 Limited or low priority access to needed to resources
0 Resources not available, or excessive restrictions on access toresources

196 SELECTING AND TRACKING SIX SIGMA PROJECTS
4.0 Scope in Terms of Black Belt Effort
Score Interpretation
9 Projected return substantially exceeds required return
3 Projected return exceeds required return
1 Projected return approximately equals required return
0 Projected return not commensurate with required return
Required return can be calculated as follows:*
(1) Length of project (months) = ____________________________________________________________________________
(2) Proportion of Black Belt’s time required (between 0 and 1) = ________________________________
(3) Probability of success (between 0 and 1) = ___________________________________
Required return** = $83,333� (1)� (2) (3) = $ ______________________________________________
Projected return: $________________________________________
5.0 Deliverable (Scope)
Score Interpretation
9 New or improved process, product or service to be created isclearly and completely defined
3 New or improved process, product or service to be created isdefined
0 Deliverable is poorly or incorrectly defined. For example, a‘‘deliverable’’ that is really a tool such as a process map
*Thanks to Tony Lin of Boeing Satellite Systems for this algorithm.
**Based on expected Black Belt results of $1million/year.

Analyzing Project Candidates 197
6.0 Time to Complete
Score Interpretation
9 Results realized in less than 3 months
3 Results realized in between 3 and 6 months
1 Results realized in 7 to 12 months
0 Results will take more than 12 months to be realized
7.0 Team Membership
Score Interpretation
9 Correct team members recruited and time commitments scheduled
3 Correct team members recruited, time committed but notscheduled
1 Correct team members recruited
0 Teammembers not recruited or not available
8.0 Project Charter
Score Interpretation
9 All elements of the project charter are complete and acceptable.Linkage between project activities and deliverable is clear
3 Project charter acceptable with minor modifications
0 Project charter requires major revisions
9.0 Value of Six Sigma Approach (DMAIC or equivalent)
Score Interpretation
9 Six Sigma approach essential to the success of the project. BlackBelt/Green Belt skill set required for success
3 Six Sigma approach helpful but not essential. Black Belt/GreenBelt skill set can be applied
0 Usefulness of Six Sigma approach not apparent. Specific Black Beltor Green Belt skills are not necessary

Other methods of identifying promisingprojects
Projects should be selected to support the organization’s overall strategyand mission. Because of this global perspective most projects involve theefforts of several different functional areas. Not only do individual projectstend to cut across organizational boundaries, different projects are oftenrelated to one another. To effectively manage this complexity it is necessaryto integrate the planning and execution of projects across the entire enter-prise. One way to accomplish this is QFD, which is discussed in detail else-where in this book (see Chapter 3, ‘‘Using QFD to link Six Sigma projectsto strategies’’). In addition to QFD and the scoring method described above,a number of other procedures are presented here to help identify a project’spotential worth.
USING PARETO ANALYSIS TO IDENTIFY SIX SIGMAPROJECT CANDIDATES
Pareto principle refers to the fact that a small percentage of processescause a large percentage of the problems. The Pareto principle is useful innarrowing a list of choices to those few projects that offer the greatestpotential (see Chapter 8). When using Pareto analysis keep in mind thatthere may be hidden ‘‘pain signals.’’ Initially problems create pain signalssuch as schedule disruptions and customer complaints. Often these symp-toms are treated rather than their underlying ‘‘diseases’’; for example, ifquality problems cause schedule slippages which lead to customer com-plaints, the ‘‘solution’’ might be to keep a large inventory and sort thegood from the bad. The result is that the schedule is met and customersstop complaining, but at huge cost. These opportunities are often greaterthan those currently causing ‘‘pain,’’ but they are now built into businesssystems and therefore very difficult to see. One solution to the hidden pro-blem phenomenon is to focus on processes rather than symptoms. Someguidelines for identifying dysfunctional processes for potential improve-ment are shown in Table 6.1.The ‘‘symptom’’ column is useful in identifying problems and setting priori-
ties. The ‘‘disease’’ column focuses attention on the underlying causes of theproblem, and the ‘‘cure’’ column is helpful in chartering quality improvementproject teams and preparing mission statements.
198 SELECTING AND TRACKING SIX SIGMA PROJECTS

PRIORITIZING PROJECTS WITH THE PARETOPRIORITY INDEXAfter a serious search for improvement opportunities the organization’s lea-
ders will probably find themselves with more projects to pursue than theyhave resources. The Pareto Priority Index (PPI) is a simple way of prioritizingthese opportunities. The PPI is calculated as follows (Juran and Gryna, 1993,p. 49):
PPI ¼ Savings � probability of success
Cost � time to completion (years)ð6:1Þ
Analyzing Project Candidates 199
Table 6.1. Dysfunctional process symptoms and underlying diseases.
Symptom Disease Cure
Extensive informationexchange, data redundancy,rekeying
Arbitrary fragmentation ofa natural process
Discover why people needto communicate with eachother so often; integratethe process
Inventory, buffers, andother assets stockpiled
System slack to cope withuncertainty
Remove the uncertainty
High ratio of checking andcontrol to value-addedwork (excessive test andinspection, internalcontrols, audits, etc.)
Fragmentation Eliminate thefragmentation, integrateprocesses
Rework and iteration Inadequate feedback in along work process
Process control
Complexity, exceptions andspecial causes
Accretion onto a simplebase
Uncover original ‘‘clean’’process and create newprocess(es) for specialsituations; eliminateexcessive standardizationof processes

A close examination of the PPI equation shows that it is related to returnon investment adjusted for probability of success. The inputs are, of course,estimates and the result is totally dependent on the accuracy of the inputs.The resulting number is an index value for a given project. The PPI valuesallow comparison of various projects. If there are clear standouts the PPIcan make it easier to select a project. Table 6.2 shows the PPIs for severalhypothetical projects.
The PPI indicates that resources be allocated first to reducing wave solderdefects, then to improving NC machine capability, and so on. The PPI maynot always give such a clear ordering of priorities. When two or more projectshave similar PPIs a judgment must be made on other criteria.
200 SELECTING AND TRACKING SIX SIGMA PROJECTS
Table 6.2. Illustration of the Pareto Priority Index (PPI).
ProjectSavings $thousands Probability
Cost, $thousands Time, years PPI
Reduce wavesolder defects50%
$70 0.7 $25 0.75 2.61
NCmachinecapabilityimprovement
$50 0.9 $20 1.00 2.25
ISO 9001certification
$150 0.9 $75 2.00 0.90
Eliminatecustomerdeliverycomplaints
$250 0.5 $75 1.50 1.11
Reduceassemblydefects 50%
$90 0.7 $30 1.50 1.40

Throughput-based project selectionWhile careful planning and management of projects is undeniably impor-
tant, they matter little if the projects being pursued have no impact on the bot-tom line (throughput). As you will see below, if you choose the wrong projectsit is possible to make big ‘‘improvements’’ in quality and productivity thathave no impact whatever on the organization’s net profit. Selecting which pro-jects to pursue is of critical importance. In this section we will use the theoryof constraints (TOC) to determine which project(s) to pursue.
THEORY OF CONSTRAINTSEvery organization has constraints. Constraints come in many forms. When
a production or service process has a resource constraint (i.e., it lacks a sufficientquantity of some resource to meet the market demand), then the sequence ofimprovement projects should be identified using very specific rules. Accordingto Eliyahu M. Goldratt (1990), the rules are:1. Identify the system’s constraint(s). Consider a ¢ctitious company that
produces only two products, P and Q (Figure 6.1). The market demandfor P is 100 units per week and P sells for $90 per unit. The marketdemand for Q is 50 units per week and Q sells for $100 per unit.Assume that A, B, C and D are workers who have di¡erent non-inter-
Analyzing Project Candidates 201
Figure 6.1. A simple process with a constraint.
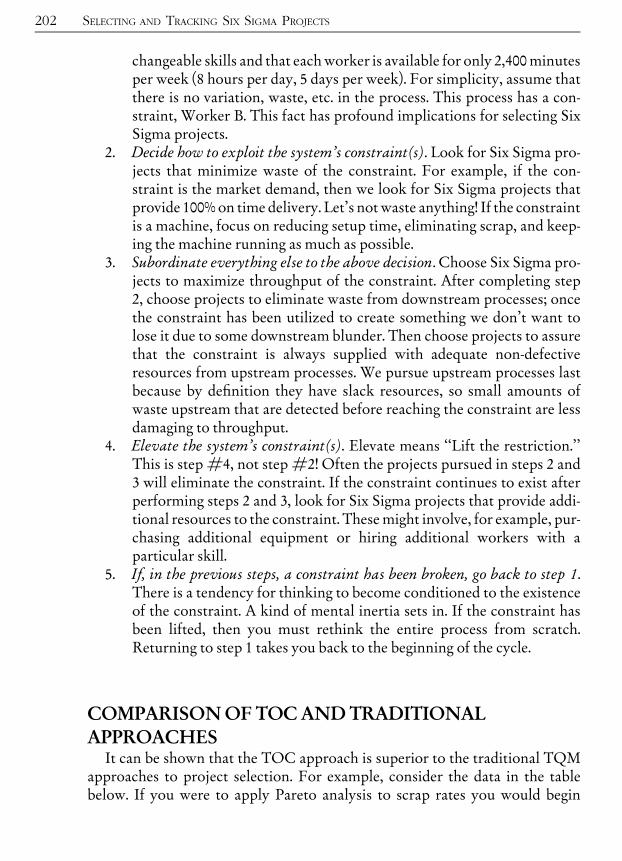
changeable skills and that eachworker is available for only 2,400minutesper week (8 hours per day, 5 days per week). For simplicity, assume thatthere is no variation, waste, etc. in the process. This process has a con-straint, Worker B. This fact has profound implications for selecting SixSigma projects.
2. Decide how to exploit the system’s constraint(s). Look for Six Sigma pro-jects that minimize waste of the constraint. For example, if the con-straint is the market demand, then we look for Six Sigma projects thatprovide 100% on time delivery. Let’s not waste anything! If the constraintis a machine, focus on reducing setup time, eliminating scrap, and keep-ing the machine running as much as possible.
3. Subordinate everything else to the above decision. Choose Six Sigma pro-jects to maximize throughput of the constraint. After completing step2, choose projects to eliminate waste from downstream processes; oncethe constraint has been utilized to create something we don’t want tolose it due to some downstream blunder. Then choose projects to assurethat the constraint is always supplied with adequate non-defectiveresources from upstream processes. We pursue upstream processes lastbecause by de¢nition they have slack resources, so small amounts ofwaste upstream that are detected before reaching the constraint are lessdamaging to throughput.
4. Elevate the system’s constraint(s). Elevate means ‘‘Lift the restriction.’’This is step #4, not step #2! Often the projects pursued in steps 2 and3 will eliminate the constraint. If the constraint continues to exist afterperforming steps 2 and 3, look for Six Sigma projects that provide addi-tional resources to the constraint. Thesemight involve, for example, pur-chasing additional equipment or hiring additional workers with aparticular skill.
5. If, in the previous steps, a constraint has been broken, go back to step 1.There is a tendency for thinking to become conditioned to the existenceof the constraint. A kind of mental inertia sets in. If the constraint hasbeen lifted, then you must rethink the entire process from scratch.Returning to step 1 takes you back to the beginning of the cycle.
COMPARISON OF TOC AND TRADITIONALAPPROACHESIt can be shown that the TOC approach is superior to the traditional TQM
approaches to project selection. For example, consider the data in the tablebelow. If you were to apply Pareto analysis to scrap rates you would begin
202 SELECTING AND TRACKING SIX SIGMA PROJECTS

with Six Sigma projects that reduced the scrap produced by Worker A. In fact,assuming the optimum product mix, Worker A has about 25% slack time, sothe scrap loss can be made up without shutting downWorker B, who is the con-straint. The TOC would suggest that the scrap loss of Worker B and the down-stream processes C and D be addressed first, the precise opposite of whatPareto analysis recommends.
Process Scrap Rates.
Process A B C D
Scrap Rate 8% 3% 5% 7%
Of course, before making a decision as to which projects to finance cost/ben-efit analyses are still necessary, and the probability of the project succeedingmust be estimated. But by using the TOC you will at least know where to lookfirst for opportunities.
USING CONSTRAINT INFORMATION TO FOCUS SIXSIGMA PROJECTSApplying the TOC strategy described above tells us where in the process to
focus. Adding CTx information (see Table 6.3) can help tell us which type ofproject to focus on, i.e., should we focus on quality, cost or schedule projects?Assume that you have three Six Sigma candidate projects, all focusing on pro-cess step B, the constraint. The area addressed is correct, but which projectshould you pursue first? Let’s assume that we learn that one project will primar-ily improve quality, another cost, and another schedule. Does this new informa-tion help? Definitely! Take a look at Table 6.3 to see how this information canbe used. Projects in the same priority group are ranked according to their impacton throughput.The same thought process can be applied to process steps before and after the
constraint. The results are shown in Table 6.4.Note that Table 6.4 assumes that projects before the constraint do not
result in problems at the constraint. Remember, impact should always bemeasured in terms of throughput. If a process upstream from the constrainthas an adverse impact on throughput, then it can be considered to be a con-straint. If an upstream process average yield is enough to feed the constrainton the average, it may still present a problem. For example, an upstream pro-cess producing 20 units per day with an average yield of 90% will produce,on average, 18 good units. If the constraint requires 18 units, things will be
Analyzing Project Candidates 203

204 SELECTING AND TRACKING SIX SIGMA PROJECTS
Table 6.3. Throughput priority of CTx projects that a¡ect the constraint.
ProjectType Discussion
CTQ Any unit produced by the constraint is especially valuable because if it is lostas scrap additional constraint time must be used to replace it or rework it.Since constraint time determines throughput (net profit of the entire system),the loss far exceeds what appears on scrap and rework reports. CTQ projectsat the constraint are the highest priority.
CTS CTS projects can reduce the time it takes the constraint to produce a unit,which means that the constraint can produce more units. This directlyimpacts throughput. CTS projects at the constraint are the highest priority.
CTC Since the constraint determines throughput, the cost of the constraint goingdown is the lost throughput of the entire system. This makes the cost ofconstraint down time extremely high. The cost of operating the constraint isusually miniscule by comparison. Also, CTC projects often have an adverseimpact on quality or schedule. Thus, CTC projects at the constraint are lowpriority.
Table 6.4. Project throughput priority versus project focus.
Focus of Six Sigma Project
CTX:
Characteristicaddressed iscritical to . . .
Before theconstraint
At theconstraint
After theconstraint
Quality (CTQ) ~ 8 8
Cost (CTC) * ~ *
Schedule (CTS) ~ 8 *
~ Low throughput priority.*Moderate throughput priority.8High throughput priority.

okay about 50% of the time, but the other 50% of the time things won’t beokay. One solution to this problem is to place a work-in-process (WIP) inven-tory between the process and the constraint as a safety buffer. Then on thosedays when the process yield is below 18 units, the inventory can be used tokeep the constraint running. However, there is a cost associated with carryinga WIP inventory. A Six Sigma project that can improve the yield will reduceor eliminate the need for the inventory and should be considered even if itdoesn’t impact the constraint directly, assuming the benefit-cost analysis justi-fies the project. On the other hand, if an upstream process can easily makeup any deficit before the constraint needs it, then a project for the processwill have a low priority.Knowing the project’s throughput priority will help you make better
project selection decisions by helping you select from among project candi-dates. Of course, the throughput priority is just one input into the projectselection process, other factors may lead to a different decision. For example,impact on other projects, a regulatory requirement, a better payoff in thelong-term, etc.
Multi-tasking and project schedulingA Six Sigma enterprise will always have more projects to pursue than it has
resources to do them. The fact that resources (usually Black Belts or GreenBelts) are scarce means that projects must be scheduled, i.e., some projectsmust be undertaken earlier than others. In such situations it is tempting to usemulti-tasking of the scarce resource. Multi-tasking is defined as the assignmentof a resource to several priorities during the same period of time. The logic isthat by working on several projects or assignments simultaneously, the entireportfolio of work will be done more quickly. However, while this is true forindependent resources working independent projects or subprojects in parallel,it is not true when applied to a single resource assigned to multiple projects orinterdependent tasks within a project.Consider the following situation. You have three Six Sigma projects, A, B,
and C. A single-tasking solution is to first do A, then B, and then C. Here’s thesingle-activity project schedule.
A(Complete in wk. 10)
B(Complete in wk. 20)
C(Complete in wk. 30)
If each project takes 10 weeks to complete, then A will be completed in 10weeks, B in 20 weeks, and C in 30 weeks. The average time to complete the
Analyzing Project Candidates 205
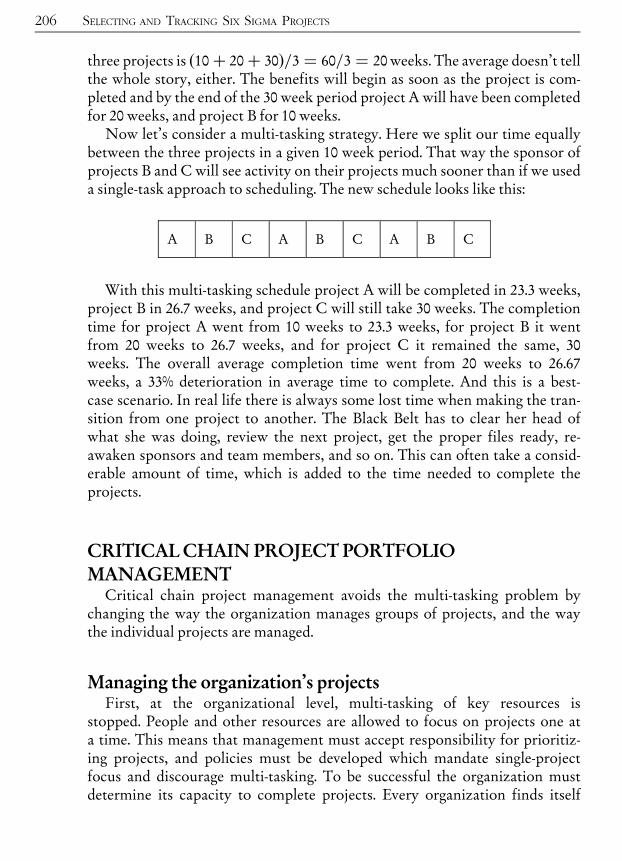
three projects is ð10þ 20þ 30Þ=3 ¼ 60=3 ¼ 20 weeks. The average doesn’t tellthe whole story, either. The benefits will begin as soon as the project is com-pleted and by the end of the 30 week period project A will have been completedfor 20 weeks, and project B for 10 weeks.Now let’s consider a multi-tasking strategy. Here we split our time equally
between the three projects in a given 10 week period. That way the sponsor ofprojects B and C will see activity on their projects much sooner than if we useda single-task approach to scheduling. The new schedule looks like this:
A B C A B C A B C
With this multi-tasking schedule project A will be completed in 23.3 weeks,project B in 26.7 weeks, and project C will still take 30 weeks. The completiontime for project A went from 10 weeks to 23.3 weeks, for project B it wentfrom 20 weeks to 26.7 weeks, and for project C it remained the same, 30weeks. The overall average completion time went from 20 weeks to 26.67weeks, a 33% deterioration in average time to complete. And this is a best-case scenario. In real life there is always some lost time when making the tran-sition from one project to another. The Black Belt has to clear her head ofwhat she was doing, review the next project, get the proper files ready, re-awaken sponsors and team members, and so on. This can often take a consid-erable amount of time, which is added to the time needed to complete theprojects.
CRITICAL CHAIN PROJECT PORTFOLIOMANAGEMENTCritical chain project management avoids the multi-tasking problem by
changing the way the organization manages groups of projects, and the waythe individual projects are managed.
Managing the organization’s projectsFirst, at the organizational level, multi-tasking of key resources is
stopped. People and other resources are allowed to focus on projects one ata time. This means that management must accept responsibility for prioritiz-ing projects, and policies must be developed which mandate single-projectfocus and discourage multi-tasking. To be successful the organization mustdetermine its capacity to complete projects. Every organization finds itself
206 SELECTING AND TRACKING SIX SIGMA PROJECTS

with more opportunities than it can successfully pursue with finiteresources. This means that only a select portfolio of projects should beundertaken in any time interval. The constraining resource is usually a keyposition in the organization, say the time available by project sponsors, engi-neers, programmers, etc. This information can be used to determine organi-zational capacity and to schedule project start dates according to theavailability of the key resource. This is called project launch synchronizationand the scarce resource that paces the project system is called a synchronizerresource.
Synchronizer resource usageCritical chain project management does not permit multi-tasking of scarce
resources. People and equipment that are fully utilized on projects, synchroni-zer resources, are assigned to a sequence of single projects. The sequence ofprojects is based on enterprise priorities. If a project requires one or more syn-chronizer resources it is vital that your project start dates integrate the sche-dules of these resources. In particular, this will require that those activitiesthat require time from a synchronizer resource (and the project as a whole)stipulate ‘‘Start no earlier than’’ dates. Although synchronizer resources areprotected by capacity buffers and might hypothetically start at a date earlierthan specified, the usual practice is to utilize any unplanned excess capacityto allow the organization to pursue additional opportunities, thereby increas-ing the organization’s capacity to complete projects. Note that humanresources are defined in terms of the skills required for the activity, not interms of individual people. In fact, the resource manager should refrain fromassigning an activity to an individual until all predecessors have been com-pleted and the activity is ready to begin. This precludes the temptation tomulti-task as the individual looks ahead and sees the activity start date draw-ing near.Project start dates are determined by beginning with the highest priority
project and calculating the end date for the synchronizing resource basedon the estimated duration of all activities that require the synchronizingresource. The second highest priority project’s start date will be calculatedby adding a capacity buffer to the expected end date of the first project.The third highest priority project’s start date is based on the completiondate of the second, and so on. If, by chance, the synchronizing resource isavailable before the scheduled start date, the time can be used to increasethe organization’s capacity to complete more projects. Figure 6.2 illustratesthis strategy.
Analyzing Project Candidates 207

Summary and preliminary project selectionAt this point you have evaluated project candidates using a number of
different criteria. You must now rank the projects, and make your preliminaryselections. You may use Worksheet 3 to assist you with this. The reason yourselections are preliminary is that you lack complete data. As they work the pro-ject, Six Sigma project teams will continuously reevaluate it and they mayuncover data which will lower or raise the project’s priority. The project spon-sor is responsible for coordinating changes in priority with the process owners.
TRACKING SIX SIGMA PROJECT RESULTSIt is vital that information regarding results be accumulated and reported.
This is useful for a variety of purposes:& Evaluating the e¡ectiveness of the Six Sigma project selection system& Determining the overall return on investment& Setting budgets
208 SELECTING AND TRACKING SIX SIGMA PROJECTS
Figure 6.2. Critical chain scheduling illustration.

& Appraising individual and group performance& Setting goals and targets& Identifying areas where more (or less) emphasis on Six Sigma is indicated& Helping educate newcomers on the value of Six Sigma& Answering skeptics& Quieting cynicsA major difference between Six Sigma and failed programs of the past is the
emphasis on tangible, measurable results. Six Sigma advocates make a strongpoint of the fact that projects are selected to provide a mixture of short- andlong-term paybacks that justify the investment and the effort. Unless proof isprovided any statements regarding paybacks are nothing more than emptyassertions.Data storage is becoming so inexpensive that the typical organization can
afford to keep fairly massive amounts of data in databases. The limiting factoris the effort needed to enter the data into the system. This is especially importantif highly trained change agents such as Master Black Belts, Black Belts, orGreen Belts are needed to perform the data entry (Table 6.5).Usually viewing access is restricted to the project data according to role
played in the project, position in the organization, etc. Change access is usuallyrestricted to the project sponsor, leader, or Black Belt. However, to the extentpossible, it should be easy to ‘‘slice-and-dice’’ this information in a variety ofways. Periodic reports might be created summarizing results according todepartment, sponsor, Black Belt, etc. The system should also allow ad-hocviews to be easily created, such as the simple list shown in Table 6.6.
Tracking Six Sigma Project Results 209
Worksheet 3. Project assessment summary.
Project Descriptionor IDNumber
ProjectScore
PPIPriority
ROIPriority
ThroughputPriority Comments

210 SELECTING AND TRACKING SIX SIGMA PROJECTS
Table 6.5. Possible information to be captured.
&Charter information (title, sponsor, membership, deadline etc.)&Description of project in ordinary language& Project status& Savings type (hard, soft, cost avoidance, CTQ, etc.)& Process or unit owner&Key accounting information (charge numbers, etc.)& Project originator& Top-level strategy addressed by project&Comments, issues& Lessons learned&Keywords (for future searches)&Related documents and links&Audit trail of changes& Project task and schedule information
Table 6.6. A typical view of Six Sigma projects.
Project
ID
Project
Title Status Black Belt Sponsor Due
Savings
Type
Total
Savings Costs
76 Cup
Dipole
Antenna
Pending
approval
J Jones Jane Doe 3/1/04 Hard $508,000 $5,900
33 Tank
assembly
Define B Olson Sam
Smith
9/30/03 Hard $250,000 $25,000
35 SSPA Completed NHepburn Sal Davis 10/31/03 Cost
avoidance
$1.3
Million
$13,000
37 FCC RFI
compliance
Control M Littleton Henry
Little
9/30/03 Other NA $1,500
� � � � � � � � �
� � � � � � � � �
� � � � � � � � �

Financial results validationSix Sigma financial benefits claimed for every project must be confirmed by
experts in accounting or finance. Initial savings estimates may be calculated byBlack Belts or sponsors, but final results require at least the concurrence of thefinance department. This should be built in from the start. The finance personassigned to work with the team should be listed in the project charter. Withoutthis involvement the claimed savings are simply not credible. Aside from thebuilt-in bias involved in calculating the benefit created from one’s own project,there is the issue of qualifications. The best qualified people to calculate finan-cial benefits are generally those who do such calculations for a living.This is not to imply that the finance expert’s numbers should go unchal-
lenged. If the results appear to be unreasonable, either high or low, then theyshould be clearly explained in terms the sponsor understands. The Six SigmaLeader also has an interest in assuring that the numbers are valid. Invalid resultspose a threat to the viability of the Six Sigma effort itself. For example, on oneproject the Black Belt claimed savings of several hundred thousand dollars for‘‘unpaid overtime.’’ A finance person concurred. However, the Six SigmaLeader would not accept the savings, arguing quite reasonably that the companyhadn’t saved anything if it had never paid the overtime. This isn’t to say thatthe project didn’t have a benefit. Perhaps morale improved or turnover declineddue to the shorter working hours. Care must be taken to show the benefitsproperly.
TYPES OF SAVINGSThe accounting or finance department should formally define the different
categories of savings. Savings are typically placed in categories such as:Hard savings are actual reductions in dollars now being spent, such asreduced budgets, fewer employees, reduction of prices paid on purchasingcontracts, etc. Hard savings can be used to lower prices, change bid mod-els, increase pro¢ts, or for other purposes where a high degree of con¢-dence in the bene¢t is required.Soft savings are projected reductions that should result from the project.For example, savings from less inventory, reduced testing, lower cycletimes, improved yields, lower rework rates, reduced scrap.
It is important that savings be integrated into the business systems of theorganization. If the institutional framework doesn’t change, the savings couldeventually be lost. For example, if a Six Sigma project improves a processyield, be sure the MRP system’s calculations reflect the new yields.
Tracking Six Sigma Project Results 211
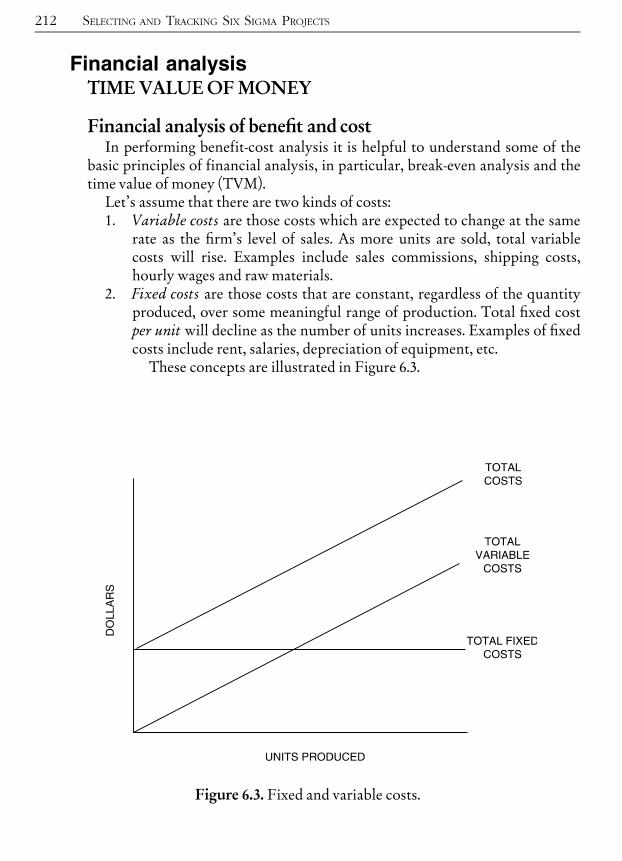
Financial analysisTIME VALUE OF MONEY
Financial analysis of bene¢t and costIn performing benefit-cost analysis it is helpful to understand some of the
basic principles of financial analysis, in particular, break-even analysis and thetime value of money (TVM).Let’s assume that there are two kinds of costs:1. Variable costs are those costs which are expected to change at the same
rate as the ¢rm’s level of sales. As more units are sold, total variablecosts will rise. Examples include sales commissions, shipping costs,hourly wages and raw materials.
2. Fixed costs are those costs that are constant, regardless of the quantityproduced, over some meaningful range of production. Total ¢xed costper unit will decline as the number of units increases. Examples of ¢xedcosts include rent, salaries, depreciation of equipment, etc.These concepts are illustrated in Figure 6.3.
212 SELECTING AND TRACKING SIX SIGMA PROJECTS
Figure 6.3. Fixed and variable costs.

Break-even pointsWe can define the break-even point, or operating break-even point as the level
of unit sales required to make earnings before interest and taxes (EBIT) equalto zero, i.e., the level of sales where profits cover both fixed and variable costs.Let Q be the quantity sold, P the price per unit, V the variable cost per unit,
and F the total fixed costs. Then the quantity P�V represents the variable profitper unit and
QðP� VÞ � F ¼ EBIT ð6:2ÞIf we set EBIT equal to zero in Equation 6.2 and solve for the break-even
quantityQ* we get:
Q� ¼ F
P� Vð6:3Þ
Example of break-even analysisA publishing firm is selling books for $30 per unit. The variable costs are $10
per unit and fixed costs total $100,000. The break-even point is:
Q� ¼ F
P� V¼ $100,000
$30� $10¼ 5,000 units
Of course, management usually wishes to earn a profit rather than to merelybreak even. In this case, simply set EBIT to the desired profit rather than zeroin Equation 6.2 and we get the production quantity necessary to meet manage-ment’s target:
Q�TARGET ¼ F þ EBITTARGET
P� Vð6:4Þ
For example, if the publisher mentioned above wishes to earn a $5,000 profitthen the break-even level of sales becomes
Q�TARGET ¼ F þ EBITTARGET
P� V¼ $100,000þ $5,000
$30� $10¼ 5,250 units
In project benefit-cost analysis these break-even quantities are compared tothe sales forecasts to determine the probability that the expected return willactually be earned.
Tracking Six Sigma Project Results 213
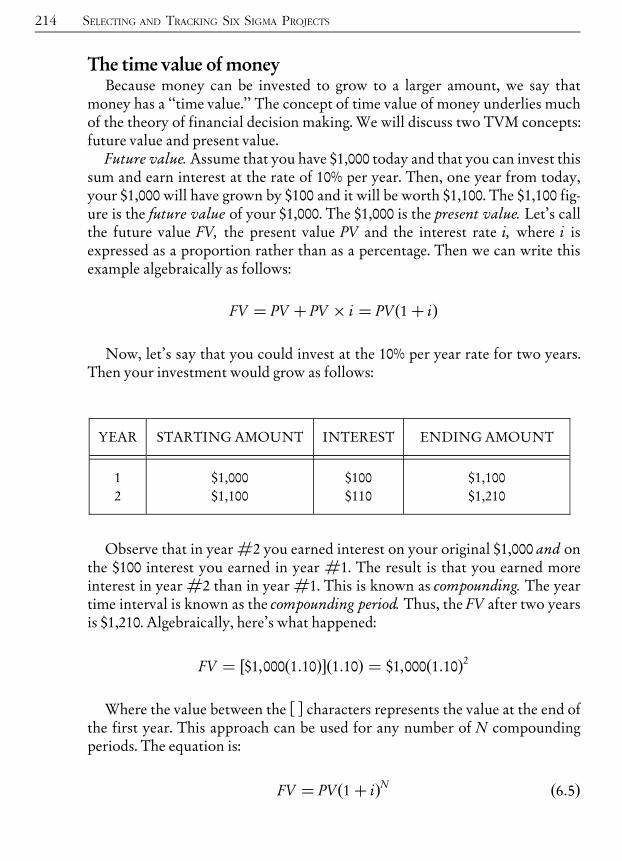
The time value of moneyBecause money can be invested to grow to a larger amount, we say that
money has a ‘‘time value.’’ The concept of time value of money underlies muchof the theory of financial decision making. We will discuss two TVM concepts:future value and present value.
Future value.Assume that you have $1,000 today and that you can invest thissum and earn interest at the rate of 10% per year. Then, one year from today,your $1,000 will have grown by $100 and it will be worth $1,100. The $1,100 fig-ure is the future value of your $1,000. The $1,000 is the present value. Let’s callthe future value FV, the present value PV and the interest rate i, where i isexpressed as a proportion rather than as a percentage. Then we can write thisexample algebraically as follows:
FV ¼ PV þ PV � i ¼ PVð1þ iÞ
Now, let’s say that you could invest at the 10% per year rate for two years.Then your investment would grow as follows:
YEAR STARTING AMOUNT INTEREST ENDINGAMOUNT
12
$1,000$1,100
$100$110
$1,100$1,210
Observe that in year #2 you earned interest on your original $1,000 and onthe $100 interest you earned in year #1. The result is that you earned moreinterest in year #2 than in year #1. This is known as compounding. The yeartime interval is known as the compounding period. Thus, the FV after two yearsis $1,210. Algebraically, here’s what happened:
FV ¼ ½$1,000ð1:10Þ ð1:10Þ ¼ $1,000ð1:10Þ2
Where the value between the [ ] characters represents the value at the end ofthe first year. This approach can be used for any number of N compoundingperiods. The equation is:
FV ¼ PVð1þ iÞN ð6:5Þ
214 SELECTING AND TRACKING SIX SIGMA PROJECTS
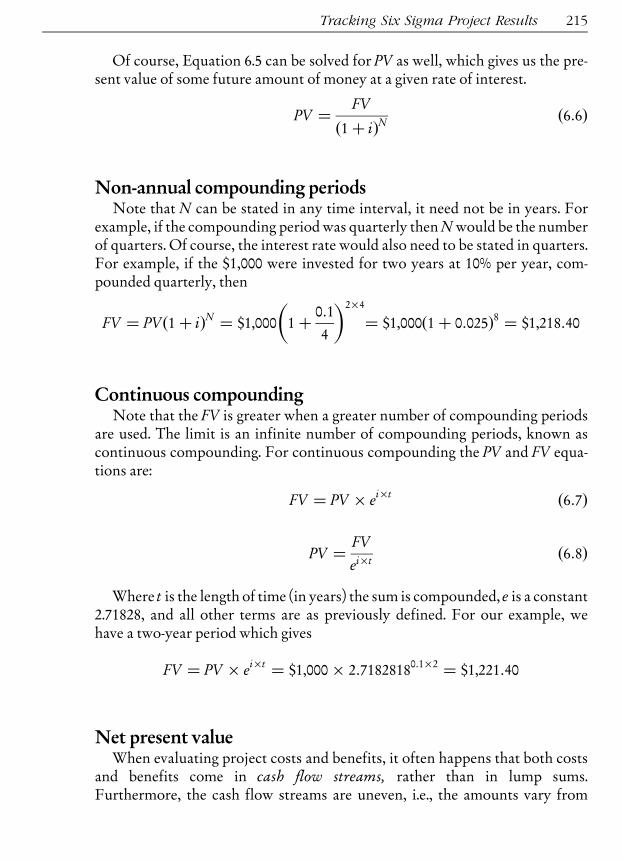
Of course, Equation 6.5 can be solved for PV as well, which gives us the pre-sent value of some future amount of money at a given rate of interest.
PV ¼ FV
ð1þ iÞN ð6:6Þ
Non-annual compounding periodsNote that N can be stated in any time interval, it need not be in years. For
example, if the compounding period was quarterly thenNwould be the numberof quarters. Of course, the interest rate would also need to be stated in quarters.For example, if the $1,000 were invested for two years at 10% per year, com-pounded quarterly, then
FV ¼ PVð1þ iÞN ¼ $1,000 1þ 0:1
4
� �2�4¼ $1,000ð1þ 0:025Þ8 ¼ $1,218:40
Continuous compoundingNote that the FV is greater when a greater number of compounding periods
are used. The limit is an infinite number of compounding periods, known ascontinuous compounding. For continuous compounding the PV and FV equa-tions are:
FV ¼ PV � ei�t ð6:7Þ
PV ¼ FV
ei�t ð6:8Þ
Where t is the length of time (in years) the sum is compounded, e is a constant2.71828, and all other terms are as previously defined. For our example, wehave a two-year period which gives
FV ¼ PV � ei�t ¼ $1,000� 2:71828180:1�2 ¼ $1,221:40
Net present valueWhen evaluating project costs and benefits, it often happens that both costs
and benefits come in cash flow streams, rather than in lump sums.Furthermore, the cash flow streams are uneven, i.e., the amounts vary from
Tracking Six Sigma Project Results 215
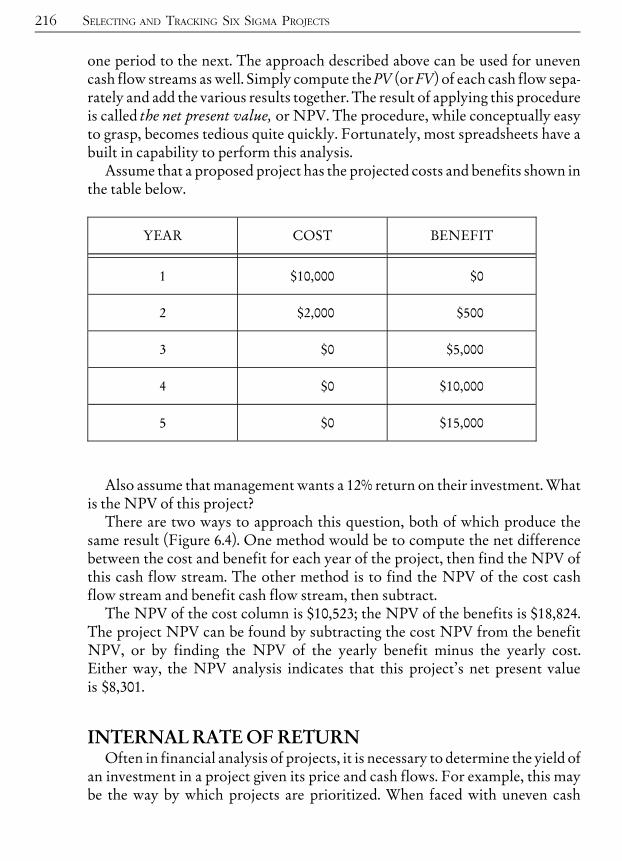
one period to the next. The approach described above can be used for unevencash flow streams as well. Simply compute the PV (or FV) of each cash flow sepa-rately and add the various results together. The result of applying this procedureis called the net present value, or NPV. The procedure, while conceptually easyto grasp, becomes tedious quite quickly. Fortunately, most spreadsheets have abuilt in capability to perform this analysis.Assume that a proposed project has the projected costs and benefits shown in
the table below.
YEAR COST BENEFIT
1 $10,000 $0
2 $2,000 $500
3 $0 $5,000
4 $0 $10,000
5 $0 $15,000
Also assume that management wants a 12% return on their investment. Whatis the NPV of this project?There are two ways to approach this question, both of which produce the
same result (Figure 6.4). One method would be to compute the net differencebetween the cost and benefit for each year of the project, then find the NPV ofthis cash flow stream. The other method is to find the NPV of the cost cashflow stream and benefit cash flow stream, then subtract.The NPV of the cost column is $10,523; the NPV of the benefits is $18,824.
The project NPV can be found by subtracting the cost NPV from the benefitNPV, or by finding the NPV of the yearly benefit minus the yearly cost.Either way, the NPV analysis indicates that this project’s net present valueis $8,301.
INTERNAL RATE OF RETURNOften in financial analysis of projects, it is necessary to determine the yield of
an investment in a project given its price and cash flows. For example, this maybe the way by which projects are prioritized. When faced with uneven cash
216 SELECTING AND TRACKING SIX SIGMA PROJECTS

flows, the solution to this type of problem is usually done by computer. Forexample, with Microsoft Excel, we need to make use of the internal rate ofreturn (IRR) function. The IRR is defined as the rate of return which equatesthe present value of future cash flows with the cost of the investment. To findthe IRR the computer uses an iterative process. In other words, the computerstarts by taking an initial ‘‘guess’’ for the IRR, determines how close the com-puted PV is to the cost of the investment, then adjusts its estimate of the IRReither upward or downward. The process is continued until the desired degreeof precision has been achieved.
ExampleA quality improvement team in a hospital has been investigating the problem
of lost surgical instruments. They have determined that in the rush to get theoperating room cleaned up between surgeries many instruments are acci-dentally thrown away with the surgical waste. A test has shown that a $1,500metal detector can save the following amounts:
Tracking Six Sigma Project Results 217
Figure 6.4. Using Excel to ¢nd the net present value of a project.

Year Savings
1 $750
2 $1,000
3 $1,250
4 $1,500
5 $1,750
After five years of use the metal detector will have a scrap value of $250. Tofind the IRR for this cash flow stream we set up the Excel spreadsheet andsolve the problem as illustrated in Figure 6.5.The Excel formula, shown in the window at the top of the figure, was built
using the Insert Formula ‘‘wizard,’’ with the cash flows in cells B2:B7 and aninitial guess of 0.1 (10%). Note that in year #5 the $250 salvage value is addedto the expected $1,750 in savings on surgical instruments. The cost is shown as
218 SELECTING AND TRACKING SIX SIGMA PROJECTS
Figure 6.5. Using Excel to ¢nd the internal rate of return for a project.
a negative cash flow in year 0. Excel found the IRR to be 63%. The IRR can beone of the criteria for prioritizing projects, as an alternative to, or in additionto, using the PPI.
COST OF (POOR) QUALITYThe history of quality costs dates back to the first edition of Juran’s QC
Handbook in 1951. Today, quality cost accounting systems are part of everymodern organization’s quality improvement strategy. Indeed, quality costaccounting and reporting are part of many quality standards. Quality cost sys-tems help management plan for Six Sigma by identifying opportunities forgreatest return on investment. However, leadership should keep in mind thatquality costs address only half of the quality equation. The quality equationstates that quality consists of doing the right things and not doing the wrongthings. ‘‘Doing the right things’’ means including product and service featuresthat satisfy or delight the customer. ‘‘Not doing the wrong things’’ means avoid-ing defects and other behaviors that cause customer dissatisfaction. Qualitycosts address only the latter aspect of quality. It is conceivable that a firmcould drive quality costs to zero and still go out of business.A problem exists with the very name ‘‘cost of quality.’’ By using this termi-
nology, we automatically create the impression that quality is a cost. However,our modern understanding makes it clear that quality is not a cost. Qualityrepresents a driver that produces higher profits through lower costs and the abil-ity to command a premium price in the marketplace. This author concurs withsuch quality experts as H.J. Harrington and Frank M. Gryna that a better termwould be ‘‘cost of poor quality.’’ However, we will bow to tradition and usethe familiar term ‘‘cost of quality’’ throughout this discussion.The fundamental principle of the cost of quality is that any cost that would
not have been expended if quality were perfect is a cost of quality. This includessuch obvious costs as scrap and rework, but it also includes many costs that arefar less obvious, such as the cost of reordering to replace defective material.Service businesses also incur quality costs; for example, a hotel incurs a qualitycost when room service delivers a missing item to a guest. Specifically, qualitycosts are a measure of the costs associated with the achievement or non-achieve-ment of product or service qualityLincluding all product or service require-ments established by the company and its contracts with customers andsociety. Requirements include marketing specifications, end-product and pro-cess specifications, purchase orders, engineering drawings, company proce-dures, operating instructions, professional or industry standards, governmentregulations, and any other document or customer needs that can affect the defi-nition of product or service. More specifically, quality costs are the total of the
Tracking Six Sigma Project Results 219

cost incurred by a) investing in the prevention of non-conformances to require-ments; b) appraising a product or service for conformance to requirements;and c) failure to meet requirements (Figure 6.6).
220 SELECTING AND TRACKING SIX SIGMA PROJECTS
tomer/user needs. Failure costs are divided into internal and external failure costcategories.
Figure 6.6. Quality costsLgeneral description.From Principles of Quality Costs, 3rd Edition, p. 5, Jack Campanella, Editor.
Copyright#1999 by ASQQuality Press.

For most organizations, quality costs are hidden costs. Unless specific qual-ity cost identification efforts have been undertaken, few accounting systemsinclude provision for identifying quality costs. Because of this, unmeasuredquality costs tend to increase. Poor quality impacts companies in two ways:higher cost and lower customer satisfaction. The lower satisfaction createsprice pressure and lost sales, which results in lower revenues. The combinationof higher cost and lower revenues eventually brings on a crisis that may threatenthe very existence of the company. Rigorous cost of quality measurement isone technique for preventing such a crisis from occurring. Figure 6.7 illustratesthe hidden cost concept.
Goal of quality cost systemThe goal of any quality cost system is to reduce quality costs to the lowest
practical level. This level is determined by the total of the costs of failure andthe cost of appraisal and prevention. Juran and Gryna (1988) present thesecosts graphically as shown in Figure 6.8. In the figure it can be seen that thecost of failure declines as conformance quality levels improve toward perfec-tion, while the cost of appraisal plus prevention increases. There is some ‘‘opti-mum’’ target quality level where the sum of prevention, appraisal, and failurecosts is at a minimum. Efforts to improve quality to better than the optimumlevel will result in increasing the total quality costs.
Tracking Six Sigma Project Results 221
Figure 6.7. Hidden cost of quality and the multiplier e¡ect.From Principles of Quality Costs, 2nd Edition, p. 11, Jack Campanella, Editor.
Copyright# 1990 by ASQQuality Press.

Juran acknowledged that in many cases the classical model of optimum qual-ity costs is flawed. It is common to find that quality levels can be economicallyimproved to literal perfection. For example, millions of stampings may be pro-duced virtually error-free from a well-designed and built stamping die. The clas-sical model created a mindset that resisted the idea that perfection was apossibility. No obstacle is as difficult to surmount as a mindset. The newmodel of optimum quality cost incorporates the possibility of zero defects andis shown in Figure 6.9.Quality costs are lowered by identifying the root causes of quality problems
and taking action to eliminate these causes. The tools and techniques describedin Part II are useful in this endeavor. KAIZEN, reengineering, and other contin-uous improvement approaches are commonly used.
Strategy for reducing quality costsAs a general rule, quality costs increase as the detection point moves further
up the production and distribution chain. The lowest cost is generally obtainedwhen non-conformances are prevented in the first place. If non-conformancesoccur, it is generally least expensive to detect them as soon as possible aftertheir occurrence. Beyond that point there is loss incurred from additionalwork that may be lost. The most expensive quality costs are from non-confor-
222 SELECTING AND TRACKING SIX SIGMA PROJECTS
Figure 6.8. Classical model of optimum quality costs.From Juran’s Quality Control Handbook, 4th edition, J.M. Juran and F.M. Gryna, Editors.
Copyright# 1988, McGraw-Hill.

mances detected by customers. In addition to the replacement or repair loss, acompany loses customer goodwill and their reputation is damaged when thecustomer relates his experience to others. In extreme cases, litigationmay result,adding even more cost and loss of goodwill.Another advantage of early detection is that it provides more meaningful
feedback to help identify root causes. The time lag between production andfield failure makes it very difficult to trace the occurrence back to the processstate that produced it. While field failure tracking is useful in prospectively eval-uating a ‘‘fix,’’ it is usually of little value in retrospectively evaluating a problem.
Accounting supportWe have said it before, but it bears repeating, that the support of the account-
ing department is vital whenever financial and accounting matters are involved.In fact, the accounting department bears primary responsibility for accountingmatters, including cost of quality systems. The Six Sigma department’s role in
Tracking Six Sigma Project Results 223
Figure 6.9. Newmodel of optimum quality costs.From Juran’s Quality Control Handbook, 4th edition, J.M. Juran and F.M. Gryna, Editors.
Copyright# 1988, McGraw-Hill.
development and maintenance of the cost of quality system is to provide gui-dance and support to the accounting department.The cost of quality system must be integrated into the larger cost accounting
system. It is, in fact, merely a subsystem. Terminology, format, etc., should beconsistent between the cost of quality system and the larger system. This willspeed the learning process and reduce confusion. Ideally, the cost of qualitywill be so fully integrated into the cost accounting system that it will not beviewed as a separate accounting system at all, it will be a routine part of costreporting and reduction. The ideal cost of quality accounting systemwill simplyaggregate quality costs to enhance their visibility to management and facilitateefforts to reduce them. Formost companies, this task falls under the jurisdictionof the controller’s office.Quality cost measurement need not be accurate to the penny to be effective.
The purpose of measuring such costs is to provide broad guidelines for manage-ment decision-making and action. The very nature of cost of quality makessuch accuracy impossible. In some instances it will only be possible to obtainperiodic rough estimates of such costs as lost customer goodwill, cost of damageto the company’s reputation, etc. These estimates can be obtained using specialaudits, statistical sampling, and other market studies. These activities can bejointly conducted by teams of marketing, accounting, and Six Sigma personnel.Since these costs are often huge, these estimates must be obtained. However,they need not be obtained every month. Annual studies are usually sufficientto indicate trends in these measures.
Management of quality costsIn our discussion of the cost of quality subsystem, we emphasized the impor-
tance of not creating a unique accounting system. The same holds true when dis-cussing management of quality costs. Quality cost management should be partof the charter of the senior level cross-functional cost management team. It isone part of the broader business effort to control costs. However, in all likeli-hood, the business will find that quality cost reduction has greater potential tocontribute to the bottom line than the reduction of other costs. This is sobecause, unlike other costs, quality costs are waste costs (Pyzdek, 1976). Assuch, quality costs contribute no value to the product or service purchased bythe customer. Indeed, quality costs are often indicators of negative customervalue. The customer who brings his car in for a covered warranty expense suf-fers uncompensated inconvenience, the cost of which is not captured by mostquality cost systems (although, as discussed above, we recommend that suchcosts be estimated from time to time). All other costs incurred by the firm pur-chase at least some value.
224 SELECTING AND TRACKING SIX SIGMA PROJECTS

Effective cost of quality programs consist of taking the following steps(Campanella, 1990, p. 34):
. Establish a quality cost measurement system
. Develop a suitable long-range trend analysis
. Establish annual improvement goals for total quality costs
. Develop short-range trend analyses with individual targets which, whencombined, meet the annual improvement goal
. Monitor progress towards the goals and take action when progress fallsshort of targets
The tools and techniques described in Chapter 15 are useful formanaging SixSigma quality cost reduction projects.Quality cost management helps firms establish priorities for corrective
action. Without such guidance, it is likely that firms will misallocate theirresources, thereby getting less than optimal return on investment. If suchexperiences are repeated frequently, the organization may even questionor abandon their quality cost reduction efforts. The most often-used toolin setting priorities is Pareto analysis (see Chapter 8). Typically at the out-set of the quality cost reduction effort, Pareto analysis is used to evaluatefailure costs to identify those ‘‘vital few’’ areas in most need of attention.Documented failure costs, especially external failure costs, almost certainlyunderstate the true cost and they are highly visible to the customer.Pareto analysis is combined with other quality tools, such as control chartsand cause and effect diagrams, to identify the root causes of quality pro-blems. Of course, the analyst must constantly keep in mind the fact thatmost costs are hidden. Pareto analysis cannot be effectively performeduntil the hidden costs have been identified. Analyzing only those dataeasiest to obtain is an example of the GIGO (garbage-in, garbage-out)approach to analysis.After the most significant failure costs have been identified and brought
under control, appraisal costs are analyzed. Are we spending too much onappraisal in view of the lower levels of failure costs? Here quality cost analysismust be supplemented with risk analysis to assure that failure and appraisalcost levels are in balance. Appraisal cost analysis is also used to justify expen-diture in prevention costs.Prevention costs of quality are investments in the discovery, incorporation,
and maintenance of defect prevention disciplines for all operations affectingthe quality of product or service (Campanella, 1990). As such, preventionneeds to be applied correctly and not evenly across the board. Much improve-ment has been demonstrated through reallocation of prevention effort fromareas having little effect to areas where it really pays off; once again, the Paretoprinciple in action.
Tracking Six Sigma Project Results 225

Cost of quality examplesI. Prevention costsLCosts incurred to prevent the occurrence of non-conformances in the future, such as*
A. Marketing/customer/user1. Marketing research2. Customer/user perception surveys/clinics3. Contract/document review
B. Product/service/design development1. Design quality progress reviews2. Design support activities3. Product design qualification test4. Service design qualification5. Field tests
C. Purchasing1. Supplier reviews2. Supplier rating3. Purchase order tech data reviews4. Supplier quality planning
D. Operations (manufacturing or service)1. Operations process validation2. Operations quality planning
a. Design and development of quality measurement and controlequipment
3. Operations support quality planning4. Operator quality education5. Operator SPC/process control
E. Quality administration1. Administrative salaries2. Administrative expenses3. Quality program planning4. Quality performance reporting5. Quality education6. Quality improvement7. Quality audits8. Other prevention costs
226 SELECTING AND TRACKING SIX SIGMA PROJECTS
*All detailed quality cost descriptions are from Principles of Quality Costs, John T. Hagan, editor. Milwaukee, WI: ASQ
Quality Press, appendix B.

II. Appraisal costsLCosts incurred in measuring and controlling currentproduction to assure conformance to requirements, such as
A. Purchasing appraisal costs1. Receiving or incoming inspections and tests2. Measurement equipment3. Qualification of supplier product4. Source inspection and control programs
B. Operations (manufacturing or service) appraisal costs1. Planned operations inspections, tests, audits
a. Checking laborb. Product or service quality auditsc. Inspection and test materials
2. Set-up inspections and tests3. Special tests (manufacturing)4. Process control measurements5. Laboratory support6. Measurement equipment
a. Depreciation allowancesb. Measurement equipment expensesc. Maintenance and calibration labor
7. Outside endorsements and certificationsC. External appraisal costs
1. Field performance evaluation2. Special product evaluations3. Evaluation of field stock and spare parts
D. Review of tests and inspection dataE. Miscellaneous quality evaluations
III. Internal failure costsLCosts generated before a product is shipped as aresult of non-conformance to requirements, such as
A. Product/service design failure costs (internal)1. Design corrective action2. Rework due to design changes3. Scrap due to design changes
B. Purchasing failure costs1. Purchased material reject disposition costs2. Purchased material replacement costs3. Supplier corrective action4. Rework of supplier rejects5. Uncontrolled material losses
Tracking Six Sigma Project Results 227
C. Operations (product or service) failure costs1. Material review and corrective action costs
a. Disposition costsb. Troubleshooting or failure analysis costs (operations)c. Investigation support costsd. Operations corrective action
2. Operations rework and repair costsa. Reworkb. Repair
3. Reinspection/retest costs4. Extra operations5. Scrap costs (operations)6. Downgraded end product or service7. Internal failure labor losses
D. Other internal failure costs
IV. External failure costsLCosts generated after a product is shipped as aresult of non-conformance to requirements, such as
A. Complaint investigation/customer or user serviceB. Returned goodsC. Retrofit costsD. Recall costsE. Warranty claimsF. Liability costsG. PenaltiesH. Customer/user goodwillI. Lost salesJ. Other external failure costs
Quality cost basesThe guidelines for selecting a base for analyzing quality costs are:. The base should be related to quality costs in a meaningful way. The base should be well-known to the managers who will receive the qual-ity cost reports
. The base should be ameasure of business volume in the area where qualitycost measurements are to be applied
. Several bases are often necessary to get a complete picture of the relativemagnitude of quality costs
Some commonly used bases are (Campanella, 1990, p. 26):. A labor base (such as total labor, direct labor, or applied labor)
228 SELECTING AND TRACKING SIX SIGMA PROJECTS

. A cost base (such as shop cost, operating cost, or total material and labor)
. A sales base (such as net sales billed, or sales value of ¢nished goods)
. A unit base (such as the number of units produced, or the volume of out-put)
While actual dollars spent are usually the best indicator for determiningwhere quality improvement projects will have the greatest impact on profitsand where corrective action should be taken, unless the production rate is rel-atively constant, it will not provide a clear indication of quality cost improve-ment trends. Since the goal of the cost of quality program is improvement overtime, it is necessary to adjust the data for other time-related changes such as pro-duction rate, inflation, etc. Total quality cost compared to an applicable baseresults in an index which may be plotted and analyzed using control charts,run charts, or one of the other tools described in Chapters 11^14.For long-range analyses and planning, net sales is the base most often used
for presentations to top management (Campanella, 1990, p. 24). If sales are rela-tively constant over time, the quality cost analysis can be performed for rela-tively short spans of time. In other industries this figure must be computedover a longer time interval to smooth out large swings in the sales base. Forexample, in industries such as shipbuilding or satellite manufacturing, someperiods may have no deliveries, while others have large dollar amounts. It isimportant that the quality costs incurred be related to the sales for the same per-iod. Consider the sales as the ‘‘opportunity’’ for the quality costs to happen.Some examples of cost of quality bases are (Campanella, 1990):. Internal failure costs as a percent of total production costs. External failure costs as an average percent of net sales. Procurement appraisal costs as a percent of total purchased material cost. Operations appraisal costs as a percent of total production costs. Total quality costs as a percent of production costsAn example of a cost of quality report that employs some of these bases is
shown in Figure 6.10.
Quality cost trend analysisAs stated above, the purpose of collecting quality cost data is to provide a
sound basis for taking the necessary action to eliminate the causes of thesecosts, and thereby eliminate the costs themselves. If the action taken is effective,the data will indicate a positive trend. Trend analysis is most often performedby presenting the data in run chart form and analyzing the runs (see Chapter11). It is common to combine all of the cost of quality data on a single graph, asshown in Figure 6.11.
Tracking Six Sigma Project Results 229
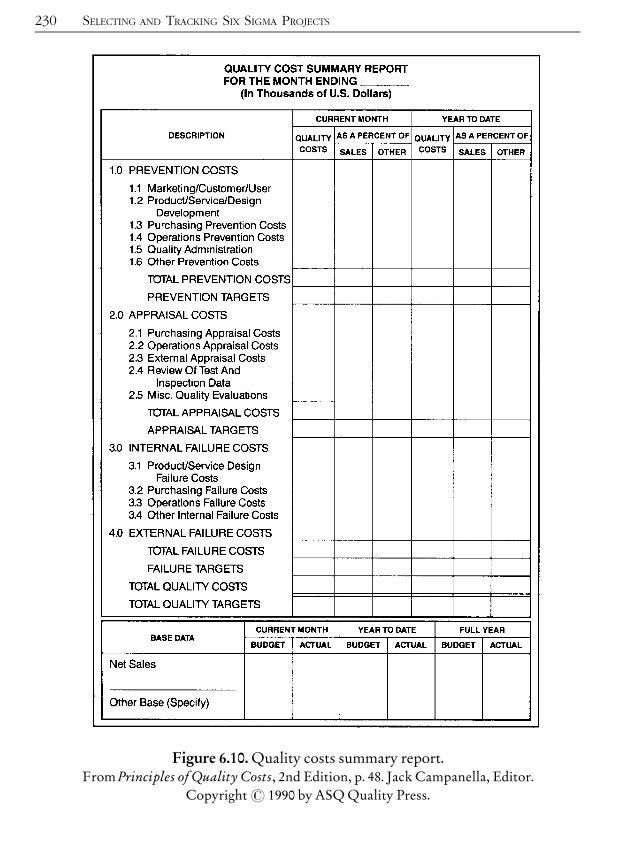
230 SELECTING AND TRACKING SIX SIGMA PROJECTS
Figure 6.10. Quality costs summary report.From Principles of Quality Costs, 2nd Edition, p. 48. Jack Campanella, Editor.
Copyright# 1990 by ASQQuality Press.

If the runs are subjected to the run tests described below, it can be shown thatthe total failure and total COQ (cost of quality) trends are statistically sig-nificant. However, for this example data, the use of formal statistical rules issuperfluousLthe improvement is obvious.While such aggregate analysis is useful for senior management, it is of little
value to those engaged in more focused Six Sigma cost of quality projects. Inthese cases the trend data should be as specific as possible to the area being stu-died. Also, the measurement may be something more directly related to thework being done by the Six Sigma team rather than dollars, and the time intervalshould be shorter. For example, if it has been determined that a major internalfailure cost item is defective solder joints, then the team should plot a controlchart of the solder defect rate and analyze the process in real-time. Obviously,reducing solder defects should reduce the cost associated with solder defects.
Implementing the quality cost programQuality cost program introduction is a major project and should utilize the
tools and techniques described in Chapter 15. Prior to implementation, aneeds analysis should be performed to determine if, in fact, a cost of quality pro-gram can benefit the company. The needs assessment should also include a
Tracking Six Sigma Project Results 231
Figure 6.11. Cost of quality history.

benefit/cost analysis and a plan for the implementation. The plan shouldinclude:
. the management presentation, designed to identify the overall opportu-nity and show an example of how the program will achieve its bene¢ts
. a description of the pilot program
. material designed to educate and involve all functions in the program
. outline of the internal cost of quality accounting procedures
. description of the data collection and analysis of cost of quality data at thehighest level of aggregation
. description of the cost of quality reporting system and how the data will beused to improve quality
As with anymajor Six Sigma project, a sponsor should be found andmanage-ment support secured. In the case of cost of quality, the sponsor should be thecontroller or one of her subordinates.
Use of quality costsThe principal use of quality cost data is to justify and support quality per-
formance improvement. Quality cost data help identify problem areas anddirect resources to these areas. To be effective, the cost of quality system has tobe integrated with other quality information systems to assure that root causeswill be addressed. Statistical analysis can be used to correlate quality cost trendswith other quality data to help direct attention to problem causes.One mission of the quality management function is to educate top man-
agement about the long-range effects of total quality performance on the profitsand quality reputation of the company.Managementmust understand that stra-tegic planning for quality is as important as strategic planning for any otherfunctional area. When the strategic plan addresses cost issues, quality cost con-sideration should be prominent. Quality costs should be considered firstbecause, since they are waste costs, their reduction is always taken from the‘‘fat’’ of the organization. The role of the quality manager in this process shouldbe to (Campanella, 1990, p. 56)
. analyze major trends in customer satisfaction, defects or error rates, andquality costs, both generally and by speci¢c program or project. Thesetrends should also be used to provide inputs for setting objectives;
. assist the other functions to ensure that costs related to quality areincluded in their analyses for setting objectives;
. develop an overall quality strategic plan which incorporates all functionalquality objectives and strategic action plans, including plans and budgetsfor the quality function.
232 SELECTING AND TRACKING SIX SIGMA PROJECTS

Bene¢ts of quality cost reductionQuality cost reductions can have a significant impact on a company’s growth
rate and bottom line. Research done by the Chicago Graduate School ofBusiness showed that companies using TQM for an average of 6.5 yearsincreased revenues at an annual rate of 8.3% annually, versus 4.2% annually forall U.S. manufacturers. Suminski (1994) reports that the average manufacturer’sprice of non-conformance is 25% of operating costs, for service businesses thefigure is 35%. These costs represent a direct charge against a company’s profit-ability. A New England heavy equipment manufacturer reports that theirprice of non-conformance was 31% of total sales when they undertook a qualitycost reduction project. In just one year they were able to lower these costs to9%. Among their accomplishments:
. Scrap and rework reduced 30%.
. Manufacturing cost variance reduced 20%.
. Late collections reduced 46%.
. Average turnaround on receivables reduced from 62 days to 35 days.
Lessons learned capture and replicationIt is often possible to apply the lessons learned from a project to other pro-
cesses, either internally or externally. Most companies have more than one per-son or organizational unit performing similar or identical tasks. Many alsohave suppliers and outsourcers who do work similar to that being done intern-ally. By replicating the changes done during a project the benefits of Six Sigmacan be multiplied many fold, often at very minimal cost. Think of it as a formof benchmarking. Instead of looking for the best-in-class process for you tolearn from, the Six Sigma team created a best-in-class process and you want toteach the new approach to others.Unlike benchmarking, where the seeker of knowledge is predisposed to
change what they are doing, the process owners who might benefit from theknowledge gained during a Six Sigma project may not even be aware that theycan benefit from a change. This needs to be accounted for when planning theprogram for sharing lessons learned. The process is a combination of motiva-tion, education and selling the target audience on the new approach. Chancesare that those who worked the project are not the best ones to sell others onthe new approach. They can serve as technical advisers to those who will carrythe message to other areas. The Six Sigma function (Process Excellence) usuallytakes the lead in developing a system for replication and sharing of lessonslearned.
Tracking Six Sigma Project Results 233

In addition to the lessons learned about business processes, a great deal willbe learned about how to conduct successful projects. In a few years even a mod-erately sized Six Sigma effort will complete hundreds or thousands of projects.These project lessons learned should be captured and used to help other projectteams. The information is usually best expressed in simple narratives by the pro-ject Black Belt. The narratives can be indexed by search engines and used byother Black Belts in the organization. The lessons learned database is an extre-mely valuable asset to the Six Sigma organization.
234 SELECTING AND TRACKING SIX SIGMA PROJECTS
^ ^ ^PART
II
Six Sigma Tools andTechniques
Copyright 2003 by The McGraw-Hill Companies, Inc. Click Here for Terms of Use.

This page intentionally left blank.

^ ^ ^CHAPTER
7
Introduction to DMAICand Other Improvement
ModelsDMAIC, DMADV, AND LEARNING MODELS
Part II covers the toolkit commonly used in Six Sigma.
For the most part, these are the same tools used by the quality profession andapplied statisticians for decades. Six Sigma puts some new twists on these tradi-tional tools:1. They are taught in the context of a well-de¢ned improvement model
known as DMAIC (see below). Computers are used intensively.2. They are applied at once on real projects designed to deliver tangible
results for an identi¢ed stakeholder.3. Items 1 and 2 are integrated via an intensive training regimen that is pro-
vided to full-time change agents who work on projects while they arebeing trained.
The tools of Six Sigma are most often applied within a simple performanceimprovement model known as De¢ne-Measure-Analyze-Improve-Control,or DMAIC. DMAIC is summarized in Figure 7.1. DMAIC is used when aproject’s goal can be accomplished by improving an existing product, process,or service.
Copyright 2003 by The McGraw-Hill Companies, Inc. Click Here for Terms of Use.

Figure 7.1. Overview of DMAIC.
D De¢ne the goals of the improvement activity. The most importantgoals are obtained from customers. At the top level the goals will bethe strategic objectives of the organization, such as greater customerloyalty, a higher ROI or increased market share, or greater employeesatisfaction. At the operations level, a goal might be to increase thethroughput of a production department. At the project level goalsmight be to reduce the defect level and increase throughput for aparticular process. Obtain goals from direct communication withcustomers, shareholders, and employees.
M Measure the existing system. Establish valid and reliable metrics tohelp monitor progress towards the goal(s) de¢ned at the previousstep.
A Analyze the system to identify ways to eliminate the gap between thecurrent performance of the system or process and the desired goal.Begin by determining the current baseline. Use exploratory anddescriptive data analysis to help you understand the data. Usestatistical tools to guide the analysis.
I Improve the system. Be creative in ¢nding new ways to do thingsbetter, cheaper, or faster. Use project management and otherplanning and management tools to implement the new approach. Usestatistical methods to validate the improvement.
C Control the new system. Institutionalize the improved system bymodifying compensation and incentive systems, policies, procedures,MRP, budgets, operating instructions and other managementsystems. You may wish to utilize standardization such as ISO 9000 toassure that documentation is correct. Use statistical tools to monitorstability of the new systems.
DMAIC is such an integral part of Six Sigma that it is used to organize thematerial for Part II of this book. It provides a useful framework for conductingSix Sigma projects, see Figure 7.2. DMAIC is sometimes even used to create a‘‘gated process’’ for project control. That is, criteria for completing a particularphase are de¢ned and projects reviewed to determine if all of the criteria havebeen met. If so, then the gate (e.g., De¢ne) is ‘‘closed.’’
238 INTRODUCTION TO DMAIC

Table 7.1 shows a partial listing of tools often found to be useful in a givenstage of a project. There is considerable overlap in practice.
Design for Six Sigma project frameworkAnother approach, used when the goal is the development of a new or radi-
cally redesigned product, process or service, is De¢ne-Measure-Analyze-Design-Verify, or DMADV (Figure 7.3). DMADV is part of the design for SixSigma (DFSS) toolkit.
DMAIC, DMADV, and learning models 239
Figure 7.2. Using DMAIC on a Six Sigma project.

240 INTRODUCTION TO DMAIC
Table 7.1. Six Sigma tools commonly used in each phase of a project.
Project Phase Candidate Six Sigma Tools
De¢ne & Project charter& VOC tools (surveys, focus groups, letters, comment
cards)& Process map& QFD, SIPOC& Benchmarking
Measure & Measurement systems analysis& Exploratory data analysis& Descriptive statistics& Data mining& Run charts& Pareto analysis
Analyze & Cause-and-e¡ect diagrams& Tree diagrams& Brainstorming& Process behavior charts (SPC)& Process maps& Design of experiments& Enumerative statistics (hypothesis tests)& Inferential statistics (Xs and Ys)& FMEA& Simulation
Improve & Force ¢eld diagrams& 7M tools& Project planning and management tools& Prototype and pilot studies
Control & SPC& FMEA& ISO 900�& Change budgets, bid models, cost estimating models& Reporting system

D
De¢ne the goals of the design activity. What is being designed?Why? Use QFD or the Analytic Hierarchical Process to assure thatthe goals are consistent with customer demands and enterprisestrategy.
MMeasure.Determine Critical to Stakeholder metrics. Translatecustomer requirements into project goals.
AAnalyze the options available for meeting the goals. Determine theperformance of similar best-in-class designs.
DDesign the new product, service or process. Use predictive models,simulation, prototypes, pilot runs, etc. to validate the designconcept’s e¡ectiveness in meeting goals.
V Verify the design’s e¡ectiveness in the real world.
Figure 7.3. Overview of DMADV.
Figure 7.4 illustrates the relationship between DMAIC and DMADV.
Learning modelsKnowledge is hierarchical, meaning that some ideas have more impact
than others because they are more fundamental. Six Sigma tends to take avery ‘‘practical view’’ of the world, but this perspective is dangerous if itscontext isn’t well understood. True, the focus is on doing. But how do weknow that what we are doing is correct? If we are wrong, then our actionsmay make matters worse instead of better. The question of how we knowthat we know is a philosophical one, not a technical one. Technical tools,such as statistical methods, can be used to help us answer this question,but unless we have a deep understanding of the philosophy that underliesthe use of the tools we won’t really know how to interpret the resultsobtained.Learning is the acquisition of new knowledge about the way the world
works. Both DMAIC and DMADV are learning frameworks. Learningmust occur if the project deliverable is to provide the intended bene¢t.W|thout learning to guide process change activity it’s just hit-and-miss, andMurphy’s Law* assures that our e¡orts will miss the mark more often than
DMAIC, DMADV, and learning models 241
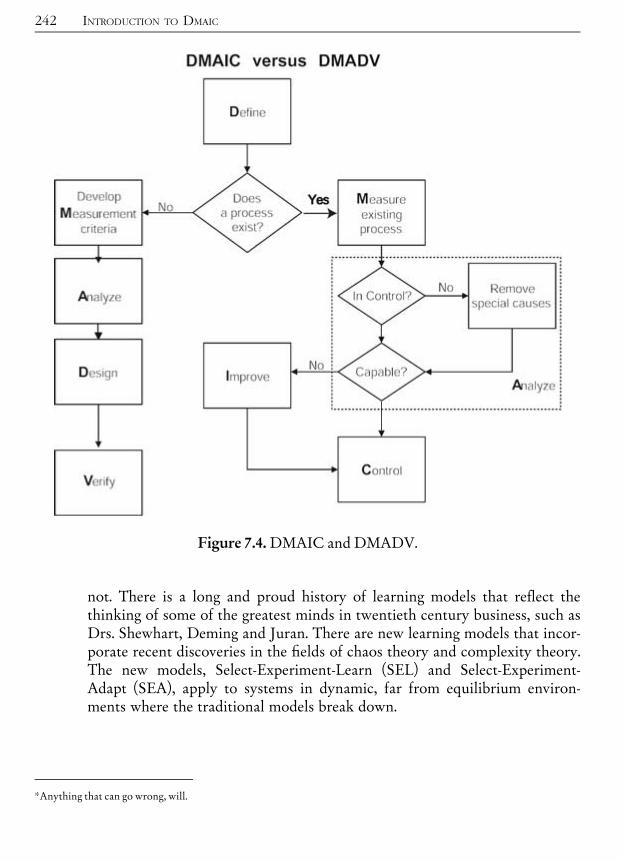
not. There is a long and proud history of learning models that re£ect thethinking of some of the greatest minds in twentieth century business, such asDrs. Shewhart, Deming and Juran. There are new learning models that incor-porate recent discoveries in the ¢elds of chaos theory and complexity theory.The new models, Select-Experiment-Learn (SEL) and Select-Experiment-Adapt (SEA), apply to systems in dynamic, far from equilibrium environ-ments where the traditional models break down.
242 INTRODUCTION TO DMAIC
Figure 7.4. DMAIC and DMADV.
*Anything that can go wrong, will.

PDCA (PLAN-DO-CHECK-ACT)The PDCA cycle, which Deming refers to as the PDSA cycle (Deming, 1993,
p. 134), is a £ow chart for learning and process improvement. The basic ideabegan with Shewhart’s attempt to understand the nature of knowledge.Shewhart believed that knowledge begins and ends in experimental data butthat it does not end in the data in which it begins. He felt there were three impor-tant components of knowledge (Shewhart, 1939, 1986): a) the data of experiencein which the process of knowing begins, b) the prediction in terms of data thatonewould expect to get if onewere to perform certain experiments in the future,and c) the degree of belief in the prediction based on the original data or somesummary thereof as evidence. Shewhart arranged these three components sche-matically as shown in Figure 7.5.
Since knowledge begins with the original data and ends in new data, thesefuture data constitute the operationally veri¢able meaning of the original data.However, since inferences or predictions based upon experimental data cannever be certain, the knowledge based upon the original data can inhere inthese data only to the extent of some degree of rational belief. In other words,according to Shewhart, knowledge can only be probable. Also, the data are not‘‘facts’’ in and of themselves, they are merely measurements that allow us todraw inferences about something. In other words,we can not have facts withoutsome theory.Shewhart applied these principles in many practical ways. For example, he
identi¢ed the three steps of quality control in manufacturing as speci¢cation,production, and judgment of quality (inspection). He noted that, in practice,speci¢cations could not be set without ¢rst having some information from
DMAIC, DMADV, and learning models 243
Figure 7.5. The three components of knowledge.
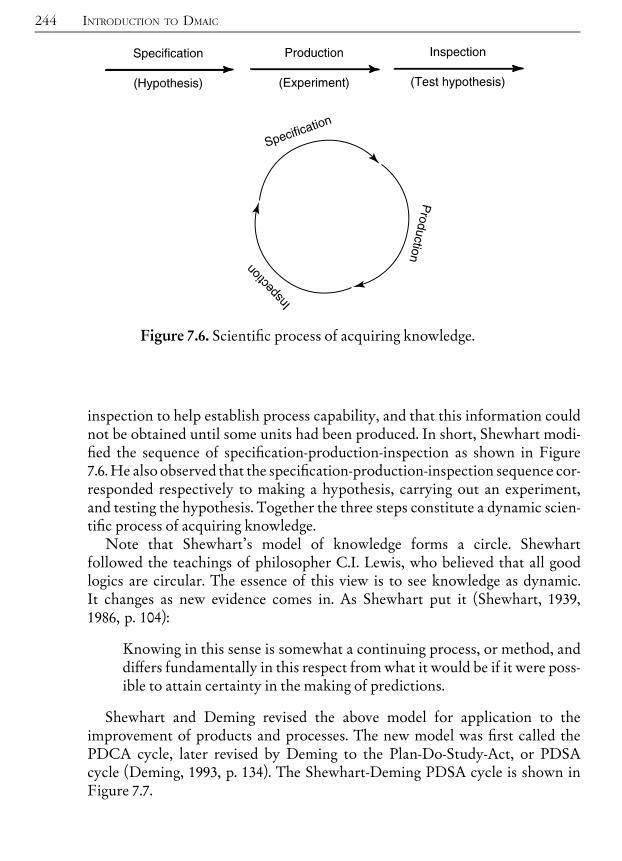
inspection to help establish process capability, and that this information couldnot be obtained until some units had been produced. In short, Shewhart modi-¢ed the sequence of speci¢cation-production-inspection as shown in Figure7.6.He also observed that the speci¢cation-production-inspection sequence cor-responded respectively to making a hypothesis, carrying out an experiment,and testing the hypothesis. Together the three steps constitute a dynamic scien-ti¢c process of acquiring knowledge.Note that Shewhart’s model of knowledge forms a circle. Shewhart
followed the teachings of philosopher C.I. Lewis, who believed that all goodlogics are circular. The essence of this view is to see knowledge as dynamic.It changes as new evidence comes in. As Shewhart put it (Shewhart, 1939,1986, p. 104):
Knowing in this sense is somewhat a continuing process, or method, anddi¡ers fundamentally in this respect fromwhat it would be if it were poss-ible to attain certainty in the making of predictions.
Shewhart and Deming revised the above model for application to theimprovement of products and processes. The new model was ¢rst called thePDCA cycle, later revised by Deming to the Plan-Do-Study-Act, or PDSAcycle (Deming, 1993, p. 134). The Shewhart-Deming PDSA cycle is shown inFigure 7.7.
244 INTRODUCTION TO DMAIC
Figure 7.6. Scienti¢c process of acquiring knowledge.

Plan a change or a test, aimed at improvement. This is the foundation for theentire PDCA-PDSA cycle. The term ‘‘plan’’ need not be limited to large-scaleplanning on an organization-wide scale, it may simply refer to a small processchange one is interested in exploring.
Do. Carry out the change or the test (preferably on a small scale). It is impor-tant that the DO step carefully follow the plan, otherwise learning will not bepossible.
Study the results. What did we learn? What went wrong?Act. Adopt the change, or abandon it, or run through the cycle again.The PDCA approach is essentially amanagement-oriented version of the ori-
ginal Shewhart cycle, which focused on engineering and production. A numberof other variations have been developed, two of Deming’s variations are shownin Figure 7.8.Juran depicts quality as a ‘‘spiral,’’ as shown in Figure 7.9.Because of their historical origins and logical appeal, circular diagrams are
ubiquitous in the quality ¢eld. In qualitymanagement, the circle represents con-tinuous improvement of quality by continuous acquisition of knowledge.
DYNAMIC MODELS OF LEARNING ANDADAPTATIONThe PDSA cycle describes planning and learning in an environment at or
near a stable equilibrium. The PDSA loop indicates that plans are con-
DMAIC, DMADV, and learning models 245
Figure 7.7. The Shewhart-Deming PDSA cycle for learning and improvement.

tinuously improved by studying the results obtained when the plans areimplemented, and then modifying the plans. However, the PDSA model failsto account for the activities of other agents, which is a characteristic of com-plex adaptive systems, such as a market economy. For this situation I proposea new model, the Select-Experiment-Adapt (SEA) model depicted in Figure7.10.
246 INTRODUCTION TO DMAIC
Figure 7.8. Some variations of the PDCA-PDSA cycle.
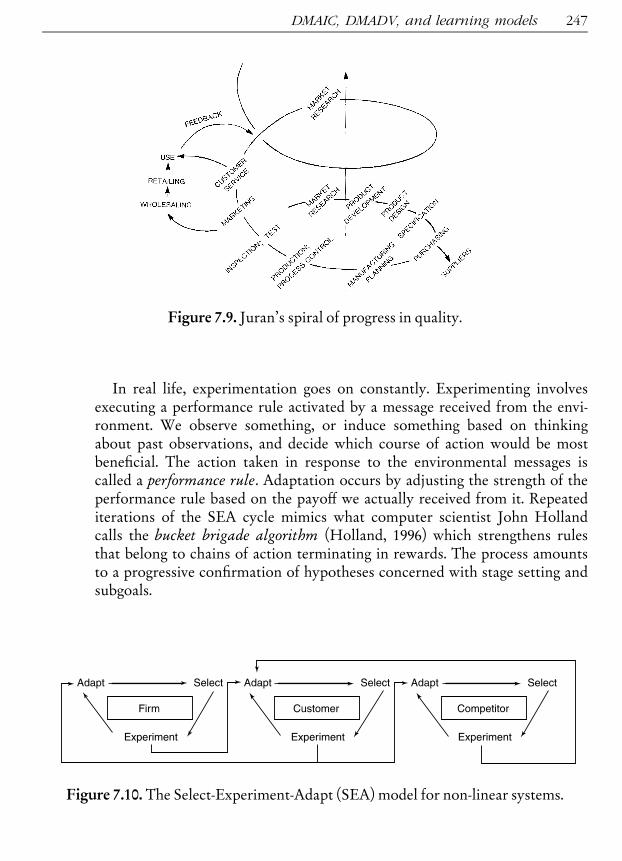
In real life, experimentation goes on constantly. Experimenting involvesexecuting a performance rule activated by a message received from the envi-ronment. We observe something, or induce something based on thinkingabout past observations, and decide which course of action would be mostbene¢cial. The action taken in response to the environmental messages iscalled a performance rule. Adaptation occurs by adjusting the strength of theperformance rule based on the payo¡ we actually received from it. Repeatediterations of the SEA cycle mimics what computer scientist John Hollandcalls the bucket brigade algorithm (Holland, 1996) which strengthens rulesthat belong to chains of action terminating in rewards. The process amountsto a progressive con¢rmation of hypotheses concerned with stage setting andsubgoals.
DMAIC, DMADV, and learning models 247
Figure 7.9. Juran’s spiral of progress in quality.
Figure 7.10. The Select-Experiment-Adapt (SEA) model for non-linear systems.
248 INTRODUCTION TO DMAIC
SEA versus PDSAIn the PDSA cycle, the plan documents the theory being tested. Deming
believed that a statement which conveys knowledge must predict future out-comes, with risk of being wrong, and that it ¢ts without failure observations ofthe past. Rational prediction, according to Deming, requires theory and buildsknowledge through systematic revision and extension of theory based on com-parison of prediction with observation. W|thout theory there is nothing torevise, so experience has no meaning (Deming, 1993).The SEA model, unlike the PDSA cycle, contains positive feedback loops,
making this a dynamic, non-linear system. These systems act like both commonand special causes in the Shewhart-Deming model. V|rtually undetectableminor di¡erences (common causes) are greatly ampli¢ed by positive feedbackand produce unpredictably large e¡ects (special causes). Because of positivefeedback the behavior of even simple systems like the one shown in Figure 7.10is unpredictable, even in principle. Of course, this illustration grossly oversim-pli¢es reality. In the real world there are many competitors, competitors forour customers, many customers, regulation, many employees changing thingsin our ¢rm, and so on. But the conclusion is the same: long-term forecasting isimpossible, and therefore long-term planning is invalid. The ‘‘P’’ (plan) in thePDSA cycle cannot be used for other than short-term planning or systems in astate of ‘‘control’’ in the Shewhart-Deming sense.The ‘‘S’’ (study) element is also suspect. What exactly are we studying? The
e¡ect of the action we took in the ‘‘A’’ (act) step? This won’t work because theobserved e¡ects are also in£uenced, even overwhelmed, by actions taken byother agents. Thus, we may falsely conclude that our actions had an e¡ect whenin fact they did not, leading to superstitious learning. For example, we run a spe-cial promotion and sales increase, leading us to conclude that the promotionwas a success. But in fact our promotion just happened to coincide with a cus-tomer promotion that created a temporary increase in demand for our product.Or wemay conclude that our actions did not have an e¡ect when in fact their
e¡ect was masked by activities by other agents. For example, perhaps our newmarketing program would have worked except that our competitor had ashort-term sale and our customer was under pressure to hold costs down dueto a temporary cash £ow problem.
Learning and the SEA modelIn the SEA model, there is no ‘‘learning’’ per se. There is merely strategic
adaptation. Computers can be programmed to modify performance rulesbased on payo¡s, but the computer doesn’t learn anything. It merely ‘‘discov-ers’’ new performance rules through successful adaptations based on repeated

DMAIC, DMADV, and learning models 249
trial and error, i.e., through iterations of the SEA loop. Learning in the humansense involves discovering principles that explain the reasons for the increasedor decreased payo¡s obtained by applying the performance rules. This is a dif-ferent thing entirely than simply discovering that a particular performancerule gives a somewhat higher payo¡. Learning makes it possible to skip one ormore generations of adaptation.One model that incorporates learning in a dynamic environment, the Select-
Experiment-Learn (SEL) model, is shown in Figure 7.11.
SEL also di¡ers from PDSA. Shewhart realized the value of discovering sci-enti¢c principles, and he also understood that progress was possible even with-out this knowledge. However, Shewhart believed that it was possible to applynatural laws to achieve ‘‘control within limits,’’ i.e., statistical certainty. WhatShewhart called a state of statistical control, I will call statistical equilibrium.A system exhibits statistical equilibriumwhen its future performance is predict-able within limits which can be determined using linear, negative feedbackmod-els. Chaos theory and complexity theory show that in dynamic environments,i.e., environments in£uenced by positive feedback, even this level of control isimpossible to achieve.
TheSELmodel is designed foradynamicenvironmentand itdoesnotattemptto develop long-range strategic plans basedon super-humanknowledge and fore-sight. Instead SEL seeks principles that are useful for making predictions, recog-nizing that positive feedback and the actions of other agents makes it di⁄cult toidentify the e¡ects of these principles. Furthermore, other agents may alsoacquire thisknowledgeandmodify theirbehavior, therebynegating theprinciple.For example, cooperation and reciprocity may appear to be a principle thatapplies to all human cultures. However, since the principle applies to agents,future behavior can not be predicted with even statistical certainty. If others rea-lize that you are applying this principle, they can take advantage of your predict-ability. Of course, until new breakthrough principles are learned, gradualcontinuous improvement can still be obtained by using the SEA model. Thecumulative improvement fromSEAcanbe signi¢cant (e.g., natural evolution).
Figure 7.11. The Select-Experiment-Learn (SEL) model for dynamic systems.

Essentially, when environments are dynamic the SEA and SEL modelsreplace the equilibrium environment PDSA learningmodel with dynamic adap-tation (SEA) and agent-based learning (SEL). Centralized control schemes(plans) are replaced by self-control or at least local control by meta-agents. SixSigma activities should employ all three strategies for improvement. Here aresome general guidelines to help you determine when to apply a given approach:
. SEA applies unless formal, controlled experiments are underway. Followa mini-max strategy: minimize central planning and control to the maxi-mum extent possible. Allow individual employees maximum freedom toexperiment and change their work environment and processes to seek bet-ter ways to do things.
. When processes are in£uenced by positive feedback from other agents,apply the SEA and SEL models. Eliminate long-term strategic planningand strive to cultivate an environment with maximum ability to adapt tochange.
. When processes are at or near equilibrium and not in£uenced by positivefeedback loops, PDSA applies. Since PDSA is planning based, the use offormal teams is justi¢ed. Rigorously apply the tools of process control,formal design of experiments, etc.
Illustration of PDSA, SEA and SELThe chart below shows the percentage change in the S and P 500 index of
stocks over a period of 100months. The data re£ect the buying and selling activ-ities of millions of investors. The data re£ect statistical control, i.e., equilibriumbehavior, for the entire period and PDSA functioned quite well for investorsduring the period. Using control charts the predicted return for the nextmonth is between�11.2% and +12.6%.
250 INTRODUCTION TO DMAIC

But this process turned out to be distinctly non-linear. In the month #101,investors (agents) reacted to a price drop by selling, which caused the price todrop further, which caused still more selling. In other words, this dynamic pro-cess encountered a positive feedback loop. The result of this SEA behavior: adrop of nearly 22% (indicated by an ‘‘X’’ on the chart); a far greater drop thanpredicted by linear statistical models.
Some investors were not in£uenced by the positive feedback. Using SELlogic, they examined macro and micro factors and found no reason for theplunge. Rather than selling, they either held on to their shares or bought more.For a while, it appeared that this strategy would back¢re: the market droppedanother 9% the next month. But it eventually recovered, regained all of the lostground, and moved back into positive territory.
DMAIC, DMADV, and learning models 251

DMAIC^ ^ ^CHAPTER
8
Problem Solving ToolsPROCESS MAPPING
Just as companies have organization charts, they can have process maps thatgive a picture of how work flows through the company. A process map createsa vocabulary to help people discuss process improvement. A process map is agraphic representation of a process, showing the sequence of tasks using a mod-ified version of standard flowcharting symbols. The map of a work process is apicture of how people do their work. Work process maps are similar to roadmaps in that there are many alternative routes that will accomplish the objec-tive. In any given circumstance, one routemay be better than others. By creatinga process map, the various alternatives are displayed and effective planning isfacilitated. The steps involved are as follows (Galloway, 1994):1. Select a process to be mapped.2. De¢ne the process.3. Map the primary process.4. Map alternative paths.5. Map inspection points.6. Use the map to improve the process.Processes correspond to natural business activities. However, in modern
organizations these natural processes are fragmented among many differentdepartments. A process map provides an integrated picture of the natural pro-cess. Because of the focus on organizational hierarchies, processes tend to beunmanaged. People are responsible for departments and budgets, but no one isresponsible for the processes.
Copyright 2003 by The McGraw-Hill Companies, Inc. Click Here for Terms of Use.
Because organizations are arranged as departments rather than processes, itis often difficult for people to see the processes that make up the business. Toget a better handle on the processes that make up a business, Hammer andChampy (1993, p. 118) suggest that they be given names that express their begin-ning and ending states. These names should imply all the work that gets donebetween their start and finish. Manufacturing, which sounds like a departmentname, is better called the procurement-to-shipment process. Some other recur-ring processes and their state-change names:
. Product development: concept to prototype
. Sales: prospect to order
. Order ful¢llment: order to payment
. Service: inquiry to resolution
Cycle time reduction through cross-functionalprocess mapping
Hurley and Loew (1996) describe how Motorola uses process mapping tohelp them reduce cycle times. Cross-functional process mapping involves cre-ating teams whose members are selected from every department involved inthe new product development cycleLfrom marketing to manufacturing toresearch and development. The next phase involves mapping each step withinthe product development process from start to finish. Team members aredivided into four categories:
. Project championLprovide resources and remove barriers
. Team leaderLorganize and conduct meetings, insure that informationexchange occurs
. Action item ownerLcomplete assigned tasks
. Team memberLcomplete assigned tasksThe teams develop two maps: an ‘‘as-is’’ map and a ‘‘should-be’’ map. The
As-is may detail the way the new product-development process is currentlyrun and identifies all the problematic issues that exist in the current way thatnew product development is accomplished. Using the cross-functional format,each step of the process is mapped out, along with the time each step takes.The result of the exercise is twofold: a map that shows the current process, andan appreciation among team members of the contributions of their fellowteam members. The As-is map can be used to improve the current process(KAIZEN). If possible, any steps that do not add value in the customer’s eyes,or that are redundant, should be deleted.The Should-be map forms the basis of reengineering the product develop-
ment process. The Should-be map details each step in the new, more efficient
Process mapping 253
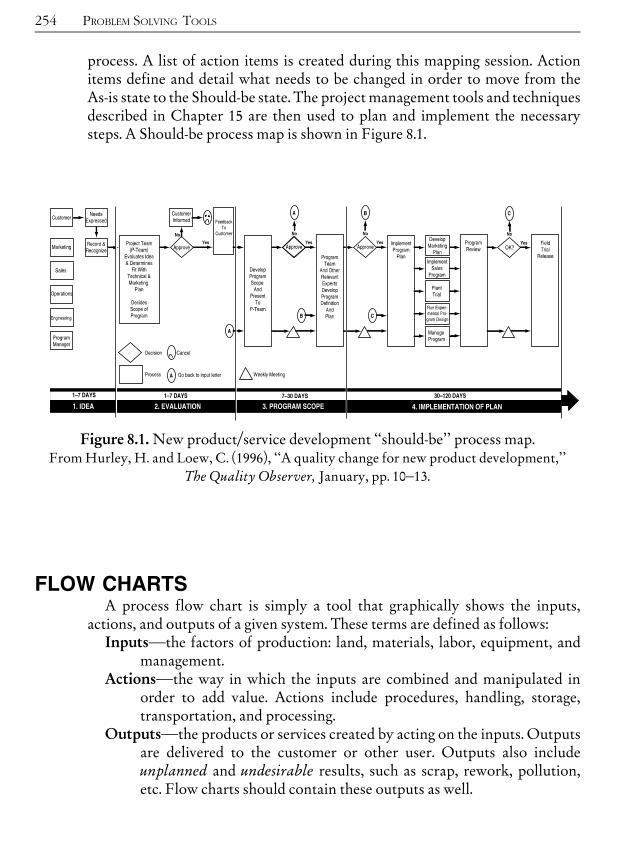
process. A list of action items is created during this mapping session. Actionitems define and detail what needs to be changed in order to move from theAs-is state to the Should-be state. The project management tools and techniquesdescribed in Chapter 15 are then used to plan and implement the necessarysteps. A Should-be process map is shown in Figure 8.1.
FLOW CHARTSA process flow chart is simply a tool that graphically shows the inputs,
actions, and outputs of a given system. These terms are defined as follows:InputsLthe factors of production: land, materials, labor, equipment, and
management.ActionsLthe way in which the inputs are combined and manipulated in
order to add value. Actions include procedures, handling, storage,transportation, and processing.
OutputsLthe products or services created by acting on the inputs. Outputsare delivered to the customer or other user. Outputs also includeunplanned and undesirable results, such as scrap, rework, pollution,etc. Flow charts should contain these outputs as well.
254 PROBLEM SOLVING TOOLS
Figure 8.1. New product/service development ‘‘should-be’’ process map.FromHurley, H. and Loew, C. (1996), ‘‘A quality change for new product development,’’
The Quality Observer, January, pp. 10^13.

Flow charting is such a useful activity that the symbols have been stan-dardized by various ANSI standards. There are special symbols for special pro-cesses, such as electronics or information systems. However, in most cases onecan get by with the symbols shown in Figure 8.2.
The flow chart in Figure 8.3 shows a high-level view of a process capabilityanalysis. The flow chart can be made either more complex or less complex. Asa rule of thumb, to paraphrase Albert Einstein, ‘‘Flow charts should be as simpleas possible, but not simpler.’’ The purpose of the flow chart is to help peopleunderstand the process and this is not accomplished with flow charts that areeither too simple or too complex.
CHECK SHEETSCheck sheets are devices which consist of lists of items and some indicator of
how often each item on the list occurs. In their simplest form, checklists aretools that make the data collection process easier by providing pre-writtendescriptions of events likely to occur. A well-designed check sheet will answerthe questions posed by the investigator. Some examples of questions are: ‘‘Haseverything been done?’’ ‘‘Have all inspections been performed?’’ ‘‘How oftendoes a particular problem occur?’’ ‘‘Are problems more common with part Xthan with part Y?’’ They also serve as reminders that direct the attention of thedata collector to items of interest and importance. Such simple check sheetsare called confirmation check sheets. Check sheets have been improved by add-ing a number of enhancements, a few of which are described belowAlthough they are simple, check sheets are extremely useful process-
improvement and problem-solving tools. Their power is greatly enhancedwhen they are used in conjunction with other simple tools, such as histogramsand Pareto analysis. Ishikawa (1985) estimated that 80% to 90% of all workplaceproblems could be solved using only the simple quality improvement tools.
Check sheets 255
Figure 8.2. Selected £ow chart symbols.
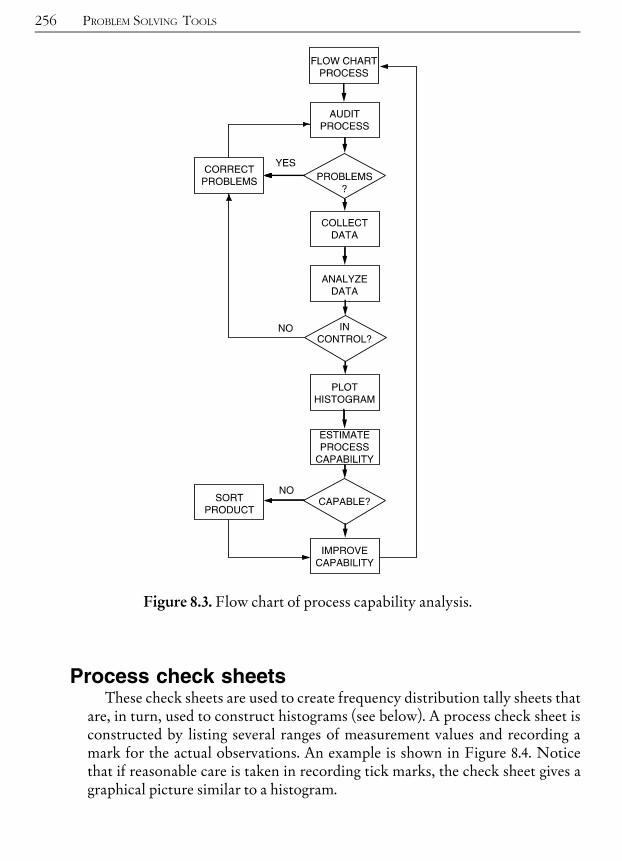
Process check sheetsThese check sheets are used to create frequency distribution tally sheets that
are, in turn, used to construct histograms (see below). A process check sheet isconstructed by listing several ranges of measurement values and recording amark for the actual observations. An example is shown in Figure 8.4. Noticethat if reasonable care is taken in recording tick marks, the check sheet gives agraphical picture similar to a histogram.
256 PROBLEM SOLVING TOOLS
Figure 8.3. Flow chart of process capability analysis.
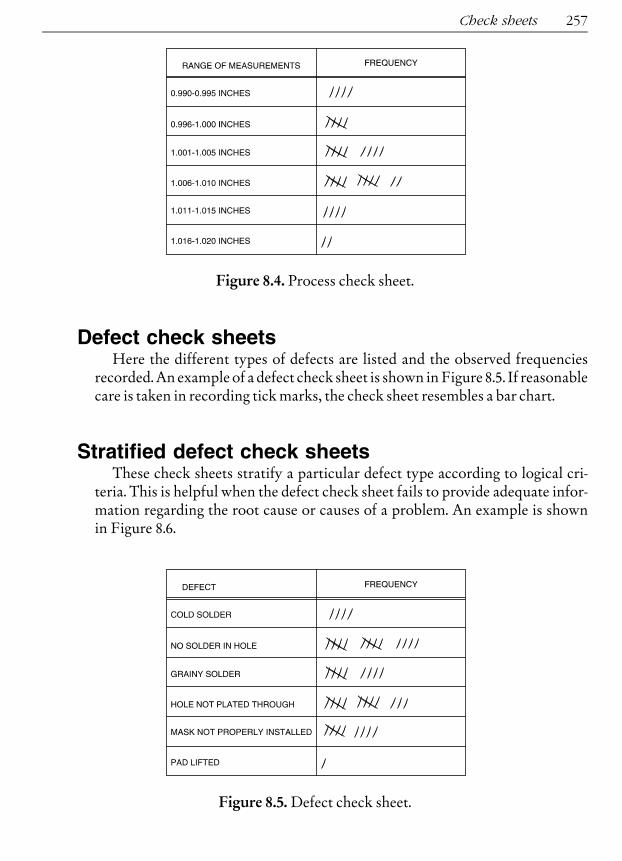
Defect check sheetsHere the different types of defects are listed and the observed frequencies
recorded. An example of a defect check sheet is shown inFigure 8.5. If reasonablecare is taken in recording tickmarks, the check sheet resembles a bar chart.
Stratified defect check sheetsThese check sheets stratify a particular defect type according to logical cri-
teria. This is helpful when the defect check sheet fails to provide adequate infor-mation regarding the root cause or causes of a problem. An example is shownin Figure 8.6.
Check sheets 257
Figure 8.4. Process check sheet.
Figure 8.5. Defect check sheet.
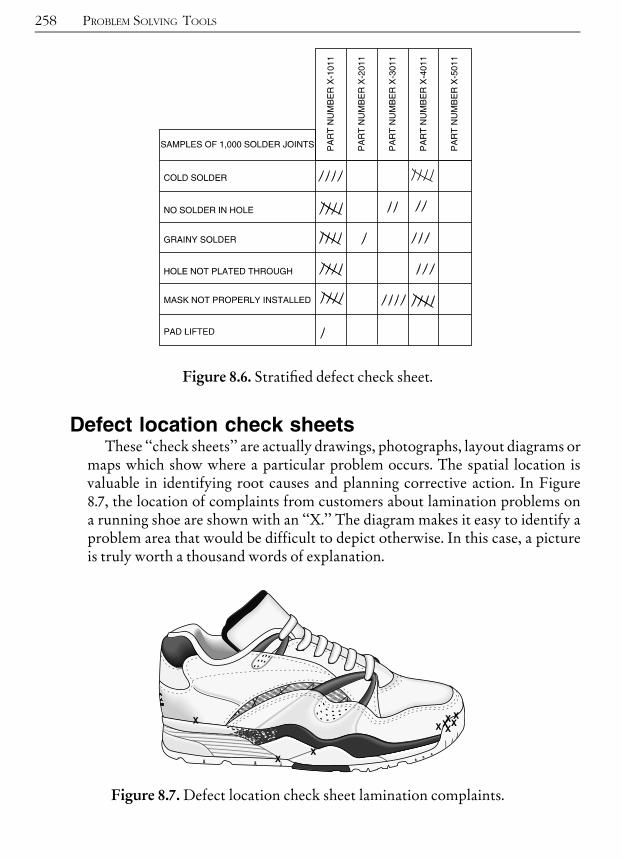
Defect location check sheetsThese ‘‘check sheets’’ are actually drawings, photographs, layout diagrams or
maps which show where a particular problem occurs. The spatial location isvaluable in identifying root causes and planning corrective action. In Figure8.7, the location of complaints from customers about lamination problems ona running shoe are shown with an ‘‘X.’’ The diagram makes it easy to identify aproblem area that would be difficult to depict otherwise. In this case, a pictureis truly worth a thousand words of explanation.
258 PROBLEM SOLVING TOOLS
Figure 8.6. Strati¢ed defect check sheet.
Figure 8.7. Defect location check sheet lamination complaints.

Cause and effect diagram check sheetsCause and effect diagrams can also serve as check sheets. Once the diagram
has been prepared, it is posted in the work area and the appropriate arrow ismarked whenever that particular cause or situation occurs. Teams can also usethis approach for historic data, when such data are available.
PARETO ANALYSISDefinitionLPareto analysis is the process of ranking opportunities to
determine which of many potential opportunities should be pursuedfirst. It is also known as ‘‘separating the vital few from the trivial many.’’
UsageLPareto analysis should be used at various stages in a qualityimprovement program to determine which step to take next. Paretoanalysis is used to answer such questions as ‘‘What department shouldhave the next SPC team?’’ or ‘‘On what type of defect should we con-centrate our efforts?’’
How to perform a Pareto analysis1. Determine the classi¢cations (Pareto categories) for the graph. If the
desired information does not exist, obtain it by designing check sheetsand log sheets.
2. Select a time interval for analysis. The interval should be long enough tobe representative of typical performance.
3. Determine the total occurrences (i.e., cost, defect counts, etc.) for eachcategory. Also determine the grand total. If there are several categorieswhich account for only a small part of the total, group these into a cat-egory called ‘‘other.’’
4. Compute the percentage for each category by dividing the categorytotal by the grand total and multiplying by 100.
5. Rank-order the categories from the largest total occurrences to thesmallest.
6. Compute the ‘‘cumulative percentage’’ by adding the percentage foreach category to that of any preceding categories.
7. Construct a chart with the left vertical axis scaled from 0 to at least thegrand total. Put an appropriate label on the axis. Scale the right verticalaxis from 0 to 100%, with 100% on the right side being the same heightas the grand total on the left side.
8. Label the horizontal axis with the category names. The left-most cate-gory should be the largest, second largest next, and so on.
Pareto analysis 259

9. Draw in bars representing the amount of each category. The height ofthe bar is determined by the left vertical axis.
10. Draw a line that shows the cumulative percentage column of the Paretoanalysis table. The cumulative percentage line is determined by theright vertical axis.
Example of Pareto analysisThe data in Table 8.1 have been recorded for peaches arriving at Super Duper
Market during August.
The Pareto table for the data in Table 8.1 is shown in Table 8.2.
260 PROBLEM SOLVING TOOLS
Table 8.1. Raw data for Pareto analysis.
PROBLEM PEACHES LOST
Bruised 100
Undersized 87
Rotten 235
Underripe 9
Wrong variety 7
Wormy 3
Table 8.2. Data organized for Pareto analysis.
RANK CATEGORY COUNT PERCENTAGE CUM %
1 Rotten 235 53.29 53.29
2 Bruised 100 22.68 75.97
3 Undersized 87 19.73 95.70
4 Other 19 4.31 100.01
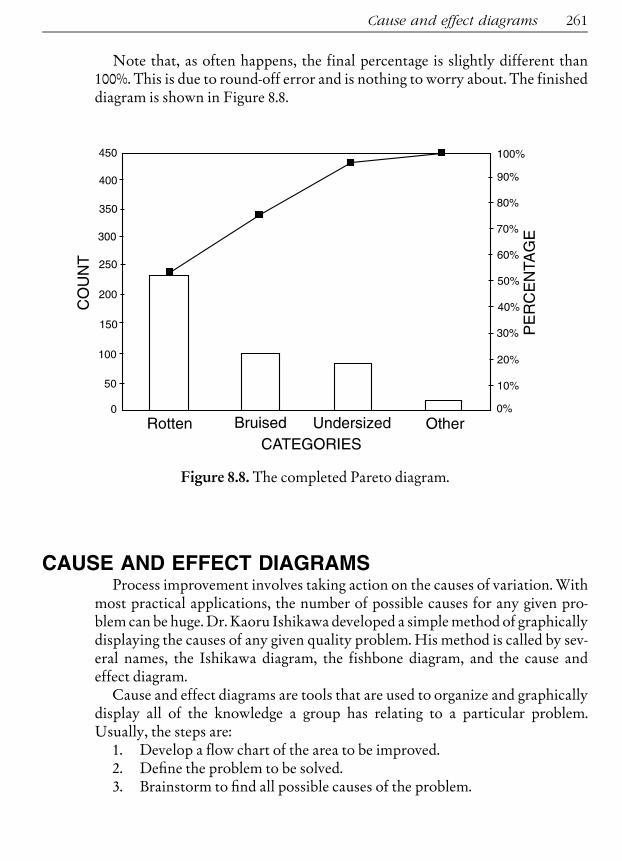
Note that, as often happens, the final percentage is slightly different than100%. This is due to round-off error and is nothing to worry about. The finisheddiagram is shown in Figure 8.8.
CAUSE AND EFFECT DIAGRAMSProcess improvement involves taking action on the causes of variation. With
most practical applications, the number of possible causes for any given pro-blem can be huge. Dr. Kaoru Ishikawa developed a simplemethod of graphicallydisplaying the causes of any given quality problem. His method is called by sev-eral names, the Ishikawa diagram, the fishbone diagram, and the cause andeffect diagram.Cause and effect diagrams are tools that are used to organize and graphically
display all of the knowledge a group has relating to a particular problem.Usually, the steps are:1. Develop a £ow chart of the area to be improved.2. De¢ne the problem to be solved.3. Brainstorm to ¢nd all possible causes of the problem.
Cause and effect diagrams 261
Figure 8.8. The completed Pareto diagram.
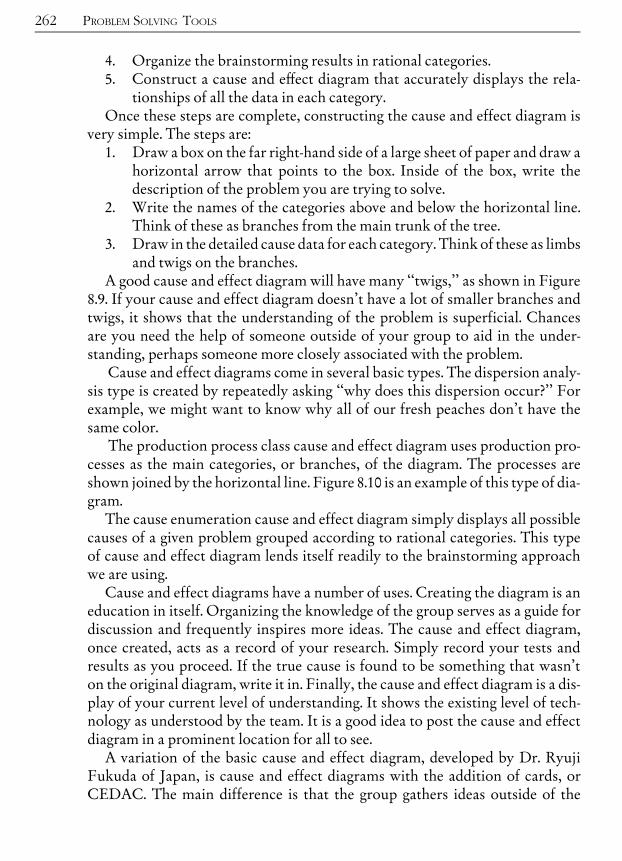
4. Organize the brainstorming results in rational categories.5. Construct a cause and e¡ect diagram that accurately displays the rela-
tionships of all the data in each category.Once these steps are complete, constructing the cause and effect diagram is
very simple. The steps are:1. Draw a box on the far right-hand side of a large sheet of paper and draw a
horizontal arrow that points to the box. Inside of the box, write thedescription of the problem you are trying to solve.
2. Write the names of the categories above and below the horizontal line.Think of these as branches from the main trunk of the tree.
3. Draw in the detailed cause data for each category. Think of these as limbsand twigs on the branches.
A good cause and effect diagram will have many ‘‘twigs,’’ as shown in Figure8.9. If your cause and effect diagram doesn’t have a lot of smaller branches andtwigs, it shows that the understanding of the problem is superficial. Chancesare you need the help of someone outside of your group to aid in the under-standing, perhaps someone more closely associated with the problem.
Cause and effect diagrams come in several basic types. The dispersion analy-sis type is created by repeatedly asking ‘‘why does this dispersion occur?’’ Forexample, we might want to know why all of our fresh peaches don’t have thesame color.
The production process class cause and effect diagram uses production pro-cesses as the main categories, or branches, of the diagram. The processes areshown joined by the horizontal line. Figure 8.10 is an example of this type of dia-gram.The cause enumeration cause and effect diagram simply displays all possible
causes of a given problem grouped according to rational categories. This typeof cause and effect diagram lends itself readily to the brainstorming approachwe are using.Cause and effect diagrams have a number of uses. Creating the diagram is an
education in itself. Organizing the knowledge of the group serves as a guide fordiscussion and frequently inspires more ideas. The cause and effect diagram,once created, acts as a record of your research. Simply record your tests andresults as you proceed. If the true cause is found to be something that wasn’ton the original diagram, write it in. Finally, the cause and effect diagram is a dis-play of your current level of understanding. It shows the existing level of tech-nology as understood by the team. It is a good idea to post the cause and effectdiagram in a prominent location for all to see.A variation of the basic cause and effect diagram, developed by Dr. Ryuji
Fukuda of Japan, is cause and effect diagrams with the addition of cards, orCEDAC. The main difference is that the group gathers ideas outside of the
262 PROBLEM SOLVING TOOLS

Cause and effect diagrams 263
Fig
ure
8.9.Causeande¡ectdiagram
.
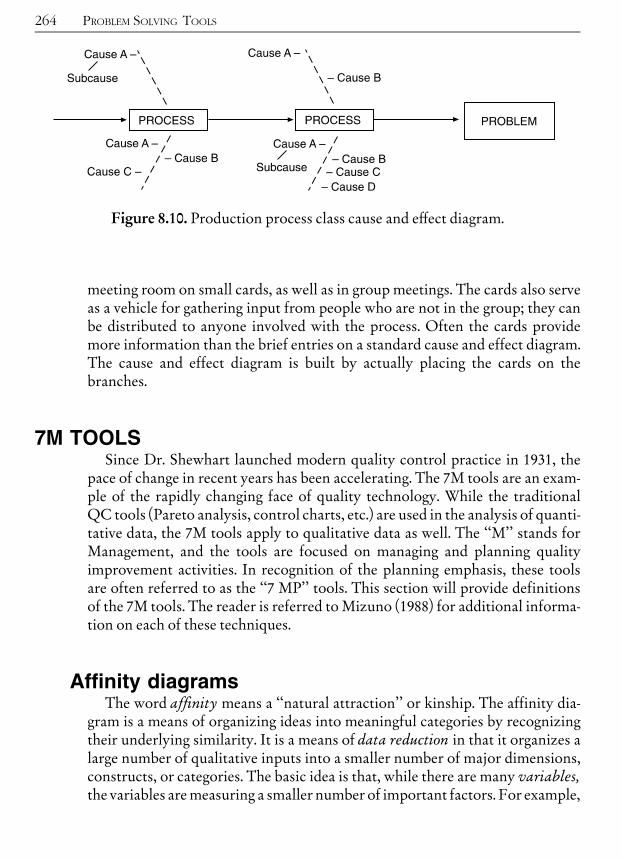
meeting room on small cards, as well as in group meetings. The cards also serveas a vehicle for gathering input from people who are not in the group; they canbe distributed to anyone involved with the process. Often the cards providemore information than the brief entries on a standard cause and effect diagram.The cause and effect diagram is built by actually placing the cards on thebranches.
7M TOOLSSince Dr. Shewhart launched modern quality control practice in 1931, the
pace of change in recent years has been accelerating. The 7M tools are an exam-ple of the rapidly changing face of quality technology. While the traditionalQC tools (Pareto analysis, control charts, etc.) are used in the analysis of quanti-tative data, the 7M tools apply to qualitative data as well. The ‘‘M’’ stands forManagement, and the tools are focused on managing and planning qualityimprovement activities. In recognition of the planning emphasis, these toolsare often referred to as the ‘‘7 MP’’ tools. This section will provide definitionsof the 7M tools. The reader is referred to Mizuno (1988) for additional informa-tion on each of these techniques.
Affinity diagramsThe word affinity means a ‘‘natural attraction’’ or kinship. The affinity dia-
gram is a means of organizing ideas into meaningful categories by recognizingtheir underlying similarity. It is a means of data reduction in that it organizes alarge number of qualitative inputs into a smaller number of major dimensions,constructs, or categories. The basic idea is that, while there are many variables,the variables aremeasuring a smaller number of important factors. For example,
264 PROBLEM SOLVING TOOLS
Figure 8.10. Production process class cause and e¡ect diagram.

if patients are interviewed about their hospital experience they may say ‘‘thedoctor was friendly,’’ ‘‘the doctor knew what she was doing,’’ and ‘‘the doctorkeptme informed.’’ Each of these statements relates to a single thing, the doctor.Many times affinity diagrams are constructed using existing data, such asmemos, drawings, surveys, letters, and so on. Ideas are sometimes generated inbrainstorming sessions by teams. The technique works as follows:1. Write the ideas on small pieces of paper (Post-itsTM or 3� 5 cards work
very well).2. The team works in silence to arrange the ideas into separate categories.
Silence is believed to help because the task involves pattern recognitionand some research shows that for some people, particularly males, lan-guage processing involves the left side of the brain. Research also showsthat left-brain thinking tends to be more linear, which is thought to inhi-bit creativity and pattern recognition. Thus, by working silently, theright brain is more involved in the task. To put an idea into a category aperson simply picks up the Post-itTM and moves it.
3. The ¢nal groupings are then reviewed and discussed by the team.Usually, the grouping of ideas helps the team to develop a coherent plan.
Affinity diagrams are useful for analysis of quality problems, defect data, cus-tomer complaints, survey results, etc. They can be used in conjunction withother techniques such as cause and effect diagrams or interrelationship digraphs(see below). Figure 8.11 is an example of an affinity diagram.
Tree diagramsTree diagrams are used to break down or stratify ideas in progressively
greater detail. The objective is to partition a big idea or problem into its smallercomponents. By doing this you will make the idea easier to understand, or theproblem easier to solve. The basic idea behind this is that, at some level, a pro-blem’s solution becomes relatively easy to find. Figure 8.12 shows an exampleof a tree diagram. Quality improvement would progress from the right-mostportion of the tree diagram to the left-most. Another common usage of tree dia-grams is to show the goal or objective on the left side and the means of accom-plishing the goal, to the right.
Process decision program chartsThe process decision program chart (PDPC) is a technique designed to help
prepare contingency plans. It is modeled after reliability engineering methodsof failure mode, effects, and criticality analysis (FMECA) and fault tree analysis(see Chapter 16). The emphasis of PDPC is the impact of the ‘‘failures’’ (pro-
7M tools 265
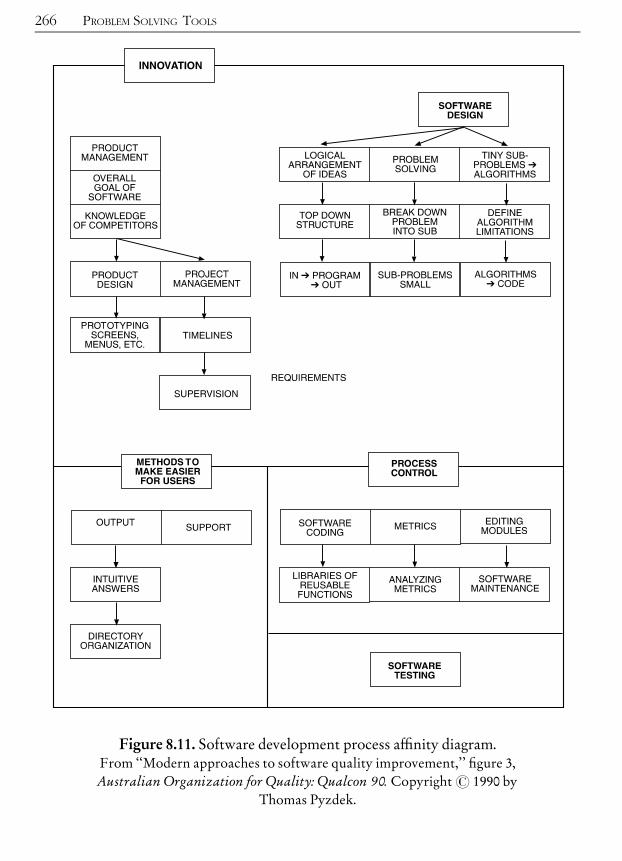
266 PROBLEM SOLVING TOOLS
Figure 8.11. Software development process a⁄nity diagram.From ‘‘Modern approaches to software quality improvement,’’ ¢gure 3,Australian Organization for Quality: Qualcon 90.Copyright# 1990 by
Thomas Pyzdek.

blems) on project schedules. Also, PDPC seeks to describe specific actions to betaken to prevent the problems from occurring in the first place, and to mitigatethe impact of the problems if they do occur. An enhancement to classicalPDPC is to assign subjective probabilities to the various problems and to usethese to help assign priorities. Figure 8.13 shows a PDPC.
7M tools 267
Figure 8.12. An example of a tree diagram.
Figure 8.13. Process decision program chart.

Matrix diagramsA matrix diagram is constructed to analyze the correlations between two
groups of ideas. Actually, quality function deployment (QFD) is an enhancedmatrix diagram (see Chapter 3 for a discussion of QFD). The major advantageof constructing matrix diagrams is that it forces you to systematically analyzecorrelations. Matrix diagrams can be used in conjunction with decision trees.To do this, simply use the most detailed level of two decision trees as the con-tents of rows and columns of a matrix diagram. An example of a matrix diagramis shown in Figure 8.14.
Interrelationship digraphsLike affinity diagrams, interrelationship digraphs are designed as a means of
organizing disparate ideas, usually (but not always) ideas generated in brain-storming sessions. However, while affinity diagrams seek to simply arrangerelated ideas into groups, interrelationship digraphs attempt to define theways in which ideas influence one another. It is best to use both affinity dia-grams and interrelationship digraphs.
268 PROBLEM SOLVING TOOLS
Figure 8.14. An example of a matrix diagram.

The interrelationship digraph begins by writing down the ideas on smallpieces of paper, such as Post-itsTM. The pieces of paper are then placed on alarge sheet of paper, such as a flip-chart sheet or a piece of large-sized blue-printpaper. Arrows are drawn between related ideas. An idea that has arrows leavingit but none entering is a ‘‘root idea.’’ By evaluating the relationships betweenideas you will get a better picture of the way things happen. The root ideas areoften keys to improving the system. Figure 8.15 illustrates a simple interrela-tionship digraph.
Prioritization matrices*To prioritize is to arrange or deal with in order of importance. A prioritiza-
tion matrix is a combination of a tree diagram and a matrix chart and it is usedto help decision makers determine the order of importance of the activities
7M tools 269
Figure 8.15. How does ‘‘people management’’ impact change?
*This chart replaces the matrix data analysis chart, formerly one of the 7M tools. The matrix data analysis chart was based on
factor analysis or principal components analysis. This dependence on heavy-duty statistical methods made it unacceptable
as a tool for use by non-statisticians on a routine basis.
or goals being considered. Prioritization matrices are designed to rationallynarrow the focus of the team to those key issues and options which aremost important to the organization. Brassard (1989, pp. 102^103) presentsthree methods for developing prioritization matrices: the full analyticalcriteria method, the combination interrelationship digraph (ID)/matrixmethod, and the consensus criteria method. We will discuss the three differentmethods.
FULL ANALYTICAL CRITERIA METHODThe full analytical criteria method is based upon work done by Saaty (1988).
Saaty’s approach is called the analytic hierarchy process (AHP). While analyti-cally rigorous, AHP is cumbersome in both data collection procedures and theanalysis. This author recommends that this approach be reserved for truly‘‘heavy-duty’’ decisions of major strategic importance to the organization. Inthose cases, you may wish to obtain consulting assistance to assure that theapproach is properly applied. In addition, you may want to acquire software toassist in the analysis.* Brassard (1989) and Saaty (1988) provide detailed exam-ples of the application of the full analytical criteria approach.
COMBINATION ID/MATRIX METHODThe interrelationship digraph (ID) is a method used to uncover patterns in
cause and effect relationships (see above). This approach to creating a priori-tization matrix begins with a tree diagram (see above). Items at the right-mostlevel of the tree diagram (the most detailed level) are placed in a matrix (i.e.,both the rows and columns of the matrix are the items from the right-most posi-tion of the tree diagram) and their impact on one another evaluated. The IDmatrix is developed by starting with a single item, then adding items one byone. As each item is added, the team answers the question ‘‘is this item causedby X?’’ where X is another item. The process is repeated item by item until therelationship between each item and every other item has been determined. Ifthe answer is ‘‘yes,’’ then an arrow is drawn between the ‘‘cause’’ item and the‘‘effect’’ item. The strength of the relationship is determined by consensus. Thefinal result is an estimate of the relative strength of each item and its effect onother items.
270 PROBLEM SOLVING TOOLS
*At the time of this writing, software was available fromQuality America, Inc., in Tucson, Arizona, and Expert Choice, Inc.,
in Pittsburgh, Pennsylvania.

In Figure 8.16, an ‘‘in’’ arrow points left and indicates that the column itemleads to the row item. On the ID, this would be indicated by an arrow from thecolumn item to the row item. An ‘‘out’’ arrow points upward and indicates theopposite of an ‘‘in’’ arrow. To maintain symmetry, if an in arrow appears in arow/column cell, an out arrow must appear in the corresponding column/rowcell, and vice versa.Once the final matrix has been created, priorities are set by evaluating the
strength column, the total arrows column, and the relationship between thenumber of in and out arrows. An item with a high strength and a large numberof out arrows would be a strong candidate because it is important (highstrength) and it influences a large number of other options (many arrows, pre-dominately out arrows). Items with high strength and a large number of inarrows are candidates for outcome measures of success.
CONSENSUS CRITERIA METHODThe consensus criteria method is a simplified approach to selecting from sev-
eral options according to some criteria. It begins with a matrix where the differ-ent options under consideration are placed in rows and the criteria to be usedare shown in columns. The criteria are given weights by the team using the con-
7M tools 271
Figure 8.16. Combination ID/matrix method.Use the best mix of marketing medium.

sensus decision rule. For example, if criterion #1 were given a weight of 3 andthe group agreed that criterion #2 was twice as important, then criterion #2would receive a weight of 6. Another way to do the weighting is to give theteam $1 in nickels and have them ‘‘spend’’ the dollar on the various criteria.The resulting value allocated to each criterion is its weight. The group thenrank-orders the options based on each criterion. Ranks are labeled such thatthe option that best meets the criterion gets the highest rank; e.g., if there arefive options being considered for a given criterion, the option that best meetsthe criterion is given a rank of 5.The options are then prioritized by adding up the option’s rank for each cri-
terion multiplied by the criterion weight.
Example of consensus criteria methodA team had to choose which of four projects to pursue first. To help them
decide, they identified four criteria for selection and their weights as follows:high impact on bottom line (weight¼ 0.25), easy to implement (0.15), low costto implement (0.20) and high impact on customer satisfaction (0.40). The fourprojects were then ranked according to each of the criteria; the results areshown in the table below.
In the above example, the team would begin with project #2 because it hasthe highest score. If the team had difficulty reaching consensus on the weightsor ranks, they could use totals or a method such as the nominal group techniquedescribed below.
272 PROBLEM SOLVING TOOLS
Weight !Criteria and weights
0.25 0.15 0.2 0.4
Bottomline Easy
Lowcost
Customersatisfaction Total
Project 1 1 2 2 1 1.35
Project 2 3 4 4 3 3.35
Project 3 2 1 3 4 2.85
Project 4 4 3 1 2 2.45

Activity network diagramActivity network diagrams, sometimes called arrow diagrams, have their
roots in well-established methods used in operations research. The arrow dia-gram is directly analogous to the critical path method (CPM) and the programevaluation and review technique (PERT) discussed in Chapter 15. These twoproject management tools have been used for many years to determine whichactivities must be performed, when they must be performed, and in whatorder. Unlike CPM and PERT, which require training in project managementor systems engineering, arrow diagrams are greatly simplified so that they canbe used with a minimum of training. An illustration of an arrow (PERT) dia-gram, is reproduced in Figure 8.17.
Other continuous improvement toolsOver the years, the tools of quality improvement have proliferated. By some
estimates there are now over 400 tools in the ‘‘TQM Toolbox.’’ This authorbelieves that it is possible to make dramatic improvements with the tools
7M tools 273
Figure 8.17. PERT network for constructing a house.

already described, combined with the powerful statistical techniques describedin other parts of this book. However, in addition to the tools already discussed,there are two more simple tools that the author believes deserve mention: thenominal group technique, and force-field analysis. These tools are commonlyused to help teams move forward by obtaining input from all interested partiesand identifying the obstacles they face.
NOMINAL GROUP TECHNIQUEThe nominal group technique (NGT) is a method for generating a ‘‘short
list’’ of items to be acted upon. The NGT uses a highly structured approachdesigned to reduce the usual give-and-take among group members. Usage ofthe NGT is indicated when 1) the group is new or has several new members, 2)when the topic under consideration is controversial, or 3) when the team isunable to resolve a disagreement. Scholtes (1988) describes the steps involvedin the NGT. A summary of the approach is shown below.
Part ILA formalized brainstorm1. De¢ne the task in the form of a question.2. Describe the purpose of this discussion and the rules and procedures of
the NGT.3. Introduce and clarify the question.4. Generate ideas. Do this by having the team write down their ideas in
silence.5. List the ideas obtained.6. Clarify and discuss the ideas.
Part IILMaking the selection1. Choose the top 50 ideas. Note: members can remove their ideas from
consideration if they wish, but no member can remove another’s idea.2. Pass out index cards to eachmember, using the following table as a guide:
IDEAS INDEX CARDS
less than 2020^3536^50
4 cards6 cards8 cards
3. Each member writes down their choices from the list, one choice percard.
274 PROBLEM SOLVING TOOLS

4. Eachmember rank-orders their choices and writes the rank on the cards.5. Record the group’s choices and ranks.6. Group reviews and discusses the results. Consider: How often was an
item selected? What is the total of the ranks for each item?If the team can agree on the importance of the item(s) that got the highest
score(s) (sum of ranks), then the team moves on to preparing an action plan todeal with the item or items selected.
FORCE-FIELD ANALYSISForce-field analysis (FFA) is a method borrowed from the mechanical engi-
neering discipline known as free-body diagrams. Free-body diagrams aredrawn to help the engineer identify all the forces surrounding and acting on abody. The objective is to ascertain the forces leading to an equilibrium state forthe body.In FFA the ‘‘equilibrium’’ is the status quo. FFA helps the team under-
stand the forces that keep things the way they are. Some of the forces are‘‘drivers’’ that move the system towards a desired goal. Other forces are‘‘restrainers’’ that prevent the desired movement and may even cause move-ment away from the goal. Once the drivers and restrainers are known, theteam can design an action plan which will 1) reduce the forces restrainingprogress and 2) increase the forces which lead to movement in the desireddirection.FFA is useful in the early stages of planning. Once restrainers are explicitly
identified, a strategic plan can be prepared to develop the drivers necessary toovercome them. FFA is also useful when progress has stalled. By performingFFA, people are brought together and guided toward consensus, an activitythat, by itself, often overcomes a number of obstacles. Pyzdek (1994) lists the fol-lowing steps for conducting FFA.1. Determine the goal.2. Create a team of individuals with the authority, expertise, and interest
needed to accomplish the goal.3. Have the team use brainstorming or theNGT to identify restrainers and
drivers.4. Create a force-¢eld diagram or table which lists the restrainers and
drivers.5. Prepare a plan for removing restrainers and increasing drivers.
An example of a force-field diagram is shown in Figure 8.18.
7M tools 275

It may be helpful to assign ‘‘strength weights’’ to the drivers and restrainers(e.g., weak, moderate, strong).
276 PROBLEM SOLVING TOOLS
Figure 8.18. Example of a force-¢eld diagram.From Pocket Guide to Quality Tools, p. 10. Copyright# 1995 by Thomas Pyzdek.

DMAIC^ ^ ^CHAPTER
9
Basic Principles ofMeasurement
An argument can be made for asserting that quality begins with measure-ment. Only when quality is quantified can meaningful discussion aboutimprovement begin. Conceptually, measurement is quite simple: measure-ment is the assignment of numbers to observed phenomena according tocertain rules. Measurement is a sine qua non of any science, including manage-ment science.
SCALES OF MEASUREMENTA measurement is simply a numerical assignment to something, usually a
non-numerical element. Measurements convey certain information about therelationship between the element and other elements. Measurement involves atheoretical domain, an area of substantive concern represented as an empiricalrelational system, and a domain represented by a particular selected numericalrelational system. There is amapping function that carries us from the empiricalsystem into the numerical system. The numerical system is manipulated andthe results of the manipulation are studied to help the manager better under-stand the empirical system.In reality, measurement is problematic: the manager can never know the
‘‘true’’ value of the element being measured. The numbers provide informationon a certain scale and they represent measurements of some unobservable vari-
Copyright 2003 by The McGraw-Hill Companies, Inc. Click Here for Terms of Use.

able of interest. Some measurements are richer than others, i.e., some measure-ments provide more information than other measurements. The informationcontent of a number is dependent on the scale of measurement used. This scaledetermines the types of statistical analyses that can be properly employed instudying the numbers. Until one has determined the scale of measurement,one cannot know if a given method of analysis is valid.The four measurement scales are: nominal, ordinal, interval, and ratio.
Harrington (1992) summarizes the properties of each scale in Table 9.1.
Numbers on a nominal scale aren’t measurements at all, they are merely cat-egory labels in numerical form. Nominal measurements might indicate mem-bership in a group (1¼male, 2¼female) or simply represent a designation(John Doe is #43 on the team). Nominal scales represent the simplest and
278 BASIC PRINCIPLES of MEASUREMENT
Table 9.1. Types of measurement scales and permissible statistics.FromQuality Engineering Handbook, p. 516. Copyright# 1992. Used by permission of
the publisher, ASQQuality Press, Milwaukee, Wisconsin.
SCALE DEFINITION EXAMPLE STATISTICS
Nominal Only the presence/absence ofan attribute; can only countitems
go/no go;success/fail;accept/reject
percent;proportion;chi-square tests
Ordinal Can say that one item hasmore or less of an attributethan another item; can order aset of items
taste;attractiveness
rank-ordercorrelation
Interval Di¡erence between any twosuccessive points is equal;often treated as a ratio scaleeven if assumption of equalintervals is incorrect; can add,subtract, order objects
calendar time;temperature
correlations;t-tests; F-tests;multipleregression
Ratio True zero point indicatesabsence of an attribute; canadd, subtract, multiply anddivide
elapsed time;distance; weight
t-test; F-test;correlations;multipleregression

weakest form of measurement. Nominal variables are perhaps best viewed as aform of classification rather than as a measurement scale. Ideally, categories onthe nominal scale are constructed in such a way that all objects in the universeare members of one and only one class. Data collected on a nominal scale arecalled attribute data. The only mathematical operations permitted on nominalscales are ¼ (which shows that an object possesses the attribute of concern)or 6¼.An ordinal variable is one that has a natural ordering of its possible values,
but for which the distances between the values are undefined. An example isproduct preference rankings such as good, better, best. Ordinal data can be ana-lyzed with the mathematical operators,¼ (equality), 6¼ (inequality),> (greaterthan) and< (less than). There are a wide variety of statistical techniques whichcan be applied to ordinal data including the Pearson correlation. Other ordinalmodels include odds-ratio measures, log-linear models and logit models, bothof which are used to analyze cross-classifications of ordinal data presented incontingency tables. In quality management, ordinal data are commonly con-verted into nominal data and analyzed using binomial or Poisson models. Forexample, if parts were classified using a poor-good-excellent ordering, the qual-ity analyst might plot a p chart of the proportion of items in the poor category.
Interval scales consist of measurements where the ratios of differences areinvariant. For example, 908C¼ 1948F, 1808C¼ 3568F, 2708C¼ 5188F, 3608C¼ 6808F. Now 1948F/908C 6¼ 3568F/1808C but
3568F� 1948F6808F� 5188F
¼ 1808C� 908C3608C� 2708C
Conversion between two interval scales is accomplished by the transforma-tion y ¼ axþ b; a > 0. For example, 8F ¼ 32þ ð95 � 8C), where a ¼ 9=5,b ¼ 32. As with ratio scales, when permissible transformations are made statis-tical, results are unaffected by the interval scale used. Also, 08 (on either scale)is arbitrary. In this example, zero does not indicate an absence of heat.
Ratio scalemeasurements are so called because measurements of an object intwo different metrics are related to one another by an invariant ratio. For exam-ple, if an object’s mass was measured in pounds (x) and kilograms (y), thenx=y ¼ 2:2 for all values of x and y. This implies that a change from one ratiomeasurement scale to another is performed by a transformation of the formy ¼ ax, a > 0; e.g., pounds = 2.2 � kilograms. When permissible transforma-tions are used, statistical results based on the data are identical regardless ofthe ratio scale used. Zero has an inherent meaning: in this example it signifiesan absence of mass.
Scales of measurement 279
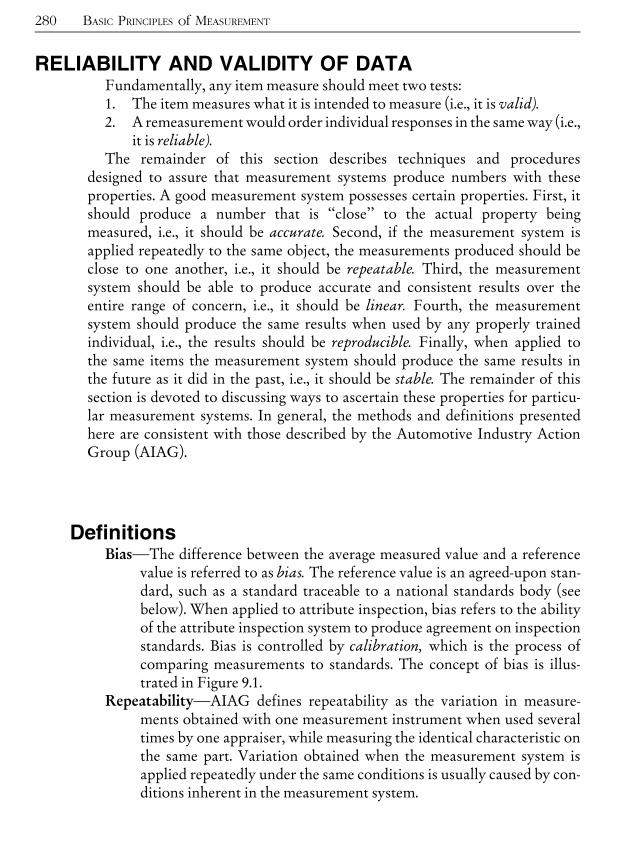
RELIABILITY AND VALIDITY OF DATAFundamentally, any item measure should meet two tests:1. The item measures what it is intended to measure (i.e., it is valid).2. A remeasurement would order individual responses in the sameway (i.e.,
it is reliable).The remainder of this section describes techniques and procedures
designed to assure that measurement systems produce numbers with theseproperties. A good measurement system possesses certain properties. First, itshould produce a number that is ‘‘close’’ to the actual property beingmeasured, i.e., it should be accurate. Second, if the measurement system isapplied repeatedly to the same object, the measurements produced should beclose to one another, i.e., it should be repeatable. Third, the measurementsystem should be able to produce accurate and consistent results over theentire range of concern, i.e., it should be linear. Fourth, the measurementsystem should produce the same results when used by any properly trainedindividual, i.e., the results should be reproducible. Finally, when applied tothe same items the measurement system should produce the same results inthe future as it did in the past, i.e., it should be stable. The remainder of thissection is devoted to discussing ways to ascertain these properties for particu-lar measurement systems. In general, the methods and definitions presentedhere are consistent with those described by the Automotive Industry ActionGroup (AIAG).
DefinitionsBiasLThe difference between the average measured value and a reference
value is referred to as bias. The reference value is an agreed-upon stan-dard, such as a standard traceable to a national standards body (seebelow). When applied to attribute inspection, bias refers to the abilityof the attribute inspection system to produce agreement on inspectionstandards. Bias is controlled by calibration, which is the process ofcomparing measurements to standards. The concept of bias is illus-trated in Figure 9.1.
RepeatabilityLAIAG defines repeatability as the variation in measure-ments obtained with one measurement instrument when used severaltimes by one appraiser, while measuring the identical characteristic onthe same part. Variation obtained when the measurement system isapplied repeatedly under the same conditions is usually caused by con-ditions inherent in the measurement system.
280 BASIC PRINCIPLES of MEASUREMENT
ASQ defines precision as ‘‘The closeness of agreement between ran-domly selected individual measurements or test results. NOTE: Thestandard deviation of the error of measurement is sometimes called‘imprecision’.’’ This is similar to what we are calling repeatability.Repeatability is illustrated in Figure 9.2.
ReproducibilityLReproducibility is the variation in the average of the mea-surements made by different appraisers using the same measuringinstrument when measuring the identical characteristic on the samepart. Reproducibility is illustrated in Figure 9.3.
StabilityLStability is the total variation in the measurements obtained witha measurement system on the same master or parts when measuring asingle characteristic over an extended time period. A system is said tobe stable if the results are the same at different points in time. Stabilityis illustrated in Figure 9.4.
LinearityLthe difference in the bias values through the expected operatingrange of the gage. Linearity is illustrated in Figure 9.5.
Reliability and validity of data 281
Figure 9.1. Bias illustrated.

282 BASIC PRINCIPLES of MEASUREMENT
Figure 9.2. Repeatability illustrated.
Figure 9.3. Reproducibility illustrated. Figure 9.4. Stability illustrated.

OVERVIEW OF STATISTICAL METHODSEnumerative versus analytic statistical methods
How would you respond to the following question?
A sample of 100 bottles taken from a ¢lling process has an average of 11.95ounces and a standard deviation of 0.1 ounce. The speci¢cations are 11.9^12.1 ounces. Based on these results, should you
a. Do nothing?b. Adjust the average to precisely 12 ounces?
Overview of statistical methods 283
Figure 9.5. Linearity illustrated.

c. Compute a confidence interval about the mean and adjust theprocess if the nominal fill level is not within the confidenceinterval?
d. None of the above?
The correct answer is d, none of the above. The other choices all make themistake of applying enumerative statistical concepts to an analytic statisticalsituation. In short, the questions themselves are wrong! For example, based onthe data, there is no way to determine if doing nothing is appropriate. ‘‘Doingsomething’’ implies that there is a known cause and effect mechanism whichcan be employed to reach a known objective. There is nothing to suggest thatthis situation exists. Thus, we can’t simply adjust the process average to thenominal value of 12 ounces, even though the process appears to be 5 standarderrors below this value. This might have happened because the first 50 were 10standard errors below the nominal and the last 50 were exactly equal to the nom-inal (or any of a nearly infinite number of other possible scenarios). The confi-dence interval calculation fails for the same reason. Figure 9.6 illustrates someprocesses that could produce the statistics provided above.Some appropriate analytic statistics questions might be:. Is the process central tendency stable over time?. Is the process dispersion stable over time?. Does the process distribution change over time?If any of the above are answered ‘‘no,’’ then what is the cause of the insta-
bility? To help answer this question, ask ‘‘what is the nature of the variation asrevealed by the patterns?’’ when plotted in time-sequence and stratified in var-ious ways.
If none of the above are answered ‘‘no,’’ then, and only then, we can ask suchquestions as
. Is the process meeting the requirements?
. Can the process meet the requirements?
. Can the process be improved by recentering it?
. How can we reduce variation in the process?
WHAT ARE ENUMERATIVE AND ANALYTICSTUDIES?Deming (1975) defines enumerative and analytic studies as follows:Enumerative studyLa study in which action will be taken on the universe.Analytic studyLa study in which action will be taken on a process to
improve performance in the future.
284 BASIC PRINCIPLES of MEASUREMENT

The term ‘‘universe’’ is defined in the usual way: the entire group of interest,e.g., people, material, units of product, which possess certain properties of inter-est. An example of an enumerative study would be sampling an isolated lot todetermine the quality of the lot.
In an analytic study the focus is on a process and how to improve it. The focusis the future. Thus, unlike enumerative studies which make inferences aboutthe universe actually studied, analytic studies are interested in a universewhich has yet to be produced. Table 9.2 compares analytic studies with enu-merative studies (Provost, 1988).Deming (1986) points out that ‘‘Analysis of variance, t-tests, confidence
intervals, and other statistical techniques taught in the books, however inter-esting, are inappropriate because they provide no basis for prediction andbecause they bury the information contained in the order of production.’’
Overview of statistical methods 285
Figure 9.6. Possible processes with similar means and sigmas.

These traditional statistical methods have their place, but they are widelyabused in the real world. When this is the case, statistics do more to cloud theissue than to enlighten.Analytic study methods provide information for inductive thinking, rather
than the largely deductive approach of enumerative statistics. Analytic meth-ods are primarily graphical devices such as run charts, control charts, his-tograms, interrelationship digraphs, etc. Analytic statistics provideoperational guidelines, rather than precise calculations of probability. Thus,such statements as ‘‘There is a 0.13% probability of a Type I error when actingon a point outside a three-sigma control limit’’ are false (the author admitsto having made this error in the past). The future cannot be predicted with aknown level of confidence. Instead, based on knowledge obtained from everysource, including analytic studies, one can state that one has a certain degreeof belief (e.g., high, low) that such and such will result from such and suchaction on a process.Another difference between the two types of studies is that enumerative
statistics proceed from predetermined hypotheses while analytic studies try
286 BASIC PRINCIPLES of MEASUREMENT
Table 9.2. Important aspects of analytic studies.
ITEM ENUMERATIVE STUDY ANALYTIC STUDY
Aim Parameter estimation Prediction
Focus Universe Process
Method ofaccess
Counts, statistics Models of the process(e.g., £ow charts, causeand e¡ects, mathematicalmodels)
Major source ofuncertainty
Sampling variation Extrapolation into thefuture
Uncertaintyquanti¢able?
Yes No
Environmentfor the study
Static Dynamic

to help the analyst generate new hypotheses. In the past, this extremely worth-while approach has been criticized by some statisticians as ‘‘fishing’’ or ‘‘ratio-nalizing.’’ However, this author believes that using data to develop plausibleexplanations retrospectively is a perfectly legitimate way of creating new the-ories to be tested. To refuse to explore possibilities suggested by data is totake a very limited view of the scope of statistics in quality improvement andcontrol.
Enumerative statistical methodsThis section discusses the basic concept of statistical inference. The reader
should also consult the Glossary in the Appendix for additional information.Inferential statistics belong to the enumerative class of statistical methods.The term inference is defined as 1) the act or process of deriving logical con-
clusions from premises known or assumed to be true, or 2) the act of reasoningfrom factual knowledge or evidence. Inferential statistics provide informationthat is used in the process of inference. As can be seen from the definitions, infer-ence involves two domains: the premises and the evidence or factual knowledge.Additionally, there are two conceptual frameworks for addressing premisesquestions in inference: the design-based approach and the model-basedapproach.As discussed by Koch and Gillings (1983), a statistical analysis whose only
assumptions are random selection of units or random allocation of units toexperimental conditions results in design-based inferences; or, equivalently,randomization-based inferences. The objective is to structure sampling suchthat the sampled population has the same characteristics as the target popula-tion. If this is accomplished then inferences from the sample are said to haveinternal validity. A limitation on design-based inferences for experimental stu-dies is that formal conclusions are restricted to the finite population of sub-jects that actually received treatment, that is, they lack external validity.However, if sites and subjects are selected at random from larger eligiblesets, then models with random effects provide one possible way of addressingboth internal and external validity considerations. One important considera-tion for external validity is that the sample coverage includes all relevantsubpopulations; another is that treatment differences be homogeneous acrosssubpopulations. A common application of design-based inference is thesurvey.Alternatively, if assumptions external to the study design are required to
extend inferences to the target population, then statistical analyses based onpostulated probability distributional forms (e.g., binomial, normal, etc.) orother stochastic processes yield model-based inferences. A focus of distinction
Overview of statistical methods 287
between design-based and model-based studies is the population to which theresults are generalized rather than the nature of the statistical methods applied.When using a model-based approach, external validity requires substantive jus-tification for the model’s assumptions, as well as statistical evaluation of theassumptions.Statistical inference is used to provide probabilistic statements regarding a
scientific inference. Science attempts to provide answers to basic questions,such as can this machine meet our requirements? Is the quality of this lotwithin the terms of our contract? Does the new method of processing producebetter results than the old? These questions are answered by conducting anexperiment, which produces data. If the data vary, then statistical inferenceis necessary to interpret the answers to the questions posed. A statisticalmodel is developed to describe the probabilistic structure relating theobserved data to the quantity of interest (the parameters), i.e., a scientifichypothesis is formulated. Rules are applied to the data and the scientifichypothesis is either rejected or not. In formal tests of a hypothesis, there areusually two mutually exclusive and exhaustive hypotheses formulated: a nullhypothesis and an alternate hypothesis. Formal hypothesis testing is discussedlater in this chapter.
DISCRETE AND CONTINUOUS DATAData are said to be discrete when they take on only a finite number of points
that can be represented by the non-negative integers. An example of discretedata is the number of defects in a sample. Data are said to be continuous whenthey exist on an interval, or on several intervals. An example of continuousdata is the measurement of pH. Quality methods exist based on probabilityfunctions for both discrete and continuous data.
METHODS OF ENUMERATIONEnumeration involves counting techniques for very large numbers of poss-
ible outcomes. This occurs for even surprisingly small sample sizes. In SixSigma, these methods are commonly used in a wide variety of statistical proce-dures.
The basis for all of the enumerative methods described here is the multi-plication principle. The multiplication principle states that the number of poss-ible outcomes of a series of experiments is equal to the product of the numberof outcomes of each experiment. For example, consider flipping a coin twice.On the first flip there are two possible outcomes (heads/tails) and on the second
288 BASIC PRINCIPLES of MEASUREMENT

flip there are also two possible outcomes. Thus, the series of two flips can resultin 2� 2 ¼ 4 outcomes. Figure 9.7 illustrates this example.
An ordered arrangement of elements is called a permutation. Suppose thatyou have four objects and four empty boxes, one for each object. Considerhow many different ways the objects can be placed into the boxes. The firstobject can be placed in any of the four boxes. Once this is done there are threeboxes to choose from for the second object, then two boxes for the third objectand finally one box left for the last object. Using the multiplication principleyou find that the total number of arrangements of the four objects into thefour boxes is 4� 3� 2� 1 ¼ 24. In general, if there are n positions to be filledwith n objects there are
nðn� 1Þ . . . ð2Þð1Þ ¼ n! ð9:1Þ
possible arrangements. The symbol n! is read n factorial. By de¢nition, 0! ¼ 1.In applying probability theory to discrete variables in quality control we fre-
quently encounter the need for efficient methods of counting. One countingtechnique that is especially useful is combinations. The combination formulais shown in Equation 9.2.
Cnr ¼
n!
r!ðn� rÞ! ð9:2Þ
Overview of statistical methods 289
Figure 9.7. Multiplication principle applied to coin £ips.

Combinations tell how many unique ways you can arrange n objects takingthem in groups of r objects at a time, where r is a positive integer less than orequal to n. For example, to determine the number of combinations we canmake with the letters X,Y, and Z in groups of 2 letters at a time, we note thatn ¼ 3 letters, r ¼ 2 letters at a time and use the above formula to find
C32 ¼
3!
2!ð3� 2Þ! ¼3� 2� 1
ð2� 1Þð1Þ ¼6
2¼ 3
The 3 combinations are XY, XZ, and YZ. Notice that this method does notcount reversing the letters as separate combinations, i.e., XY and YX are con-sidered to be the same.
Assumptions and robustness of testsIt is important at the outset to comment on what we are not discussing here
when we use the term ‘‘robustness.’’ First, we are not talking about the sensi-tivity of a particular statistic to outliers. This concept is more properlyreferred to as resistance and it is discussed in the exploratory data analysissection of this book. We are also not speaking of a product design that canperform well under a wide variety of operating conditions. This design-baseddefinition of robustness is discussed in the Taguchi robustness conceptssection.All statistical procedures rest upon certain assumptions. For example,
ANOVA assumes that the data are normally distributed with equal variances.Whenwe use the term robustness here, wemean the ability of the statistical pro-cedure to produce the correct final result when the assumptions are violated. Astatistical procedure is said to be robust when it can be used even when thebasic assumptions are violated to a small degree.How large a departure from the assumptions is acceptable? Or, equivalently,
how small is a ‘‘small’’ degree of error? For a given violation of the assumptions,how large an error in the result is acceptable? Regrettably, there is no rigorousmathematical definition of the term ‘‘robust.’’In practice, robustness is commonly addressed in two ways. One approach is
to test the underlying assumptions prior to using a given statistical procedure.In the case of ANOVA, for example, the practitioner would test the assump-tions of normality and constant variance on the data set before accepting theresults of the ANOVA.Another approach is to use robust statistical procedures. Some ways of deal-
ing with the issue are:
290 BASIC PRINCIPLES of MEASUREMENT

. Use procedures with less restrictive underlying assumptions (e.g., non-parametric procedures).
. Drop ‘‘gross outliers’’ from the data set before proceeding with the analy-sis (using an acceptable statistical method to identify the outliers).
. Use more resistant statistics (e.g., the median instead of the arithmeticmean).
DistributionsDistributions are a set of numbers collected from a well-defined universe of
possible measurements arising from a property or relationship under study.Distributions show the way in which the probabilities are associated withthe numbers being studied. Assuming a state of statistical control, by con-sulting the appropriate distribution one can determine the answer to suchquestions as:
. What is the probability that x will occur?
. What is the probability that a value less than x will occur?
. What is the probability that a value greater than x will occur?
. What is the probability that a value will occur that is between x and y?By examining plots of the distribution shape, one can determine how rapidly
or slowly probabilities change over a given range of values. In short, distribu-tions provide a great deal of information.
FREQUENCY AND CUMULATIVE DISTRIBUTIONSA frequency distribution is an empirical presentation of a set of observations.
If the frequency distribution is ungrouped, it simply shows the observationsand the frequency of each number. If the frequency distribution is grouped,then the data are assembled into cells, each cell representing a subset of thetotal range of the data. The frequency in each cell completes the grouped fre-quency distribution. Frequency distributions are often graphically displayedin histograms or stem-and-leaf plots.
While histograms and stem-and-leaf plots show the frequency of specificvalues or groups of values, analysts often wish to examine the cumulative fre-quency of the data. The cumulative frequency refers to the total up to andincluding a particular value. In the case of grouped data, the cumulative fre-quency is computed as the total number of observations up to and including acell boundary. Cumulative frequency distributions are often displayed on anogive, as depicted in Figure 9.8.
Overview of statistical methods 291

SAMPLING DISTRIBUTIONSIn most Six Sigma projects involving enumerative statistics, we deal with
samples, not populations. In the previous section, sample data were used to con-struct an ogive and, elsewhere in this book, sample data are used to constructhistograms, stem-and-leaf plots, boxplots, and to compute various statistics.We now consider the estimation of certain characteristics or parameters of thedistribution from the data.The empirical distribution assigns the probability 1/n to each Xi in the sam-
ple, thus the mean of this distribution is
�XX ¼Xn
i¼1Xi1
nð9:3Þ
The symbol �XX is called ‘‘X bar.’’ Since the empirical distribution is deter-mined by a sample, �XX is simply called the sample mean.The variance of the empirical distribution is given by
S2 ¼ 1
n� 1
Xni¼1
ðXi � �XXÞ2 ð9:4Þ
292 BASIC PRINCIPLES of MEASUREMENT
Figure 9.8. Ogive of rod diameter data.
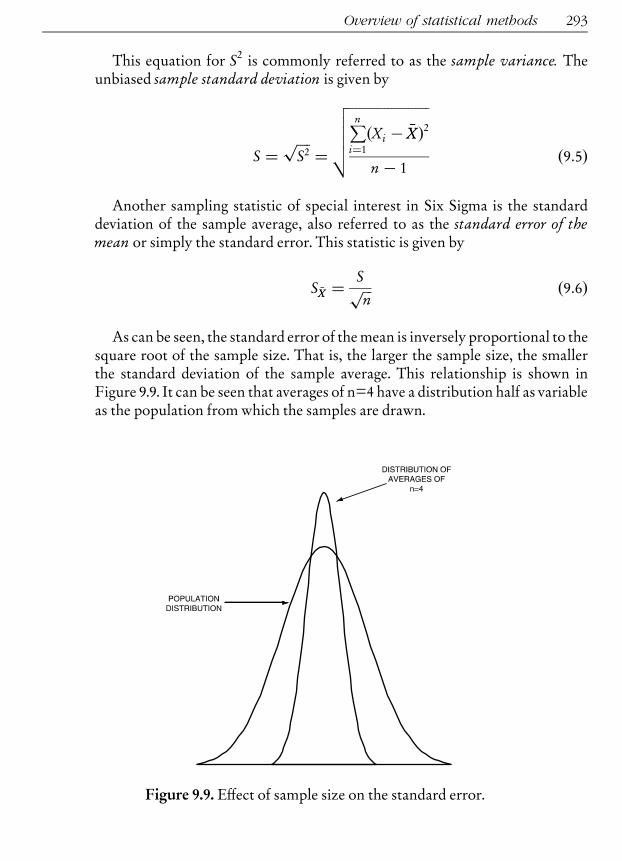
This equation for S2 is commonly referred to as the sample variance. Theunbiased sample standard deviation is given by
S ¼ffiffiffiffiS2
p¼
ffiffiffiffiffiffiffiffiffiffiffiffiffiffiffiffiffiffiffiffiffiffiffiPni¼1
ðXi � �XXÞ2
n� 1
vuuut ð9:5Þ
Another sampling statistic of special interest in Six Sigma is the standarddeviation of the sample average, also referred to as the standard error of themean or simply the standard error. This statistic is given by
S �XX ¼ Sffiffiffin
p ð9:6Þ
As can be seen, the standard error of themean is inversely proportional to thesquare root of the sample size. That is, the larger the sample size, the smallerthe standard deviation of the sample average. This relationship is shown inFigure 9.9. It can be seen that averages of n=4 have a distribution half as variableas the population from which the samples are drawn.
Overview of statistical methods 293
Figure 9.9. E¡ect of sample size on the standard error.

Probability distributions for Six SigmaThis section discusses the following probability distributions often used in
Six Sigma:. Binomial distribution. Poisson distribution. Hypergeometric distribution. Normal distribution. Exponential distribution. Chi-square distribution. Student’s t distribution. F distribution
BINOMIAL DISTRIBUTIONAssume that a process is producing some proportion of non-conforming
units, which we will call p. If we are basing p on a sample we find p by dividingthe number of non-conforming units in the sample by the number of itemssampled. The equation that will tell us the probability of getting x defectives ina sample of n units is shown by Equation 9.7.
PðxÞ ¼ Cnxp
xð1� pÞn�x ð9:7Þ
This equation is known as the binomial probability distribution. In additionto being useful as the exact distribution of non-conforming units for processesin continuous production, it is also an excellent approximation to the cum-bersome hypergeometric probability distribution when the sample size is lessthan 10% of the lot size.
Example of applying the binomial probability distributionAprocess is producing glass bottles on a continuous basis. Past history shows
that 1%of the bottles have oneormore flaws. Ifwedrawa sample of 10units fromthe process,what is theprobability that therewill be 0non-conformingbottles?Using the above information, n = 10, p = .01, and x = 0. Substituting these
values into Equation 9.7 gives us
Pð0Þ ¼ C100 0:01
0ð1� 0:01Þ10�0 ¼ 1� 1� 0:9910 ¼ 0:904 ¼ 90:4%
Anotherwayof interpretingtheaboveexample is thatasamplingplan ‘‘inspect10 units, accept the process if no non-conformances are found’’ has a 90.4%prob-ability of accepting a process that is averaging 1%non-conforming units.
294 BASIC PRINCIPLES of MEASUREMENT

Example of binomial probability calculations using MicrosoftExcel1Microsoft Excel has a built-in capability to analyze binomial probabilities. To
solve the above problem using Excel, enter the sample size, p value, and x valueas shown in Figure 9.10. Note the formula result near the bottom of the screen.
Poisson distributionAnother situation encountered often in quality control is that we are not just
concerned with units that don’t conform to requirements, instead we are con-cerned with the number of non-conformances themselves. For example, let’ssay we are trying to control the quality of a computer. A complete audit of thefinished computer would almost certainly reveal some non-conformances,even though these non-conformances might be of minor importance (for exam-ple, a decal on the back panel might not be perfectly straight). If we tried to usethe hypergeometric or binomial probability distributions to evaluate samplingplans for this situation, we would find they didn’t work because our lot or pro-
Overview of statistical methods 295
Figure 9.10. Example of ¢nding binomial probability using Microsoft Excel.
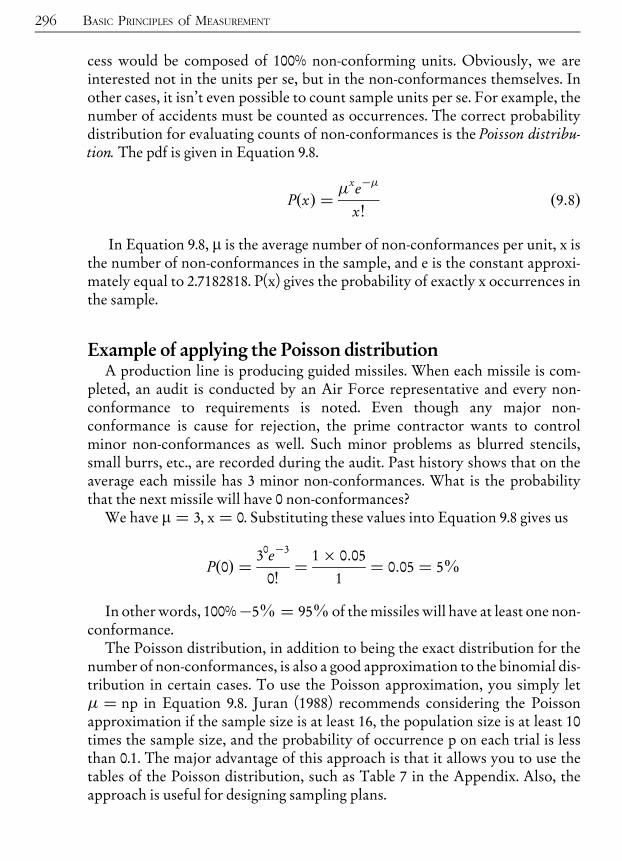
cess would be composed of 100% non-conforming units. Obviously, we areinterested not in the units per se, but in the non-conformances themselves. Inother cases, it isn’t even possible to count sample units per se. For example, thenumber of accidents must be counted as occurrences. The correct probabilitydistribution for evaluating counts of non-conformances is the Poisson distribu-tion. The pdf is given in Equation 9.8.
PðxÞ ¼ �xe��
x!ð9:8Þ
In Equation 9.8, m is the average number of non-conformances per unit, x isthe number of non-conformances in the sample, and e is the constant approxi-mately equal to 2.7182818. P(x) gives the probability of exactly x occurrences inthe sample.
Example of applying the Poisson distributionA production line is producing guided missiles. When each missile is com-
pleted, an audit is conducted by an Air Force representative and every non-conformance to requirements is noted. Even though any major non-conformance is cause for rejection, the prime contractor wants to controlminor non-conformances as well. Such minor problems as blurred stencils,small burrs, etc., are recorded during the audit. Past history shows that on theaverage each missile has 3 minor non-conformances. What is the probabilitythat the next missile will have 0 non-conformances?We have m ¼ 3, x ¼ 0. Substituting these values into Equation 9.8 gives us
Pð0Þ ¼ 30e�3
0!¼ 1� 0:05
1¼ 0:05 ¼ 5%
In other words, 100%�5% ¼ 95% of themissiles will have at least one non-conformance.The Poisson distribution, in addition to being the exact distribution for the
number of non-conformances, is also a good approximation to the binomial dis-tribution in certain cases. To use the Poisson approximation, you simply let� ¼ np in Equation 9.8. Juran (1988) recommends considering the Poissonapproximation if the sample size is at least 16, the population size is at least 10times the sample size, and the probability of occurrence p on each trial is lessthan 0.1. The major advantage of this approach is that it allows you to use thetables of the Poisson distribution, such as Table 7 in the Appendix. Also, theapproach is useful for designing sampling plans.
296 BASIC PRINCIPLES of MEASUREMENT

Example of Poisson probability calculations using MicrosoftExcelMicrosoft Excel has a built-in capability to analyze Poisson probabilities. To
solve the above problem using Excel, enter the average and x values as shownin Figure 9.11. Note the formula result near the bottom of the screen.
HYPERGEOMETRIC DISTRIBUTIONAssume we have received a lot of 12 parts from a distributor. We need the
parts badly and arewilling to accept the lot if it has fewer than 3 non-conformingparts. We decide to inspect only 4 parts since we can’t spare the time to checkevery part. Checking the sample, we find 1 part that doesn’t conform to therequirements. Should we reject the remainder of the lot?
This situation involves sampling without replacement. We draw a unit fromthe lot, inspect it, and draw another unit from the lot. Furthermore, the lot is
Overview of statistical methods 297
Figure 9.11. Example of ¢nding Poisson probability using Microsoft Excel.

quite small, the sample is 25% of the entire lot. The formula needed to computeprobabilities for this procedure is known as the hypergeometric probability dis-tribution, and it is shown in Equation 9.9.
PðxÞ ¼ CN�mn�x Cm
x
CNn
ð9:9Þ
In the above equation, N is the lot size, m is the number of defectives in thelot, n is the sample size, x is the number of defectives in the sample, and P(x) isthe probability of getting exactly x defectives in the sample. Note that thenumerator term CN�m
n�x gives the number of combinations of non-defectiveswhile Cm
x is the number of combinations of defectives. Thus the numeratorgives the total number of arrangements of samples from lots of size N with mdefectives where the sample n contains exactly x defectives. The term CN
n inthe denominator is the total number of combinations of samples of size n fromlots of size N, regardless of the number of defectives. Thus, the probability is aratio of the likelihood of getting the result under the assumed conditions.
For our example, we must solve the above equation for x = 0 as well as x = 1,since we would also accept the lot if we had no defectives. The solution isshown as follows.
Pð0Þ ¼ C12�34�0 C
30
C124
¼ 126� 1
495¼ 0:255
Pð1Þ ¼ C12�34�1 C
31
C124
¼ 84� 3
495¼ 252
495¼ 0:509
Pð1 or lessÞ ¼ Pð0Þ þ Pð1ÞAdding the two probabilities tells us the probability that our sampling plan
will accept lots of 12 with 3 non-conforming units. The plan of inspecting 4parts and accepting the lot if we have 0 or 1 non-conforming has a probabilityof .255 + .509 = .764, or 76.4%, of accepting this ‘‘bad’’ quality lot. This is the‘‘consumer’s risk’’ for this sampling plan. Such a high sampling risk would beunacceptable to most people.
Example of hypergeometric probability calculations usingMicrosoft ExcelMicrosoft Excel has a built-in capability to analyze hypergeometric probabil-
ities. To solve the above problem using Excel, enter the population and samplevalues as shown in Figure 9.12. Note the formula result near the bottom of the
298 BASIC PRINCIPLES of MEASUREMENT

screen (0.509) gives the probability for x¼ 1. To find the cumulative probabilityyou need to sum the probabilities for x¼ 0 and x¼ 1 etc.
NORMAL DISTRIBUTIONThe most common continuous distribution encountered in Six Sigma work
is, by far, the normal distribution. Sometimes the process itself produces anapproximately normal distribution, other times a normal distribution can beobtained by performing a mathematical transformation on the data or byusing averages. The probability density function for the normal distribution isgiven by Equation 9.10.
f ðxÞ ¼ 1
�ffiffiffiffiffi2�
p e�ðx��Þ2=2�2 ð9:10Þ
If f ðxÞ is plotted versus x, the well-known ‘‘bell curve’’ results. The normaldistribution is also known as the Gaussian distribution. An example is shownin Figure 9.13.
Overview of statistical methods 299
Figure 9.12. Example of ¢nding hypergeometric probability using Microsoft Excel.

In Equation 9.10, m is the population average or mean and s is the popula-tion standard deviation. These parameters have been discussed earlier in thischapter.
Example of calculating m,s2 andsFind m,s2 and s for the following data:
i xi
1 17
2 23
3 5
Table 11.4 gives the equation for the population mean as:
� ¼ 1
N
XNi¼1
xi
300 BASIC PRINCIPLES of MEASUREMENT
Figure 9.13. The normal/Gaussian curve.

To find the mean for our data we compute
� ¼ 1
3ð17þ 23þ 5Þ ¼ 15
The variance and standard deviation are both measures of dispersion orspread. The equations for the population variance s2 and standard deviation sare given in Table 11.4.
�2 ¼ PNi¼1
ðxi��Þ2N
� ¼ ffiffiffi�
p 2
Referring to the data above with a mean m of 15, we compute s2 and s asfollows:
i xi xi � � ðxi � �Þ2
1 17 2 4
2 23 8 64
3 5 �10 100
SUM 168
�2 ¼ 168=3 ¼ 56
� ¼ ffiffiffi�
p 2 ¼ ffiffi5
p6 � 7:483
Usually we have only a sample and not the entire population. A population isthe entire set of observations from which the sample, a subset, is drawn.Calculations for the sample mean, variance, and standard deviation wereshown earlier in this chapter.The areas under the normal curve can be found by integrating Equation 9.10
using numerical methods, but, more commonly, tables are used. Table 2 in theAppendix gives areas under the normal curve. The table is indexed by using theZ transformation, which is
Z ¼ xi��
�ð9:11Þ
Overview of statistical methods 301
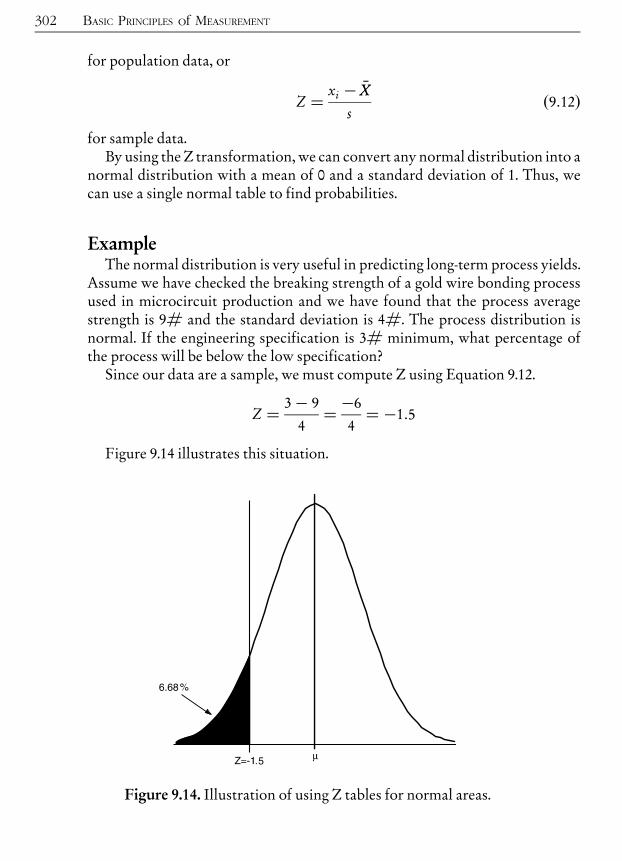
for population data, or
Z ¼ xi � �XX
sð9:12Þ
for sample data.By using the Z transformation, we can convert any normal distribution into a
normal distribution with a mean of 0 and a standard deviation of 1. Thus, wecan use a single normal table to find probabilities.
ExampleThe normal distribution is very useful in predicting long-term process yields.
Assume we have checked the breaking strength of a gold wire bonding processused in microcircuit production and we have found that the process averagestrength is 9# and the standard deviation is 4#. The process distribution isnormal. If the engineering specification is 3# minimum, what percentage ofthe process will be below the low specification?Since our data are a sample, we must compute Z using Equation 9.12.
Z ¼ 3� 9
4¼ �6
4¼ �1:5
Figure 9.14 illustrates this situation.
302 BASIC PRINCIPLES of MEASUREMENT
6.68
5
Figure 9.14. Illustration of using Z tables for normal areas.

Entering Table 2 in the Appendix for Z ¼ �1:5, we find that 6.68% of thearea is below this Z value. Thus 6.68% of our breaking strengths will be belowour low specification limit of 3#. In quality control applications, we usuallytry to have the average at least 3 standard deviations away from the specification.To accomplish this, we would have to improve the process by either raising theaverage breaking strength or reducing the process standard deviation, or both.
Example of normal probability calculations using MicrosoftExcelMicrosoft Excel has a built-in capability to analyze normal probabilities. To
solve the above problem using Excel, enter the average, sigma and x values asshown in Figure 9.15. The formula result near the bottom of the screen givesthe desired probability.
Overview of statistical methods 303
Figure 9.15. Example of ¢nding normal probability using Microsoft Excel.
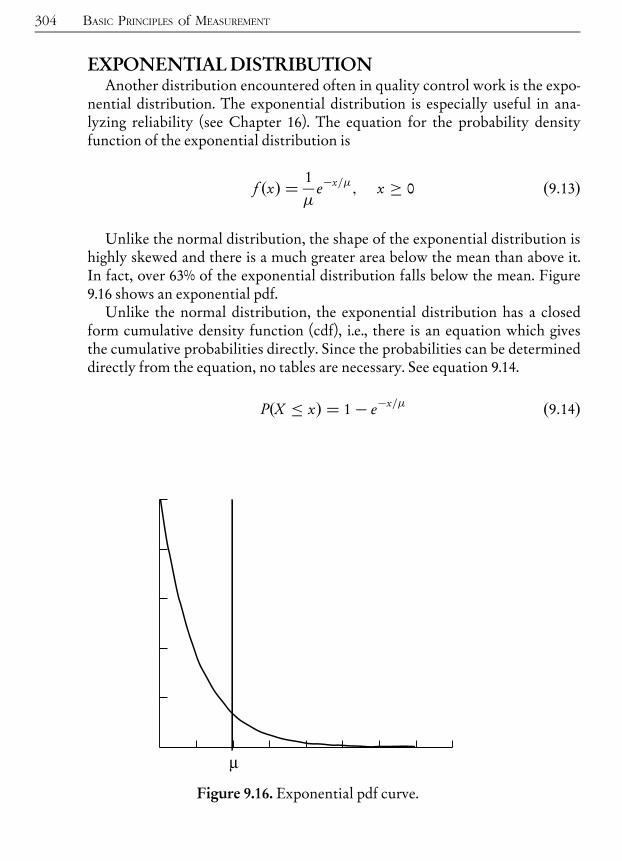
EXPONENTIAL DISTRIBUTIONAnother distribution encountered often in quality control work is the expo-
nential distribution. The exponential distribution is especially useful in ana-lyzing reliability (see Chapter 16). The equation for the probability densityfunction of the exponential distribution is
f ðxÞ ¼ 1
�e�x=�; x � 0 ð9:13Þ
Unlike the normal distribution, the shape of the exponential distribution ishighly skewed and there is a much greater area below the mean than above it.In fact, over 63% of the exponential distribution falls below the mean. Figure9.16 shows an exponential pdf.Unlike the normal distribution, the exponential distribution has a closed
form cumulative density function (cdf), i.e., there is an equation which givesthe cumulative probabilities directly. Since the probabilities can be determineddirectly from the equation, no tables are necessary. See equation 9.14.
PðX � xÞ ¼ 1� e�x=� ð9:14Þ
304 BASIC PRINCIPLES of MEASUREMENT
Figure 9.16. Exponential pdf curve.
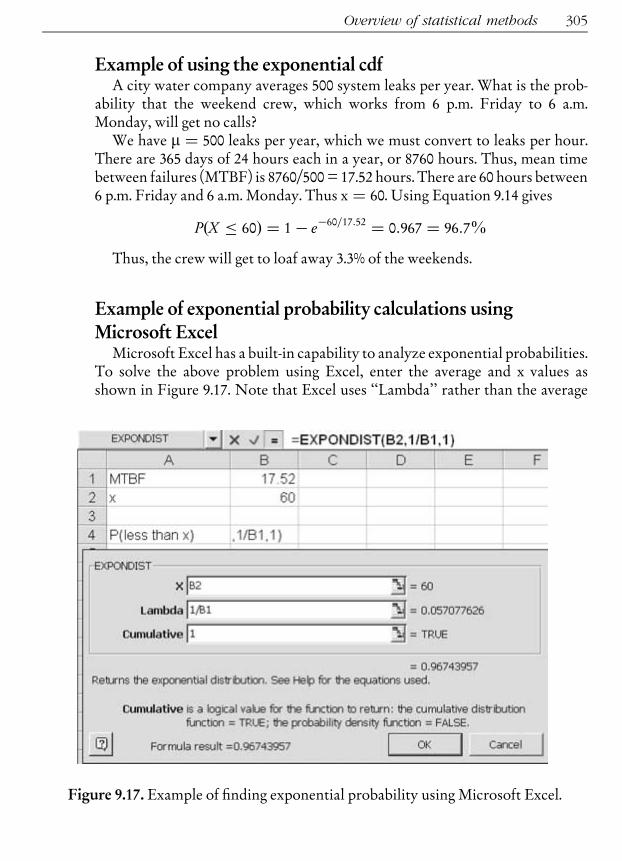
Example of using the exponential cdfA city water company averages 500 system leaks per year. What is the prob-
ability that the weekend crew, which works from 6 p.m. Friday to 6 a.m.Monday, will get no calls?We have m ¼ 500 leaks per year, which we must convert to leaks per hour.
There are 365 days of 24 hours each in a year, or 8760 hours. Thus, mean timebetween failures (MTBF) is 8760/500 = 17.52 hours. There are 60 hours between6 p.m. Friday and 6 a.m. Monday. Thus x ¼ 60. Using Equation 9.14 gives
PðX � 60Þ ¼ 1� e�60=17:52 ¼ 0:967 ¼ 96:7%
Thus, the crew will get to loaf away 3.3% of the weekends.
Example of exponential probability calculations usingMicrosoft ExcelMicrosoft Excel has a built-in capability to analyze exponential probabilities.
To solve the above problem using Excel, enter the average and x values asshown in Figure 9.17. Note that Excel uses ‘‘Lambda’’ rather than the average
Overview of statistical methods 305
Figure 9.17. Example of ¢nding exponential probability using Microsoft Excel.

in its calculations; lambda is the reciprocal of the average. The formula resultnear the bottom of the screen gives the desired probability.
CHI-SQUARE, STUDENT’S T, AND F DISTRIBUTIONSThese three distributions are used in Six Sigma to test hypotheses, construct
confidence intervals, and compute control limits.
CHI-SQUAREMany characteristics encountered in Six Sigma have normal or approxi-
mately normal distributions. It can be shown that in these instances the distribu-tion of sample variances has the form (except for a constant) of a chi-squaredistribution, symbolized 2. Tables have been constructed giving abscissavalues for selected ordinates of the cumulative 2 distribution. One such tableis Table 4 in the Appendix.The 2 distribution varies with the quantity v, which for our purposes is
equal to the sample size minus 1. For each value of v there is a different 2 dis-tribution. Equation 9.15 gives the pdf for the 2.
f ð2Þ ¼ e�2=2ð2Þðv�2Þ=2
2v=2v� 2
2
!
ð9:15Þ
Figure 9.18 shows the pdf for v ¼ 4.
ExampleThe use of2 is illustrated in this example to find the probability that the var-
iance of a sample of n items from a specified normal universe will equal orexceed a given value s2; we compute 2 ¼ ðn� 1Þs2=�2. Now, let’s supposethat we sample n ¼ 10 items from a process with �2 ¼ 25 and wish to deter-mine the probability that the sample variance will exceed 50. Then
ðn� 1Þs2�2
¼ 9ð50Þ25
¼ 18
We enter Appendix Table 4 (2) at the line for v ¼ 10� 1 ¼ 9 and note that18 falls between the columns for the percentage points of 0.025 and 0.05. Thus,the probability of getting a sample variance in excess of 50 is about 3%.It is also possible to determine the sample variance that would be exceeded
only a stated percentage of the time. For example, we might want to be alerted
306 BASIC PRINCIPLES of MEASUREMENT

when the sample variance exceeded a value that should occur only once in 100times. Then we set up the 2 equation, find the critical value from Table 4 in theAppendix, and solve for the sample variance. Using the same values as above,the value of s2 that would be exceeded only once in 100 times is found as follows:
9s2
�2¼ 9s2
25¼ 21:7 ) s2 ¼ 21:7� 25
9¼ 60:278
In other words, the variance of samples of size 10, taken from this process,should be less than 60.278, 99% of the time.
Example of chi-squared probability calculations usingMicrosoft ExcelMicrosoft Excel has a built-in capability to calculate chi-squared probabil-
ities. To solve the above problem using Excel, enter the n and x values asshown in Figure 9.19. Note that Excel uses degrees of freedom rather than thesample size in its calculations; degrees of freedom is the sample size minusone, as shown in the Deg___freedom box in Figure 9.19. The formula result nearthe bottom of the screen gives the desired probability.
Overview of statistical methods 307
Figure 9.18. 2 pdf for v ¼ 4.

Example of inverse chi-squared probability calculations usingMicrosoft ExcelMicrosoftExcel has abuilt-in capability to calculate chi-squaredprobabilities,
making it unnecessary to look up the probabilities in tables. To find the criticalchi-squared value for the above problem using Excel, use the CHIINV functionand enter the desired probability and degrees of freedomas shown inFigure 9.20.The formula result near the bottomof the screen gives the desired critical value.
308 BASIC PRINCIPLES of MEASUREMENT
Figure 9.19. Example of ¢nding chi-squared probability using Microsoft Excel.
Figure 9.20. Example of ¢nding inverse chi-squared probability using Microsoft Excel.

STUDENT’S T DISTRIBUTIONThe t statistic is commonly used to test hypotheses regarding means, regres-
sion coefficients and a wide variety of other statistics used in quality engi-neering. ‘‘Student’’ was the pseudonym of W.S. Gosset, whose need toquantify the results of small scale experiments motivated him to develop andtabulate the probability integral of the ratio which is now known as the tstatistic and is shown in Equation 9.16.
t ¼ �� �XX
s=ffiffiffin
p ð9:16Þ
In Equation 9.16, the denominator is the standard deviation of the samplemean. Percentage points of the corresponding distribution function of t maybe found in Table 3 in the Appendix. There is a t distribution for each samplesize of n > 1. As the sample size increases, the t distribution approaches theshape of the normal distribution, as shown in Figure 9.21.One of the simplest (and most common) applications of the Student’s t test
involves using a sample from a normal population with mean m and variances2. This is demonstrated in the Hypothesis testing section later in this chapter.
Overview of statistical methods 309
Figure 9.21. Student’s t distributions.

F DISTRIBUTIONSuppose we have two random samples drawn from a normal population. Let
s21 be the variance of the first sample and s22 be the variance of the second sample.
The two samples need not have the same sample size. The statistic F given by
F ¼ s21s22
ð9:17Þ
has a sampling distribution called the F distribution. There are two sample var-iances involved and two sets of degrees of freedom, n1�1 in the numerator andn2�1 in the denominator. The Appendix includes tables for 1% and 5% percen-tage points for the F distribution. The percentages refer to the areas to theright of the values given in the tables. Figure 9.22 illustrates two F distributions.
310 BASIC PRINCIPLES of MEASUREMENT
Figure 9.22. F distributions.
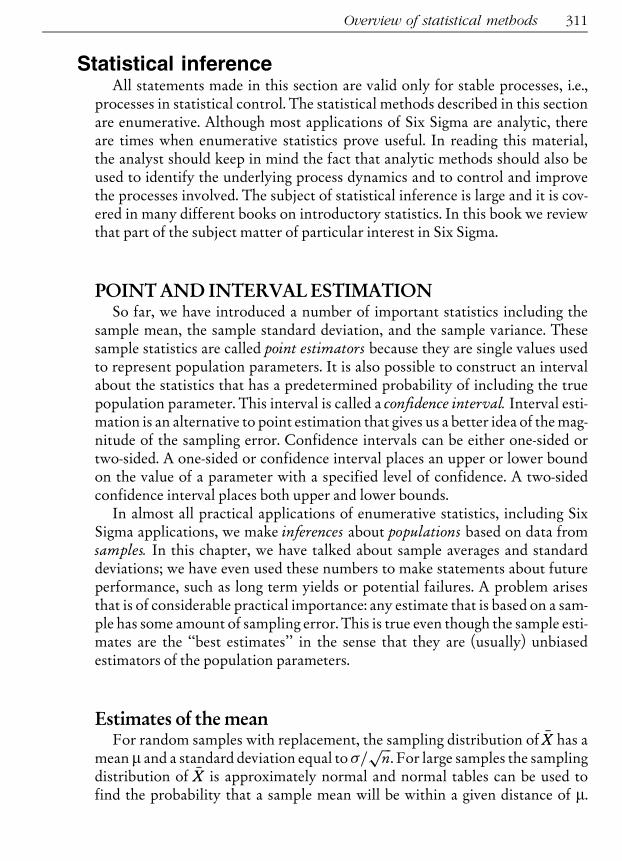
Statistical inferenceAll statements made in this section are valid only for stable processes, i.e.,
processes in statistical control. The statistical methods described in this sectionare enumerative. Although most applications of Six Sigma are analytic, thereare times when enumerative statistics prove useful. In reading this material,the analyst should keep in mind the fact that analytic methods should also beused to identify the underlying process dynamics and to control and improvethe processes involved. The subject of statistical inference is large and it is cov-ered in many different books on introductory statistics. In this book we reviewthat part of the subject matter of particular interest in Six Sigma.
POINT AND INTERVAL ESTIMATIONSo far, we have introduced a number of important statistics including the
sample mean, the sample standard deviation, and the sample variance. Thesesample statistics are called point estimators because they are single values usedto represent population parameters. It is also possible to construct an intervalabout the statistics that has a predetermined probability of including the truepopulation parameter. This interval is called a confidence interval. Interval esti-mation is an alternative to point estimation that gives us a better idea of themag-nitude of the sampling error. Confidence intervals can be either one-sided ortwo-sided. A one-sided or confidence interval places an upper or lower boundon the value of a parameter with a specified level of confidence. A two-sidedconfidence interval places both upper and lower bounds.In almost all practical applications of enumerative statistics, including Six
Sigma applications, we make inferences about populations based on data fromsamples. In this chapter, we have talked about sample averages and standarddeviations; we have even used these numbers to make statements about futureperformance, such as long term yields or potential failures. A problem arisesthat is of considerable practical importance: any estimate that is based on a sam-ple has some amount of sampling error. This is true even though the sample esti-mates are the ‘‘best estimates’’ in the sense that they are (usually) unbiasedestimators of the population parameters.
Estimates of the meanFor random samples with replacement, the sampling distribution of �XX has a
meanm and a standard deviation equal to �=ffiffiffin
p. For large samples the sampling
distribution of �XX is approximately normal and normal tables can be used tofind the probability that a sample mean will be within a given distance of m.
Overview of statistical methods 311

For example, in 95% of the samples we will observe a mean within�1:96�= ffiffiffin
pof m. In other words, in 95% of the samples the interval from �XX � 1:96�=
ffiffiffin
pto
�XX þ 1:96�=ffiffiffin
pwill include m. This interval is called a ‘‘95% confidence interval
for estimating m.’’ It is usually shown using inequality symbols:
�XX � 1:96�=ffiffiffin
p< � < �XX þ 1:96�=
ffiffiffin
p
The factor 1.96 is the Z value obtained from the normal Table 2 in theAppendix. It corresponds to the Z value beyond which 2.5% of the populationlie. Since the normal distribution is symmetric, 2.5% of the distribution liesabove Z and 2.5% below �Z. The notation commonly used to denote Z valuesfor confidence interval construction or hypothesis testing is Za=z where100ð1� a) is the desired confidence level in percent. For example, if we want95% confidence, a ¼ 0:05, 100ð1� aÞ ¼ 95%, and Z0.025¼1.96. In hypothesistesting the value of a is known as the significance level.
Example: estimating mwhens is knownSuppose thats is known to be 2.8. Assume that we collect a sample of n ¼ 16
and compute �XX ¼ 15:7. Using the above equation we find the 95% confidenceinterval for m as follows:
�XX � 1:96�=ffiffiffin
p< � < �XX þ 1:96�=
ffiffiffin
p
15:7� 1:96ð2:8= ffiffiffiffiffi16
p Þ < � < 15:7þ 1:96ð2:8= ffiffiffiffiffi16
p Þ14:33 < � < 17:07
There is a 95% level of confidence associated with this interval. The numbers14.33 and 17.07 are sometimes referred to as the confidence limits.Note that this is a two-sided confidence interval. There is a 2.5% probability
that 17.07 is lower than m and a 2.5% probability that 14.33 is greater than m. Ifwe were only interested in, say, the probability that m were greater than 14.33,then the one-sided confidence interval would be m > 14:33 and the one-sidedconfidence level would be 97.5%.
Example of using Microsoft Excel to calculate the con¢denceinterval for the mean when sigma is knownMicrosoft Excel has a built-in capability to calculate confidence intervals for
the mean. The dialog box in Figure 9.23 shows the input. The formula resultnear the bottom of the screen gives the interval width as 1.371972758. To find
312 BASIC PRINCIPLES of MEASUREMENT
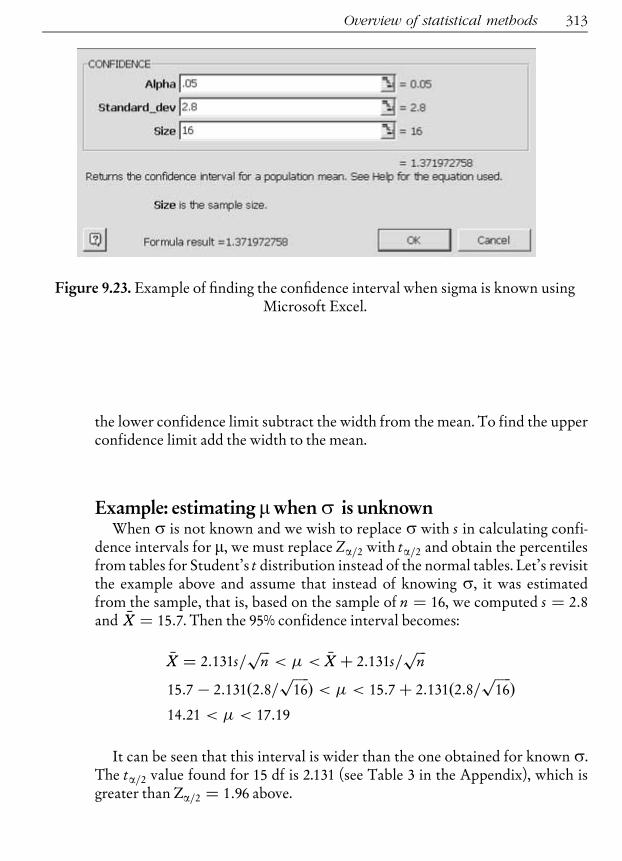
the lower confidence limit subtract the width from the mean. To find the upperconfidence limit add the width to the mean.
Example: estimating mwhens is unknownWhen s is not known and we wish to replace s with s in calculating confi-
dence intervals for m, we must replace Za=2 with ta=2 and obtain the percentilesfrom tables for Student’s t distribution instead of the normal tables. Let’s revisitthe example above and assume that instead of knowing s, it was estimatedfrom the sample, that is, based on the sample of n ¼ 16, we computed s ¼ 2:8and �XX ¼ 15:7. Then the 95% confidence interval becomes:
�XX ¼ 2:131s=ffiffiffin
p< � < �XX þ 2:131s=
ffiffiffin
p
15:7� 2:131ð2:8= ffiffiffiffiffi16
p Þ < � < 15:7þ 2:131ð2:8= ffiffiffiffiffi16
p Þ14:21 < � < 17:19
It can be seen that this interval is wider than the one obtained for known s.The ta=2 value found for 15 df is 2.131 (see Table 3 in the Appendix), which isgreater than Za=2 ¼ 1:96 above.
Overview of statistical methods 313
Figure 9.23. Example of ¢nding the con¢dence interval when sigma is known usingMicrosoft Excel.
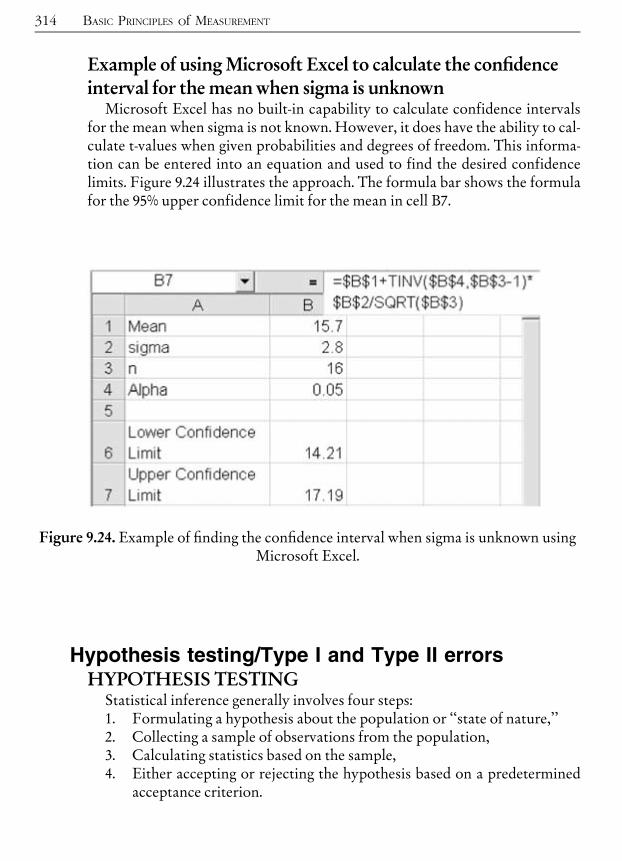
Example of using Microsoft Excel to calculate the con¢denceinterval for the mean when sigma is unknownMicrosoft Excel has no built-in capability to calculate confidence intervals
for the mean when sigma is not known. However, it does have the ability to cal-culate t-values when given probabilities and degrees of freedom. This informa-tion can be entered into an equation and used to find the desired confidencelimits. Figure 9.24 illustrates the approach. The formula bar shows the formulafor the 95% upper confidence limit for the mean in cell B7.
Hypothesis testing/Type I and Type II errorsHYPOTHESIS TESTINGStatistical inference generally involves four steps:1. Formulating a hypothesis about the population or ‘‘state of nature,’’2. Collecting a sample of observations from the population,3. Calculating statistics based on the sample,4. Either accepting or rejecting the hypothesis based on a predetermined
acceptance criterion.
314 BASIC PRINCIPLES of MEASUREMENT
Figure 9.24. Example of ¢nding the con¢dence interval when sigma is unknown usingMicrosoft Excel.
There are two types of error associated with statistical inference:Type I error (a error)LThe probability that a hypothesis that is actually
true will be rejected. The value of a is known as the significance levelof the test.
Type II error (b error)LThe probability that a hypothesis that is actuallyfalse will be accepted.
Type II errors are often plotted in what is known as an operating charac-teristics curve.Confidence intervals are usually constructed as part of a statistical test of
hypotheses. The hypothesis test is designed to help us make an inferenceabout the true population value at a desired level of confidence. We will lookat a few examples of how hypothesis testing can be used in Six Sigma applica-tions.
Example: hypothesis test of sample meanExperiment: The nominal specification for filling a bottle with a test chem-
ical is 30 cc. The plan is to draw a sample of n¼25 units from a stable processand, using the samplemean and standard deviation, construct a two-sided confi-dence interval (an interval that extends on either side of the sample average)that has a 95% probability of including the true population mean. If the inter-val includes 30, conclude that the lot mean is 30, otherwise conclude that thelot mean is not 30.Result: A sample of 25 bottles wasmeasured and the following statistics com-
puted
�XX ¼ 28 cc
s ¼ 6 cc
The appropriate test statistic is t, given by the formula
t ¼�XX � �
s=ffiffiffin
p ¼ 28� 30
6=ffiffiffiffiffi25
p ¼ �1:67
Table 3 in the Appendix gives values for the t statistic at various degrees offreedom. There are n� 1 degrees of freedom (df). For our example we needthe t.975 column and the row for 24 df. This gives a t value of 2.064. Since theabsolute value of this t value is greater than our test statistic, we fail to rejectthe hypothesis that the lot mean is 30 cc. Using statistical notation this isshown as:
Overview of statistical methods 315

H0:� ¼ 30 cc (the null hypothesis)H1:� is not equal to 30 cc (the alternate hypothesis)a ¼ :05 (Type I error or level of signi¢cance)Critical region:�2:064 � t0 � þ2:064Test statistic: t ¼ �1:67.
Since t lies inside the critical region, fail to reject H0, and accept the hypoth-esis that the lot mean is 30 cc for the data at hand.
Example: hypothesis test of two sample variancesThe variance ofmachine X’s output, based on a sample of n= 25 taken from a
stable process, is 100. Machine Y’s variance, based on a sample of 10, is 50. Themanufacturing representative from the supplier of machine X contends thatthe result is a mere ‘‘statistical fluke.’’ Assuming that a ‘‘statistical fluke’’ issomething that has less than 1 chance in 100, test the hypothesis that bothvariances are actually equal.The test statistic used to test for equality of two sample variances is the F
statistic, which, for this example, is given by the equation
F ¼ s21s22¼ 100
50¼ 2, numerator df ¼ 24; denominator df ¼ 9
Using Table 5 in the Appendix for F.99 we find that for 24 df in the numeratorand 9 df in the denominator F = 4.73. Based on this we conclude that the manu-facturer of machine X could be right, the result could be a statistical fluke. Thisexample demonstrates the volatile nature of the sampling error of samplevariances and standard deviations.
Example: hypothesis test of a standard deviation compared toa standard valueA machine is supposed to produce parts in the range of 0.500 inches plus or
minus 0.006 inches. Based on this, your statistician computes that the absoluteworst standard deviation tolerable is 0.002 inches. In looking over your capabil-ity charts you find that the best machine in the shop has a standard deviationof 0.0022, based on a sample of 25 units. In discussing the situation with the sta-tistician and management, it is agreed that the machine will be used if a one-sided 95% confidence interval on sigma includes 0.002.
316 BASIC PRINCIPLES of MEASUREMENT

The correct statistic for comparing a sample standard deviation with a stan-dard value is the chi-square statistic. For our data we have s¼0.0022, n¼25,and s0 ¼ 0:002. The 2 statistic has n� 1 ¼ 24 degrees of freedom. Thus,
2 ¼ ðn� 1Þs2�2
¼ 24� ð0:0022Þ2ð0:002Þ2 ¼ 29:04
Appendix Table 4 gives, in the 0.05 column (since we are constructing a one-sided confidence interval) and the df ¼ 24 row, the critical value 2 ¼ 36:42.Since our computed value of 2 is less than 36.42, we use the machine. Thereader should recognize that all of these exercises involved a number of assump-tions, e.g., that we ‘‘know’’ that the best machine has a standard deviation of0.0022. In reality, this knowledge must be confirmed by a stable control chart.
RESAMPLING (BOOTSTRAPPING)A number of criticisms have been raised regarding the methods used for esti-
mation and hypothesis testing:. They are not intuitive.. They are based on strong assumptions (e.g., normality) that are often notmet in practice.
. They are di⁄cult to learn and to apply.
. They are error-prone.In recent years a new method of performing these analyses has been devel-
oped. It is known as resampling or bootstrapping. The new methods are con-ceptually quite simple: using the data from a sample, calculate the statistic ofinterest repeatedly and examine the distribution of the statistic. For example,say you obtained a sample of n ¼ 25 measurements from a lot and you wishedto determine a confidence interval on the statistic Cpk.* Using resampling, youwould tell the computer to select a sample of n ¼ 25 from the sample results,compute Cpk, and repeat the process many times, say 10,000 times. You wouldthen determine whatever percentage point value you wished by simply lookingat the results. The samples would be taken ‘‘with replacement,’’ i.e., a particularvalue from the original sample might appear several times (or not at all) in aresample.
Resampling has many advantages, especially in the era of easily available,low-cost computer power. Spreadsheets can be programmed to resample andcalculate the statistics of interest. Compared with traditional statistical meth-ods, resampling is easier formost people to understand. It works without strong
Overview of statistical methods 317
*See Chapter 13.

assumptions, and it is simple. Resampling doesn’t impose as much baggagebetween the engineering problem and the statistical result as conventionalmethods. It can also be used for more advanced problems, such as modeling,design of experiments, etc.For a discussion of the theory behind resampling, see Efron (1982). For a pre-
sentation of numerous examples using a resampling computer program seeSimon (1992).
PRINCIPLES OF STATISTICAL PROCESS CONTROLTerms and concepts
DISTRIBUTIONSA central concept in statistical process control (SPC) is that every measur-
able phenomenon is a statistical distribution. In other words, an observed setof data constitutes a sample of the effects of unknown common causes. It fol-lows that, after we have done everything to eliminate special causes of varia-tions, there will still remain a certain amount of variability exhibiting the stateof control. Figure 9.25 illustrates the relationships between common causes,special causes, and distributions.
There are three basic properties of a distribution: location, spread, andshape. The location refers to the typical value of the distribution, such as themean. The spread of the distribution is the amount by which smaller valuesdiffer from larger ones. The standard deviation and variance are measures ofdistribution spread. The shape of a distribution is its patternLpeakedness,symmetry, etc. A given phenomenon may have any one of a number of distri-bution shapes, e.g., the distribution may be bell-shaped, rectangular-shaped,etc.
318 BASIC PRINCIPLES of MEASUREMENT
Figure 9.25. Distributions.From Continuing Process Control and Process Capability Improvement, p. 4a. Copyright
# 1983 by Ford Motor Company. Used by permission of the publisher.
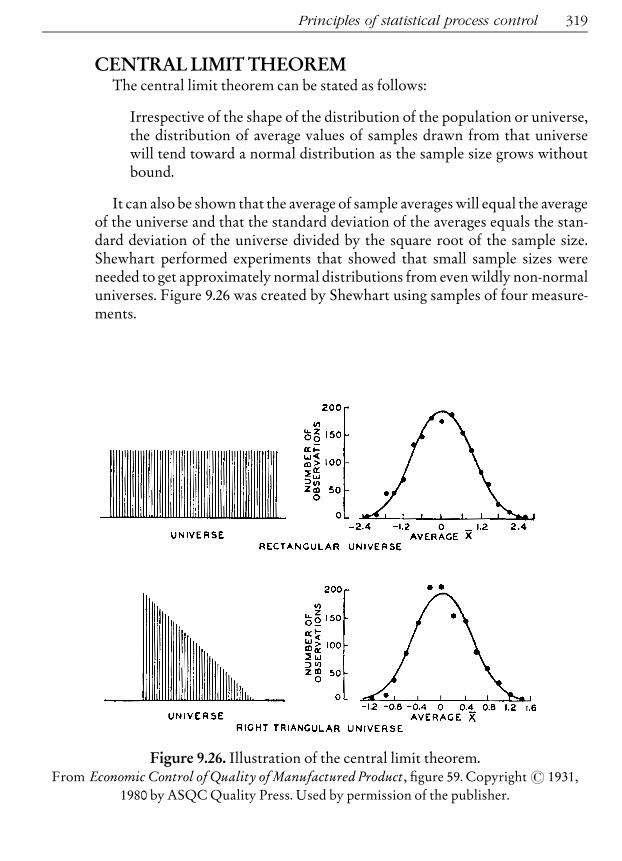
CENTRAL LIMIT THEOREMThe central limit theorem can be stated as follows:
Irrespective of the shape of the distribution of the population or universe,the distribution of average values of samples drawn from that universewill tend toward a normal distribution as the sample size grows withoutbound.
It can also be shown that the average of sample averages will equal the averageof the universe and that the standard deviation of the averages equals the stan-dard deviation of the universe divided by the square root of the sample size.Shewhart performed experiments that showed that small sample sizes wereneeded to get approximately normal distributions from even wildly non-normaluniverses. Figure 9.26 was created by Shewhart using samples of four measure-ments.
Principles of statistical process control 319
Figure 9.26. Illustration of the central limit theorem.From Economic Control of Quality of Manufactured Product, ¢gure 59. Copyright# 1931,
1980 by ASQCQuality Press. Used by permission of the publisher.

The practical implications of the central limit theorem are immense.Consider that without the central limit theorem effects, we would have todevelop a separate statistical model for every non-normal distribution encoun-tered in practice. This would be the only way to determine if the system wereexhibiting chance variation. Because of the central limit theorem we can useaverages of small samples to evaluate any process using the normal distribution.The central limit theorem is the basis for themost powerful of statistical processcontrol tools, Shewhart control charts.
Objectives and benefitsWithout SPC, the bases for decisions regarding quality improvement are
based on intuition, after-the-fact product inspection, or seat-of-the-pants ‘‘dataanalysis.’’ SPC provides a scientific basis for decisions regarding processimprovement.
PREVENTION VERSUS DETECTIONA process control system is essentially a feedback system that links process
outcomes with process inputs. There are four main elements involved, the pro-cess itself, information about the process, action taken on the process, andaction taken on the output from the process. Theway these elements fit togetheris shown in Figure 9.27.
320 BASIC PRINCIPLES of MEASUREMENT
Figure 9.27. A process control system.
By the process, we mean the whole combination of people, equipment,input materials, methods, and environment that work together to produceoutput. The performance information is obtained, in part, from evaluationof the process output. The output of a process includes more than product,it also includes information about the operating state of the process such astemperature, cycle times, etc. Action taken on a process is future-oriented inthe sense that it will affect output yet to come. Action on the output is past-oriented because it involves detecting out-of-specification output that hasalready been produced.There has been a tendency in the past to concentrate attention on the detec-
tion-oriented strategy of product inspection. With this approach, we wait untilan output has been produced, then the output is inspected and either acceptedor rejected. SPC takes you in a completely different direction: improvement inthe future. A key concept is the smaller the variation around the target, the bet-ter. Thus, under this school of thought, it is not enough to merely meet therequirements; continuous improvement is called for even if the requirementsare already being met. The concept of never-ending, continuous improvementis at the heart of SPC and Six Sigma.
Common and special causes of variationShewhart (1931, 1980) defined control as follows:
A phenomenon will be said to be controlled when, through the use of pastexperience, we can predict, at least within limits, how the phenomenonmay be expected to vary in the future. Here it is understood that predic-tion within limits means that we can state, at least approximately, theprobability that the observed phenomenonwill fall within the given limits.
The critical point in this definition is that control is not defined as the com-plete absence of variation. Control is simply a state where all variation is pre-dictable variation. A controlled process isn’t necessarily a sign of goodmanagement, nor is an out-of-control process necessarily producing non-con-forming product.In all forms of prediction there is an element of risk. For our purposes, we
will call any unknown random cause of variation a chance cause or a commoncause, the terms are synonymous and will be used as such. If the influence ofany particular chance cause is very small, and if the number of chance causesof variation are very large and relatively constant, we have a situation wherethe variation is predictable within limits. You can see from the definitionabove, that a system such as this qualifies as a controlled system. Where Dr.Shewhart used the term chance cause, Dr. W. Edwards Deming coined the
Principles of statistical process control 321

322
Figure 9.28. Should these variations be left to chance?From Economic Control of Quality of Manufactured Product, p. 13. Copyright# 1931, 1980 by
ASQCQuality Press. Used by permission of the publisher.
Figure 9.29. Types of variation.

term common cause to describe the same phenomenon. Both terms are encoun-tered in practice.Needless to say, not all phenomena arise from constant systems of common
causes. At times, the variation is caused by a source of variation that is not partof the constant system. These sources of variation were called assignable causesby Shewhart, special causes of variation by Deming. Experience indicates that
Principles of statistical process control 323
Figure 9.30. Charts from Figure 9.28 with control limits shown.From Economic Control of Quality of Manufactured Product, p. 13. Copyright# 1931, 1980
by ASQCQuality Press. Used by permission of the publisher.

special causes of variation can usually be found without undue difficulty, lead-ing to a process that is less variable.Statistical tools are needed to help us effectively separate the effects of special
causes of variation from chance cause variation. This leads us to another defini-tion:
Statistical process controlLthe use of valid analytical statistical methods toidentify the existence of special causes of variation in a process.
The basic rule of statistical process control is:
Variation from common-cause systems should be left to chance, butspecial causes of variation should be identi¢ed and eliminated.
This is Shewhart’s original rule. However, the rule should not be misinter-preted as meaning that variation from common causes should be ignored.Rather, common-cause variation is explored ‘‘off-line.’’ That is, we look forlong-term process improvements to address common-cause variation.
Figure 9.28 illustrates the need for statistical methods to determine thecategory of variation.The answer to the question ‘‘should these variations be left to chance?’’ can
only be obtained through the use of statistical methods. Figure 9.29 illustratesthe basic concept.In short, variation between the two ‘‘control limits’’ designated by the dashed
lines will be deemed as variation from the common-cause system. Any variabil-ity beyond these fixed limits will be assumed to have come from special causesof variation. We will call any system exhibiting only common-cause variation,‘‘statistically controlled.’’ It must be noted that the control limits are not simplypulled out of the air, they are calculated from actual process data using valid sta-tistical methods. Figure 9.28 is shown below as Figure 9.30, onlywith the controllimits drawn on it; notice that process (a) is exhibiting variations from specialcauses, while process (b) is not. This implies that the type of action needed toreduce the variability in each case is of a different nature.Without statistical gui-dance there could be endless debate over whether special or common causeswere to blame for variability.
324 BASIC PRINCIPLES of MEASUREMENT
DMAIC^ ^ ^CHAPTER
10
Measurement SystemsAnalysis
R&R STUDIES FOR CONTINUOUS DATADiscrimination, stability, bias, repeatability,reproducibility, and linearity
Modern measurement system analysis goes well beyond calibration. A gagecan be perfectly accurate when checking a standard and still be entirely unac-ceptable for measuring a product or controlling a process. This section illus-trates techniques for quantifying discrimination, stability, bias, repeatability,reproducibility and variation for a measurement system. We also show how toexpress measurement error relative to the product tolerance or the process var-iation. For the most part, the methods shown here use control charts. Controlcharts provide graphical portrayals of the measurement processes that enablethe analyst to detect special causes that numerical methods alone would notdetect.
MEASUREMENT SYSTEM DISCRIMINATIONDiscrimination, sometimes called resolution, refers to the ability of the
measurement system to divide measurements into ‘‘data categories.’’ Allparts within a particular data category will measure the same. For example,
Copyright 2003 by The McGraw-Hill Companies, Inc. Click Here for Terms of Use.

if a measurement system has a resolution of 0.001 inches, then items measur-ing 1.0002, 1.0003, 0.9997 would all be placed in the data category 1.000, i.e.,they would all measure 1.000 inches with this particular measurement system.A measurement system’s discrimination should enable it to divide the regionof interest into many data categories. In Six Sigma, the region of interest isthe smaller of the tolerance (the high specification minus the low specifica-tion) or six standard deviations. A measurement system should be able todivide the region of interest into at least five data categories. For example, ifa process was capable (i.e., Six Sigma is less than the tolerance) ands ¼ 0:0005, then a gage with a discrimination of 0.0005 would be acceptable(six data categories), but one with a discrimination of 0.001 would not(three data categories). When unacceptable discrimination exists, the rangechart shows discrete ‘‘jumps’’ or ‘‘steps.’’ This situation is illustrated inFigure 10.1.
326 MEASUREMENT SYSTEMS ANALYSIS
Figure 10.1. Inadequate gage discrimination on a control chart.
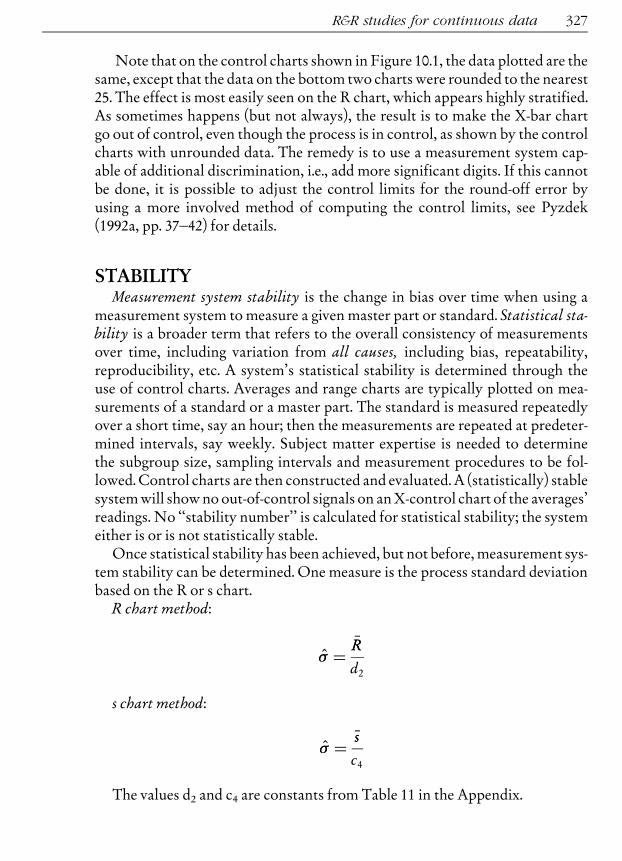
Note that on the control charts shown in Figure 10.1, the data plotted are thesame, except that the data on the bottom two charts were rounded to the nearest25. The effect is most easily seen on the R chart, which appears highly stratified.As sometimes happens (but not always), the result is to make the X-bar chartgo out of control, even though the process is in control, as shown by the controlcharts with unrounded data. The remedy is to use a measurement system cap-able of additional discrimination, i.e., add more significant digits. If this cannotbe done, it is possible to adjust the control limits for the round-off error byusing a more involved method of computing the control limits, see Pyzdek(1992a, pp. 37^42) for details.
STABILITYMeasurement system stability is the change in bias over time when using a
measurement system to measure a given master part or standard. Statistical sta-bility is a broader term that refers to the overall consistency of measurementsover time, including variation from all causes, including bias, repeatability,reproducibility, etc. A system’s statistical stability is determined through theuse of control charts. Averages and range charts are typically plotted on mea-surements of a standard or a master part. The standard is measured repeatedlyover a short time, say an hour; then the measurements are repeated at predeter-mined intervals, say weekly. Subject matter expertise is needed to determinethe subgroup size, sampling intervals and measurement procedures to be fol-lowed. Control charts are then constructed and evaluated. A (statistically) stablesystemwill showno out-of-control signals on anX-control chart of the averages’readings. No ‘‘stability number’’ is calculated for statistical stability; the systemeither is or is not statistically stable.Once statistical stability has been achieved, but not before, measurement sys-
tem stability can be determined. One measure is the process standard deviationbased on the R or s chart.
R chart method:
�̂� ¼�RR
d2
s chart method:
�̂� ¼ �ss
c4
The values d2 and c4 are constants from Table 11 in the Appendix.
R&R studies for continuous data 327
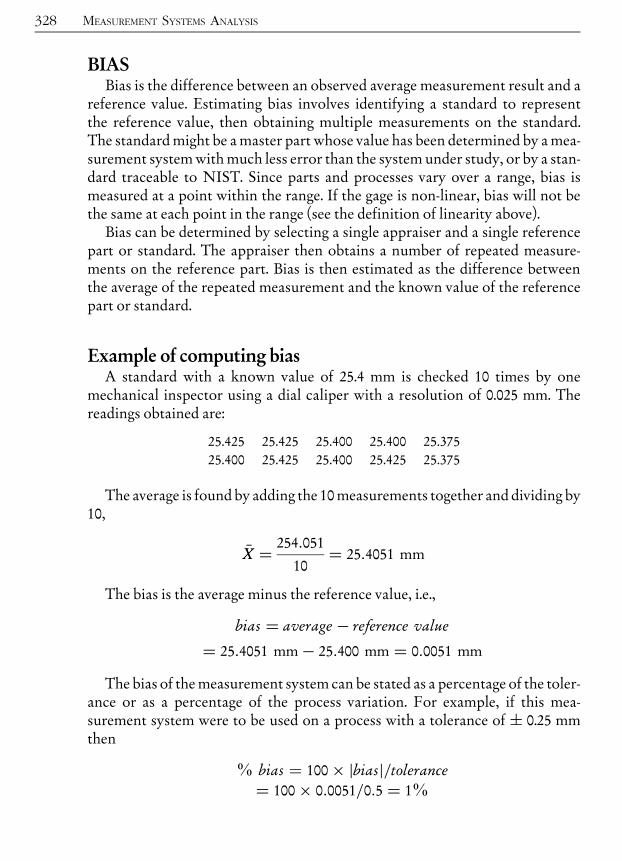
BIASBias is the difference between an observed average measurement result and a
reference value. Estimating bias involves identifying a standard to representthe reference value, then obtaining multiple measurements on the standard.The standardmight be amaster part whose value has been determined by amea-surement systemwithmuch less error than the system under study, or by a stan-dard traceable to NIST. Since parts and processes vary over a range, bias ismeasured at a point within the range. If the gage is non-linear, bias will not bethe same at each point in the range (see the definition of linearity above).Bias can be determined by selecting a single appraiser and a single reference
part or standard. The appraiser then obtains a number of repeated measure-ments on the reference part. Bias is then estimated as the difference betweenthe average of the repeated measurement and the known value of the referencepart or standard.
Example of computing biasA standard with a known value of 25.4 mm is checked 10 times by one
mechanical inspector using a dial caliper with a resolution of 0.025 mm. Thereadings obtained are:
25.425 25.425 25.400 25.400 25.37525.400 25.425 25.400 25.425 25.375
The average is found by adding the 10measurements together and dividing by10,
�XX ¼ 254:051
10¼ 25:4051 mm
The bias is the average minus the reference value, i.e.,
bias ¼ average� reference value
¼ 25:4051 mm� 25:400 mm ¼ 0:0051 mm
The bias of themeasurement system can be stated as a percentage of the toler-ance or as a percentage of the process variation. For example, if this mea-surement system were to be used on a process with a tolerance of � 0.25 mmthen
% bias ¼ 100� jbiasj=tolerance¼ 100� 0:0051=0:5 ¼ 1%
328 MEASUREMENT SYSTEMS ANALYSIS
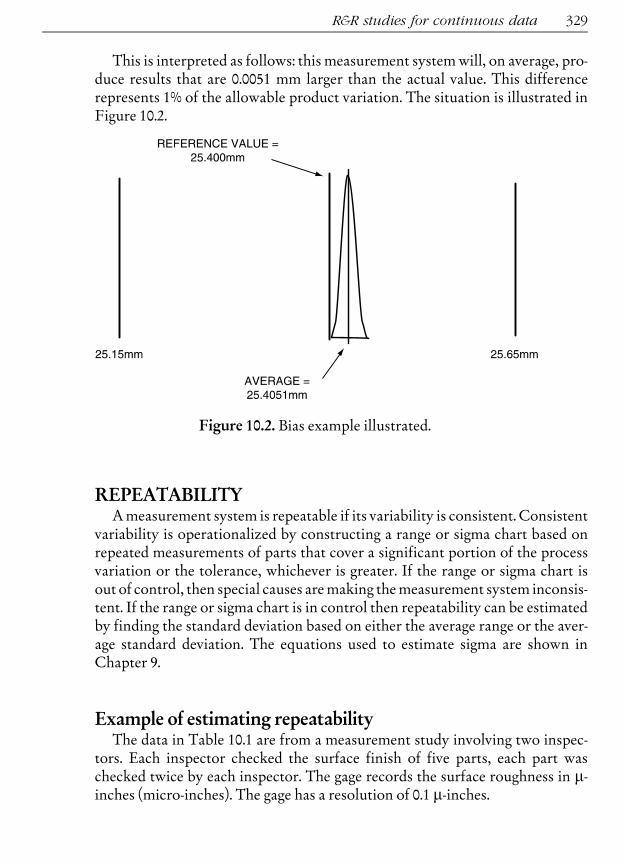
This is interpreted as follows: this measurement systemwill, on average, pro-duce results that are 0.0051 mm larger than the actual value. This differencerepresents 1% of the allowable product variation. The situation is illustrated inFigure 10.2.
REPEATABILITYAmeasurement system is repeatable if its variability is consistent. Consistent
variability is operationalized by constructing a range or sigma chart based onrepeated measurements of parts that cover a significant portion of the processvariation or the tolerance, whichever is greater. If the range or sigma chart isout of control, then special causes aremaking themeasurement system inconsis-tent. If the range or sigma chart is in control then repeatability can be estimatedby finding the standard deviation based on either the average range or the aver-age standard deviation. The equations used to estimate sigma are shown inChapter 9.
Example of estimating repeatabilityThe data in Table 10.1 are from a measurement study involving two inspec-
tors. Each inspector checked the surface finish of five parts, each part waschecked twice by each inspector. The gage records the surface roughness in m-inches (micro-inches). The gage has a resolution of 0.1 m-inches.
R&R studies for continuous data 329
Figure 10.2. Bias example illustrated.

We compute:Ranges chart
�RR ¼ 0:51
UCL ¼ D4�RR ¼ 3:267� 0:51 ¼ 1:67
Averages chart
��XX�XX ¼ 118:85
LCL ¼ ��XX�XX � A2 �RR ¼ 118:85� 1:88� 0:109 ¼ 118:65
UCL ¼ ��XX�XX þ A2 �RR ¼ 118:85þ 1:88� 0:109 ¼ 119:05
330 MEASUREMENT SYSTEMS ANALYSIS
Table 10.1. Measurement system repeatability study data.
PART READING #1 READING #2 AVERAGE RANGE
INSPECTOR#1
1 111.9 112.3 112.10 0.4
2 108.1 108.1 108.10 0.0
3 124.9 124.6 124.75 0.3
4 118.6 118.7 118.65 0.1
5 130.0 130.7 130.35 0.7
INSPECTOR #2
1 111.4 112.9 112.15 1.5
2 107.7 108.4 108.05 0.7
3 124.6 124.2 124.40 0.4
4 120.0 119.3 119.65 0.7
5 130.4 130.1 130.25 0.3

The data and control limits are displayed in Figure 10.3. The R chart analysisshows that all of the R values are less than the upper control limit. This indicatesthat the measurement system’s variability is consistent, i.e., there are no specialcauses of variation.
Note that many of the averages are outside of the control limits. This is theway it should be! Consider that the spread of the X-bar chart’s control limits isbased on the average range, which is based on the repeatability error. If theaverageswerewithin the control limits it wouldmean that the part-to-part varia-tion was less than the variation due to gage repeatability error, an undesirablesituation. Because the R chart is in control we can now estimate the standarddeviation for repeatability or gage variation:
�e ¼�RR
d�2ð10:1Þ
where d�2 is obtained from Table 13 in the Appendix. Note that we are using d�2and not d2. The d
�2 values are adjusted for the small number of subgroups typi-
cally involved in gage R&R studies. Table 13 is indexed by two values: m is thenumber of repeat readings taken (m ¼ 2 for the example), and g is the numberof parts times the number of inspectors (g ¼ 5� 2 ¼ 10 for the example).This gives, for our example
�e ¼�RR
d�2¼ 0:51
1:16¼ 0:44
R&R studies for continuous data 331
Figure 10.3. Repeatability control charts.

The repeatability from this study is calculated by 5:15�e ¼ 5:15�0:44 ¼ 2:26. The value 5.15 is the Z ordinate which includes 99% of a standardnormal distribution.
REPRODUCIBILITYA measurement system is reproducible when different appraisers produce
consistent results. Appraiser-to-appraiser variation represents a bias due toappraisers. The appraiser bias, or reproducibility, can be estimated by com-paring each appraiser’s average with that of the other appraisers. The standarddeviation of reproducibility (�o) is estimated by finding the range betweenappraisers (Ro) and dividing by d
�2 . Reproducibility is then computed as 5.15�o.
Reproducibility example (AIAG method)Using the data shown in the previous example, each inspector’s average is
computed and we find:
Inspector #1 average ¼ 118:79�-inches
Inspector #2 average ¼ 118:90�-inches
Range ¼ Ro ¼ 0:11�-inches
Looking in Table 13 in the Appendix for one subgroup of two appraisers wefind d�2 ¼ 1:41 ðm ¼ 2, g ¼ 1), since there is only one range calculation g ¼ 1.Using these results we find Ro=d
�2 ¼ 0:11=1:41 ¼ 0:078.
This estimate involves averaging the results for each inspector over all of thereadings for that inspector. However, since each inspector checked each partrepeatedly, this reproducibility estimate includes variation due to repeatabilityerror. The reproducibility estimate can be adjusted using the following equa-tion: ffiffiffiffiffiffiffiffiffiffiffiffiffiffiffiffiffiffiffiffiffiffiffiffiffiffiffiffiffiffiffiffiffiffiffiffiffiffiffiffiffiffi
5:15Ro
d�2
� �2
� ð5:15�eÞ2nr
s¼
ffiffiffiffiffiffiffiffiffiffiffiffiffiffiffiffiffiffiffiffiffiffiffiffiffiffiffiffiffiffiffiffiffiffiffiffiffiffiffiffiffiffiffiffiffiffiffiffiffiffiffiffiffiffiffiffiffiffiffi5:15� 0:11
1:41
� �2
�ð5:15� 0:44Þ25� 2
s
¼ ffiffiffiffiffiffiffiffiffiffiffiffiffiffiffiffiffiffiffiffiffi0:16� 0:51
p ¼ 0
As sometimes happens, the estimated variance from reproducibility exceedsthe estimated variance of repeatability + reproducibility. When this occurs theestimated reproducibility is set equal to zero, since negative variances are the-oretically impossible. Thus, we estimate that the reproducibility is zero.
332 MEASUREMENT SYSTEMS ANALYSIS

The measurement system standard deviation is
�m ¼ffiffiffiffiffiffiffiffiffiffiffiffiffiffiffi�2e þ �2o
p¼
ffiffiffiffiffiffiffiffiffiffiffiffiffiffiffiffiffiffiffiffið0:44Þ2 þ 0
q¼ 0:44 ð10:2Þ
and the measurement system variation, or gage R&R, is 5.15�m. For our datagage R&R¼ 5:15� 0:44 ¼ 2:27.
Reproducibility example (alternative method)One problem with the above method of evaluating reproducibility error is
that it does not produce a control chart to assist the analyst with the evaluation.The method presented here does this. This method begins by rearranging thedata in Table 10.1 so that all readings for any given part become a single row.This is shown in Table 10.2.
Observe that when the data are arranged in this way, theR valuemeasures thecombined range of repeat readings plus appraisers. For example, the smallestreading for part #3 was from inspector #2 (124.2) and the largest was frominspector #1 (124.9). Thus, R represents two sources of measurement error:repeatability and reproducibility.
R&R studies for continuous data 333
Table 10.2. Measurement error data for reproducibility evaluation.
INSPECTOR#1 INSPECTOR#2
Part Reading 1 Reading 2 Reading 1 Reading 2 X bar R
1 111.9 112.3 111.4 112.9 112.125 1.5
2 108.1 108.1 107.7 108.4 108.075 0.7
3 124.9 124.6 124.6 124.2 124.575 0.7
4 118.6 118.7 120 119.3 119.15 1.4
5 130 130.7 130.4 130.1 130.3 0.7
Averages! 118.845 1

The control limits are calculated as follows:Ranges chart
�RR ¼ 1:00
UCL ¼ D4�RR ¼ 2:282� 1:00 ¼ 2:282
Note that the subgroup size is 4.
Averages chart
��XX�XX ¼ 118:85
LCL ¼ ��XX�XX � A2 �RR ¼ 118:85� 0:729� 1 ¼ 118:12
UCL ¼ ��XX�XX þ A2 �RR ¼ 118:85þ 0:729� 1 ¼ 119:58
The data and control limits are displayed in Figure 10.4. The R chart analysisshows that all of the R values are less than the upper control limit. This indicatesthat the measurement system’s variability due to the combination of repeatabil-ity and reproducibility is consistent, i.e., there are no special causes of variation.
Using this method, we can also estimate the standard deviation of repro-ducibility plus repeatability, as we can find �o ¼ Ro=d
�2 ¼ 1=2:08 ¼ 0:48.
Now we know that variances are additive, so
�2repeatabilityþreproducibility ¼ �2repeatability þ �2reproducibility ð10:3Þ
334 MEASUREMENT SYSTEMS ANALYSIS
Figure 10.4. Reproducibility control charts.
which implies that
�reproducibility ¼ffiffiffiffiffiffiffiffiffiffiffiffiffiffiffiffiffiffiffiffiffiffiffiffiffiffiffiffiffiffiffiffiffiffiffiffiffiffiffiffiffiffiffiffiffiffiffiffiffiffiffiffiffiffiffiffiffiffiffiffiffiffiffiffiffiffi�2repeatabilityþreproducibility � �2repeatability
qIn a previous example, we computed �repeatability ¼ 0:44. Substituting these
values gives
�reproducibility ¼ffiffiffiffiffiffiffiffiffiffiffiffiffiffiffiffiffiffiffiffiffiffiffiffiffiffiffiffiffiffiffiffiffiffiffiffiffiffiffiffiffiffiffiffiffiffiffiffiffiffiffiffiffiffiffiffiffiffiffiffiffiffiffiffiffiffi�2repeatabilityþreproducibility � �2repeatability
q¼
ffiffiffiffiffiffiffiffiffiffiffiffiffiffiffiffiffiffiffiffiffiffiffiffiffiffiffiffiffiffiffið0:48Þ2 � ð0:44Þ2
q¼ 0:19
Using this we estimate reproducibility as 5:15� 0:19 ¼ 1:00.
PART-TO-PART VARIATIONThe X-bar charts show the part-to-part variation. To repeat, if the measure-
ment system is adequate,most of the parts will fall outside of the X -bar chart con-trol limits. If fewer than half of the parts are beyond the control limits, thenthe measurement system is not capable of detecting normal part-to-part vari-ation for this process.Part-to-part variation can be estimated once the measurement process is
shown to have adequate discrimination and to be stable, accurate, linear (seebelow), and consistent with respect to repeatability and reproducibility. If thepart-to-part standard deviation is to be estimated from themeasurement systemstudy data, the following procedures are followed:1. Plot the average for each part (across all appraisers) on an averages con-
trol chart, as shown in the reproducibility error alternate method.2. Con¢rm that at least 50% of the averages fall outside the control limits. If
not, ¢nd a better measurement system for this process.3. Find the range of the part averages, Rp.4. Compute �p ¼ Rp=d
�2 , the part-to-part standard deviation. The value of
d�2 is found in Table 13 in the Appendix usingm ¼ the number of partsand g ¼ 1, since there is only one R calculation.
5. The 99% spread due to part-to-part variation (PV) is found as 5.15�p.
Once the above calculations have been made, the overall measurement sys-tem can be evaluated.1. The total process standard deviation is found as �t ¼
ffiffiffiffiffiffiffiffiffiffiffiffiffiffiffiffi�2m þ �2p
q. Where
�m ¼ the standard deviation due to measurement error.2. Total variability (TV) is 5.15�t.3. The percent repeatability and reproducibility (R&R) is 100� ð�m=�tÞ%.
R&R studies for continuous data 335

4. The number of distinct data categories that can be created with this mea-surement system is 1.41� (PV/R&R).
EXAMPLE OF MEASUREMENT SYSTEM ANALYSISSUMMARY1. Plot the average for each part (across all appraisers) on an averages con-
trol chart, as shown in the reproducibility error alternate method.Done above, see Figure 10.3.
2. Con¢rm that at least 50% of the averages fall outside the control limits. Ifnot, ¢nd a better measurement system for this process.
4 of the 5 part averages, or 80%, are outside of the control limits. Thus,the measurement system error is acceptable.
3. Find the range of the part averages, Rp.Rp ¼ 130:3� 108:075 ¼ 22:23.
4. Compute �p ¼ Rp=d�2 , the part-to-part standard deviation. The value of
d�2 is found in Table 13 in the Appendix usingm ¼ the number of partsand g ¼ 1, since there is only one R calculation.
m ¼ 5, g ¼ 1, d�2 ¼ 2:48, �p ¼ 22:23=2:48 ¼ 8:96.5. The 99% spread due to part-to-part variation (PV) is found as 5.15�p.
5:15� 8:96 ¼ PV ¼ 46:15.
Once the above calculations have been made, the overall measurement sys-tem can be evaluated.1. The total process standard deviation is found as �t ¼
ffiffiffiffiffiffiffiffiffiffiffiffiffiffiffiffi�2m þ �2p
q�t ¼
ffiffiffiffiffiffiffiffiffiffiffiffiffiffiffiffi�2m þ �2p
q¼
ffiffiffiffiffiffiffiffiffiffiffiffiffiffiffiffiffiffiffiffiffiffiffiffiffiffiffiffiffiffiffið0:44Þ2 þ ð8:96Þ2
q¼ ffiffiffiffiffiffiffiffi
80:5p ¼ 8:97
2. Total variability (TV) is 5.15�t.
5:15� 8:97 ¼ 46:20
3. The percent R&R is 100� ð�m=�tÞ%
100�m�t
% ¼ 1000:44
8:97¼ 4:91%
4. The number of distinct data categories that can be created with this mea-surement system is 1:41� ðPV=R&RÞ.
1:41� 46:15
2:27¼ 28:67 ¼ 28
336 MEASUREMENT SYSTEMS ANALYSIS

Since the minimum number of categories is five, the analysis indicates thatthis measurement system is more than adequate for process analysis or processcontrol.
Gage R&R analysis using MinitabMinitab has a built-in capability to perform gage repeatability and reproduci-
bility studies. To illustrate these capabilities, the previous analysis will berepeated using Minitab. To begin, the data must be rearranged into the formatexpected by Minitab (Figure 10.5). For reference purposes, columns C1^C4contain the data in our original format and columns C5^C8 contain the samedata in Minitab’s preferred format.
Minitab offers two different methods for performing gage R&R studies:crossed and nested. Use gage R&R nested when each part can be measured byonly one operator, as with destructive testing. Otherwise, choose gage R&Rcrossed. To do this, select Stat>Quality Tools>Gage R&R Study (Crossed)to reach the Minitab dialog box for our analysis (Figure 10.6). In addition tochoosing whether the study is crossed or nested, Minitab also offers both the
R&R studies for continuous data 337
Figure 10.5. Data formatted for Minitab input.
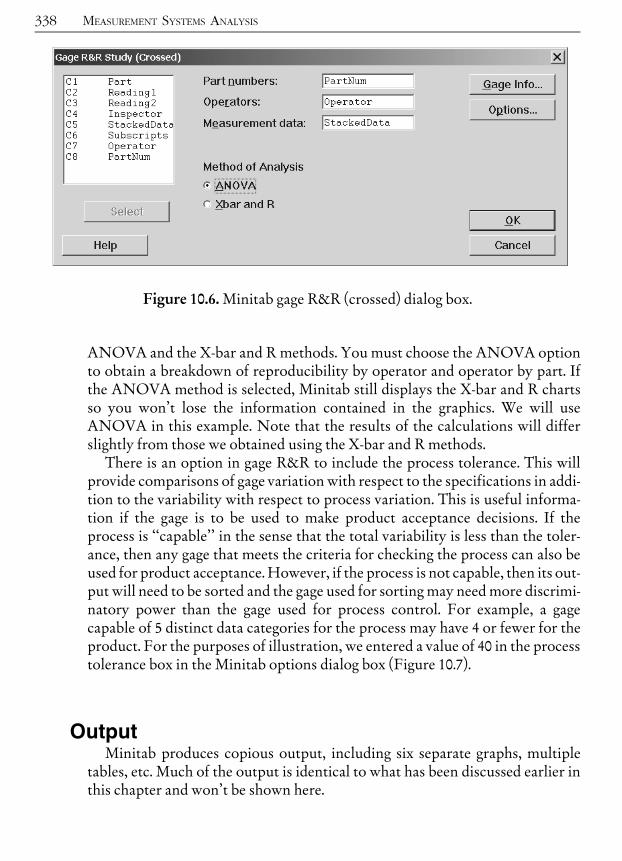
ANOVA and the X-bar and R methods. You must choose the ANOVA optionto obtain a breakdown of reproducibility by operator and operator by part. Ifthe ANOVA method is selected, Minitab still displays the X-bar and R chartsso you won’t lose the information contained in the graphics. We will useANOVA in this example. Note that the results of the calculations will differslightly from those we obtained using the X-bar and R methods.There is an option in gage R&R to include the process tolerance. This will
provide comparisons of gage variation with respect to the specifications in addi-tion to the variability with respect to process variation. This is useful informa-tion if the gage is to be used to make product acceptance decisions. If theprocess is ‘‘capable’’ in the sense that the total variability is less than the toler-ance, then any gage that meets the criteria for checking the process can also beused for product acceptance.However, if the process is not capable, then its out-put will need to be sorted and the gage used for sorting may need more discrimi-natory power than the gage used for process control. For example, a gagecapable of 5 distinct data categories for the process may have 4 or fewer for theproduct. For the purposes of illustration, we entered a value of 40 in the processtolerance box in the Minitab options dialog box (Figure 10.7).
OutputMinitab produces copious output, including six separate graphs, multiple
tables, etc. Much of the output is identical to what has been discussed earlier inthis chapter and won’t be shown here.
338 MEASUREMENT SYSTEMS ANALYSIS
Figure 10.6. Minitab gage R&R (crossed) dialog box.
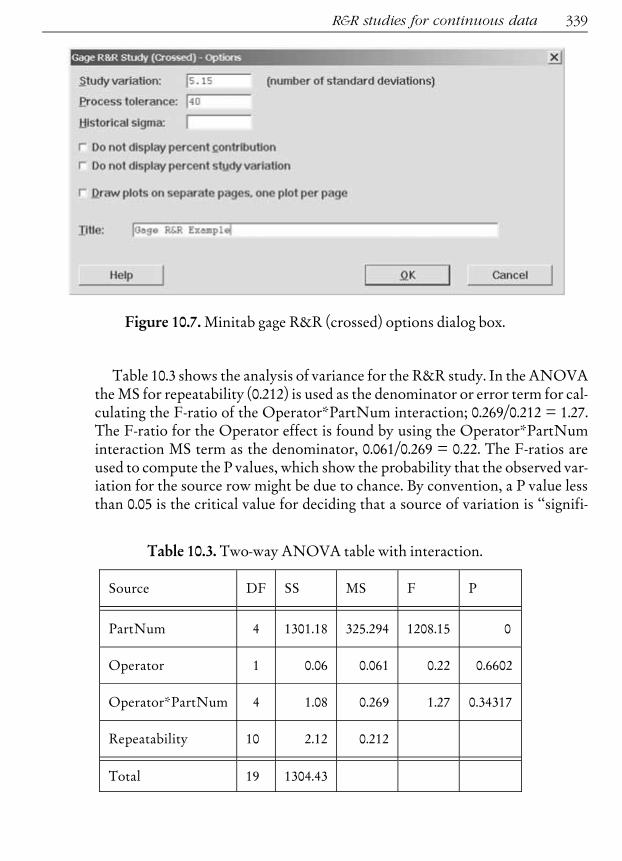
Table 10.3 shows the analysis of variance for the R&R study. In the ANOVAtheMS for repeatability (0.212) is used as the denominator or error term for cal-culating the F-ratio of the Operator*PartNum interaction; 0.269/0.212 = 1.27.The F-ratio for the Operator effect is found by using the Operator*PartNuminteraction MS term as the denominator, 0.061/0.269 = 0.22. The F-ratios areused to compute the P values, which show the probability that the observed var-iation for the source row might be due to chance. By convention, a P value lessthan 0.05 is the critical value for deciding that a source of variation is ‘‘signifi-
R&R studies for continuous data 339
Figure 10.7. Minitab gage R&R (crossed) options dialog box.
Table 10.3. Two-way ANOVA table with interaction.
Source DF SS MS F P
PartNum 4 1301.18 325.294 1208.15 0
Operator 1 0.06 0.061 0.22 0.6602
Operator*PartNum 4 1.08 0.269 1.27 0.34317
Repeatability 10 2.12 0.212
Total 19 1304.43

cant,’’ i.e., greater than zero. For example, the P value for the PartNum row is 0,indicating that the part-to-part variation is almost certainly not zero. The Pvalues for Operator (0.66) and the Operator*PartNum interaction (0.34) aregreater than 0.05 so we conclude that the differences accounted for by thesesources might be zero. If the Operator term was significant (P < 0.05) wewould conclude that there were statistically significant differences betweenoperators, prompting an investigation into underlying causes. If the interactionterm was significant, we would conclude that one operator has obtained differ-ent results with some, but not all, parts.Minitab’s next output is shown in Table 10.4. This analysis has removed the
interaction term from the model, thereby gaining 4 degrees of freedom for theerror term and making the test more sensitive. In some cases this might identifya significant effect that was missed by the larger model, but for this examplethe conclusions are unchanged.
Minitab also decomposes the total variance into components, as shown inTable 10.5. The VarComp column shows the variance attributed to each source,while the % of VarComp shows the percentage of the total variance accountedfor by each source. The analysis indicates that nearly all of the variation isbetween parts.The variance analysis shown in Table 10.5, while accurate, is not in original
units. (Variances are the squares of measurements.) Technically, this is the cor-rect way to analyze information on dispersion because variances are additive,while dispersion measurements expressed in original units are not. However,there is a natural interest in seeing an analysis of dispersion in the originalunits so Minitab provides this. Table 10.6 shows the spread attributable to the
340 MEASUREMENT SYSTEMS ANALYSIS
Table 10.4. Two-way ANOVA table without interaction.
Source DF SS MS F P
PartNum 4 1301.18 325.294 1426.73 0
Operator 1 0.06 0.061 0.27 0.6145
Repeatability 14 3.19 0.228
Total 19 1304.43
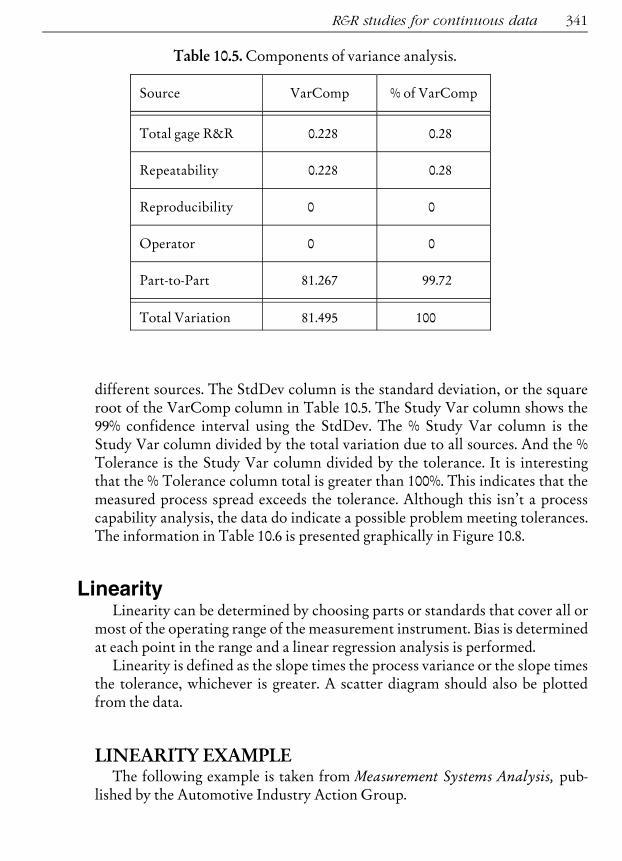
different sources. The StdDev column is the standard deviation, or the squareroot of the VarComp column in Table 10.5. The Study Var column shows the99% confidence interval using the StdDev. The % Study Var column is theStudy Var column divided by the total variation due to all sources. And the %Tolerance is the Study Var column divided by the tolerance. It is interestingthat the % Tolerance column total is greater than 100%. This indicates that themeasured process spread exceeds the tolerance. Although this isn’t a processcapability analysis, the data do indicate a possible problem meeting tolerances.The information in Table 10.6 is presented graphically in Figure 10.8.
LinearityLinearity can be determined by choosing parts or standards that cover all or
most of the operating range of the measurement instrument. Bias is determinedat each point in the range and a linear regression analysis is performed.Linearity is defined as the slope times the process variance or the slope times
the tolerance, whichever is greater. A scatter diagram should also be plottedfrom the data.
LINEARITY EXAMPLEThe following example is taken from Measurement Systems Analysis, pub-
lished by the Automotive Industry Action Group.
R&R studies for continuous data 341
Table 10.5. Components of variance analysis.
Source VarComp % of VarComp
Total gage R&R 0.228 0.28
Repeatability 0.228 0.28
Reproducibility 0 0
Operator 0 0
Part-to-Part 81.267 99.72
Total Variation 81.495 100

342 MEASUREMENT SYSTEMS ANALYSIS
Table 10.6. Analysis of spreads.
Source StdDev
StudyVar
(5.15*SD)% Study Var
(%SV)
%Tolerance(SV/Toler)
Total gage R&R 0.47749 2.4591 5.29 6.15
Repeatability 0.47749 2.4591 5.29 6.15
Reproducibility 0 0 0 0
Operator 0 0 0 0
Part-to-Part 9.0148 46.4262 99.86 116.07
Total Variation 9.02743 46.4913 100 116.23
Figure 10.8. Graphical analysis of components of variation.

A plant foreman was interested in determining the linearity of a measure-ment system. Five parts were chosen throughout the operating range of themea-surement system based upon the process variation. Each part was measured bya layout inspection to determine its reference value. Each part was then mea-sured twelve times by a single appraiser. The parts were selected at random.The part average and bias average were calculated for each part as shown inFigure 10.9. The part bias was calculated by subtracting the part referencevalue from the part average.
A linear regression analysis was performed. In the regression, x is the refer-ence value and y is the bias. The results are shown in Figure 10.10.
R&R studies for continuous data 343
Figure 10.9. Gage data summary.
Figure 10.10. Regression analysis of linearity summary data.

The P-values indicate that the result is statistically significant, i.e., there isactually a bias in the gage. The slope of the line is �0.132, and the intercept is0.74. R2 ¼ 0:98, indicating that the straight line explains about 98% of the varia-tion in the bias readings. The results can be summarized as follows:
Bias bþ ax ¼ 0:74� 0:132 (Reference Value)Linearity jslopej � Process Variation¼ 0:132� 6 ¼ 0:79, where 6 is the
tolerance% Linearity 100%� jslopej ¼ 13:2%
Note that the zero bias point is found at
x ¼ � intercept
slope
� �¼ � 0:74
�0:132� �
¼ 5:61
In this case, this is the point of least bias. Greater bias exists as you movefurther from this value.This information is summarized graphically in Figure 10.11.
344 MEASUREMENT SYSTEMS ANALYSIS
Figure 10.11. Graphical analysis of linearity.

LINEARITY ANALYSIS USING MINITABMinitab has a built-in capability to perform gage linearity analysis. Figure
10.12 shows the data layout and dialog box. Figure 10.13 shows the Minitab out-put.Note thatMinitab doesn’t show the P-values for the analysis so it is necessary
to perform a supplementary regression analysis anyway to determine the statis-tical significance of the results. For this example, it is obvious from the scatterplot that the slope of the line isn’t zero, so a P-value isn’t required to concludethat non-linearity exists. The results aren’t so clear for bias, which is only0.867%. In fact, if we perform a one-sample t test of the hypothesis that themean bias is 0, we get the results shown in Figure 10.14, which indicate the biascould be 0 (P = 0.797).*
R&R studies for continuous data 345
Figure 10.12. Minitab gage linearity dialog box.
*A problem with this analysis is that the datum for each part is an average of twelve measurements, not individual measure-
ments. If we could obtain the 60 actual measurements the P-value would probably be different because the standard error
would be based on 60 measurements rather than five. On the other hand, the individual measurements would also be more
variable, so the exact magnitude of the difference is impossible to determine without the raw data.
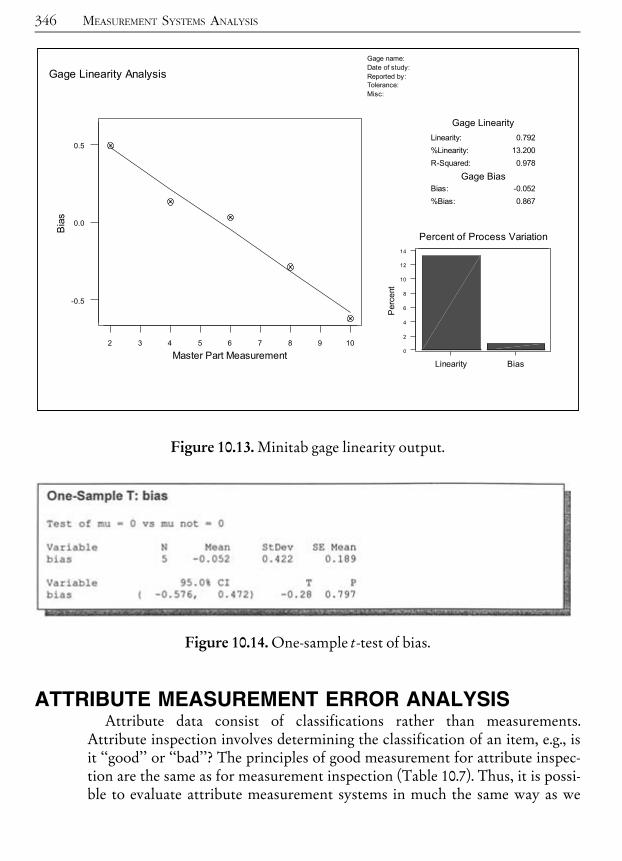
ATTRIBUTE MEASUREMENT ERROR ANALYSISAttribute data consist of classifications rather than measurements.
Attribute inspection involves determining the classification of an item, e.g., isit ‘‘good’’ or ‘‘bad’’? The principles of good measurement for attribute inspec-tion are the same as for measurement inspection (Table 10.7). Thus, it is possi-ble to evaluate attribute measurement systems in much the same way as we
346 MEASUREMENT SYSTEMS ANALYSIS
Figure 10.13. Minitab gage linearity output.
Figure 10.14. One-sample t-test of bias.

evaluate variable measurement systems. Much less work has been done onevaluating attribute measurement systems. The proposals provided in thisbook are those I’ve found to be useful for my employers and clients. Theideas are not part of any standard and you are encouraged to think aboutthem critically before adopting them. I also include an example of Minitab’sattribute gage R&R analysis.
Attribute measurement error analysis 347
Table 10.7. Attribute measurement concepts.
MeasurementConcept
Interpretation forAttribute Data Suggested Metrics and Comments
Accuracy Items are correctlycategorized.
Number of times correctly classified by all
Total number of evaluations by all
Requires knowledge of the ‘‘true’’ value.
Bias The proportion ofitems in a givencategory is correct.
Overall average proportion in a given category (for allinspectors) minus correct proportion in a givencategory. Averaged over all categories.
Requires knowledge of the ‘‘true’’ value.
Repeatability When an inspectorevaluates the sameitem multipletimes in a shorttime interval, sheassigns it to thesame categoryevery time.
For a given inspector:
Total number of times repeat classifications agree
Total number of repeat classifications
Overall: Average of repeatabilities
Reproducibility When allinspectors evaluatethe same item,they all assign it tothe same category.
Total number of times classifications for all concur
Total number of classifications
Continued on next page . . .

Operational definitionsAn operational definition is defined as a requirement that includes a means
of measurement. ‘‘High quality solder’’ is a requirement that must be operatio-nalized by a clear definition of what ‘‘high quality solder’’ means. This mightinclude verbal descriptions, magnification power, photographs, physical com-parison specimens, and many more criteria.
EXAMPLES OF OPERATIONAL DEFINITIONS
1. Operational de¢nition of the Ozone Transport Assessment Group’s(OTAG) goal
Goal: To identify reductions and recommend transported ozoneand its precursors which, in combination with other measures, willenable attainment and maintenance of the ozone standard in theOTAG region.
348 MEASUREMENT SYSTEMS ANALYSIS
MeasurementConcept
Interpretation forAttribute Data Suggested Metrics and Comments
Stability The variabilitybetween attributeR&R studies atdi¡erent times.
‘‘Linearity’’ When an inspectorevaluates itemscovering the fullset of categories,her classi¢cationsare consistentacross thecategories.
Range of inaccuracy and bias across all categories.
Requires knowledge of the ‘‘true’’ value.
Note: Because there is no natural ordering fornominal data, the concept of linearity doesn’t reallyhave a precise analog for attribute data on this scale.However, the suggested metrics will highlightinteractions between inspectors and speci¢c categories.
Metric Stability Measure for Metric
Repeatability Standard deviation ofrepeatabilities
Reproducibility Standard deviation ofreproducibilities
Accuracy Standard deviation of accuracies
Bias Average bias
Table 10.7 (cont.)

Suggested operational de¢nition of the goal:1. A general modeled reduction in ozone and ozone precursors
aloft throughout the OTAG region; and2. A reduction of ozone and ozone precursors both aloft and at
ground level at the boundaries of non-attainment area modelingdomains in the OTAG region; and
3. A minimization of increases in peak ground level ozone concen-trations in the OTAG region. (This component of the opera-tional de¢nition is in review.)
2. Wellesley College Child Care Policy Research Partnership operationalde¢nition of unmet need1. Standard of comparison to judge the adequacy of neighborhood ser-
vices: the median availability of services in the larger region(Hampden County).
2. Thus, our de¢nition of unmet need: The di¡erence between the careavailable in the neighborhood and themedian level of care in the sur-rounding region (stated in terms of child care slots indexed to theage-appropriate child populationL‘‘slots-per-tots’’).
3. Operational de¢nitions of acids and bases1. An acid is any substance that increases the concentration of the H+
ion when it dissolves in water.2. A base is any substance that increases the concentration of the OH^
ion when it dissolves in water.4. Operational de¢nition of ‘‘intelligence’’
1. Administer the Stanford-Binet IQ test to a person and score theresult. The person’s intelligence is the score on the test.
5. Operational de¢nition of ‘‘dark blue carpet’’A carpet will be deemed to be dark blue if1. Judged by an inspector medically certi¢ed as having passed the U.S.
Air Force test for color-blindness1.1. Itmatches the PANTONEcolor card 7462Cwhenboth carpet
and card are illuminated byGE ‘‘cool white’’ £uorescent tubes;1.2. Card and carpet are viewed at a distance between 16 inches and
24 inches.
HOW TO CONDUCT ATTRIBUTE INSPECTIONSTUDIESSome commonly used approaches to attribute inspection analysis are shown
in Table 10.8.
Attribute measurement error analysis 349

350 MEASUREMENT SYSTEMS ANALYSIS
Table 10.8. Methods of evaluating attribute inspection.
True Value Method of Evaluation Comments
Known
Expert Judgment: Anexpert looks at theclassi¢cations after theoperator makes normalclassi¢cations and decideswhich are correct andwhich are incorrect.
& Metrics:Percent correct
& Quanti¢es the accuracy of theclassi¢cations.
& Simple to evaluate.
& Who says the expert is correct?
& Care must be taken to include all types ofattributes.
& Di⁄cult to compare operators sincedi¡erent units are classi¢ed by di¡erentpeople.
& Acceptable level of performance must bedecided upon. Consider cost, impact oncustomers, etc.
Round Robin Study: A setof carefully identi¢edobjects is chosen torepresent the full range ofattributes.
1. Each item is evaluatedby an expert and itscondition recorded.
2. Each item is evaluatedby every inspector atleast twice.
& Metrics:1. Percent correct by inspector2. Inspector repeatability3. Inspector reproducibility4. Stability5. Inspector ‘‘linearity’’
& Full range of attributes included.
& All aspects of measurement errorquanti¢ed.
& People know they’re being watched, maya¡ect performance.
& Not routine conditions.
& Special care must be taken to insure rigor.
& Acceptable level of performance must bedecided upon for each type of error.Consider cost, impact on customers, etc.
Continued on next page . . .

Example of attribute inspection error analysisTwo sheets with identical lithographed patterns are to be inspected under
carefully controlled conditions by each of the three inspectors. Each sheet hasbeen carefully examined multiple times by journeymen lithographers and theyhave determined that one of the sheets should be classified as acceptable, theother as unacceptable. The inspectors sit on a stool at a large table where thesheet will be mounted for inspection. The inspector can adjust the height ofthe stool and the angle of the table. A lighted magnifying glass is mounted tothe table with an adjustable arm that lets the inspector move it to any part ofthe sheet (see Figure 10.15).
Attribute measurement error analysis 351
True Value Method of Evaluation Comments
Unknown
Inspector ConcurrenceStudy: A set of carefullyidenti¢ed objects ischosen to represent thefull range of attributes, tothe extent possible.
1. Each item is evaluatedby every inspector atleast twice.
& Metrics:1. Inspector repeatability2. Inspector reproducibility3. Stability4. Inspector ‘‘linearity’’
& Like a round robin, except true value isn’tknown.
& Nomeasures of accuracy or bias arepossible. Can only measure agreementbetween equally quali¢ed people.
& Full range of attributes included.
& People know they’re being watched, maya¡ect performance.
& Not routine conditions.
& Special care must be taken to insure rigor.
& Acceptable level of performance must bedecided upon for each type of error.Consider cost, impact on customers, etc.
Table 10.8. (cont.)

Each inspector checks each sheet once in the morning and again in the after-noon. After each inspection, the inspector classifies the sheet as either accepta-ble or unacceptable. The entire study is repeated the following week. Theresults are shown in Table 10.9.
352 MEASUREMENT SYSTEMS ANALYSIS
Figure 10.15. Lithography inspection station table, stool and magnifying glass.
Table 10.9. Results of lithography attribute inspection study.
A B C D E F G H I
1 Part Standard InspA InspB InspC Date T|me Reproducible Accurate
2 1 1 1 1 1 Today Morning 1 1
3 1 1 0 1 1 Today Afternoon 0 0
4 2 0 0 0 0 Today Morning 1 0
5 2 0 0 0 1 Today Afternoon 0 0
6 1 1 1 1 1 LastWeek Morning 1 1
7 1 1 1 1 0 LastWeek Afternoon 0 0
8 2 0 0 0 1 LastWeek Morning 0 0
9 2 0 0 0 0 LastWeek Afternoon 1 0

In Table 10.9 the Part column identifies which sheet is being inspected, andthe Standard column is the classification for the sheet based on the journey-men’s evaluations. A 1 indicates that the sheet is acceptable, a 0 that it is unac-ceptable. The columns labeled InspA, InspB, and InspC show theclassifications assigned by the three inspectors respectively. The Reproduciblecolumn is a 1 if all three inspectors agree on the classification, whether their clas-sification agrees with the standard or not. The Accurate column is a 1 if allthree inspectors classify the sheet correctly as shown in the Standard column.
INDIVIDUAL INSPECTOR ACCURACYIndividual inspector accuracy is determined by comparing each inspector’s
classification with the Standard. For example, in cell C2 of Table 10.9Inspector A classified the unit as acceptable, and the standard column in thesame row indicates that the classification is correct. However, in cell C3 theunit is classified as unacceptable when it actually is acceptable. Continuingthis evaluation shows that Inspector A made the correct assessment 7 out of 8times, for an accuracy of 0.875 or 87.5%. The results for all inspectors are givenin Table 10.10.
Repeatability and pairwise reproducibilityRepeatability is defined in Table 10.7 as the same inspector getting the same
result when evaluating the same item more than once within a short time inter-val. Looking at InspA we see that when she evaluated Part 1 in the morning of‘‘Today’’ she classified it as acceptable (1), but in the afternoon she said it wasunacceptable (0). The other three morning/afternoon classifications matchedeach other. Thus, her repeatability is 3/4 or 75%.Pairwise reproducibility is the comparison of each inspector with every other
inspector when checking the same part at the same time on the same day. Forexample, on Part 1/Morning/Today, InspA’s classification matched that ofInspB. However, for Part 1/Afternoon/Today InspA’s classification was differ-
Attribute measurement error analysis 353
Table 10.10. Inspector accuracies.
Inspector A B C
Accuracy 87.5% 100.0% 62.5%
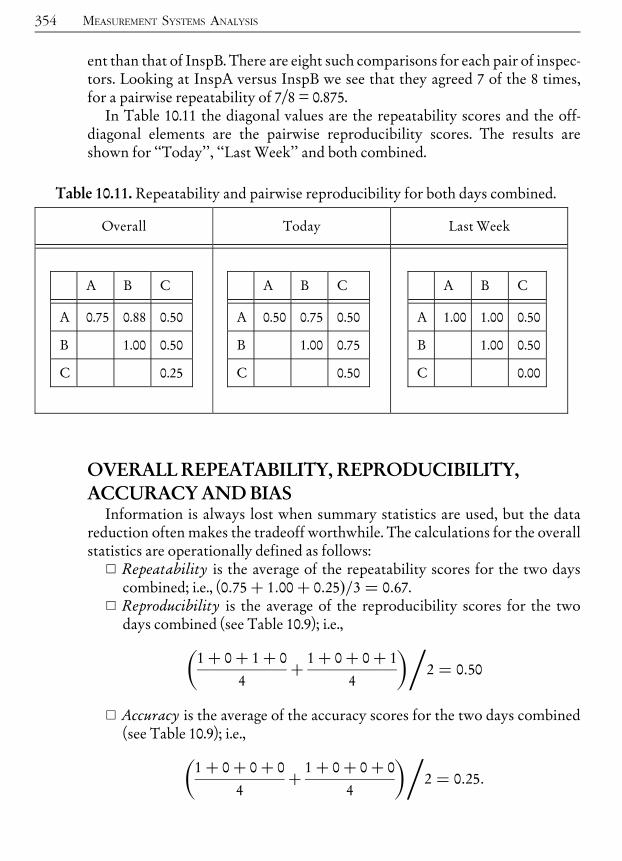
ent than that of InspB. There are eight such comparisons for each pair of inspec-tors. Looking at InspA versus InspB we see that they agreed 7 of the 8 times,for a pairwise repeatability of 7/8 = 0.875.In Table 10.11 the diagonal values are the repeatability scores and the off-
diagonal elements are the pairwise reproducibility scores. The results areshown for ‘‘Today’’, ‘‘Last Week’’ and both combined.
OVERALL REPEATABILITY, REPRODUCIBILITY,ACCURACY AND BIASInformation is always lost when summary statistics are used, but the data
reduction often makes the tradeoff worthwhile. The calculations for the overallstatistics are operationally defined as follows:
& Repeatability is the average of the repeatability scores for the two dayscombined; i.e., (0:75þ 1:00þ 0:25Þ=3 ¼ 0:67.
& Reproducibility is the average of the reproducibility scores for the twodays combined (see Table 10.9); i.e.,
1þ 0þ 1þ 0
4þ 1þ 0þ 0þ 1
4
� ��2 ¼ 0:50
& Accuracy is the average of the accuracy scores for the two days combined(see Table 10.9); i.e.,
1þ 0þ 0þ 0
4þ 1þ 0þ 0þ 0
4
� ��2 ¼ 0:25:
354 MEASUREMENT SYSTEMS ANALYSIS
Table 10.11. Repeatability and pairwise reproducibility for both days combined.
Overall Today Last Week
A B C
A 0.75 0.88 0.50
B 1.00 0.50
C 0.25
A B C
A 0.50 0.75 0.50
B 1.00 0.75
C 0.50
A B C
A 1.00 1.00 0.50
B 1.00 0.50
C 0.00

& Bias is the estimated proportion in a categoryminus the true proportion inthe category. In this example the true percent defective is 50% (1 part in2). Of the twenty-four evaluations, twelve evaluations classi¢ed the itemas defective. Thus, the bias is 0:5� 0:5 ¼ 0.
OVERALL STABILITYStability is calculated for each of the above metrics separately, as shown in
Table 10.12.
INTERPRETATION OF RESULTS1. The system overall appears to be unbiased and accurate. However, the
evaluation of individual inspectors indicates that there is room forimprovement.
2. The results of the individual accuracy analysis indicate that Inspector Chas a problem with accuracy, see Table 10.10.
3. The results of the R&R (pairwise) indicate that Inspector C has a pro-blem with both repeatability and reproducibility, see Table 10.11.
4. The repeatability numbers are not very stable (Table 10.12). Comparingthe diagonal elements for Today with those of Last Week in Table10.11, we see that Inspectors A and C tended to get di¡erent results forthe di¡erent weeks. Otherwise the system appears to be relatively stable.
5. Reproducibility of Inspectors A and B is not perfect. Some bene¢t mightbe obtained from looking at reasons for the di¡erence.
Attribute measurement error analysis 355
Table 10.12. Stability analysis.
Stability of . . . Operational De¢nition of StabilityStabilityResult
Repeatability Standard deviation of the six repeatabilities (0.5, 1, 0.5, 1, 1, 1) 0.41
Reproducibility Standard deviation of the average repeatabilities. For data inTable 10.9, =STDEV(AVERAGE(H2:H5),AVERAGE(H6:H9)) 0.00
Accuracy Standard deviation of the average accuracies. For data in Table10.9, =STDEV(AVERAGE(I2:I5),AVERAGE(I6:I9)) 0.00
Bias Average of bias over the two weeks 0.0

6. Since Inspector B’s results are more accurate and repeatable, studyingher might lead to the discovery of best practices.
Minitab attribute gage R&R exampleMinitab includes a built-in capability to analyze attribute measurement sys-
tems, known as ‘‘attribute gage R&R.’’ We will repeat the above analysis usingMinitab.Minitab can’t work with the data as shown in Table 10.9, it must be rear-
ranged. Once the data are in a format acceptable to Minitab, we enter theAttribute Gage R&R Study dialog box by choosing Stat > Quality Tools >Attribute Gage R&R Study (see Figure 10.16). Note the checkbox ‘‘Categoriesof the attribute data are ordered.’’ Check this box if the data are ordinal andhave more than two levels. Ordinal data means, for example, a 1 is in somesense ‘‘bigger’’ or ‘‘better’’ than a 0. For example, if we ask raters in a taste testa question like the following: ‘‘Rate the flavor as 0 (awful), 1 (OK), or 2 (deli-cious).’’ Our data are ordinal (acceptable is better than unacceptable), butthere are only two levels, so we will not check this box.
356 MEASUREMENT SYSTEMS ANALYSIS
Figure 10.16. Attribute gage R&R dialog box and data layout.

Within appraiser analysisMinitab evaluates the repeatability of appraisers by examining how often the
appraiser ‘‘agrees with him/herself across trials.’’ It does this by looking at allof the classifications for each part and counting the number of parts where allclassifications agreed. For our example each appraiser looked at two parts fourtimes each. Minitab’s output, shown in Figure 10.17, indicates that InspA rated50% of the parts consistently, InspB 100%, and InspC 0%. The 95% confidenceinterval on the percentage agreement is also shown. The results are displayedgraphically in Figure 10.18.
Attribute measurement error analysis 357
Figure 10.17. Minitab within appraiser assessment agreement.
Figure 10.18. Plot of within appraiser assessment agreement.
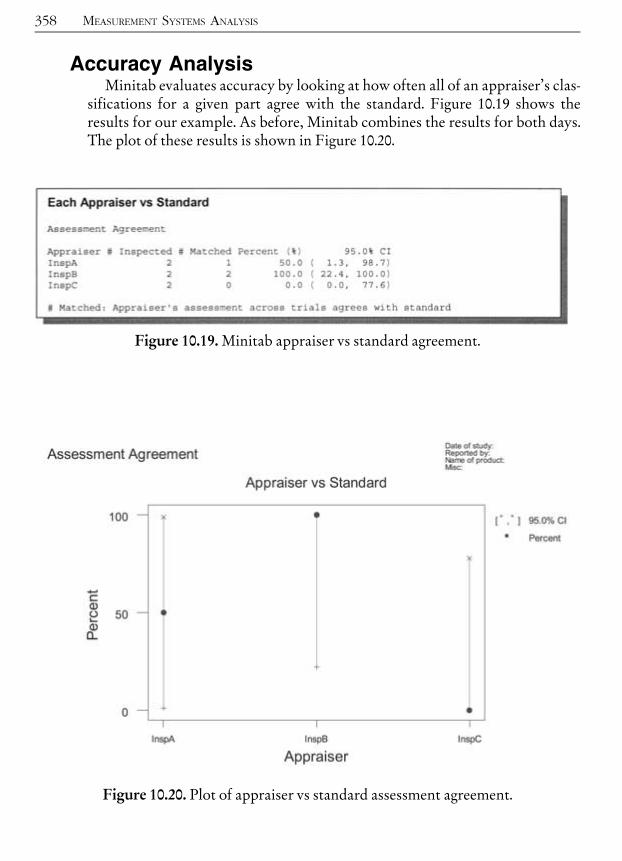
Accuracy AnalysisMinitab evaluates accuracy by looking at how often all of an appraiser’s clas-
sifications for a given part agree with the standard. Figure 10.19 shows theresults for our example. As before, Minitab combines the results for both days.The plot of these results is shown in Figure 10.20.
358 MEASUREMENT SYSTEMS ANALYSIS
Figure 10.19. Minitab appraiser vs standard agreement.
Figure 10.20. Plot of appraiser vs standard assessment agreement.

Minitab also looks at whether or not there is a distinct pattern in the disagree-ments with the standard. It does this by counting the number of times theappraiser classified an item as a 1 when the standard said it was a 0 (the # 1/0Percent column), how often the appraiser classified an item as a 0 when it wasa 1 (the # 0/1 Percent column), and how often the appraiser’s classificationswere mixed, i.e., is not repeatable (the # Mixed Percent column). The resultsare shown in Figure 10.21. The results indicate that there is no consistent bias,defined as consistently putting a unit into the same wrong category. The pro-blem, as was shown in the previous analysis, is that appraisers A and C are notrepeatable.
BETWEEN APPRAISER ASSESSMENTSNext, Minitab looks at all of the appraiser assessments for each part and
counts how often every appraiser agrees on the classification of the part. Theresults, shown in Figure 10.22, indicate that this never happened during ourexperiment. The 95% confidence interval is also shown.
Attribute measurement error analysis 359
Figure 10.21. Minitab appraiser assessment disagreement analysis.
Figure 10.22. Minitab between appraisers assessment agreement.

ALL APPRAISERS VS STANDARDFinally, Minitab looks at all of the appraiser assessments for each part and
counts how often every appraiser agrees on the classification of the partand their classification agrees with the standard. This can’t be any betterthan the between appraiser assessment agreement shown in Figure 10.22.Unsurprisingly, the results, shown in Figure 10.23, indicate that this neverhappened during our experiment. The 95% confidence interval is also shown.
360 MEASUREMENT SYSTEMS ANALYSIS
Figure 10.23. Minitab assessment vs standard agreement across all appraisers.
DMAIC^ ^ ^CHAPTER
11
Knowledge DiscoveryKNOWLEDGE DISCOVERY TOOLS
Getting the correct answer begins with asking the right question. The toolsand techniques described in this section help the Six Sigma team learn whichquestions to ask. These simple tools are properly classified as data presentationtools. Many are graphically based, creating easy to understand pictures fromthe numbers and categories in the data. Others summarize the data, reducingincomprehensible data in massive tables to a few succinct numbers that conveyessential information.In addition to these traditional tools of the trade, the reader should deter-
mine if they have access to on-line analytic processing (OLAP) tools. OLAP isdiscussed briefly in Chapter 2. Contact your organization’s InformationSystems department for additional information regarding OLAP.In this section, we will address the subject of time series analysis on a rela-
tively simple level. First, we will look at statistical methods that can be usedwhen we believe the data are from a stable process. This involves analysis of pat-terns in runs of data in a time-ordered sequence.We discuss the problemof auto-correlation in time series data and provide a method of dealing with thisproblem in Chapter 12, EWMA charts.
Run chartsRun charts are plots of data arranged in time sequence. Analysis of run charts
is performed to determine if the patterns can be attributed to common causes
Copyright 2003 by The McGraw-Hill Companies, Inc. Click Here for Terms of Use.
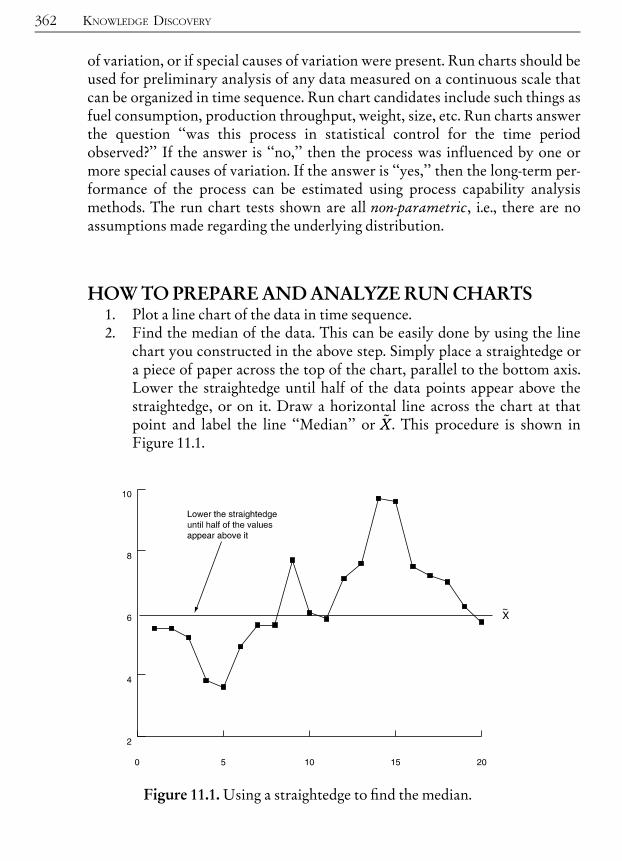
of variation, or if special causes of variation were present. Run charts should beused for preliminary analysis of any data measured on a continuous scale thatcan be organized in time sequence. Run chart candidates include such things asfuel consumption, production throughput, weight, size, etc. Run charts answerthe question ‘‘was this process in statistical control for the time periodobserved?’’ If the answer is ‘‘no,’’ then the process was influenced by one ormore special causes of variation. If the answer is ‘‘yes,’’ then the long-term per-formance of the process can be estimated using process capability analysismethods. The run chart tests shown are all non-parametric, i.e., there are noassumptions made regarding the underlying distribution.
HOW TO PREPARE AND ANALYZE RUN CHARTS1. Plot a line chart of the data in time sequence.2. Find the median of the data. This can be easily done by using the line
chart you constructed in the above step. Simply place a straightedge ora piece of paper across the top of the chart, parallel to the bottom axis.Lower the straightedge until half of the data points appear above thestraightedge, or on it. Draw a horizontal line across the chart at thatpoint and label the line ‘‘Median’’ or ~XX. This procedure is shown inFigure 11.1.
362 KNOWLEDGE DISCOVERY
Figure 11.1. Using a straightedge to ¢nd the median.

As youmight expect, run charts are evaluated by examining the ‘‘runs’’ on thechart. A ‘‘run’’ is a time-ordered sequence of points. There are several differentstatistical tests that can be applied to the runs.
RUN LENGTHA run to the median is a series of consecutive points on the same side of the
median. Unless the process is being influenced by special causes, it is unlikelythat a long series of consecutive points will all fall on the same side of themedian. Thus, checking run length is one way of checking for special causesof variation. The length of a run is found by simply counting the number ofconsecutive points on the same side of the median. However, it may be thatsome values are exactly equal to the median. If only one value is exactly onthe median line, ignore it. There will always be at least one value exactly onthe median if you have an odd number of data points. If more than onevalue is on the line, assign them to one side or the other in a way that resultsin 50% being on one side and 50% on the other. On the run chart, markthose that will be counted as above the median with an a and those that willbe counted below the median with a b. The run length concept is illustratedin Figure 11.2.
Knowledge discovery tools 363
Figure 11.2. Determination of run length.

After finding the longest run, compare the length of the longest run to thevalues in Table 11.1. If the longest run is longer than the maximum allowed,then the process was probably influenced by a special cause of variation(a ¼ 0:05). With the example, there are 20 values plotted and the longest runwas 8. Table 11.1 indicates that a run of 7 would not be too unusual for 20 plottedpoints but a run of 8 would be. Since our longest run is 8, we conclude that aspecial cause of variation is indicated and conduct an investigation to identifythe special cause.
NUMBER OF RUNSThe number of runs we expect to find from a controlled process can also be
mathematically determined. A process that is not being influenced by specialcauses will not have either too many runs or too few runs. The number of runsis found by simple counting. Referring to Figure 11.3, we see that there are 5runs.Table 11.2 is used to evaluate the number of runs. If you have fewer runs
than the smallest allowed or more runs than the largest allowed then there isa high probability (a ¼ 0:05) that a special cause is present. With the example,we have 20 values plotted and 5 runs. Table 11.2 indicates that for 20 plottedpoints, 6 to 15 runs are expected, so we conclude that a special cause waspresent.
364 KNOWLEDGE DISCOVERY
Table 11.1. Maximum run length.
NUMBEROF PLOTTED VALUES MAXIMUMRUN LENGTH
10 5
15 6
20 7
30 8
40 9
50 10

TRENDSThe run chart should not have any unusually long series of consecutive
increases or decreases. If it does, then a trend is indicated and it is probablydue to a special cause of variation (a¼0.05). Compare the longest count of con-secutive increases or decreases to the longest allowed shown in Table 11.3, andif your count exceeds the table value then it is likely that a special cause of varia-tion caused the process to drift.Figure 11.4 shows the analysis of trends. Note that the trend can extend on
both sides of the median, i.e., for this particular run test the median is ignored.When counting increases or decreases, ignore ‘‘no change’’ values. For
example, the trend length in the series 2, 3, 3, 5, 6 is four.
POINTERS FOR USING RUN CHARTSRun charts should not be used if too many of the numbers are the same. As a
rule of thumb, don’t use run charts if more than 30% of the values are the same.For example, in the data set 1, 2, 3, 3, 6, 7, 7, 11, 17, 19, the number 3 appearstwice and the number 7 appears twice. Thus, 4 of the 10, or 40% of the valuesare the same.Run charts are preliminary analysis tools, so if you have continuous data in
time-order always sketch a quick run chart before doing any more complex
Knowledge discovery tools 365
Figure 11.3. Determination of number of runs.
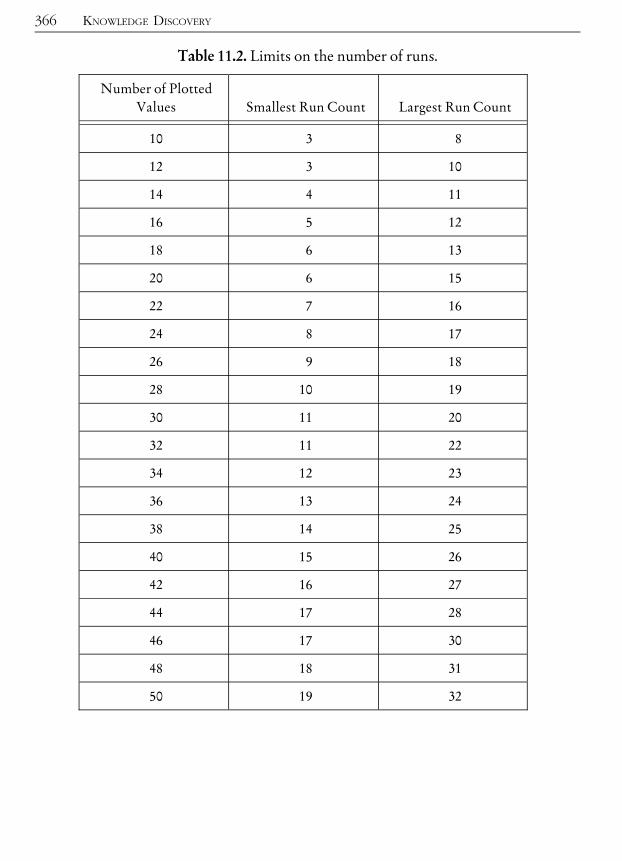
366 KNOWLEDGE DISCOVERY
Table 11.2. Limits on the number of runs.
Number of PlottedValues Smallest Run Count Largest Run Count
10 3 8
12 3 10
14 4 11
16 5 12
18 6 13
20 6 15
22 7 16
24 8 17
26 9 18
28 10 19
30 11 20
32 11 22
34 12 23
36 13 24
38 14 25
40 15 26
42 16 27
44 17 28
46 17 30
48 18 31
50 19 32

analysis. Often the patterns on a run chart will point you in the right directionwithout any further work.Run charts are one of the least sensitive SPC techniques. They are unable to
detect ‘‘freaks,’’ i.e., single points dramatically different from the rest. Thus,run charts may fail to find a special cause even if a special cause was present. In
Knowledge discovery tools 367
Figure 11.4. Determination of trend length.
Table 11.3. Maximum consecutive increases/decreases.
NUMBEROF PLOTTED VALUESMAXIMUMCONSECUTIVEINCREASES/DECREASES
5 to 8 4
9 to 20 5
21 to 100 6
101 or more 7

statistical parlance, run charts tend to have large Type II errors, i.e., they have ahigh probability of accepting the hypothesis of no special cause even when thespecial cause actually exists. Use run charts to aid in troubleshooting. The differ-ent run tests indicate different types of special causes. A long run on the sameside of the median indicates a special cause that created a process shift. A longseries of consecutively increasing or decreasing values indicates a special causethat created a trend. Too many runs often indicates a mixture of several sourcesof variation in the sample. Too few runs often occur in conjunction with a pro-cess shift or trend. If you have too few runs and they are not caused by a processshift or trend, then too few runs may indicate a mixture that follows a definitepattern (e.g., an operator who is periodically relieved).
Descriptive statisticsTypically, descriptive statistics are computed to describe properties of
empirical distributions, that is, distributions of data from samples. There arethree areas of interest: the distribution’s location or central tendency, its dis-persion, and its shape. The analyst may also want some idea of the magnitudeof possible error in the statistical estimates. Table 11.4 describes some of themore common descriptive statistical measures.
368 KNOWLEDGE DISCOVERY
Table 11.4. Common descriptive statistics.
SAMPLE STATISTIC DISCUSSION EQUATION/SYMBOL
Measures of location
Population mean The center of gravity orcentroid of the distribution.
� ¼ 1N
PNi¼1
xi
where x is an observation, N isthe population size.
Sample mean The center of gravity orcentroid of a sample from adistribution.
�XX ¼ 1n
Pni¼1
xi
where x is an observation, n isthe sample size.

Knowledge discovery tools 369
Median The 50%/50% split point.Precisely half of the data setwill be above the median,and half below it.
~XX
Mode The value that occurs mostoften. If the data aregrouped, the mode is thegroup with the highestfrequency.
None
Measures of dispersion
Range The distance between thesample extreme values.
R¼Largest�Smallest
Population variance A measure of the variationaround the mean; units arethe square of the units usedfor the original data.
�2 ¼ PNi¼1
ðxi � �Þ2N
Population standarddeviation
A measure of the variationaround the mean, in thesame units as the originaldata.
� ¼ffiffiffiffiffi�2
p
Sample variance A measure of the variationaround the mean; units arethe square of the units usedfor the original data.
s2 ¼ Pni¼1
ðxi � �XXÞ2n� 1
Sample standard deviation A measure of the variationaround the mean, in thesame units as the originaldata.
s ¼ffiffiffiffis2
p
Continued on next page . . .

Figures 11.5^11.8 illustrate distributions with different descriptive statistics.
370 KNOWLEDGE DISCOVERY
SAMPLE STATISTIC DISCUSSION EQUATION/SYMBOL
Measures of shape
SkewnessAmeasure of asymmetry.Zero indicates perfectsymmetry; the normaldistribution has a skewnessof zero. Positive skewnessindicates that the ‘‘tail’’ of thedistribution is more stretchedon the side above themean.Negative skewness indicatesthat the tail of thedistribution is more stretchedon the side below themean.
k ¼
Xni¼1
x3i
n �3 �XX
Xn
i¼1s2i
n þ 2 �XX3
s3
k ¼
Xn
i¼1x3i
n �3 �XX
Xn
i¼1x2i
n þ 2 �XX3
s3
Kurtosis Kurtosis is a measure of £atness of the distribution. Heaviertailed distributions have larger kurtosis measures. The normaldistribution has a kurtosis of 3.
2 ¼
Pni¼1
x4i
n � 4 �XX
Pni¼1
x3i
n þ 6 �XX2
Pni¼1
x2i
n � 3 �XX4
s4
Table 11.4. (cont.)
Figure 11.5. Illustration of mean, median, and mode.

HistogramsA histogram is a pictorial representation of a set of data. It is created by
grouping the measurements into ‘‘cells.’’ Histograms are used to determine theshape of a data set. Also, a histogram displays the numbers in a way that makesit easy to see the dispersion and central tendency and to compare the distrib-
Knowledge discovery tools 371
Figure 11.6. Illustration of sigma.
Figure 11.7. Illustration of skewness.
Figure 11.8. Illustration of kurtosis.
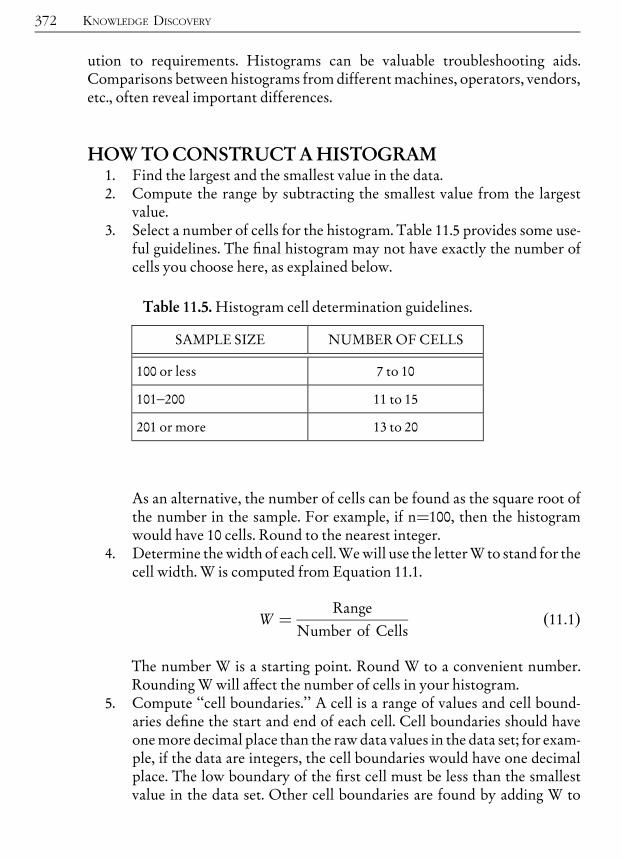
ution to requirements. Histograms can be valuable troubleshooting aids.Comparisons between histograms from different machines, operators, vendors,etc., often reveal important differences.
HOW TO CONSTRUCT A HISTOGRAM1. Find the largest and the smallest value in the data.2. Compute the range by subtracting the smallest value from the largest
value.3. Select a number of cells for the histogram. Table 11.5 provides some use-
ful guidelines. The ¢nal histogram may not have exactly the number ofcells you choose here, as explained below.
As an alternative, the number of cells can be found as the square root ofthe number in the sample. For example, if n¼100, then the histogramwould have 10 cells. Round to the nearest integer.
4. Determine thewidth of each cell.Wewill use the letterW to stand for thecell width. W is computed from Equation 11.1.
W ¼ Range
Number of Cellsð11:1Þ
The number W is a starting point. Round W to a convenient number.Rounding W will a¡ect the number of cells in your histogram.
5. Compute ‘‘cell boundaries.’’ A cell is a range of values and cell bound-aries de¢ne the start and end of each cell. Cell boundaries should haveonemore decimal place than the raw data values in the data set; for exam-ple, if the data are integers, the cell boundaries would have one decimalplace. The low boundary of the ¢rst cell must be less than the smallestvalue in the data set. Other cell boundaries are found by adding W to
372 KNOWLEDGE DISCOVERY
Table 11.5. Histogram cell determination guidelines.
SAMPLE SIZE NUMBEROF CELLS
100 or less 7 to 10
101^200 11 to 15
201 or more 13 to 20
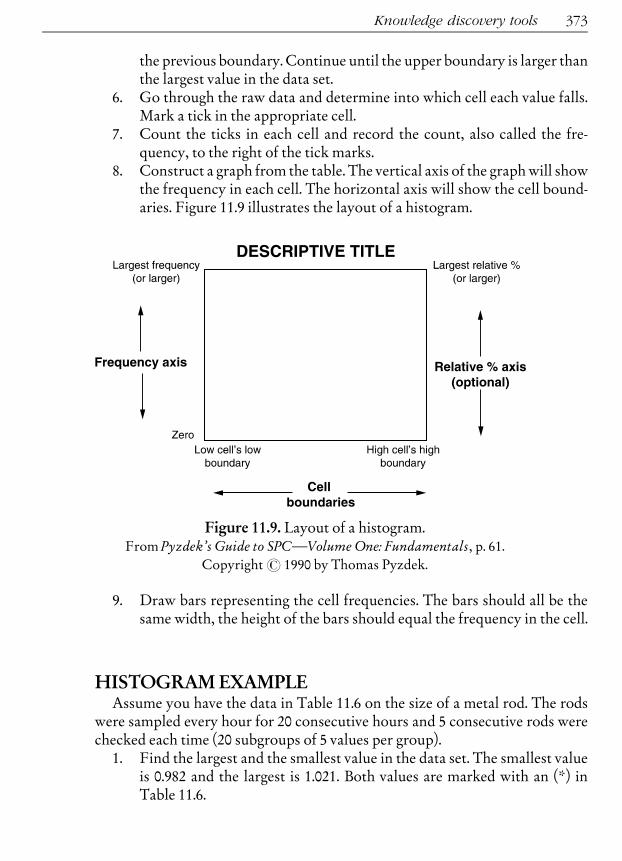
the previous boundary. Continue until the upper boundary is larger thanthe largest value in the data set.
6. Go through the raw data and determine into which cell each value falls.Mark a tick in the appropriate cell.
7. Count the ticks in each cell and record the count, also called the fre-quency, to the right of the tick marks.
8. Construct a graph from the table. The vertical axis of the graphwill showthe frequency in each cell. The horizontal axis will show the cell bound-aries. Figure 11.9 illustrates the layout of a histogram.
9. Draw bars representing the cell frequencies. The bars should all be thesame width, the height of the bars should equal the frequency in the cell.
HISTOGRAM EXAMPLEAssume you have the data in Table 11.6 on the size of a metal rod. The rods
were sampled every hour for 20 consecutive hours and 5 consecutive rods werechecked each time (20 subgroups of 5 values per group).1. Find the largest and the smallest value in the data set. The smallest value
is 0.982 and the largest is 1.021. Both values are marked with an (*) inTable 11.6.
Knowledge discovery tools 373
Figure 11.9. Layout of a histogram.From Pyzdek’s Guide to SPC�Volume One: Fundamentals, p. 61.
Copyright# 1990 by Thomas Pyzdek.

2. Compute the range, R, by subtracting the smallest value from the largestvalue. R¼1.021 ^ 0.982¼0.039.
3. Select a number of cells for the histogram. Since we have 100 values, 7 to10 cells are recommended. We will use 10 cells.
4. Determine the width of each cell, W. Using Equation 11.1, we computeW¼0.039/10¼0.0039. We will round this to 0.004 for convenience.Thus, W¼0.004.
374 KNOWLEDGE DISCOVERY
Table 11.6. Data for histogram.From Pyzdek’s Guide to SPC�Volume One: Fundamentals, p. 62.
Copyright# 1990 by Thomas Pyzdek.
ROW SAMPLE 1 SAMPLE 2 SAMPLE 3 SAMPLE 4 SAMPLE 5
1 1.002 0.995 1.000 1.002 1.005
2 1.000 0.997 1.007 0.992 0.995
3 0.997 1.013 1.001 0.985 1.002
4 0.990 1.008 1.005 0.994 1.012
5 0.992 1.012 1.005 0.985 1.006
6 1.000 1.002 1.006 1.007 0.993
7 0.984 0.994 0.998 1.006 1.002
8 0.987 0.994 1.002 0.997 1.008
9 0.992 0.988 1.015 0.987 1.006
10 0.994 0.990 0.991 1.002 0.988
11 1.007 1.008 0.990 1.001 0.999
12 0.995 0.989 0.982* 0.995 1.002
13 0.987 1.004 0.992 1.002 0.992
14 0.991 1.001 0.996 0.997 0.984
15 1.004 0.993 1.003 0.992 1.010
16 1.004 1.010 0.984 0.997 1.008
17 0.990 1.021* 0.995 0.987 0.989
18 1.003 0.992 0.992 0.990 1.014
19 1.000 0.985 1.019 1.002 0.986
20 0.996 0.984 1.005 1.016 1.012

5. Compute the cell boundaries. The low boundary of the ¢rst cell must bebelow our smallest value of 0.982, and our cell boundaries should haveone decimal placemore than our raw data. Thus, the lower cell boundaryfor the ¢rst cell will be 0.9815. Other cell boundaries are found by addingW¼0.004 to the previous cell boundary until the upper boundary isgreater than our largest value of 1.021. This gives us the cell boundariesin Table 11.7.
6. Go through the raw data and mark a tick in the appropriate cell for eachdata point.
7. Count the tickmarks in each cell and record the frequency to the right ofeach cell. The results of all we have done so far are shown in Table 11.8.Table 11.8 is often referred to as a ‘‘frequency table’’ or ‘‘frequency tallysheet.’’
Knowledge discovery tools 375
Table 11.7. Histogram cell boundaries.From Pyzdek’s Guide to SPC�Volume One: Fundamentals, p. 63.
Copyright# 1990 by Thomas Pyzdek.
CELL NUMBER LOWERCELL BOUNDARY UPPER CELL BOUNDARY
1 0.9815 0.9855
2 0.9855 0.9895
3 0.9895 0.9935
4 0.9935 0.9975
5 0.9975 1.0015
6 1.0015 1.0055
7 1.0055 1.0095
8 1.0095 1.0135
9 1.0135 1.0175
10 1.0175 1.0215
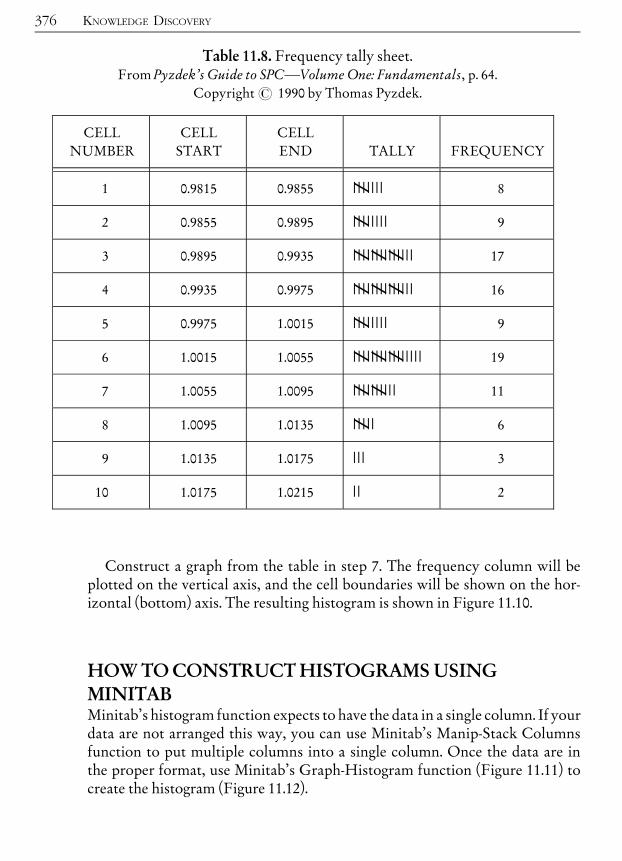
Construct a graph from the table in step 7. The frequency column will beplotted on the vertical axis, and the cell boundaries will be shown on the hor-izontal (bottom) axis. The resulting histogram is shown in Figure 11.10.
HOW TO CONSTRUCT HISTOGRAMS USINGMINITABMinitab’s histogram function expects to have the data in a single column. If yourdata are not arranged this way, you can use Minitab’s Manip-Stack Columnsfunction to put multiple columns into a single column. Once the data are inthe proper format, use Minitab’s Graph-Histogram function (Figure 11.11) tocreate the histogram (Figure 11.12).
376 KNOWLEDGE DISCOVERY
Table 11.8. Frequency tally sheet.From Pyzdek’s Guide to SPC�Volume One: Fundamentals, p. 64.
Copyright# 1990 by Thomas Pyzdek.
CELLNUMBER
CELLSTART
CELLEND TALLY FREQUENCY
1 0.9815 0.9855 IIIIIIII 8
2 0.9855 0.9895 IIIIIIIII 9
3 0.9895 0.9935 IIIIIIIIIIIIIIIII 17
4 0.9935 0.9975 IIIIIIIIIIIIIIIII 16
5 0.9975 1.0015 IIIIIIIII 9
6 1.0015 1.0055 IIIIIIIIIIIIIIIIIII 19
7 1.0055 1.0095 IIIIIIIIIIII 11
8 1.0095 1.0135 IIIIII 6
9 1.0135 1.0175 III 3
10 1.0175 1.0215 II 2

Knowledge discovery tools 377
Figure 11.10. Completed histogram.From Pyzdek’s Guide to SPC�Volume One: Fundamentals, p. 61.
Copyright# 1990 by Thomas Pyzdek.
Figure 11.11. Minitab’s histogram dialog box.
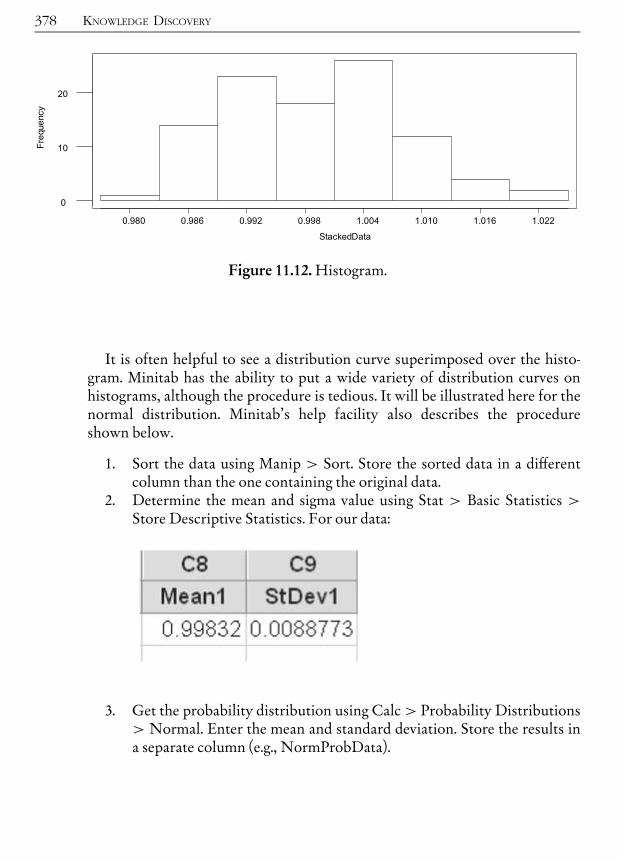
It is often helpful to see a distribution curve superimposed over the histo-gram. Minitab has the ability to put a wide variety of distribution curves onhistograms, although the procedure is tedious. It will be illustrated here for thenormal distribution. Minitab’s help facility also describes the procedureshown below.
1. Sort the data using Manip > Sort. Store the sorted data in a di¡erentcolumn than the one containing the original data.
2. Determine the mean and sigma value using Stat > Basic Statistics >Store Descriptive Statistics. For our data:
3. Get the probability distribution using Calc> Probability Distributions>Normal. Enter the mean and standard deviation. Store the results ina separate column (e.g., NormProbData).
378 KNOWLEDGE DISCOVERY
Figure 11.12. Histogram.

4. Adjust the NormProbData values in accordance with your histogramcell interval. In the previous example we letMinitab choose the cell inter-val for use. Here we will use a cell interval of 0.005. Choose Calc >Calculator and enter the information as shown below:
5. Create the histogram with the normal curve:Choose Graph>Histogram
For X, select StackedData
Knowledge discovery tools 379
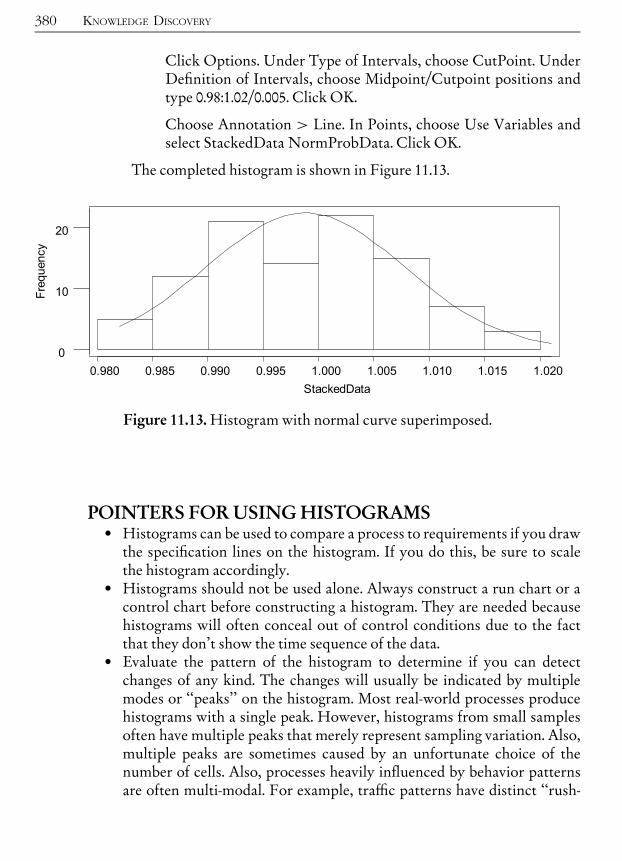
Click Options. Under Type of Intervals, choose CutPoint. UnderDe¢nition of Intervals, choose Midpoint/Cutpoint positions andtype 0.98:1.02/0.005. Click OK.
Choose Annotation > Line. In Points, choose Use Variables andselect StackedData NormProbData. Click OK.
The completed histogram is shown in Figure 11.13.
POINTERS FOR USING HISTOGRAMS. Histograms can be used to compare a process to requirements if you drawthe speci¢cation lines on the histogram. If you do this, be sure to scalethe histogram accordingly.
. Histograms should not be used alone. Always construct a run chart or acontrol chart before constructing a histogram. They are needed becausehistograms will often conceal out of control conditions due to the factthat they don’t show the time sequence of the data.
. Evaluate the pattern of the histogram to determine if you can detectchanges of any kind. The changes will usually be indicated by multiplemodes or ‘‘peaks’’ on the histogram. Most real-world processes producehistograms with a single peak. However, histograms from small samplesoften have multiple peaks that merely represent sampling variation. Also,multiple peaks are sometimes caused by an unfortunate choice of thenumber of cells. Also, processes heavily in£uenced by behavior patternsare often multi-modal. For example, tra⁄c patterns have distinct ‘‘rush-
380 KNOWLEDGE DISCOVERY
Figure 11.13. Histogram with normal curve superimposed.
hours,’’ and prime time is prime time precisely because more people tendto watch television at that time.
. Compare histograms from di¡erent periods of time. Changes in histo-gram patterns from one time period to the next can be very useful in ¢nd-ing ways to improve the process.
. Stratify the data by plotting separate histograms for di¡erent sources ofdata. For example, with the rod diameter histogram we might want toplot separate histograms for shafts made from di¡erent vendors’ materialsor made by di¡erent operators or machines. This can sometimes revealthings that even control charts don’t detect.
Exploratory data analysisData analysis can be divided into two broad phases: an exploratory phase and
a confirmatory phase. Data analysis can be thought of as detective work.Before the ‘‘trial’’ one must collect evidence and examine it thoroughly. Onemust have a basis for developing a theory of cause and effect. Is there a gap inthe data? Are there patterns that suggest some mechanism? Or, are there pat-terns that are simply mysterious (e.g., are all of the numbers even or odd)? Dooutliers occur? Are there patterns in the variation of the data? What are theshapes of the distributions? This activity is known as exploratory data analysis(EDA). Tukey’s 1977 book with this title elevated this task to acceptabilityamong ‘‘serious’’ devotees of statistics.Four themes appear repeatedly throughout EDA: resistance, residuals, re-
expression, and visual display. Resistance refers to the insensitivity of a methodto a small change in the data. If a small amount of the data is contaminated, themethod shouldn’t produce dramatically different results. Residuals are whatremain after removing the effect of a model or a summary. For example, onemight subtract the mean from each value, or look at deviations about a regres-sion line. Re-expression involves examination of different scales on which thedata are displayed. Tukey focused most of his attention on simple power trans-formations such as y ¼ ffiffiffi
xp
, y ¼ x2, y ¼ 1=x . Visual display helps the analystexamine the data graphically to grasp regularities and peculiarities in the data.EDA is based on a simple basic premise: it is important to understand what
you can do before you learn to measure how well you seem to have done it(Tukey, 1977). The objective is to investigate the appearance of the data, not toconfirm some prior hypothesis. While there are a large number of EDA meth-ods and techniques, there are two which are commonly encountered in SixSigma work: stem-and-leaf plots and boxplots. These techniques are commonlyincluded in most statistics packages. (SPSS was used to create the figures used
Knowledge discovery tools 381

in this book.) However, the graphics of EDA are simple enough to be doneeasily by hand.
STEM-AND-LEAF PLOTSStem-and-leaf plots are a variation of histograms and are especially useful for
smaller data sets (n<200). A major advantage of stem-and-leaf plots over thehistogram is that the raw data values are preserved, sometimes completely andsometimes only partially. There is a loss of information in the histogrambecause the histogram reduces the data by grouping several values into a singlecell.Figure 11.14 is a stem-and-leaf plot of diastolic blood pressures. As in a his-
togram, the length of each row corresponds to the number of cases that fallinto a particular interval. However, a stem-and-leaf plot represents each casewith a numeric value that corresponds to the actual observed value. This isdone by dividing observed values into two componentsLthe leading digit ordigits, called the stem, and the trailing digit, called the leaf. For example, thevalue 75 has a stem of 7 and a leaf of 5.
382 KNOWLEDGE DISCOVERY
Figure 11.14. Stem-and-leaf plot of diastolic blood pressures.From SPSS for W|ndows Base System User’s Guide, p. 183. Copyright# 1993. Used by
permission of the publisher, SPSS, Inc., Chicago, IL.

In this example, each stem is divided into two rows. The first row of each pairhas cases with leaves of 0 through 4, while the second row has cases with leavesof 5 through 9. Consider the two rows that correspond to the stem of 11. In thefirst row, we can see that there are four cases with diastolic blood pressure of110 and one case with a reading of 113. In the second row, there are two caseswith a value of 115 and one case each with a value of 117, 118, and 119.The last row of the stem-and-leaf plot is for cases with extreme values (values
far removed from the rest). In this row, the actual values are displayed inparentheses. In the frequency column, we see that there are four extreme cases.Their values are 125, 133, and 160. Only distinct values are listed.When there are few stems, it is sometimes useful to subdivide each stem even
further. Consider Figure 11.15 a stem-and-leaf plot of cholesterol levels. In thisfigure, stems 2 and 3 are divided into five parts, each representing two leafvalues. The first row, designated by an asterisk, is for leaves of 0 and 1; thenext, designated by t, is for leaves of 2’s and 3’s; the third, designated by f, is forleaves of 4’s and 5’s; the fourth, designated by s, is for leaves of 6’s and 7’s; andthe fifth, designated by a period, is for leaves of 8’s and 9’s. Rows without casesare not represented in the plot. For example, in Figure 11.15, the first two rowsfor stem 1 (corresponding to 0-1 and 2-3) are omitted.
Knowledge discovery tools 383
Figure 11.15. Stem-and-leaf plot of cholesterol levels.From SPSS for W|ndows Base System User’s Guide, p. 185. Copyright# 1993. Used by
permission of the publisher, SPSS, Inc., Chicago, IL.

This stem-and-leaf plot differs from the previous one in another way. Sincecholesterol values have a wide rangeLfrom 106 to 515 in this exampleLusingthe first two digits for the stem would result in an unnecessarily detailed plot.Therefore, we will use only the hundreds digit as the stem, rather than the firsttwo digits. The stem setting of 100 appears in the row labeled Stem width. Theleaf is then the tens digit. The last digit is ignored. Thus, from this particularstem-and-leaf plot, it is not possible to determine the exact cholesterol level fora case. Instead, each is classified by only its first two digits.
BOXPLOTSA display that further summarizes information about the distribution of the
values is the boxplot. Instead of plotting the actual values, a boxplot displayssummary statistics for the distribution. It is a plot of the 25th, 50th, and 75th per-centiles, as well as values far removed from the rest.Figure 11.16 shows an annotated sketch of a boxplot. The lower boundary of
the box is the 25th percentile. Tukey refers to the 25th and 75th percentile‘‘hinges.’’ Note that the 50th percentile is the median of the overall data set,the 25th percentile is the median of those values below the median, and the75th percentile is the median of those values above the median. The horizontalline inside the box represents the median. 50% of the cases are included withinthe box. The box length corresponds to the interquartile range, which is the dif-ference between the 25th and 75th percentiles.The boxplot includes two categories of cases with outlying values. Cases with
values that are more than 3 box-lengths from the upper or lower edge of thebox are called extreme values. On the boxplot, these are designated with anasterisk (*). Cases with values that are between 1.5 and 3 box-lengths from theupper or lower edge of the box are called outliers and are designatedwith a circle.The largest and smallest observed values that aren’t outliers are also shown.Lines are drawn from the ends of the box to these values. (These lines are some-times called whiskers and the plot is then called a box-and-whiskers plot.)Despite its simplicity, the boxplot contains an impressive amount of infor-
mation. From the median you can determine the central tendency, or location.From the length of the box, you can determine the spread, or variability, ofyour observations. If the median is not in the center of the box, you know thatthe observed values are skewed. If the median is closer to the bottom of the boxthan to the top, the data are positively skewed. If the median is closer to thetop of the box than to the bottom, the opposite is true: the distribution is nega-tively skewed. The length of the tail is shown by the whiskers and the outlyingand extreme points.
384 KNOWLEDGE DISCOVERY

Boxplots are particularly useful for comparing the distribution of values inseveral groups. Figure 11.17 shows boxplots for the salaries for several differentjob titles.The boxplot makes it easy to see the different properties of the distributions.
The location, variability, and shapes of the distributions are obvious at a glance.This ease of interpretation is something that statistics alone cannot provide.
ESTABLISHING THE PROCESS BASELINEThe process baseline is best described as ‘‘what were things like before the
project?’’ There are several reasons for obtaining this information:
Establishing the process baseline 385
Figure 11.16. Annotated boxplot.

& To determine if the project should be pursued. Although the project charterprovides a business case for the project, it sometimes happens that addi-tional, detailed information fails to support it. It may be that the situationisn’t as bad as people think, or the project may be addressing an unimpor-tant aspect of the problem.
& To orient the project team. The process baseline helps the team identifyCTQs and other hard metrics. The information on the historic perfor-mance of these metrics may point the team to strategies. For example, ifthe process is erratic and unstable the team would pursue a di¡erentstrategy than if it was operating at a consistently poor level.
& To provide data that will be used to estimate savings. Baseline informationwill be invaluable when the project is over and the team is trying to deter-mine the magnitude of the savings or improvement. Many a Black Belthas discovered after the fact that the information they need is no longeravailable after the completion of the project, making it impossible todetermine what bene¢t was obtained. For example, a project that stream-lined a production control system was aimed at improving morale byreducing unpaid overtime worked by exempt employees. However, nomeasure of employee morale was obtained ahead of time. Nor was theunpaid overtime documented anywhere. Consequently, the Black Beltwasn’t able to substantiate his claims of improvement and his certi¢cation(and pay increase) was postponed.
386 KNOWLEDGE DISCOVERY
Figure 11.17. Boxplots of salary by job category.
Describing the Process BaselineQUALITATIVE DESCRIPTIONSThe process baseline should be described in both qualitative and quantitative
terms. It’s not enough to report survey results or complaint counts, the voiceof the customer (VOC) should be made heard. If your customers are sayingthat your service stinks, then don’t mince words, tell it like the customer tellsit.* Likewise, include glowing praise. The new process might make the averageperformance better and improve consistency, but if it creates ho-hum satisfac-tion at the expense of eliminating delight, that fact should be known. It may bethat the new system takes the joy out of customer service work, which willhave adverse consequences on employee morale and might lead to unexpectedconsequences that need to be considered.InadditiontotheVOC,youmayalsowanttocapturethevoiceoftheemployee
(VOE). Do employees say they feel great about what they do? Or do they dreadcoming in each day? Is it a great place to work?Why or why not? Are employeeseager to transfer toother jobs just toget away fromthe stress?Whatdoemployeesthink would make things better? If you find a workplace that is a delight to theemployees, youmightwant to think twice about changing it. If theworkplace is achamber of horrors, youmaywant to speedup the pace of the project.A descriptive narrative by the team members should be considered. Every
team member should spend time in the work area. There is no substitute forfirsthand observation. It need not be a formal audit. Just go and look at theway things are done. Talk to people doing the work and actively listen to whatthey have to say. Watch what they do. Look for differences between the way dif-ferent people do similar tasks. Document your observations and share themwith the team and the sponsor.Collect information contained in memos, email, reports, studies, etc.
Organize the informationusing affinity analysis andothermethods of categoriz-ing. Arrange it in time-order and look for patterns. Were things once better thanthey are now? Are things getting worse?Whatmight account for these trends?
QUANTITATIVE DESCRIPTIONQuantifying the process baseline involves answering some simple questions:& What are the key metrics for this process? (Critical to quality, cost,schedule, customer satisfaction, etc.)* What are the operational de¢nitions of these metrics?
Establishing the process baseline 387
*Profanity and obscenity excepted, of course.
* Are these the metrics that will be used after completing the project tomeasure success?
& What data are available for these metrics?* If none, how will data be obtained?* What is the quality of the data?
Once the metrics are identified and the data located and validated, performanalyses to answer these questions:
& When historical data are looked at over a period of time, are there any pat-terns or trends? What might be causing this? (Run charts, time seriescharts, process behavior charts (control charts))
& Were things ever better than they are now? Why?& Should the data be transformed to make them easier to analyze?& What is the historical central tendency? (Mean, median and mode)& What is the historical variability? (Inter-quartile range, standarddeviation)& What is the historical shape or distribution? (Histograms, stem-and-leafplots, box plots, dot plots)
& Are there any interesting relationships between variables? Cross tabula-tions should be created to evaluate possible relationships with categoricaldata. Scatterplots and correlation studies can be used to study continuousdata.
The analyses can be performed by any team member, with the guidance of aBlack Belt. The results should be shared with the team. Brief summaries of espe-cially important findings should be reported to the process owner and sponsor.If the results indicate a need to change the project charter, the sponsor shouldbe informed.
SIPOCVirtually all Six Sigma projects address business processes that have an
impact on a top-level enterprise strategy. In previous chapters a great deal ofattention was devoted to developing a list of project candidates by meticulouslylinking projects and strategies using dashboards, QFD, structured decisionmaking, business process mapping, and many other tools and techniques.However, Six Sigma teams usually find that although this approach succeedsin identifying important projects, these projects tend to have too large a scopeto be completed within the time and budget constraints. More work is neededto clearly define that portion of the overall business process to be improved bythe project. One way to do this is to apply process flowcharting or mapping tosubprocesses until reaching the part of the process that has been assigned tothe team for improvement. A series of questions are asked, such as:
388 KNOWLEDGE DISCOVERY

1. For which stakeholder does this process primarily exist?2. What value does it create? What output is produced?3. Who is the owner of this process?4. Who provides inputs to this process?5. What are the inputs?6. What resources does this process use?7. What steps create the value?8. Are there subprocesses with natural start and end points?These questions, which are common to nearly all processes addressed by Six
Sigma projects, have been arranged into a standard format known as SIPOC.SIPOC stands for Suppliers-Inputs-Process-Outputs-Customers.
Process for creating a SIPOC diagramSIPOCs beginwith people who know something about the process. Thismay
involve people who are not full-time members of the Six Sigma team. Bring thepeople together in a room and conduct a ‘‘focused brainstorming’’ session. Tobegin, briefly describe the process and obtain consensus on the definition. Forexample:
& ‘‘Make it easy for the customer to reach technical support by phone’’& ‘‘Reduce the space needed to store tooling’’& ‘‘Reduce the downtime on the Niad CNCmachine’’& ‘‘Get roo¢ng crew to the work site on time’’& ‘‘Reduce extra trips taken by copier maintenance person’’
Post flipcharts labeled suppliers, inputs, process, outputs, customers. Oncethe process has been described, create the SIPOC diagram as follows:
1. Create a simple, high-level process map of the process. Display this con-spicuously while the remaining steps are taken to provide a reminder tothe team.
Perform the steps below using brainstorming rules. Write down all ideas with-out critiquing them.
2. Identify the outputs of this process. Record on the Outputs £ip chart.3. Identify the customers who will receive the outputs. Record on the
Customers £ip chart.4. Identify the inputs needed for the process to create the outputs. Record
on the Inputs £ip chart.5. Identify the suppliers of the inputs. Record on the Suppliers £ip chart.6. Clean up the lists by analyzing, rephrasing, combining, moving, etc.7. Create a SIPOC diagram.
SIPOC 389

8. Review the SIPOCwith the project sponsor and process owner. Modifyas necessary.
SIPOC exampleA software company wants to improve overall customer satisfaction (Big Y).
Research has indicated that a key component of overall satisfaction is satisfac-tion with technical support (Little Y). Additional drill down of customer com-ments indicates that one important driver of technical support satisfaction isthe customer’s perception that it is easy to contact technical support. There
390 KNOWLEDGE DISCOVERY
Figure 11.18. Process map for contacting technical support by telephone.
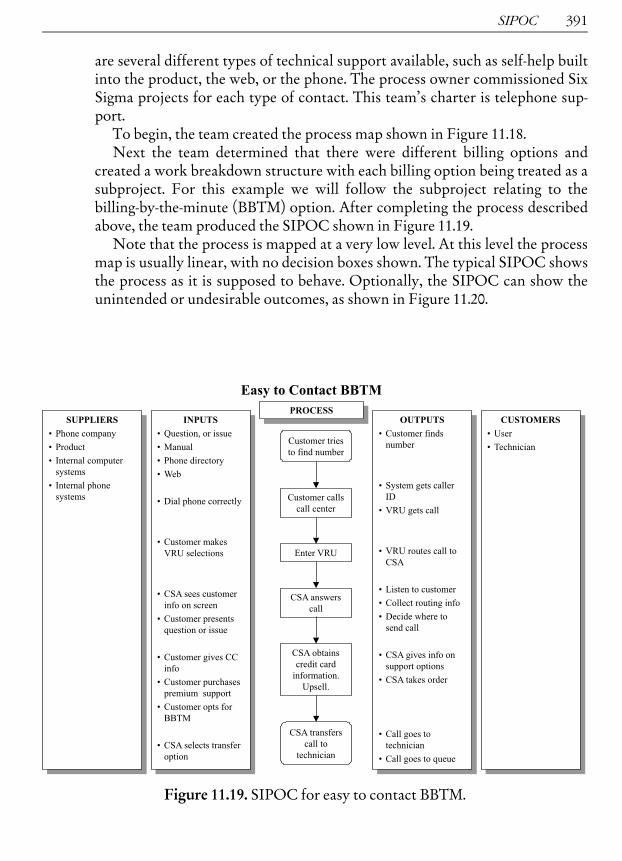
are several different types of technical support available, such as self-help builtinto the product, the web, or the phone. The process owner commissioned SixSigma projects for each type of contact. This team’s charter is telephone sup-port.To begin, the team created the process map shown in Figure 11.18.Next the team determined that there were different billing options and
created a work breakdown structure with each billing option being treated as asubproject. For this example we will follow the subproject relating to thebilling-by-the-minute (BBTM) option. After completing the process describedabove, the team produced the SIPOC shown in Figure 11.19.Note that the process is mapped at a very low level. At this level the process
map is usually linear, with no decision boxes shown. The typical SIPOC showsthe process as it is supposed to behave. Optionally, the SIPOC can show theunintended or undesirable outcomes, as shown in Figure 11.20.
SIPOC 391
Figure 11.19. SIPOC for easy to contact BBTM.

This ‘‘bad process’’ SIPOC is used only for team troubleshooting. It helps theteam formulate hypotheses to be tested during the analyze phase.SIPOC analyses focus on the Xs that drive the Ys. It helps the team under-
stand which ‘‘dials to turn’’ to make the top-level dashboard’s Big Y move. Inthe example, let’s assume that the team collects information and determinesthat a significant percentage of the customers can’t find the phone number fortechnical support. A root cause of the problem then, is the obscure location ofthe support center phone number. Improving overall customer satisfaction islinked to making it easier for the customer to locate the correct number, per-haps by placing a big, conspicuous sticker with the phone number on the coverof the manual. The Big Y and the root cause X are separated by several levels,but the process mapping and SIPOC analysis chain provides a methodologyfor making the connection.
392 KNOWLEDGE DISCOVERY
Figure 11.20. SIPOC for undesirable outcomes.