the sixth carbon budget - gshp
TRANSCRIPT
The Sixth Carbon BudgetThe UK’s path to Net Zero
December 2020
2
The Sixth Carbon Budget
The UK's path to Net Zero
Committee on Climate ChangeDecember 2020
Presented to the Secretary of State pursuant to
section 34 of the Climate Change Act 2008
© Committee on Climate Change Copyright 2020
The text of this document (this excludes, where present, the Royal Arms and all departmental or agency logos) may be reproduced free of charge in any format or medium provided that it is reproduced accurately and not in a misleading context. The material must be acknowledged as Committee on Climate Change copyright and the document title specified.
Permission from copyright holders must be sought before any photographs are reproduced. You can download this publication from www.theccc.org.uk/publications
All enquiries related to this publication should be sent to: [email protected]
3
Acknowledgements
The team that prepared this report and its analysis: This was led by Chris Stark, Mike
Thompson and David Joffe and included Tom Andrew, Owen Bellamy, Marili
Boufounou, Peter Budden, Cloe Cole, Eoin Devane, Ellie Davies, Aaron Goater,
Neil Grant, Rachel Hay, Mike Hemsley, Robbie Herring, Jenny Hill, Jaya Jassi, Ewa
Kmietowicz, Harry Lightfoot Brown, Jake Langmead-Jones, Bianca de Farias Letti,
Cheryl Mackenzie, Richard Millar, Chloe Nemo, Jacadi Nicholas, Simon Rayner,
Vivian Scott, Alexandra Scudo, Richard Taylor, Indra Thillainathan, Emma Vause,
and Louis Worthington.
Other members of the Secretariat who contributed to this report: Jo Barrett,
Kathryn Brown, Victoria de la Cruz, Tom Dooks, Brendan Freeman, Suzanna Hinson,
Gemma Holmes, Miriam Kennedy, Cara Labuschagne, James Lees, Charles
Odunuga, Penny Seera, David Style, and Sean Taylor.
Organisations and individuals that carried out research for the report: Aurora Energy Research, John Barrett (University of Leeds), Cambridge
Econometrics, Centre for Ecology & Hydrology, Element Energy, Energy Systems
Catapult, Energy UK, Alice Garvey and Peter Taylor (University of Leeds), Dr Clair
Gough (University of Manchester), the Met Office Hadley Centre, Louise Marix-
Evans, Kate Scott (University of Manchester), Scottish Rural College, techUK, Terri
Wills, University College London, Dr Nem Vaughan (University of East Anglia), and
Vivid Economics.
Our special advisor on COP26: Pete Betts.
Our three expert Advisory Groups and industry policy steering group: Policy Advisory Group: Professor Cameron Hepburn (Chair), Tera Allas (McKinsey),
Laura Cozzi (IEA), Michael Liebreich (Liebreich Associates), Professor Jim Skea (Just
Transition Commission), Professor Lorraine Whitmarsh (Cardiff University), Giles Wilkes
(Institute for Government) and Baroness Bryony Worthington (House of Lords).
Finance Advisory Group: Professor Nick Robins (Chair), Roberta Pierfederici (LSE),
Andy Howard (Schroders), Dr Ben Caldecott (Oxford University), Daniel Klier (HSBC),
Ingrid Holmes (Federated Hermes), Dr Rhian-Mari Thomas (Green Finance Institute),
Rishi Madlani (RBS) and Dr Steve Waygood (Aviva).
Health Advisory Group: Professor Sir Michael Marmot (Chair), Alice Munro (Public
Health Specialty Registrar), Dr Tammy Boyce (The King’s Fund), Professor Sir Andy
Haines and Professor Paul Wilkinson (London School of Hygiene and Tropical
Medicine), Dr Ian Hamilton (UCL Energy Institute), Professor Susan Jebb (Oxford
University), Dr Nick Watts (Lancet Countdown on Climate Change), Dr Adrian Davis
(UWE and Edinburgh Napier), Professor Helen ApSimon (Imperial College London)
and Sonia Roschnik (NHS Sustainable Development Unit).
Industry Policy Steering Group: Frank Aaskov (Make UK), Chris Bataille (IDDRI),
Debbie Baker (CF Fertilisers), Tanisha Beebee (CBI), Roz Bullied (Green Alliance),
Diana Casey and Richard Leese (Mineral Products Association), Paul Davies (CCUS
Advisory Group Chair), Steve Freeman and David Morgan (Confederation of
Paper Industries), Alasdair Graham (Energy Transitions Commission), Peter Levi and
Christophe McGlade (International Energy Agency), Mercedes Maroto-Valer
(IDRIC), Harry Thorne (Oil and Gas UK), Richard Twinn (UK Green Building Council),

4
Adam Whitmore (Bellona), Paul Williams (SMMT-OHEEG Chair), Tomas Wyns and
Gauri Khandekar (Institute for European Studies).
All group members appeared in their personal capacities.
Our design and digital agencies: Anoushka Rodda and Pali Palavathanan
(TEMPLO) and Mat Burhouse (Slingshot).
A wide range of stakeholders and organisations who participated in workshops, engaged with us, submitted evidence or met with the Committee bilaterally.
5
Foreword
I am pleased to present the Climate Change Committee’s recommendations for
the UK’s Sixth Carbon Budget which will run from 2033 to 2037. This report builds on
the advice we gave last year, which led to Net Zero becoming law throughout the
UK.
Whereas then we painted a detailed picture of the UK in 2050, now, we describe
the path to Net Zero. We explore the changes that the UK will see on that journey
and detail the steps that must be taken to ensure we stick to our essential
endeavour.
This is the most comprehensive advice we have ever produced. It is a blueprint for
a fully decarbonised UK. A rich depiction of the choices before us in reaching the
goal of net-zero greenhouse gases by 2050 at the latest.
Our recommended pathway requires a 78% reduction in UK territorial emissions
between 1990 and 2035. In effect, it brings forward the UK’s previous 80% target by
nearly 15 years. There is no clearer indication of the increased ambition implied by
the Net Zero target than this. Our pathway meets the Paris Agreement stipulation
of ‘highest possible ambition’. It is challenging but also hugely advantageous,
creating new industrial opportunities and ensuring wider gains for the nation’s
health and for nature.
Some of our most important work is on the costs of the transition. Low carbon
investment must scale up to £50 billion each year to deliver Net Zero, supporting
the UK’s economic recovery over the next decade. This investment generates
substantial fuel savings, as cleaner, more-efficient technologies replace their fossil-
fuelled predecessors. In time, these savings cancel out the investment costs entirely
– a vital new insight that means our central estimate for costs is now below 1% of
GDP throughout the next 30 years.
The pace of our recommended emissions path tells an important story about what
must follow and what has gone before. We don’t reach Net Zero simply by wishing
it. There must be a process and a sequence by which we reach the goal. Progress
is more gradual in the early years as we make up for lost ground. Scaling up new
policy development, ramping up new supply chains for low-carbon goods,
addressing sectors that have progressed too slowly: transport, industry, buildings,
agriculture. A critical moment arrives in the early 2030s, as sales of most high-
carbon goods are phased out altogether. UK emissions fall sharply over the 2030s,
before levelling off in the 2040s, as we clear the final hurdles to Net Zero.
The implication of this path is clear: the utmost focus is required from government
over the next ten years. If policy is not scaled up across every sector; if business is
not encouraged to invest; if the people of the UK are not engaged in this
challenge - the UK will not deliver Net Zero by 2050. The 2020s must be the decisive
decade of progress and action.
Yet, that progress will be impossible if it is not just. Fairness in the transition to Net
Zero is an essential constituent for its success. In aggregate, the costs are low - but
that must not hide the need to distribute the costs and the benefits fairly. Our
recommended path heralds a major transition in the economy and jobs. There will
be new low-carbon employment opportunities, but there will also be high-carbon
sectors that shrink.
6
These impacts can be highly concentrated in some regions of the UK. We must
prepare now for those changes. It is the government’s role to ensure we have the
training and the skills that those changes require. National, regional, and local
investment in low carbon industries is now an economic and social priority.
Combatting climate change provides us with the means of levelling up as an
essential part of our economic revival.
In this endeavour, we will not be alone. The club of nations that has committed to
Net Zero has grown significantly since our report last year. These new pledges,
including those of China and the EU, South Korea and Japan, as well as the
expected pledge from the US, offer mutual advancement. These are our markets
of the future and, as low-carbon technologies and strategies develop around the
world, we can be more assured of the global response to climate change and the
widespread transitions that are underway in energy, transport, and industry. These
will also mean that the reduction in our territorial emissions will be mirrored in the
reduction of the carbon footprint of our imported goods and services.
The signs point to a propitious moment for global climate ambition in Glasgow next
year. But our international leadership, in the Presidency of COP26 and of the G7,
must begin at home. Our influence in the wider world rests ultimately on strong
domestic ambition.
For this we look to the framework provided by the UK’s Climate Change Act, which
has governed the work of the Committee in producing this report. The basis of the
British approach to tackling climate change is contained in the mix of
responsibilities that the Act lays out so clearly. An independent body, the Climate
Change Committee, advises on targets and delivery and measures progress. The
long-term emissions goal is determined by the UK’s international obligations,
themselves reflecting the scientific imperatives. Interim targets, expressed in the
carbon budgets, are set in line with that long-term goal, stimulating short-term
action. But the responsibility of meeting these carbon budgets – of actually
delivering on the advice and the commitments – rests with Government. This
Report gives the Government and Parliament the route map to meeting those
statutory obligations.
This is the governance system that has served the UK well since 2008 and this Sixth
Carbon Budget is its most complete expression. It is the product of an immense
effort from my Committee and the talented team that supports it. I commend the
advice strongly to Ministers and I urge the Government to legislate for the Sixth
Carbon Budget as soon as possible. That would constitute the strongest statement
of our ambition to tackle climate change. It is a decisive moment for global Britain.
Lord Deben
Chair of the Climate Change Committee
7 Sixth Carbon Budget – The path to Net Zero
The Committee
The Rt. Hon John Gummer, Lord Deben, Chairman
Lord Deben was the UK’s longest-serving Secretary of State
for the Environment (1993 to 1997). He has held several
other high-level ministerial posts, including Secretary of State for Agriculture, Fisheries and Food (1989 to 1993).
Lord Deben also runs Sancroft, a corporate responsibility
consultancy working with blue-chip companies around
the world on environmental, social and ethical issues.
Baroness Brown of Cambridge DBE FRS Deputy Chair
Baroness Brown of Cambridge DBE FREng FRS (Julia King) is an engineer, with a career spanning senior
engineering and leadership roles in industry and
academia. She currently serves as Chair of the CCC’s
Adaptation Committee; non-executive director of the Offshore Renewable Energy Catapult; and Chair of the
Carbon Trust.
Professor Keith Bell Keith Bell is a co-Director of the UK Energy Research
Centre (UKERC), a Chartered Engineer and a Fellow of the
Royal Society of Edinburgh. He has been at the University
of Strathclyde since 2005, was appointed to the Scottish Power Chair in Smart Grids in 2013 and has been involved
in energy system research in collaboration with many
academic and industrial partners.
Professor Nick Chater Nick Chater is Professor of Behavioural Science at
Warwick Business School. He has particular interests in
the cognitive and social foundations of rationality, and
applying behavioural insights to public policy and business. Nick is Co-founder and Director of Decision
Technology Ltd, a research consultancy.
The Committee 8
Professor Piers Forster
Piers Forster is Director of the Priestley International Centre
for Climate and Professor of Physical Climate Change at
the University of Leeds. He has played a significant role
authoring Intergovernmental Panel on Climate Change (IPCC) reports, and has a coordinating lead author role for
the IPCC’s sixth assessment report.
Dr Rebecca Heaton FICFor
Rebecca Heaton is responsible for Drax Group’s efforts
to mitigate climate change, ensuring that sound science
underpins climate change polices and business strategy. She is also responsible for developing sustainability and
climate change research programmes. Rebecca has a
20-year global career working at the interface between
business, science and policy.
Paul Johnson CBE
Paul Johnson is Director of the Institute for Fiscal Studies
and a visiting professor at University College London (UCL).
He is widely published on the economics of public policy, and he co-wrote the ‘Mirrlees review’ of tax system design.
He was previously Chief Economist at the Department for
Education (2000 to 2004).
Professor Corinne Le Quéré CBE FRS
Corinne Le Quéré is Royal Society Research Professor of
Climate Change Science at the University of East Anglia
(UEA), where she conducts research on the interactions
between climate change and the carbon cycle.
Corinne is currently the Chair of the French Haut Conseil
pour le Climat.
9 Sixth Carbon Budget – The path to Net Zero
Acknowledgements 3
Foreword 3
The Committee 7
Executive summary 11
Chapter 1 – Introduction and key messages 351. The Net Zero challenge 38
2. Context – uncertain and urgent times 40
3. COP26 and international leadership 42
4. Using scenarios to identify a balanced path to Net Zero 43
Part 1: The path to Net Zero
Chapter 2 – The UK path to Net Zero 571. The Balanced Pathway to Net Zero for the UK 60
2. Alternative pathways to Net Zero by 2050 77
3. Can the UK achieve Net Zero significantly before 2050? 87
Chapter 3 – Sector pathways to Net Zero 931. Surface transport 96
2. Buildings 109
3. Manufacturing and construction 125
4. Electricity generation 134
5. Fuel supply 148
6. Agriculture and land use, land-use change and forestry 163
7. Aviation 176
8. Shipping 182
9. Waste 187
10. F-gases 194
11. Greenhouse gas removals 197
2041. Opportunities to reduce emissions 208
2. Pathways for Scottish, Welsh and Northern Irish emissions 216
3. Implications for targets 228
4. Costs and benefits in Scotland, Wales and Northern Ireland 231
5. Recommendations for policy 233
Chapter 4 – Scotland, Wales and Northern Ireland’s contribution to Net Zero
10
Chapter 5 - Investment, costs and benefits of the Sixth Carbon Budget 2371. Background to assessing economic implications 241
2. Capital investment and operational savings 243
3. Annualised resource costs during the transition 254
4. Macroeconomic impacts 266
5. Co-impacts along the path to Net Zero 271
Chapter 6 – A just transition to the Sixth Carbon Budget and Net Zero 2781. Jobs and the Just Transition 282
2. Competitiveness 291
3. Fuel poverty, energy bills and other household costs 295
4. Fiscal circumstances 304
Part 3: International and scientific circumstances
Chapter 7 – The Sixth Carbon Budget as a contribution to the Paris Agreement 3131. Reflecting the Paris Agreement in our scenarios 317
2. Is the Balanced Pathway a fair and ambitious contribution? 322
3. Supporting global efforts to reduce emissions 333
4. Reducing the UK’s carbon footprint 344
Chapter 8 – Scientific context for setting the UK’s Sixth Carbon Budget 3511. The fundamentals of the physical science basis remain strong 355
2. Updated understanding of the climate system 359
3. Global CO2 budgets as a guide for mitigation pathways 367
4. Minimising the UK’s future contribution to climate change 372
5. The need to adapt to a changing climate 377
Part 4: Recommendations
Chapter 9 – The shape of the emissions path to Net Zero 3841. Delivering on the Paris Agreement 389
2. Supporting the recovery and maintaining momentum 391
3. Making progress in every sector in the 2020s 394
4. Why the recommendation does not require faster progress 408
Chapter 10 – Recommendations on the Sixth Carbon Budget 4121. The Sixth Carbon Budget level and emissions accounting 416
2. Nationally Determined Contribution for 2030 428
3. Increasing effort during existing carbon budgets 430
4. Traded-sector emissions and UK emission trading system cap 436
5. Next steps: A Net Zero plan and monitoring of progress 440
Part 2: Impacts of the Sixth Carbon Budget

11 Sixth Carbon Budget – The path to Net Zero

13 Sixth Carbon Budget – The path to Net Zero
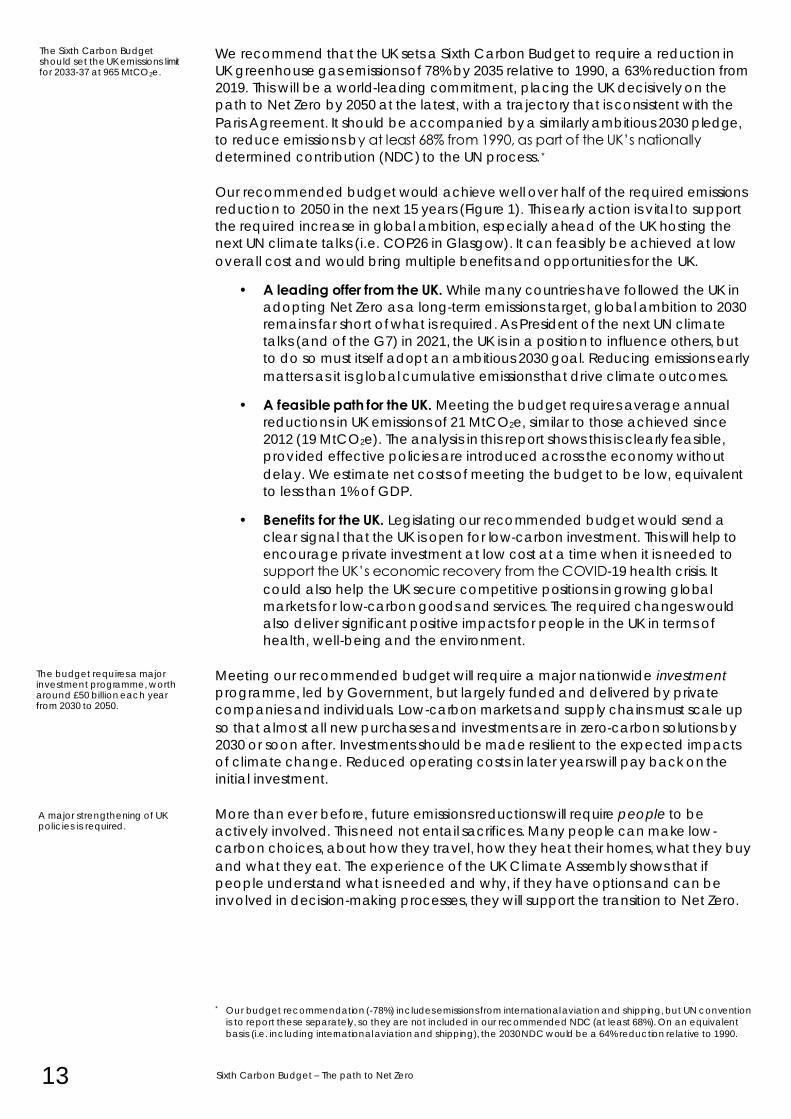
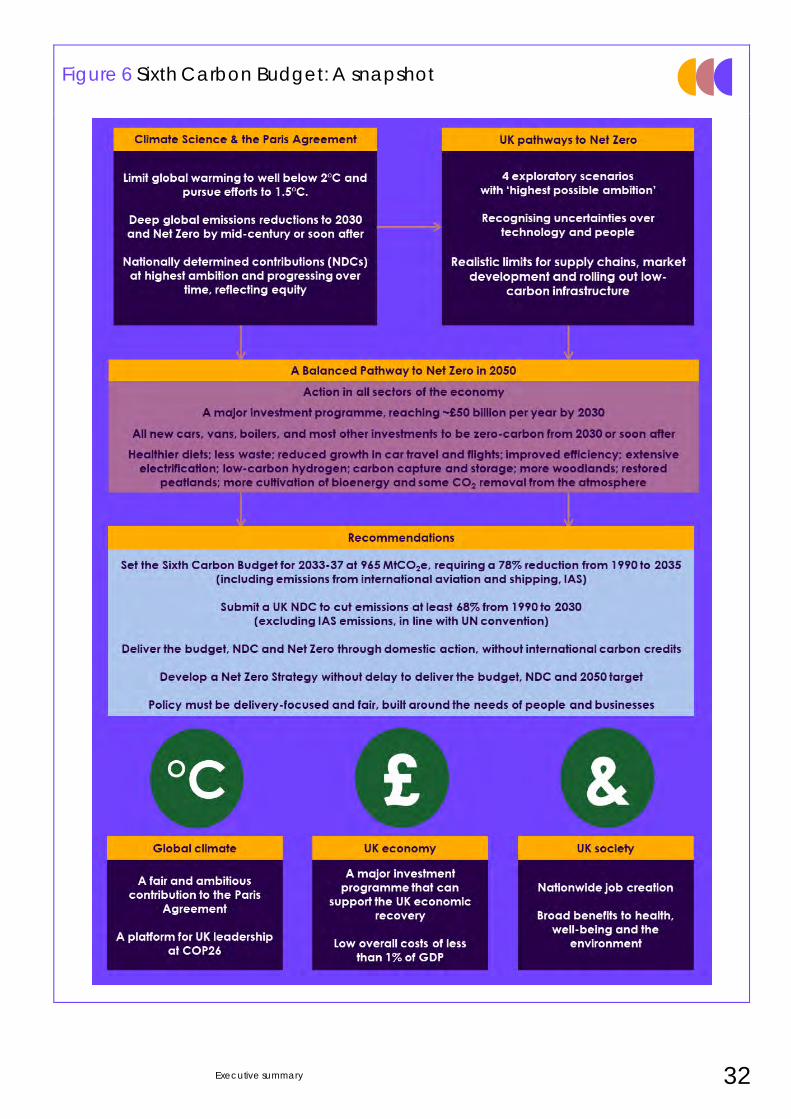
We recommend that the UK sets a Sixth Carbon Budget to require a reduction in
UK greenhouse gas emissions of 78% by 2035 relative to 1990, a 63% reduction from
2019. This will be a world-leading commitment, placing the UK decisively on the
path to Net Zero by 2050 at the latest, with a trajectory that is consistent with the
Paris Agreement. It should be accompanied by a similarly ambitious 2030 pledge,
to reduce emissions by at least 68% from 1990, as part of the UK’s nationally
determined contribution (NDC) to the UN process.*
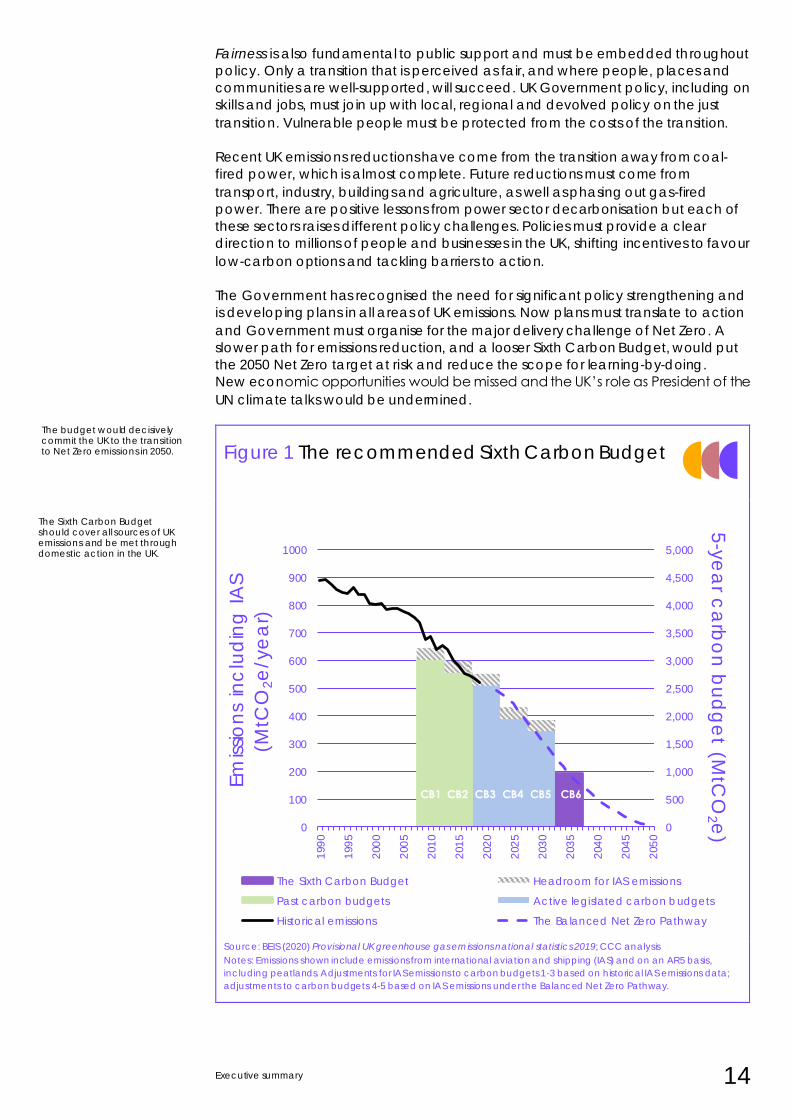
Our recommended budget would achieve well over half of the required emissions
reduction to 2050 in the next 15 years (Figure 1). This early action is vital to support
the required increase in global ambition, especially ahead of the UK hosting the
next UN climate talks (i.e. COP26 in Glasgow). It can feasibly be achieved at low
overall cost and would bring multiple benefits and opportunities for the UK.
• A leading offer from the UK. While many countries have followed the UK in
adopting Net Zero as a long-term emissions target, global ambition to 2030
remains far short of what is required. As President of the next UN climate
talks (and of the G7) in 2021, the UK is in a position to influence others, but
to do so must itself adopt an ambitious 2030 goal. Reducing emissions early
matters as it is global cumulative emissions that drive climate outcomes.
• A feasible path for the UK. Meeting the budget requires average annual
reductions in UK emissions of 21 MtCO2e, similar to those achieved since
2012 (19 MtCO2e). The analysis in this report shows this is clearly feasible,
provided effective policies are introduced across the economy without
delay. We estimate net costs of meeting the budget to be low, equivalent
to less than 1% of GDP.
• Benefits for the UK. Legislating our recommended budget would send a
clear signal that the UK is open for low-carbon investment. This will help to
encourage private investment at low cost at a time when it is needed to
support the UK’s economic recovery from the COVID-19 health crisis. It
could also help the UK secure competitive positions in growing global
markets for low-carbon goods and services. The required changes would
also deliver significant positive impacts for people in the UK in terms of
health, well-being and the environment.
Meeting our recommended budget will require a major nationwide investment
programme, led by Government, but largely funded and delivered by private
companies and individuals. Low-carbon markets and supply chains must scale up
so that almost all new purchases and investments are in zero-carbon solutions by
2030 or soon after. Investments should be made resilient to the expected impacts
of climate change. Reduced operating costs in later years will pay back on the
initial investment.
More than ever before, future emissions reductions will require people to be
actively involved. This need not entail sacrifices. Many people can make low-
carbon choices, about how they travel, how they heat their homes, what they buy
and what they eat. The experience of the UK Climate Assembly shows that if
people understand what is needed and why, if they have options and can be
involved in decision-making processes, they will support the transition to Net Zero.
* Our budget recommendation (-78%) includes emissions from international aviation and shipping, but UN convention
is to report these separately, so they are not included in our recommended NDC (at least 68%). On an equivalent
basis (i.e. including international aviation and shipping), the 2030 NDC would be a 64% reduction relative to 1990.
The budget requires a major investment programme, worth around £50 billion each year from 2030 to 2050.
A major strengthening of UK policies is required.
The Sixth Carbon Budget should set the UK emissions limit for 2033-37 at 965 MtCO2e.
Executive summary 14
Fairness is also fundamental to public support and must be embedded throughout
policy. Only a transition that is perceived as fair, and where people, places and
communities are well-supported, will succeed. UK Government policy, including on
skills and jobs, must join up with local, regional and devolved policy on the just
transition. Vulnerable people must be protected from the costs of the transition.
Recent UK emissions reductions have come from the transition away from coal-
fired power, which is almost complete. Future reductions must come from
transport, industry, buildings and agriculture, as well as phasing out gas-fired
power. There are positive lessons from power sector decarbonisation but each of
these sectors raises different policy challenges. Policies must provide a clear
direction to millions of people and businesses in the UK, shifting incentives to favour
low-carbon options and tackling barriers to action.
The Government has recognised the need for significant policy strengthening and
is developing plans in all areas of UK emissions. Now plans must translate to action
and Government must organise for the major delivery challenge of Net Zero. A
slower path for emissions reduction, and a looser Sixth Carbon Budget, would put
the 2050 Net Zero target at risk and reduce the scope for learning-by-doing.
New economic opportunities would be missed and the UK’s role as President of the
UN climate talks would be undermined.
Figure 1 The recommended Sixth Carbon Budget
Source: BEIS (2020) Provisional UK greenhouse gas emissions national statistics 2019; CCC analysis
Notes: Emissions shown include emissions from international aviation and shipping (IAS) and on an AR5 basis,
including peatlands. Adjustments for IAS emissions to carbon budgets 1-3 based on historical IAS emissions data;
adjustments to carbon budgets 4-5 based on IAS emissions under the Balanced Net Zero Pathway.
The budget would decisively commit the UK to the transition to Net Zero emissions in 2050.
The Sixth Carbon Budget should cover all sources of UK emissions and be met through domestic action in the UK.
0
500
1,000
1,500
2,000
2,500
3,000
3,500
4,000
4,500
5,000
0
100
200
300
400
500
600
700
800
900
1000
199
0
199
5
200
0
200
5
201
0
201
5
202
0
202
5
203
0
203
5
204
0
204
5
205
0
5-y
ea
r ca
rbo
n b
ud
ge
t (MtC
O2 e
)
Em
issio
ns
inc
lud
ing
IA
S
(MtC
O2e
/ye
ar)
The Sixth Carbon Budget Headroom for IAS emissions
Past carbon budgets Active legislated carbon budgets
Historical emissions The Balanced Net Zero Pathway
CB1 CB2 CB3 CB4 CB5 CB6 CB6
15 Sixth Carbon Budget – The path to Net Zero
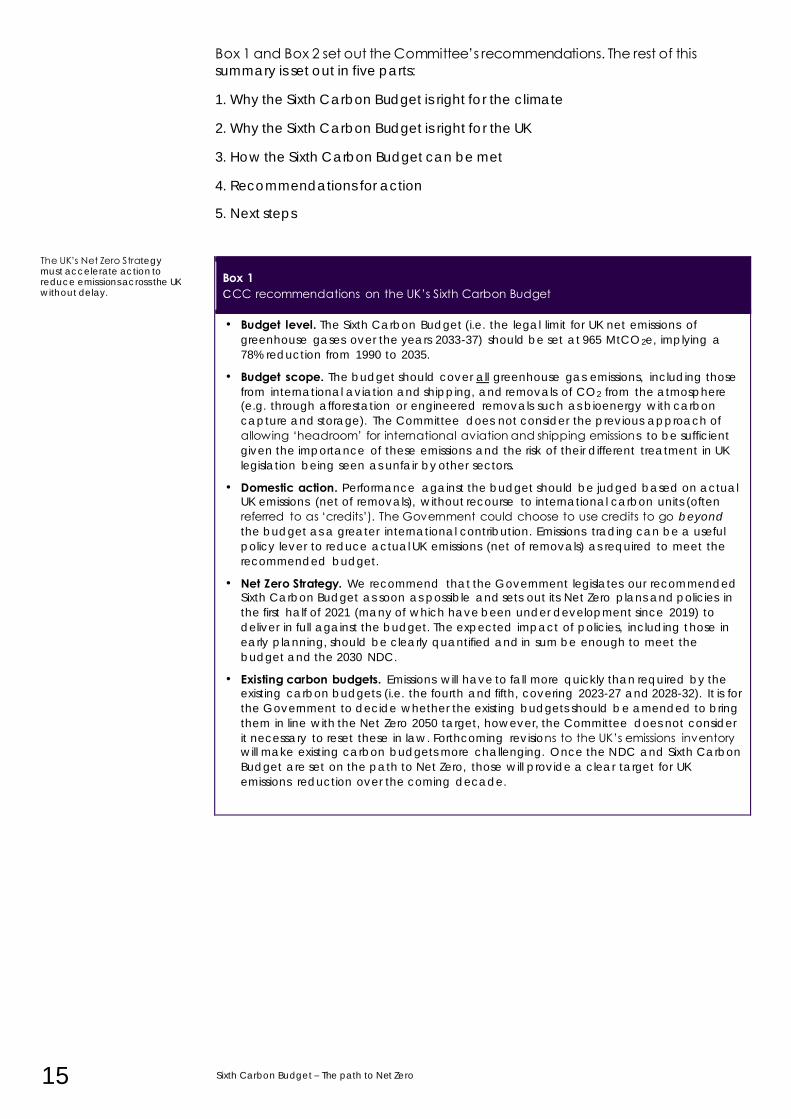
Box 1 and Box 2 set out the Committee’s recommendations. The rest of this
summary is set out in five parts:
1. Why the Sixth Carbon Budget is right for the climate
2. Why the Sixth Carbon Budget is right for the UK
3. How the Sixth Carbon Budget can be met
4. Recommendations for action
5. Next steps
Box 1 CCC recommendations on the UK’s Sixth Carbon Budget
• Budget level. The Sixth Carbon Budget (i.e. the legal limit for UK net emissions of
greenhouse gases over the years 2033-37) should be set at 965 MtCO2e, implying a
78% reduction from 1990 to 2035.
• Budget scope. The budget should cover all greenhouse gas emissions, including those
from international aviation and shipping, and removals of CO2 from the atmosphere (e.g. through afforestation or engineered removals such as bioenergy with carbon
capture and storage). The Committee does not consider the previous approach of
allowing ‘headroom’ for international aviation and shipping emissions to be sufficient
given the importance of these emissions and the risk of their different treatment in UK
legislation being seen as unfair by other sectors.
• Domestic action. Performance against the budget should be judged based on actual UK emissions (net of removals), without recourse to international carbon units (often
referred to as ‘credits’). The Government could choose to use credits to go beyond
the budget as a greater international contribution. Emissions trading can be a useful
policy lever to reduce actual UK emissions (net of removals) as required to meet the
recommended budget.
• Net Zero Strategy. We recommend that the Government legislates our recommended Sixth Carbon Budget as soon as possible and sets out its Net Zero plans and policies in
the first half of 2021 (many of which have been under development since 2019) to
deliver in full against the budget. The expected impact of policies, including those in
early planning, should be clearly quantified and in sum be enough to meet the
budget and the 2030 NDC.
• Existing carbon budgets. Emissions will have to fall more quickly than required by the existing carbon budgets (i.e. the fourth and fifth, covering 2023-27 and 2028-32). It is for
the Government to decide whether the existing budgets should be amended to bring
them in line with the Net Zero 2050 target, however, the Committee does not consider
it necessary to reset these in law. Forthcoming revisions to the UK’s emissions inventory will make existing carbon budgets more challenging. Once the NDC and Sixth Carbon
Budget are set on the path to Net Zero, those will provide a clear target for UK
emissions reduction over the coming decade.
The UK’s Net Zero Strategy must accelerate action to reduce emissions across the UK without delay.
Executive summary 16
Box 2 CCC recommendations on the UK’s Nationally Determined Contribution for 2030
The UK will host the next UN climate talks – the 26th Conference of the Parties (COP26) – in
Glasgow in November 2021. The period leading up to these talks is vital for increasing
global ambition. To support that process the UK must adopt a world leading NDC that
reflects best practice under the Paris Agreement.
• Ambition on reducing emissions. The UK should submit an NDC based on the path to
the Sixth Carbon Budget, requiring at least a 68% reduction in territorial emissions from 1990 to 2030 (excluding emissions from international aviation and shipping, IAS, in line
with UN convention), to be delivered through domestic action, with additional actions
to reduce the UK’s contribution to IAS emissions.
– This is a clear progression from the UK’s existing commitments: its expected
effort share of the EU’s NDC (-53%), the existing Fifth Carbon Budget (-57%),
and the expected reduction in actual emissions under the Fifth Carbon
Budget (-61%).*
– It would be world leading compared to existing NDCs, and amongst the
front-runners for proposals for increased ambition. For example, if the EU
adopts its proposed 55% reduction for 2030, our proposed NDC would be
towards the top of the range that we estimate for the UK’s possible effort share had it still been a Member State.
– It would align with the published pathways from the Intergovernmental Panel on Climate Change (IPCC) for a 1.5°C goal. UK emissions would fall
by 54% from 2010 to 2030, compared to the 45% that the IPCC identifies for the world as a whole.
– It is equivalent to a 64% reduction including IAS emissions, the basis of our recommended Sixth Carbon Budget.
• International aviation and shipping. While these emissions are treated separately by
the UN, they must be addressed if the temperature goal of the Paris Agreement is to
be met. The UK’s NDC should include clear commitments to act on emissions from
international aviation and shipping, including both long-term and interim targets.
• Adaptation. Even if the Paris goals are delivered in full and global temperature rise is
limited to 1.5°C, there will be further impacts from climate change beyond those already occurring today. If the Paris goals are missed, the global and UK impacts will
become much more severe. The UK needs to increase its ambition on climate change
adaptation, as it is not prepared even for the 1.5-2°C world. The UK’s NDC should
signal how national adaptation plans will be strengthened, as well as highlighting how
the UK is supporting climate adaptation overseas.
• International collaboration. The UK has been a strong contributor to international climate finance, recently doubling its commitment to £11.6 billion in aggregate over
2021/22-2025/26. The UK’s NDC should highlight this commitment, along with other UK
contributions to technology development and capacity building.
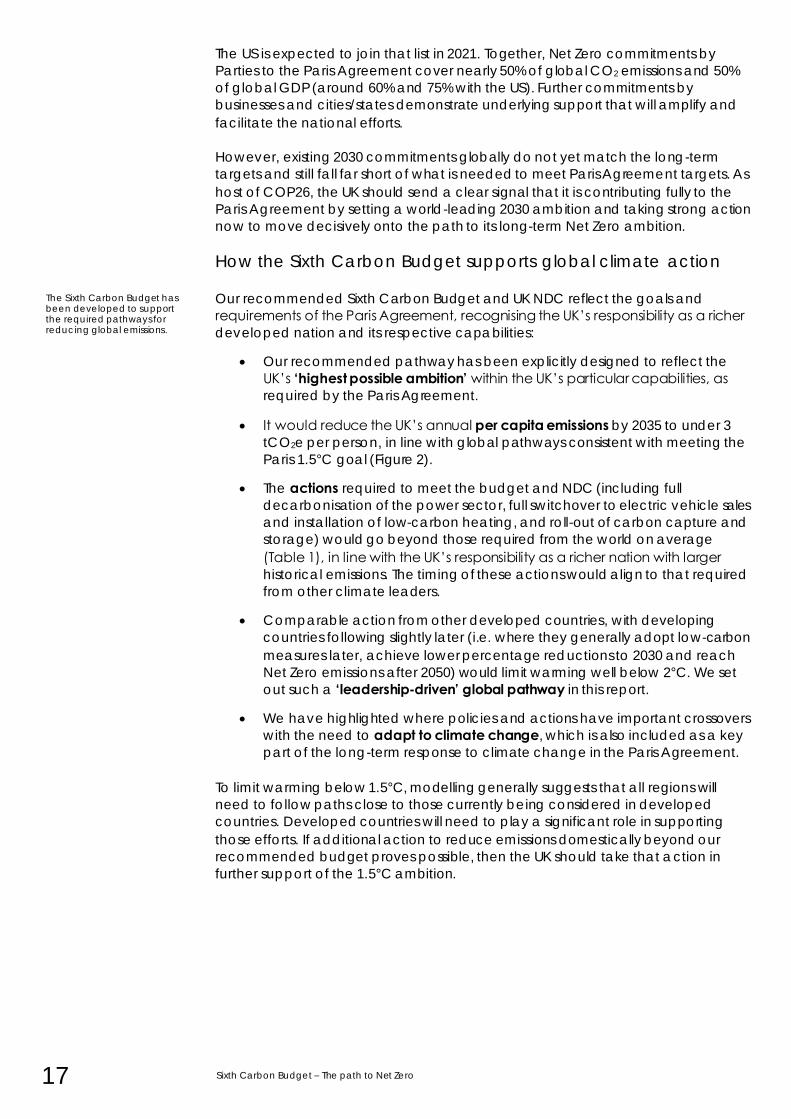
1. Why the Sixth Carbon Budget is right for the climate
Current NDCs submitted under the Paris Agreement are predicted to lead to
global average temperatures rising around 3°C by 2100 compared to pre-industrial
levels, with risks of even more severe climate outcomes. The 2015 Paris Agreement
aims to limit warming to well below 2°C and to pursue efforts to limit it to 1.5°C.
China, the EU, Japan and South Korea have all announced Net Zero emissions
targets for 2050 or soon after (2060 in the case of China).
* The existing EU ambition is for a 40% reduction by 2030 relative to 1990; an increase to 55% is being considered. The
fifth budget goal of -57% refers to the net carbon account, which adjusts for emissions trading in the EU Emissions
Trading System.
Global ambition is increasing, but remains insufficient, especially for 2030.
The UK should include separate commitments on emissions from international aviation and shipping.
An ambitious UK NDC for 2030 is vital to help unlock greater global ambition.
The NDC should also reflect the need for climate adaptation and international collaboration.
17 Sixth Carbon Budget – The path to Net Zero
The US is expected to join that list in 2021. Together, Net Zero commitments by
Parties to the Paris Agreement cover nearly 50% of global CO2 emissions and 50%
of global GDP (around 60% and 75% with the US). Further commitments by
businesses and cities/states demonstrate underlying support that will amplify and
facilitate the national efforts.
However, existing 2030 commitments globally do not yet match the long-term
targets and still fall far short of what is needed to meet Paris Agreement targets. As
host of COP26, the UK should send a clear signal that it is contributing fully to the
Paris Agreement by setting a world-leading 2030 ambition and taking strong action
now to move decisively onto the path to its long-term Net Zero ambition.
How the Sixth Carbon Budget supports global climate action
Our recommended Sixth Carbon Budget and UK NDC reflect the goals and
requirements of the Paris Agreement, recognising the UK’s responsibility as a richer
developed nation and its respective capabilities:
• Our recommended pathway has been explicitly designed to reflect the
UK’s ‘highest possible ambition’ within the UK’s particular capabilities, as
required by the Paris Agreement.
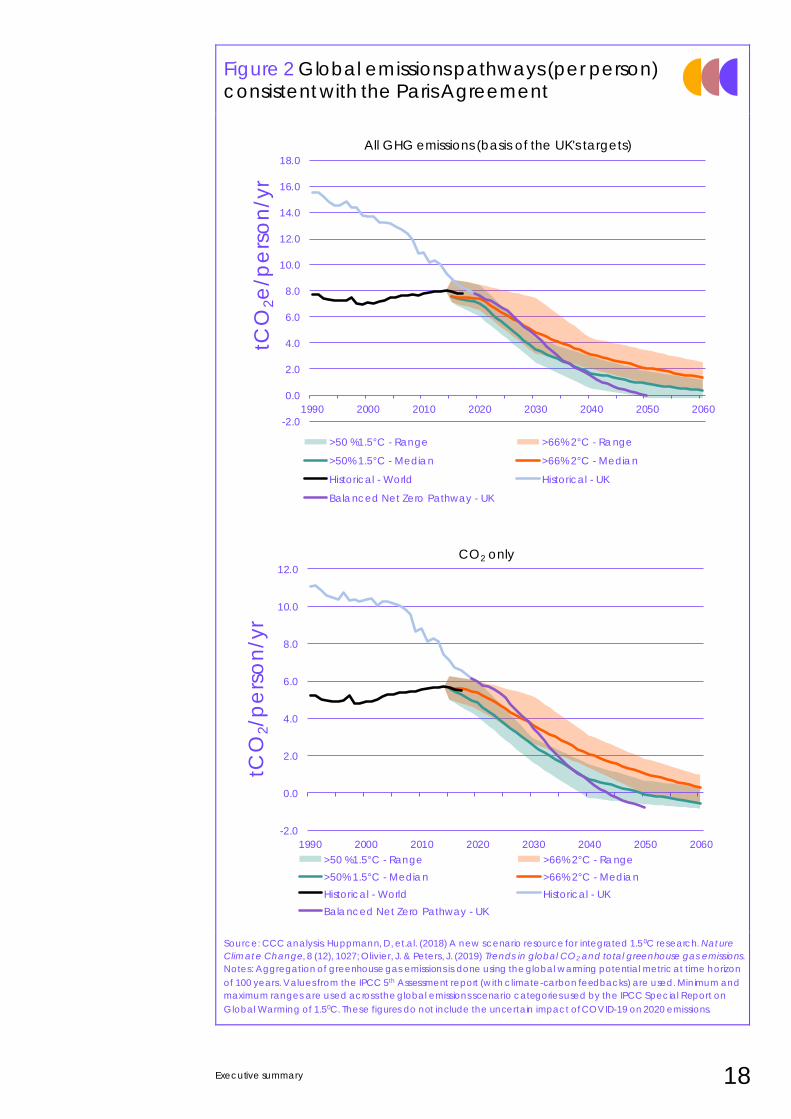
• It would reduce the UK’s annual per capita emissions by 2035 to under 3
tCO2e per person, in line with global pathways consistent with meeting the
Paris 1.5°C goal (Figure 2).
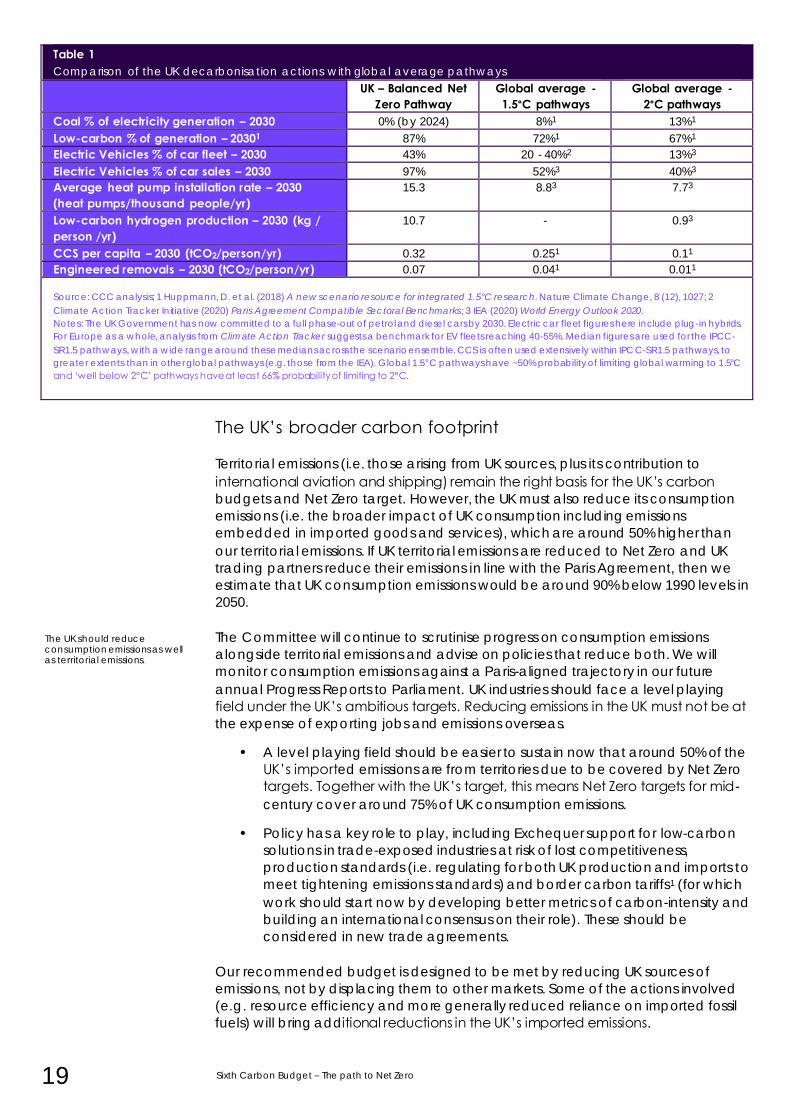
• The actions required to meet the budget and NDC (including full
decarbonisation of the power sector, full switchover to electric vehicle sales
and installation of low-carbon heating, and roll-out of carbon capture and
storage) would go beyond those required from the world on average
(Table 1), in line with the UK’s responsibility as a richer nation with larger
historical emissions. The timing of these actions would align to that required
from other climate leaders.
• Comparable action from other developed countries, with developing
countries following slightly later (i.e. where they generally adopt low-carbon
measures later, achieve lower percentage reductions to 2030 and reach
Net Zero emissions after 2050) would limit warming well below 2°C. We set
out such a ‘leadership-driven’ global pathway in this report.
• We have highlighted where policies and actions have important crossovers
with the need to adapt to climate change, which is also included as a key
part of the long-term response to climate change in the Paris Agreement.
To limit warming below 1.5°C, modelling generally suggests that all regions will
need to follow paths close to those currently being considered in developed
countries. Developed countries will need to play a significant role in supporting
those efforts. If additional action to reduce emissions domestically beyond our
recommended budget proves possible, then the UK should take that action in
further support of the 1.5°C ambition.
The Sixth Carbon Budget has been developed to support the required pathways for reducing global emissions.
Executive summary 18
Figure 2 Global emissions pathways (per person) consistent with the Paris Agreement
Source: CCC analysis. Huppmann, D, et.al. (2018) A new scenario resource for integrated 1.50C research. Nature
Climate Change, 8 (12), 1027; Olivier, J. & Peters, J. (2019) Trends in global CO2 and total greenhouse gas emissions.
Notes: Aggregation of greenhouse gas emissions is done using the global warming potential metric at time horizon
of 100 years. Values from the IPCC 5th Assessment report (with climate-carbon feedbacks) are used. Minimum and
maximum ranges are used across the global emissions scenario categories used by the IPCC Special Report on
Global Warming of 1.50C. These figures do not include the uncertain impact of COVID-19 on 2020 emissions.
-2.0
0.0
2.0
4.0
6.0
8.0
10.0
12.0
1990 2000 2010 2020 2030 2040 2050 2060
tCO
2/p
ers
on
/yr
>50 %1.5°C - Range >66% 2°C - Range
>50% 1.5°C - Median >66% 2°C - Median
Historical - World Historical - UK
Balanced Net Zero Pathway - UK
-2.0
0.0
2.0
4.0
6.0
8.0
10.0
12.0
14.0
16.0
18.0
1990 2000 2010 2020 2030 2040 2050 2060
tCO
2e
/pe
rso
n/y
r
>50 %1.5°C - Range >66% 2°C - Range
>50% 1.5°C - Median >66% 2°C - Median
Historical - World Historical - UK
Balanced Net Zero Pathway - UK
All GHG emissions (basis of the UK's targets)
CO2 only
19 Sixth Carbon Budget – The path to Net Zero
Table 1 Comparison of the UK decarbonisation actions with global average pathways
UK – Balanced Net Zero Pathway
Global average - 1.5°C pathways
Global average - 2°C pathways
Coal % of electricity generation – 2030 0% (by 2024) 8%1 13%1
Low-carbon % of generation – 20301 87% 72%1 67%1
Electric Vehicles % of car fleet – 2030 43% 20 - 40%2 13%3
Electric Vehicles % of car sales – 2030 97% 52%3 40%3
Average heat pump installation rate – 2030 (heat pumps/thousand people/yr)
15.3 8.83 7.73
Low-carbon hydrogen production – 2030 (kg / person /yr)
10.7 - 0.93
CCS per capita – 2030 (tCO2/person/yr) 0.32 0.251 0.11
Engineered removals – 2030 (tCO2/person/yr) 0.07 0.041 0.011
Source: CCC analysis; 1 Huppmann, D. et al. (2018) A new scenario resource for integrated 1.5°C research. Nature Climate Change, 8 (12), 1027; 2
Climate Action Tracker Initiative (2020) Paris Agreement Compatible Sectoral Benchmarks ; 3 IEA (2020) World Energy Outlook 2020.
Notes: The UK Government has now committed to a full phase-out of petrol and diesel cars by 2030. Electric car fleet figures here include plug-in hybrids.
For Europe as a whole, analysis from Climate Action Tracker suggests a benchmark for EV fleets reaching 40-55%. Median figures are used for the IPCC-
SR1.5 pathways, with a wide range around these medians across the scenario ensemble. CCS is often used extensively within IPCC-SR1.5 pathways, to
greater extents than in other global pathways (e.g. those from the IEA). Global 1.5°C pathways have ~50% probability of limiting global warming to 1.5°C
and ‘well below 2°C’ pathways have at least 66% probability of limiting to 2°C.
The UK’s broader carbon footprint
Territorial emissions (i.e. those arising from UK sources, plus its contribution to
international aviation and shipping) remain the right basis for the UK’s carbon
budgets and Net Zero target. However, the UK must also reduce its consumption
emissions (i.e. the broader impact of UK consumption including emissions
embedded in imported goods and services), which are around 50% higher than
our territorial emissions. If UK territorial emissions are reduced to Net Zero and UK
trading partners reduce their emissions in line with the Paris Agreement, then we
estimate that UK consumption emissions would be around 90% below 1990 levels in
2050.
The Committee will continue to scrutinise progress on consumption emissions
alongside territorial emissions and advise on policies that reduce both. We will
monitor consumption emissions against a Paris-aligned trajectory in our future
annual Progress Reports to Parliament. UK industries should face a level playing
field under the UK’s ambitious targets. Reducing emissions in the UK must not be at
the expense of exporting jobs and emissions overseas.
• A level playing field should be easier to sustain now that around 50% of the
UK’s imported emissions are from territories due to be covered by Net Zero
targets. Together with the UK’s target, this means Net Zero targets for mid-
century cover around 75% of UK consumption emissions.
• Policy has a key role to play, including Exchequer support for low-carbon
solutions in trade-exposed industries at risk of lost competitiveness,
production standards (i.e. regulating for both UK production and imports to
meet tightening emissions standards) and border carbon tariffs1 (for which
work should start now by developing better metrics of carbon-intensity and
building an international consensus on their role). These should be
considered in new trade agreements.
Our recommended budget is designed to be met by reducing UK sources of
emissions, not by displacing them to other markets. Some of the actions involved
(e.g. resource efficiency and more generally reduced reliance on imported fossil
fuels) will bring additional reductions in the UK’s imported emissions.
The UK should reduce consumption emissions as well as territorial emissions.
Executive summary 20
2. Why the Sixth Carbon Budget is right for the UK The economic context for the Sixth Carbon Budget
When the Committee recommended the UK’s Net Zero target for 2050, we
demonstrated that any negative economic impact was likely to be small and the
overall impact could turn out to be positive. Our analysis of the full pathway to Net
Zero for this report reinforces that finding. An ambitious budget is preferable to an
unambitious one, given the range of risks and costs from unchecked climate
change, and in some cases could even cut costs (e.g. with an earlier switch to
electric vehicles).
The economic and social context for climate action has changed in important
ways since the UK set its Net Zero 2050 target:
• The COVID-19 pandemic and measures taken in response to it have sharply
changed the economic backdrop in the UK and globally. In the UK, 750,000
payroll jobs have been lost (with millions more supported by the Jobs
Retention Scheme), GDP has fallen (e.g. by 9% from August 2019 to August
2020) and business investment has dropped by around a quarter despite
record low interest rates. These effects imply considerable spare capacity in
the economy and therefore that increasing investment could support the
UK’s recovery.
• The new Net Zero commitments by countries and businesses clearly
demonstrate momentum building towards more climate action. This should
drive down low-carbon technology costs that themselves can enable
further commitments to action. These commitments are a demonstration
that future markets lie with low-carbon products. Business models that are
not compatible with a Net Zero future are increasingly risky.
• Costs of key low-carbon technologies have continued to fall. For example,
the contracted price for electricity generated by offshore wind fell again in
the latest auction round by around a third compared to the previous
auction two years earlier. These cost reductions are driven by scale
manufacturing, investor confidence and ‘learning-by-doing’ during
deployment within an effective low-risk policy framework. These effects can
be replicated in other areas of the economy, as markets scale up globally
and the costs of low-carbon technologies continue to fall.
This background favours a decisive transition for the UK, quickly switching resources
away from high-carbon activity and into low-carbon investments with lower
operating costs than high-carbon alternatives. This is reflected in our proposed
pathway, which transitions as rapidly as possible within constraints of stock
turnover, supply chain capacity and time required to design effective policy.
Investment and cost estimates
The Balanced Pathway to deliver our recommended Sixth Carbon Budget involves
a large sustained increase in investment, adding around £50 billion annually by
2030 (compared to current economy-wide investment of nearly £400 billion).
The largest increases are for low-carbon power capacity, retrofit of buildings and
the added costs of batteries and infrastructure for electric vehicles.
This required increase in investment can, and should, be delivered largely by the
private sector. It is well within the range of historical changes in UK total investment.
Costs of low-carbon technologies continue to fall.
Low-carbon investment can support the economic recovery.
21 Sixth Carbon Budget – The path to Net Zero
The sectoral increases have broadly been seen before, for example, in the
transport sector as car-buyers shifted towards larger cars, in the power sector as
renewable investment increased in the last decade, and in the housing sector as
spending on refurbishments increased. It can be financed at low cost if policies are
constructed to give long-term clarity to consumers and confidence to investors.
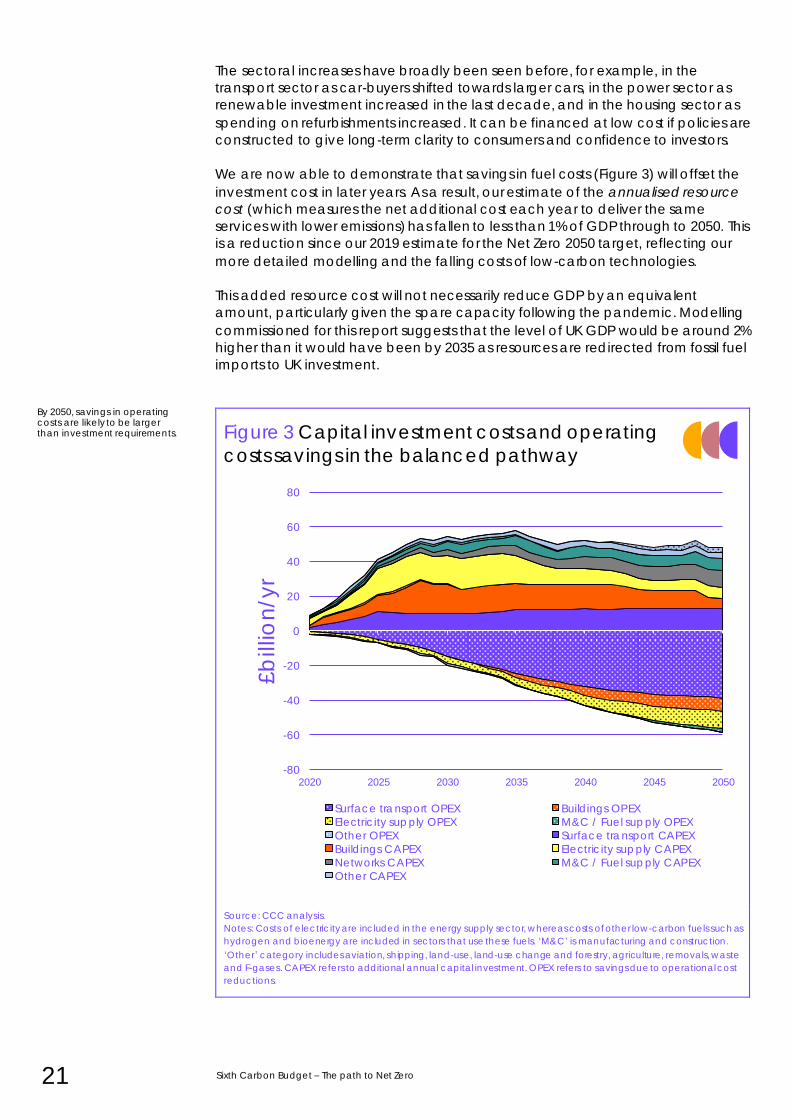
We are now able to demonstrate that savings in fuel costs (Figure 3) will offset the
investment cost in later years. As a result, our estimate of the annualised resource
cost (which measures the net additional cost each year to deliver the same
services with lower emissions) has fallen to less than 1% of GDP through to 2050. This
is a reduction since our 2019 estimate for the Net Zero 2050 target, reflecting our
more detailed modelling and the falling costs of low-carbon technologies.
This added resource cost will not necessarily reduce GDP by an equivalent
amount, particularly given the spare capacity following the pandemic. Modelling
commissioned for this report suggests that the level of UK GDP would be around 2%
higher than it would have been by 2035 as resources are redirected from fossil fuel
imports to UK investment.
Figure 3 Capital investment costs and operating
costs savings in the balanced pathway
Source: CCC analysis.
Notes: Costs of electricity are included in the energy supply sector, whereas costs of other low-carbon fuels such as
hydrogen and bioenergy are included in sectors that use these fuels. ‘M&C’ is manufacturing and construction.
‘Other’ category includes aviation, shipping, land-use, land-use change and forestry, agriculture, removals, waste
and F-gases. CAPEX refers to additional annual capital investment. OPEX refers to savings due to operational cost
reductions.
-80
-60
-40
-20
0
20
40
60
80
2020 2025 2030 2035 2040 2045 2050
£b
illio
n/y
r
Surface transport OPEX Buildings OPEX
Electricity supply OPEX M&C / Fuel supply OPEX
Other OPEX Surface transport CAPEX
Buildings CAPEX Electricity supply CAPEX
Networks CAPEX M&C / Fuel supply CAPEX
Other CAPEX
By 2050, savings in operating costs are likely to be larger than investment requirements.
Executive summary 22
Broader impacts
While costs are small overall, they could be large for particular people, sectors or
areas. The risk of localised impacts should be a key focus for the Government.
Our proposed pathway will require new jobs to be filled, as the need for other jobs
is reduced. With the right policies in place, our proposed pathway can be
delivered without adding further costs to energy bills and with limited impacts on
the public finances. Significant positive impacts on health and the environment are
expected.
• Jobs and the Just Transition. Our pathway involves considerable
opportunities for job creation. For example, the programme to retrofit
buildings alone would require over 200,000 extra full-time workers in that
sector from 2030 through to 2050.2 An important challenge for Government
is to identify where jobs may be lost (for example in oil and gas extraction
and refining) and to support workers to transition to being a part of the new
low-carbon workforce (e.g. in carbon capture and storage), whether within
companies undergoing their own transitions or beyond.
• Energy bills. A national investment programme is needed to decarbonise
the UK’s homes fully, at an average investment of less than £10,000 per
home, over the next 30 years.3 This can be achieved with practical policy
design and some Exchequer funding. The plan can be implemented
without large increases in consumers’ energy bills, especially as the savings
from low-cost renewables begin to be reflected in consumer bills. Indeed,
policy can be designed to ensure that vulnerable customers benefit from
lower energy bills, given the lower operating costs resulting from
improvements in energy efficiency of homes and heating systems. Motorists
stand to see significant cuts in the costs of driving as they shift to electric
vehicles.
• Public finances. Given a small overall economic impact, and the
expectation for the private sector to finance most of the transition, the
overall impact on public finances should be limited. However, the
Government will need to find a way to replace lost revenues from road fuel
duty and vehicle excise duties, for example by shifting to a road charging
regime. Carbon taxes are an important part of the policy toolkit and could
raise revenues during the Net Zero transition. The priorities we identify in this
report for Exchequer support imply around a doubling in annual public
funding to £9-12 billion by 2030, depending on policy choices.
• Health and environment. There is a host of health and environmental
benefits attached to the Net Zero transition. More walking and cycling and
less carbon-intensive diets can improve health, as can cleaner air and
better insulated homes (e.g. the annual cost to the NHS of poor-quality
housing in England alone has been estimated at over £1 billion).4
Restoration of peatlands and planting of woodlands can improve access
to green space and, done well, can provide new income streams for
farmers, improve the natural environment, support biodiversity and improve
adaptation to the impacts of climate change.
The required investment programme can provide a significant economic boost in
the coming years and support the UK’s economic recovery. These benefits may
well persist into the longer-term and could grow if new zero-carbon technologies
continue to develop rapidly and provide spil l-overs to other sectors.
The path to Net Zero brings many opportunities for job creation.
Impacts on energy bills and the public finances can be managed with good policy design.
The path to Net Zero has considerable co-benefits for health and the environment.
23 Sixth Carbon Budget – The path to Net Zero
At worst the size of the economy would be similar to that expected without climate
action, but with valuable co-benefits. Negative impacts can be avoided with
effective policy, which must be decisive and provide confidence to investors.
Why the budget is right for Scotland, Wales & Northern Ireland
Scotland, Wales and Northern Ireland together cover a fifth of UK emissions. They
have an integral role to play in delivering the UK’s Sixth Carbon Budget on the path
to Net Zero. For Scotland and Wales, this will be achieved under long-term targets
passed in Holyrood and the Senedd Cymru. Northern Ireland is considering
introducing its own climate legislation.
The challenges and solutions to tackling greenhouse gas emissions are broadly
similar across the UK. The respective contributions made by each part of the UK will
depend, at least in part, on the relative importance within their economies of
particular types of emitting activity (e.g. agriculture, industry) and opportunities for
removing CO2 from the atmosphere through natural or engineered solutions.
UK climate targets cannot be met without strong policy action across Scotland,
Wales and Northern Ireland, tailored for national, regional and local needs:
• While some important policy levers are held in Westminster, powers are fully
or partially devolved in most key areas, including encouraging shifts to
walking, cycling and public transport; providing electric vehicle charging
points; improvements to the efficiency and comfort of the building stock
and heating in homes off the gas grid; agriculture and land use; waste;
carbon trading; and public provision of education and training. Northern
Ireland also has wider devolved powers over energy networks.
• The frameworks in Wales and Scotland are ahead of the rest of the UK in
emphasising the importance of the potential health and environment
benefits, and the need for a just transition. Wales’ Wellbeing of Future
Generations Act and Scotland’s Just Transition Commission will be
important in ensuring this.
• Even where the main policy levers are held by the UK Government,
Scotland, Wales and Northern Ireland can take action through
complementary measures at the devolved level (e.g. provision of
additional incentives, public engagement, and supporting policies such as
planning and consenting).
We will shortly publish two joint reports reflecting on progress towards meeting
Wales’s existing climate targets and giving new recommendations on the level of
Wales’s Third Carbon Budget (2026-2030) and other emissions reduction targets
including the 2050 target.
In parallel with this advice, the Committee has written to the Scottish Government
and the Northern Ireland Executive to give further advice on meeting and setting
climate targets.
Meeting the Sixth Carbon Budget will help Scotland, Wales and Northern Ireland meet their own ambitions.
Executive summary 24
3. How the Sixth Carbon Budget can be met
UK territorial emissions in 2019 were 522 MtCO2e, 41% below 1990 levels.* UK GDP
grew by over 75% over the same period. Emissions primarily result from the burning
of fossil fuels (mostly oil and gas) to run vehicles, heat buildings, produce electricity
and in industry and agriculture. Further emissions arise from industrial and
agricultural processes, changes in land use, waste disposal and leakage from
various sources.
Net Zero requires a transformation across these areas. No single solution or single
sector can meet the budget alone; action is required across all areas and all
sectors, without delay. The 2020s are the crucial decade: with effective action
starting now, by 2030 the UK will be firmly on track to Net Zero.
A large part of meeting Net Zero is a technological and investment challenge. But
it also requires a fundamental response from people: as consumers, workers,
homeowners, tenants and landlords, motorists, farmers, citizens and families.
Government should lead that response and will have most success where its
proposals are seen to be fair and where people have been involved in developing
the proposed solutions. The UK Climate Assembly provided useful insights on the
priorities of a representative cross-section of the UK population. These priorities are
reflected in this report.
Scenarios for the path to Net Zero
At the core of our advice for this report are multiple scenarios exploring the actions
required in each area and every year in order to reduce UK emissions to Net Zero
by 2050 at the latest. The detailed scenarios explore uncertainties, particularly over
how far people will change their behaviours, how quickly technology will develop
and the balance between options where credible alternatives exist.
All the scenarios are ambitious while bounded by realistic assumptions over the
speed at which low-carbon technologies can be developed and rolled out,
allowing time for supply chains, markets and infrastructure to scale up. They are
self-consistent and recognise other priorities – for example, our energy analysis
maintains security of supply, our housing analysis considers the need for flood
protection and to avoid over-heating, our land analysis supports the natural
environment.
Based on the insights of these scenarios, we have developed a Balanced Pathway
as the basis for our recommended Sixth Carbon Budget and the UK’s NDC. The
Balanced Pathway makes moderate assumptions on behavioural change and
innovation and takes actions in the coming decade to develop multiple options
for later roll-out (e.g. use of hydrogen and/or electrification for heavy goods
vehicles and buildings). While it is not a prescriptive path that must be followed
exactly, it provides a good indication of what should be done over the coming
years.
* Throughout this report our figures for UK emissions include those from international aviation and shipping (45 MtCO2e
in 2019). We also incorporate expected changes to the UK emissions accounts to reflect higher estimates for
emissions from peatlands and higher global warming potentials (GWP) proposed by the IPCC (and agreed at the
UNFCCC) for non-CO2 greenhouse gases. As a result, our estimate for UK emissions in 2019 is a further 42 MtCO2e
higher than in the UK’s official inventory. Box 2.1 in Chapter 2 sets out more details on these issues.
People have a vital role in delivering Net Zero and the Sixth Carbon Budget.
The Committee has used scenarios to identify a Balanced Pathway to Net Zero, which forms the basis of the Sixth Carbon Budget.
25 Sixth Carbon Budget – The path to Net Zero
Reducing emissions to 2035
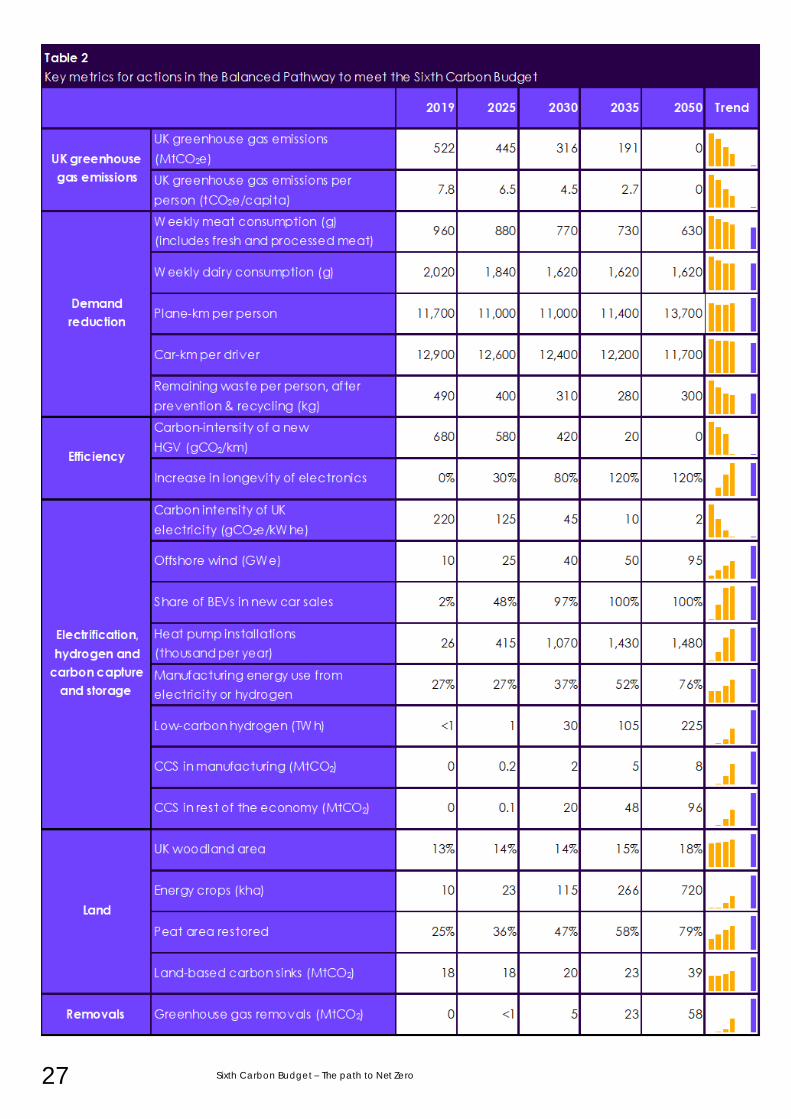
Meeting the Sixth Carbon Budget requires action across four key areas in line with
those from our Balanced Pathway (Figure 4, Table 2):
• Reducing demand for carbon-intensive activities.
– Reduced demand. Around 10% of the emissions saving in our Balanced Pathway in 2035 comes from changes that reduce demand for carbon-intensive activity. Particularly important in our scenarios are an accelerated shift in diets away from meat and dairy products, reductions in waste, slower growth in flights and reductions in travel demand. While changes are needed, these can happen over time and overall can be positive for health and well-being.
– Improved efficiency. A further 5% comes from improving efficiency, in use of energy and resources, especially by better insulation of buildings, improving vehicle efficiency and improving efficiency in industry.
• Take-up of low-carbon solutions. Over half the emissions saving is from people and businesses adopting low-carbon solutions as high-carbon options are phased out (Table 3). By the early 2030s all new cars and vans and all boiler replacements in homes and other buildings must be low-
carbon – we expect largely electric. By 2040 all new heavy goods vehicles should be low-carbon. Industry must either adopt technologies that use electricity or hydrogen instead of fossil fuels or install carbon capture and storage.
• Expansion of low-carbon energy supplies.
– Low-carbon electricity. Low-carbon electricity can now be produced more cheaply than high-carbon electricity in the UK and globally.
– In our Balanced Pathway the low-carbon share increases from 50%
now to 100% by 2035, cutting UK emissions by 18% compared to our baseline. New demands from transport, buildings and industry
(moderated by improving energy efficiency) mean electricity demand rises 50% to 2035, doubling or even trebling by 2050. The largest contribution is from offshore wind, reaching the Government’s goal of 40 GW in 2030, on a path to 65-125 GW by 2050.
– Low-carbon hydrogen scales up to 90 TWh by 2035 (i.e. nearly a third of the size of the current power sector), produced using electricity or from natural gas or biomass with carbon capture and storage. It is used in areas less suited to electrification, particularly shipping and parts of industry, and is vital in providing flexibility to deal with intermittency in the power system. It may also have a material longer-
term role in buildings and other transport, such as heavy goods vehicles.
• Land (and removals). A transformation is needed in the UK’s land while supporting UK farmers. By 2035 our scenarios involve planting of 440,000 hectares of mixed woodland to remove CO2 from the atmosphere as they grow, with a further 260,000 hectares of agricultural land shifting to bioenergy production (including short rotation forestry). This would see UK woodland cover growing from 13% now to 15% by 2035. Peatlands must be restored widely and managed sustainably. Low-carbon farming practices must be adopted widely, while raising farm productivity.
The largest contribution is from mass take-up of low-carbon solutions, powered by a major expansion of low-carbon electricity and hydrogen supplies.
Changes in the UK’s land use are also needed.
Lower-carbon choices and efficiency can make a material contribution to meeting the budget.
Executive summary 26
Alongside the nature-based removals, by 2035 the UK should be using
bioenergy (largely grown in the UK) with CCS to deliver engineered
removals of CO2 at scale.
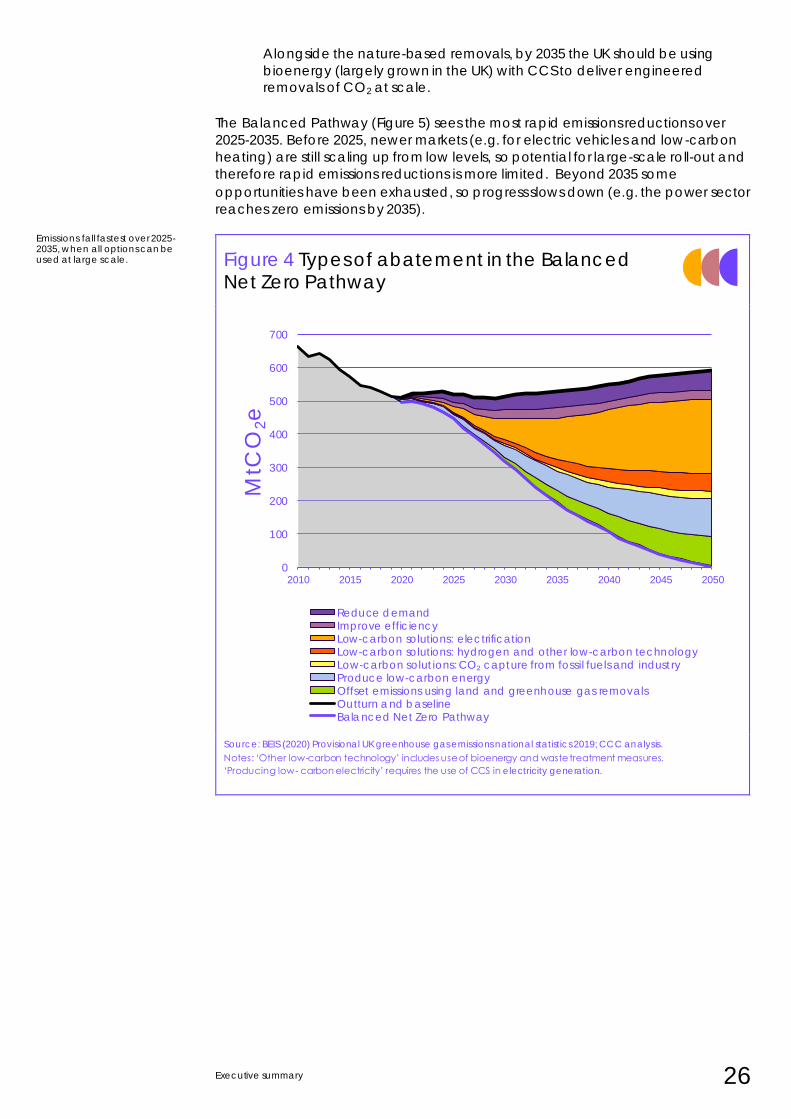
The Balanced Pathway (Figure 5) sees the most rapid emissions reductions over
2025-2035. Before 2025, newer markets (e.g. for electric vehicles and low-carbon
heating) are still scaling up from low levels, so potential for large-scale roll-out and
therefore rapid emissions reductions is more limited. Beyond 2035 some
opportunities have been exhausted, so progress slows down (e.g. the power sector
reaches zero emissions by 2035).
Figure 4 Types of abatement in the Balanced Net Zero Pathway
Source: BEIS (2020) Provisional UK greenhouse gas emissions national statistics 2019; CCC analysis.
Notes: ‘Other low-carbon technology’ includes use of bioenergy and waste treatment measures.
‘Producing low- carbon electricity’ requires the use of CCS in electricity generation.
Emissions fall fastest over 2025-2035, when all options can be used at large scale.
0
100
200
300
400
500
600
700
2010 2015 2020 2025 2030 2035 2040 2045 2050
MtC
O2e
Reduce demandImprove efficiencyLow-carbon solutions: electrificationLow-carbon solutions: hydrogen and other low-carbon technologyLow-carbon solutions: CO₂ capture from fossil fuels and industryProduce low-carbon energyOffset emissions using land and greenhouse gas removalsOutturn and baselineBalanced Net Zero Pathway
27 Sixth Carbon Budget – The path to Net Zero
Executive summary 28
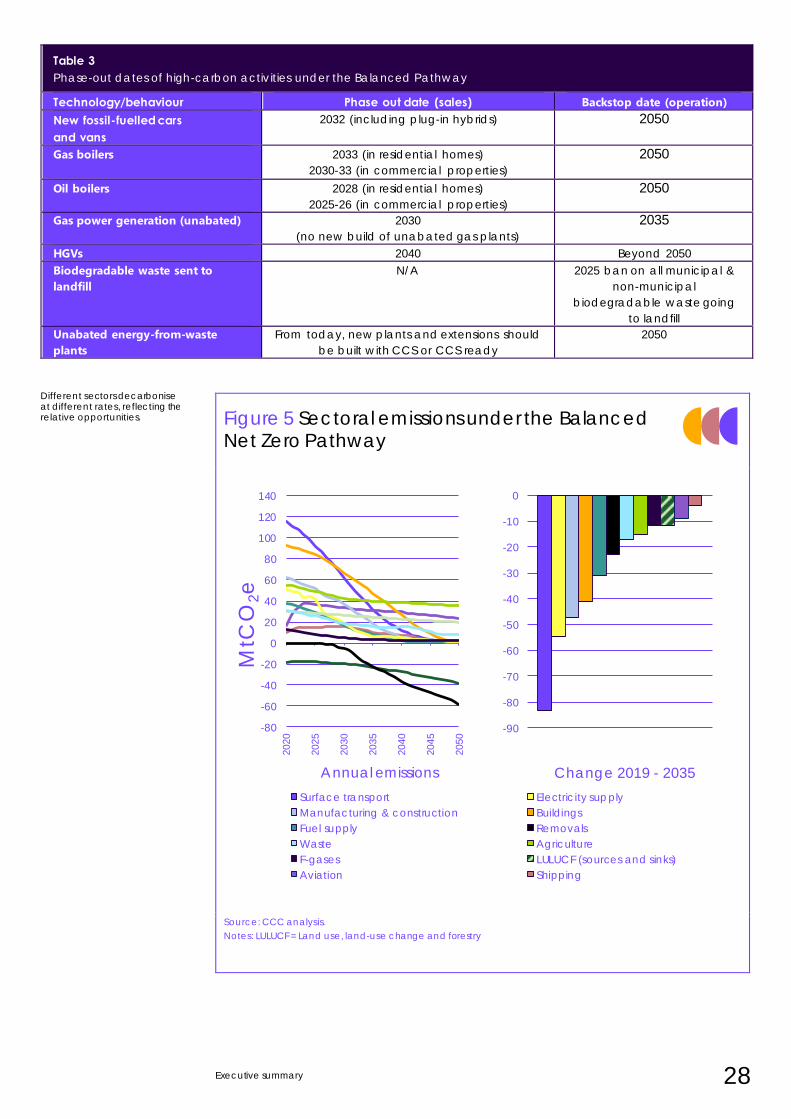
Table 3
Phase-out dates of high-carbon activities under the Balanced Pathway
Technology/behaviour Phase out date (sales) Backstop date (operation) New fossil-fuelled cars and vans
2032 (including plug-in hybrids) 2050
Gas boilers
2033 (in residential homes)
2030-33 (in commercial properties)
2050
Oil boilers 2028 (in residential homes)
2025-26 (in commercial properties)
2050
Gas power generation (unabated) 2030
(no new build of unabated gas plants)
2035
HGVs 2040 Beyond 2050
Biodegradable waste sent to
landfill
N/A 2025 ban on all municipal &
non-municipal
biodegradable waste going
to landfill
Unabated energy-from-waste
plants
From today, new plants and extensions should
be built with CCS or CCS ready
2050
Figure 5 Sectoral emissions under the Balanced Net Zero Pathway
Source: CCC analysis.
Notes: LULUCF = Land use, land-use change and forestry
Different sectors decarbonise at different rates, reflecting the relative opportunities.
-80
-60
-40
-20
0
20
40
60
80
100
120
140
2020
2025
2030
2035
2040
2045
2050
MtC
O2e
Annual emissions
-90
-80
-70
-60
-50
-40
-30
-20
-10
0
Change 2019 - 2035
Surface transport Electricity supply
Manufacturing & construction Buildings
Fuel supply Removals
Waste Agriculture
F-gases LULUCF (sources and sinks)
Aviation Shipping
29 Sixth Carbon Budget – The path to Net Zero
4. Recommendations for action
Delivering the actions required in the 2020s to meet the Sixth Carbon Budget
requires policies to be strengthened now. Matching strong ambition with action is
vital for the UK’s credibility, with business and with the international community.
Action in early years underpins the transition by developing options and driving
learning-by-doing in key technologies. It keeps open the possibility that if faster
progress proves possible it can be taken, in further support of the global 1.5°C goal.
A vital challenge is to ensure that the transition is fair, and perceived to be fair.
That was a key theme from the recent UK Climate Assembly, and it is clear that
engaging and involving the public in the transition and in policy design will be vital.
The Treasury Net Zero Review must identify fair ways to share the costs and benefits
of the transition and the Government must develop effective plans for a just
transition while embedding the principle of fairness throughout policy. Plans should
recognise interactions with other transformations, such as digitalisation. Place and
skills will be key dimensions to consider, so it is vital that UK Government policy joins
up well with local, regional and devolved policy on the just transition.
We identify priorities for every sector of the economy, building on our detailed
recommendations in our June Progress Report.
• Surface transport (22% of 2019 emissions).5 A comprehensive policy
package will be needed to deliver on the Government’s new commitment
to phase out new sales of petrol and diesel cars and vans by 2030,
including ensuring that plug-in hybrids play no more than a niche role by
then. A further commitment should be made to phase out sales of diesel
heavy goods vehicles no later than 2040, supported by large-scale trials in
the near term. Recharging and refuelling infrastructure will need to develop
to meet the range of emerging needs. Effective demand-side policy is also
essential – we identify significant opportunities, and advantages, to
reducing travel demand, but this will not happen without firm policies.
• Industry (20%). For the manufacturing, construction and fuel supply
industries, the Government must move from the current piecemeal
approach to a comprehensive transition support framework. Taxpayer
funding will be key in early years to ensure industries stay internationally
competitive while reducing emissions. The development of longer-term
policies, such as border carbon tariffs or carbon standards, should begin
immediately, for example through development of improved measurement
of carbon-intensity. Policy must tackle both the demand-side and supply-
side for low-carbon products and ensure relevant infrastructure is available.
• Buildings (17%). Government must produce a robust and ambitious Heat
and Buildings strategy which sets the direction for the next decade, with
clear signals on the phase-out of fossil heating, rebalancing of policy costs
between electricity and gas, commitments to funding and delivery plans
which include regional and local actors. Our Balanced Pathway is
underpinned by clear timetables for standards to make all buildings energy
efficient and ultimately low-carbon. The other priorities are rapidly to scale
up supply chains for heat pumps and heat networks and to develop the
option of hydrogen for heat. Proper enforcement of standards, including
avoiding overheating risks, and an effective approach to skills are essential.
• Electricity generation (10%). Low-risk instruments like the auctions of
renewable contracts should continue to support the scale-up of low-
carbon generating capacity. Policy should address barriers to the major
scale-up required, for example by supporting the coordination of
connections from offshore windfarms into the onshore network and greatly
Only a just transition will be successful.
Policy throughout the economy must be clear, effective and fair.
Executive summary 30
strengthening the UK’s power grid. Following on from the 2024 coal phase-
out, gas-fired power without CCS should be phased out by 2035. Work to
improve markets for the provision of flexibility must accelerate to
accommodate the increasing shares of variable power.
• Low-carbon hydrogen. The Government’s Hydrogen Strategy is due to be
published in spring 2021. It will need to set out a vision for hydrogen’s role in
meeting Net Zero in the longer term, together with the actions, regulations
and incentives across end-use applications and hydrogen supply to
develop hydrogen’s role over the next decade.
• Agriculture (10%) and land (net source of 2%). We set out detailed
recommendations on policy for land and agriculture in January 2020. These
must be implemented in a way that is fair to farmers. The priorities remain: a
strengthened regulatory baseline to ensure low-regret measures are
adopted; incentive schemes such as auctioned contracts to drive
afforestation; and enabling measures to address issues such as skills, supply
chains and barriers for tenant farmers. Policy design must account for the
challenges of the changing climate and reflect wider environmental
priorities, including for biodiversity, to harness potential synergies and avoid
unnecessary trade-offs. Policies are also needed to cut food waste and
encourage a reduction in consumption of meat and dairy.
• Aviation (7%) and shipping (3%). The UK will need strategies to reduce its
emissions from aviation and shipping to Net Zero. It should help drive
international processes (through ICAO and the IMO)6 to strengthen
ambition in line with Net Zero. Policy should also provide early-stage
development support for engineered CO2 removals, sustainable fuels and
more efficient, including electrified, craft. Steps should be taken to limit
aviation growth in line with our scenarios.
• Waste (6%) and F-gases (3%). Waste policy should include a ban on
landfilling biodegradable waste by 2025, with recycling increasing to 70%
by 2030. More policies are needed through the chain from manufacturing
to the consumer to reduce the amount of waste. All energy-from-waste
plants should fit CCS by 2050. F-gas regulations already require reduction of
some F-gas sources; plans will need to extend to all sources.
• CO2 removal. A full strategy is needed for CO2 removal, covering both
nature-based and engineered options. It should cover initial development
and demonstration, governance arrangements to ensure sustainability and
that removals are permanent, and possible routes to market development
to support the scale-up required from the late 2020s.
Net Zero and the Sixth Carbon Budget present a major coordination and delivery
challenge. The Government must organise itself and its agencies to meet that
challenge. The two Cabinet Committees for Climate Action – the Strategy
Committee chaired by the Prime Minister and the Implementation Committee
chaired by the BEIS7 Secretary of State – are an important element of that, but
stronger governance and coordination will be needed, with delivery processes
reaching out across all levels and localities of Government, across borders, and
across UK businesses and people.
The Committee will continue to offer its support to developing the Government’s
policy programme, and those of Scotland, Wales and Northern Ireland, and will
scrutinise proposals carefully and transparently. The Committee has set out
detailed views on the policy priorities in a separate Policy report published
alongside this report.8
Government must organise at all levels to meet the major delivery challenge of Net Zero.
Aviation and shipping should be included in the Sixth Carbon Budget and must be tackled alongside all other emissions.
31 Sixth Carbon Budget – The path to Net Zero
5. Next steps
In the days following this advice, the Government must communicate its NDC to
the UN. That should be a world-leading commitment, in line with the Committee’s
advice. Ambitious goals on reducing emissions should be accompanied by a
promise also to increase action on adaptation, which is a key theme of the Paris
Agreement and an increasingly urgent priority given the continued changes in the
climate that can be expected even if the Paris Agreement goals are met.
The Government must then set the Sixth Carbon Budget in law by the end of June
2021. This must be followed, as soon as is practicable, by a set of policies and
proposals that demonstrably would meet the budget. We recommend that both
these steps are taken without delay, in the first half of 2021.
Such prompt action would demonstrate the UK’s climate credentials as President
of COP26 and would give confidence to businesses looking to invest and make
their own Net Zero transitions. It is necessary given the scale and speed of change
required.
We expect to report on the Government’s strategies in our next annual Progress
Report in June 2021.
_______________________________________________________________________________
This report represents an extensive programme of analysis, consultation and
consideration by the Committee and its staff, building on the extensive evidence
published last year for our Net Zero advice. This includes: our public Call for
Evidence; 10 new research projects; three expert advisory groups on health,
finance and policy for Net Zero; policy roundtables on heating buildings, electricity
market design and phase-out of unabated gas, digitalisation, greenhouse gas
removals and low-carbon industry; detailed datasets and deep dives into the roles
of local authorities and businesses.
The outputs of our work are published on our website (www.theccc.org.uk) and
explained in the five parts (10 chapters) of this report and its accompanying Policy
report and Methodology report.9
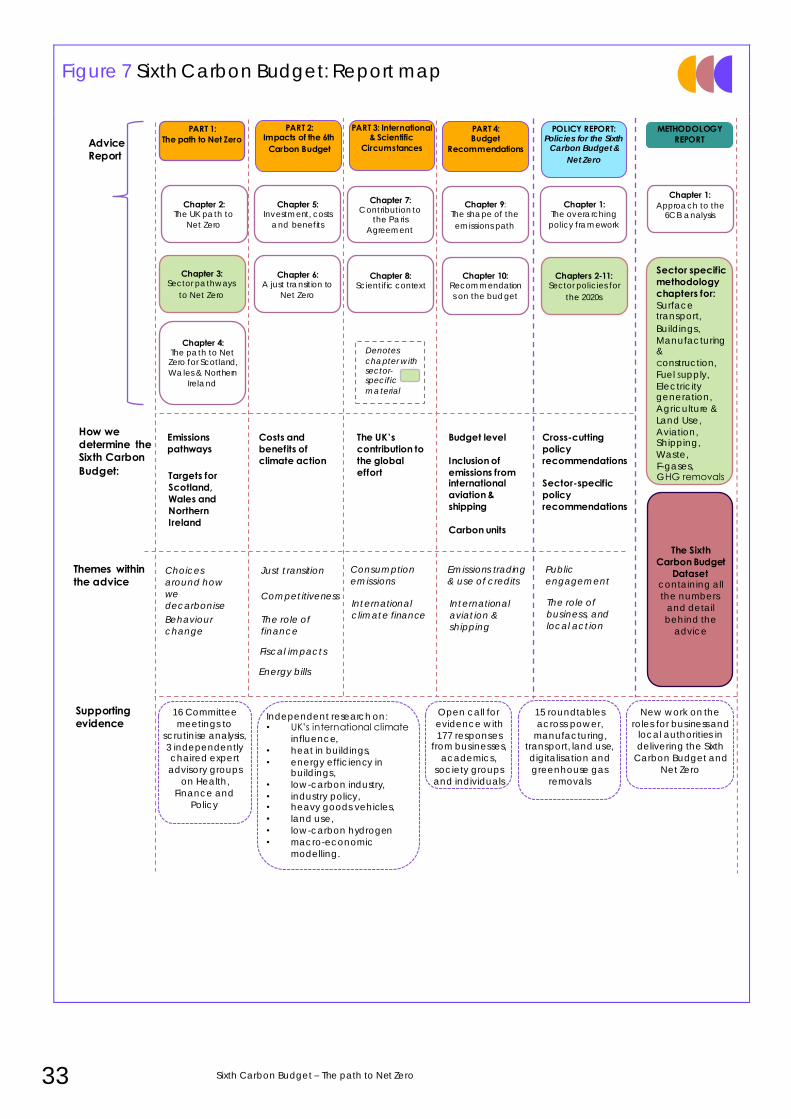
• Part 1: The path to Net Zero sets out the scenarios that underpin our advice
and that demonstrate how the Sixth Carbon Budget can be met: overall
(Chapter 2), sector by sector (Chapter 3) and for Scotland, Wales and
Northern Ireland (Chapter 4).
• Part 2: Impacts of the Sixth Carbon Budget sets out (in Chapter 5) our
estimates of the costs, investments and potential economic impact of the
budget, and (in Chapter 6) the need for a just transition, including
implications for jobs, competitiveness, energy bills and the public finances.
• Part 3: International Circumstances and Climate Science sets out how our
recommendations represent a fair and ambitious contribution to the Paris
Agreement, including consideration of the UK’s broader contribution to
tackling climate change beyond UK territorial emissions, including the UK’s
overseas consumption emissions (Chapter 7). Chapter 8 sets out the
relevant climate science that underpins our advice.
• Part 4: Recommendations sets out why our recommended pathway
reduces emissions more quickly before 2035 than after 2035 (Chapter 9)
and our full recommendations relating to the Sixth Carbon Budget (Chapter
10).
The Government should legislate the Sixth Carbon Budget and set out quantified plans to meet it within 6 months.
Executive summary 32
Figure 6 Sixth Carbon Budget: A snapshot
33 Sixth Carbon Budget – The path to Net Zero
Figure 7 Sixth Carbon Budget: Report map
Denotes
chapter with sector-specific
material
Chapter 2: The UK path to
Net Zero
Chapter 3: Sector pathways
to Net Zero
Chapter 9: The shape of the
emissions path
Chapter 5: Investment, costs
and benefits
Chapter 6: A just transition to
Net Zero
Chapter 7: Contribution to
the Paris
Agreement
Chapter 8: Scientific context
Chapter 10: Recommendation
s on the budget
Chapters 2-11: Sector policies for
the 2020s
Chapter 4: The path to Net Zero for Scotland,
Wales & Northern
Ireland
PART 1: The path to Net Zero
PART 2: Impacts of the 6th
Carbon Budget
PART 3: International & Scientific
Circumstances
PART 4: Budget
Recommendations
POLICY REPORT: Policies for the Sixth
Carbon Budget &
Net Zero
Themes within the advice
Budget level
Inclusion of emissions from international aviation & shipping
Carbon units
Supporting evidence
METHODOLOGY REPORT
Chapter 1: The overarching
policy framework
Chapter 1: Approach to the
6CB analysis
Cross-cutting policy recommendations
Sector-specific policy recommendations
Advice
Report
Targets for Scotland, Wales and Northern Ireland
How we determine the Sixth Carbon Budget:
Emissions pathways
Costs and benefits of climate action
The UK’s contribution to the global effort
Consumption
emissions Just t ransition
The role of
business, and
local act ion
Competitiveness
Fiscal impacts
The role of
finance
Public
engagement
Energy bills
Choices
around how
we
decarbonise
Emissions trading
& use of credits
Behaviour
change
International
climate finance
International
aviat ion &
shipping
The Sixth Carbon Budget
Dataset containing all
the numbers
and detail
behind the
advice
Sector specific methodology chapters for:Surface transport,
Buildings,
Manufacturing &
construction,
Fuel supply,
Electricity generation,
Agriculture &
Land Use,
Aviation, Shipping,
Waste,
F-gases, GHG removals gas removals.
16 Committee
meetings to
scrutinise analysis,
3 independently chaired expert
advisory groups
on Health,
Finance and
Policy
Open call for
evidence with
177 responses from businesses,
academics,
society groups
and individuals
15 roundtables
across power,
manufacturing, transport, land use,
digitalisation and
greenhouse gas
removals
New work on the
roles for business and local authorities in
delivering the Sixth
Carbon Budget and
Net Zero
Independent research on: • UK’s international climate
influence,
• heat in buildings,
• energy efficiency inbuildings,
• low-carbon industry,
• industry policy, • heavy goods vehicles,
• land use,
• low-carbon hydrogen
• macro-economic
modelling.
Executive summary 34
1 Border carbon tariffs impose a carbon tax at the border on imported products based on their
embedded emissions, or carbon footprint. By matching the border carbon tariff to domestic
carbon taxes imposed in the UK, a level playing field can be provided.
2 CITB (2020) Building Skills for Net Zero (draft report).
3 See Chapter 3 of this report.
4 Nicol S. et al. (2015), The cost of poor housing to the NHS. 5 Quoted emissions percentages refer to those used in this report, with adjustments from the UK’s
official inventory to reflect upcoming changes for peatland emissions and Global Warming
Potential (GWP) estimates. They are as a proportion of a total that includes international
aviation and shipping. For some sectors (agriculture, land use, waste, F-gases, aviation and
shipping) the latest available estimates are used, from 2018. Energy-from-waste emissions are
reported within the waste sector. 6 The International Civil Aviation Organisation and the International Maritime Organisation.
7 BEIS = The Department for Business, Energy and Industrial Strategy.
8 CCC (2020) Policies for Net Zero and the Sixth Carbon Budget.
9 CCC (2020) The Sixth Carbon Budget – Methodology Report.

35 Sixth Carbon Budget – The path to Net Zero
Introduction and key messages
1. The Net Zero challenge 38
2. Context – uncertain and urgent times 40
3. COP26 and international leadership 42
4. Using scenarios to identify a balanced path to Net Zero 43

37 Sixth Carbon Budget – The path to Net Zero
Introduction and key messages The Sixth Carbon Budget sets the limit on allowed UK territorial greenhouse gas
emissions over the period 2033 to 2037. It is our duty under the Climate Change Act
to advise on it by the end of 2020, following which it must be legislated by the
middle of 2021.
Our advice on the Sixth Carbon Budget builds on our Net Zero advice from May
2019, but goes much further:
• This is the first carbon budget to be set on the path to the UK’s Net Zero
target for 2050, which was placed in law in summer 2019. Whereas the Net
Zero advice focused on the end point, this advice looks at the whole
pathway and effectively provides the trajectory for emissions over the
coming three decades on the way to Net Zero.
• We have gone beyond the ‘proof of concept’ Further Ambition scenario
presented in our Net Zero advice, to look at different ways of achieving Net
Zero. We present five Net Zero scenarios, which explore how developments
in behavioural and societal change and in technology may affect the path
over the next three decades.
This advice comes at a critical juncture – the opportunity is there for the UK to
provide international leadership in the run up to COP26, while also driving a resilient
recovery through the low-carbon investments that will get us on track to Net Zero.
We introduce our advice in five sections:
1. The Net Zero challenge
2. Context – uncertain and urgent times
3. COP26 and international leadership
4. Our approach – using scenarios to identify a balanced path to Net Zero
5. Requirements of the Climate Change Act
This advice effectively sets the path for emissions on the way to Net Zero.
We have explored five different ways of getting to Net Zero.
Chapter 1: Introduction and key messages 38
1. The Net Zero challenge
In May 2019, the Committee recommended that the UK increase ambition under
the Climate Change Act to require greenhouse gas emissions to reach Net Zero by
2050. The Net Zero target requires deep reductions in all sources of emissions, with
any remaining sources offset by removals of CO2 from the atmosphere (e.g. by
afforestation). Net emissions, after accounting for removals, must be reduced by at
least 100%, to zero.
The Government accepted this advice and legislated in June 2019 to make Net
Zero 2050 a legal requirement.
When advising on the target, the Committee was clear that increasing ambition
under the legislated targets had to be accompanied by a step-change in climate
policy to get on track towards meeting Net Zero.
• Net Zero is a different challenge from the previous 2050 target for at least
an 80% reduction in emissions – all UK emissions must be tackled, without
reliance on offsets from elsewhere. It is not sufficient to simply reduce
emissions – where zero-carbon options exist these must be deployed (for
example, in homes and in manufacturing).
• The public need to be involved – over half the emissions reductions we
identified to reach Net Zero actively involve people, whether by choosing
to purchase low-carbon technologies like electric cars, or by making
different choices, for example on their travel and diets.
• Delivering Net Zero will involve costs and benefits, employment and fiscal
effects, and reinvention for many businesses. It must be a central influence
over our recovery from the COVID-19 economic crisis. Investment for Net
Zero is a solid basis for economic renewal.
We have begun to see the consultations, policies and strategies that show that the
Government is taking the Net Zero policy challenge seriously.
This advice explores a range of ways to achieve Net Zero by 2050. In advising on
the Sixth Carbon Budget, the Committee has focused in particular on what they
mean for the shape of the emissions trajectory and how they perform against the
criteria set out by the Climate Change Act (see section 5).
We have developed scenarios that cut emissions rapidly as demanded by the
climate science, but also ones that provide clarity for businesses to support
investment, that contribute to future-proofed good-quality jobs while smoothing
the transition for current high-carbon industries, that unlock health and well-being
benefits, and that support a positive position for the UK in the world.
Our recommended ‘Balanced Net Zero Pathway’ is the basis of our advice on the level of the Sixth Carbon Budget. It reduces emissions by 2035 to 78% below 1990 levels, including the UK’s share of international aviation and international shipping (IAS) emissions (Figure 1.1). This equates to a 63% reduction on 2019 emissions, by
when emissions had already fallen around 40% since 1990.
This Balanced Net Zero Pathway is set out in Chapters 2 and 3. It was built on
multiple lines of evidence, and takes into account what is feasible over time and
what is necessary to get on track to Net Zero by 2050.
We recommend a budget that means a 78% reduction across all emissions by 2035.
This budget means a step-change in climate policy, starting now.
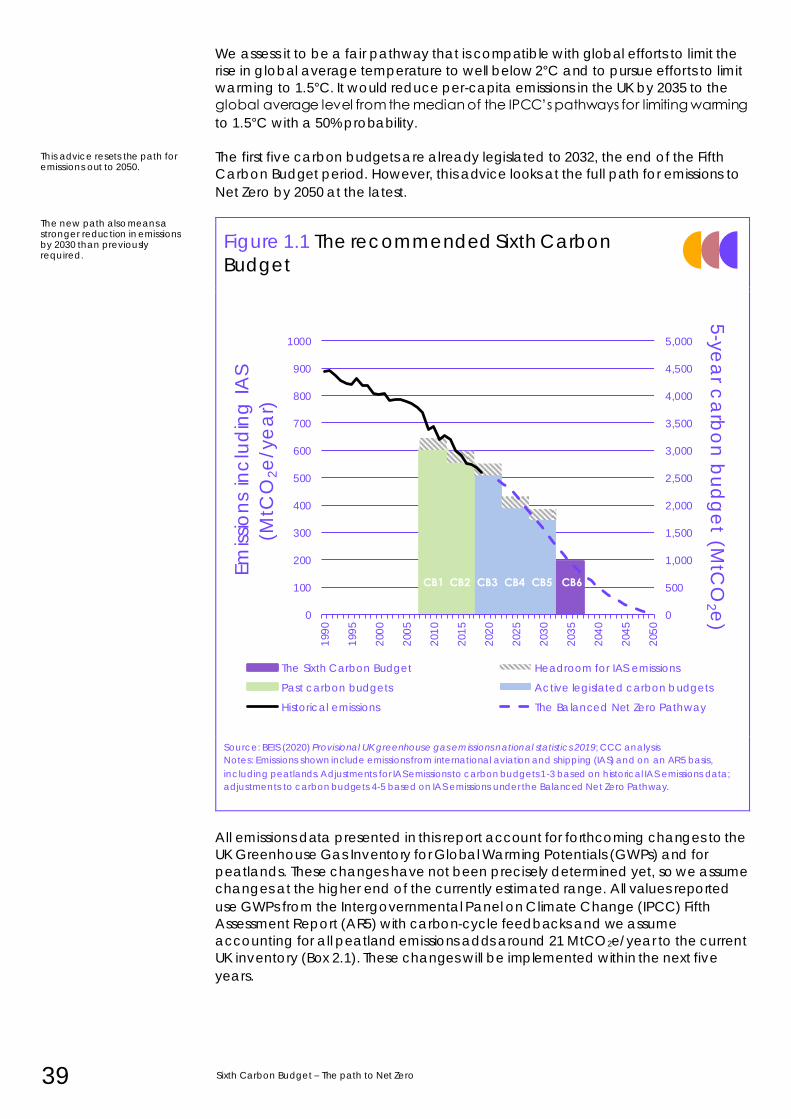
39 Sixth Carbon Budget – The path to Net Zero
We assess it to be a fair pathway that is compatible with global efforts to limit the
rise in global average temperature to well below 2°C and to pursue efforts to limit
warming to 1.5°C. It would reduce per-capita emissions in the UK by 2035 to the
global average level from the median of the IPCC’s pathways for limiting warming
to 1.5°C with a 50% probability.
The first five carbon budgets are already legislated to 2032, the end of the Fifth
Carbon Budget period. However, this advice looks at the full path for emissions to
Net Zero by 2050 at the latest.
Figure 1.1 The recommended Sixth Carbon
Budget
Source: BEIS (2020) Provisional UK greenhouse gas emissions national statistics 2019; CCC analysis
Notes: Emissions shown include emissions from international aviation and shipping (IAS) and on an AR5 basis,
including peatlands. Adjustments for IAS emissions to carbon budgets 1-3 based on historical IAS emissions data;
adjustments to carbon budgets 4-5 based on IAS emissions under the Balanced Net Zero Pathway.
All emissions data presented in this report account for forthcoming changes to the
UK Greenhouse Gas Inventory for Global Warming Potentials (GWPs) and for
peatlands. These changes have not been precisely determined yet, so we assume
changes at the higher end of the currently estimated range. All values reported
use GWPs from the Intergovernmental Panel on Climate Change (IPCC) Fifth
Assessment Report (AR5) with carbon-cycle feedbacks and we assume
accounting for all peatland emissions adds around 21 MtCO2e/year to the current
UK inventory (Box 2.1). These changes will be implemented within the next five
years.
This advice resets the path for emissions out to 2050.
The new path also means a stronger reduction in emissions by 2030 than previously required.
0
500
1,000
1,500
2,000
2,500
3,000
3,500
4,000
4,500
5,000
0
100
200
300
400
500
600
700
800
900
1000
199
0
199
5
200
0
200
5
201
0
201
5
202
0
202
5
203
0
203
5
204
0
204
5
205
0
5-y
ea
r ca
rbo
n b
ud
ge
t (MtC
O2 e
)
Em
issio
ns
inc
lud
ing
IA
S
(MtC
O2e
/ye
ar)
The Sixth Carbon Budget Headroom for IAS emissions
Past carbon budgets Active legislated carbon budgets
Historical emissions The Balanced Net Zero Pathway
CB1 CB2 CB3 CB4 CB5 CB6 CB6
Chapter 1: Introduction and key messages 40
2. Context – uncertain and urgent times
The Climate Change Act requires the Committee to advise by the end of 2020 on
the level of the Sixth Carbon Budget. It is crucial to set that budget now to get the
UK on track as soon as possible towards meeting its statutory Net Zero target by
2050 and meeting our commitments under the Paris Agreement. That is particularly
important this year, as the UK will host the next UN climate talks (the 26th
Conference of the Parties: COP26) in Glasgow in November 2021.
Our advice on the Sixth Carbon Budget and the path to Net Zero comes at a time
of heightened uncertainty due to the impacts of COVID-19, but with widespread
public support for climate action and a major opportunity for low-carbon
investment to be at the heart of the recovery and support UK leadership
internationally:
• The COVID-19 context. The pandemic is a public health crisis with tragic
consequences for many. It brings uncertainty for the future, but also shows
how rapidly things can change when necessary and highlights the role of
investment in driving economic recovery. The period ahead is therefore an
opportunity to make rapid progress.
– The steps that the UK takes to rebuild from the COVID-19 pandemic
and its economic damage can also accelerate the transition to low-
carbon activities and improve our climate resilience. Climate
investments can support the economic recovery and secure good
jobs for the long term, while taking advantage of low interest rates.
– The pandemic has also demonstrated how quickly social change can
occur, and the role of Government in driving that change. As we set
out in this advice, social and behavioural change can make a very
important contribution to meeting Net Zero.
– Setting a carbon budget during the COVID-19 pandemic brings with it
the risk that the projections we have used for the level and nature of
economic activity in the UK are significantly out of line with the reality
that emerges as we recover from its impacts. Due to major uncertainty
over how the recovery will play out, our analysis has assumed no
lasting impact to the UK’s level of economic (and potentially emitting)
activity – this means that if anything, we understate the rate at which
emissions could fall over the next decade and a half.
• The Brexit context. As we establish a new trading relationship with the EU
and leave the EU Emissions Trading System (EU ETS) and other mechanisms,
it makes sense to move to setting and judging our carbon budgets on the
basis of actual UK emissions in all sectors. Clarity and confidence will be
valued, and well-designed climate policy should provide investment
opportunities across a range of sectors (Box 1.1). Nonetheless, coherence
with the wider trading system of the EU ETS is important.
The policy context. Following the legislation of the Net Zero target in 2019,
the Government has rightly been accelerating the development of
strategy and policy. We welcome the Prime Minister’s Ten Point Plan for a
Green Industrial Revolution. It remains urgent to align the policy framework
with the raised ambition under Net Zero, and for a Net Zero strategy to be
published prior to COP26. Our recommended budget requires a policy
framework that enables investment and delivery to be ramped up with
immediate effect.
The context for our advice is one of uncertainty and strengthening climate action.
41 Sixth Carbon Budget – The path to Net Zero
• The climate context. During 2020, we have continued to see the impacts of
climate change that are already here, both in the UK and globally.
Atmospheric CO2 concentrations are at record levels, and compound risks
are building. As the UK prepares to host COP26, ambition is growing
internationally, with a wave of Net Zero targets now being set, and
updated Nationally Determined Contributions (NDCs) for 2030 are
expected as we approach COP26.
• The social context. There is widespread public support for action to tackle
climate change, although without enough clarity so far over the steps that
are needed to do so. The Climate Assembly has given us a valuable insight
into the public’s preferences over how we meet Net Zero.
Box 1.1 The impact of Brexit on the UK’s climate objectives
The UK’s departure from the European Union will hav e implications for the UK’s
environmental and decarbonisation policy. Key implications include:
• Leaving the EU’s Emissions Trading System (EU ETS). Current Government proposals are
to replicate this scheme, with a smaller UK ETS, with a view to linking to the EU ETS. A
carbon tax has also been proposed.
• Product standards set at an EU level have been an important driver of energy
efficiency, and emissions reductions in lights, appliances and vehicles.
• Leaving the Common Agricultural Policy (CAP), which provides direct income support
for farmers, as well as payments for environmental services. The UK’s replacement scheme, Environmental Land Management (ELM), aims to transition to rewarding
farmers more for public goods including mitigating and adapting to climate change.
• The Office for Environmental Protection replaces the role of the European Commission
in enforcing environmental regulations. Once established, in 2021, its role will also
include climate change.
As we noted in 2016, in areas where EU mechanisms are working effectively – such as
product standards, which reduce emissions and save consumers money, or targets for
waste reduction - the UK should aim to replicate them at UK level. Some areas, such as leaving the Common Agricultural Policy, present an opportunity to better target public
funds towards environmental goals.
Source: CCC (2016) Meeting Carbon Budgets – Implications of Brexit for UK climate policy
Chapter 1: Introduction and key messages 42
3. COP26 and international leadership
In November 2021, less than a year after the publication of this report, the UK will
host in Glasgow the next round of UN climate talks: the 26th Conference of the
Parties (‘COP26’). COP26 represents an important milestone in the UN process, with
parties to the Paris Agreement expected to update and increase their
commitments on tackling climate change.
The process of increasing commitments has already begun, with several major
economies setting new goals to reach Net Zero emissions around mid-century.
Commitments from China, the EU, Japan and South Korea cover nearly half of
global emissions. The further commitment expected by the US would extend
coverage to around 60%.
However, to meet the goals of the Paris Agreement, emissions must not only reach
Net Zero, they must do so rapidly, with deep reductions to 2030. That puts a
particular focus on the next decade and the UK’s commitments as host of COP.
The UK will have to submit its ambition to 2030 in its own nationally-determined
contribution (NDC) to the UN process, due by the end of 2020. We make
recommendations on the UK’s NDC in this report, based on the same Balanced
Pathway used for our recommendations on the Sixth Carbon Budget.
The UK’s choices over the NDC and the Sixth Carbon Budget will affect its
credibility as a climate leader, and will set an important context for commitments
by other countries. To support the large increase required in global ambition,
particularly in the period to 2030, the UK’s new commitments must be suitably
ambitious and aligned to the goals of the Paris Agreement.
We reflect that need in this report, in part by ensuring that our scenarios reflect the
UK’s highest possible ambition, as required by Article 4 of the Paris Agreement. We
also consider, in Chapter 7, the various other elements of the Paris Agreement
besides the UK’s direct reductions in emissions. For example, Chapter 7 covers the
UK’s consumption emissions, the role of climate finance and trade agreements.
Delivering a positive outcome from the COP26 climate talks is key to the world’s
efforts to tackle climate change and to protecting the UK from the worst impacts
of climate change. It will be underpinned by a clear and rapid acceptance of the
advice in this report, and by decisively strengthening policy to deliver our
recommended Sixth Carbon Budget and NDC on the path to Net Zero.
We recommend the UK’s ‘NDC’ is set on the same path as the Sixth Carbon Budget.
Our recommendations are consistent with the requirements of the Paris Agreement.
43 Sixth Carbon Budget – The path to Net Zero
4. Using scenarios to identify a balanced path to Net Zero
We have developed scenarios for this report to explore a range of ways to
achieve Net Zero by 2050 at the latest, and used those exploratory scenarios to identify a ‘Balanced Pathway’ towards Net Zero that keeps in play a range of ways of getting there based on central assumptions.
Our scenarios demonstrate that there are multiple ways to meet the Net Zero 2050
target and many routes to our recommended Sixth Carbon Budget. While our
Balanced Pathway is the basis for our recommended budget it is not intended to
be prescriptive. Rather it is illustrative of what a broadly sensible path based on
moderate assumptions would look like. A little more or a little less may be achieved
in any area, or alternative low-carbon options could be used, but the overall level
of ambition and delivery must match.
This section sets out that approach in three parts:
a) The value of using scenarios to set a path to Net Zero
b) Our ‘exploratory’ scenarios to reach Net Zero
c) A Balanced Net Zero Pathway
a) The value of using scenarios to set a path to Net Zero
A key design feature of the Climate Change Act is that legislation of the budget level leaves free a choice about how this is to be delivered. It is the responsibility of Government then to determine how the budget will be met.
In our 2019 advice on setting the Net Zero target, we presented a single (‘Further Ambition’) scenario for 2050 (Box 1.2) – this acted as a ‘proof of concept’,
providing confidence that Net Zero can be achieved at reasonable cost without relying on major breakthroughs in technologies and behaviours.
In this year’s advice, we have developed three exploratory scenarios that reach
Net Zero emissions by 2050 in quite different ways, illustrating the range of
pathways that are currently available. We also present a further, highly optimistic,
scenario that enables Net Zero to be achieved prior to 2050. This allows exploration
of a range of approaches over the next three decades.
We use these scenarios to guide judgements on the achievable and sensible pace
of decarbonisation in the face of uncertainty, and to understand how less success
in one area can be compensated for elsewhere. The scenarios are also useful for
monitoring progress subsequently (see section 5 of Chapter 10).
Box 1.2 The Committee’s 2019 Further Ambition scenario
In determining our 2019 advice on whether the UK could reach Net Zero emissions by
2050, we developed a Further Ambition scenario as a snapshot of sources and sinks of
emissions in the UK by 2050 (Figure B1.2). This scenario was specific about how 96% of the
emissions reductions could be achieved, compared to emissions in 1990, but noted that
multiple options were available for achieving the last 4% of emissions reductions, including
additional engineered removals, further innovation and further behaviour change.
Our scenarios explore different ways of getting to Net Zero.
We go beyond our 2019 Further Ambition scenario, which underpinned the Net Zero advice.
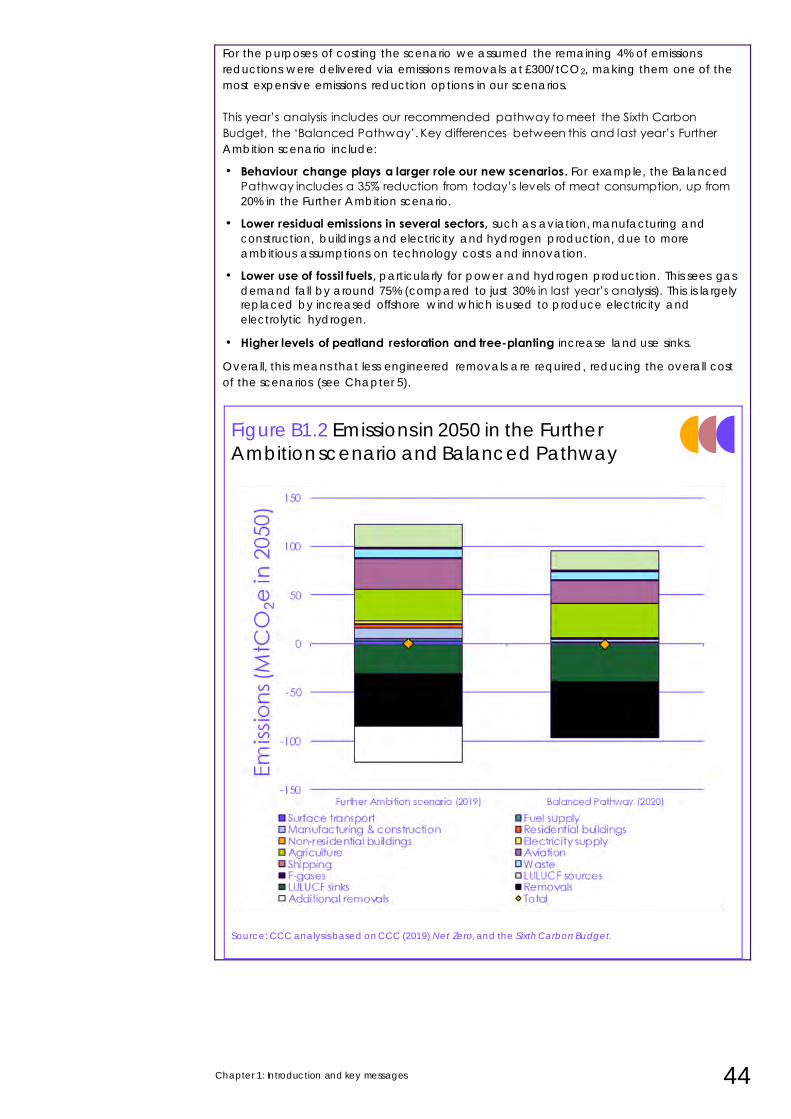
Chapter 1: Introduction and key messages 44
For the purposes of costing the scenario we assumed the remaining 4% of emissions
reductions were delivered via emissions removals at £300/tCO2, making them one of the
most expensive emissions reduction options in our scenarios.
This year’s analysis includes our recommended pathway to meet the Sixth Carbon
Budget, the ‘Balanced Pathway’. Key differences between this and last year’s Further
Ambition scenario include:
• Behaviour change plays a larger role our new scenarios. For example, the Balanced
Pathway includes a 35% reduction from today’s levels of meat consumption, up from
20% in the Further Ambition scenario.
• Lower residual emissions in several sectors, such as aviation, manufacturing and
construction, buildings and electricity and hydrogen production, due to more
ambitious assumptions on technology costs and innovation.
• Lower use of fossil fuels, particularly for power and hydrogen production. This sees gas
demand fall by around 75% (compared to just 30% in last year’s ana lysis). This is largely replaced by increased offshore wind which is used to produce electricity and
electrolytic hydrogen.
• Higher levels of peatland restoration and tree-planting increase land use sinks.
Overall, this means that less engineered removals are required, reducing the overall cost
of the scenarios (see Chapter 5).
Figure B1.2 Emissions in 2050 in the Further
Ambition scenario and Balanced Pathway
Source: CCC analysis based on CCC (2019) Net Zero, and the Sixth Carbon Budget.
45 Sixth Carbon Budget – The path to Net Zero
b) Our exploratory scenarios to reach Net Zero
Our 2019 Further Ambition scenario made relatively conservative assumptions on
the extent of cost reductions as a result of innovation, and on societal and
behavioural change. Making conservative assumptions was appropriate in the
context of setting the target, as it was important to ensure a legally binding target
could be met. But in the context of achieving Net Zero, and setting a pathway to
match, we must consider how success can be maximised on these fronts.
Greater contributions from societal/behavioural change and from innovation
would reduce the challenges in achieving Net Zero emissions by 2050, by reducing
emitting activities (e.g. flying, livestock farming) and making emissions reduction
cheaper and/or easier. The Government should therefore ensure that policy
frameworks are designed in a way that encourages both behavioural change and
innovation to contribute strongly to decarbonisation.
However, even with well-designed policies, it remains uncertain how large a
contribution each will make. Our scenarios therefore reflect potential ranges for
their contributions, together with the sets of choices (e.g. on HGVs and low-carbon
heat) that are necessary in this decade.
• Societal and behavioural change across all scenarios illustrates how
choices by people and businesses can affect emissions. In many cases
these align with the findings of the recent Climate Assembly (Table 1.2).
• Innovation. The costs and efficiencies of low-carbon technologies varies in
our scenarios, according to the latest available evidence and projections
for these technologies.
• Choices are also prevalent in our scenarios, where the clearest low-carbon
option is not currently evident. For example, in some scenarios hydrogen
takes the place of electrification in HGVs and in some home heating.
Similarly, our scenarios also try to reflect preferences, such as a preference
for nature-based removals over engineered removals in the Widespread
Engagement scenario, or the use of synthetic fuels in aviation instead of
only offsetting aviation emissions via emission removals.
As a general principle, consistent with the preferences expressed in the Climate
Assembly,1 our pathways prioritise emissions reductions where known solutions exist
and thereby minimise the use of greenhouse gas removals. This will tend to lead to
lower overall cumulative UK emissions and limit risks of over-reliance on being able
to deploy removals sustainably at scale.
We initially constructed three ‘exploratory’ scenarios that reach Net Zero by 2050,
one of which is similar to Further Ambition while the other two are more optimistic
either on developments regarding behavioural change or improvements in
technology costs and performance (Figure 1.2). Although to some extent these
reflect choices on the way to Net Zero, they primarily reflect greater or lesser
degrees of success on key policy priorities on the path to Net Zero – engagement
of the public and businesses, and innovation:
• In the Headwinds scenario, we have assumed that policies only manage to
bring forward societal/behavioural change and innovation at the lesser
end of the scale, similar to levels assumed in our 2019 Further Ambition
scenario. People change their behaviour and new technologies develop,
but we do not see widespread behavioural shifts or innovations that
significantly reduce the cost of green technologies ahead of our current
projections. This scenario is more reliant on the use of large hydrogen and
carbon capture and storage (CCS) infrastructure to achieve Net Zero
Exploring how to meet Net Zero means looking at bolder assumptions on behaviour and innovation.
When setting the Net Zero target, we erred on the side of caution.
Our scenarios also explore choices around how to reach Net Zero.
Our pathways use known solutions where they exist and minimise use of greenhouse gas removals.
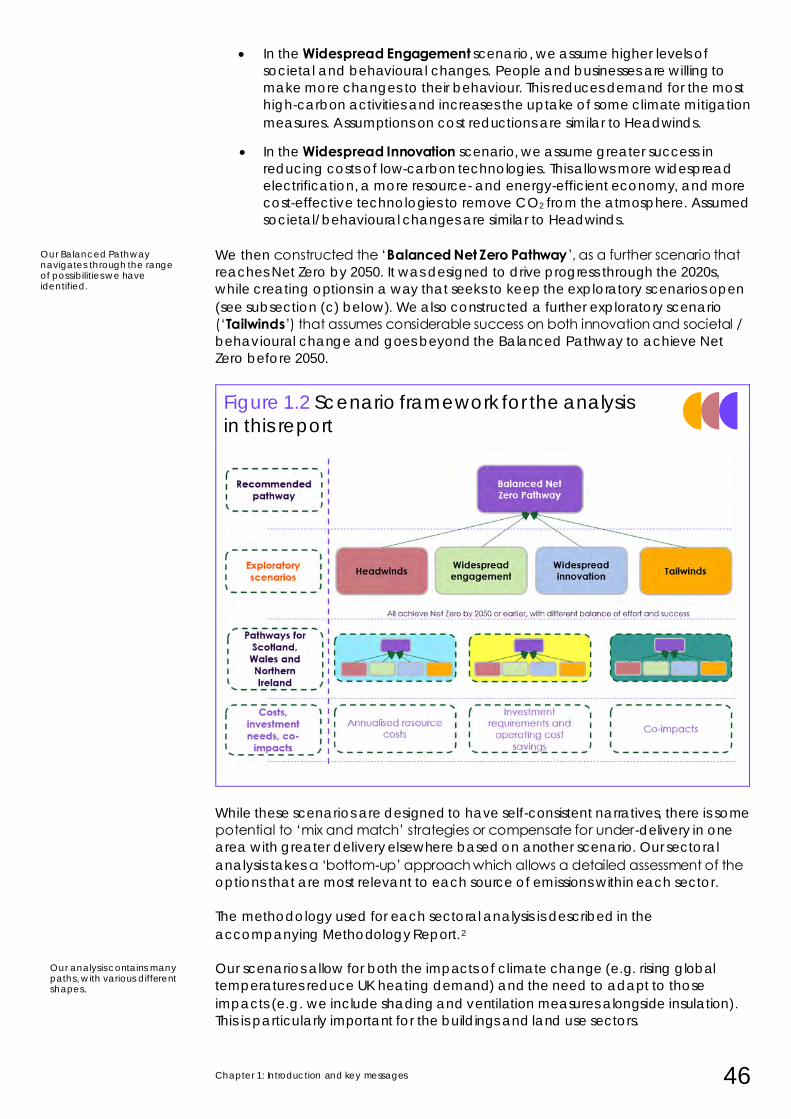
Chapter 1: Introduction and key messages 46
• In the Widespread Engagement scenario, we assume higher levels of
societal and behavioural changes. People and businesses are willing to
make more changes to their behaviour. This reduces demand for the most
high-carbon activities and increases the uptake of some climate mitigation
measures. Assumptions on cost reductions are similar to Headwinds.
• In the Widespread Innovation scenario, we assume greater success in
reducing costs of low-carbon technologies. This allows more widespread
electrification, a more resource- and energy-efficient economy, and more
cost-effective technologies to remove CO2 from the atmosphere. Assumed
societal/behavioural changes are similar to Headwinds.
We then constructed the ‘Balanced Net Zero Pathway’, as a further scenario that
reaches Net Zero by 2050. It was designed to drive progress through the 2020s,
while creating options in a way that seeks to keep the exploratory scenarios open
(see subsection (c) below). We also constructed a further exploratory scenario
(‘Tailwinds’) that assumes considerable success on both innovation and societal /
behavioural change and goes beyond the Balanced Pathway to achieve Net
Zero before 2050.
Figure 1.2 Scenario framework for the analysis
in this report
While these scenarios are designed to have self-consistent narratives, there is some
potential to ‘mix and match’ strategies or compensate for under-delivery in one
area with greater delivery elsewhere based on another scenario. Our sectoral
analysis takes a ‘bottom-up’ approach which allows a detailed assessment of the
options that are most relevant to each source of emissions within each sector.
The methodology used for each sectoral analysis is described in the
accompanying Methodology Report.2
Our scenarios allow for both the impacts of climate change (e.g. rising global
temperatures reduce UK heating demand) and the need to adapt to those
impacts (e.g. we include shading and ventilation measures alongside insulation).
This is particularly important for the buildings and land use sectors.
Our Balanced Pathway navigates through the range of possibilities we have identified.
Our analysis contains many paths, with various different shapes.
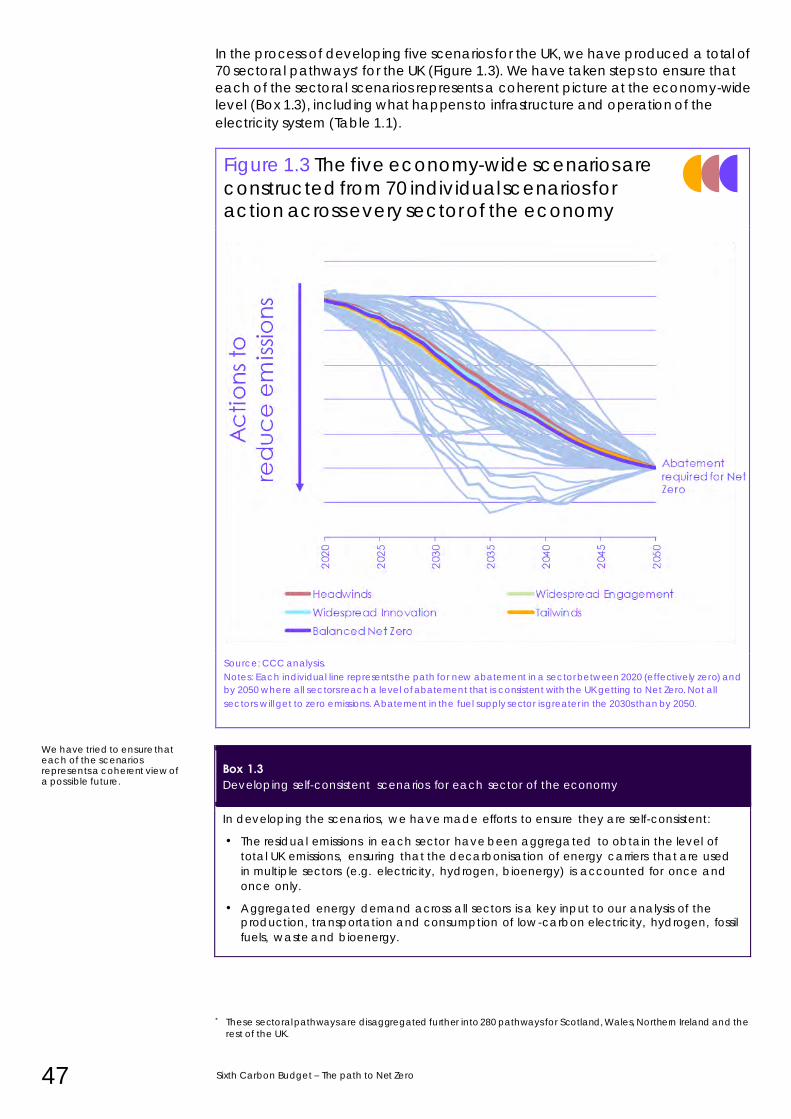
47 Sixth Carbon Budget – The path to Net Zero
In the process of developing five scenarios for the UK, we have produced a total of
70 sectoral pathways* for the UK (Figure 1.3). We have taken steps to ensure that
each of the sectoral scenarios represents a coherent picture at the economy-wide
level (Box 1.3), including what happens to infrastructure and operation of the
electricity system (Table 1.1).
Figure 1.3 The five economy-wide scenarios are
constructed from 70 individual scenarios for action across every sector of the economy
Source: CCC analysis.
Notes: Each individual line represents the path for new abatement in a sector between 2020 (effectively zero) and
by 2050 where all sectors reach a level of abatement that is consistent with the UK getting to Net Zero. Not all
sectors will get to zero emissions. Abatement in the fuel supply sector is greater in the 2030s than by 2050.
Box 1.3 Developing self-consistent scenarios for each sector of the economy
In developing the scenarios, we have made efforts to ensure they are self-consistent:
• The residual emissions in each sector have been aggregated to obtain the level of
total UK emissions, ensuring that the decarbonisation of energy carriers that are used
in multiple sectors (e.g. electricity, hydrogen, bioenergy) is accounted for once and
once only.
• Aggregated energy demand across all sectors is a key input to our analysis of the production, transportation and consumption of low-carbon electricity, hydrogen, fossil
fuels, waste and bioenergy.
* These sectoral pathways are disaggregated further into 280 pathways for Scotland, Wales, Northern Ireland and the
rest of the UK.
We have tried to ensure that each of the scenarios represents a coherent view of a possible future.
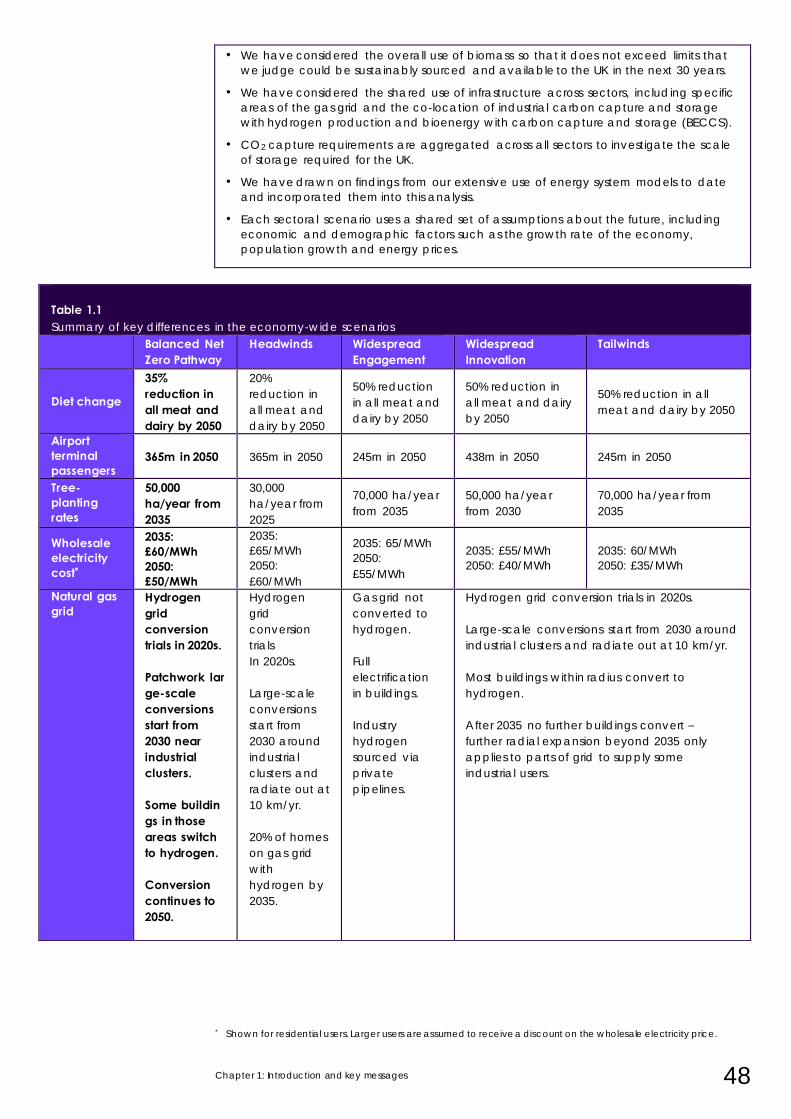
Chapter 1: Introduction and key messages 48
• We have considered the overall use of biomass so that it does not exceed limits that
we judge could be sustainably sourced and available to the UK in the next 30 years.
• We have considered the shared use of infrastructure across sectors, including specific
areas of the gas grid and the co-location of industrial carbon capture and storage
with hydrogen production and bioenergy with carbon capture and storage (BECCS).
• CO2 capture requirements are aggregated across all sectors to investigate the scale
of storage required for the UK.
• We have drawn on findings from our extensive use of energy system models to date
and incorporated them into this analysis.
• Each sectoral scenario uses a shared set of assumptions about the future, including
economic and demographic factors such as the growth rate of the economy,
population growth and energy prices.
* Shown for residential users. Larger users are assumed to receive a discount on the wholesale electricity price.
Table 1.11:Table 1.11 Table 1.1 Summary of key differences in the economy-wide scenarios
Balanced Net Zero Pathway
Headwinds Widespread Engagement
Widespread Innovation
Tailwinds
Diet change
35% reduction in all meat and dairy by 2050
20%
reduction in
all meat and
dairy by 2050
50% reduction
in all meat and
dairy by 2050
50% reduction in
all meat and dairy
by 2050
50% reduction in all
meat and dairy by 2050
Airport terminal passengers
365m in 2050 365m in 2050 245m in 2050 438m in 2050 245m in 2050
Tree-planting rates
50,000 ha/year from 2035
30,000
ha/year from
2025
70,000 ha/year
from 2035
50,000 ha/year
from 2030
70,000 ha/year from
2035
Wholesale electricity cost*
2035: £60/MWh 2050: £50/MWh
2035:
£65/MWh
2050:
£60/MWh
2035: 65/MWh
2050:
£55/MWh
2035: £55/MWh
2050: £40/MWh
2035: 60/MWh
2050: £35/MWh
Natural gas grid
Hydrogen grid conversion trials in 2020s. Patchwork large-scale conversions start from 2030 near industrial clusters. Some buildings in those areas switch to hydrogen. Conversion continues to 2050.
Hydrogen
grid
conversion
trials
In 2020s.
Large-scale
conversions
start from
2030 around
industrial
clusters and
radiate out at
10 km/yr.
20% of homes
on gas grid
with
hydrogen by
2035.
Gas grid not
converted to
hydrogen.
Full
electrification
in buildings.
Industry
hydrogen
sourced via
private
pipelines.
Hydrogen grid conversion trials in 2020s.
Large-scale conversions start from 2030 around
industrial clusters and radiate out at 10 km/yr.
Most buildings within radius convert to
hydrogen.
After 2035 no further buildings convert –
further radial expansion beyond 2035 only
applies to parts of grid to supply some
industrial users.
49 Sixth Carbon Budget – The path to Net Zero
c) A Balanced Net Zero Pathway The multiple scenarios we present in this advice provide an illustration of the various
ways that we can pursue emissions reductions on a path to Net Zero. However, the
implied flexibility on how to deliver it does not mean the near-term path is unclear.
Many steps can be taken with confidence in the next decade and should begin
immediately. Our ‘Balanced Net Zero Pathway’ is informed by the range of
solutions across the ‘exploratory’ scenarios, that would put the UK on track to Net
Zero and would meet the recommended carbon budget. This pathway:
• Represents a sensible strategy to underpin policy on over the coming years,
based on known technologies and behaviours, with potential to be
adapted as we learn more about the most effective ways to cut emissions
(see the Policy Report).
• Takes a whole-system approach to decarbonisation, reflecting the range of
opportunities across behaviour, efficiency, land, low-carbon energy supply
and end-use technologies, and how these potentially interact.
• Develops key options for decarbonisation in the 2030s and 2040s, with
action in the 2020s, accepting that some things will not work but that it is
necessary to try things out to find the best options and develop effective
policies.
• Includes some measures that are not cost-effective when considering only
emissions reductions, where they support other objectives (e.g. some
higher-cost improvements to energy efficiency of homes, due to benefits to
fuel poverty, health and employment).
• Is designed to be delivered in a way that works for people – reflects their
priorities and choices, and aligns very well to the preferences expressed by
the Climate Assembly,3 which was called by six Select Committees of the
House of Commons to understand public views on how the UK should
tackle climate change (Table 1.2).
• Works in the real world and at the local level, providing good quality jobs,
and benefits to health and wellbeing.
• Allows time for societal choices to contribute and the necessary scale-up of
supply chains, skills, business models and infrastructure during the 2020s.
• Puts the UK on track to Net Zero, and supports the required global path for
decarbonisation (see Chapter 7) by reflecting the highest possible ambition
on emissions reduction as a necessary contribution the Paris Agreement.
The Balanced Net Zero Pathway is plausible based on our assessment. An
alternative strategy that delivers the same emissions reductions in different ways,
with less in one area compensated by more elsewhere, would also meet the
recommended budget. Our wider set of scenarios illustrate different pathways that
could help to achieve the budget and get on track to meeting Net Zero (see
subsection b) above). However, there is a series of actions that need to be taken
now, irrespective of the choices that we make later, and a continuing programme
to be fulfilled if those later choices are to remain open. More generally, the need
to act on climate change and to reach Net Zero emissions is now widely
recognised in businesses.
Many UK businesses have set their own Net Zero goals and stand ready to transition
to the new technologies, behaviours and business models required.
In that context, the most positive economic strategy is to proceed with ‘highest
possible ambition’, as required by the Paris Agreement.
In our assessment, the Balanced Pathway is right for the climate and for the UK.
The Balanced Pathway is challenging but feasible.
Business will be key in delivering the Sixth Carbon Budget.
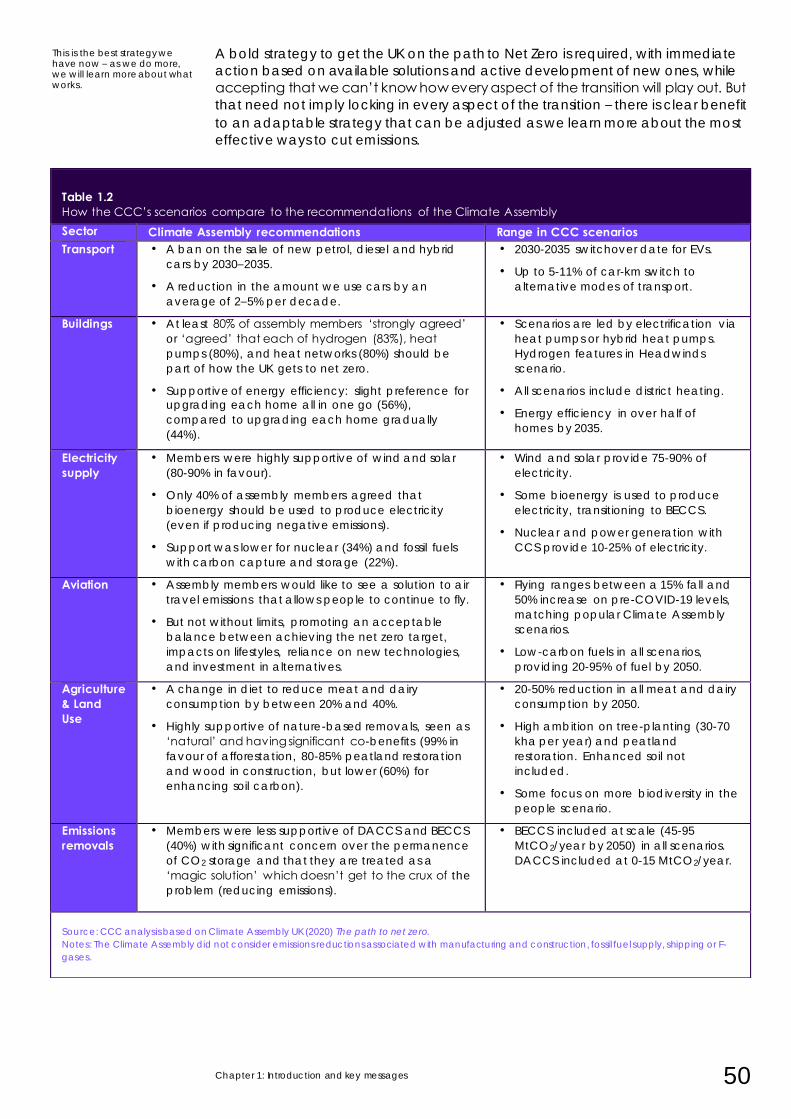
Chapter 1: Introduction and key messages 50
A bold strategy to get the UK on the path to Net Zero is required, with immediate
action based on available solutions and active development of new ones, while
accepting that we can’t know how every aspect of the transition will play out. But
that need not imply locking in every aspect of the transition – there is clear benefit
to an adaptable strategy that can be adjusted as we learn more about the most
effective ways to cut emissions.
Table 1.11:Table 1.11
Table 1.2 How the CCC’s scenarios compare to the recommendations of the Climate Assembly
Sector Climate Assembly recommendations Range in CCC scenarios Transport • A ban on the sale of new petrol, diesel and hybrid
cars by 2030–2035.
• A reduction in the amount we use cars by an
average of 2–5% per decade.
• 2030-2035 switchover date for EVs.
• Up to 5-11% of car-km switch to
alternative modes of transport.
Buildings • At least 80% of assembly members ‘strongly agreed’
or ‘agreed’ that each of hydrogen (83%), heat
pumps (80%), and heat networks (80%) should be
part of how the UK gets to net zero.
• Supportive of energy efficiency: slight preference for upgrading each home all in one go (56%),
compared to upgrading each home gradually
(44%).
• Scenarios are led by electrification via
heat pumps or hybrid heat pumps.
Hydrogen features in Headwinds
scenario.
• All scenarios include district heating.
• Energy efficiency in over half of
homes by 2035.
Electricity supply
• Members were highly supportive of wind and solar
(80-90% in favour).
• Only 40% of assembly members agreed that
bioenergy should be used to produce electricity
(even if producing negative emissions).
• Support was lower for nuclear (34%) and fossil fuels
with carbon capture and storage (22%).
• Wind and solar provide 75-90% of
electricity.
• Some bioenergy is used to produce
electricity, transitioning to BECCS.
• Nuclear and power generation with
CCS provide 10-25% of electricity.
Aviation • Assembly members would like to see a solution to air
travel emissions that allows people to continue to fly.
• But not without limits, promoting an acceptable
balance between achieving the net zero target,
impacts on lifestyles, reliance on new technologies,
and investment in alternatives.
• Flying ranges between a 15% fall and
50% increase on pre-COVID-19 levels,
matching popular Climate Assembly
scenarios.
• Low-carbon fuels in all scenarios,
providing 20-95% of fuel by 2050.
Agriculture & Land Use
• A change in diet to reduce meat and dairy
consumption by between 20% and 40%.
• Highly supportive of nature-based removals, seen as
‘natural’ and having significant co-benefits (99% in
favour of afforestation, 80-85% peatland restoration
and wood in construction, but lower (60%) for
enhancing soil carbon).
• 20-50% reduction in all meat and dairy
consumption by 2050.
• High ambition on tree-planting (30-70
kha per year) and peatland
restoration. Enhanced soil not
included.
• Some focus on more biodiversity in the
people scenario.
Emissions removals
• Members were less supportive of DACCS and BECCS
(40%) with significant concern over the permanence
of CO2 storage and that they are treated as a
‘magic solution’ which doesn’t get to the crux of the
problem (reducing emissions).
• BECCS included at scale (45-95
MtCO2/year by 2050) in all scenarios.
DACCS included at 0-15 MtCO2/year.
Source: CCC analysis based on Climate Assembly UK (2020) The path to net zero.
Notes: The Climate Assembly did not consider emissions reductions associated with manufacturing and construction, fossil fuel supply, shipping or F-
gases.
This is the best strategy we have now – as we do more, we will learn more about what works.
51 Sixth Carbon Budget – The path to Net Zero
5. Our approach to advice on the Sixth Carbon Budget
This report is based on an extensive programme of analysis, consultation and
consideration by the Committee and its staff, building on the evidence published
last year for our Net Zero advice. That programme has addressed the requirements
set out for the Committee in the Climate Change Act.
It aims to set a platform to support the UK Government in taking confident
decisions on the budget and the actions required to deliver it. Doing so can fulfil
the UK’s commitments on climate change, support investment and job creation by
businesses in the UK, deliver on priorities of UK citizens and support the UK’s positive
place in the world.
The outputs of the work, including our public Call for Evidence, several new
research projects, three expert advisory groups, detailed datasets and deep dives
into the roles of local authorities and businesses, are published on our website
(www.theccc.org.uk) and explained in the four parts of this report and its
accompanying Methodology and Policy Reports.
a) The requirements of the Climate Change Act
The Climate Change Act requires the Committee to provide advice on the Sixth
Carbon Budget by the end of 2020. The Government is then required to legislate
the carbon budget by the end of June 2021, and to produce proposals and
policies to meet it ‘as soon as is reasonably practicable’ thereafter.
The carbon budget must be set with a view to meeting the 2050 target, which is
now set in legislation as an emissions reduction of ‘at least 100%’ (i.e. Net Zero).
In recommending carbon budgets, the Committee is required by the Act to take
into account a range of considerations. These are designed to ensure that action
to tackle climate change contributes fully to the global effort, while supporting
other Government objectives. Below we outline these considerations, and where
within the report they are addressed:
• Scientific knowledge about climate change. We set out in Chapter 8 the
updated state of knowledge on the science of climate change, which
remains similar to that when providing the advice on Net Zero.
Considerations relating to cumulative emissions inform our assessment for
the appropriate shape of the emissions path on the way to Net Zero
(Chapter 9).
• Technology relevant to climate change. Our scenarios, set out in Part 1 of
the report (i.e. Chapters 2 and 3), take into account the potential roles,
costs and interactions between the various technologies that can help to
reduce emissions. One of these, the Balanced Net Zero Pathway provides
the basis for our recommended level for the carbon budget.
• Economic circumstances, and in particular the likely impact of the decision on the economy and the competitiveness of particular sectors of the economy. Quantitative and qualitative assessments of the economic
transition through the Sixth Carbon Budget on the path to Net Zero are set
out in Part 2 of the report (i.e. Chapters 5 and 6). Competitiveness is
addressed both within our scenario design and specifically in Chapter 6.
We have considered all of the aspects required by the Climate Change Act.
The Sixth Carbon Budget can be the platform for a step-change in climate action.
Chapter 1: Introduction and key messages 52
• Fiscal circumstances, and in particular the likely impact of the decision on taxation, public spending and public borrowing. Part 2 addresses the costs
and investment requirements of the transition, and what choices over how
to fund decarbonisation might mean for the Government’s fiscal position.
• Social circumstances, and in particular the likely impact of the decision on fuel poverty. We consider a range of social circumstances in Part 2 of the
advice, including fuel poverty, impact on employment and health co-
benefits. Our scenarios (Part 1) include some measures that are not cost-
effective when only considering emissions reductions, where they support
these wider objectives.
• Energy policy, and in particular the likely impact of the decision on energy supplies and the carbon and energy intensity of the economy. By design,
our scenarios set out in Part 1 of the report maintain security of electricity
supply at similar levels to those required today. Chapter 2 sets out the
impact of the recommended budget for emissions and energy
consumption, including the reduced dependence on imported oil and gas.
• Differences in circumstances between England, Wales, Scotland and Northern Ireland under our scenarios are set out in Chapter 4, as well as
what our UK-wide pathways mean for emissions in each part of the UK.
• Circumstances at European and international level. We consider the role of
the UK in the global effort to tackle climate change in Chapter 7, including
the UK’s commitments under the Paris Agreement and the benefits of UK
leadership in the run up to COP26 in Glasgow in November 2021.
• The estimated amount of reportable emissions from international aviation and international shipping for the budgetary period or periods in question. Emissions from these sectors under our scenarios are set out in Chapter 3,
while considerations on how these affect the recommendation on the Sixth
Carbon Budget are set out in Chapter 10.
As well as the recommended level of the Sixth Carbon Budget, the Act also
requires this advice to cover:
• Whether and how emissions from international aviation and international
shipping can be formally included in the carbon budgets;
• The role of international emissions credits (known as ‘carbon units’ under
the Act);
• The opportunities for emissions reduction in particular sectors; and
• The balance of emissions in the sectors that have been covered to-date by
the EU ETS as against those outside.
All of these matters are addressed in our recommendations in Chapter 10.
53 Sixth Carbon Budget – The path to Net Zero
Supporting evidence and publications
In support of the advice in this report, we have also produced
• A Methodology Report, setting out the evidence and methodology behind
the scenarios presented in Part 1 of this report.4
• A Policy Report, setting out the changes to policy that could drive the
changes necessary particularly over the 2020s.5
• A dataset for the Sixth Carbon Budget scenarios, which sets out more
details and data on the pathways than can be included in this report.
We are also publishing a set of other documents alongside these reports (Box 1.3).
In December 2019, we published a call for evidence on the Sixth Carbon Budget,
which ran until February 2020. We received 177 responses, and published each of
these, together with a summary document, in July 2020. We have also undertaken
a wide range of engagement as an input to our advice (Figure 1.4 and Box 1.4).6
Box 1.3 New evidence and new CCC research
In our work for the Sixth Carbon Budget we engaged with a range of experts to ensure
that our analysis reflects up-to-date evidence wherever possible, building on the
evidence we produced alongside our Net Zero report in 2019. In addition to the Call for
Evidence (Box 1.4) new evidence and research collected for this report includes:
• Three Expert Advisory Group reports on: the health co-benefits of the actions in our
Sixth Carbon Budget scenarios, financing the investment required in our scenarios and
how cross-cutting policy interventions can accelerate a transition to Net Zero.
• Research and engagement with the UK’s business community, culminating in a series
of briefing notes on enabling business to take a full role in Net Zero.
• An in-depth report on how local and regional Government can deliver the UK’s Net
Zero ambition.
• Consultancy reports on the UK’s international climate influence, heat in buildings,
energy efficiency in buildings, deep decarbonisation in industry, industry policy, heavy
goods vehicles, agricultural abatement, land use modelling, low-carbon hydrogen
and macroeconomic modelling.
• Expert roundtable discussions on electricity market design, phase-out of unabated
gas-fired generation, industrial decarbonisation policy, digitalisation, emissions removals, arable yield improvements and policy for buildings decarbonisation,
including a published summary of the removals discussion.
New evidence is summarised in Boxes in this report and the accompanying Policy and
Methodology reports, with significant further detail available in the published materials on
the Committee’s Sixth Carbon Budget webpage.
Other outputs more fully present the rich analysis that has gone into this advice.
Our advice has drawn on extensive consultation and stakeholder input.
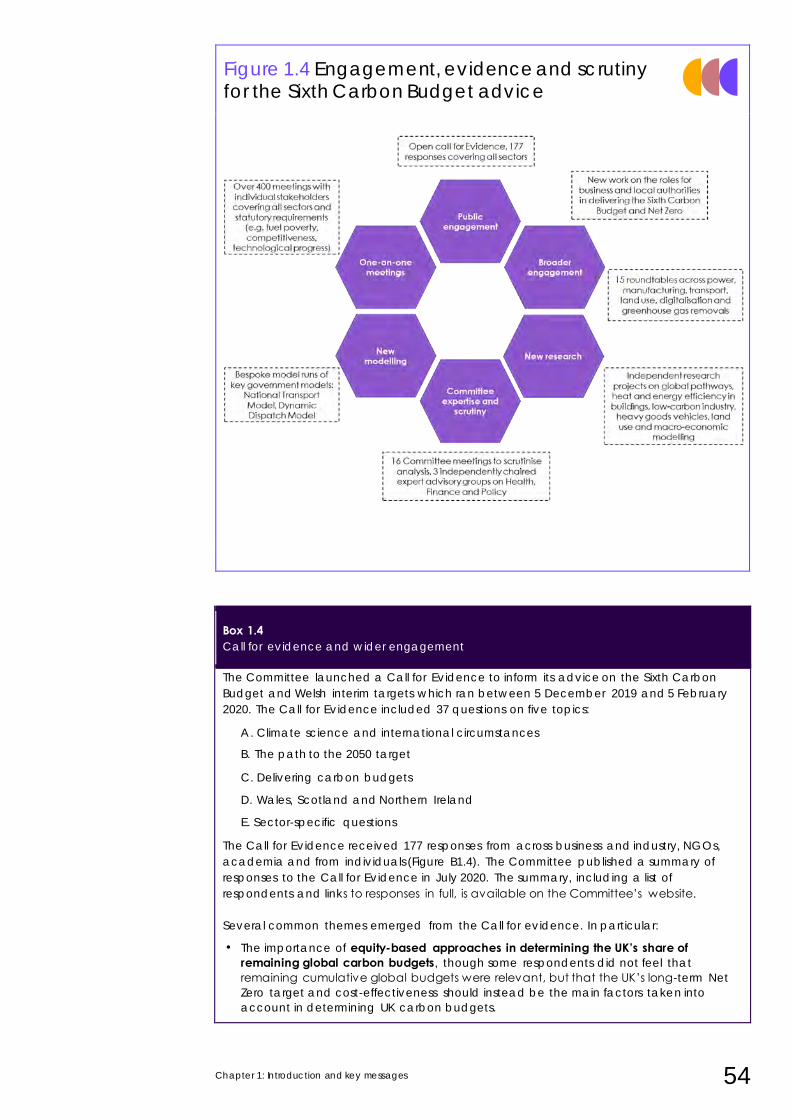
Chapter 1: Introduction and key messages 54
Figure 1.4 Engagement, evidence and scrutiny for the Sixth Carbon Budget advice
Box 1.4 Call for evidence and wider engagement
The Committee launched a Call for Evidence to inform its advice on the Sixth Carbon
Budget and Welsh interim targets which ran between 5 December 2019 and 5 February
2020. The Call for Evidence included 37 questions on five topics:
A. Climate science and international circumstances
B. The path to the 2050 target
C. Delivering carbon budgets
D. Wales, Scotland and Northern Ireland
E. Sector-specific questions
The Call for Evidence received 177 responses from across business and industry, NGOs,
academia and from individuals (Figure B1.4). The Committee published a summary of
responses to the Call for Evidence in July 2020. The summary, including a list of
respondents and links to responses in full, is available on the Committee’s website.
Several common themes emerged from the Call for evidence. In particular:
• The importance of equity-based approaches in determining the UK’s share of remaining global carbon budgets, though some respondents did not feel that
remaining cumulative global budgets were relevant, but that the UK’s long-term Net
Zero target and cost-effectiveness should instead be the main factors taken into
account in determining UK carbon budgets.
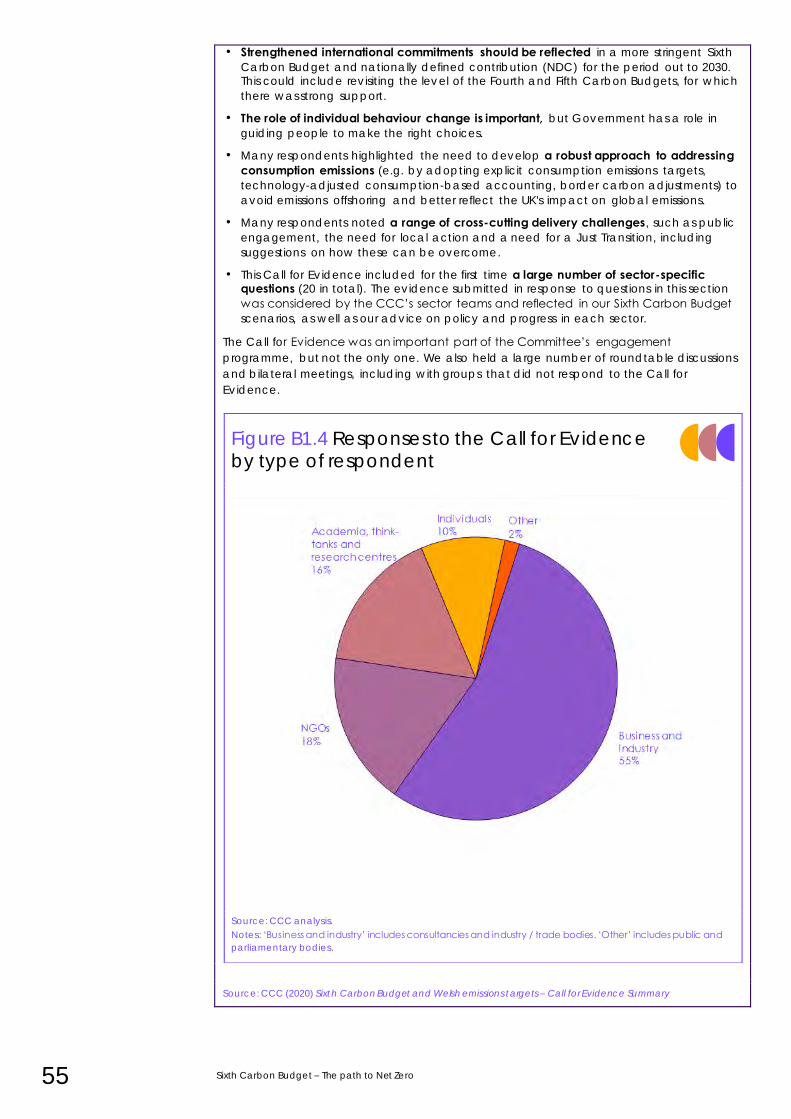
55 Sixth Carbon Budget – The path to Net Zero
• Strengthened international commitments should be reflected in a more stringent Sixth
Carbon Budget and nationally defined contribution (NDC) for the period out to 2030. This could include revisiting the level of the Fourth and Fifth Carbon Budgets, for which
there was strong support.
• The role of individual behaviour change is important, but Government has a role in
guiding people to make the right choices.
• Many respondents highlighted the need to develop a robust approach to addressing consumption emissions (e.g. by adopting explicit consumption emissions targets,
technology-adjusted consumption-based accounting, border carbon adjustments) to
avoid emissions offshoring and better reflect the UK's impact on global emissions.
• Many respondents noted a range of cross-cutting delivery challenges, such as public
engagement, the need for local action and a need for a Just Transition, including
suggestions on how these can be overcome.
• This Call for Evidence included for the first time a large number of sector-specific questions (20 in total). The evidence submitted in response to questions in this section
was considered by the CCC’s sector teams and reflected in our Sixth Carbon Budget
scenarios, as well as our advice on policy and progress in each sector.
The Call for Evidence was an important part of the Committee’s engagement
programme, but not the only one. We also held a large number of roundtable discussions
and bilateral meetings, including with groups that did not respond to the Call for
Evidence.
Figure B1.4 Responses to the Call for Evidence by type of respondent
Source: CCC analysis.
Notes: ‘Business and industry’ includes consultancies and industry / trade bodies. ‘Other’ includes public and
parliamentary bodies.
Source: CCC (2020) Sixth Carbon Budget and Welsh emissions targets – Call for Evidence Summary
Chapter 1: Introduction and key messages 56
1 Climate Assembly UK (2020) The path to Net Zero
2 CCC (2020) The Sixth Carbon Budget – Methodology Report 3 See 1
4 CCC (2020) The Sixth Carbon Budget – Methodology Report
5 CCC (2020) Policies for the Sixth Carbon Budget and Net Zero
6 CCC (2020) Sixth Carbon Budget and Welsh Emissions Targets Call for Evidence Summary.
57 Sixth Carbon Budget – The path to Net Zero
The UK path to Net Zero
1. The Balanced Pathway to Net Zero for the UK 60
2. Alternative pathways to Net Zero by 2050 77
3. Can the UK achieve Net Zero significantly before 2050? 87

59 Sixth Carbon Budget – The path to Net Zero
Introduction and key messages
The value of carbon budgets is in guiding action to reduce emissions on the path
to the UK’s long-term Net Zero target.
This chapter sets out how our recommended Sixth Carbon Budget (requiring a 78%
reduction from 1990 to 2035, a 63% reduction relative to 2019) can be met on the
pathway to Net Zero, based on the detailed bottom-up scenarios that the
Committee has developed.
Our key messages are:
• The UK’s emissions fell by around 40% (365 MtCO2e) in the last three
decades. In the next three decades, emissions must fall by 100% (522
MtCO2e) to achieve the Net Zero goal.
• The Balanced Net Zero Pathway – the basis for our Sixth Carbon Budget
recommendation – represents a decisive transition to Net Zero with over
60% of the necessary reduction to Net Zero achieved in the coming 15
years.
• This will require systematic changes in consumer and business behaviours,
our energy system, carbon capture and storage and how our land is used.
• Success is contingent on taking actions in the 2020s across every sector of
the economy.
• There is flexibility to meet Net Zero in different ways depending on societal
changes and technologies. Some sectors face key decision points in the
2020s.
• Our Tailwinds scenario gets to Net Zero in 2042 but it is a highly optimistic
scenario, stretching feasibility in a wide range of areas and going beyond
the current evidence in others.
Chapter 3 provides more detail sector by sector while Chapter 4 sets out pathways
for Scotland, Wales and Northern Ireland. Costs and impacts of the scenarios are
set out in Chapters 5 and 6. Chapter 9 explains why this is the right pace of action
to be on track to Net Zero and meet our commitments under the Paris Agreement.
The accompanying Policy Report sets out the policy priorities to deliver the actions
required to meet the recommended carbon budget.
This Chapter is set out in three sections:
1. The Balanced Pathway to Net Zero for the UK
2. Alternative pathways to Net Zero by 2050
3. Can the UK achieve Net Zero significantly before 2050?
Chapter 2: The UK path to Net Zero 60
1. The Balanced Pathway to Net Zero for the UK
This section sets out the actions the Committee has assessed as being required in
the 2020s to get on track to Net Zero and to meet our recommended Sixth Carbon
Budget. It is set out in five parts:
a) The scale of the Net Zero challenge
b) Emissions in the Balanced Net Zero Pathway
c) Actions in the 2020s and beyond
d) Key phase out dates
e) Energy, carbon capture and storage, and land use requirements
a) The scale of the Net Zero challenge
The majority of emissions in 2018 – the most recent year for which there is an
accurate estimate of emissions for all sectors – were associated with the
combustion of fossil fuels in the ‘energy system’: electricity production, transport,
heat in buildings, and industry (Figure 2.1).
UK greenhouse gas emissions in 2019 were 522 MtCO2e.* By 2050 the UK’s net
emissions must fall by 100% from current levels to achieve Net Zero, with any
residual emissions offset by actions that remove CO2 from the atmosphere.
Emissions have fallen by 40% in the last three decades, with the most rapid progress
over the most recent decade:
• In the last three decades, UK GHG emissions have fallen at an average rate
of 13 MtCO2e per year.
• Outside of the electricity supply sector, emissions have fallen at an average
rate of just 7 MtCO2e per year.
• Progress has been quicker in recent years, primarily led by the UK’s transition
from coal-fired power generation towards low-carbon generation. Since
2012, UK emissions have fallen on average by 19 MtCO2e per year. In the
last five years emissions have fallen by 16 MtCO2e on average.
Emissions must fall more quickly to meet the Sixth Carbon Budget (by around
21 MtCO2e per year). However, the power sector can no longer be relied upon to
deliver the majority of these reductions; progress must extend to all sectors of the
economy (Figure 2.2).
* Including emissions from international aviation and shipping and accounting for upcoming changes to the inventory
regarding peatlands and global warming potentials of greenhouse gases (Box 2.1).
UK emissions have fallen by two-fifths in the last thirty years. Emissions must fall by 100% in the next thirty years.
Action must be taken in all sectors of the economy, not just the power sector.
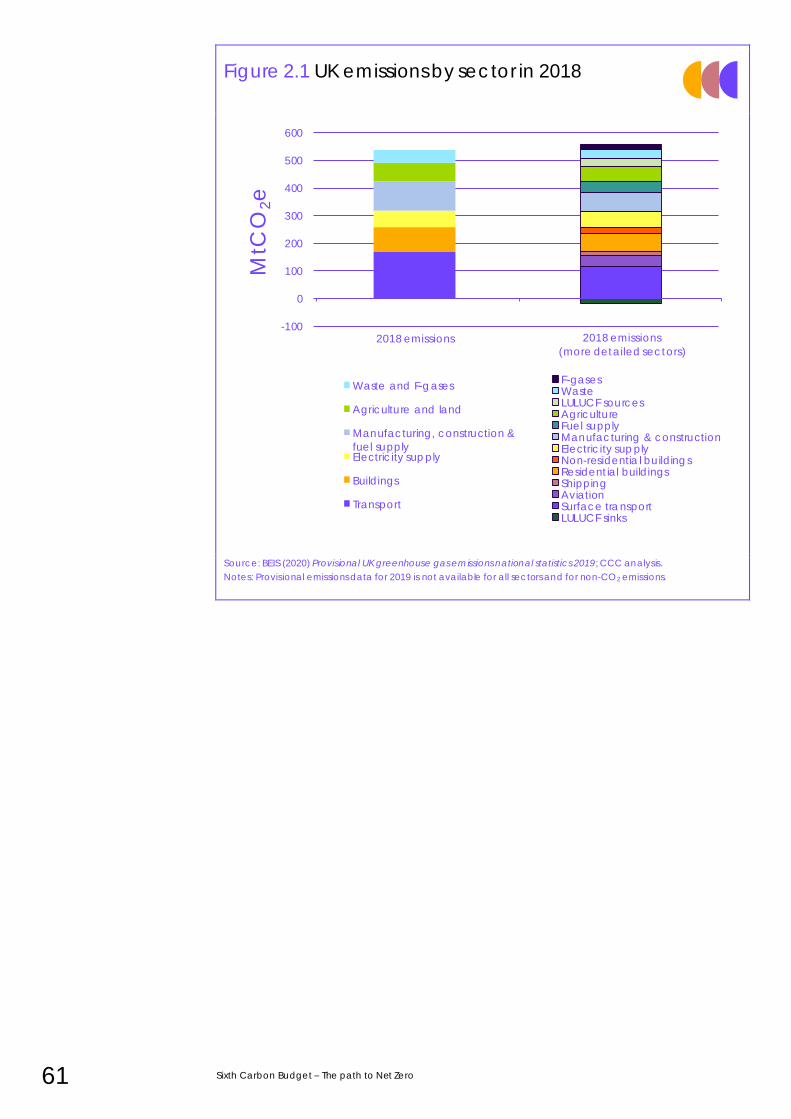
61 Sixth Carbon Budget – The path to Net Zero
Figure 2.1 UK emissions by sector in 2018
Source: BEIS (2020) Provisional UK greenhouse gas emissions national statistics 2019; CCC analysis.
Notes: Provisional emissions data for 2019 is not available for all sectors and for non-CO2 emissions.
-100
0
100
200
300
400
500
600
MtC
O2e
Waste and F-gases
Agriculture and land
Manufacturing, construction &
fuel supplyElectricity supply
Buildings
Transport
F-gasesWasteLULUCF sourcesAgricultureFuel supplyManufacturing & constructionElectricity supplyNon-residential buildingsResidential buildingsShippingAviationSurface transportLULUCF sinks
2018 emissions 2018 emissions
(more detailed sectors)
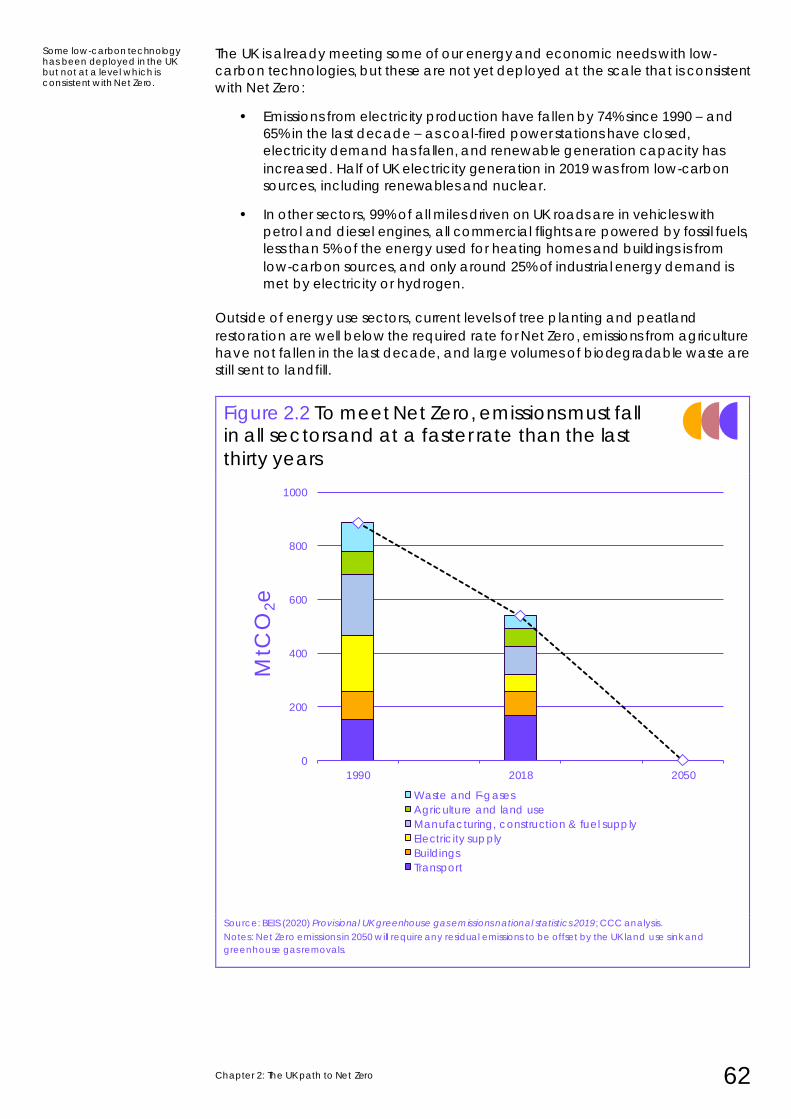
Chapter 2: The UK path to Net Zero 62
The UK is already meeting some of our energy and economic needs with low-
carbon technologies, but these are not yet deployed at the scale that is consistent
with Net Zero:
• Emissions from electricity production have fallen by 74% since 1990 – and
65% in the last decade – as coal-fired power stations have closed,
electricity demand has fallen, and renewable generation capacity has
increased. Half of UK electricity generation in 2019 was from low-carbon
sources, including renewables and nuclear.
• In other sectors, 99% of all miles driven on UK roads are in vehicles with
petrol and diesel engines, all commercial flights are powered by fossil fuels,
less than 5% of the energy used for heating homes and buildings is from
low-carbon sources, and only around 25% of industrial energy demand is
met by electricity or hydrogen.
Outside of energy use sectors, current levels of tree planting and peatland
restoration are well below the required rate for Net Zero, emissions from agriculture
have not fallen in the last decade, and large volumes of biodegradable waste are
still sent to landfill.
Figure 2.2 To meet Net Zero, emissions must fall in all sectors and at a faster rate than the last
thirty years
Source: BEIS (2020) Provisional UK greenhouse gas emissions national statistics 2019; CCC analysis.
Notes: Net Zero emissions in 2050 will require any residual emissions to be offset by the UK land use sink and
greenhouse gas removals.
Some low-carbon technology has been deployed in the UK but not at a level which is consistent with Net Zero.
0
200
400
600
800
1000
1990 2018 2050
MtC
O2e
Waste and F-gases
Agriculture and land use
Manufacturing, construction & fuel supply
Electricity supply
Buildings
Transport
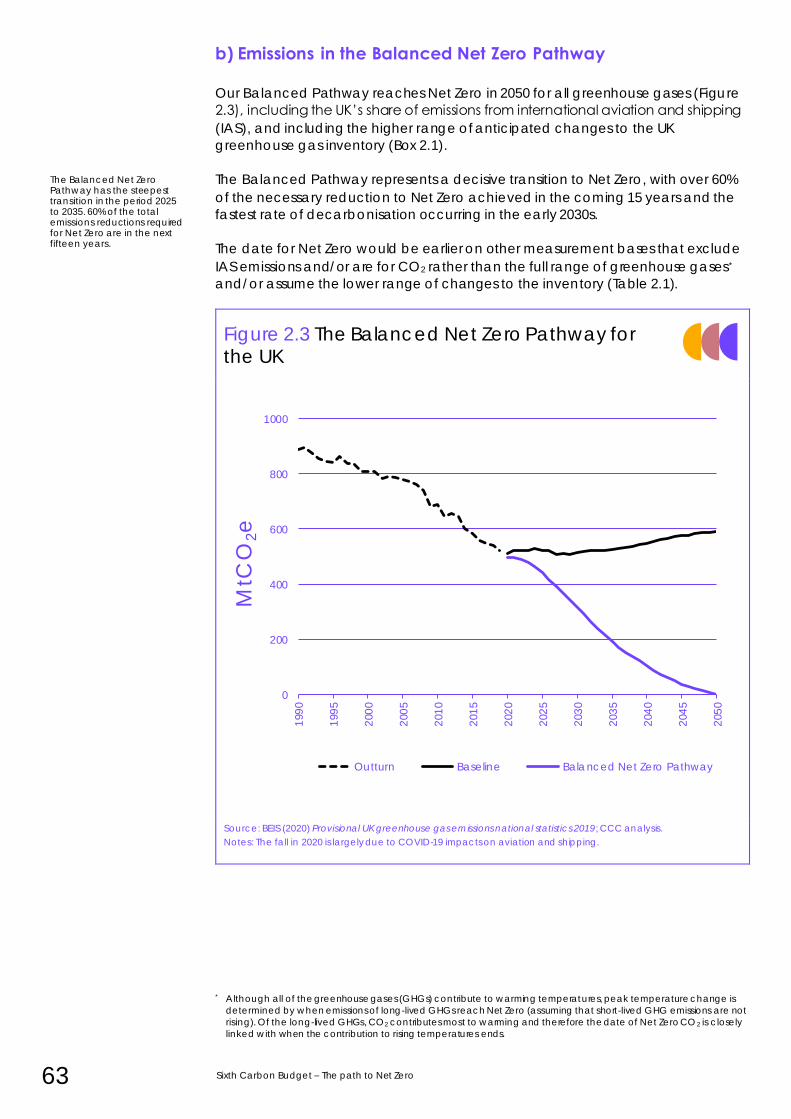
63 Sixth Carbon Budget – The path to Net Zero
b) Emissions in the Balanced Net Zero Pathway Our Balanced Pathway reaches Net Zero in 2050 for all greenhouse gases (Figure
2.3), including the UK’s share of emissions from international aviation and shipping
(IAS), and including the higher range of anticipated changes to the UK
greenhouse gas inventory (Box 2.1).
The Balanced Pathway represents a decisive transition to Net Zero, with over 60%
of the necessary reduction to Net Zero achieved in the coming 15 years and the
fastest rate of decarbonisation occurring in the early 2030s.
The date for Net Zero would be earlier on other measurement bases that exclude
IAS emissions and/or are for CO2 rather than the full range of greenhouse gases*
and/or assume the lower range of changes to the inventory (Table 2.1).
Figure 2.3 The Balanced Net Zero Pathway for the UK
Source: BEIS (2020) Provisional UK greenhouse gas emissions national statistics 2019; CCC analysis.
Notes: The fall in 2020 is largely due to COVID-19 impacts on aviation and shipping.
* Although all of the greenhouse gases (GHGs) contribute to warming temperatures, peak temperature change is
determined by when emissions of long-lived GHGs reach Net Zero (assuming that short-lived GHG emissions are not
rising). Of the long-lived GHGs, CO2 contributes most to warming and therefore the date of Net Zero CO2 is closely
linked with when the contribution to rising temperatures ends.
The Balanced Net Zero Pathway has the steepest transition in the period 2025 to 2035. 60% of the total emissions reductions required for Net Zero are in the next fifteen years.
0
200
400
600
800
1000
199
0
199
5
200
0
200
5
201
0
201
5
202
0
202
5
203
0
203
5
204
0
204
5
205
0
MtC
O2e
Outturn Baseline Balanced Net Zero Pathway
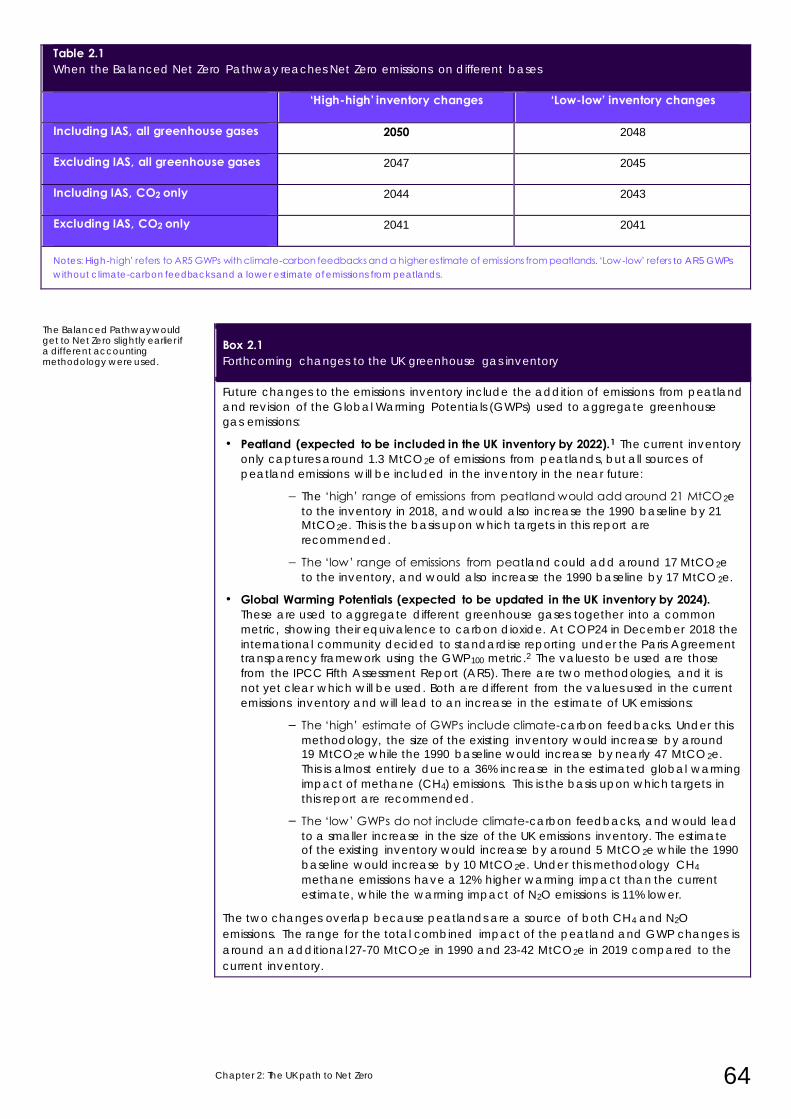
Chapter 2: The UK path to Net Zero 64
Table 2.1 When the Balanced Net Zero Pathway reaches Net Zero emissions on different bases
‘High-high’ inventory changes ‘Low-low’ inventory changes
Including IAS, all greenhouse gases 2050 2048
Excluding IAS, all greenhouse gases 2047 2045
Including IAS, CO2 only 2044 2043
Excluding IAS, CO2 only 2041 2041
Notes: High-high’ refers to AR5 GWPs with climate-carbon feedbacks and a higher estimate of emissions from peatlands. ‘Low -low’ refers to AR5 GWPs
without climate-carbon feedbacks and a lower estimate of emissions from peatlands.
Box 2.1 Forthcoming changes to the UK greenhouse gas inventory
Future changes to the emissions inventory include the addition of emissions from peatland
and revision of the Global Warming Potentials (GWPs) used to aggregate greenhouse
gas emissions:
• Peatland (expected to be included in the UK inventory by 2022).1 The current inventory
only captures around 1.3 MtCO2e of emissions from peatlands, but all sources of
peatland emissions will be included in the inventory in the near future:
– The ‘high’ range of emissions from peatland would add around 21 MtCO2e
to the inventory in 2018, and would also increase the 1990 baseline by 21 MtCO2e. This is the basis upon which targets in this report are
recommended.
– The ‘low’ range of emissions from peatland could add around 17 MtCO2e
to the inventory, and would also increase the 1990 baseline by 17 MtCO 2e.
• Global Warming Potentials (expected to be updated in the UK inventory by 2024). These are used to aggregate different greenhouse gases together into a common
metric, showing their equivalence to carbon dioxide. At COP24 in December 2018 the
international community decided to standardise reporting under the Paris Agreement transparency framework using the GWP100 metric.2 The values to be used are those
from the IPCC Fifth Assessment Report (AR5). There are two methodologies, and it is
not yet clear which will be used. Both are different from the values used in the current
emissions inventory and will lead to an increase in the estimate of UK emissions:
– The ‘high’ estimate of GWPs include climate-carbon feedbacks. Under this
methodology, the size of the existing inventory would increase by around 19 MtCO2e while the 1990 baseline would increase by nearly 47 MtCO2e.
This is almost entirely due to a 36% increase in the estimated global warming
impact of methane (CH4) emissions. This is the basis upon which targets in
this report are recommended.
– The ‘low’ GWPs do not include climate-carbon feedbacks, and would lead
to a smaller increase in the size of the UK emissions inventory. The estimate of the existing inventory would increase by around 5 MtCO2e while the 1990
baseline would increase by 10 MtCO2e. Under this methodology CH4
methane emissions have a 12% higher warming impact than the current
estimate, while the warming impact of N2O emissions is 11% lower.
The two changes overlap because peatlands are a source of both CH 4 and N2O
emissions. The range for the total combined impact of the peatland and GWP changes is
around an additional 27-70 MtCO2e in 1990 and 23-42 MtCO2e in 2019 compared to the
current inventory.
The Balanced Pathway would get to Net Zero slightly earlier if a different accounting methodology were used.
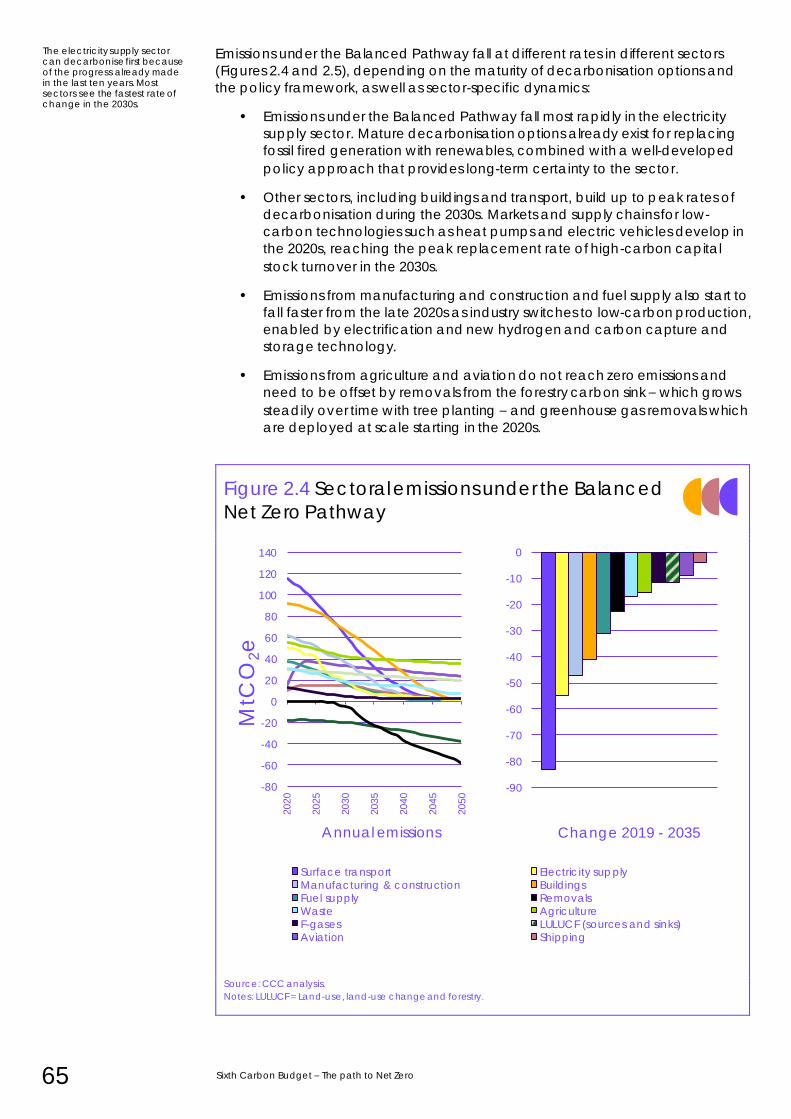
65 Sixth Carbon Budget – The path to Net Zero
Emissions under the Balanced Pathway fall at different rates in different sectors
(Figures 2.4 and 2.5), depending on the maturity of decarbonisation options and
the policy framework, as well as sector-specific dynamics:
• Emissions under the Balanced Pathway fall most rapidly in the electricity
supply sector. Mature decarbonisation options already exist for replacing
fossil fired generation with renewables, combined with a well-developed
policy approach that provides long-term certainty to the sector.
• Other sectors, including buildings and transport, build up to peak rates of
decarbonisation during the 2030s. Markets and supply chains for low-
carbon technologies such as heat pumps and electric vehicles develop in
the 2020s, reaching the peak replacement rate of high-carbon capital
stock turnover in the 2030s.
• Emissions from manufacturing and construction and fuel supply also start to
fall faster from the late 2020s as industry switches to low-carbon production,
enabled by electrification and new hydrogen and carbon capture and
storage technology.
• Emissions from agriculture and aviation do not reach zero emissions and
need to be offset by removals from the forestry carbon sink – which grows
steadily over time with tree planting – and greenhouse gas removals which
are deployed at scale starting in the 2020s.
Figure 2.4 Sectoral emissions under the Balanced
Net Zero Pathway
Source: CCC analysis.
Notes: LULUCF = Land-use, land-use change and forestry.
The electricity supply sector can decarbonise first because of the progress already made in the last ten years. Most sectors see the fastest rate of change in the 2030s.
-90
-80
-70
-60
-50
-40
-30
-20
-10
0
Change 2019 - 2035
Surface transport Electricity supplyManufacturing & construction BuildingsFuel supply RemovalsWaste AgricultureF-gases LULUCF (sources and sinks)Aviation Shipping
-80
-60
-40
-20
0
20
40
60
80
100
120
140
2020
2025
2030
2035
2040
2045
2050
MtC
O2e
Annual emissions
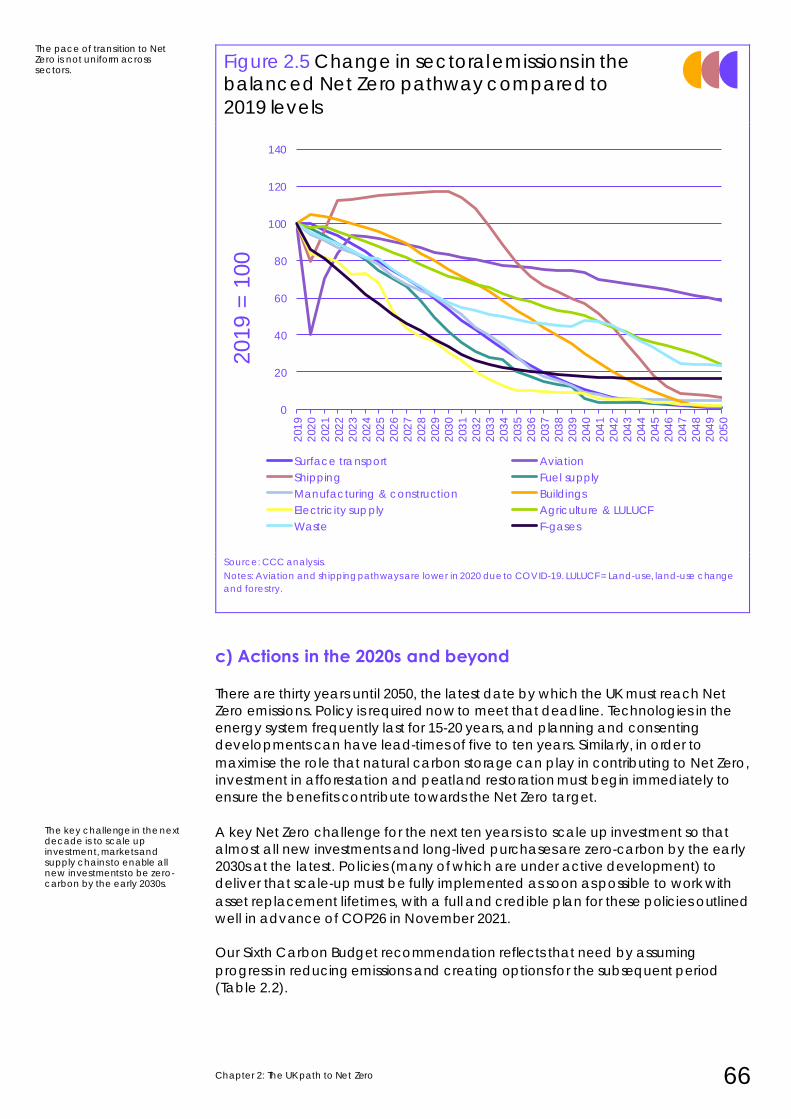
Chapter 2: The UK path to Net Zero 66
Figure 2.5 Change in sectoral emissions in the balanced Net Zero pathway compared to
2019 levels
Source: CCC analysis.
Notes: Aviation and shipping pathways are lower in 2020 due to COVID-19. LULUCF = Land-use, land-use change
and forestry.
c) Actions in the 2020s and beyond
There are thirty years until 2050, the latest date by which the UK must reach Net
Zero emissions. Policy is required now to meet that deadline. Technologies in the
energy system frequently last for 15-20 years, and planning and consenting
developments can have lead-times of five to ten years. Similarly, in order to
maximise the role that natural carbon storage can play in contributing to Net Zero,
investment in afforestation and peatland restoration must begin immediately to
ensure the benefits contribute towards the Net Zero target.
A key Net Zero challenge for the next ten years is to scale up investment so that
almost all new investments and long-lived purchases are zero-carbon by the early
2030s at the latest. Policies (many of which are under active development) to
deliver that scale-up must be fully implemented as soon as possible to work with
asset replacement lifetimes, with a full and credible plan for these policies outlined
well in advance of COP26 in November 2021.
Our Sixth Carbon Budget recommendation reflects that need by assuming
progress in reducing emissions and creating options for the subsequent period
(Table 2.2).
The pace of transition to Net Zero is not uniform across sectors.
The key challenge in the next decade is to scale up investment, markets and supply chains to enable all new investments to be zero-carbon by the early 2030s.
0
20
40
60
80
100
120
140
201
9
202
0
202
1
202
2
202
3
202
4
202
5
202
6
202
7
202
8
202
9
203
0
203
1
203
2
203
3
203
4
203
5
203
6
203
7
203
8
203
9
204
0
204
1
204
2
204
3
204
4
204
5
204
6
204
7
204
8
204
9
205
0
2019 =
100
Surface transport Aviation
Shipping Fuel supply
Manufacturing & construction Buildings
Electricity supply Agriculture & LULUCF
Waste F-gases
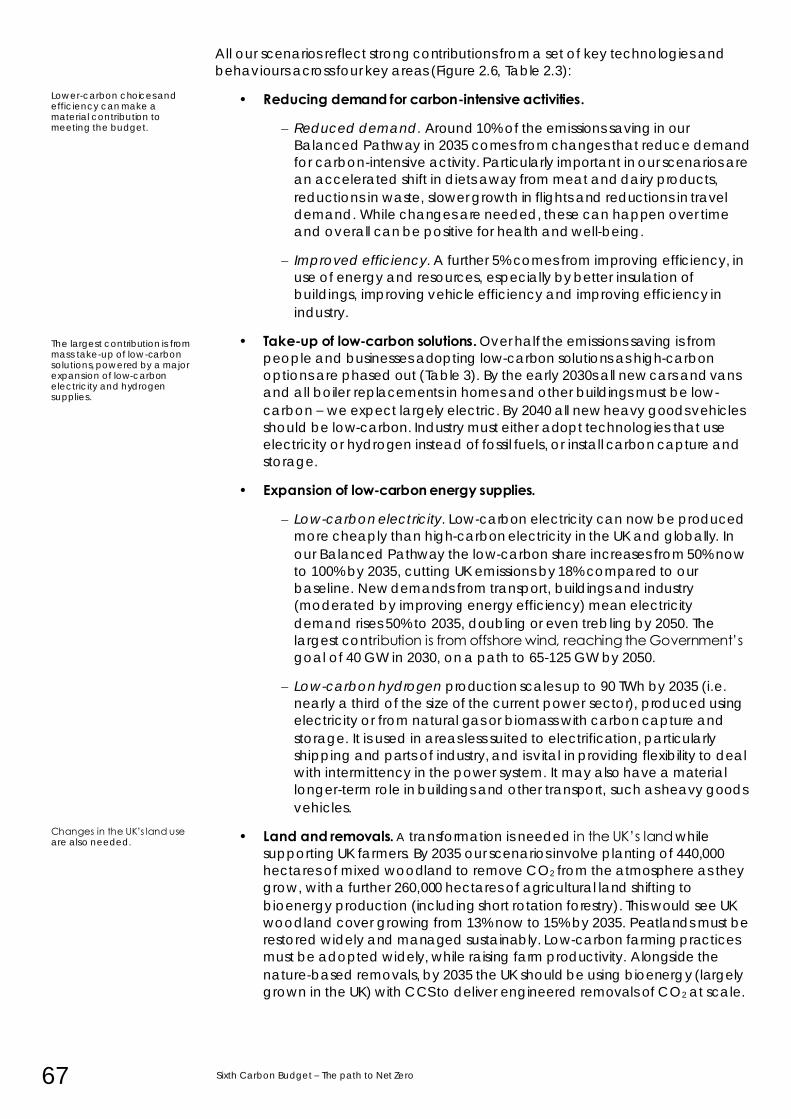
67 Sixth Carbon Budget – The path to Net Zero
All our scenarios reflect strong contributions from a set of key technologies and
behaviours across four key areas (Figure 2.6, Table 2.3):
• Reducing demand for carbon-intensive activities.
– Reduced demand. Around 10% of the emissions saving in our
Balanced Pathway in 2035 comes from changes that reduce demand
for carbon-intensive activity. Particularly important in our scenarios are
an accelerated shift in diets away from meat and dairy products,
reductions in waste, slower growth in flights and reductions in travel
demand. While changes are needed, these can happen over time
and overall can be positive for health and well-being.
– Improved efficiency. A further 5% comes from improving efficiency, in
use of energy and resources, especially by better insulation of
buildings, improving vehicle efficiency and improving efficiency in
industry.
• Take-up of low-carbon solutions. Over half the emissions saving is from
people and businesses adopting low-carbon solutions as high-carbon
options are phased out (Table 3). By the early 2030s all new cars and vans
and all boiler replacements in homes and other buildings must be low-
carbon – we expect largely electric. By 2040 all new heavy goods vehicles
should be low-carbon. Industry must either adopt technologies that use
electricity or hydrogen instead of fossil fuels, or install carbon capture and
storage.
• Expansion of low-carbon energy supplies.
– Low-carbon electricity. Low-carbon electricity can now be produced
more cheaply than high-carbon electricity in the UK and globally. In
our Balanced Pathway the low-carbon share increases from 50% now
to 100% by 2035, cutting UK emissions by 18% compared to our
baseline. New demands from transport, buildings and industry
(moderated by improving energy efficiency) mean electricity
demand rises 50% to 2035, doubling or even trebling by 2050. The
largest contribution is from offshore wind, reaching the Government’s
goal of 40 GW in 2030, on a path to 65-125 GW by 2050.
– Low-carbon hydrogen production scales up to 90 TWh by 2035 (i.e.
nearly a third of the size of the current power sector), produced using
electricity or from natural gas or biomass with carbon capture and
storage. It is used in areas less suited to electrification, particularly
shipping and parts of industry, and is vital in providing flexibility to deal
with intermittency in the power system. It may also have a material
longer-term role in buildings and other transport, such as heavy goods
vehicles.
• Land and removals. A transformation is needed in the UK’s land while
supporting UK farmers. By 2035 our scenarios involve planting of 440,000
hectares of mixed woodland to remove CO2 from the atmosphere as they
grow, with a further 260,000 hectares of agricultural land shifting to
bioenergy production (including short rotation forestry). This would see UK
woodland cover growing from 13% now to 15% by 2035. Peatlands must be
restored widely and managed sustainably. Low-carbon farming practices
must be adopted widely, while raising farm productivity. Alongside the
nature-based removals, by 2035 the UK should be using bioenergy (largely
grown in the UK) with CCS to deliver engineered removals of CO2 at scale.
The largest contribution is from mass take-up of low-carbon solutions, powered by a major expansion of low-carbon electricity and hydrogen supplies.
Changes in the UK’s land use are also needed.
Lower-carbon choices and efficiency can make a material contribution to meeting the budget.
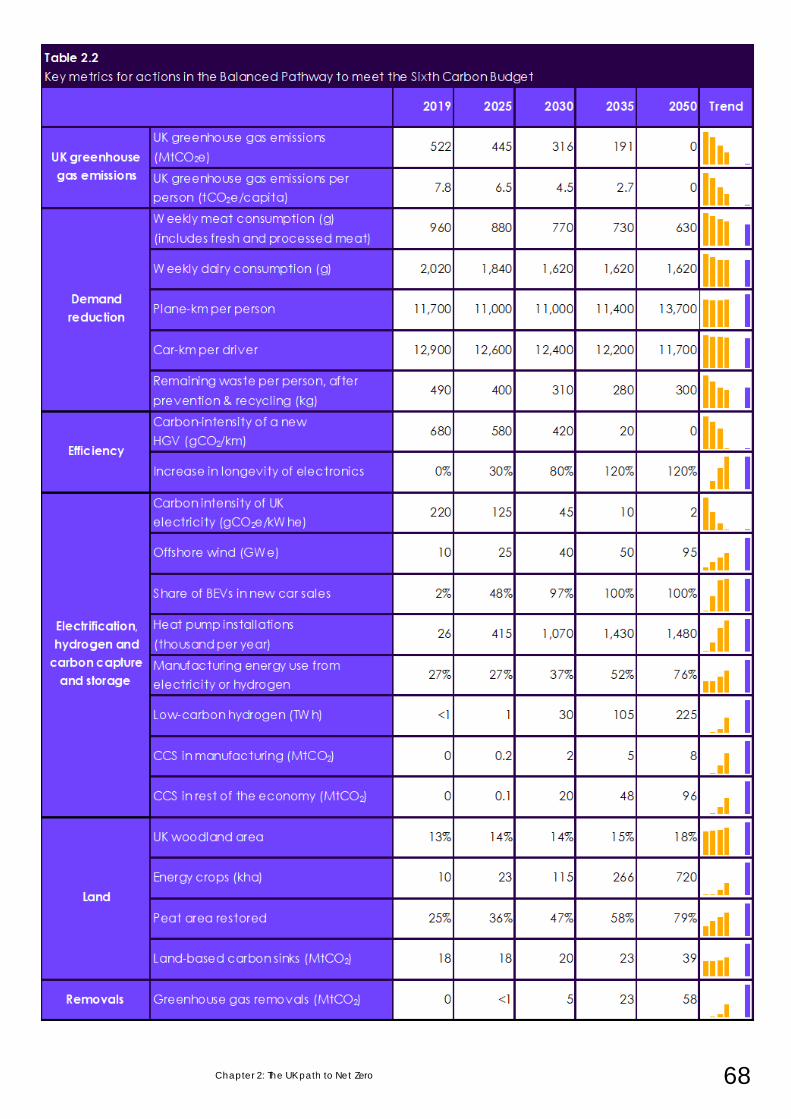
Chapter 2: The UK path to Net Zero 68
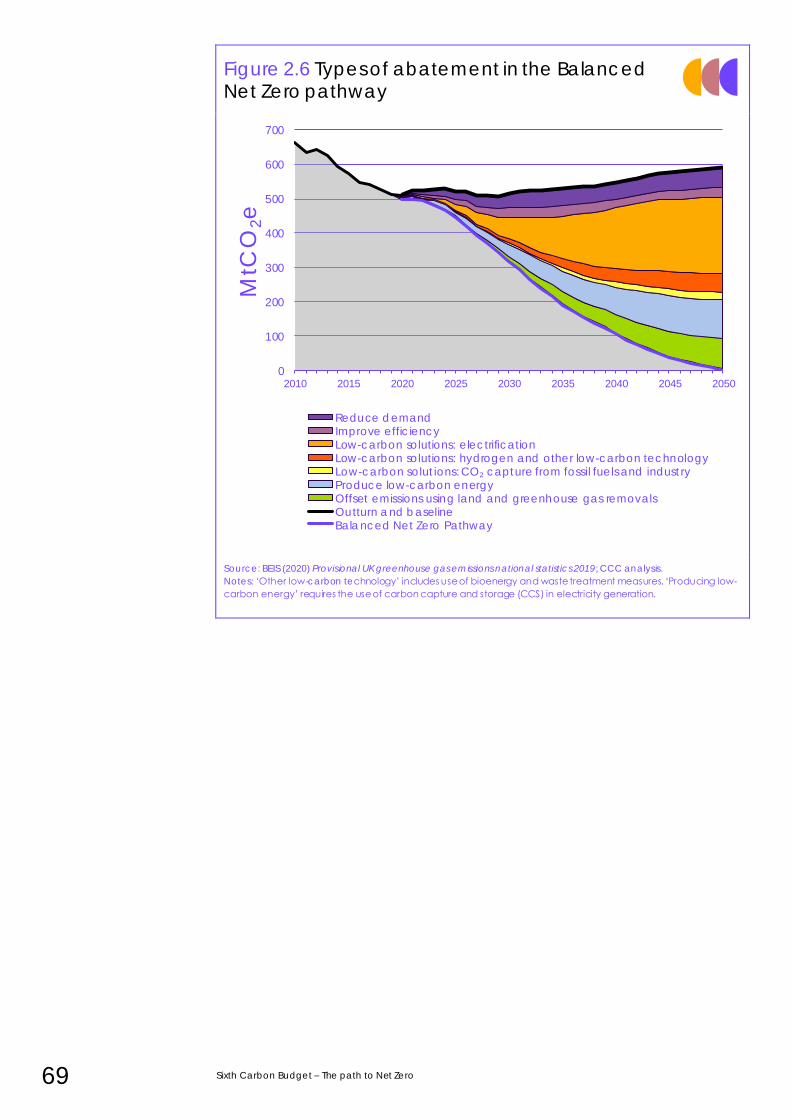
69 Sixth Carbon Budget – The path to Net Zero
Figure 2.6 Types of abatement in the Balanced Net Zero pathway
Source: BEIS (2020) Provisional UK greenhouse gas emissions national statistics 2019; CCC analysis.
Notes: ‘Other low-carbon technology’ includes use of bioenergy and waste treatment measures. ‘Producing low-
carbon energy’ requires the use of carbon capture and storage (CCS) in electricity generation.
0
100
200
300
400
500
600
700
2010 2015 2020 2025 2030 2035 2040 2045 2050
MtC
O2e
Reduce demandImprove efficiencyLow-carbon solutions: electrificationLow-carbon solutions: hydrogen and other low-carbon technologyLow-carbon solutions: CO₂ capture from fossil fuels and industryProduce low-carbon energyOffset emissions using land and greenhouse gas removalsOutturn and baselineBalanced Net Zero Pathway
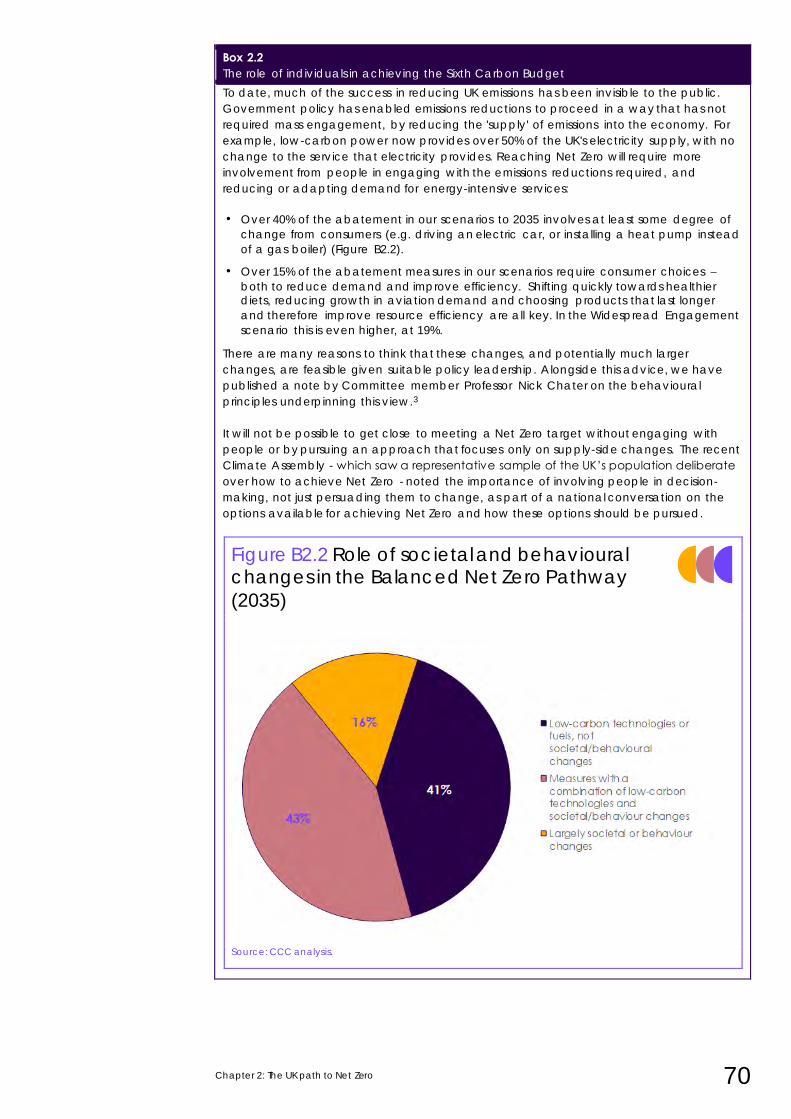
Chapter 2: The UK path to Net Zero 70
Box 2.2 The role of individuals in achieving the Sixth Carbon Budget
To date, much of the success in reducing UK emissions has been invisible to the public.
Government policy has enabled emissions reductions to proceed in a way that has not
required mass engagement, by reducing the 'supply' of emissions into the economy. For
example, low-carbon power now provides over 50% of the UK's electricity supply, with no
change to the service that electricity provides. Reaching Net Zero will require more
involvement from people in engaging with the emissions reductions required, and
reducing or adapting demand for energy-intensive services:
• Over 40% of the abatement in our scenarios to 2035 involves at least some degree of
change from consumers (e.g. driving an electric car, or installing a heat pump instead
of a gas boiler) (Figure B2.2).
• Over 15% of the abatement measures in our scenarios require consumer choices –
both to reduce demand and improve efficiency. Shifting quickly towards healthier diets, reducing growth in aviation demand and choosing products that last longer
and therefore improve resource efficiency are all key. In the Widespread Engagement
scenario this is even higher, at 19%.
There are many reasons to think that these changes, and potentially much larger
changes, are feasible given suitable policy leadership. Alongside this advice, we have
published a note by Committee member Professor Nick Chater on the behavioural
principles underpinning this view.3
It will not be possible to get close to meeting a Net Zero target without engaging with
people or by pursuing an approach that focuses only on supply-side changes. The recent
Climate Assembly - which saw a representative sample of the UK’s population deliberate
over how to achieve Net Zero - noted the importance of involving people in decision-
making, not just persuading them to change, as part of a national conversation on the
options available for achieving Net Zero and how these options should be pursued.
Figure B2.2 Role of societal and behavioural changes in the Balanced Net Zero Pathway
(2035)
Source: CCC analysis.
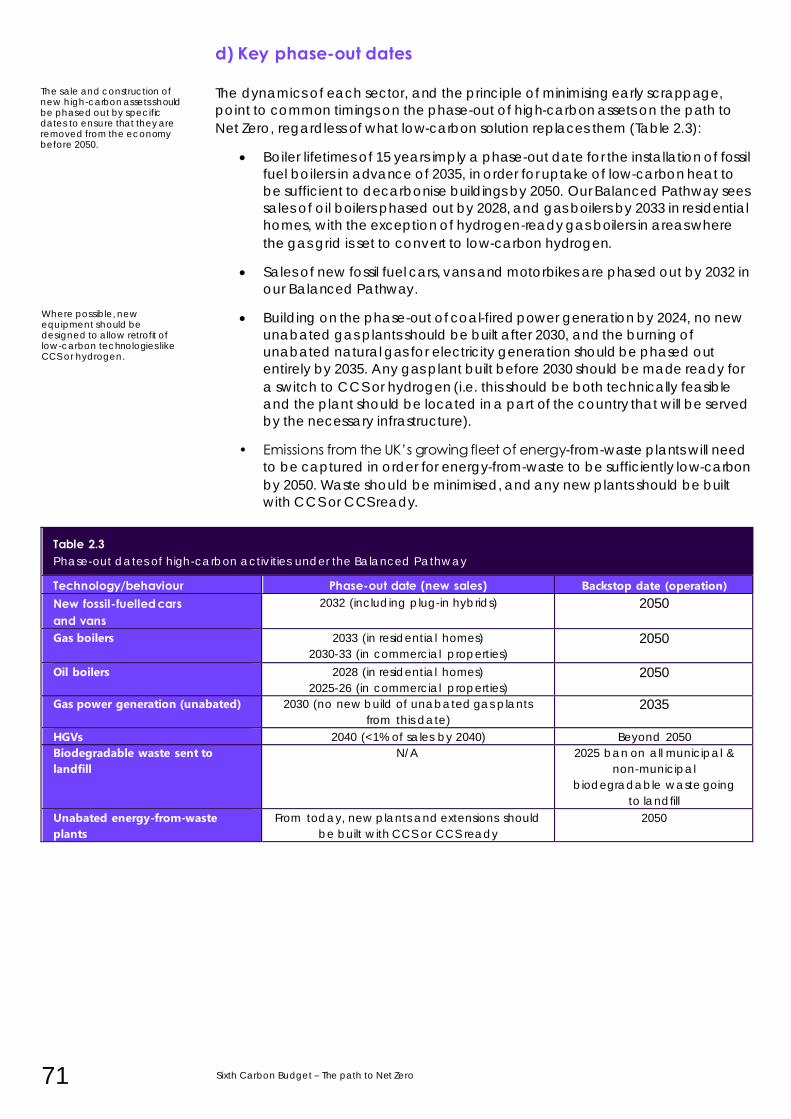
71 Sixth Carbon Budget – The path to Net Zero
d) Key phase-out dates
The dynamics of each sector, and the principle of minimising early scrappage,
point to common timings on the phase-out of high-carbon assets on the path to
Net Zero, regardless of what low-carbon solution replaces them (Table 2.3):
• Boiler lifetimes of 15 years imply a phase-out date for the installation of fossil
fuel boilers in advance of 2035, in order for uptake of low-carbon heat to
be sufficient to decarbonise buildings by 2050. Our Balanced Pathway sees
sales of oil boilers phased out by 2028, and gas boilers by 2033 in residential
homes, with the exception of hydrogen-ready gas boilers in areas where
the gas grid is set to convert to low-carbon hydrogen.
• Sales of new fossil fuel cars, vans and motorbikes are phased out by 2032 in
our Balanced Pathway.
• Building on the phase-out of coal-fired power generation by 2024, no new
unabated gas plants should be built after 2030, and the burning of
unabated natural gas for electricity generation should be phased out
entirely by 2035. Any gas plant built before 2030 should be made ready for
a switch to CCS or hydrogen (i.e. this should be both technically feasible
and the plant should be located in a part of the country that will be served
by the necessary infrastructure).
• Emissions from the UK’s growing fleet of energy-from-waste plants will need
to be captured in order for energy-from-waste to be sufficiently low-carbon
by 2050. Waste should be minimised, and any new plants should be built
with CCS or CCS ready.
Table 2.3
Phase-out dates of high-carbon activities under the Balanced Pathway Technology/behaviour Phase-out date (new sales) Backstop date (operation) New fossil-fuelled cars and vans
2032 (including plug-in hybrids) 2050
Gas boilers
2033 (in residential homes)
2030-33 (in commercial properties)
2050
Oil boilers 2028 (in residential homes)
2025-26 (in commercial properties)
2050
Gas power generation (unabated) 2030 (no new build of unabated gas plants
from this date)
2035
HGVs 2040 (<1% of sales by 2040) Beyond 2050
Biodegradable waste sent to
landfill
N/A 2025 ban on all municipal &
non-municipal
biodegradable waste going
to landfill
Unabated energy-from-waste
plants
From today, new plants and extensions should
be built with CCS or CCS ready
2050
The sale and construction of new high-carbon assets should be phased out by specific dates to ensure that they are removed from the economy before 2050.
Where possible, new equipment should be designed to allow retrofit of low-carbon technologies like CCS or hydrogen.
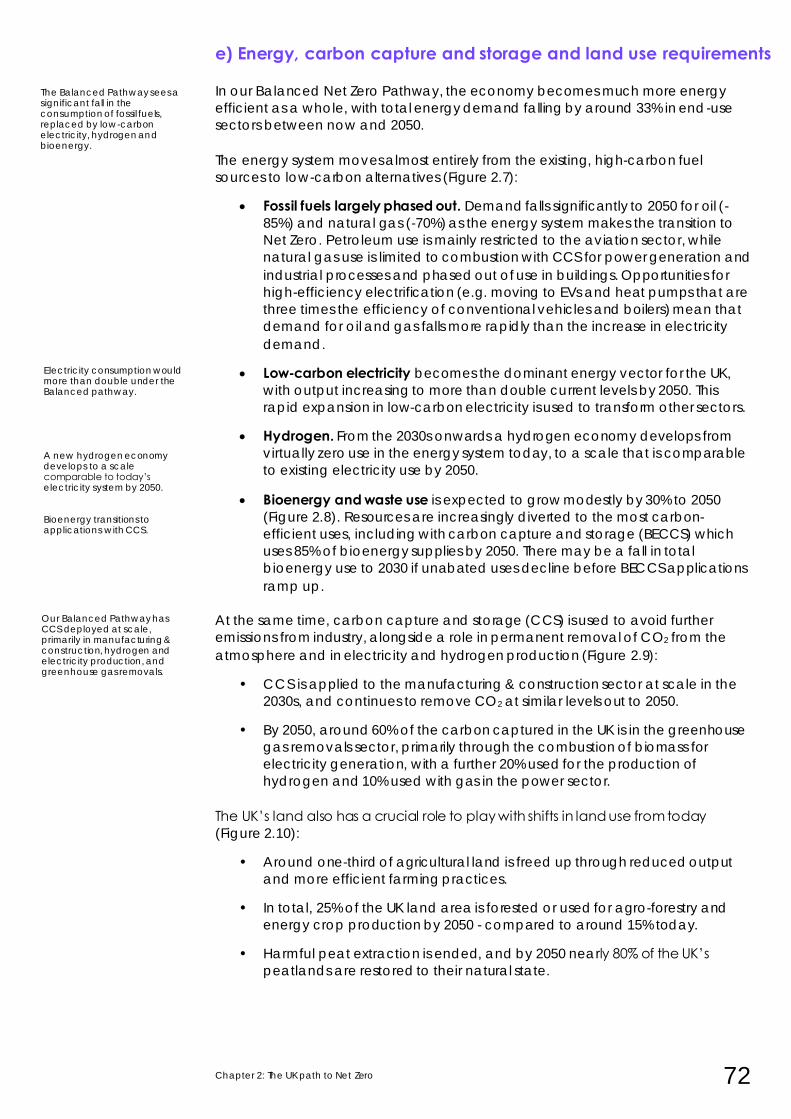
Chapter 2: The UK path to Net Zero 72
e) Energy, carbon capture and storage and land use requirements
In our Balanced Net Zero Pathway, the economy becomes much more energy
efficient as a whole, with total energy demand falling by around 33% in end-use
sectors between now and 2050.
The energy system moves almost entirely from the existing, high-carbon fuel
sources to low-carbon alternatives (Figure 2.7):
• Fossil fuels largely phased out. Demand falls significantly to 2050 for oil (-
85%) and natural gas (-70%) as the energy system makes the transition to
Net Zero. Petroleum use is mainly restricted to the aviation sector, while
natural gas use is limited to combustion with CCS for power generation and
industrial processes and phased out of use in buildings. Opportunities for
high-efficiency electrification (e.g. moving to EVs and heat pumps that are
three times the efficiency of conventional vehicles and boilers) mean that
demand for oil and gas falls more rapidly than the increase in electricity
demand.
• Low-carbon electricity becomes the dominant energy vector for the UK,
with output increasing to more than double current levels by 2050. This
rapid expansion in low-carbon electricity is used to transform other sectors.
• Hydrogen. From the 2030s onwards a hydrogen economy develops from
virtually zero use in the energy system today, to a scale that is comparable
to existing electricity use by 2050.
• Bioenergy and waste use is expected to grow modestly by 30% to 2050
(Figure 2.8). Resources are increasingly diverted to the most carbon-
efficient uses, including with carbon capture and storage (BECCS) which
uses 85% of bioenergy supplies by 2050. There may be a fall in total
bioenergy use to 2030 if unabated uses decline before BECCS applications
ramp up.
At the same time, carbon capture and storage (CCS) is used to avoid further
emissions from industry, alongside a role in permanent removal of CO2 from the
atmosphere and in electricity and hydrogen production (Figure 2.9):
• CCS is applied to the manufacturing & construction sector at scale in the
2030s, and continues to remove CO2 at similar levels out to 2050.
• By 2050, around 60% of the carbon captured in the UK is in the greenhouse
gas removals sector, primarily through the combustion of biomass for
electricity generation, with a further 20% used for the production of
hydrogen and 10% used with gas in the power sector.
The UK’s land also has a crucial role to play with shifts in land use from today
(Figure 2.10):
• Around one-third of agricultural land is freed up through reduced output
and more efficient farming practices.
• In total, 25% of the UK land area is forested or used for agro-forestry and
energy crop production by 2050 - compared to around 15% today.
• Harmful peat extraction is ended, and by 2050 nearly 80% of the UK’s
peatlands are restored to their natural state.
The Balanced Pathway sees a significant fall in the consumption of fossil fuels, replaced by low-carbon electricity, hydrogen and bioenergy.
Our Balanced Pathway has CCS deployed at scale, primarily in manufacturing & construction, hydrogen and electricity production, and greenhouse gas removals.
Electricity consumption would more than double under the Balanced pathway. A new hydrogen economy develops to a scale comparable to today’s electricity system by 2050. Bioenergy transitions to applications with CCS.
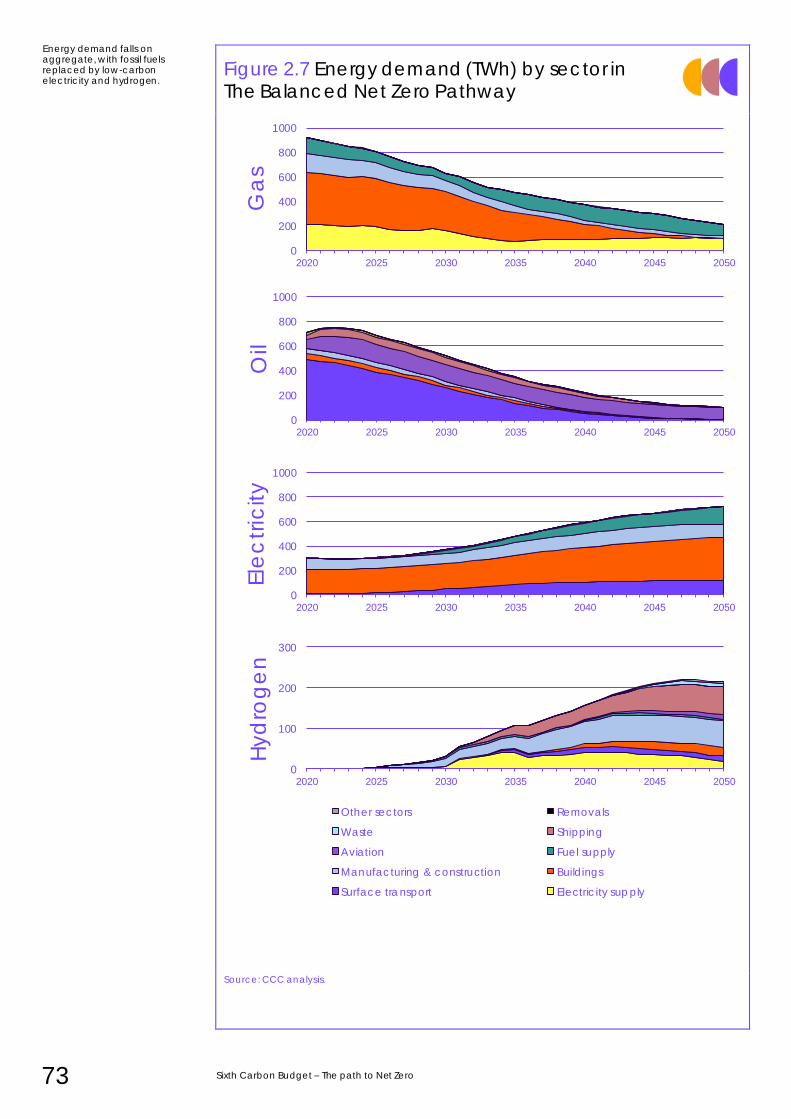
73 Sixth Carbon Budget – The path to Net Zero
Figure 2.7 Energy demand (TWh) by sector in The Balanced Net Zero Pathway
Source: CCC analysis.
0
200
400
600
800
1000
2020 2025 2030 2035 2040 2045 2050
Ele
ctr
icity
0
200
400
600
800
1000
2020 2025 2030 2035 2040 2045 2050G
as
0
200
400
600
800
1000
2020 2025 2030 2035 2040 2045 2050
Oil
0
100
200
300
2020 2025 2030 2035 2040 2045 2050
Hyd
rog
en
Other sectors Removals
Waste Shipping
Aviation Fuel supply
Manufacturing & construction Buildings
Surface transport Electricity supply
Energy demand falls on aggregate, with fossil fuels replaced by low-carbon electricity and hydrogen.
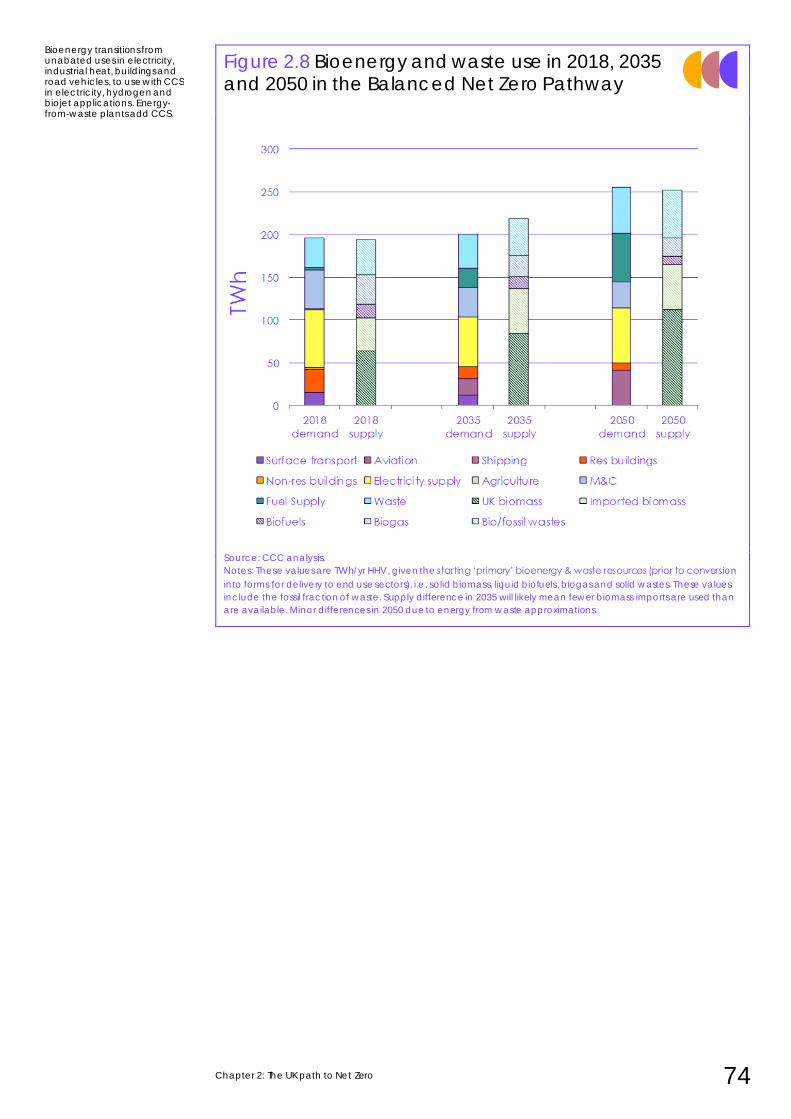
Chapter 2: The UK path to Net Zero 74
Figure 2.8 Bioenergy and waste use in 2018, 2035 and 2050 in the Balanced Net Zero Pathway
Source: CCC analysis.
Notes: These values are TWh/yr HHV, given the starting ‘primary’ bioenergy & waste resources (prior to conversion
into forms for delivery to end use sectors), i.e. solid biomass, liquid biofuels, biogas and solid wastes. These values
include the fossil fraction of waste. Supply difference in 2035 will likely mean fewer biomass imports are used than
are available. Minor differences in 2050 due to energy from waste approximations.
Bioenergy transitions from unabated uses in electricity, industrial heat, buildings and road vehicles, to use with CCS in electricity, hydrogen and biojet applications. Energy-from-waste plants add CCS.
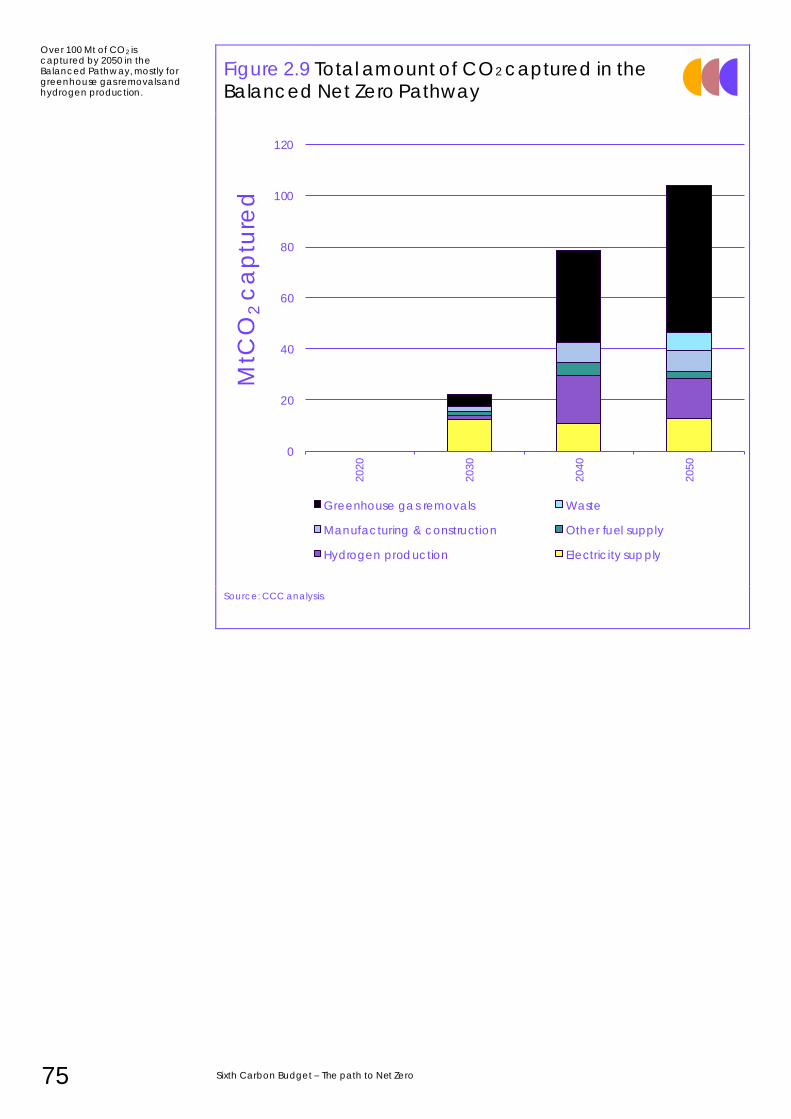
75 Sixth Carbon Budget – The path to Net Zero
Figure 2.9 Total amount of CO2 captured in the Balanced Net Zero Pathway
Source: CCC analysis.
Over 100 Mt of CO2 is captured by 2050 in the Balanced Pathway, mostly for greenhouse gas removals and hydrogen production.
0
20
40
60
80
100
120
2020
2030
2040
2050
MtC
O2
ca
ptu
red
Greenhouse gas removals Waste
Manufacturing & construction Other fuel supply
Hydrogen production Electricity supply
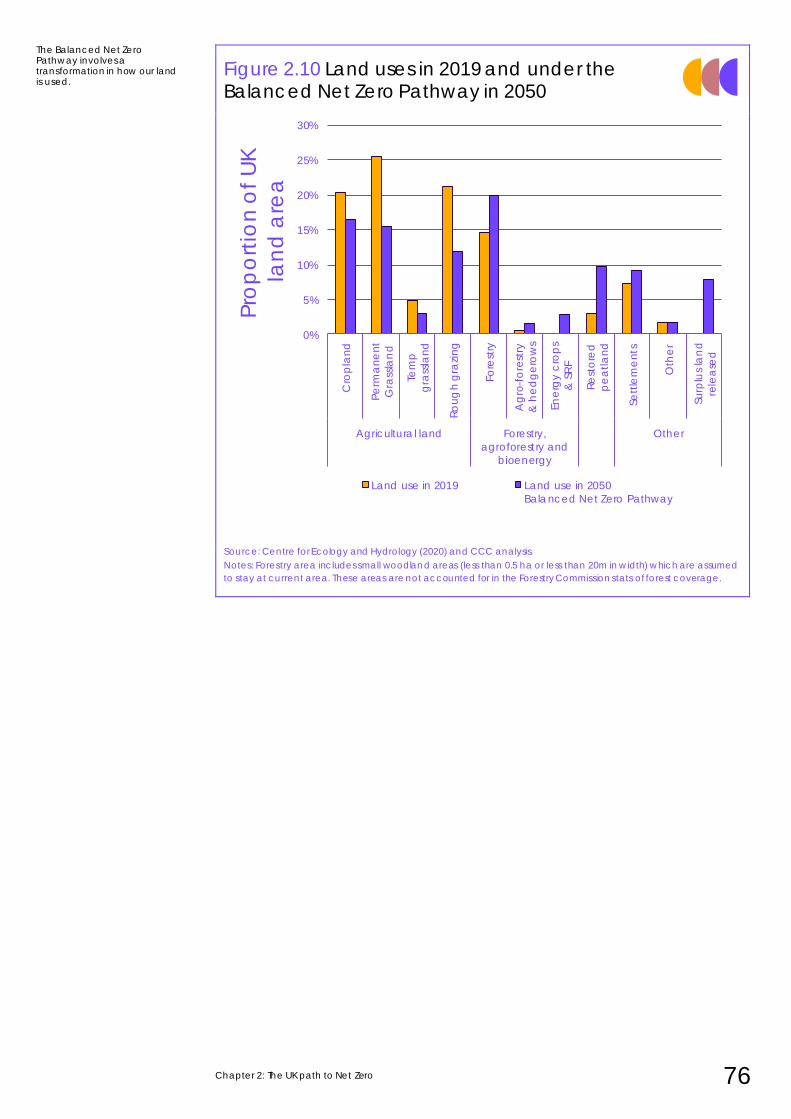
Chapter 2: The UK path to Net Zero 76
Figure 2.10 Land uses in 2019 and under the Balanced Net Zero Pathway in 2050
Source: Centre for Ecology and Hydrology (2020) and CCC analysis.
Notes: Forestry area includes small woodland areas (less than 0.5 ha or less than 20m in width) which are assumed
to stay at current area. These areas are not accounted for in the Forestry Commission stats of forest coverage.
The Balanced Net Zero Pathway involves a transformation in how our land is used.
0%
5%
10%
15%
20%
25%
30%
Cro
pla
nd
Pe
rma
ne
nt
Gra
ssla
nd
Tem
p
gra
ssla
nd
Ro
ug
h g
razi
ng
Fo
rest
ry
Ag
ro-f
ore
stry
& h
ed
ge
row
s
En
erg
y c
rop
s
& S
RF
Re
sto
red
pe
atl
an
d
Se
ttle
me
nts
Oth
er
Su
rplu
s la
nd
rele
ase
d
Agricultural land Forestry,
agroforestry and
bioenergy
Other
Pro
po
rtio
n o
f U
K
lan
d a
rea
Land use in 2019 Land use in 2050
Balanced Net Zero Pathway
77 Sixth Carbon Budget – The path to Net Zero
2. Alternative pathways to Net Zero by 2050
This section addresses the implications of different pathways to Net Zero on the
level of the Sixth Carbon Budget. This section presents results for all of our
exploratory scenarios, but primarily focuses on the Headwinds, Widespread
Engagement, Widespread Innovation scenarios. The Tailwinds scenario and the
potential to achieve Net Zero before 2050 are discussed in Section 3. This section is
set out in four parts:
a) Different emissions pathways for reaching Net Zero
b) Contributions of different decarbonisation options
c) Critical decision points
d) The impacts of uncertainties on meeting the budget
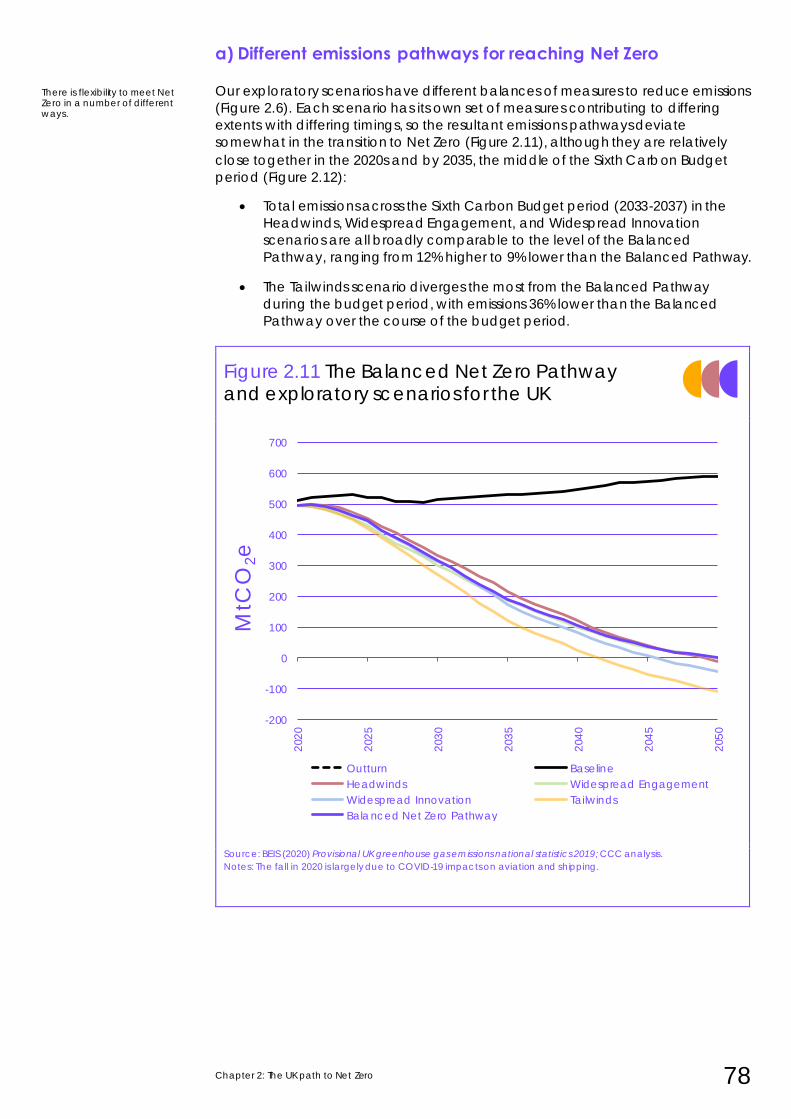
Chapter 2: The UK path to Net Zero 78
a) Different emissions pathways for reaching Net Zero
Our exploratory scenarios have different balances of measures to reduce emissions
(Figure 2.6). Each scenario has its own set of measures contributing to differing
extents with differing timings, so the resultant emissions pathways deviate
somewhat in the transition to Net Zero (Figure 2.11), although they are relatively
close together in the 2020s and by 2035, the middle of the Sixth Carbon Budget
period (Figure 2.12):
• Total emissions across the Sixth Carbon Budget period (2033-2037) in the
Headwinds, Widespread Engagement, and Widespread Innovation
scenarios are all broadly comparable to the level of the Balanced
Pathway, ranging from 12% higher to 9% lower than the Balanced Pathway.
• The Tailwinds scenario diverges the most from the Balanced Pathway
during the budget period, with emissions 36% lower than the Balanced
Pathway over the course of the budget period.
Figure 2.11 The Balanced Net Zero Pathway and exploratory scenarios for the UK
Source: BEIS (2020) Provisional UK greenhouse gas emissions national statistics 2019; CCC analysis.
Notes: The fall in 2020 is largely due to COVID-19 impacts on aviation and shipping.
There is flexibility to meet Net Zero in a number of different ways.
-200
-100
0
100
200
300
400
500
600
700
202
0
202
5
203
0
203
5
204
0
204
5
205
0
MtC
O2e
Outturn Baseline
Headwinds Widespread Engagement
Widespread Innovation Tailwinds
Balanced Net Zero Pathway
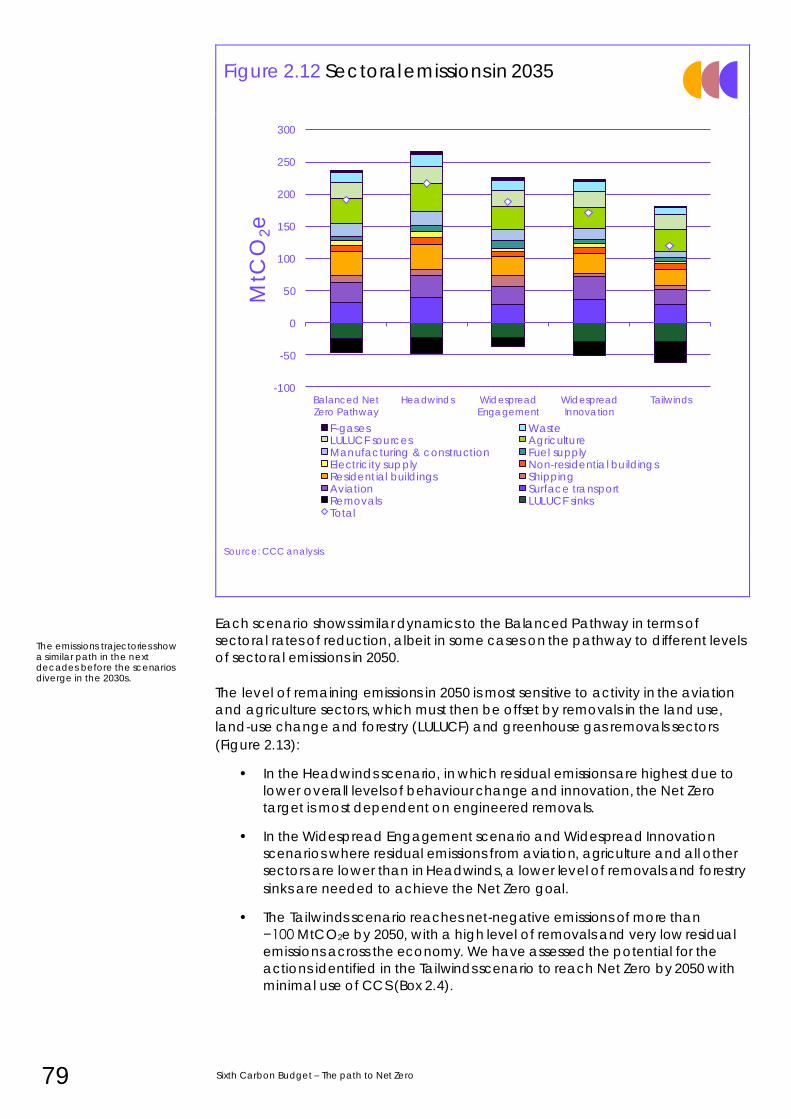
79 Sixth Carbon Budget – The path to Net Zero
Figure 2.12 Sectoral emissions in 2035
Source: CCC analysis.
Each scenario shows similar dynamics to the Balanced Pathway in terms of
sectoral rates of reduction, albeit in some cases on the pathway to different levels
of sectoral emissions in 2050.
The level of remaining emissions in 2050 is most sensitive to activity in the aviation
and agriculture sectors, which must then be offset by removals in the land use,
land-use change and forestry (LULUCF) and greenhouse gas removals sectors
(Figure 2.13):
• In the Headwinds scenario, in which residual emissions are highest due to
lower overall levels of behaviour change and innovation, the Net Zero
target is most dependent on engineered removals.
• In the Widespread Engagement scenario and Widespread Innovation
scenarios where residual emissions from aviation, agriculture and all other
sectors are lower than in Headwinds, a lower level of removals and forestry
sinks are needed to achieve the Net Zero goal.
• The Tailwinds scenario reaches net-negative emissions of more than
−100 MtCO2e by 2050, with a high level of removals and very low residual
emissions across the economy. We have assessed the potential for the
actions identified in the Tailwinds scenario to reach Net Zero by 2050 with
minimal use of CCS (Box 2.4).
The emissions trajectories show a similar path in the next decades before the scenarios diverge in the 2030s.
-100
-50
0
50
100
150
200
250
300
Balanced NetZero Pathway
Headwinds WidespreadEngagement
WidespreadInnovation
Tailwinds
MtC
O2e
F-gases WasteLULUCF sources AgricultureManufacturing & construction Fuel supplyElectricity supply Non-residential buildingsResidential buildings ShippingAviation Surface transportRemovals LULUCF sinksTotal
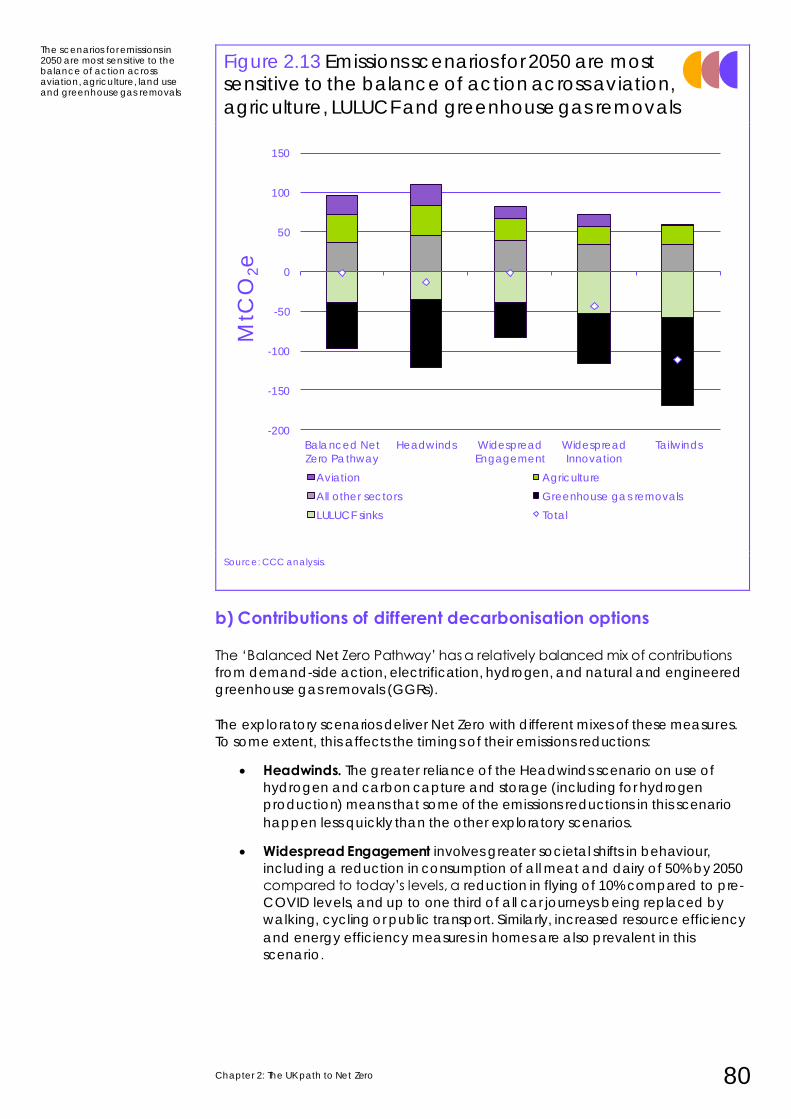
Chapter 2: The UK path to Net Zero 80
Figure 2.13 Emissions scenarios for 2050 are most sensitive to the balance of action across aviation,
agriculture, LULUCF and greenhouse gas removals
Source: CCC analysis.
b) Contributions of different decarbonisation options
The ‘Balanced Net Zero Pathway’ has a relatively balanced mix of contributions
from demand-side action, electrification, hydrogen, and natural and engineered
greenhouse gas removals (GGRs).
The exploratory scenarios deliver Net Zero with different mixes of these measures.
To some extent, this affects the timings of their emissions reductions:
• Headwinds. The greater reliance of the Headwinds scenario on use of
hydrogen and carbon capture and storage (including for hydrogen
production) means that some of the emissions reductions in this scenario
happen less quickly than the other exploratory scenarios.
• Widespread Engagement involves greater societal shifts in behaviour,
including a reduction in consumption of all meat and dairy of 50% by 2050
compared to today’s levels, a reduction in flying of 10% compared to pre-
COVID levels, and up to one third of all car journeys being replaced by
walking, cycling or public transport. Similarly, increased resource efficiency
and energy efficiency measures in homes are also prevalent in this
scenario.
The scenarios for emissions in 2050 are most sensitive to the balance of action across aviation, agriculture, land use and greenhouse gas removals.
-200
-150
-100
-50
0
50
100
150
Balanced Net
Zero Pathway
Headwinds Widespread
Engagement
Widespread
Innovation
Tailwinds
MtC
O2e
Aviation Agriculture
All other sectors Greenhouse gas removals
LULUCF sinks Total
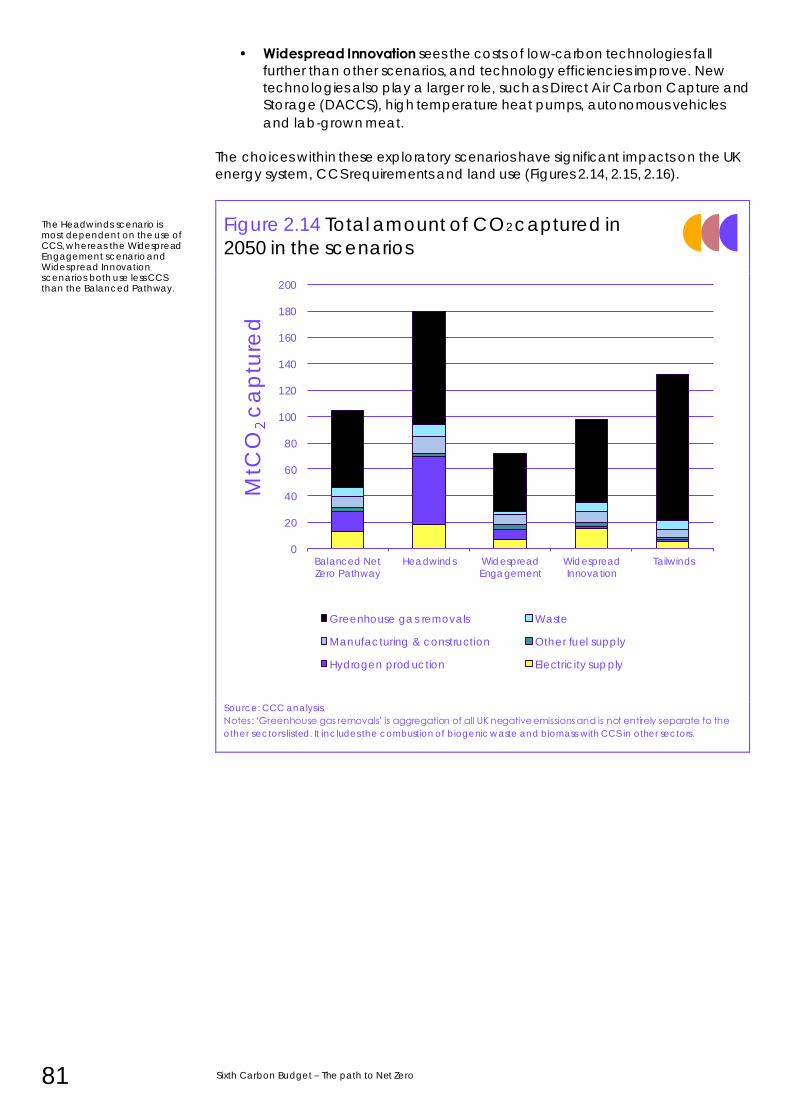
81 Sixth Carbon Budget – The path to Net Zero
• Widespread Innovation sees the costs of low-carbon technologies fall
further than other scenarios, and technology efficiencies improve. New
technologies also play a larger role, such as Direct Air Carbon Capture and
Storage (DACCS), high temperature heat pumps, autonomous vehicles
and lab-grown meat.
The choices within these exploratory scenarios have significant impacts on the UK
energy system, CCS requirements and land use (Figures 2.14, 2.15, 2.16).
Figure 2.14 Total amount of CO2 captured in
2050 in the scenarios
Source: CCC analysis.
Notes: ‘Greenhouse gas removals’ is aggregation of all UK negative emissions and is not entirely separate to the
other sectors listed. It includes the combustion of biogenic waste and biomass with CCS in other sectors.
The Headwinds scenario is most dependent on the use of CCS, whereas the Widespread Engagement scenario and Widespread Innovation scenarios both use less CCS than the Balanced Pathway.
0
20
40
60
80
100
120
140
160
180
200
Balanced NetZero Pathway
Headwinds WidespreadEngagement
WidespreadInnovation
Tailwinds
MtC
Oc
ap
ture
d
Greenhouse gas removals Waste
Manufacturing & construction Other fuel supply
Hydrogen production Electricity supply
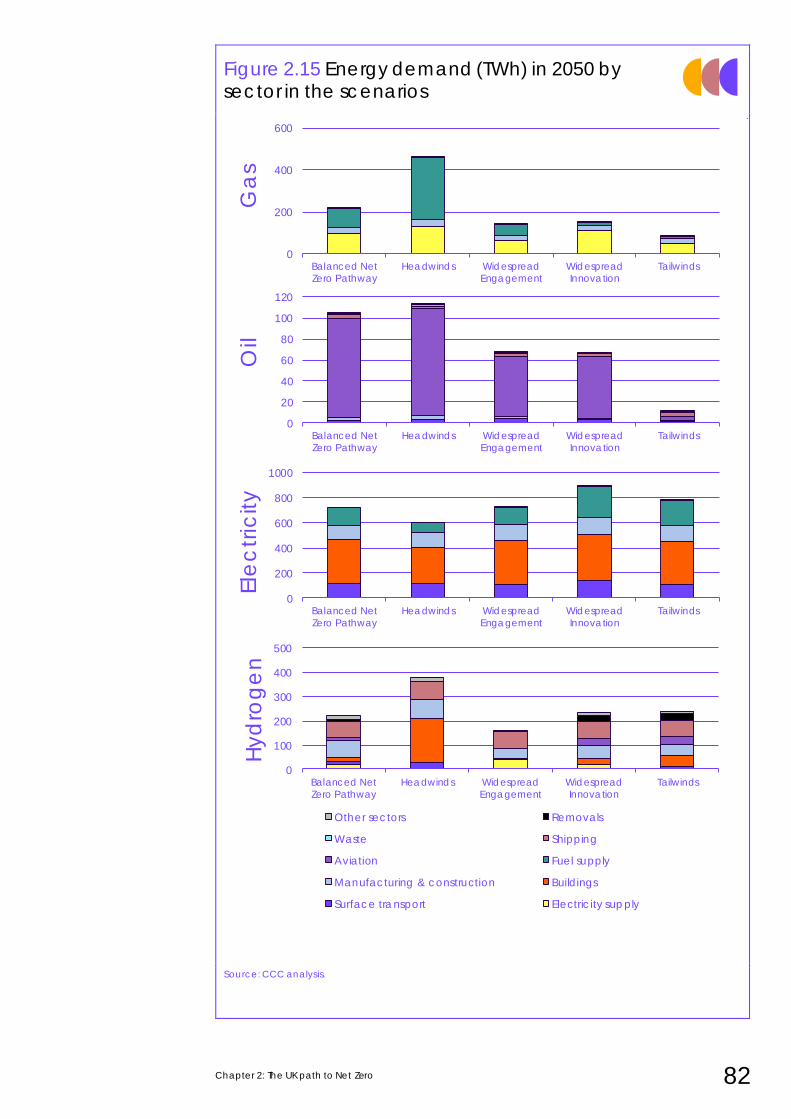
Chapter 2: The UK path to Net Zero 82
Figure 2.15 Energy demand (TWh) in 2050 by sector in the scenarios
Source: CCC analysis.
0
200
400
600
800
1000
Balanced NetZero Pathway
Headwinds WidespreadEngagement
WidespreadInnovation
Tailwinds
Ele
ctr
icity
0
200
400
600
Balanced NetZero Pathway
Headwinds WidespreadEngagement
WidespreadInnovation
Tailwinds
Ga
s
0
20
40
60
80
100
120
Balanced NetZero Pathway
Headwinds WidespreadEngagement
WidespreadInnovation
Tailwinds
Oil
0
100
200
300
400
500
Balanced NetZero Pathway
Headwinds WidespreadEngagement
WidespreadInnovation
Tailwinds
Hyd
rog
en
Other sectors Removals
Waste Shipping
Aviation Fuel supply
Manufacturing & construction Buildings
Surface transport Electricity supply
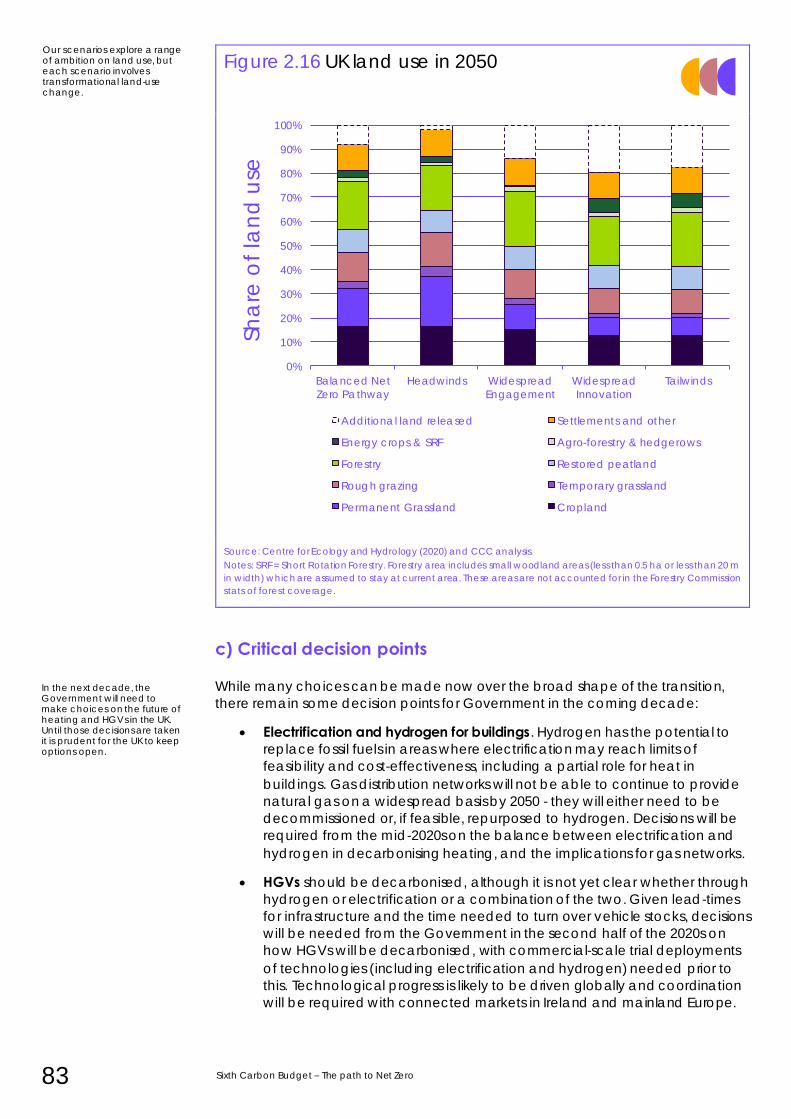
83 Sixth Carbon Budget – The path to Net Zero
Figure 2.16 UK land use in 2050
Source: Centre for Ecology and Hydrology (2020) and CCC analysis.
Notes: SRF = Short Rotation Forestry. Forestry area includes small woodland areas (less than 0.5 ha or less than 20 m
in width) which are assumed to stay at current area. These areas are not accounted for in the Forestry Commission
stats of forest coverage.
c) Critical decision points
While many choices can be made now over the broad shape of the transition,
there remain some decision points for Government in the coming decade:
• Electrification and hydrogen for buildings. Hydrogen has the potential to
replace fossil fuels in areas where electrification may reach limits of
feasibility and cost-effectiveness, including a partial role for heat in
buildings. Gas distribution networks will not be able to continue to provide
natural gas on a widespread basis by 2050 - they will either need to be
decommissioned or, if feasible, repurposed to hydrogen. Decisions will be
required from the mid-2020s on the balance between electrification and
hydrogen in decarbonising heating, and the implications for gas networks.
• HGVs should be decarbonised, although it is not yet clear whether through
hydrogen or electrification or a combination of the two. Given lead-times
for infrastructure and the time needed to turn over vehicle stocks, decisions
will be needed from the Government in the second half of the 2020s on
how HGVs will be decarbonised, with commercial-scale trial deployments
of technologies (including electrification and hydrogen) needed prior to
this. Technological progress is likely to be driven globally and coordination
will be required with connected markets in Ireland and mainland Europe.
Our scenarios explore a range of ambition on land use, but each scenario involves transformational land-use change.
In the next decade, the Government will need to make choices on the future of heating and HGVs in the UK. Until those decisions are taken it is prudent for the UK to keep options open.
0%
10%
20%
30%
40%
50%
60%
70%
80%
90%
100%
Balanced Net
Zero Pathway
Headwinds Widespread
Engagement
Widespread
Innovation
Tailwinds
Sh
are
of
lan
d u
se
Additional land released Settlements and other
Energy crops & SRF Agro-forestry & hedgerows
Forestry Restored peatland
Rough grazing Temporary grassland
Permanent Grassland Cropland
Chapter 2: The UK path to Net Zero 84
Until those decisions are made, the UK can keep as many options open as possible
by supporting pilot programmes and accelerating deployment of ‘low-regret’
options (such as heat pumps in homes off the gas grid).
d) The impacts of uncertainties on meeting the budget
Beyond the factors considered within the scenarios, there is a range of
conceivable uncertainties, where our assumptions generally err on the side of
caution (i.e. if our assumptions are wrong it would tend to make the
recommended budget easier to meet). Uncertainties include the performance of
the economy and forthcoming changes to the methodology for estimating
emissions within the inventory (Figure 2.17):
• Level of GDP. Future performance of the economy – and hence the level of
economic activity that could cause emissions – is always uncertain to some
degree. At the moment, the uncertainty is much greater than usual,
relating to how the economy will recover after the COVID-19 pandemic.
Our analysis has assumed that there is no lasting impact on GDP, an
assumption at the optimistic end of the July scenarios from the Office for
Budget Responsibility (OBR). This compares to the OBR’s ‘Downside’
scenario for a lasting 6% hit to GDP (Box 2.3). While the pattern of emissions
impacts under such a scenario is uncertain, a uniform 6% reduction in all
emitting activity relative to the Balanced Net Zero Pathway would lead to
emissions being 11 MtCO2e lower in 2035, or 57 MtCO2e across the five-year
Sixth Carbon Budget period.
• Sustained behaviour changes post-COVID. While 2020 has seen some large
changes in patterns of behaviour due to the COVID-19 pandemic and
associated restrictions, it is unclear the extent to which these changes will
endure:
– In the Widespread Engagement scenario, we have explored the
impacts of some sustained societal and behavioural changes (e.g. a
sustained reduction in business aviation demand, due to greater
familiarity with videoconferencing). This does not represent the full
range of possible societal changes that result from the pandemic.
– Given the lack of clear evidence on how much behaviour may
change and for how long, in the Balanced Pathway we have
assumed that behaviour patterns return to how they were before the
pandemic. Sustained changes of some of the kinds seen during 2020
(e.g. increased working from home, more walking and cycling) would
tend to reduce overall emissions and also have positive co-impacts for
health.
• Changes to the UK Greenhouse Gas Inventory.
– There will be changes to how UK emissions are estimated, owing to
increasing the scope of the emissions inventory to count all emissions
from wetlands and also because of changes in estimates from the
IPCC for the global warming potentials of methane and other non-
CO2 gases (see Box 2.1). These changes are expected to be made
before 2025 and, in each case, there is a range of possible impacts
depending on the precise methodology chosen. We have included
those extra emissions at the upper end of current estimates. This means
there is a possibility that estimated emissions may end up being
around 15 MtCO2e lower than we have assumed in our analysis.
Should this transpire, the Sixth Carbon Budget would have an effective
75 MtCO2e of headroom across the five-year budget period.
Where possible, our analysis makes conservative assumptions about uncertain factors including economic growth and changes to the UK greenhouse gas inventory.
Changes to how UK emissions are estimated can make the budget easier or more difficult to meet. Where we know of changes in the near future, we have assumed the higher range of possible impacts.
Our Balanced Pathway does not assume lasting behavioural changes from the pandemic.
The lasting impacts of the pandemic are unclear, but may cause emissions to fall particularly if transport behaviours change.
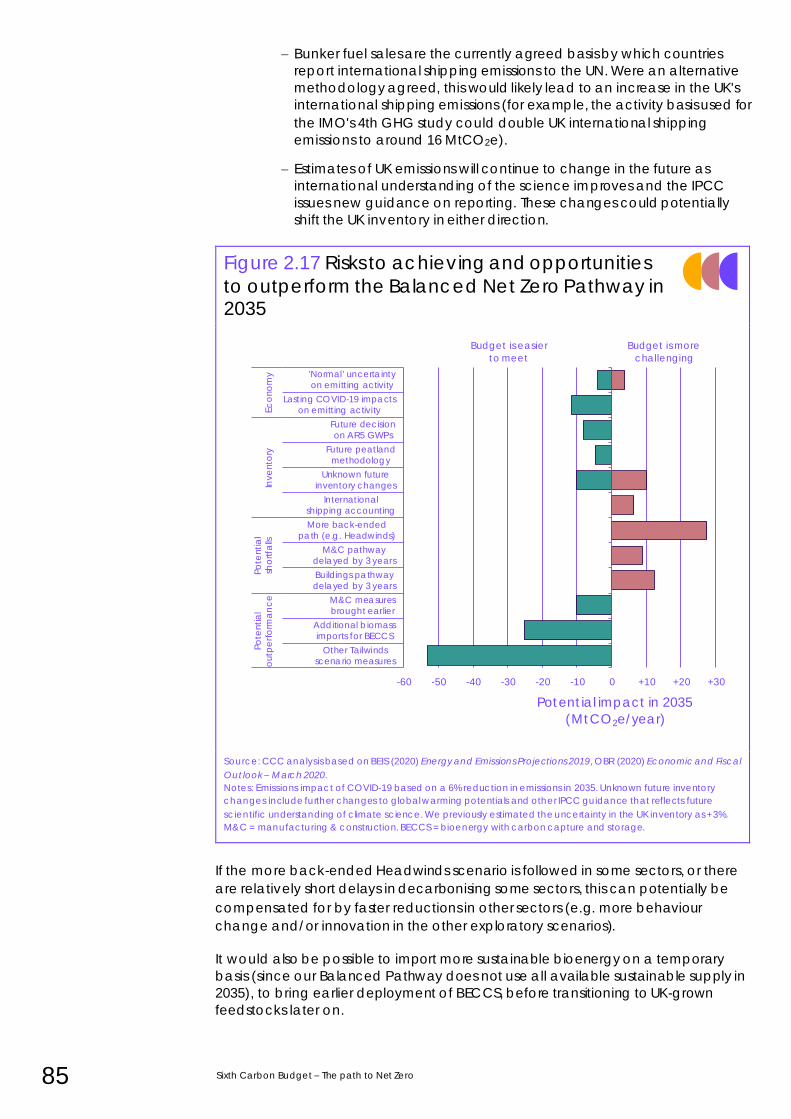
85 Sixth Carbon Budget – The path to Net Zero
– Bunker fuel sales are the currently agreed basis by which countries
report international shipping emissions to the UN. Were an alternative
methodology agreed, this would likely lead to an increase in the UK's
international shipping emissions (for example, the activity basis used for
the IMO's 4th GHG study could double UK international shipping
emissions to around 16 MtCO2e).
– Estimates of UK emissions will continue to change in the future as
international understanding of the science improves and the IPCC
issues new guidance on reporting. These changes could potentially
shift the UK inventory in either direction.
Figure 2.17 Risks to achieving and opportunities
to outperform the Balanced Net Zero Pathway in 2035
Source: CCC analysis based on BEIS (2020) Energy and Emissions Projections 2019, OBR (2020) Economic and Fiscal
Out look – March 2020.
Notes: Emissions impact of COVID-19 based on a 6% reduction in emissions in 2035. Unknown future inventory
changes include further changes to global warming potentials and other IPCC guidance that reflects future
scientific understanding of climate science. We previously estimated the uncertainty in the UK inventory as +3%.
M&C = manufacturing & construction. BECCS = bioenergy with carbon capture and storage.
If the more back-ended Headwinds scenario is followed in some sectors, or there
are relatively short delays in decarbonising some sectors, this can potentially be
compensated for by faster reductions in other sectors (e.g. more behaviour
change and/or innovation in the other exploratory scenarios).
It would also be possible to import more sustainable bioenergy on a temporary
basis (since our Balanced Pathway does not use all available sustainable supply in
2035), to bring earlier deployment of BECCS, before transitioning to UK-grown
feedstocks later on.
-60 -50 -40 -30 -20 -10 0 +10 +20 +30
Other Tailwindsscenario measures
Additional biomassimports for BECCS
M&C measuresbrought earlier
Buildings pathwaydelayed by 3 years
M&C pathwaydelayed by 3 years
More back-endedpath (e.g. Headwinds)
Internationalshipping accounting
Unknown futureinventory changes
Future peatlandmethodology
Future decisionon AR5 GWPs
Lasting COVID-19 impactson emitting activity
'Normal' uncertaintyon emitting activity
Po
tentia
lo
utp
erf
orm
an
ce
Po
tentia
lsh
ortfa
llsIn
ve
nto
ryEc
ono
my
Potential impact in 2035
(MtCO2e/year)
Budget is easier
to meet
Budget is more
challenging
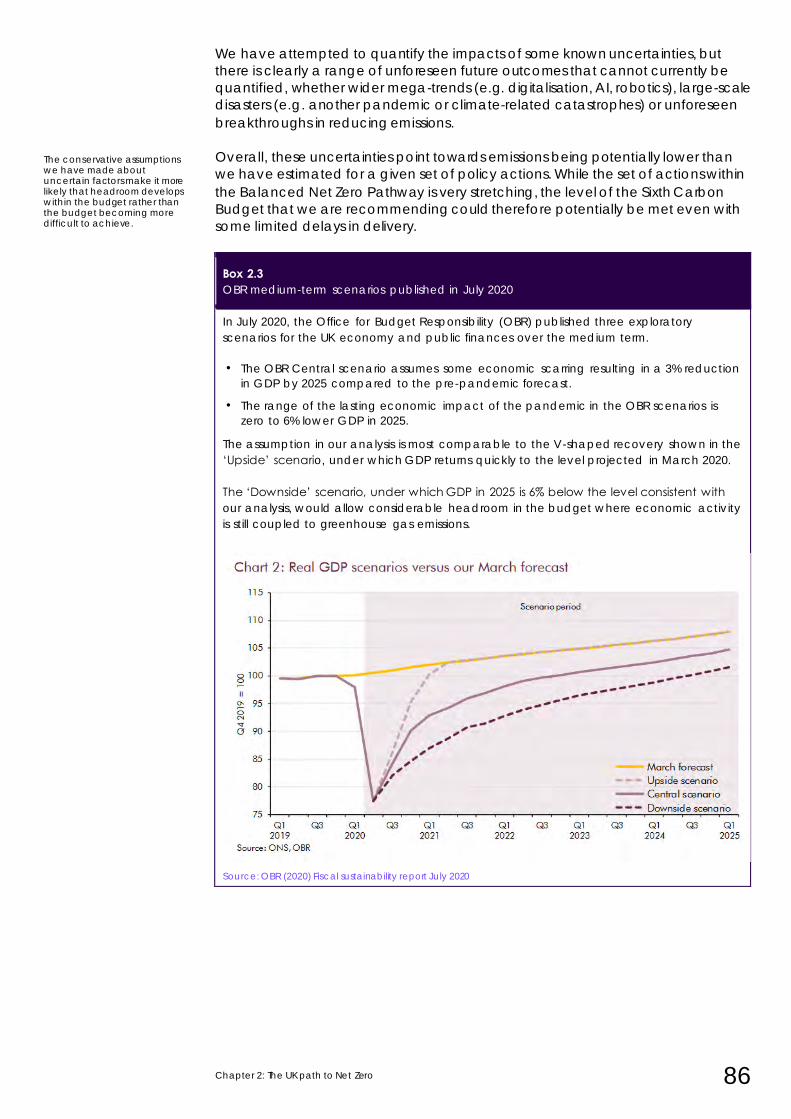
Chapter 2: The UK path to Net Zero 86
We have attempted to quantify the impacts of some known uncertainties, but
there is clearly a range of unforeseen future outcomes that cannot currently be
quantified, whether wider mega-trends (e.g. digitalisation, AI, robotics), large-scale
disasters (e.g. another pandemic or climate-related catastrophes) or unforeseen
breakthroughs in reducing emissions.
Overall, these uncertainties point towards emissions being potentially lower than
we have estimated for a given set of policy actions. While the set of actions within
the Balanced Net Zero Pathway is very stretching, the level of the Sixth Carbon
Budget that we are recommending could therefore potentially be met even with
some limited delays in delivery.
Box 2.3 OBR medium-term scenarios published in July 2020
In July 2020, the Office for Budget Responsibility (OBR) published three exploratory
scenarios for the UK economy and public finances over the medium term.
• The OBR Central scenario assumes some economic scarring resulting in a 3% reduction
in GDP by 2025 compared to the pre-pandemic forecast.
• The range of the lasting economic impact of the pandemic in the OBR scenarios is
zero to 6% lower GDP in 2025.
The assumption in our analysis is most comparable to the V-shaped recovery shown in the
‘Upside’ scenario, under which GDP returns quickly to the level projected in March 2020.
The ‘Downside’ scenario, under which GDP in 2025 is 6% below the level consistent with
our analysis, would allow considerable headroom in the budget where economic activity
is still coupled to greenhouse gas emissions.
Source: OBR (2020) Fiscal sustainability report July 2020
The conservative assumptions we have made about uncertain factors make it more likely that headroom develops within the budget rather than the budget becoming more difficult to achieve.
87 Sixth Carbon Budget – The path to Net Zero
3. Can the UK achieve Net Zero significantly before 2050?
As well as using our exploratory scenarios to explore a range of ways to achieve
Net Zero by around 2050, we also combined the more optimistic assumptions on
societal/behavioural change and on innovation to produce the ‘Tailwinds’
scenario, which aims to achieve Net Zero as early as possible.
Tailwinds is a highly optimistic scenario, stretching feasibility in a wide range of
areas and going beyond the current evidence in others. Even then, this scenario
only reaches Net Zero in 2042, with a reduction of 87% by 2035 (Figure 2.18).
We consider it unlikely that the Tailwinds scenario could be delivered across the
board.
It requires that policy works first time, with full effect and in all cases to drive cost
reductions and changes to behaviour, and that a range of uncertain technologies
turn out at the better end of the range of expectations. These include:
• Diet change. A 50% reduction in meat and dairy consumption – which is at
the highest range of our modelled scenarios – and a corresponding
reduction in emissions from agriculture while releasing additional land for
carbon sequestration.
• Aviation demand and efficiency. A 15% reduction on 2018 passenger levels
as well as rapid improvements in efficiency and widespread use of biofuel
and carbon-neutral synthetic jet fuel by 2050.
• Very low-cost renewable electricity. A further halving of the costs of
offshore wind and other renewables to £23/MWh by 2050.
• Major improvements to energy- and resource-efficiency across all sectors:
– The fastest uptake of energy efficiency measures in buildings to the full
economic potential, in combination with higher efficiency heat
pumps.
– All HGVs adopt efficiency measures (compared to an 80% uptake in
the Balanced Pathway).
• Rapid uptake of new technologies including a 2030 switchover date for
electric vehicles; widespread acceptance of heat pumps in buildings, with
innovative solutions for less-suited homes; production and public
acceptance of lab-grown meat.
• Energy networks and industrial clusters. Rapid roll-out of CCS and hydrogen
infrastructure at industrial sites, as well as upgrade of electricity grids to
cope with widespread electrification.
• Land use. Very high rates of tree-planting (70,000 hectares per year) and
other land-based measures by 2050.
• Engineered removals. The Tailwinds scenario contains the highest level of
engineered removals in any of our scenarios. Bioenergy with carbon
capture and storage scales up more quickly, a large increase in sustainable
biomass imports is assumed, and DACCS is available at commercial scale
of 15 MtCO2/year by 2050.
The Tailwinds scenario is highly optimistic and requires everything to go right first time.
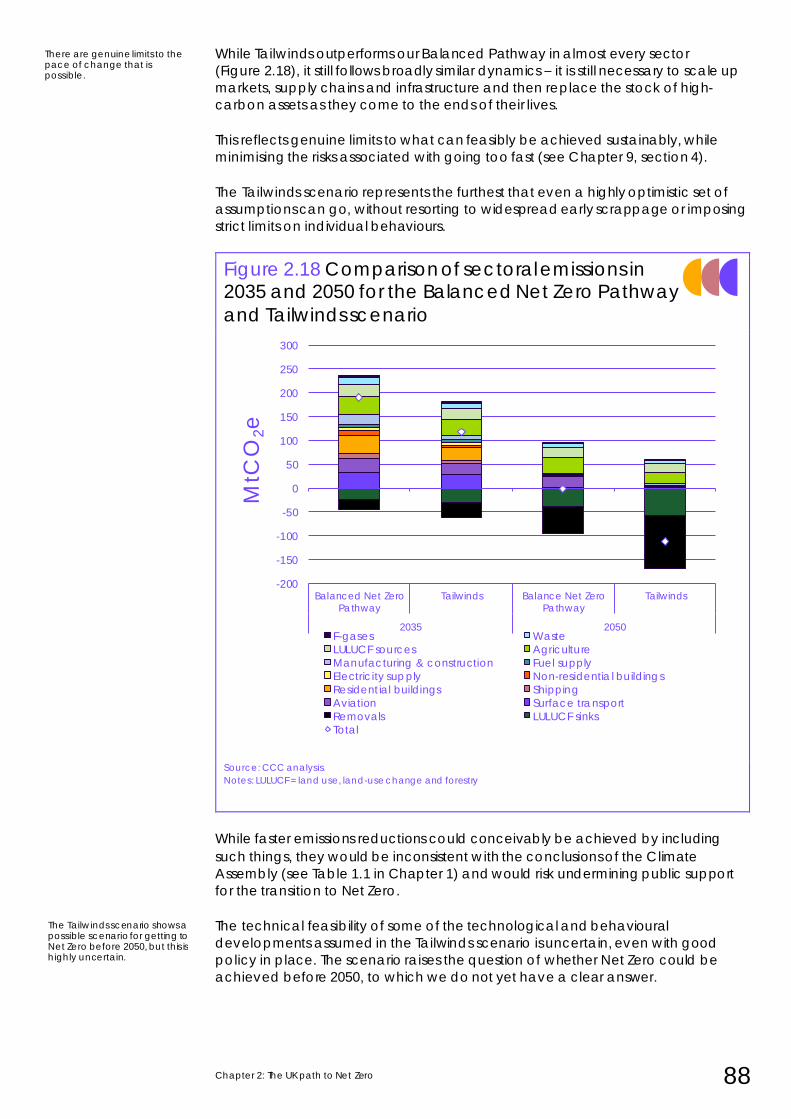
Chapter 2: The UK path to Net Zero 88
While Tailwinds outperforms our Balanced Pathway in almost every sector
(Figure 2.18), it still follows broadly similar dynamics – it is still necessary to scale up
markets, supply chains and infrastructure and then replace the stock of high-
carbon assets as they come to the ends of their lives.
This reflects genuine limits to what can feasibly be achieved sustainably, while
minimising the risks associated with going too fast (see Chapter 9, section 4).
The Tailwinds scenario represents the furthest that even a highly optimistic set of
assumptions can go, without resorting to widespread early scrappage or imposing
strict limits on individual behaviours.
Figure 2.18 Comparison of sectoral emissions in 2035 and 2050 for the Balanced Net Zero Pathway
and Tailwinds scenario
Source: CCC analysis.
Notes: LULUCF = land use, land-use change and forestry
While faster emissions reductions could conceivably be achieved by including
such things, they would be inconsistent with the conclusions of the Climate
Assembly (see Table 1.1 in Chapter 1) and would risk undermining public support
for the transition to Net Zero.
The technical feasibility of some of the technological and behavioural
developments assumed in the Tailwinds scenario is uncertain, even with good
policy in place. The scenario raises the question of whether Net Zero could be
achieved before 2050, to which we do not yet have a clear answer.
There are genuine limits to the pace of change that is possible.
The Tailwinds scenario shows a possible scenario for getting to Net Zero before 2050, but this is highly uncertain.
-200
-150
-100
-50
0
50
100
150
200
250
300
Balanced Net ZeroPathway
Tailwinds Balance Net ZeroPathway
Tailwinds
2035 2050
MtC
O2e
F-gases Waste
LULUCF sources Agriculture
Manufacturing & construction Fuel supply
Electricity supply Non-residential buildings
Residential buildings Shipping
Aviation Surface transport
Removals LULUCF sinks
Total
89 Sixth Carbon Budget – The path to Net Zero
Given these considerations, we continue to recommend Net Zero by 2050 at the
latest as the appropriate goal for the UK. Should it become evident later in the
2020s that we are in a position to be able to take a path closer to that outlined in
Tailwinds, it may be appropriate to revisit the date of Net Zero. This would require
most or all of the following:
• Progress in deployment. It is critical that progress is made in the first half of
the 2020s on reducing emissions across a wide range of areas, in line with –
or ideally ahead of – our Balanced Net Zero Pathway.
• Behaviours. Policies for the 2020s must be designed to encourage the sorts
of societal and behaviour changes that would reduce emissions while also
providing co-benefits in some cases (e.g. to health). These include reduced
demand for flying and healthier diets that contain significantly less meat
and dairy, as well as uptake of unfamiliar technologies such as heat pumps.
Should it turn out that people are willing to embrace these changes, faster
progress may be possible to reduce emissions.
• Learning by doing. Should the major cost reductions seen in the last
decade for solar, wind and batteries be repeated in those or other areas
over the next decade (e.g. in electrolysis, greenhouse gas removals, plus
further reductions in costs of zero-carbon electricity), emissions could fall
more quickly. Such cost reductions will require learning-by-doing through
deployment in the 2020s, supported where necessary by appropriate
infrastructure (e.g. CO2 infrastructure for greenhouse gas removals).
• Strategic decisions. The Government will need to make decisions on how
we will decarbonise heating and the future of gas networks in the mid-
2020s, and on heavy goods vehicles (HGVs) shortly thereafter, even under
the Balanced Pathway. There is no scope for this to slip, especially if
accelerated progress is intended.
• Breakthroughs. There is also potential scope for more speculative
breakthroughs that are not even included in the Tailwinds scenarios (e.g.
cheap and effective feed additives to reduce agricultural methane
emissions).
• New scientific evidence – for example on the relative warming potential of
methane or the rate at which UK peatlands emit greenhouse gases – could
affect the date at which Net Zero could be achieved.
Until then the priority must be to put in place strong policies to drive changes
across the board and react to new developments.
Net Zero in 2050 remains the right target for the UK.
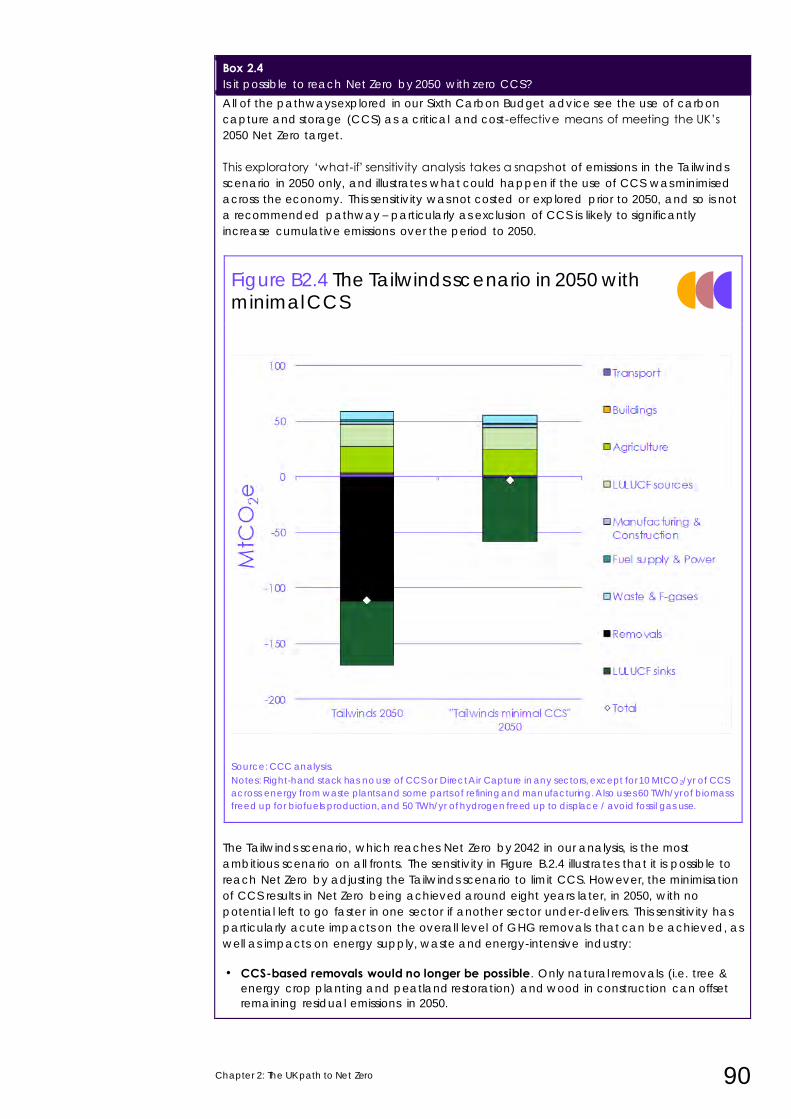
Chapter 2: The UK path to Net Zero 90
Box 2.4 Is it possible to reach Net Zero by 2050 with zero CCS?
All of the pathways explored in our Sixth Carbon Budget advice see the use of carbon
capture and storage (CCS) as a critical and cost-effective means of meeting the UK’s
2050 Net Zero target.
This exploratory ‘what-if’ sensitivity analysis takes a snapshot of emissions in the Tailwinds
scenario in 2050 only, and illustrates what could happen if the use of CCS was minimised
across the economy. This sensitivity was not costed or explored prior to 2050, and so is not
a recommended pathway – particularly as exclusion of CCS is likely to significantly
increase cumulative emissions over the period to 2050.
Figure B2.4 The Tailwinds scenario in 2050 with minimal CCS
Source: CCC analysis.
Notes: Right-hand stack has no use of CCS or Direct Air Capture in any sectors, except for 10 MtCO2/yr of CCS
across energy from waste plants and some parts of refining and manufacturing. Also uses 60 TWh/yr of biomass
freed up for biofuels production, and 50 TWh/yr of hydrogen freed up to displace / avoid fossil gas use.
The Tailwinds scenario, which reaches Net Zero by 2042 in our analysis, is the most
ambitious scenario on all fronts. The sensitivity in Figure B.2.4 illustrates that it is possible to
reach Net Zero by adjusting the Tailwinds scenario to limit CCS. However, the minimisation
of CCS results in Net Zero being achieved around eight years later, in 2050, with no
potential left to go faster in one sector if another sector under-delivers. This sensitivity has
particularly acute impacts on the overall level of GHG removals that can be achieved, as
well as impacts on energy supply, waste and energy-intensive industry:
• CCS-based removals would no longer be possible. Only natural removals (i.e. tree &
energy crop planting and peatland restoration) and wood in construction can offset
remaining residual emissions in 2050.
91 Sixth Carbon Budget – The path to Net Zero
• The best use of bioenergy would change. Given that bioenergy cannot be used with
CCS, bioenergy will achieve lower GHG savings. However, 60 TWh/year of biomass would now be available that would otherwise have been used to fuel CO 2 capture
equipment on CCS plant. This biomass could instead be converted into biofuels,
eliminating residual petroleum emissions in aviation and other parts of the economy.
• Gas-based power and hydrogen production, without CCS, would no longer be consistent with Net Zero. However, most of the hydrogen in the Tailwinds scenario is
produced via renewable electricity, so this could be manageable under th is scenario. Additionally, excluding Direct Air Capture frees up 50 TWh/year of low -carbon
hydrogen, displacing fossil gas use in power and avoiding the use of fossil gas in
hydrogen production.
• Parts of manufacturing and refining, and energy from waste plants, would still need to use CCS in order to decarbonise, as no other viable low-carbon alternatives are
available. This would require 10 MtCO2/year to be captured and stored by 2050.
Furthermore, the reliance only on natural removals to offset remaining positive emissions
(e.g. in agriculture) means that staying at Net Zero after 2050 would require ever-
increasing natural carbon stocks (e.g. in forests and peatlands), requiring a slow ly but
ever-increasing area of the UK to be devoted to sequestration.
Overall, this supports our message that CCS is essential to achieving Net Zero, at lowest
cost, in the UK. The importance of CCS globally further underscores the urgency of
progressing CCS plans in the UK.
CCS is essential to achieving Net Zero. A sensitivity analysis shows that getting to Net Zero with minimal use of CCS would be even more stretching than the highly uncertain Tailwinds scenario.
Chapter 2: The UK path to Net Zero 92
1 Evans et al. (2019) Implementation of an Emissions Inventory for UK Peatlands.
2 Myhre, G., D. Shindell, F.-M. Bréon, W. Collins, J. Fuglestvedt, J. Huang, D. Koch, J.-F. Lamarque, D.
Lee, B. Mendoza, T. Nakajima, A. Robock, G. Stephens, T. Takemura and H. Zhang, 2013:
Anthropogenic and Natural Radiative Forcing. In: Climate Change 2013: The Physical Science
Basis. Contribution of Working Group I to the Fifth Assessment Report of the Intergovernmental
Panel on Climate Change [Stocker, T.F., D. Qin, G.-K. Plattner, M. Tignor, S.K. Allen, J. Boschung,
A. Nauels, Y. Xia, V. Bex and P.M. Midgley (eds.)]. Cambridge University Press, Cambridge,
United Kingdom and New York, NY, USA.
3 CCC (2020) Net Zero after Covid: Behavioural Principles for Bui lding Back Better.
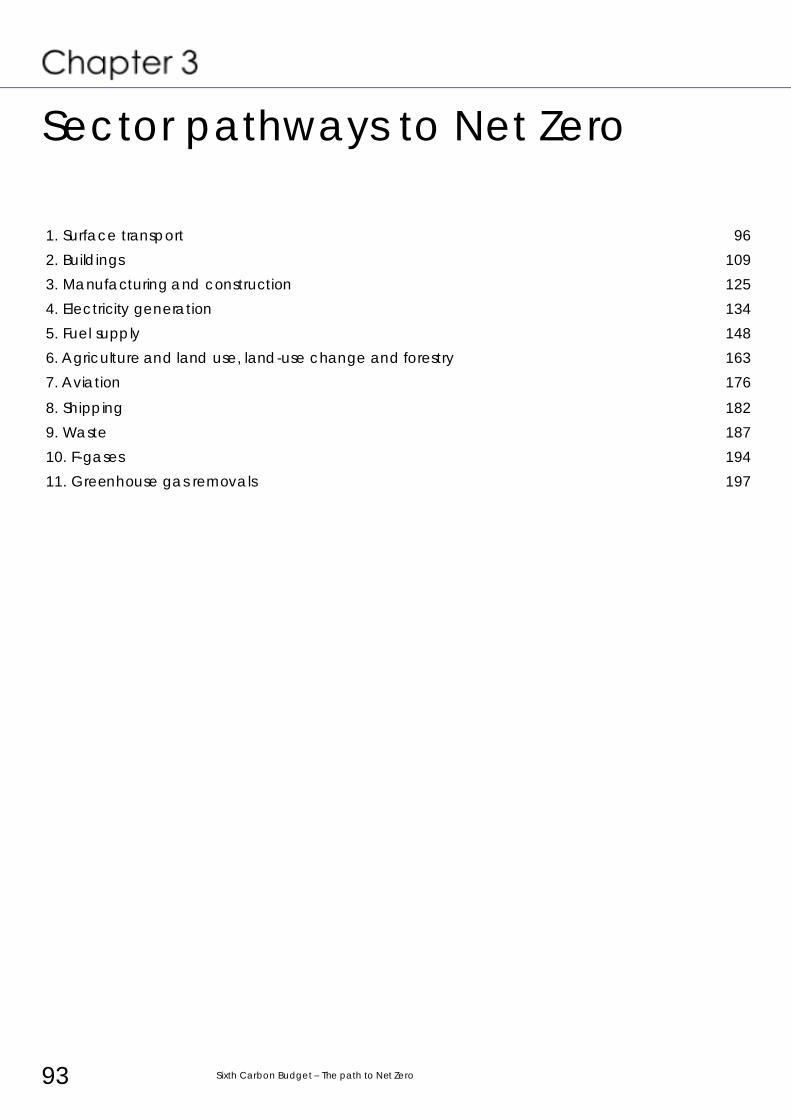
93 Sixth Carbon Budget – The path to Net Zero
Sector pathways to Net Zero
1. Surface transport 96
2. Buildings 109
3. Manufacturing and construction 125
4. Electricity generation 134
5. Fuel supply 148
6. Agriculture and land use, land-use change and forestry 163
7. Aviation 176
8. Shipping 182
9. Waste 187
10. F-gases 194
11. Greenhouse gas removals 197
95 Sixth Carbon Budget – The path to Net Zero
Introduction and key messages
Achieving the Net Zero target requires all sectors of the economy to contribute,
including international aviation and shipping. This chapter presents the scenarios
shown in Chapter 2 at a sectoral level and discusses the different options that are
available within each sector on the transition to Net Zero.
We also discuss the impacts of the choices made in each sector on investment
requirements, cost savings and the wider co-impacts on society. The economy-
wide impacts, costs and benefits of each scenario are then assessed in more detail
in Chapter 5 of this report.
Policy recommendations, and additional detail behind the analysis for each sector
is provided in the accompanying Policy and Methodology Reports.
Key messages
Our key messages in this Chapter are:
• Delivering Net Zero GHGs by 2050 will require all sectors to contribute.
• Each area of the economy must make substantial changes in the next decade to get on the path to Net Zero emissions for the whole of the UK. The transition must not be delayed.
• All sectors have multiple options to achieve a level of emissions reduction
that is consistent with Net Zero by 2050.
• Most sectors can achieve near-zero greenhouse gas emissions by 2050 in different ways. For many sectors, the shape of the overall emissions
trajectory that is required is similar even where very different options are
deployed (for example the relative uptake of electrification compared to
the use of low-carbon hydrogen in manufacturing).
• The scenarios for the agriculture, land use, aviation and greenhouse gas removals sectors have the most variation in emissions by 2050. The choices
made in these sectors have greatest impact on the UK’s residual
greenhouse gas emissions in 2050 and the scale and type of negative
emissions that are required to offset them.
• Different sector pathways bring different costs, benefits and impacts. The
choices made in each sector have wide-ranging impacts, including costs,
cost savings and co-impacts on society. Policymakers should look to
maximise the positive co-impacts of decarbonising each sector.
The analysis underpinning our key messages is set out for each of the following
sectors in this chapter:
1. Surface transport
2. Buildings
3. Manufacturing & construction
4. Electricity generation
5. Fuel supply
6. Agriculture and land use, land-use change and forestry (LULUCF)
7. Aviation
8. Shipping
9. Waste
10. F-gases
11. Greenhouse gas removals
Chapter 3: Sector pathways to Net Zero 96
1. Surface transport
Introduction and key messages Surface transport GHG emissions were 113 MtCO2e in 2019, comprising 22% of total
UK GHG emissions. This could fall to 32 MtCO2e by 2035 in our Balanced Net Zero
Pathway. Delivering this transition will require take-up of low-carbon technologies,
low-carbon fuels and efficiency improvements for petrol and diesel vehicles and
behaviour change to reduce travel demand and shift journeys onto lower-carbon
modes of transport.
Achieving this reduction will require significant investment in technology and
infrastructure but these will be more than offset by savings in operational
expenditure, delivering an estimated net benefit to consumers of £8 billion per year
in 2035.
Our assessment is based on detailed modelling, literature review and stakeholder
engagement. We commissioned Element Energy to assess trajectories for uptake of
zero-carbon options for HGVs.
The rest of this section is set out in three parts:
a) The Balanced Net Zero Pathway for surface transport
b) Alternative routes to delivering abatement in the mid-2030s
c) Impacts of the scenarios: costs, benefits and co-impacts on society
a) The Balanced Net Zero Pathway for surface transport
In our Balanced Pathway, options to reduce emissions, including take-up of zero-
emission technologies and reduction in travel demand, combine to reduce
surface transport emissions by around 70% to 32 MtCO2e by 2035 and to
approximately 1 MtCO2e by 2050 (Figure 3.1.a).
Surface transport is currently the UK’s highest emitting sector.
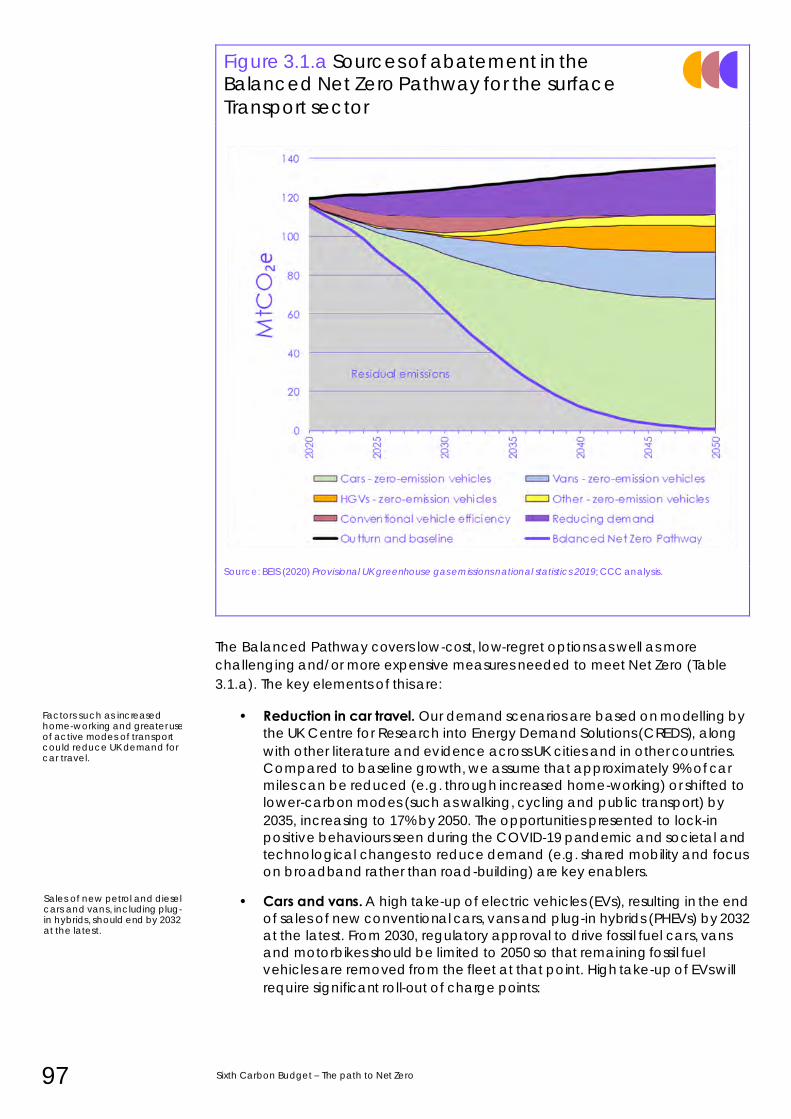
97 Sixth Carbon Budget – The path to Net Zero
Figure 3.1.a Sources of abatement in the Balanced Net Zero Pathway for the surface
Transport sector
Source: BEIS (2020) Provisional UK greenhouse gas emissions national statistics 2019; CCC analysis.
The Balanced Pathway covers low-cost, low-regret options as well as more
challenging and/or more expensive measures needed to meet Net Zero (Table
3.1.a). The key elements of this are:
• Reduction in car travel. Our demand scenarios are based on modelling by
the UK Centre for Research into Energy Demand Solutions (CREDS), along
with other literature and evidence across UK cities and in other countries.
Compared to baseline growth, we assume that approximately 9% of car
miles can be reduced (e.g. through increased home-working) or shifted to
lower-carbon modes (such as walking, cycling and public transport) by
2035, increasing to 17% by 2050. The opportunities presented to lock-in
positive behaviours seen during the COVID-19 pandemic and societal and
technological changes to reduce demand (e.g. shared mobility and focus
on broadband rather than road-building) are key enablers.
• Cars and vans. A high take-up of electric vehicles (EVs), resulting in the end
of sales of new conventional cars, vans and plug-in hybrids (PHEVs) by 2032
at the latest. From 2030, regulatory approval to drive fossil fuel cars, vans
and motorbikes should be limited to 2050 so that remaining fossil fuel
vehicles are removed from the fleet at that point. High take-up of EVs will
require significant roll-out of charge points:
Factors such as increased home-working and greater use of active modes of transport could reduce UK demand for car travel.
Sales of new petrol and diesel cars and vans, including plug-in hybrids, should end by 2032 at the latest.
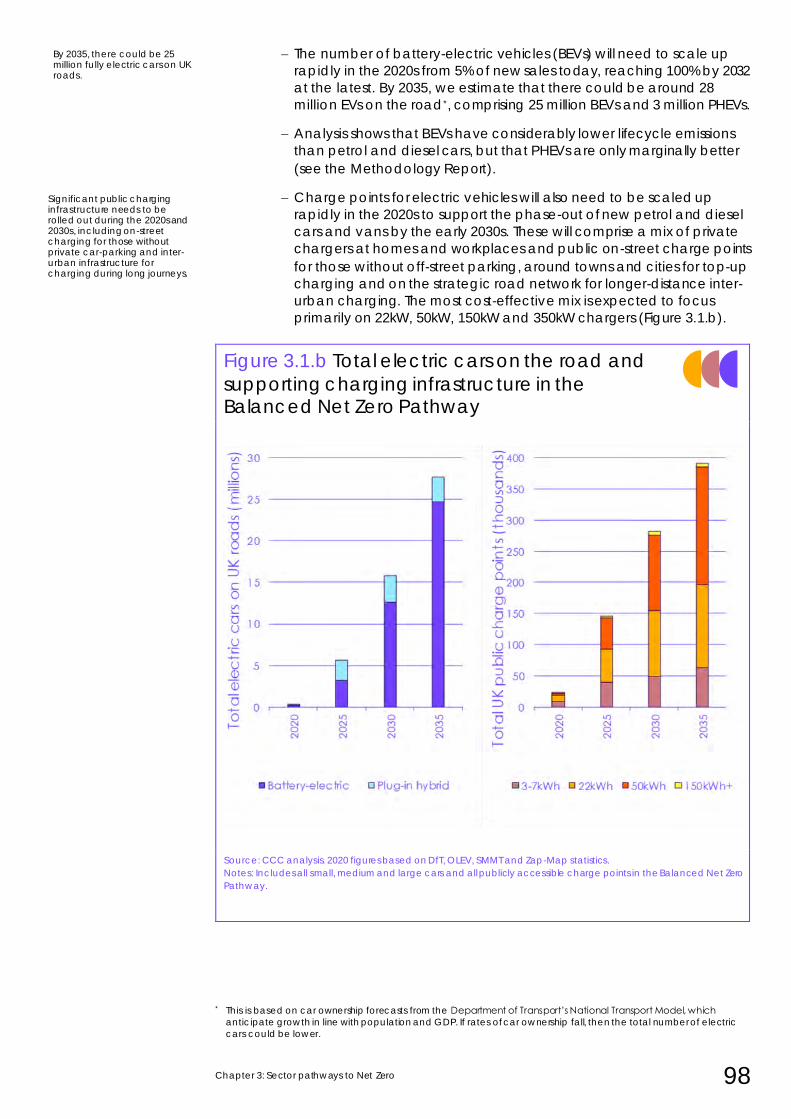
Chapter 3: Sector pathways to Net Zero 98
– The number of battery-electric vehicles (BEVs) will need to scale up
rapidly in the 2020s from 5% of new sales today, reaching 100% by 2032
at the latest. By 2035, we estimate that there could be around 28
million EVs on the road*, comprising 25 million BEVs and 3 million PHEVs.
– Analysis shows that BEVs have considerably lower lifecycle emissions
than petrol and diesel cars, but that PHEVs are only marginally better
(see the Methodology Report).
– Charge points for electric vehicles will also need to be scaled up
rapidly in the 2020s to support the phase-out of new petrol and diesel
cars and vans by the early 2030s. These will comprise a mix of private
chargers at homes and workplaces and public on-street charge points
for those without off-street parking, around towns and cities for top-up
charging and on the strategic road network for longer-distance inter-
urban charging. The most cost-effective mix is expected to focus
primarily on 22kW, 50kW, 150kW and 350kW chargers (Figure 3.1.b).
Figure 3.1.b Total electric cars on the road and
supporting charging infrastructure in the Balanced Net Zero Pathway
Source: CCC analysis. 2020 figures based on DfT, OLEV, SMMT and Zap-Map statistics.
Notes: Includes all small, medium and large cars and all publicly accessible charge points in the Balanced Net Zero
Pathway.
* This is based on car ownership forecasts from the Department of Transport’s National Transport Model, which
anticipate growth in line with population and GDP. If rates of car ownership fall, then the total number of electric
cars could be lower.
By 2035, there could be 25 million fully electric cars on UK roads.
Significant public charging infrastructure needs to be rolled out during the 2020s and 2030s, including on-street charging for those without private car-parking and inter-urban infrastructure for charging during long journeys.
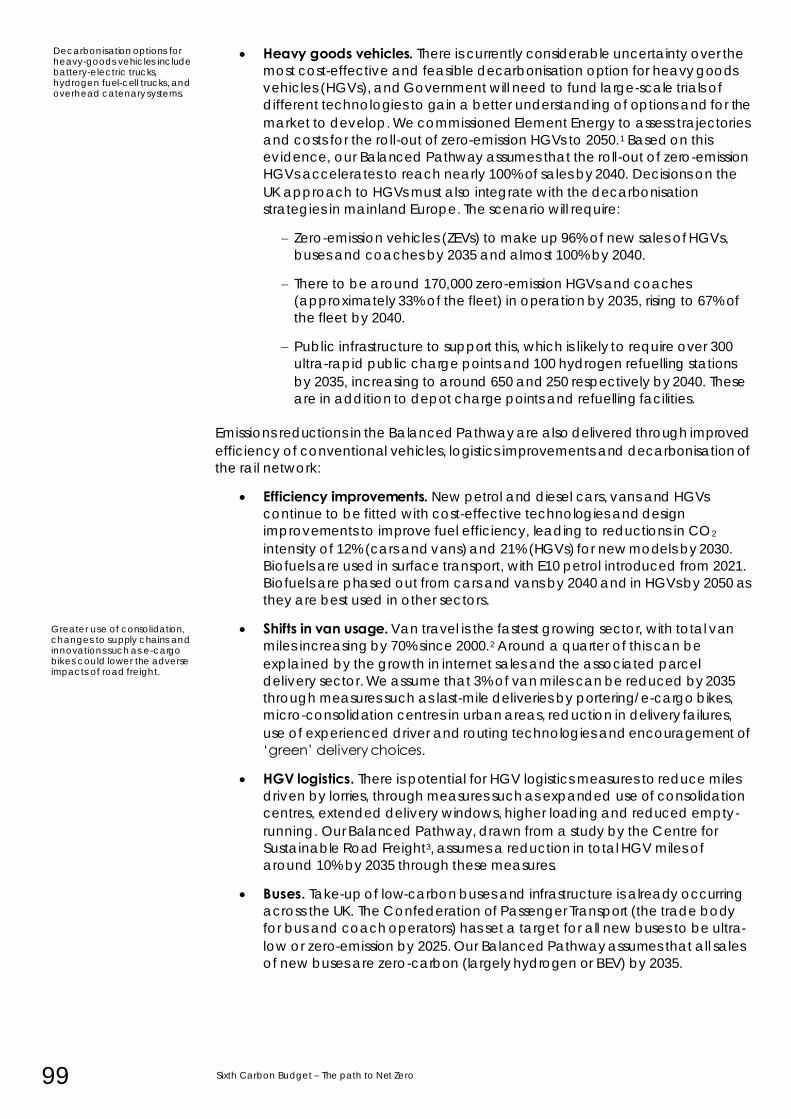
99 Sixth Carbon Budget – The path to Net Zero
• Heavy goods vehicles. There is currently considerable uncertainty over the
most cost-effective and feasible decarbonisation option for heavy goods
vehicles (HGVs), and Government will need to fund large-scale trials of
different technologies to gain a better understanding of options and for the
market to develop. We commissioned Element Energy to assess trajectories
and costs for the roll-out of zero-emission HGVs to 2050.1 Based on this
evidence, our Balanced Pathway assumes that the roll-out of zero-emission
HGVs accelerates to reach nearly 100% of sales by 2040. Decisions on the
UK approach to HGVs must also integrate with the decarbonisation
strategies in mainland Europe. The scenario will require:
– Zero-emission vehicles (ZEVs) to make up 96% of new sales of HGVs,
buses and coaches by 2035 and almost 100% by 2040.
– There to be around 170,000 zero-emission HGVs and coaches
(approximately 33% of the fleet) in operation by 2035, rising to 67% of
the fleet by 2040.
– Public infrastructure to support this, which is likely to require over 300
ultra-rapid public charge points and 100 hydrogen refuelling stations
by 2035, increasing to around 650 and 250 respectively by 2040. These
are in addition to depot charge points and refuelling facilities.
Emissions reductions in the Balanced Pathway are also delivered through improved
efficiency of conventional vehicles, logistics improvements and decarbonisation of
the rail network:
• Efficiency improvements. New petrol and diesel cars, vans and HGVs
continue to be fitted with cost-effective technologies and design
improvements to improve fuel efficiency, leading to reductions in CO2
intensity of 12% (cars and vans) and 21% (HGVs) for new models by 2030.
Biofuels are used in surface transport, with E10 petrol introduced from 2021.
Biofuels are phased out from cars and vans by 2040 and in HGVs by 2050 as
they are best used in other sectors.
• Shifts in van usage. Van travel is the fastest growing sector, with total van
miles increasing by 70% since 2000.2 Around a quarter of this can be
explained by the growth in internet sales and the associated parcel
delivery sector. We assume that 3% of van miles can be reduced by 2035
through measures such as last-mile deliveries by portering/e-cargo bikes,
micro-consolidation centres in urban areas, reduction in delivery failures,
use of experienced driver and routing technologies and encouragement of
‘green’ delivery choices.
• HGV logistics. There is potential for HGV logistics measures to reduce miles
driven by lorries, through measures such as expanded use of consolidation
centres, extended delivery windows, higher loading and reduced empty-
running. Our Balanced Pathway, drawn from a study by the Centre for
Sustainable Road Freight3, assumes a reduction in total HGV miles of
around 10% by 2035 through these measures.
• Buses. Take-up of low-carbon buses and infrastructure is already occurring
across the UK. The Confederation of Passenger Transport (the trade body
for bus and coach operators) has set a target for all new buses to be ultra-
low or zero-emission by 2025. Our Balanced Pathway assumes that all sales
of new buses are zero-carbon (largely hydrogen or BEV) by 2035.
Decarbonisation options for heavy-goods vehicles include battery-electric trucks, hydrogen fuel-cell trucks, and overhead catenary systems.
Greater use of consolidation, changes to supply chains and innovations such as e-cargo bikes could lower the adverse impacts of road freight.
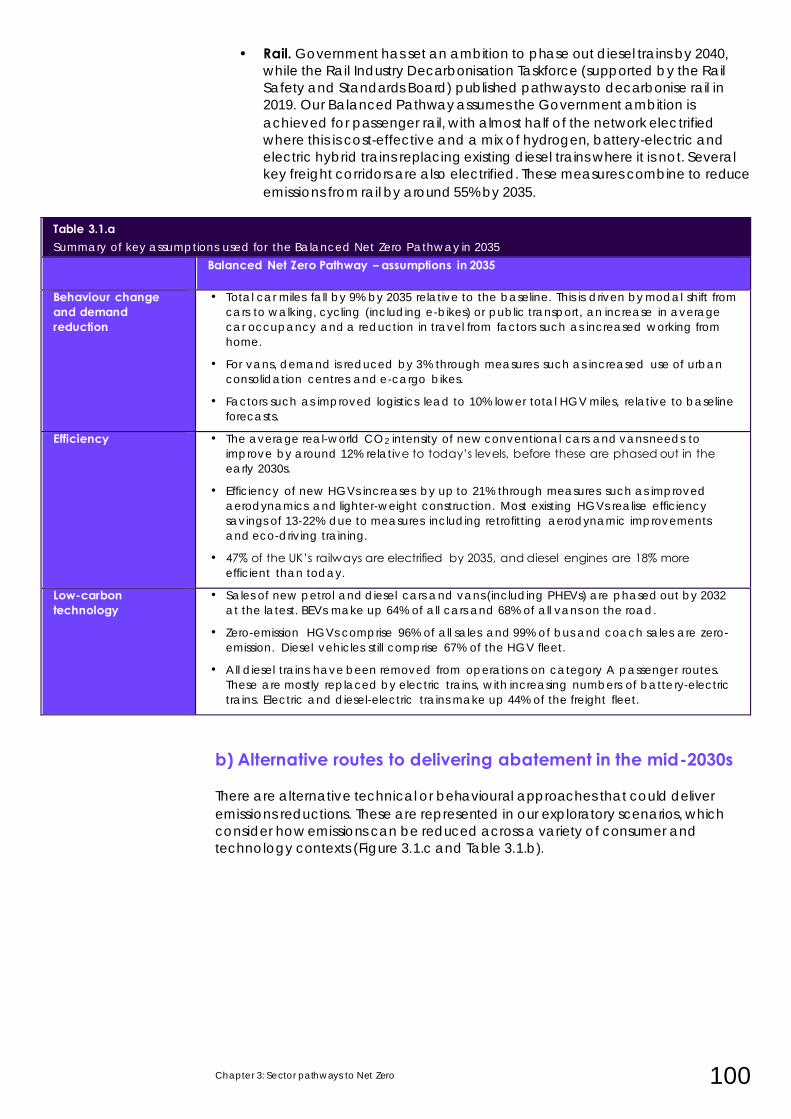
Chapter 3: Sector pathways to Net Zero 100
• Rail. Government has set an ambition to phase out diesel trains by 2040,
while the Rail Industry Decarbonisation Taskforce (supported by the Rail
Safety and Standards Board) published pathways to decarbonise rail in
2019. Our Balanced Pathway assumes the Government ambition is
achieved for passenger rail, with almost half of the network electrified
where this is cost-effective and a mix of hydrogen, battery-electric and
electric hybrid trains replacing existing diesel trains where it is not. Several
key freight corridors are also electrified. These measures combine to reduce
emissions from rail by around 55% by 2035.
Table 3.1.a Summary of key assumptions used for the Balanced Net Zero Pathway in 2035
Balanced Net Zero Pathway – assumptions in 2035
Behaviour change and demand reduction
• Total car miles fall by 9% by 2035 relative to the baseline. This is driven by modal shift from
cars to walking, cycling (including e-bikes) or public transport, an increase in average
car occupancy and a reduction in travel from factors such as increased working from
home.
• For vans, demand is reduced by 3% through measures such as increased use of urban
consolidation centres and e-cargo bikes.
• Factors such as improved logistics lead to 10% lower total HGV miles, relative to baseline
forecasts.
Efficiency • The average real-world CO2 intensity of new conventional cars and vans needs to
improve by around 12% relative to today’s levels, before these are phased out in the
early 2030s.
• Efficiency of new HGVs increases by up to 21% through measures such as improved
aerodynamics and lighter-weight construction. Most existing HGVs realise efficiency
savings of 13-22% due to measures including retrofitting aerodynamic improvements
and eco-driving training.
• 47% of the UK’s railways are electrified by 2035, and diesel engines are 18% more
efficient than today.
Low-carbon technology
• Sales of new petrol and diesel cars and vans (including PHEVs) are phased out by 2032
at the latest. BEVs make up 64% of all cars and 68% of all vans on the road.
• Zero-emission HGVs comprise 96% of all sales and 99% of bus and coach sales are zero-
emission. Diesel vehicles still comprise 67% of the HGV fleet.
• All diesel trains have been removed from operations on category A passenger routes.
These are mostly replaced by electric trains, with increasing numbers of battery-electric
trains. Electric and diesel-electric trains make up 44% of the freight fleet.
b) Alternative routes to delivering abatement in the mid-2030s
There are alternative technical or behavioural approaches that could deliver
emissions reductions. These are represented in our exploratory scenarios, which
consider how emissions can be reduced across a variety of consumer and
technology contexts (Figure 3.1.c and Table 3.1.b).
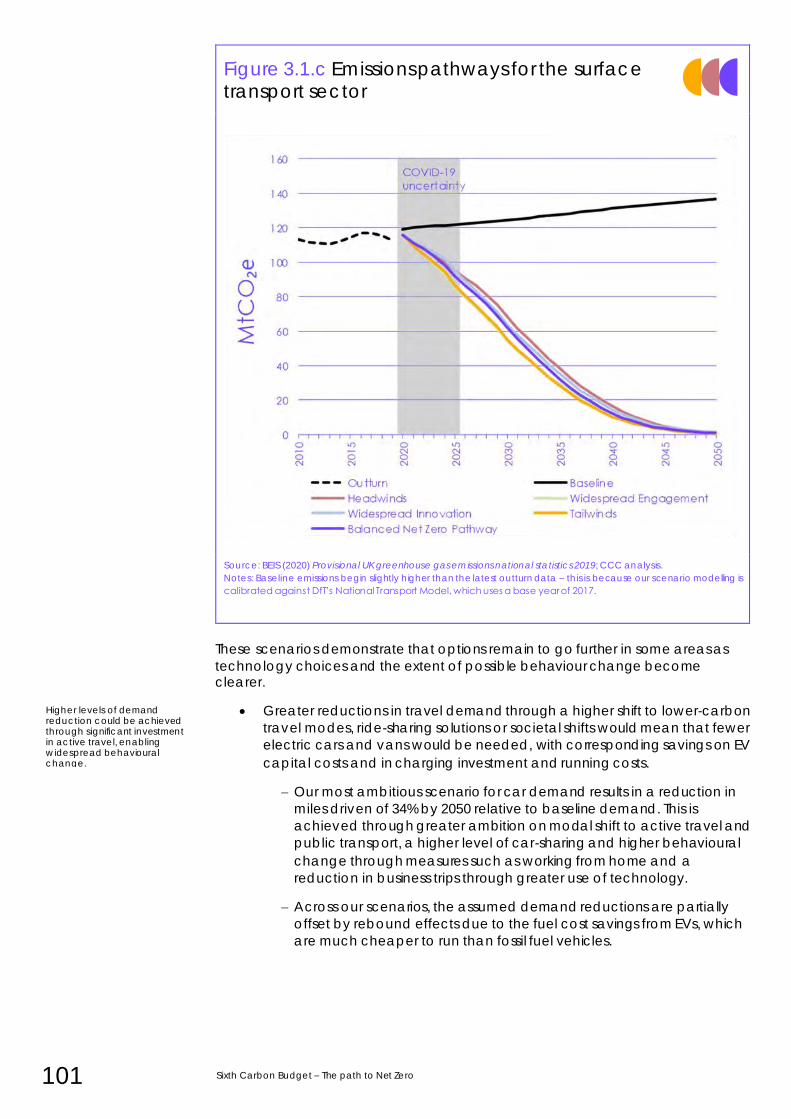
101 Sixth Carbon Budget – The path to Net Zero
Figure 3.1.c Emissions pathways for the surface transport sector
Source: BEIS (2020) Provisional UK greenhouse gas emissions national statistics 2019; CCC analysis.
Notes: Baseline emissions begin slightly higher than the latest outturn data – this is because our scenario modelling is
calibrated against DfT’s National Transport Model, which uses a base year of 2017.
These scenarios demonstrate that options remain to go further in some areas as
technology choices and the extent of possible behaviour change become clearer.
• Greater reductions in travel demand through a higher shift to lower-carbon
travel modes, ride-sharing solutions or societal shifts would mean that fewer
electric cars and vans would be needed, with corresponding savings on EV
capital costs and in charging investment and running costs.
– Our most ambitious scenario for car demand results in a reduction in
miles driven of 34% by 2050 relative to baseline demand. This is
achieved through greater ambition on modal shift to active travel and
public transport, a higher level of car-sharing and higher behavioural
change through measures such as working from home and a
reduction in business trips through greater use of technology.
– Across our scenarios, the assumed demand reductions are partially
offset by rebound effects due to the fuel cost savings from EVs, which
are much cheaper to run than fossil fuel vehicles.
Higher levels of demand reduction could be achieved through significant investment in active travel, enabling widespread behavioural change.
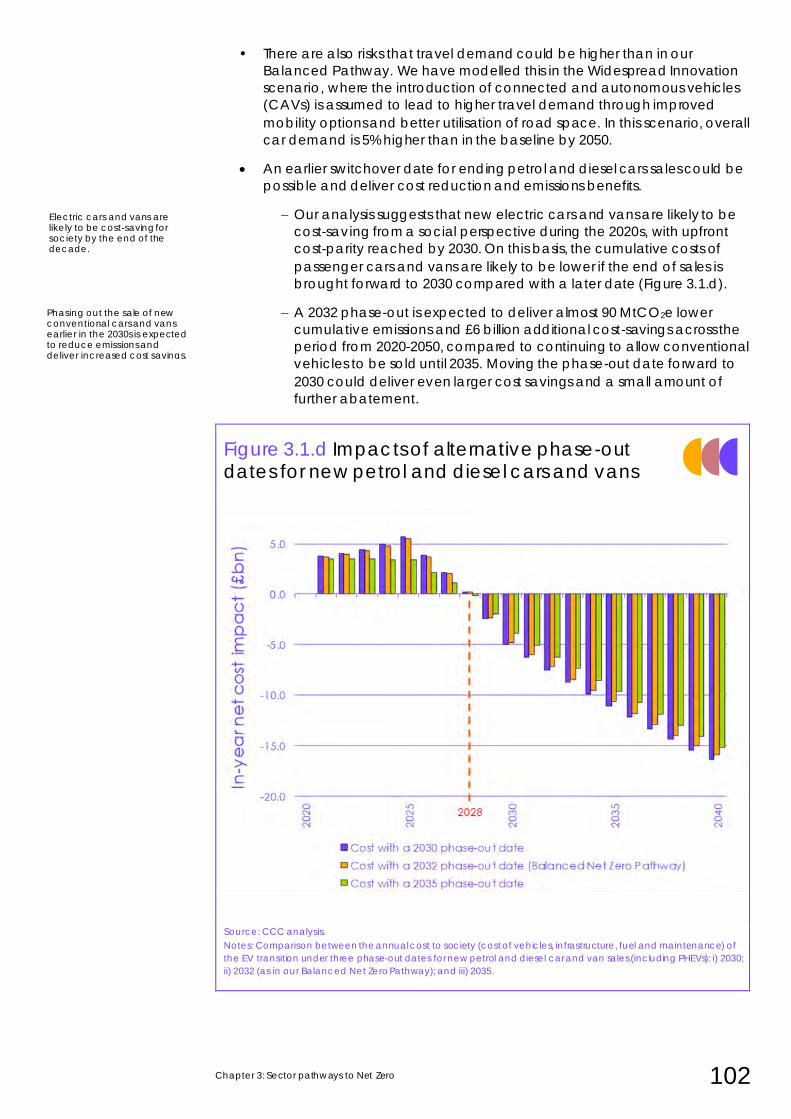
Chapter 3: Sector pathways to Net Zero 102
• There are also risks that travel demand could be higher than in our
Balanced Pathway. We have modelled this in the Widespread Innovation
scenario, where the introduction of connected and autonomous vehicles
(CAVs) is assumed to lead to higher travel demand through improved
mobility options and better utilisation of road space. In this scenario, overall
car demand is 5% higher than in the baseline by 2050.
• An earlier switchover date for ending petrol and diesel cars sales could be
possible and deliver cost reduction and emissions benefits.
– Our analysis suggests that new electric cars and vans are likely to be
cost-saving from a social perspective during the 2020s, with upfront
cost-parity reached by 2030. On this basis, the cumulative costs of
passenger cars and vans are likely to be lower if the end of sales is
brought forward to 2030 compared with a later date (Figure 3.1.d).
– A 2032 phase-out is expected to deliver almost 90 MtCO2e lower
cumulative emissions and £6 billion additional cost-savings across the
period from 2020-2050, compared to continuing to allow conventional
vehicles to be sold until 2035. Moving the phase-out date forward to
2030 could deliver even larger cost savings and a small amount of
further abatement.
Figure 3.1.d Impacts of alternative phase-out dates for new petrol and diesel cars and vans
Source: CCC analysis.
Notes: Comparison between the annual cost to society (cost of vehicles, infrastructure, fuel and maintenance) of
the EV transition under three phase-out dates for new petrol and diesel car and van sales (including PHEVs): i) 2030;
ii) 2032 (as in our Balanced Net Zero Pathway); and iii) 2035.
Electric cars and vans are likely to be cost-saving for society by the end of the decade.
Phasing out the sale of new conventional cars and vans earlier in the 2030s is expected to reduce emissions and deliver increased cost savings.
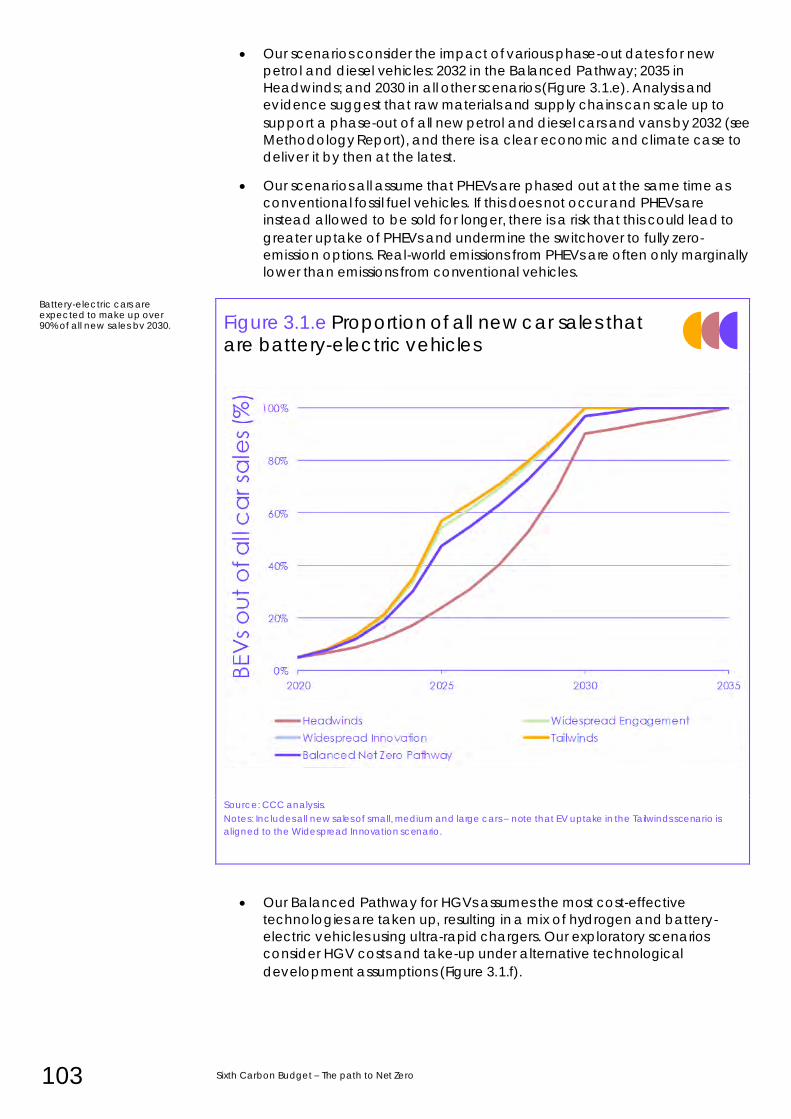
103 Sixth Carbon Budget – The path to Net Zero
• Our scenarios consider the impact of various phase-out dates for new
petrol and diesel vehicles: 2032 in the Balanced Pathway; 2035 in
Headwinds; and 2030 in all other scenarios (Figure 3.1.e). Analysis and
evidence suggest that raw materials and supply chains can scale up to
support a phase-out of all new petrol and diesel cars and vans by 2032 (see
Methodology Report), and there is a clear economic and climate case to
deliver it by then at the latest.
• Our scenarios all assume that PHEVs are phased out at the same time as
conventional fossil fuel vehicles. If this does not occur and PHEVs are
instead allowed to be sold for longer, there is a risk that this could lead to
greater uptake of PHEVs and undermine the switchover to fully zero-
emission options. Real-world emissions from PHEVs are often only marginally
lower than emissions from conventional vehicles.
Figure 3.1.e Proportion of all new car sales that are battery-electric vehicles
Source: CCC analysis.
Notes: Includes all new sales of small, medium and large cars – note that EV uptake in the Tailwinds scenario is
aligned to the Widespread Innovation scenario.
• Our Balanced Pathway for HGVs assumes the most cost-effective
technologies are taken up, resulting in a mix of hydrogen and battery-
electric vehicles using ultra-rapid chargers. Our exploratory scenarios
consider HGV costs and take-up under alternative technological
development assumptions (Figure 3.1.f).
Battery-electric cars are expected to make up over 90% of all new sales by 2030.
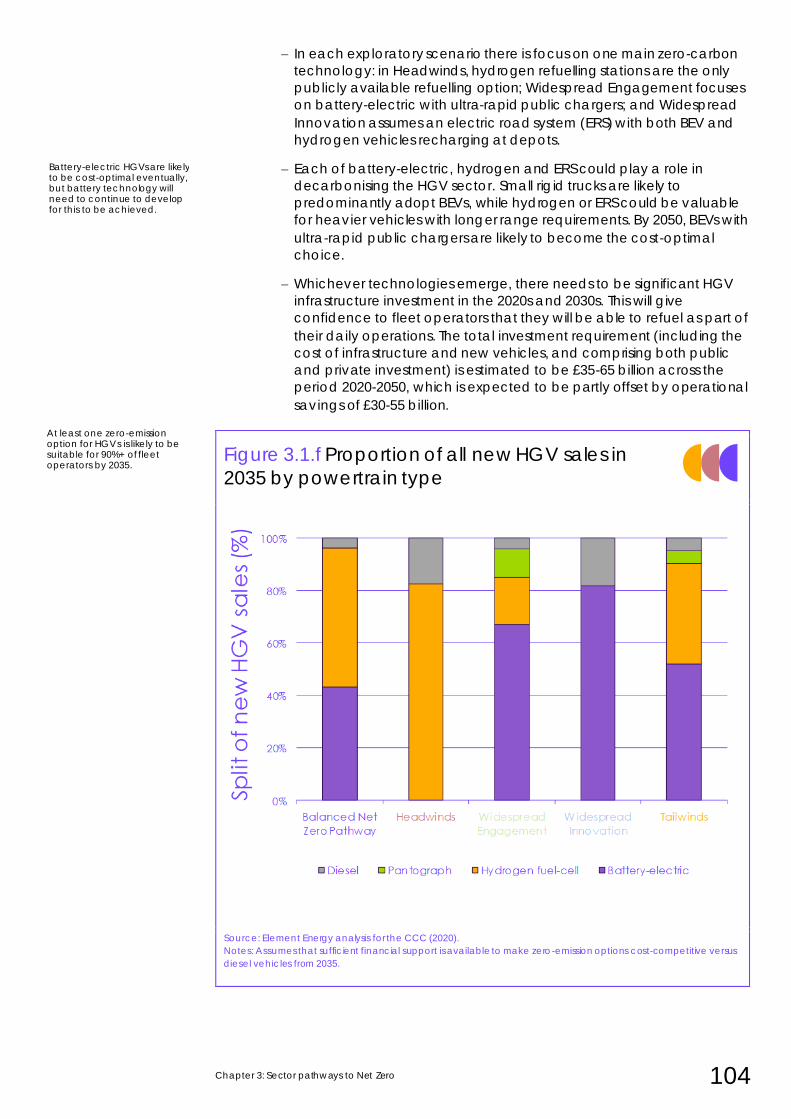
Chapter 3: Sector pathways to Net Zero 104
– In each exploratory scenario there is focus on one main zero-carbon
technology: in Headwinds, hydrogen refuelling stations are the only
publicly available refuelling option; Widespread Engagement focuses
on battery-electric with ultra-rapid public chargers; and Widespread
Innovation assumes an electric road system (ERS) with both BEV and
hydrogen vehicles recharging at depots.
– Each of battery-electric, hydrogen and ERS could play a role in
decarbonising the HGV sector. Small rigid trucks are likely to
predominantly adopt BEVs, while hydrogen or ERS could be valuable
for heavier vehicles with longer range requirements. By 2050, BEVs with
ultra-rapid public chargers are likely to become the cost-optimal
choice.
– Whichever technologies emerge, there needs to be significant HGV
infrastructure investment in the 2020s and 2030s. This will give
confidence to fleet operators that they will be able to refuel as part of
their daily operations. The total investment requirement (including the
cost of infrastructure and new vehicles, and comprising both public
and private investment) is estimated to be £35-65 billion across the
period 2020-2050, which is expected to be partly offset by operational
savings of £30-55 billion.
Figure 3.1.f Proportion of all new HGV sales in
2035 by powertrain type
Source: Element Energy analysis for the CCC (2020).
Notes: Assumes that sufficient financial support is available to make zero-emission options cost-competitive versus
diesel vehicles from 2035.
At least one zero-emission option for HGVs is likely to be suitable for 90%+ of fleet operators by 2035.
Battery-electric HGVs are likely to be cost-optimal eventually, but battery technology will need to continue to develop for this to be achieved.
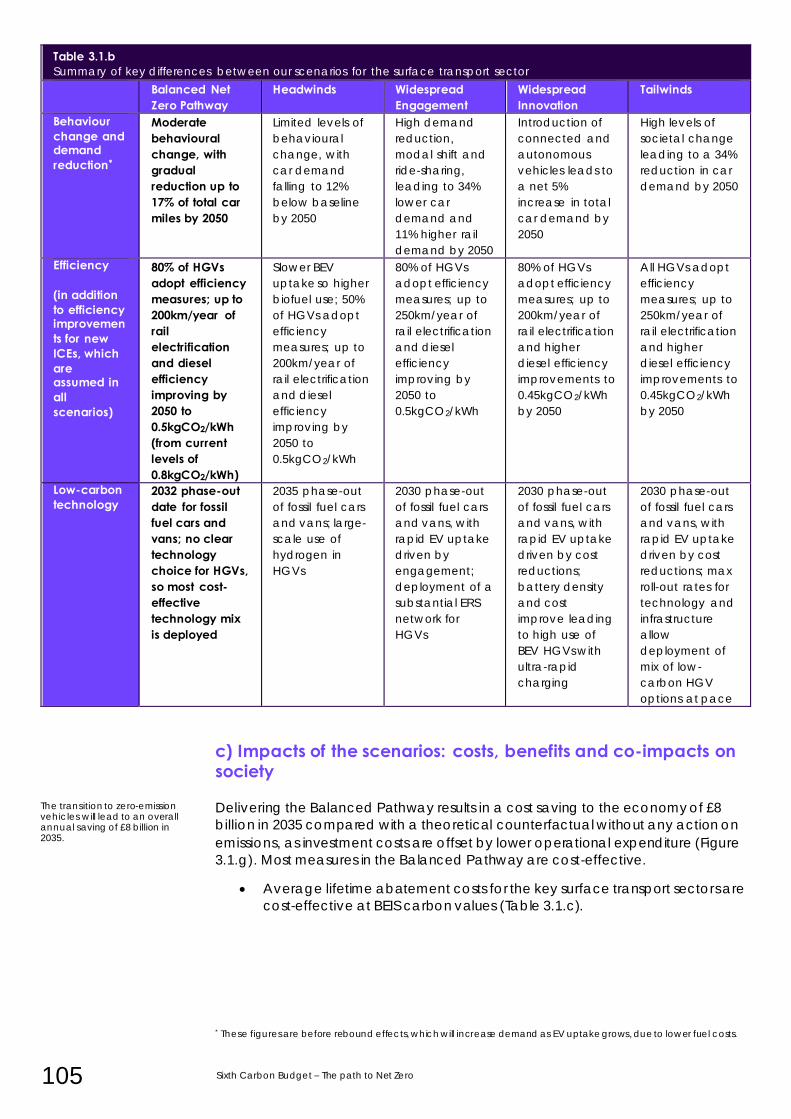
105 Sixth Carbon Budget – The path to Net Zero
Table 3.1.b Summary of key differences between our scenarios for the surface transport sector
Balanced Net Zero Pathway
Headwinds Widespread Engagement
Widespread Innovation
Tailwinds
Behaviour change and demand reduction*
Moderate behavioural change, with gradual reduction up to 17% of total car miles by 2050
Limited levels of
behavioural
change, with
car demand
falling to 12%
below baseline
by 2050
High demand
reduction,
modal shift and
ride-sharing,
leading to 34%
lower car
demand and
11% higher rail
demand by 2050
Introduction of
connected and
autonomous
vehicles leads to
a net 5%
increase in total
car demand by
2050
High levels of
societal change
leading to a 34%
reduction in car
demand by 2050
Efficiency
(in addition to efficiency improvements for new ICEs, which are assumed in all scenarios)
80% of HGVs adopt efficiency measures; up to 200km/year of rail electrification and diesel efficiency improving by 2050 to 0.5kgCO2/kWh (from current levels of 0.8kgCO2/kWh)
Slower BEV
uptake so higher
biofuel use; 50%
of HGVs adopt
efficiency
measures; up to
200km/year of
rail electrification
and diesel
efficiency
improving by
2050 to
0.5kgCO2/kWh
80% of HGVs
adopt efficiency
measures; up to
250km/year of
rail electrification
and diesel
efficiency
improving by
2050 to
0.5kgCO2/kWh
80% of HGVs
adopt efficiency
measures; up to
200km/year of
rail electrification
and higher
diesel efficiency
improvements to
0.45kgCO2/kWh
by 2050
All HGVs adopt
efficiency
measures; up to
250km/year of
rail electrification
and higher
diesel efficiency
improvements to
0.45kgCO2/kWh
by 2050
Low-carbon technology
2032 phase-out date for fossil fuel cars and vans; no clear technology choice for HGVs, so most cost-effective technology mix is deployed
2035 phase-out
of fossil fuel cars
and vans; large-
scale use of
hydrogen in
HGVs
2030 phase-out
of fossil fuel cars
and vans, with
rapid EV uptake
driven by
engagement;
deployment of a
substantial ERS
network for
HGVs
2030 phase-out
of fossil fuel cars
and vans, with
rapid EV uptake
driven by cost
reductions;
battery density
and cost
improve leading
to high use of
BEV HGVs with
ultra-rapid
charging
2030 phase-out
of fossil fuel cars
and vans, with
rapid EV uptake
driven by cost
reductions; max
roll-out rates for
technology and
infrastructure
allow
deployment of
mix of low-
carbon HGV
options at pace
c) Impacts of the scenarios: costs, benefits and co-impacts on society
Delivering the Balanced Pathway results in a cost saving to the economy of £8
billion in 2035 compared with a theoretical counterfactual without any action on
emissions, as investment costs are offset by lower operational expenditure (Figure
3.1.g). Most measures in the Balanced Pathway are cost-effective.
• Average lifetime abatement costs for the key surface transport sectors are
cost-effective at BEIS carbon values (Table 3.1.c).
* These figures are before rebound effects, which will increase demand as EV uptake grows, due to lower fuel costs.
The transition to zero-emission vehicles will lead to an overall annual saving of £8 billion in 2035.
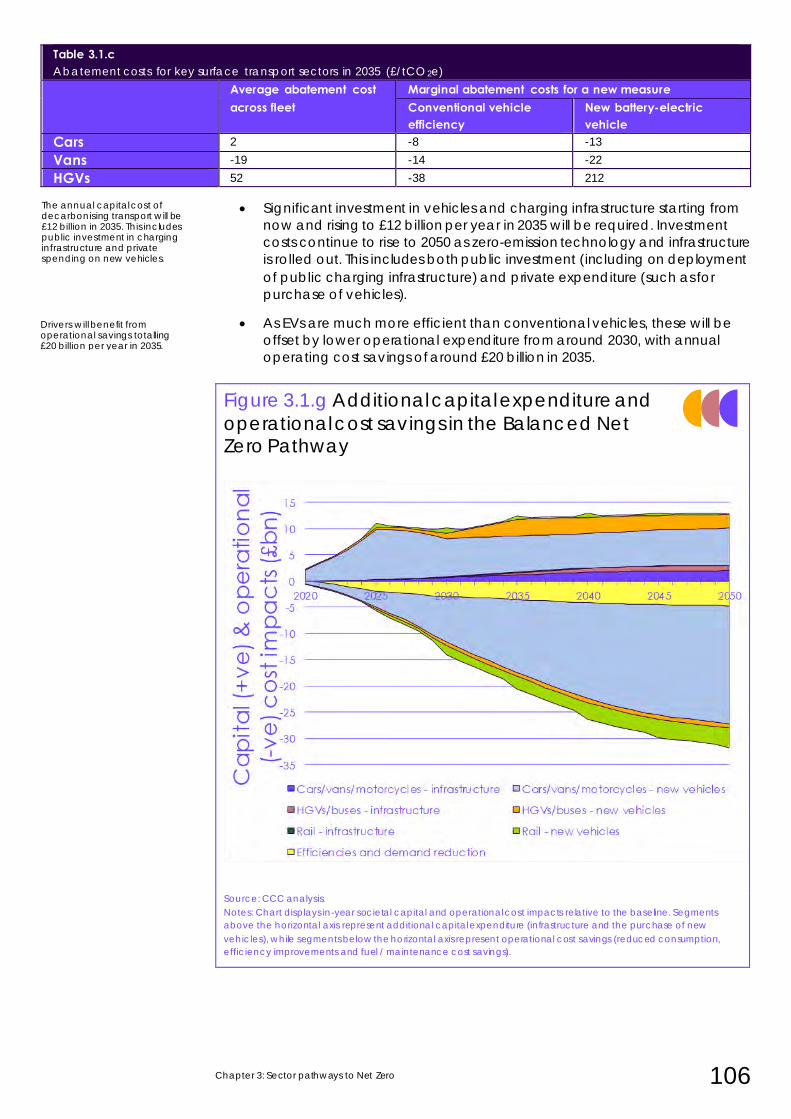
Chapter 3: Sector pathways to Net Zero 106
Table 3.1.c Abatement costs for key surface transport sectors in 2035 (£/tCO2e)
Average abatement cost across fleet
Marginal abatement costs for a new measure Conventional vehicle efficiency
New battery-electric vehicle
Cars 2 -8 -13
Vans -19 -14 -22
HGVs 52 -38 212
• Significant investment in vehicles and charging infrastructure starting from
now and rising to £12 billion per year in 2035 will be required. Investment
costs continue to rise to 2050 as zero-emission technology and infrastructure
is rolled out. This includes both public investment (including on deployment
of public charging infrastructure) and private expenditure (such as for
purchase of vehicles).
• As EVs are much more efficient than conventional vehicles, these will be
offset by lower operational expenditure from around 2030, with annual
operating cost savings of around £20 billion in 2035.
Figure 3.1.g Additional capital expenditure and
operational cost savings in the Balanced Net Zero Pathway
Source: CCC analysis.
Notes: Chart displays in-year societal capital and operational cost impacts relative to the baseline. Segments
above the horizontal axis represent additional capital expenditure (infrastructure and the purchase of new
vehicles), while segments below the horizontal axis represent operational cost savings (reduced consumption,
efficiency improvements and fuel / maintenance cost savings).
The annual capital cost of decarbonising transport will be £12 billion in 2035. This includes public investment in charging infrastructure and private spending on new vehicles.
Drivers will benefit from operational savings totalling £20 billion per year in 2035.
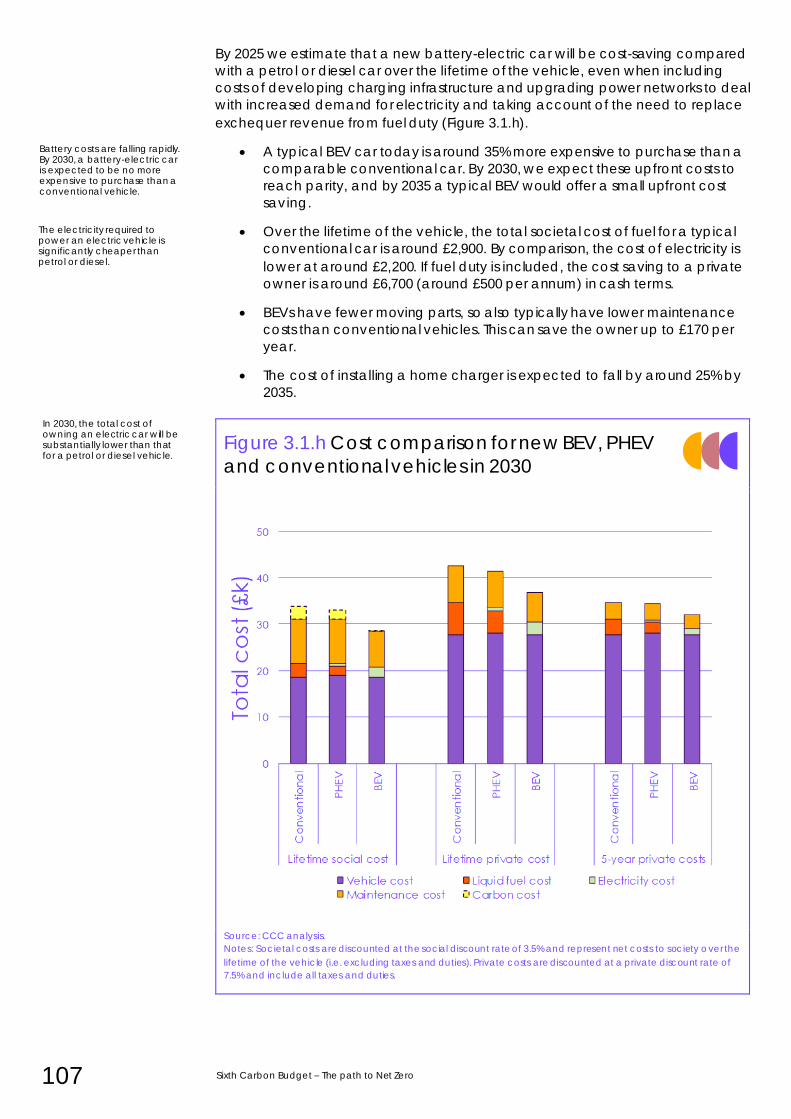
107 Sixth Carbon Budget – The path to Net Zero
By 2025 we estimate that a new battery-electric car will be cost-saving compared
with a petrol or diesel car over the lifetime of the vehicle, even when including
costs of developing charging infrastructure and upgrading power networks to deal
with increased demand for electricity and taking account of the need to replace
exchequer revenue from fuel duty (Figure 3.1.h).
• A typical BEV car today is around 35% more expensive to purchase than a
comparable conventional car. By 2030, we expect these upfront costs to
reach parity, and by 2035 a typical BEV would offer a small upfront cost
saving.
• Over the lifetime of the vehicle, the total societal cost of fuel for a typical
conventional car is around £2,900. By comparison, the cost of electricity is
lower at around £2,200. If fuel duty is included, the cost saving to a private
owner is around £6,700 (around £500 per annum) in cash terms.
• BEVs have fewer moving parts, so also typically have lower maintenance
costs than conventional vehicles. This can save the owner up to £170 per
year.
• The cost of installing a home charger is expected to fall by around 25% by
2035.
Figure 3.1.h Cost comparison for new BEV, PHEV
and conventional vehicles in 2030
Source: CCC analysis.
Notes: Societal costs are discounted at the social discount rate of 3.5% and represent net costs to society over the
lifetime of the vehicle (i.e. excluding taxes and duties). Private costs are discounted at a private discount rate of
7.5% and include all taxes and duties.
Battery costs are falling rapidly. By 2030, a battery-electric car is expected to be no more expensive to purchase than a conventional vehicle.
The electricity required to power an electric vehicle is significantly cheaper than petrol or diesel.
In 2030, the total cost of owning an electric car will be substantially lower than that for a petrol or diesel vehicle.
Chapter 3: Sector pathways to Net Zero 108
In addition to significant emissions reductions and operating cost savings, many of
the measures we outline have wider benefits to society:
• Reduced demand for car travel and improved delivery logistics will lead to
lower levels of congestion and better air quality, particularly in urban areas.
• Switching to active forms of travel, such as walking and cycling, should
offer health and wellbeing benefits.
• Widespread uptake of zero-emission vehicles will deliver improvements in
air quality (particularly in NO2 and CO2) and noise reduction.
Demand reduction, shifts to lower-carbon modes of transport and widespread EV uptake will bring significant co-benefits alongside emissions reduction.
109 Sixth Carbon Budget – The path to Net Zero
2. Buildings
Introduction and key messages
Direct buildings emissions were 87 MtCO2e in 2019. Progress in delivering emissions
reductions has broadly flatlined since 2015, when comparing on a temperature
adjusted basis.
Our pathways to 2050 aim to reduce emissions in buildings to zero by 2050 at the
latest, based on the findings of our Net Zero report. They also aim to ensure
buildings of the future are comfortable, healthy spaces to be year-round, which
are resilient to overheating and other climate risks.
Our Balanced Net Zero Pathway reflects four priorities over the coming decade or so:
• Deliver on the Government’s energy efficiency plans to upgrade all
buildings to EPC C over the next 10-15 years.
• Scale up the market for heat pumps as a critical technology for
decarbonising space heating, while maintaining quality.
• Expand the rollout of low-carbon heat networks in heat dense areas like
cities, using anchor loads such as hospitals and schools. Prepare to shift
away from using fossil fuel Combined Heat and Power (CHP) as a supply-
source towards low-carbon and waste heat by preference from the mid-
2020s.
• Prepare for a potential role for hydrogen in heat through a set of trials
building on the current innovation programme.
This programme requires a major ramp-up from what is happening today in supply chains for insulation, heat pumps and heat networks. Our detailed analysis demonstrates that this is feasible:
• We commissioned Element Energy to undertake bottom-up modelling of
heat decarbonisation for existing homes. Alongside modelling undertaken
in house, the assessment indicates that delivering net zero emissions in
buildings is feasible.
• This assessment is underpinned by the latest available evidence on the cost
and performance of measures, and on deployment constraints, informed
by a literature review and through evidence gathering from expert
stakeholders.
• The installation rates for insulation measures such as lofts and cavity walls
are within the range previously achieved under the supplier obligations in
the early 2010s. Solid wall installation rates are more ambitious but
considered achievable with strong policy in our testing with stakeholders.
The rest of this section is set out in three parts:
a) The Balanced Net Zero Pathway for buildings
b) Alternative routes to delivering abatement in the mid-2030s
c) Impacts of the Scenarios – costs and benefits
Our pathways reduce emissions in buildings to zero by 2050 at the latest, whilst adapting to a changing climate.
They require a major ramp up in supply chains for insulation, heat pumps and heat networks, which our analysis shows is feasible.
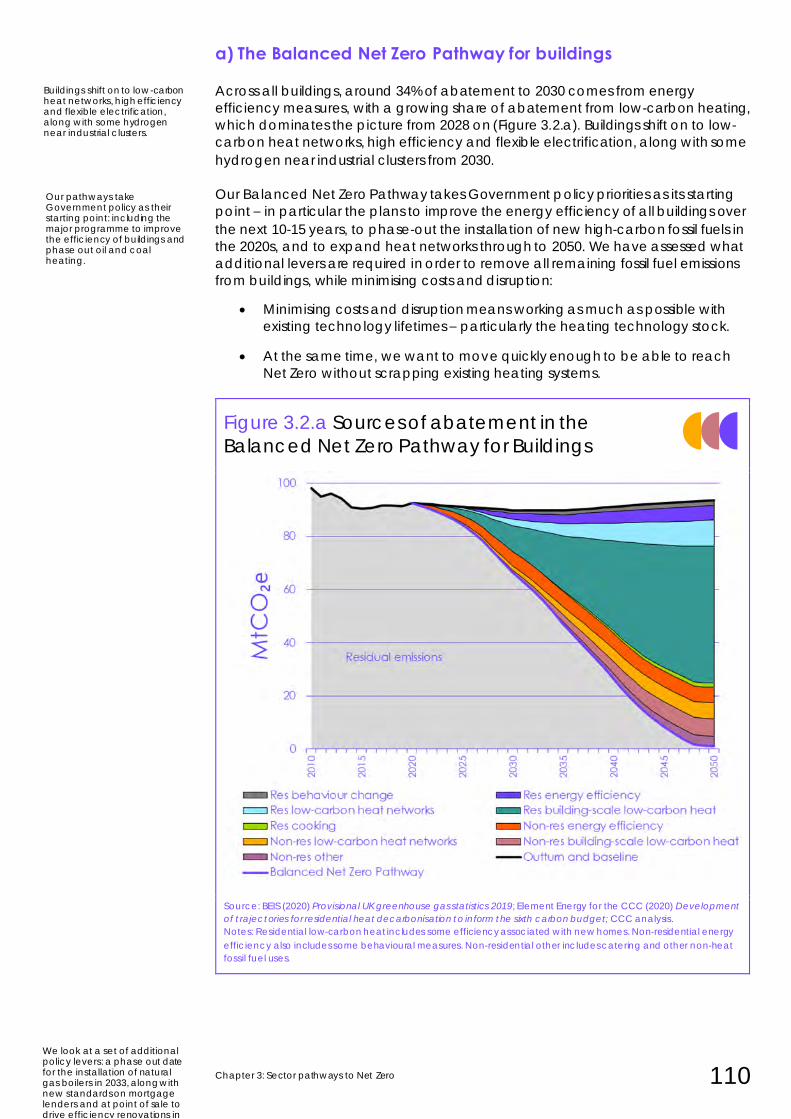
Chapter 3: Sector pathways to Net Zero 110
a) The Balanced Net Zero Pathway for buildings
Across all buildings, around 34% of abatement to 2030 comes from energy
efficiency measures, with a growing share of abatement from low-carbon heating,
which dominates the picture from 2028 on (Figure 3.2.a). Buildings shift on to low-
carbon heat networks, high efficiency and flexible electrification, along with some
hydrogen near industrial clusters from 2030.
Our Balanced Net Zero Pathway takes Government policy priorities as its starting
point – in particular the plans to improve the energy efficiency of all buildings over
the next 10-15 years, to phase-out the installation of new high-carbon fossil fuels in
the 2020s, and to expand heat networks through to 2050. We have assessed what
additional levers are required in order to remove all remaining fossil fuel emissions
from buildings, while minimising costs and disruption:
• Minimising costs and disruption means working as much as possible with
existing technology lifetimes – particularly the heating technology stock.
• At the same time, we want to move quickly enough to be able to reach
Net Zero without scrapping existing heating systems.
Figure 3.2.a Sources of abatement in the
Balanced Net Zero Pathway for Buildings
Source: BEIS (2020) Provisional UK greenhouse gas statistics 2019; Element Energy for the CCC (2020) Development
of t rajectories for residential heat decarbonisation to inform the sixth carbon budget; CCC analysis.
Notes: Residential low-carbon heat includes some efficiency associated with new homes. Non-residential energy
efficiency also includes some behavioural measures. Non-residential other includes catering and other non-heat
fossil fuel uses.
Our pathways take Government policy as their starting point: including the major programme to improve the efficiency of buildings and phase out oil and coal heating.
Buildings shift on to low-carbon heat networks, high efficiency and flexible electrification, along with some hydrogen near industrial clusters.
We look at a set of additional policy levers: a phase out date for the installation of natural gas boilers in 2033, along with new standards on mortgage lenders and at point of sale to drive efficiency renovations in
111 Sixth Carbon Budget – The path to Net Zero
Given boiler lifetimes of around 15 years, we have looked at phasing out the
installation of fossil fuel boilers, in advance of 2035. We adopt a central date of
2033 for gas boilers across buildings, with public buildings moving faster:
• For homes, we pick a central phase out date of 2028 for high-carbon fossil
fuel boilers not connected to the gas grid, and a phase out date of 2033
for gas boilers.
• The key date of 2033 balances the need to scale up heat pump supply
chains sustainably, while allowing for a small amount of headroom over a
typical 15-year boiler stock turnover before 2050.
• In non-residential buildings we use 2025 for high-carbon fossil fuel boilers in
public buildings and 2026 in commercial buildings, based on the feasibility
and benefits of moving faster. We use phase out dates for gas boilers of
2033 in commercial buildings and 2030 in public buildings in the Balanced
pathway. The faster pace in public buildings allows the Government to
meet its targeted 50% reduction in emissions by 2032.
• These dates operate alongside the deployment of low-carbon heat
networks and a regional rollout of hydrogen conversion of the gas grid,
informed by our industry scenarios. This means that the phase-out does not
apply in any areas designated for these alternatives.
The other key dates are then based on the need to build critical supply chains and
skills, and prepare the building stock for the transition to low-carbon heating, with
most of the energy efficiency programme completed by the time fossil fuel boiler
installations are phased out from 2033 (Table 3.2.a).
This energy efficiency programme is also underpinned by a timetable of standards
–rented homes achieve EPC C by 2028 in line with new Government proposals,
with social homes aligned to the same timetable.
We test two new policy proposals for the two-thirds of homes which are owner-
occupied, and therefore not covered by existing proposals outside of Scotland.
This includes a requirement on lenders to first report on and then improve the
average efficiency of their mortgage portfolios, covering just under half of the
owner-occupied stock. A further subset are captured by regulations at point of
sale, drawing on proposals published by the Scottish Government.
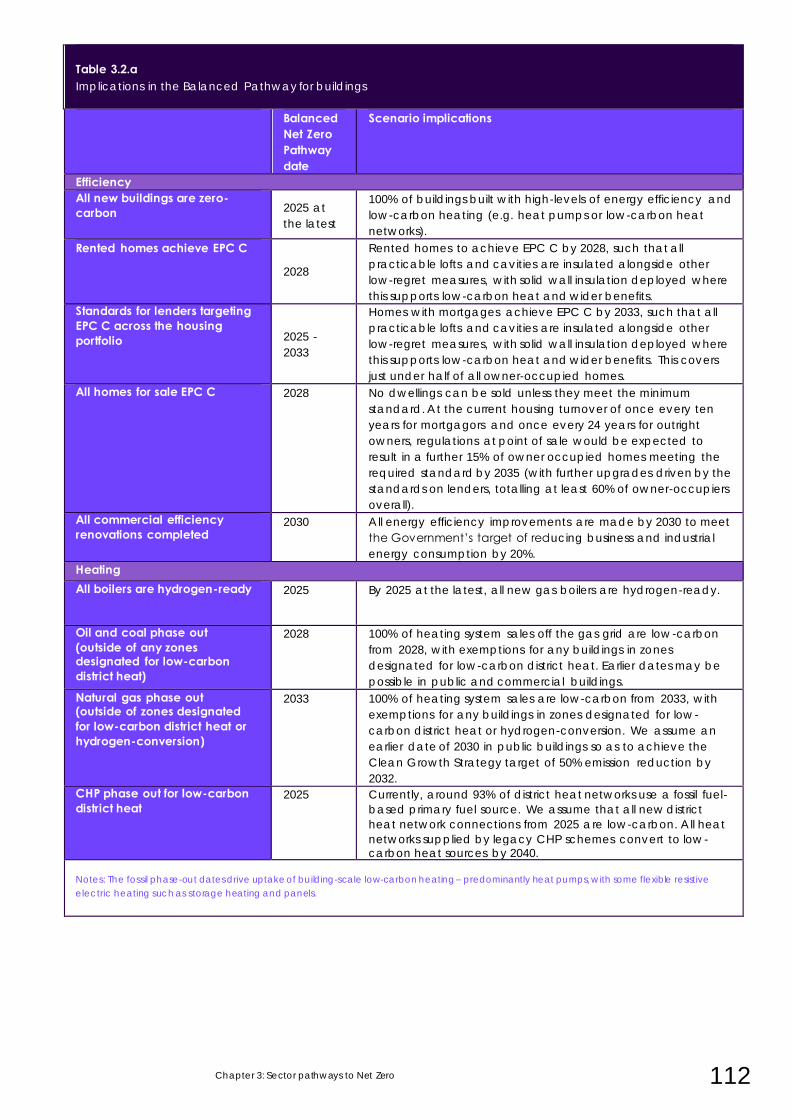
Chapter 3: Sector pathways to Net Zero 112
Table 1.11:Table 1.11
Table 3.2.a Implications in the Balanced Pathway for buildings
Critical dates and Balanced
Net Zero Pathway date
Scenario implications
Efficiency All new buildings are zero-carbon 2025 at
the latest
100% of buildings built with high-levels of energy efficiency and
low-carbon heating (e.g. heat pumps or low-carbon heat
networks).
Rented homes achieve EPC C
2028
Rented homes to achieve EPC C by 2028, such that all
practicable lofts and cavities are insulated alongside other
low-regret measures, with solid wall insulation deployed where
this supports low-carbon heat and wider benefits.
Standards for lenders targeting EPC C across the housing portfolio 2025 -
2033
Homes with mortgages achieve EPC C by 2033, such that all
practicable lofts and cavities are insulated alongside other
low-regret measures, with solid wall insulation deployed where
this supports low-carbon heat and wider benefits. This covers
just under half of all owner-occupied homes.
All homes for sale EPC C 2028 No dwellings can be sold unless they meet the minimum
standard. At the current housing turnover of once every ten
years for mortgagors and once every 24 years for outright
owners, regulations at point of sale would be expected to
result in a further 15% of owner occupied homes meeting the
required standard by 2035 (with further upgrades driven by the
standards on lenders, totalling at least 60% of owner-occupiers
overall).
All commercial efficiency renovations completed
2030 All energy efficiency improvements are made by 2030 to meet
the Government’s target of reducing business and industrial
energy consumption by 20%.
Heating All boilers are hydrogen-ready 2025 By 2025 at the latest, all new gas boilers are hydrogen-ready.
Oil and coal phase out (outside of any zones designated for low-carbon district heat)
2028 100% of heating system sales off the gas grid are low-carbon
from 2028, with exemptions for any buildings in zones
designated for low-carbon district heat. Earlier dates may be
possible in public and commercial buildings.
Natural gas phase out (outside of zones designated for low-carbon district heat or hydrogen-conversion)
2033 100% of heating system sales are low-carbon from 2033, with
exemptions for any buildings in zones designated for low -
carbon district heat or hydrogen-conversion. We assume an
earlier date of 2030 in public buildings so as to achieve the
Clean Growth Strategy target of 50% emission reduction by
2032.
CHP phase out for low-carbon district heat
2025 Currently, around 93% of district heat networks use a fossil fuel-
based primary fuel source. We assume that all new district
heat network connections from 2025 are low-carbon. All heat
networks supplied by legacy CHP schemes convert to low -carbon heat sources by 2040.
Notes: The fossil phase-out dates drive uptake of building-scale low-carbon heating – predominantly heat pumps, with some flexible resistive
electric heating such as storage heating and panels.
113 Sixth Carbon Budget – The path to Net Zero
Energy efficiency in the Balanced Net Zero Pathway
The household energy efficiency programme in our Balanced Net Zero Pathway
corresponds to a similar level of ambition as the Government’s EPC C targets:
• It entails £55 billion of investment in home energy efficiency to 2050.
• BEIS’s published estimate of £35-65 billion to achieve the EPC C standard
implies a broadly consistent level of ambition.
• It remains important that EPCs are reformed to ensure they drive the energy
efficiency measures needed, as detailed in our accompanying Policy
report.
In total, 15 million households receive one of the main insulation measures
(loft/wall/floor) and a further 8 million benefit from draught-proofing. Most homes
with hot water tanks benefit from hot water tank insulation. All fuel poor homes
receive a high efficiency upgrade:
• We deploy low-cost measures such as draft proofing and hot water tank
insulation in all homes, as well as insulating all practicable cavities and lofts
(including top-ups where existing insulation is below 200mm).
• Our assessment is that this leads to the deployment of around 3 million
cavity insulation measures and 11 million loft insulation measures to 2050.
• We include solid wall insulation in just under half of all uninsulated solid-
walled homes (3.4 million in total) including all those in fuel poverty.
Energy efficiency and behavioural measures in our Balanced Pathway deliver a
12% reduction in heat demand to 2050 (compared to a 22% reduction in our
Tailwinds scenario).* This is a conservative estimate which reflects how measures
are currently performing when installed in existing homes (further detailed in the
accompanying Method report). Higher savings are possible with greater
improvements in tackling the performance gap, innovation and public
engagement.
There remains uncertainty over the balance of costs and benefits for wall insulation
in solid walled homes in particular, as well as levels of public support. This includes
uncertainty over the energy savings which can be achieved and the potential for
innovative new approaches which minimise cost and disruption (detailed in the
separate Methodology report). Further research is needed here to inform
deployment. To the extent there is any under delivery of solid wall insulation relative
to our scenarios, the abatement would need to be delivered in other ways e.g.
through increased uptake or performance of other energy efficiency measures, or
through a faster rate of heat pump deployment.
* This represents an aggregate reduction in heat demand across the stock, tak ing into account technical and
economic potential, and is not reflective of the savings which might be delivered in an individual home which has
minimal existing insulation. A typical household in our Balanced Pathway which installs cavity wall insulation, loft
insulation, and floor insulation sees heat demand savings of 30%, while very deep retrofits might deliver savings in the
region of 57% (Element Energy for the CCC (2020) Development of trajectories for residential heat decarbonisation
to inform the sixth carbon budget). The lower stock-level heat demand savings relative to our Net Zero analysis
reflect a number of factors, including updated savings assumptions based on data from the National Energy
Efficiency Database, and the latest evidence on costs and technical and economic potential. These factors lead to
lower deployment relative to Net Zero, but similar deployment to that modelled for the Fifth Carbon Budget.
Our assumed household energy efficiency programme over the next 10-15 years is broadly in line with Government ambition.
15 million homes get one of the main measures (wall/roof/floor insulation).
We conservatively estimate heat efficiency savings of 12% based on evidence of how measures currently performed when installed.
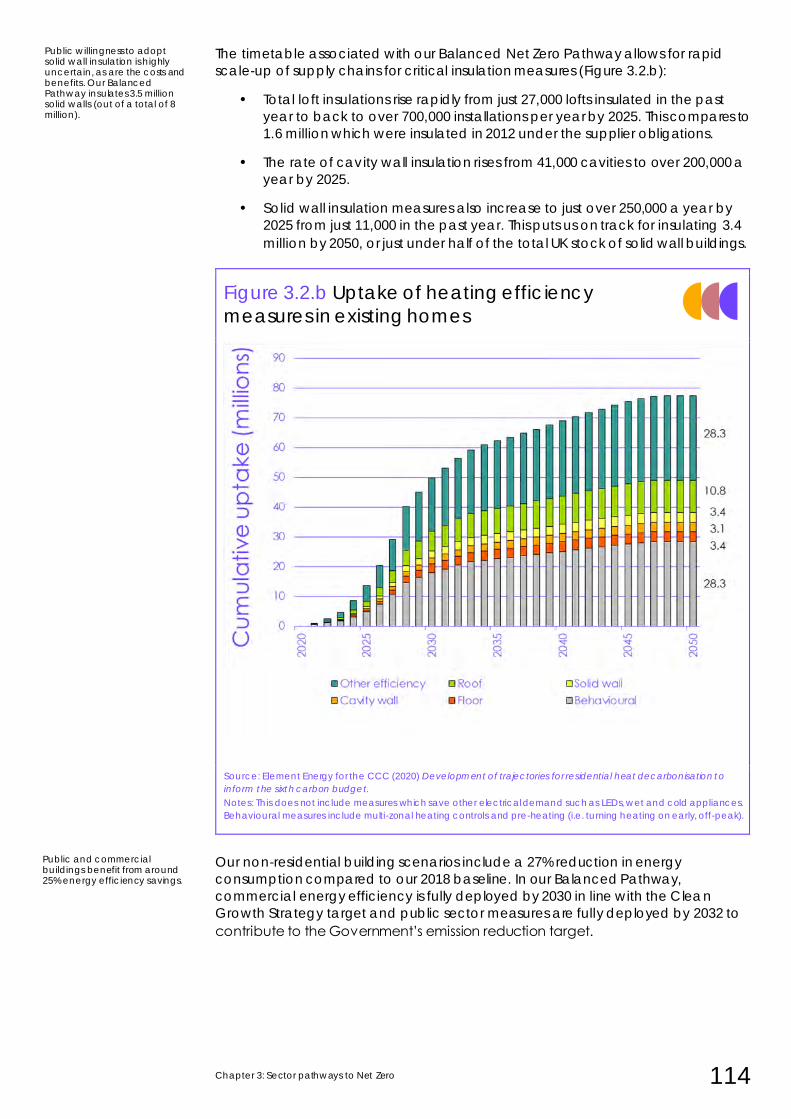
Chapter 3: Sector pathways to Net Zero 114
The timetable associated with our Balanced Net Zero Pathway allows for rapid
scale-up of supply chains for critical insulation measures (Figure 3.2.b):
• Total loft insulations rise rapidly from just 27,000 lofts insulated in the past
year to back to over 700,000 installations per year by 2025. This compares to
1.6 million which were insulated in 2012 under the supplier obligations.
• The rate of cavity wall insulation rises from 41,000 cavities to over 200,000 a
year by 2025.
• Solid wall insulation measures also increase to just over 250,000 a year by
2025 from just 11,000 in the past year. This puts us on track for insulating 3.4
million by 2050, or just under half of the total UK stock of solid wall buildings.
Figure 3.2.b Uptake of heating efficiency
measures in existing homes
Source: Element Energy for the CCC (2020) Development of trajectories for residential heat decarbonisation to
inform the sixth carbon budget.
Notes: This does not include measures which save other electrical demand such as LEDs, wet and cold appliances.
Behavioural measures include multi-zonal heating controls and pre-heating (i.e. turning heating on early, off-peak).
Our non-residential building scenarios include a 27% reduction in energy
consumption compared to our 2018 baseline. In our Balanced Pathway,
commercial energy efficiency is fully deployed by 2030 in line with the Clean
Growth Strategy target and public sector measures are fully deployed by 2032 to
contribute to the Government’s emission reduction target.
Public willingness to adopt solid wall insulation is highly uncertain, as are the costs and benefits. Our Balanced Pathway insulates 3.5 million solid walls (out of a total of 8 million).
Public and commercial buildings benefit from around 25% energy efficiency savings.
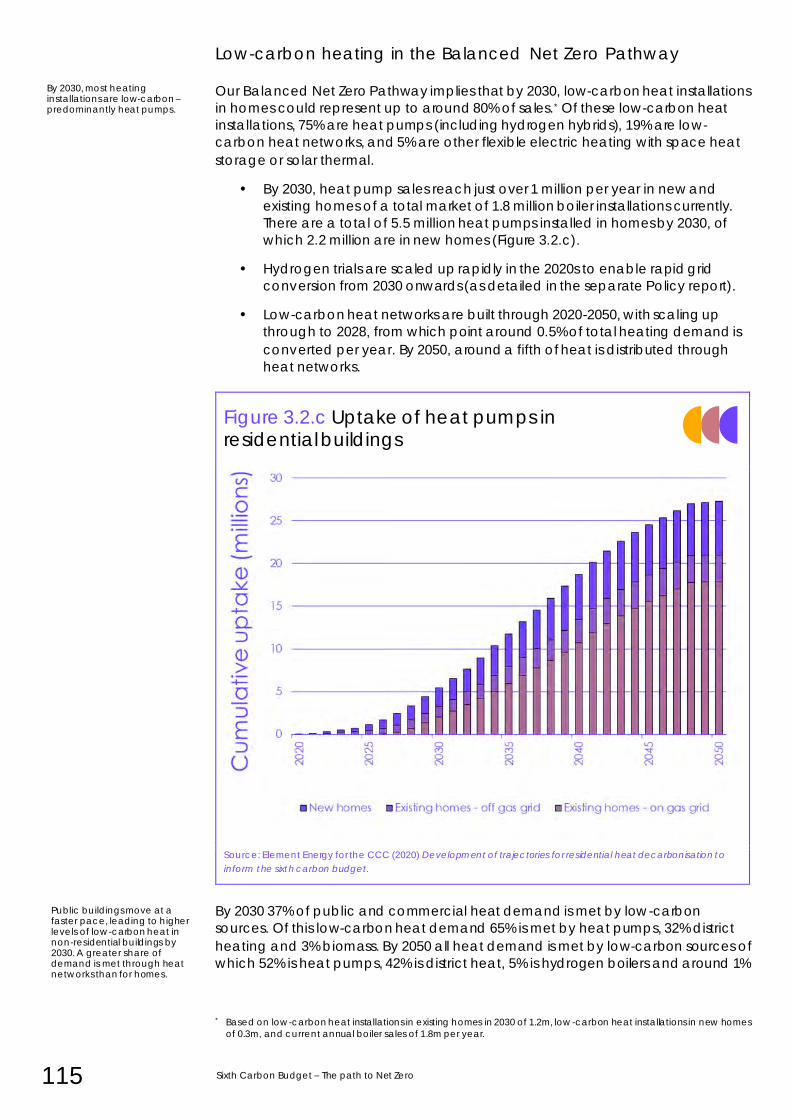
115 Sixth Carbon Budget – The path to Net Zero
Low-carbon heating in the Balanced Net Zero Pathway
Our Balanced Net Zero Pathway implies that by 2030, low-carbon heat installations
in homes could represent up to around 80% of sales.* Of these low-carbon heat
installations, 75% are heat pumps (including hydrogen hybrids), 19% are low-
carbon heat networks, and 5% are other flexible electric heating with space heat
storage or solar thermal.
• By 2030, heat pump sales reach just over 1 million per year in new and
existing homes of a total market of 1.8 million boiler installations currently.
There are a total of 5.5 million heat pumps installed in homes by 2030, of
which 2.2 million are in new homes (Figure 3.2.c).
• Hydrogen trials are scaled up rapidly in the 2020s to enable rapid grid
conversion from 2030 onwards (as detailed in the separate Policy report).
• Low-carbon heat networks are built through 2020-2050, with scaling up
through to 2028, from which point around 0.5% of total heating demand is
converted per year. By 2050, around a fifth of heat is distributed through
heat networks.
Figure 3.2.c Uptake of heat pumps in residential buildings
Source: Element Energy for the CCC (2020) Development of trajectories for residential heat decarbonisation to
inform the sixth carbon budget.
By 2030 37% of public and commercial heat demand is met by low-carbon
sources. Of this low-carbon heat demand 65% is met by heat pumps, 32% district
heating and 3% biomass. By 2050 all heat demand is met by low-carbon sources of
which 52% is heat pumps, 42% is district heat, 5% is hydrogen boilers and around 1%
* Based on low-carbon heat installations in existing homes in 2030 of 1.2m, low-carbon heat installations in new homes
of 0.3m, and current annual boiler sales of 1.8m per year.
By 2030, most heating installations are low-carbon – predominantly heat pumps.
Public buildings move at a faster pace, leading to higher levels of low-carbon heat in non-residential buildings by 2030. A greater share of demand is met through heat networks than for homes.
Chapter 3: Sector pathways to Net Zero 116
is new direct electric heating.
b) Alternative routes to delivering abatement in the mid-2030s
All buildings scenarios achieve close to zero emissions by 2050. The Tailwinds and
Widespread Engagement pathways are faster than the Balanced Pathway,
reducing to close to zero by 2044 (Figure 3.2.d). * By 2035, the pathways achieve
reductions of 45% - 65%, relative to current emissions.
We explore different contexts by varying the key timings, costs and performance
assumptions and by exploring the impact of innovation such as new business
models (Table 3.2.b):
• Widespread Engagement. Households and businesses are prepared to
undertake renovations at scale through the 2020s, with high levels of pre-
heating and other behaviour change in homes.† They also support earlier
regulatory approaches.
• Innovation. Power sector innovation drives down electricity costs.
Households adopt smart, flexible electric heating including hybrid heat
pumps, as well as high-temperature heat pumps (which are able to
operate at higher temperatures, reducing the need for radiator
upgrades).4‡ New business models such heat-as-a-service and new
financial models for deep retrofits become common, delivering high
performance solutions. High levels of cost reduction through learning, and
increases in performance over time.
• Headwinds. People change behaviour and new technologies develop, but
there are no widespread behavioural shifts or innovations that significantly
reduce the cost of green technologies ahead of current projections.
Alongside strong electrification, there is widespread use of hydrogen, led
by the conversion of industrial clusters.
• Tailwinds. Households and businesses support early regulatory approaches,
and minimise their use of energy through behaviour change and the
highest uptake of energy efficiency measures. At the same time, innovation
drives down costs (with 40% reductions in heat pump costs to 2050) and
drives up performance.
Availability of hydrogen in Headwinds is increased at an ambitious rate in the
2030s, implying that some possible hydrogen-dominated pathways could lead to
lower emissions in the budget period. However, as a result this scenario has
considerably higher overall hydrogen demand, creating a substantially bigger
challenge to source sufficient volumes of low-carbon hydrogen. In turn, this is likely
to lead to more use of fossil gas reforming with carbon capture and storage (CCS),
increasing residual emissions from hydrogen production and increasing reliance on
CCS and fossil gas imports (see section 5). While higher buildings demands could
be conceived of, they are not included in our scenarios due to these supply
challenges and residual emissions.
* Some additional rollout of low-carbon heat networks occurs to 2050.
† Where homes are sufficiently well insulated, it is possible to pre-heat ahead of peak times, enabling access to
cheaper tariffs which reflect the reduced costs associated with running networks and producing power off-peak.
Other behavioural measures are summarised in table 3.2.a.
‡ While high temperature heat pumps are specifically designed for high temperature operation, the designs of
‘conventional’ heat pumps are increasingly being improved to reach 60-65°C at reasonable efficiency. We assume
that radiator upgrades could be avoided where flow temperatures of 65-70°C are reached. An efficiency penalty is
associated with operation at these higher temperatures, although discussions with manufacturers suggest efficiency
benefits relative to resistive heating are maintained even in very cold weather.
We explore a range of scenarios which achieve 45-65% reduction in emissions by 2035, against current levels.
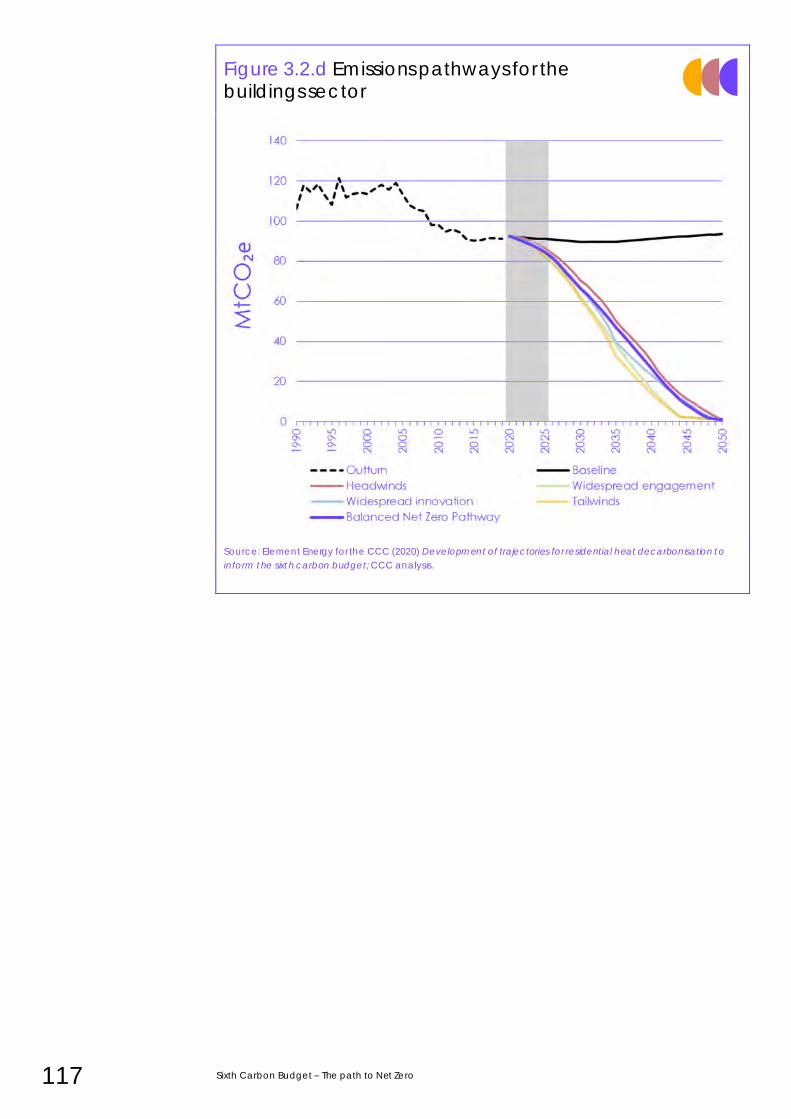
117 Sixth Carbon Budget – The path to Net Zero
Figure 3.2.d Emissions pathways for the buildings sector
Source: Element Energy for the CCC (2020) Development of trajectories for residential heat decarbonisation to
inform the sixth carbon budget; CCC analysis.
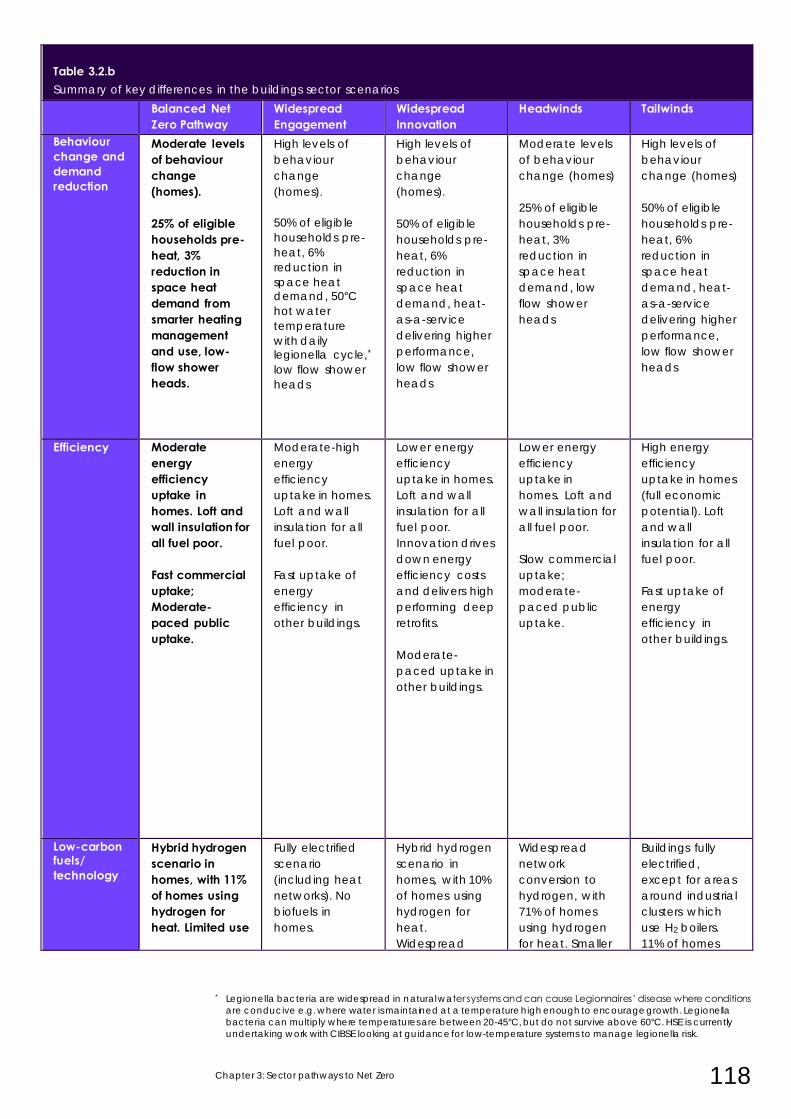
Chapter 3: Sector pathways to Net Zero 118
Table 1.11:Table 1.11 Table 3.2.b Summary of key differences in the buildings sector scenarios
Balanced Net Zero Pathway
Widespread Engagement
Widespread Innovation
Headwinds Tailwinds
Behaviour change and demand reduction
Moderate levels of behaviour change (homes). 25% of eligible households pre-heat, 3% reduction in space heat demand from smarter heating management and use, low-flow shower heads.
High levels of
behaviour
change
(homes).
50% of eligible
households pre-
heat, 6%
reduction in
space heat demand, 50°C
hot water
temperature
with daily legionella cycle,*
low flow shower
heads
High levels of
behaviour
change
(homes).
50% of eligible
households pre-
heat, 6%
reduction in
space heat
demand, heat-
as-a-service
delivering higher
performance,
low flow shower
heads
Moderate levels
of behaviour
change (homes)
25% of eligible
households pre-
heat, 3%
reduction in
space heat
demand, low
flow shower
heads
High levels of
behaviour
change (homes)
50% of eligible
households pre-
heat, 6%
reduction in
space heat
demand, heat-
as-a-service
delivering higher
performance,
low flow shower
heads
Efficiency Moderate energy efficiency uptake in homes. Loft and wall insulation for all fuel poor. Fast commercial uptake; Moderate-paced public uptake.
Moderate-high
energy
efficiency
uptake in homes.
Loft and wall
insulation for all
fuel poor.
Fast uptake of
energy
efficiency in
other buildings.
Lower energy
efficiency
uptake in homes.
Loft and wall
insulation for all
fuel poor.
Innovation drives
down energy
efficiency costs
and delivers high
performing deep
retrofits.
Moderate-
paced uptake in
other buildings.
Lower energy
efficiency
uptake in
homes. Loft and
wall insulation for
all fuel poor.
Slow commercial
uptake;
moderate-
paced public
uptake.
High energy
efficiency
uptake in homes
(full economic
potential). Loft
and wall
insulation for all
fuel poor.
Fast uptake of
energy
efficiency in
other buildings.
Low-carbon fuels/
technology
Hybrid hydrogen scenario in homes, with 11% of homes using hydrogen for heat. Limited use
Fully electrified
scenario
(including heat
networks). No
biofuels in
homes.
Hybrid hydrogen
scenario in
homes, with 10%
of homes using
hydrogen for
heat.
Widespread
Widespread
network
conversion to
hydrogen, with
71% of homes
using hydrogen
for heat. Smaller
Buildings fully
electrified,
except for areas
around industrial
clusters which
use H2 boilers.
11% of homes
* Legionella bacteria are widespread in natural water systems and can cause Legionnaires’ disease where conditions
are conducive e.g. where water is maintained at a temperature high enough to encourage growth. Legionella
bacteria can multiply where temperatures are between 20-45°C, but do not survive above 60°C. HSE is currently
undertaking work with CIBSE looking at guidance for low-temperature systems to manage legionella risk.
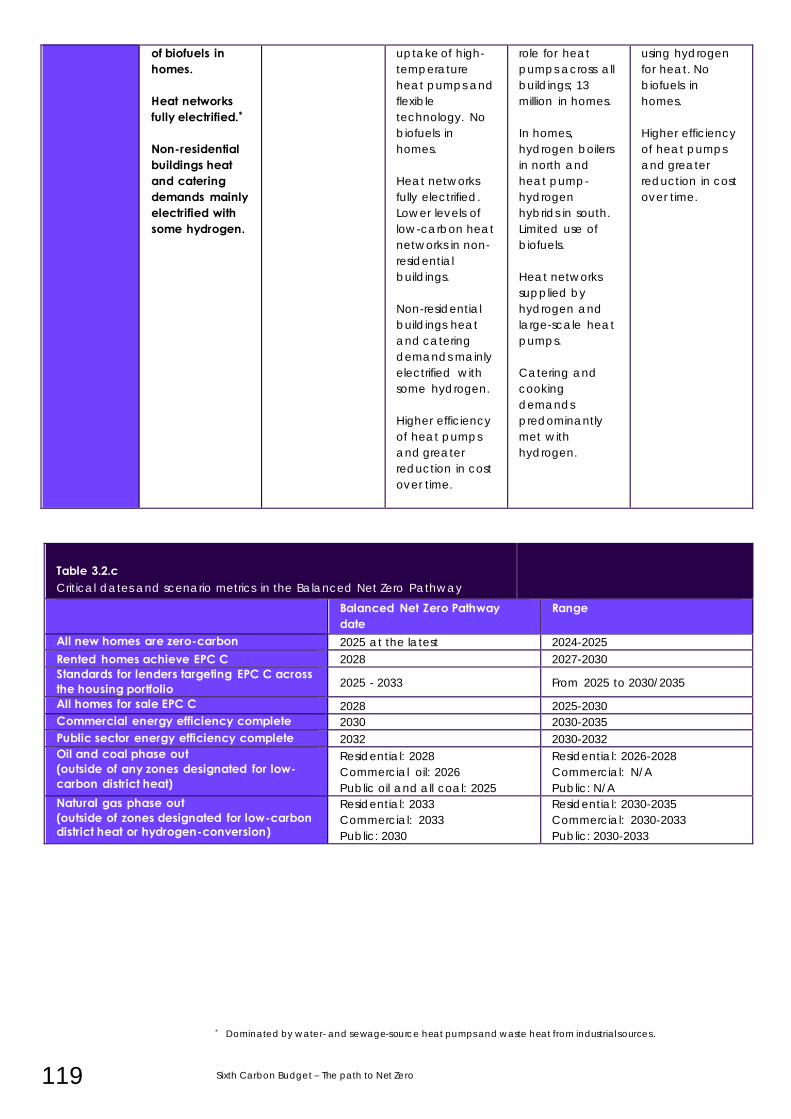
119 Sixth Carbon Budget – The path to Net Zero
of biofuels in homes. Heat networks fully electrified.* Non-residential buildings heat and catering demands mainly electrified with some hydrogen.
uptake of high-
temperature
heat pumps and
flexible
technology. No
biofuels in
homes.
Heat networks
fully electrified.
Lower levels of
low-carbon heat
networks in non-
residential
buildings.
Non-residential
buildings heat
and catering
demands mainly
electrified with
some hydrogen.
Higher efficiency
of heat pumps
and greater
reduction in cost
over time.
role for heat
pumps across all
buildings; 13
million in homes.
In homes,
hydrogen boilers
in north and
heat pump-
hydrogen
hybrids in south.
Limited use of
biofuels.
Heat networks
supplied by
hydrogen and
large-scale heat
pumps.
Catering and
cooking
demands
predominantly
met with
hydrogen.
using hydrogen
for heat. No
biofuels in
homes.
Higher efficiency
of heat pumps
and greater
reduction in cost
over time.
Table 1.11:Table 1.11 Table 3.2.c Critical dates and scenario metrics in the Balanced Net Zero Pathway
Balanced Net Zero Pathway date
Range
All new homes are zero-carbon 2025 at the latest 2024-2025
Rented homes achieve EPC C 2028 2027-2030
Standards for lenders targeting EPC C across the housing portfolio 2025 - 2033 From 2025 to 2030/2035
All homes for sale EPC C 2028 2025-2030
Commercial energy efficiency complete 2030 2030-2035
Public sector energy efficiency complete 2032 2030-2032
Oil and coal phase out (outside of any zones designated for low-carbon district heat)
Residential: 2028
Commercial oil: 2026
Public oil and all coal: 2025
Residential: 2026-2028
Commercial: N/A
Public: N/A
Natural gas phase out (outside of zones designated for low-carbon district heat or hydrogen-conversion)
Residential: 2033
Commercial: 2033
Public: 2030
Residential: 2030-2035
Commercial: 2030-2033
Public: 2030-2033
* Dominated by water- and sewage-source heat pumps and waste heat from industrial sources.
Chapter 3: Sector pathways to Net Zero 120
c) Impacts of the scenarios: costs, benefits and co-impacts on society In our 2019 Net Zero report, we identified buildings as one of the most costly
challenges across the economy, with in-year costs in 2050 of around £15 billion per
year and uncertainty around the total costs throughout the period to 2050. Our
updated Sixth Carbon Budget pathways estimate these full costs.
The Balanced Pathway requires investment across all buildings (residential and
non-residential) at an average rate of around ~£12 billion per year to 2050, offset
by reductions in operating costs of ~£5 billion per year:
• Total investment costs are £360 billion to 2050, of which around £250 billion is
for the programme of upgrading homes (Figure 3.2.e) and £110 billion in
public and commercial buildings.
• Total investment in the programme of efficiency in existing homes in this
scenario is around £45 billion to 2035 with a total spend of £55 billion by
2050. This compares to BEIS’s published estimate of £35-65 billion to achieve
the EPC C standard.5
• Total investment costs are less than £10,000 per household on average in
our Balanced Pathway. 63% of homes need spend no more than £1000 on
retrofitting energy efficiency measures.
• The deployment of all energy efficiency potential in public and
commercial buildings entails £2 billion per year of commercial investment
to 2030 and £0.5 billion per year of public sector investment to 2032. Annual
operating cost savings of around £1.5 billion and £0.5 billion result for
commercial and public buildings respectively.
• Including low-carbon heat increases this to £2.8 billion per year investment
in commercial buildings and £0.9 billion in public buildings through the
2030s and 2040s. This is associated with total operating cost savings of £3
billion per year across public and commercial buildings.
Energy efficiency is projected to deliver ongoing operating cost savings (Figure
3.2.e), resulting in lower overall bills for households in all scenarios apart from
Headwinds (Chapter 6). Behaviour change in our Balanced Pathway is estimated
to contribute around £0.4 billion of savings per year by 2050.
The Balanced Pathway requires investment at an average rate of around ~£12 billion per year to 2050, offset by reductions in fuel costs of ~£5 billion per year.
Total investment costs are less than £10,000 per household.
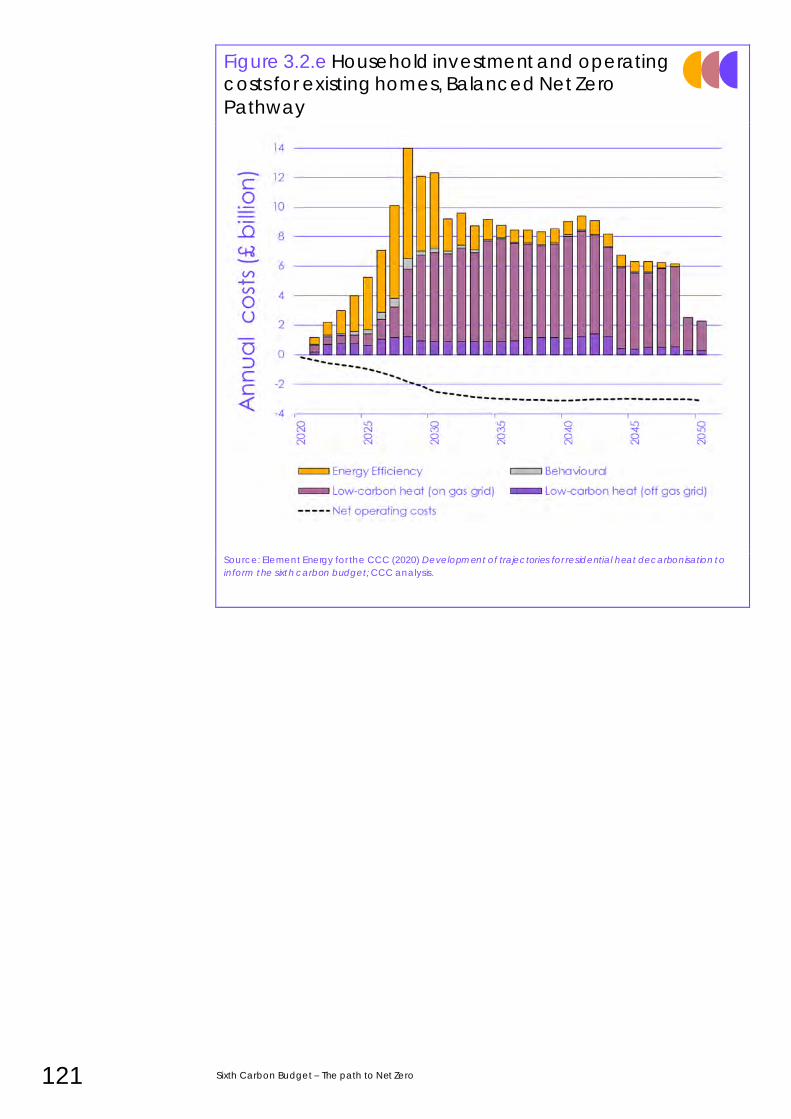
121 Sixth Carbon Budget – The path to Net Zero
Figure 3.2.e Household investment and operating costs for existing homes, Balanced Net Zero
Pathway
Source: Element Energy for the CCC (2020) Development of trajectories for residential heat decarbonisation to
inform the sixth carbon budget; CCC analysis.
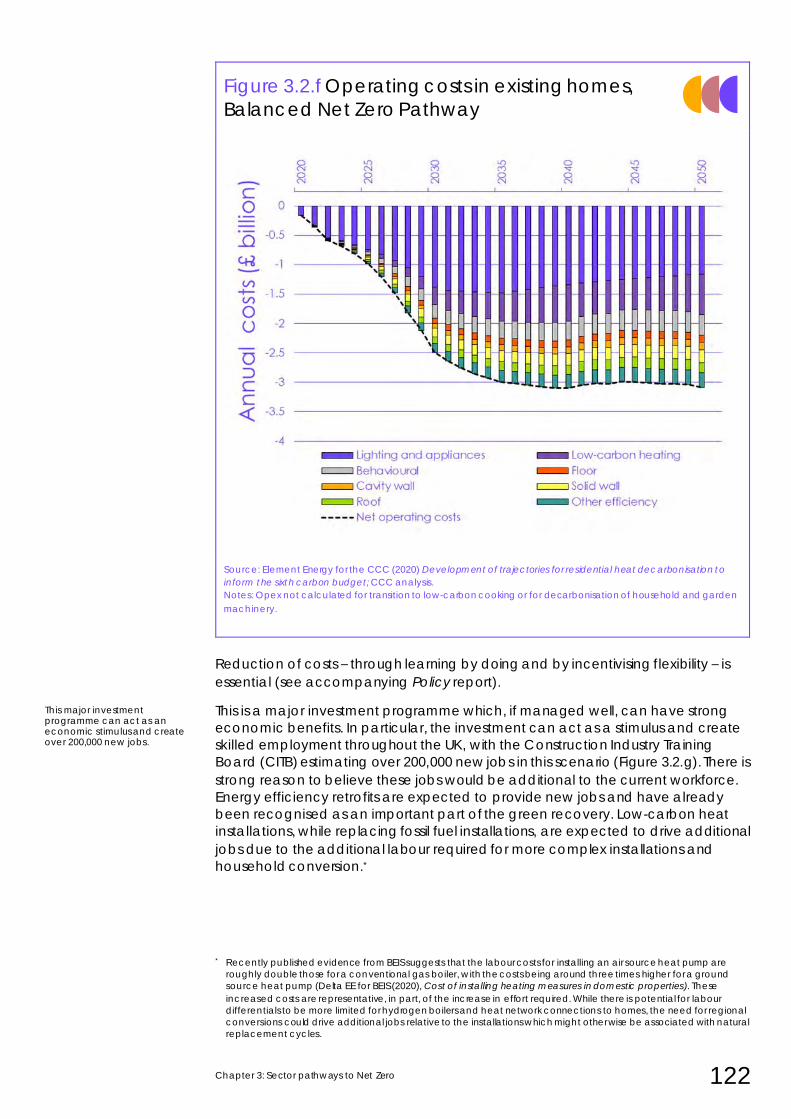
Chapter 3: Sector pathways to Net Zero 122
Figure 3.2.f Operating costs in existing homes,
Balanced Net Zero Pathway
Source: Element Energy for the CCC (2020) Development of trajectories for residential heat decarbonisation to
inform the sixth carbon budget; CCC analysis.
Notes: Opex not calculated for transition to low-carbon cooking or for decarbonisation of household and garden
machinery.
Reduction of costs – through learning by doing and by incentivising flexibility – is
essential (see accompanying Policy report).
This is a major investment programme which, if managed well, can have strong
economic benefits. In particular, the investment can act as a stimulus and create
skilled employment throughout the UK, with the Construction Industry Training
Board (CITB) estimating over 200,000 new jobs in this scenario (Figure 3.2.g). There is
strong reason to believe these jobs would be additional to the current workforce.
Energy efficiency retrofits are expected to provide new jobs and have already
been recognised as an important part of the green recovery. Low-carbon heat
installations, while replacing fossil fuel installations, are expected to drive additional
jobs due to the additional labour required for more complex installations and
household conversion.*
* Recently published evidence from BEIS suggests that the labour costs for installing an air source heat pump are
roughly double those for a conventional gas boiler, with the costs being around three times higher for a ground
source heat pump (Delta EE for BEIS (2020), Cost of installing heating measures in domestic properties). These
increased costs are representative, in part, of the increase in effort required. While there is potential for labour
differentials to be more limited for hydrogen boilers and heat network connections to homes, the need for regional
conversions could drive additional jobs relative to the installations which might otherwise be associated with natural
replacement cycles.
This major investment programme can act as an economic stimulus and create over 200,000 new jobs.
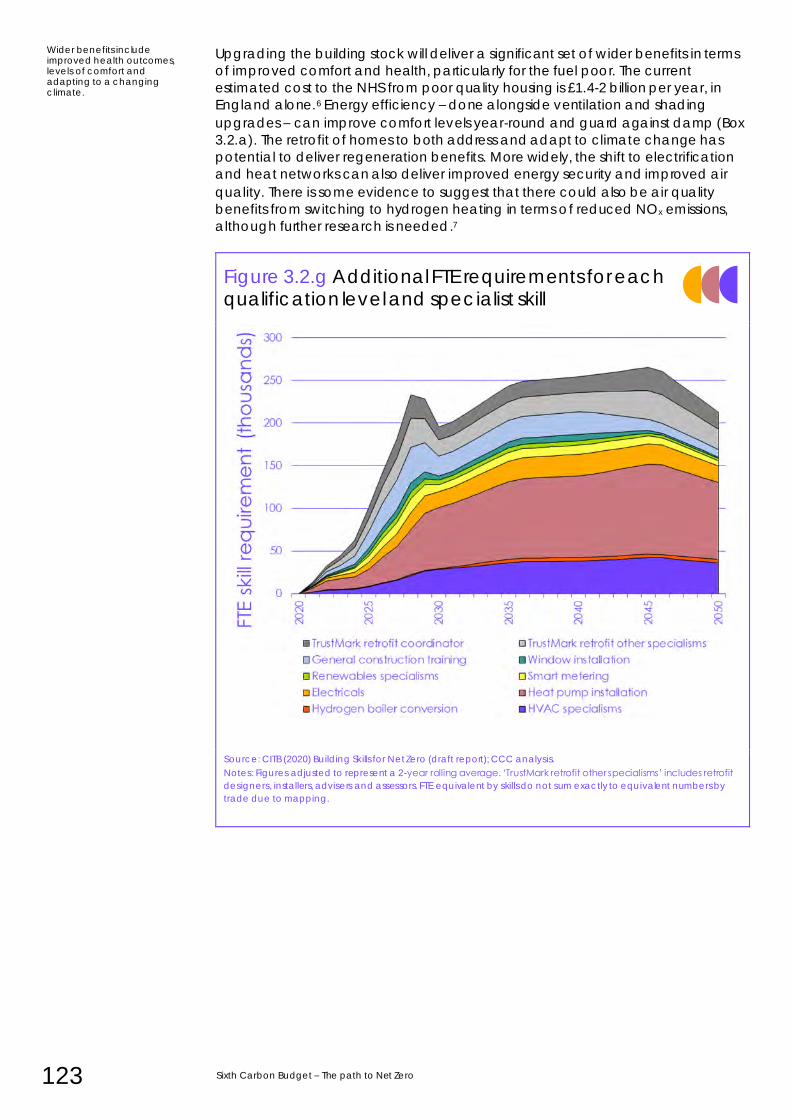
123 Sixth Carbon Budget – The path to Net Zero
Upgrading the building stock will deliver a significant set of wider benefits in terms
of improved comfort and health, particularly for the fuel poor. The current
estimated cost to the NHS from poor quality housing is £1.4-2 billion per year, in
England alone.6 Energy efficiency – done alongside ventilation and shading
upgrades – can improve comfort levels year-round and guard against damp (Box
3.2.a). The retrofit of homes to both address and adapt to climate change has
potential to deliver regeneration benefits. More widely, the shift to electrification
and heat networks can also deliver improved energy security and improved air
quality. There is some evidence to suggest that there could also be air quality
benefits from switching to hydrogen heating in terms of reduced NOx emissions,
although further research is needed.7
Figure 3.2.g Additional FTE requirements for each qualification level and specialist skill
Source: CITB (2020) Building Skills for Net Zero (draft report); CCC analysis.
Notes: Figures adjusted to represent a 2-year rolling average. ‘TrustMark retrofit other specialisms’ includes retrofit
designers, installers, advisers and assessors. FTE equivalent by skills do not sum exactly to equivalent numbers by
trade due to mapping.
Wider benefits include improved health outcomes, levels of comfort and adapting to a changing climate.
Chapter 3: Sector pathways to Net Zero 124
Box 3.2.a A holistic approach to retrofit
Measures to address thermal efficiency, overheating, indoor air quality and moisture
must be considered together when retrofitting or building new homes.
There are zero cost actions householders can take now to better ventilate and shade
their homes, including shutting curtains during the day to limit solar gains, and opening
windows to improve ventilation.* There are also home upgrade measures which can
improve overheating and ventilation further.
• Shading measures can include high specification blinds (e.g. with reflective backing)
and/or external shading or awnings. We estimate that installing moderate cost measures to the most at-risk property types would add £4-£5 billion of total investment
costs to 2050.†8
• Ventilation measures (which can also help mitigate overheating risk) include extract
fans, mechanical extract ventilation (MEV) and mechanical extract ventilation and
heat recovery (MVHR). Installing extract fans is estimated to cost around £550 per
home, while MEV or MVHR could add between £1,700-£4,100 per home.9
Wider adaptation needs, such as water efficiency and flood resilience, should be
considered as part of retrofit needs but have not been costed as part of this work.
Sources: CCC and Element Energy analysis.
* Windows should be opened when room temperatures reach 22 degrees, but should remain closed if outdoor
temperatures rise above indoor temperatures. Overheating and ventilation can both be improved by opening
windows during the night to purge heat.
† This assumes all flats within the housing stock install high specification blinds designed to reflect solar gain and/or
allow for windows to be open during use. These costs would be additional to those presented in Figure 3.2.e.
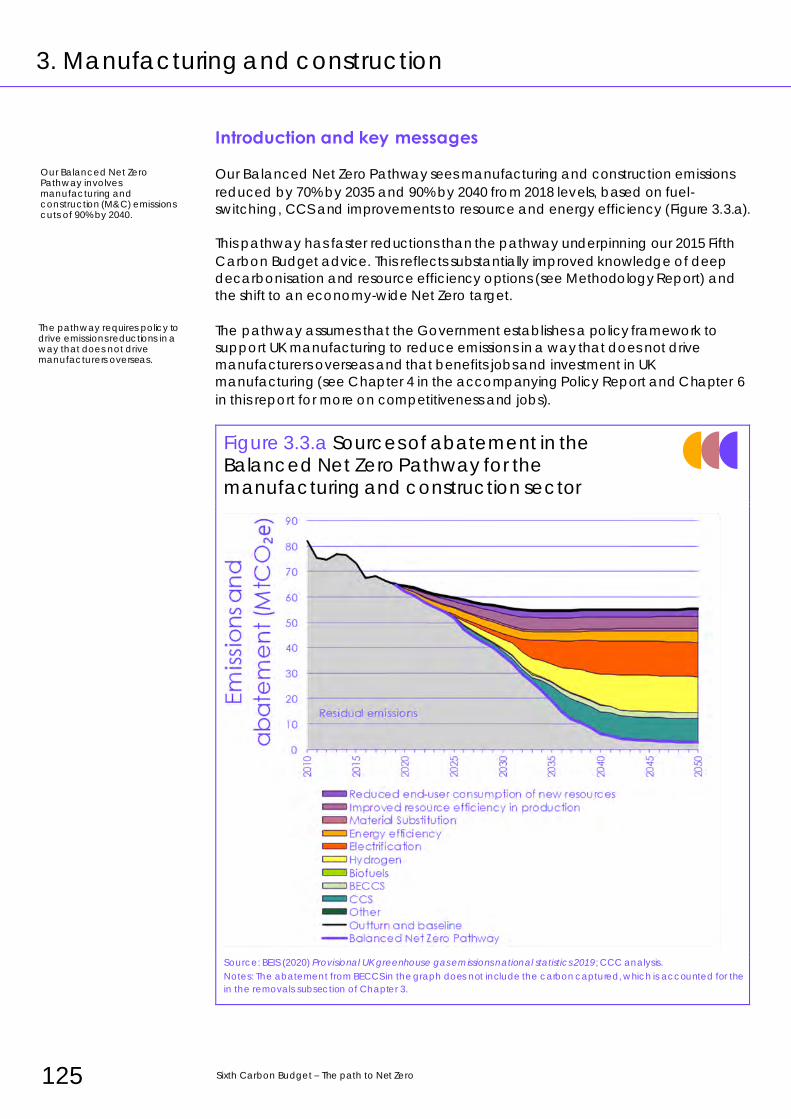
125 Sixth Carbon Budget – The path to Net Zero
3. Manufacturing and construction
Introduction and key messages
Our Balanced Net Zero Pathway sees manufacturing and construction emissions
reduced by 70% by 2035 and 90% by 2040 from 2018 levels, based on fuel-
switching, CCS and improvements to resource and energy efficiency (Figure 3.3.a).
This pathway has faster reductions than the pathway underpinning our 2015 Fifth
Carbon Budget advice. This reflects substantially improved knowledge of deep
decarbonisation and resource efficiency options (see Methodology Report) and
the shift to an economy-wide Net Zero target.
The pathway assumes that the Government establishes a policy framework to
support UK manufacturing to reduce emissions in a way that does not drive
manufacturers overseas and that benefits jobs and investment in UK
manufacturing (see Chapter 4 in the accompanying Policy Report and Chapter 6
in this report for more on competitiveness and jobs).
Figure 3.3.a Sources of abatement in the Balanced Net Zero Pathway for the manufacturing and construction sector
Source: BEIS (2020) Provisional UK greenhouse gas emissions national statistics 2019; CCC analysis.
Notes: The abatement from BECCS in the graph does not include the carbon captured, which is accounted for the
in the removals subsection of Chapter 3.
Our Balanced Net Zero Pathway involves manufacturing and construction (M&C) emissions cuts of 90% by 2040.
The pathway requires policy to drive emissions reductions in a way that does not drive manufacturers overseas.
Chapter 3: Sector pathways to Net Zero 126
This section is split into three sub-sections:
a) The Balanced Pathway for manufacturing and construction
b) Alternative routes to delivering abatement in the mid-2030s
c) Impacts of the scenarios: costs, benefits and co-impacts on society
a) The Balanced Net Zero Pathway for manufacturing and construction
The pace of decarbonisation in the Balanced Pathway for manufacturing and
construction gradually accelerates through the 2020s to mid-2030s with the
increasing implementation of new technologies, policy, resource efficient
approaches, and development of infrastructure and supply chains. Most
decarbonisation of the sector is complete by 2040. Figure 3.3.a presents an
overview of the emissions reduction actions and timing of the Balanced Pathway
actions.
• Improvements in resource and energy efficiency lead to the largest
emissions reductions in the early 2020s, with smaller contributions from
electrification, biofuel use and material substitution. Fuel-switching and CCS
deployment scale up from 2025.
• Infrastructures for CCS and hydrogen are deployed from 2025 in the
pathway, starting near industrial clusters. Electricity network connection
capacity is also increased around newly electrifying sites. The 2030s sees
substantial scale-up across these three major networks.
• Policy develops rapidly to ensure that it pays for companies to implement
societally cost-effective measures and that non-financial barriers are
addressed. See the accompanying Policy Report for policy
recommendations.
• Supply chains scale up at pace in the pathway. More workers acquire skills
to implement low-carbon measures, the supply of necessary technologies
and equipment grows, and the availability of finance increases.
Improvements in resource and energy efficiency and material substitution in the
Balanced Pathway reduce emissions by 12 MtCO2e per year by 2035, contributing
8 MtCO2e, 3 MtCO2e and 1 MtCO2e respectively:
• Resource efficiency abatement gradually increases from 2020 to 2035.
• Improvements that reduce end-user consumption of new resources cut emissions by 3 MtCO2e per year in 2035 (Figure 3.3.a). This includes
measures such as consumers using clothes and electronics products
for longer, which may require improved durability.
• Measures that improve resource efficiency in production reduce
emissions by 5 MtCO2e per year in 2035. This includes measures such as
optimising building design to reduce material use.
• The resource efficiency measures can alternatively be split into the
following groups: design optimisation to reduce material inputs (3
MtCO2e per year in 2035), increased recycling and reuse (3 MtCO2e,
of which half is through reuse of construction materials), increasing
product longevity (2 MtCO2e, largely from electronics), and increased
product utilisation and sharing (1 MtCO2e, including sharing leisure
equipment and car clubs).
During the 2020s the Balanced Pathway has increasing implementation of new technologies, policy, resource efficient approaches, and development of infrastructure and supply chains.
Recycling, reusing and sharing products, increasing product longevity and reducing material use through better design, all play a role in reducing M&C emissions in the Balanced Pathway.
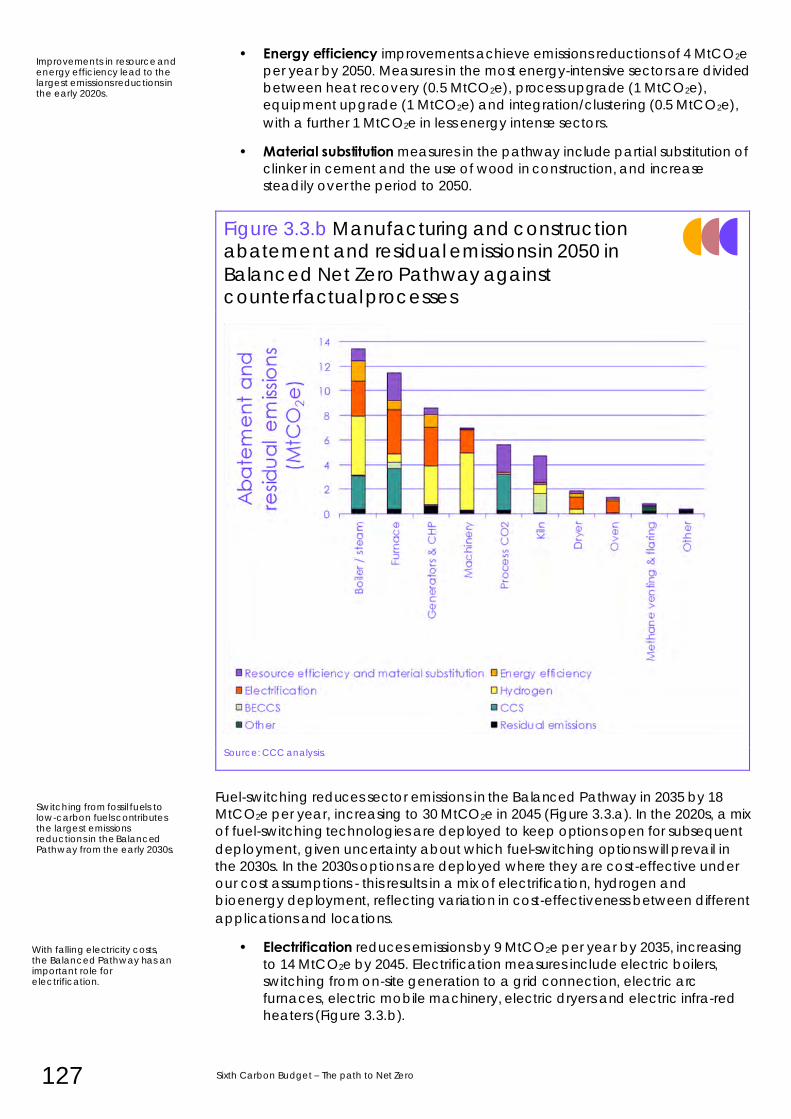
127 Sixth Carbon Budget – The path to Net Zero
• Energy efficiency improvements achieve emissions reductions of 4 MtCO2e
per year by 2050. Measures in the most energy-intensive sectors are divided
between heat recovery (0.5 MtCO2e), process upgrade (1 MtCO2e),
equipment upgrade (1 MtCO2e) and integration/clustering (0.5 MtCO2e),
with a further 1 MtCO2e in less energy intense sectors.
• Material substitution measures in the pathway include partial substitution of
clinker in cement and the use of wood in construction, and increase
steadily over the period to 2050.
Figure 3.3.b Manufacturing and construction abatement and residual emissions in 2050 in
Balanced Net Zero Pathway against counterfactual processes
Source: CCC analysis.
Fuel-switching reduces sector emissions in the Balanced Pathway in 2035 by 18
MtCO2e per year, increasing to 30 MtCO2e in 2045 (Figure 3.3.a). In the 2020s, a mix
of fuel-switching technologies are deployed to keep options open for subsequent
deployment, given uncertainty about which fuel-switching options will prevail in
the 2030s. In the 2030s options are deployed where they are cost-effective under
our cost assumptions - this results in a mix of electrification, hydrogen and
bioenergy deployment, reflecting variation in cost-effectiveness between different
applications and locations.
• Electrification reduces emissions by 9 MtCO2e per year by 2035, increasing
to 14 MtCO2e by 2045. Electrification measures include electric boilers,
switching from on-site generation to a grid connection, electric arc
furnaces, electric mobile machinery, electric dryers and electric infra-red
heaters (Figure 3.3.b).
Improvements in resource and energy efficiency lead to the largest emissions reductions in the early 2020s.
With falling electricity costs, the Balanced Pathway has an important role for electrification.
Switching from fossil fuels to low-carbon fuels contributes the largest emissions reductions in the Balanced Pathway from the early 2030s.
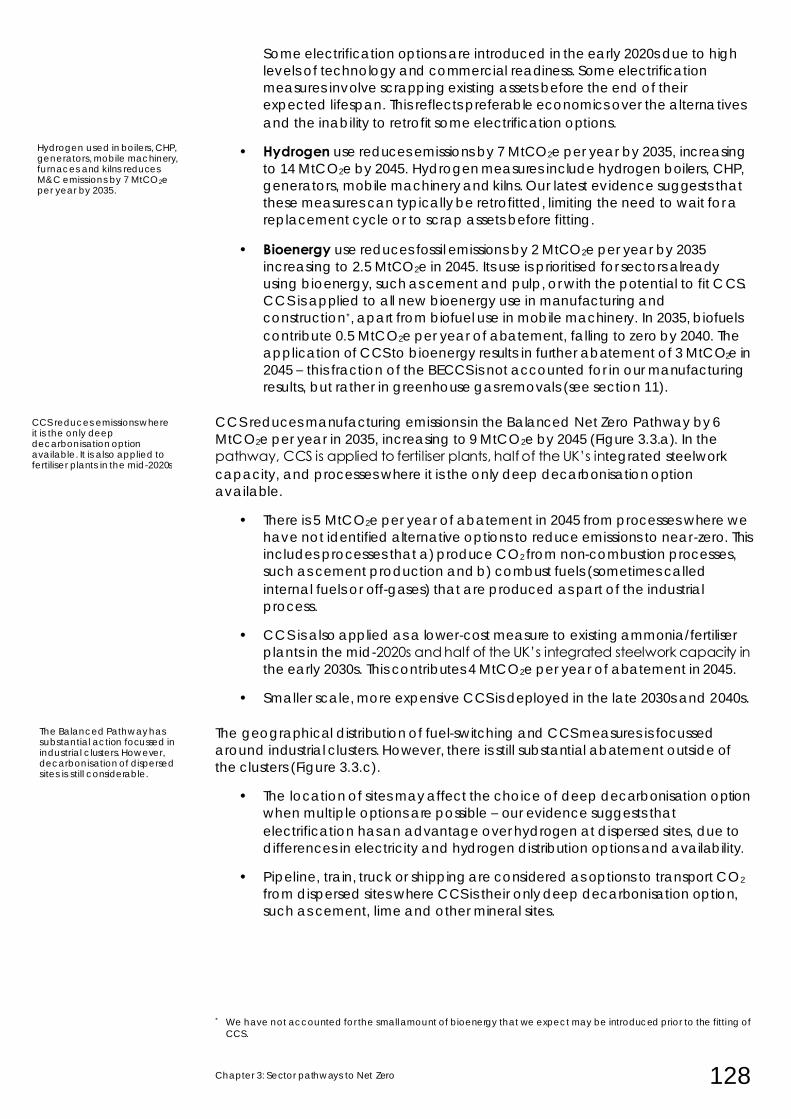
Chapter 3: Sector pathways to Net Zero 128
Some electrification options are introduced in the early 2020s due to high
levels of technology and commercial readiness. Some electrification
measures involve scrapping existing assets before the end of their
expected lifespan. This reflects preferable economics over the alternatives
and the inability to retrofit some electrification options.
• Hydrogen use reduces emissions by 7 MtCO2e per year by 2035, increasing
to 14 MtCO2e by 2045. Hydrogen measures include hydrogen boilers, CHP,
generators, mobile machinery and kilns. Our latest evidence suggests that
these measures can typically be retrofitted, limiting the need to wait for a
replacement cycle or to scrap assets before fitting.
• Bioenergy use reduces fossil emissions by 2 MtCO2e per year by 2035
increasing to 2.5 MtCO2e in 2045. Its use is prioritised for sectors already
using bioenergy, such as cement and pulp, or with the potential to fit CCS.
CCS is applied to all new bioenergy use in manufacturing and
construction*, apart from biofuel use in mobile machinery. In 2035, biofuels
contribute 0.5 MtCO2e per year of abatement, falling to zero by 2040. The
application of CCS to bioenergy results in further abatement of 3 MtCO2e in
2045 – this fraction of the BECCS is not accounted for in our manufacturing
results, but rather in greenhouse gas removals (see section 11).
CCS reduces manufacturing emissions in the Balanced Net Zero Pathway by 6
MtCO2e per year in 2035, increasing to 9 MtCO2e by 2045 (Figure 3.3.a). In the
pathway, CCS is applied to fertiliser plants, half of the UK’s integrated steelwork
capacity, and processes where it is the only deep decarbonisation option
available.
• There is 5 MtCO2e per year of abatement in 2045 from processes where we
have not identified alternative options to reduce emissions to near-zero. This
includes processes that a) produce CO2 from non-combustion processes,
such as cement production and b) combust fuels (sometimes called
internal fuels or off-gases) that are produced as part of the industrial
process.
• CCS is also applied as a lower-cost measure to existing ammonia/fertiliser
plants in the mid-2020s and half of the UK’s integrated steelwork capacity in
the early 2030s. This contributes 4 MtCO2e per year of abatement in 2045.
• Smaller scale, more expensive CCS is deployed in the late 2030s and 2040s.
The geographical distribution of fuel-switching and CCS measures is focussed
around industrial clusters. However, there is still substantial abatement outside of
the clusters (Figure 3.3.c).
• The location of sites may affect the choice of deep decarbonisation option
when multiple options are possible – our evidence suggests that
electrification has an advantage over hydrogen at dispersed sites, due to
differences in electricity and hydrogen distribution options and availability.
• Pipeline, train, truck or shipping are considered as options to transport CO2
from dispersed sites where CCS is their only deep decarbonisation option,
such as cement, lime and other mineral sites.
* We have not accounted for the small amount of bioenergy that we expect may be introduced prior to the fitting of
CCS.
Hydrogen used in boilers, CHP, generators, mobile machinery, furnaces and kilns reduces M&C emissions by 7 MtCO2e per year by 2035.
CCS reduces emissions where it is the only deep decarbonisation option available. It is also applied to fertiliser plants in the mid-2020s.
The Balanced Pathway has substantial action focussed in industrial clusters. However, decarbonisation of dispersed sites is still considerable.
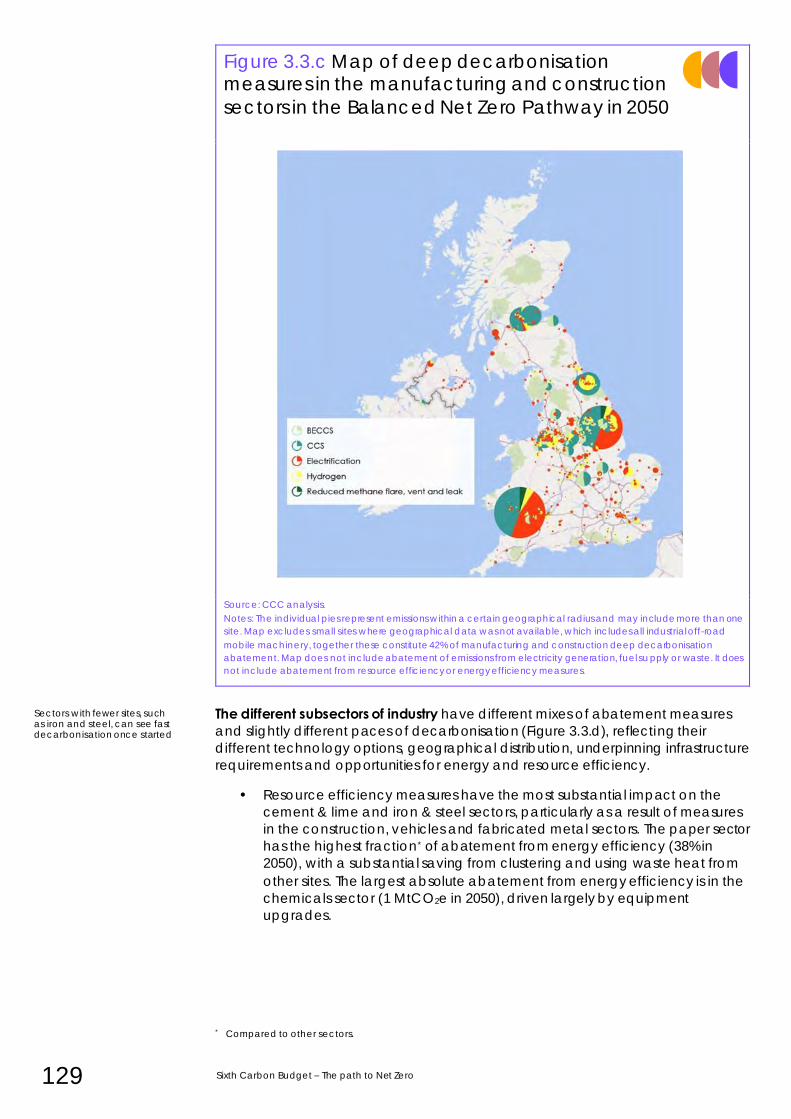
129 Sixth Carbon Budget – The path to Net Zero
Figure 3.3.c Map of deep decarbonisation measures in the manufacturing and construction
sectors in the Balanced Net Zero Pathway in 2050
Source: CCC analysis.
Notes: The individual pies represent emissions within a certain geographical radius and may include more than one
site. Map excludes small sites where geographical data was not available, which includes all industrial off-road
mobile machinery, together these constitute 42% of manufacturing and construction deep decarbonisation
abatement. Map does not include abatement of emissions from electricity generation, fuel su pply or waste. It does
not include abatement from resource efficiency or energy efficiency measures.
The different subsectors of industry have different mixes of abatement measures
and slightly different paces of decarbonisation (Figure 3.3.d), reflecting their
different technology options, geographical distribution, underpinning infrastructure
requirements and opportunities for energy and resource efficiency.
• Resource efficiency measures have the most substantial impact on the
cement & lime and iron & steel sectors, particularly as a result of measures
in the construction, vehicles and fabricated metal sectors. The paper sector
has the highest fraction* of abatement from energy efficiency (38% in
2050), with a substantial saving from clustering and using waste heat from
other sites. The largest absolute abatement from energy efficiency is in the
chemicals sector (1 MtCO2e in 2050), driven largely by equipment
upgrades.
* Compared to other sectors.
Sectors with fewer sites, such as iron and steel, can see fast decarbonisation once started.
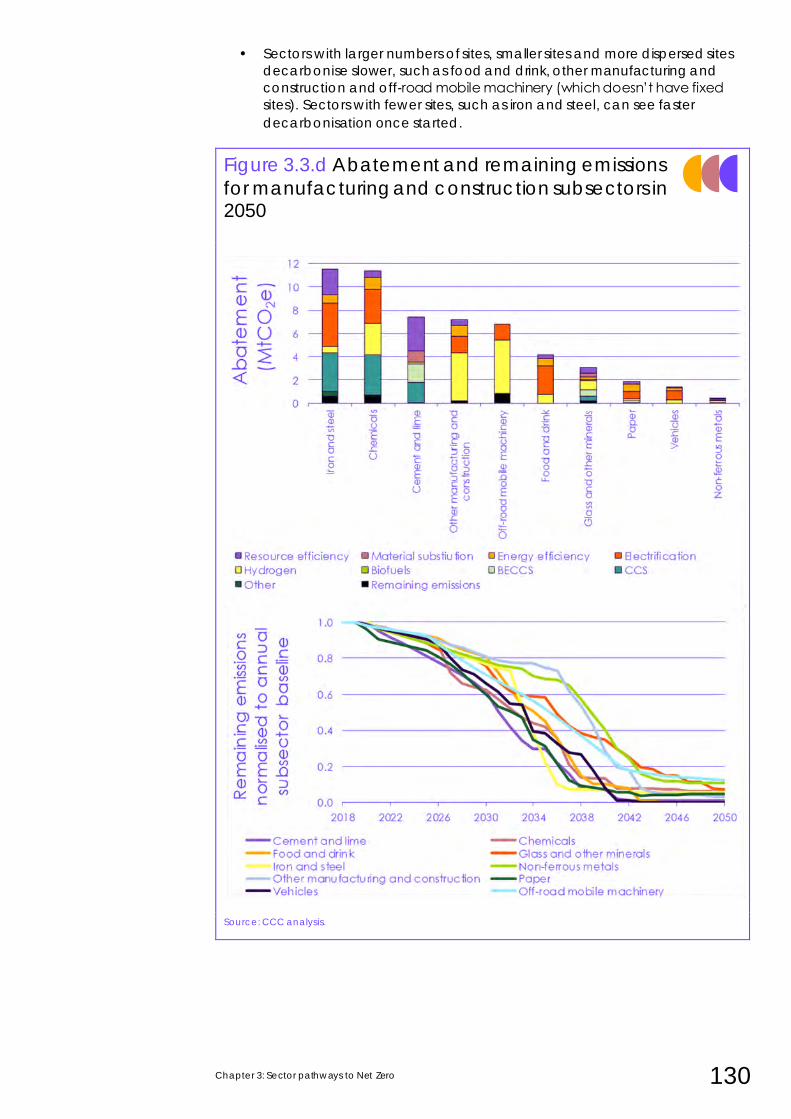
Chapter 3: Sector pathways to Net Zero 130
• Sectors with larger numbers of sites, smaller sites and more dispersed sites
decarbonise slower, such as food and drink, other manufacturing and
construction and off-road mobile machinery (which doesn’t have fixed
sites). Sectors with fewer sites, such as iron and steel, can see faster
decarbonisation once started.
Figure 3.3.d Abatement and remaining emissions
for manufacturing and construction subsectors in 2050
Source: CCC analysis.
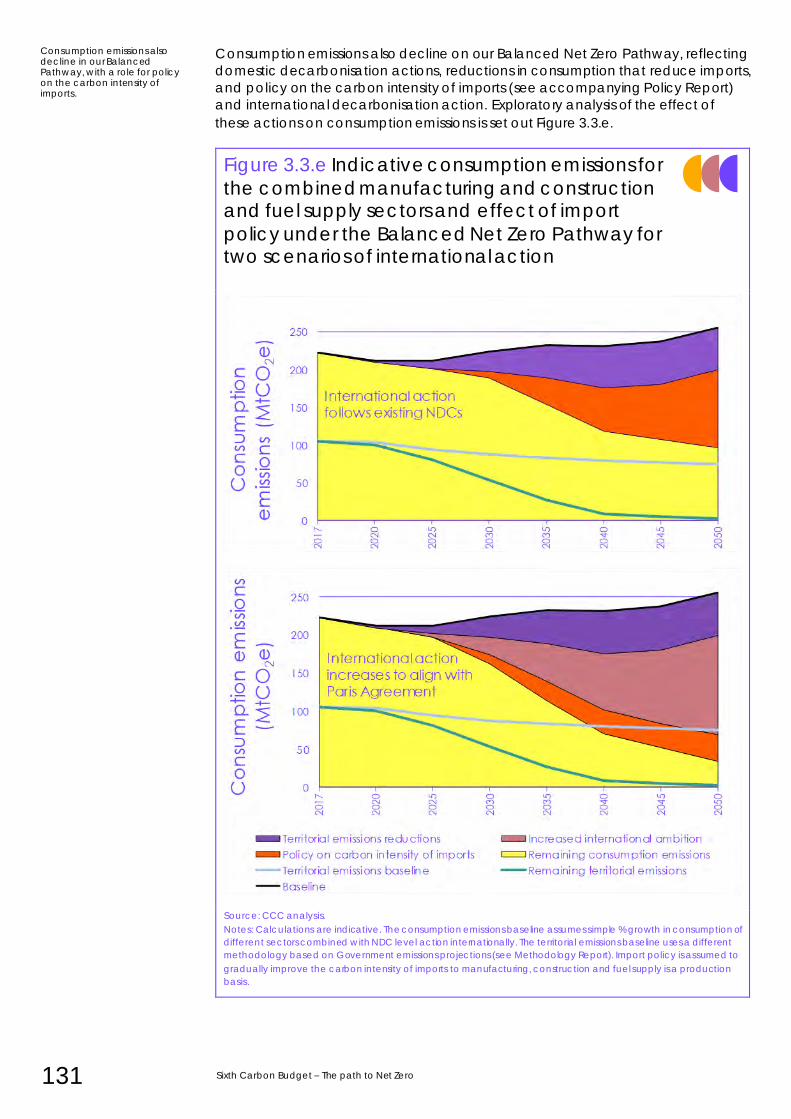
131 Sixth Carbon Budget – The path to Net Zero
Consumption emissions also decline on our Balanced Net Zero Pathway, reflecting
domestic decarbonisation actions, reductions in consumption that reduce imports,
and policy on the carbon intensity of imports (see accompanying Policy Report)
and international decarbonisation action. Exploratory analysis of the effect of
these actions on consumption emissions is set out Figure 3.3.e.
Figure 3.3.e Indicative consumption emissions for
the combined manufacturing and construction and fuel supply sectors and effect of import
policy under the Balanced Net Zero Pathway for two scenarios of international action
Source: CCC analysis.
Notes: Calculations are indicative. The consumption emissions baseline assumes simple % growth in consumption of
different sectors combined with NDC level action internationally. The territorial emissions baseline uses a different
methodology based on Government emissions projections (see Methodology Report). Import policy is assumed to
gradually improve the carbon intensity of imports to manufacturing, construction and fuel supply is a production
basis.
Consumption emissions also decline in our Balanced Pathway, with a role for policy on the carbon intensity of imports.
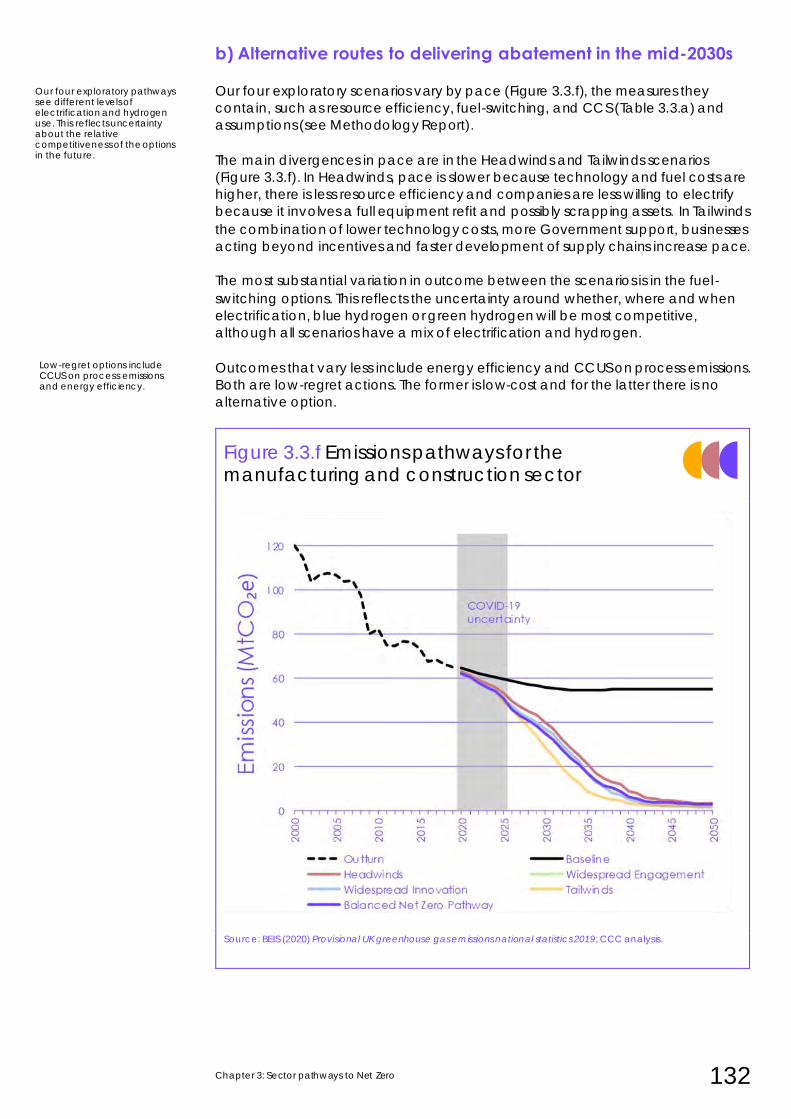
Chapter 3: Sector pathways to Net Zero 132
b) Alternative routes to delivering abatement in the mid-2030s
Our four exploratory scenarios vary by pace (Figure 3.3.f), the measures they
contain, such as resource efficiency, fuel-switching, and CCS (Table 3.3.a) and
assumptions (see Methodology Report).
The main divergences in pace are in the Headwinds and Tailwinds scenarios
(Figure 3.3.f). In Headwinds, pace is slower because technology and fuel costs are
higher, there is less resource efficiency and companies are less willing to electrify
because it involves a full equipment refit and possibly scrapping assets. In Tailwinds
the combination of lower technology costs, more Government support, businesses
acting beyond incentives and faster development of supply chains increase pace.
The most substantial variation in outcome between the scenarios is in the fuel-
switching options. This reflects the uncertainty around whether, where and when
electrification, blue hydrogen or green hydrogen will be most competitive,
although all scenarios have a mix of electrification and hydrogen.
Outcomes that vary less include energy efficiency and CCUS on process emissions.
Both are low-regret actions. The former is low-cost and for the latter there is no
alternative option.
Figure 3.3.f Emissions pathways for the manufacturing and construction sector
Source: BEIS (2020) Provisional UK greenhouse gas emissions national statistics 2019; CCC analysis.
Our four exploratory pathways see different levels of electrification and hydrogen use. This reflects uncertainty about the relative competitiveness of the options in the future.
Low-regret options include CCUS on process emissions and energy efficiency.
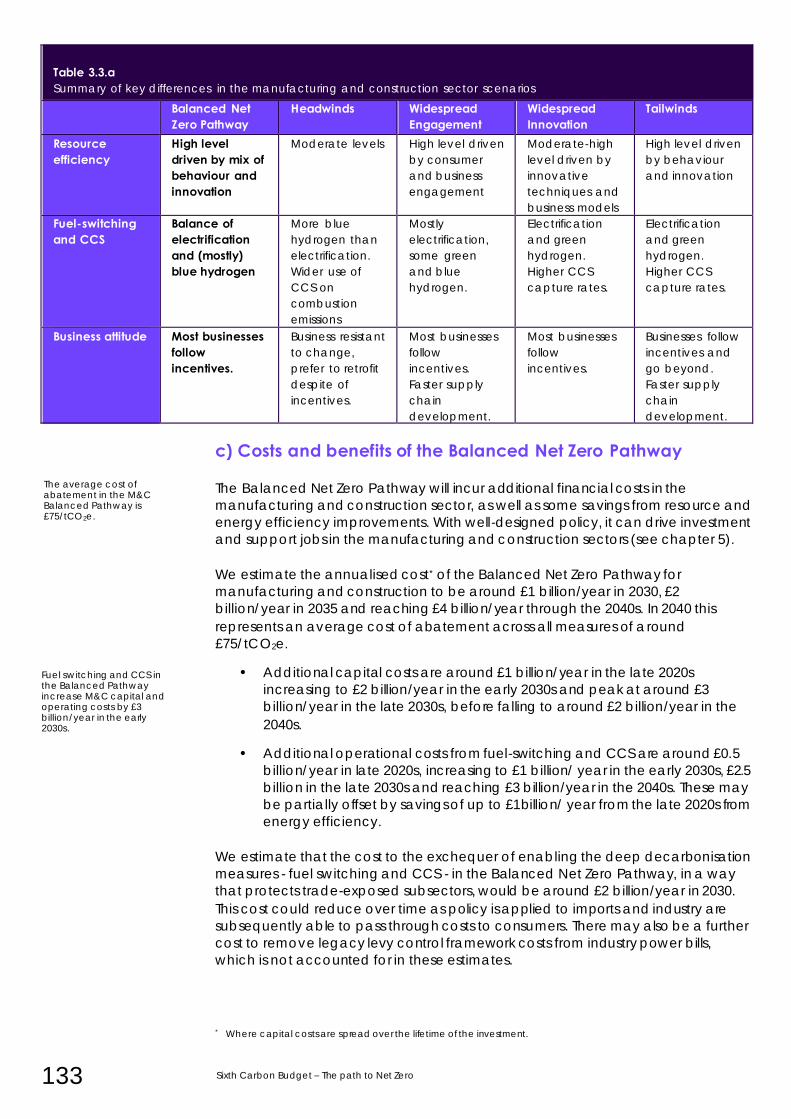
133 Sixth Carbon Budget – The path to Net Zero
Table 1.11:Table 1.1 Table 3.3.a Summary of key differences in the manufacturing and construction sector scenarios
Balanced Net Zero Pathway
Headwinds Widespread Engagement
Widespread Innovation
Tailwinds
Resource efficiency
High level driven by mix of behaviour and innovation
Moderate levels High level driven
by consumer
and business
engagement
Moderate-high
level driven by
innovative
techniques and
business models
High level driven
by behaviour
and innovation
Fuel-switching and CCS
Balance of electrification and (mostly) blue hydrogen
More blue
hydrogen than
electrification.
Wider use of
CCS on
combustion
emissions
Mostly
electrification,
some green
and blue
hydrogen.
Electrification
and green
hydrogen.
Higher CCS
capture rates.
Electrification
and green
hydrogen.
Higher CCS
capture rates.
Business attitude Most businesses follow incentives.
Business resistant
to change,
prefer to retrofit
despite of
incentives.
Most businesses
follow
incentives.
Faster supply
chain
development.
Most businesses
follow
incentives.
Businesses follow
incentives and
go beyond.
Faster supply
chain
development.
c) Costs and benefits of the Balanced Net Zero Pathway
The Balanced Net Zero Pathway will incur additional financial costs in the
manufacturing and construction sector, as well as some savings from resource and
energy efficiency improvements. With well-designed policy, it can drive investment
and support jobs in the manufacturing and construction sectors (see chapter 5).
We estimate the annualised cost* of the Balanced Net Zero Pathway for
manufacturing and construction to be around £1 billion/year in 2030, £2
billion/year in 2035 and reaching £4 billion/year through the 2040s. In 2040 this
represents an average cost of abatement across all measures of around
£75/tCO2e.
• Additional capital costs are around £1 billion/year in the late 2020s
increasing to £2 billion/year in the early 2030s and peak at around £3
billion/year in the late 2030s, before falling to around £2 billion/year in the
2040s.
• Additional operational costs from fuel-switching and CCS are around £0.5
billion/year in late 2020s, increasing to £1 billion/ year in the early 2030s, £2.5
billion in the late 2030s and reaching £3 billion/year in the 2040s. These may
be partially offset by savings of up to £1billion/ year from the late 2020s from
energy efficiency.
We estimate that the cost to the exchequer of enabling the deep decarbonisation
measures - fuel switching and CCS - in the Balanced Net Zero Pathway, in a way
that protects trade-exposed subsectors, would be around £2 billion/year in 2030.
This cost could reduce over time as policy is applied to imports and industry are
subsequently able to pass through costs to consumers. There may also be a further
cost to remove legacy levy control framework costs from industry power bills,
which is not accounted for in these estimates.
* Where capital costs are spread over the lifetime of the investment.
Fuel switching and CCS in the Balanced Pathway increase M&C capital and operating costs by £3 billion/year in the early 2030s.
The average cost of abatement in the M&C Balanced Pathway is £75/tCO2e.
Chapter 3: Sector pathways to Net Zero 134
4. Electricity generation
Introduction and key messages
In this section we set out how to reduce emissions from electricity generation to
near-zero. This will require a significant expansion of low-carbon generation, in
particular low-cost renewables and decarbonised back-up generation, in
conjunction with more flexible demand and use of storage.
Our Balanced Net Zero Pathway decarbonises electricity generation by 2035, with
action thereafter focused on meeting new demands in a low-carbon way. We set
out the analysis underpinning these conclusions in the following three sub-sections:
a) The Balanced Net Zero Pathway for electricity generation
b) Alternative routes to delivering abatement in the mid-2030s
c) Impacts of the scenarios: costs, investment, and co-impacts
Further detail on the approach to developing the scenarios is set out in Chapter 5
of the accompanying Methodology Report.
a) The Balanced Net Zero Pathway for electricity generation
Our Balanced Net Zero Pathway very largely decarbonises electricity generation
by 2030, and decarbonises it completely by 2035, with action thereafter focused
on meeting rising demand with low-carbon generation.
The key features of the scenario are an increasing demand for electricity,
decreasing carbon intensity of generation, and a more flexible system:
• Increasing demand for electricity. This reflects increasing electrification of
the economy (e.g. use of electric vehicles in transport). There is a doubling
of demand, from around 300 TWh today to 360 TWh in 2030, 460 TWh in
2035, and 610 TWh in 2050 (Figure 3.4.a). That excludes the production of
hydrogen using surplus generation, which accounts for an additional 30
TWh of electricity generation in 2035 and 120 TWh in 2050.
• Decreasing carbon intensity of electricity generation. Carbon intensity of
generation falls from 220 gCO2/kWh in 2019 to around 50 gCO2/kWh in
2030, 10 gCO2/kWh in 2035, and 2 gCO2/kWh in 2050 (Figure 3.4.b).
– Phasing out unabated fossil fuel generation by 2035. Electricity
generation will be completely low-carbon once unabated coal and
gas plants are no longer generating. Following the coal phase-out by
2024, almost all remaining emissions will come from unabated gas. The
Balanced Pathway phases out use of unabated gas by 2035, meaning
electricity generation is completely low-carbon from that date. That is
achievable with the cost-effective deployment of renewables, gas
CCS, and hydrogen at scale. Chapter 5 in the Methodology Report
sets out further detail on why this is an achievable date, and Chapter
5 in the Policy Report sets out the policy implications.
– Increasing variable renewables to 80% of generation by 2050. Under
the Balanced Pathway variable renewables reach 60% of generation
by 2030, 70% by 2035, and 80% by 2050. This generation allows new
electricity demands to be met with minimal emissions and at low cost.
The Balanced Pathway has a doubling in demand by 2050 compared to 2019 levels.
Electricity generation is entirely low-carbon by 2035.
Renewables form the backbone of the electricity system, representing 80% of generation in 2050.
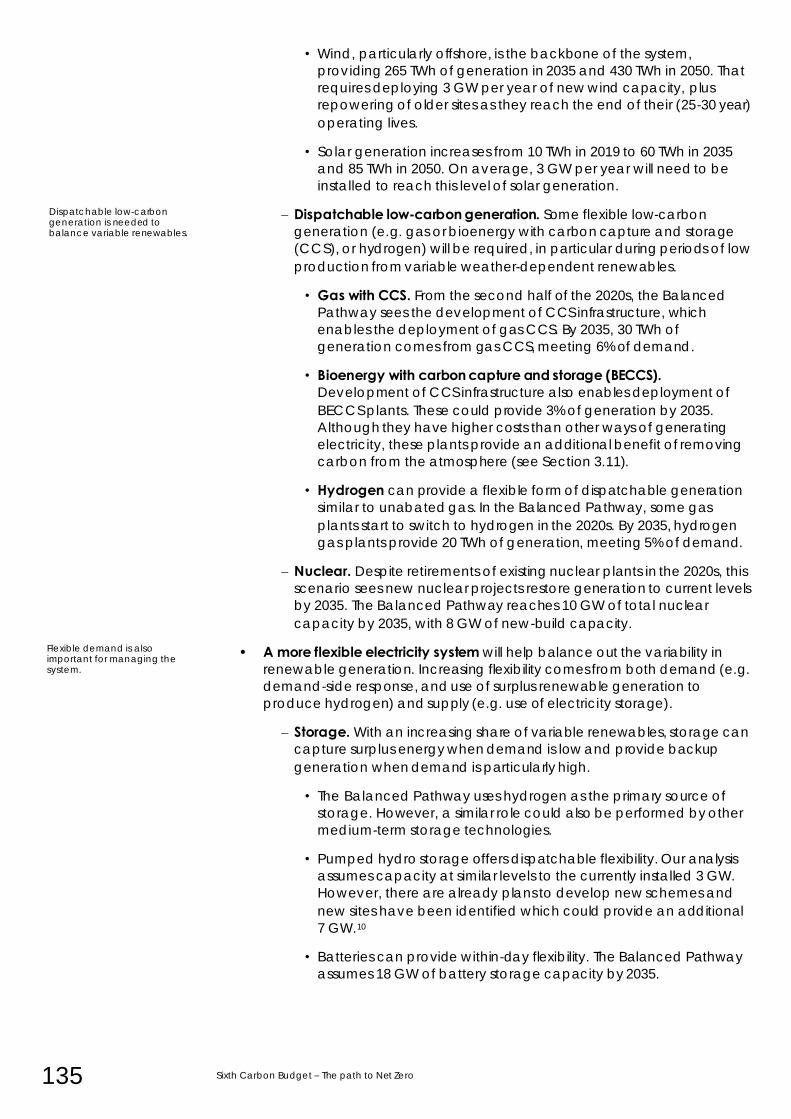
135 Sixth Carbon Budget – The path to Net Zero
• Wind, particularly offshore, is the backbone of the system,
providing 265 TWh of generation in 2035 and 430 TWh in 2050. That
requires deploying 3 GW per year of new wind capacity, plus
repowering of older sites as they reach the end of their (25-30 year)
operating lives.
• Solar generation increases from 10 TWh in 2019 to 60 TWh in 2035
and 85 TWh in 2050. On average, 3 GW per year will need to be
installed to reach this level of solar generation.
– Dispatchable low-carbon generation. Some flexible low-carbon
generation (e.g. gas or bioenergy with carbon capture and storage
(CCS), or hydrogen) will be required, in particular during periods of low
production from variable weather-dependent renewables.
• Gas with CCS. From the second half of the 2020s, the Balanced
Pathway sees the development of CCS infrastructure, which
enables the deployment of gas CCS. By 2035, 30 TWh of
generation comes from gas CCS, meeting 6% of demand.
• Bioenergy with carbon capture and storage (BECCS). Development of CCS infrastructure also enables deployment of
BECCS plants. These could provide 3% of generation by 2035.
Although they have higher costs than other ways of generating
electricity, these plants provide an additional benefit of removing
carbon from the atmosphere (see Section 3.11).
• Hydrogen can provide a flexible form of dispatchable generation
similar to unabated gas. In the Balanced Pathway, some gas
plants start to switch to hydrogen in the 2020s. By 2035, hydrogen
gas plants provide 20 TWh of generation, meeting 5% of demand.
– Nuclear. Despite retirements of existing nuclear plants in the 2020s, this
scenario sees new nuclear projects restore generation to current levels
by 2035. The Balanced Pathway reaches 10 GW of total nuclear
capacity by 2035, with 8 GW of new-build capacity.
• A more flexible electricity system will help balance out the variability in
renewable generation. Increasing flexibility comes from both demand (e.g.
demand-side response, and use of surplus renewable generation to
produce hydrogen) and supply (e.g. use of electricity storage).
– Storage. With an increasing share of variable renewables, storage can
capture surplus energy when demand is low and provide backup
generation when demand is particularly high.
• The Balanced Pathway uses hydrogen as the primary source of
storage. However, a similar role could also be performed by other
medium-term storage technologies.
• Pumped hydro storage offers dispatchable flexibility. Our analysis
assumes capacity at similar levels to the currently installed 3 GW.
However, there are already plans to develop new schemes and
new sites have been identified which could provide an additional
7 GW.10
• Batteries can provide within-day flexibility. The Balanced Pathway
assumes 18 GW of battery storage capacity by 2035.
Dispatchable low-carbon generation is needed to balance variable renewables.
Flexible demand is also important for managing the system.
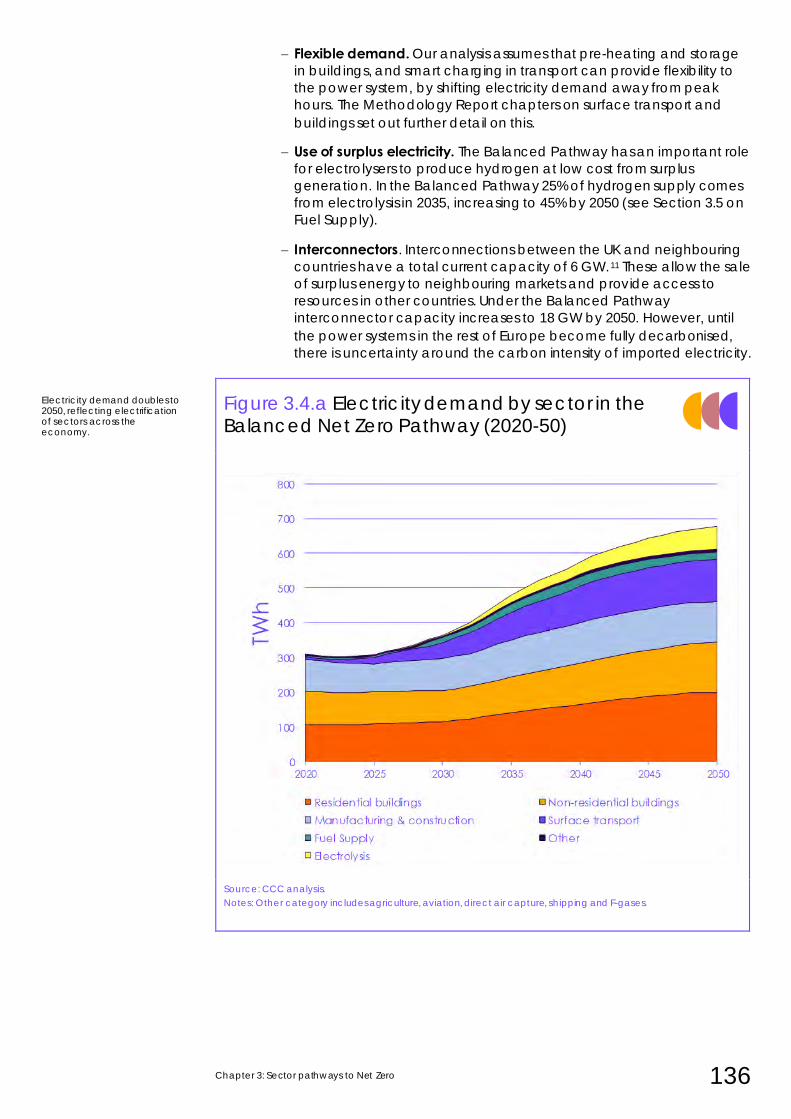
Chapter 3: Sector pathways to Net Zero 136
– Flexible demand. Our analysis assumes that pre-heating and storage
in buildings, and smart charging in transport can provide flexibility to
the power system, by shifting electricity demand away from peak
hours. The Methodology Report chapters on surface transport and
buildings set out further detail on this.
– Use of surplus electricity. The Balanced Pathway has an important role
for electrolysers to produce hydrogen at low cost from surplus
generation. In the Balanced Pathway 25% of hydrogen supply comes
from electrolysis in 2035, increasing to 45% by 2050 (see Section 3.5 on
Fuel Supply).
– Interconnectors. Interconnections between the UK and neighbouring
countries have a total current capacity of 6 GW.11 These allow the sale
of surplus energy to neighbouring markets and provide access to
resources in other countries. Under the Balanced Pathway
interconnector capacity increases to 18 GW by 2050. However, until
the power systems in the rest of Europe become fully decarbonised,
there is uncertainty around the carbon intensity of imported electricity.
Figure 3.4.a Electricity demand by sector in the Balanced Net Zero Pathway (2020-50)
Source: CCC analysis.
Notes: Other category includes agriculture, aviation, direct air capture, shipping and F-gases.
Electricity demand doubles to 2050, reflecting electrification of sectors across the economy.
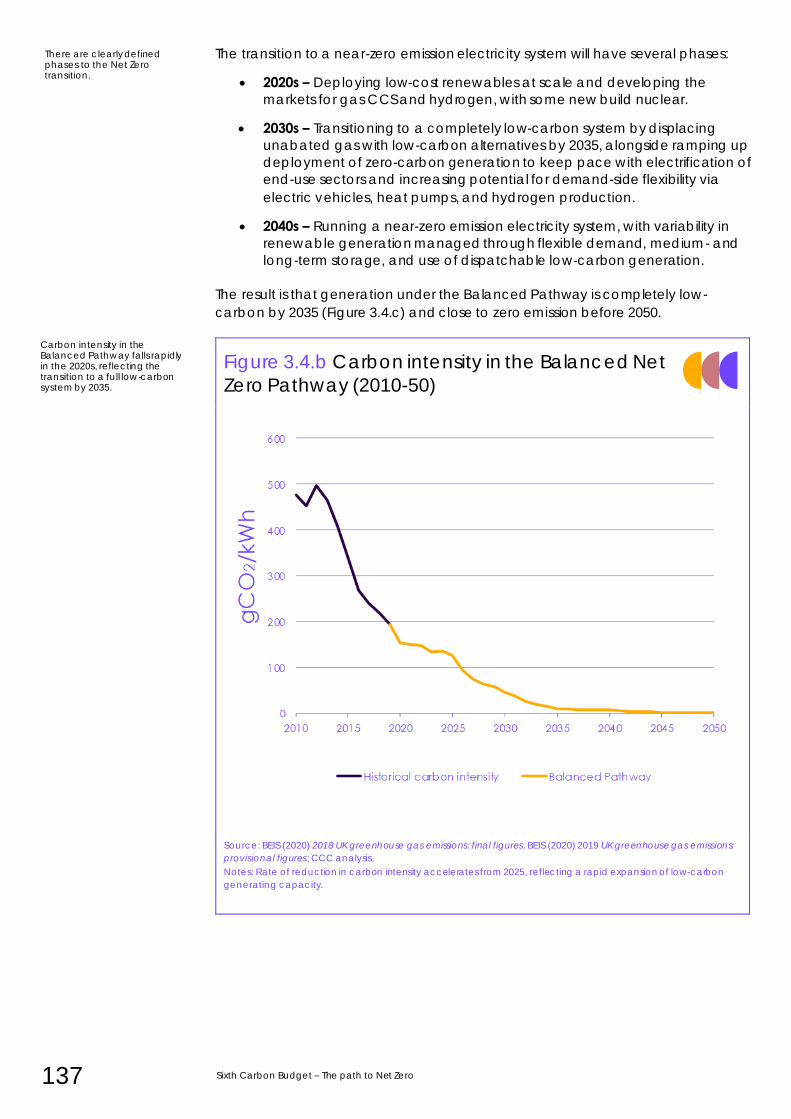
137 Sixth Carbon Budget – The path to Net Zero
The transition to a near-zero emission electricity system will have several phases:
• 2020s – Deploying low-cost renewables at scale and developing the
markets for gas CCS and hydrogen, with some new build nuclear.
• 2030s – Transitioning to a completely low-carbon system by displacing
unabated gas with low-carbon alternatives by 2035, alongside ramping up
deployment of zero-carbon generation to keep pace with electrification of
end-use sectors and increasing potential for demand-side flexibility via
electric vehicles, heat pumps, and hydrogen production.
• 2040s – Running a near-zero emission electricity system, with variability in
renewable generation managed through flexible demand, medium- and
long-term storage, and use of dispatchable low-carbon generation.
The result is that generation under the Balanced Pathway is completely low-
carbon by 2035 (Figure 3.4.c) and close to zero emission before 2050.
Figure 3.4.b Carbon intensity in the Balanced Net
Zero Pathway (2010-50)
Source: BEIS (2020) 2018 UK greenhouse gas emissions: final figures. BEIS (2020) 2019 UK greenhouse gas emissions:
provisional figures; CCC analysis.
Notes: Rate of reduction in carbon intensity accelerates from 2025, reflecting a rapid expansion of low-carbon
generating capacity.
There are clearly defined phases to the Net Zero transition.
Carbon intensity in the Balanced Pathway falls rapidly in the 2020s, reflecting the transition to a full low-carbon system by 2035.
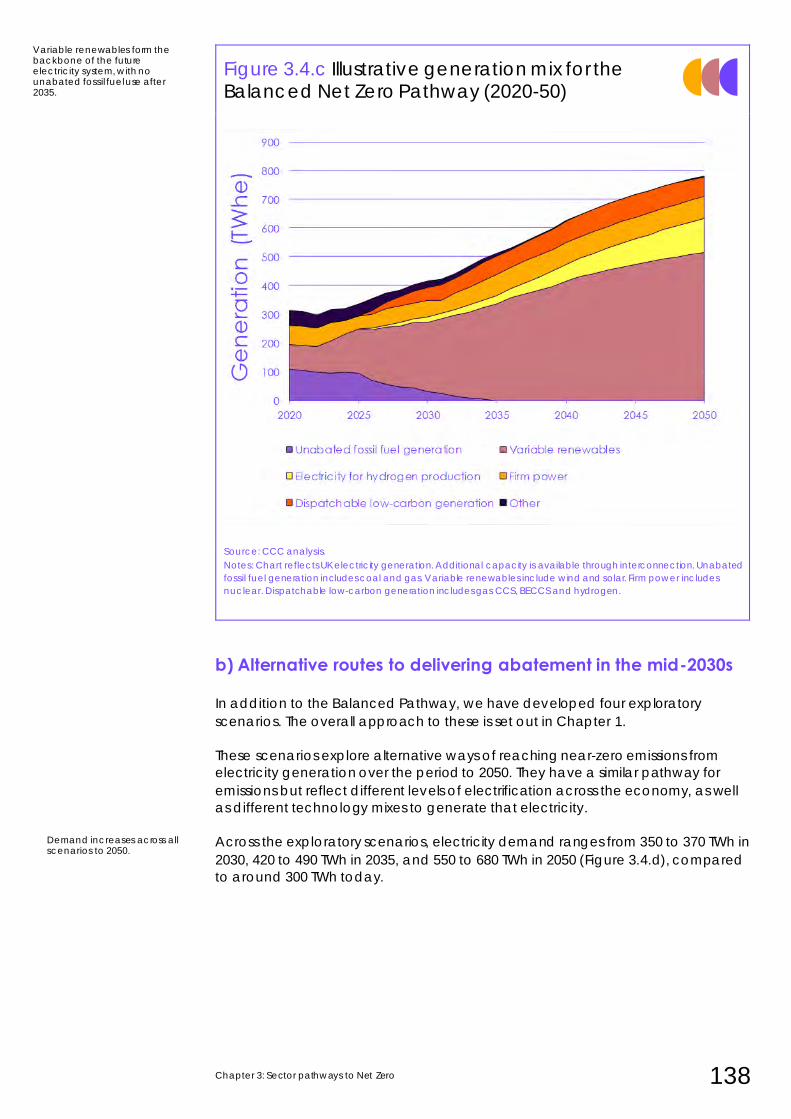
Chapter 3: Sector pathways to Net Zero 138
Figure 3.4.c Illustrative generation mix for the Balanced Net Zero Pathway (2020-50)
Source: CCC analysis.
Notes: Chart reflects UK electricity generation. Additional capacity is available through interconnection. Unabated
fossil fuel generation includes coal and gas. Variable renewables include wind and solar. Firm power includes
nuclear. Dispatchable low-carbon generation includes gas CCS, BECCS and hydrogen.
b) Alternative routes to delivering abatement in the mid-2030s In addition to the Balanced Pathway, we have developed four exploratory
scenarios. The overall approach to these is set out in Chapter 1.
These scenarios explore alternative ways of reaching near-zero emissions from
electricity generation over the period to 2050. They have a similar pathway for
emissions but reflect different levels of electrification across the economy, as well
as different technology mixes to generate that electricity.
Across the exploratory scenarios, electricity demand ranges from 350 to 370 TWh in
2030, 420 to 490 TWh in 2035, and 550 to 680 TWh in 2050 (Figure 3.4.d), compared
to around 300 TWh today.
Demand increases across all scenarios to 2050.
Variable renewables form the backbone of the future electricity system, with no unabated fossil fuel use after 2035.
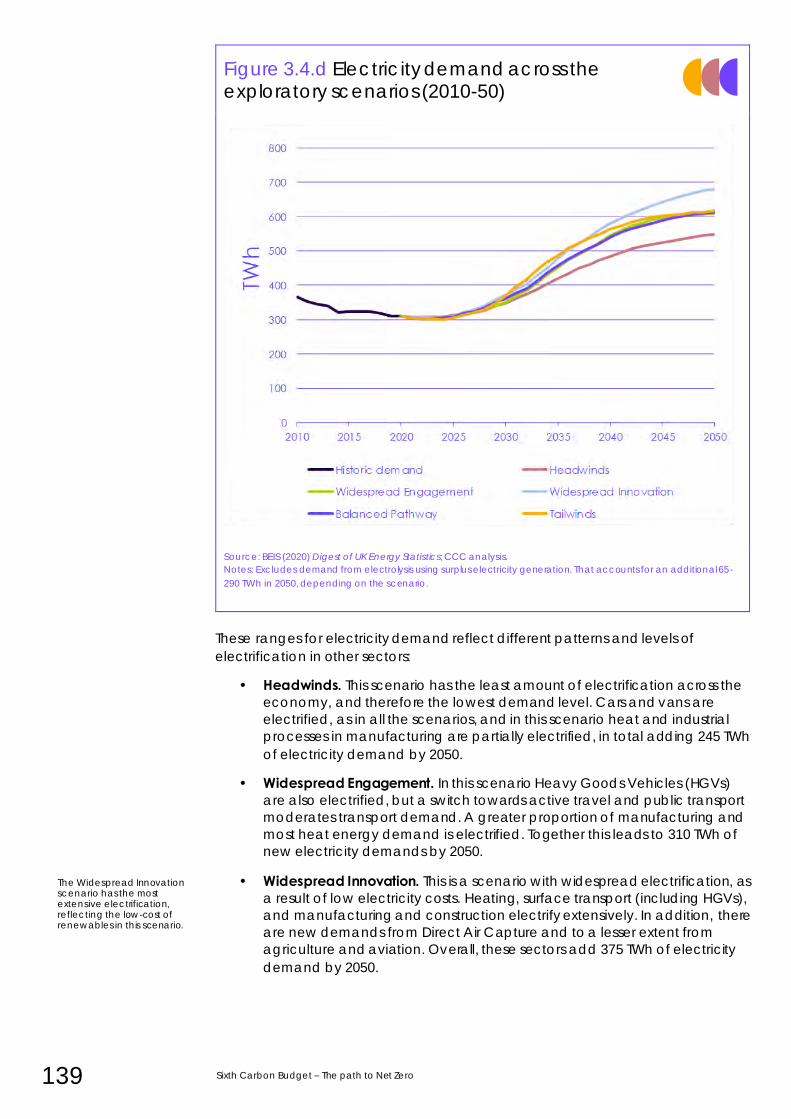
139 Sixth Carbon Budget – The path to Net Zero
Figure 3.4.d Electricity demand across the exploratory scenarios (2010-50)
Source: BEIS (2020) Digest of UK Energy Statistics; CCC analysis.
Notes: Excludes demand from electrolysis using surplus electricity generation. That accounts for an additional 65-
290 TWh in 2050, depending on the scenario.
These ranges for electricity demand reflect different patterns and levels of
electrification in other sectors:
• Headwinds. This scenario has the least amount of electrification across the
economy, and therefore the lowest demand level. Cars and vans are
electrified, as in all the scenarios, and in this scenario heat and industrial
processes in manufacturing are partially electrified, in total adding 245 TWh
of electricity demand by 2050.
• Widespread Engagement. In this scenario Heavy Goods Vehicles (HGVs)
are also electrified, but a switch towards active travel and public transport
moderates transport demand. A greater proportion of manufacturing and
most heat energy demand is electrified. Together this leads to 310 TWh of
new electricity demands by 2050.
• Widespread Innovation. This is a scenario with widespread electrification, as
a result of low electricity costs. Heating, surface transport (including HGVs),
and manufacturing and construction electrify extensively. In addition, there
are new demands from Direct Air Capture and to a lesser extent from
agriculture and aviation. Overall, these sectors add 375 TWh of electricity
demand by 2050.
The Widespread Innovation scenario has the most extensive electrification, reflecting the low-cost of renewables in this scenario.
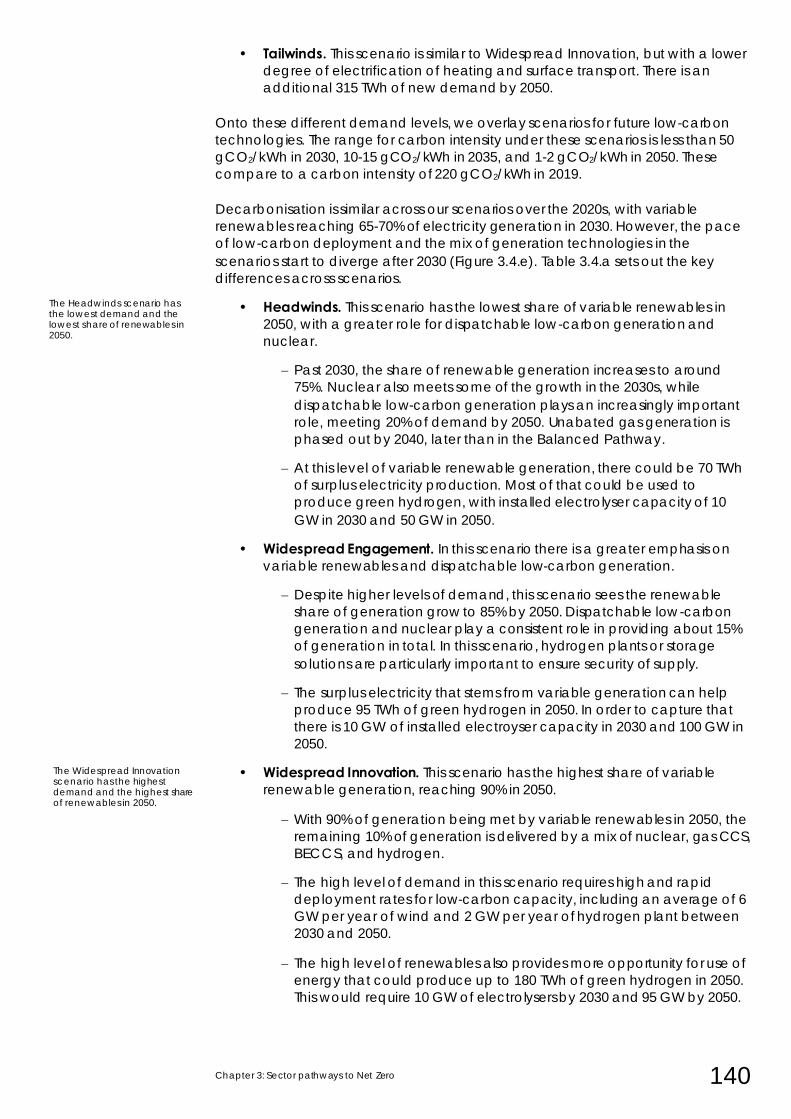
Chapter 3: Sector pathways to Net Zero 140
• Tailwinds. This scenario is similar to Widespread Innovation, but with a lower
degree of electrification of heating and surface transport. There is an
additional 315 TWh of new demand by 2050.
Onto these different demand levels, we overlay scenarios for future low-carbon
technologies. The range for carbon intensity under these scenarios is less than 50
gCO2/kWh in 2030, 10-15 gCO2/kWh in 2035, and 1-2 gCO2/kWh in 2050. These
compare to a carbon intensity of 220 gCO2/kWh in 2019.
Decarbonisation is similar across our scenarios over the 2020s, with variable
renewables reaching 65-70% of electricity generation in 2030. However, the pace
of low-carbon deployment and the mix of generation technologies in the
scenarios start to diverge after 2030 (Figure 3.4.e). Table 3.4.a sets out the key
differences across scenarios.
• Headwinds. This scenario has the lowest share of variable renewables in
2050, with a greater role for dispatchable low-carbon generation and
nuclear.
– Past 2030, the share of renewable generation increases to around
75%. Nuclear also meets some of the growth in the 2030s, while
dispatchable low-carbon generation plays an increasingly important
role, meeting 20% of demand by 2050. Unabated gas generation is
phased out by 2040, later than in the Balanced Pathway.
– At this level of variable renewable generation, there could be 70 TWh
of surplus electricity production. Most of that could be used to
produce green hydrogen, with installed electrolyser capacity of 10
GW in 2030 and 50 GW in 2050.
• Widespread Engagement. In this scenario there is a greater emphasis on
variable renewables and dispatchable low-carbon generation.
– Despite higher levels of demand, this scenario sees the renewable
share of generation grow to 85% by 2050. Dispatchable low-carbon
generation and nuclear play a consistent role in providing about 15%
of generation in total. In this scenario, hydrogen plants or storage
solutions are particularly important to ensure security of supply.
– The surplus electricity that stems from variable generation can help
produce 95 TWh of green hydrogen in 2050. In order to capture that
there is 10 GW of installed electroyser capacity in 2030 and 100 GW in
2050.
• Widespread Innovation. This scenario has the highest share of variable
renewable generation, reaching 90% in 2050.
– With 90% of generation being met by variable renewables in 2050, the
remaining 10% of generation is delivered by a mix of nuclear, gas CCS,
BECCS, and hydrogen.
– The high level of demand in this scenario requires high and rapid
deployment rates for low-carbon capacity, including an average of 6
GW per year of wind and 2 GW per year of hydrogen plant between
2030 and 2050.
– The high level of renewables also provides more opportunity for use of
energy that could produce up to 180 TWh of green hydrogen in 2050.
This would require 10 GW of electrolysers by 2030 and 95 GW by 2050.
The Headwinds scenario has the lowest demand and the lowest share of renewables in 2050.
The Widespread Innovation scenario has the highest demand and the highest share of renewables in 2050.
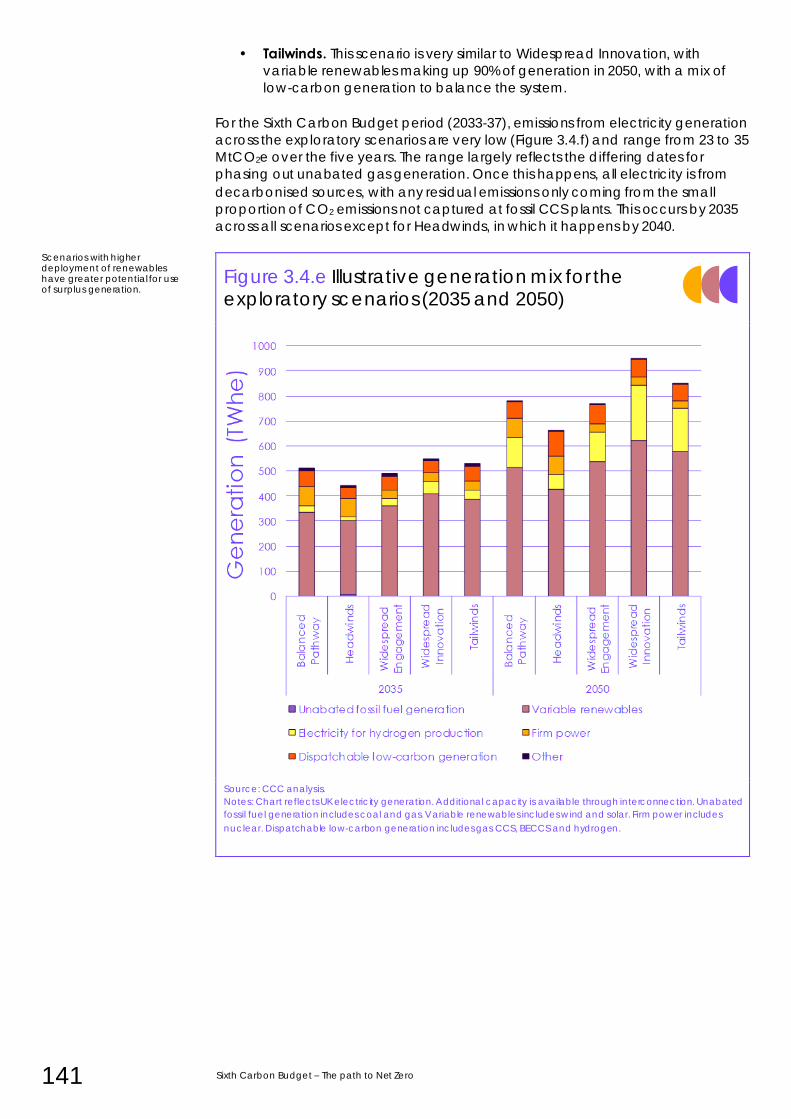
141 Sixth Carbon Budget – The path to Net Zero
• Tailwinds. This scenario is very similar to Widespread Innovation, with
variable renewables making up 90% of generation in 2050, with a mix of
low-carbon generation to balance the system.
For the Sixth Carbon Budget period (2033-37), emissions from electricity generation
across the exploratory scenarios are very low (Figure 3.4.f) and range from 23 to 35
MtCO2e over the five years. The range largely reflects the differing dates for
phasing out unabated gas generation. Once this happens, all electricity is from
decarbonised sources, with any residual emissions only coming from the small
proportion of CO2 emissions not captured at fossil CCS plants. This occurs by 2035
across all scenarios except for Headwinds, in which it happens by 2040.
Figure 3.4.e Illustrative generation mix for the exploratory scenarios (2035 and 2050)
Source: CCC analysis.
Notes: Chart reflects UK electricity generation. Additional capacity is available through interconnection. Unabated
fossil fuel generation includes coal and gas. Variable renewables includes wind and solar. Firm power includes
nuclear. Dispatchable low-carbon generation includes gas CCS, BECCS and hydrogen.
Scenarios with higher deployment of renewables have greater potential for use of surplus generation.
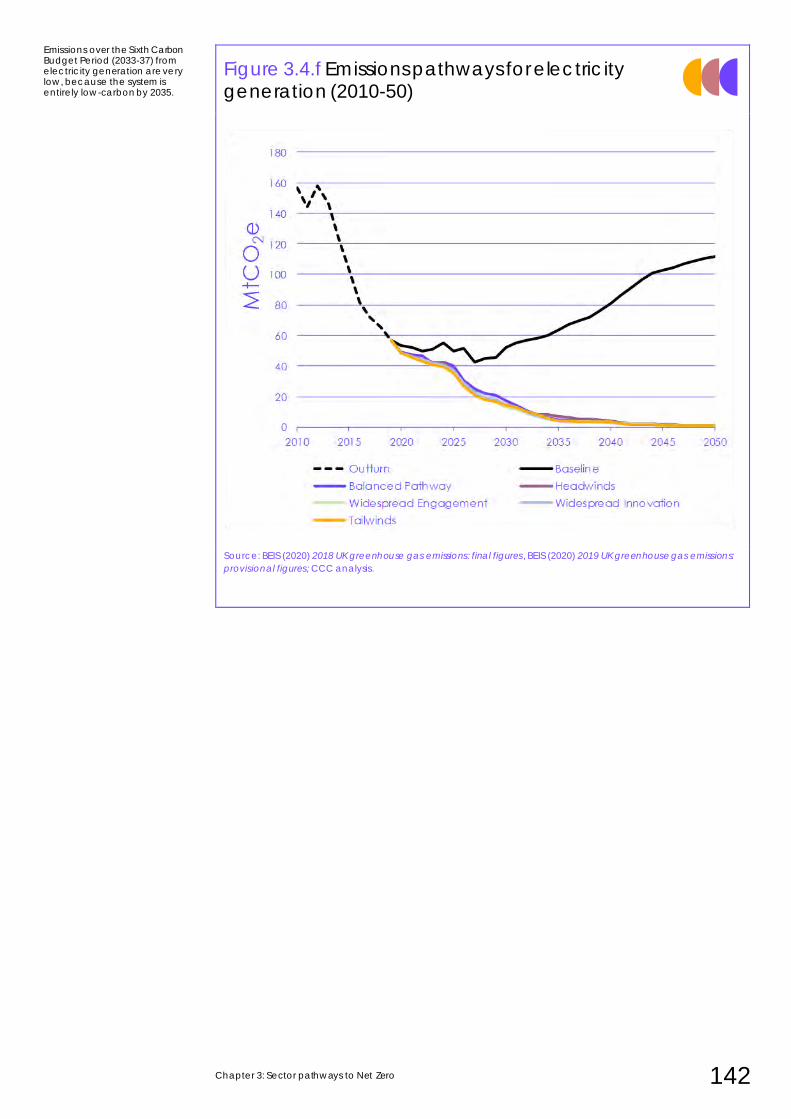
Chapter 3: Sector pathways to Net Zero 142
Figure 3.4.f Emissions pathways for electricity generation (2010-50)
Source: BEIS (2020) 2018 UK greenhouse gas emissions: final figures , BEIS (2020) 2019 UK greenhouse gas emissions:
provisional figures; CCC analysis.
Emissions over the Sixth Carbon Budget Period (2033-37) from electricity generation are very low, because the system is entirely low-carbon by 2035.
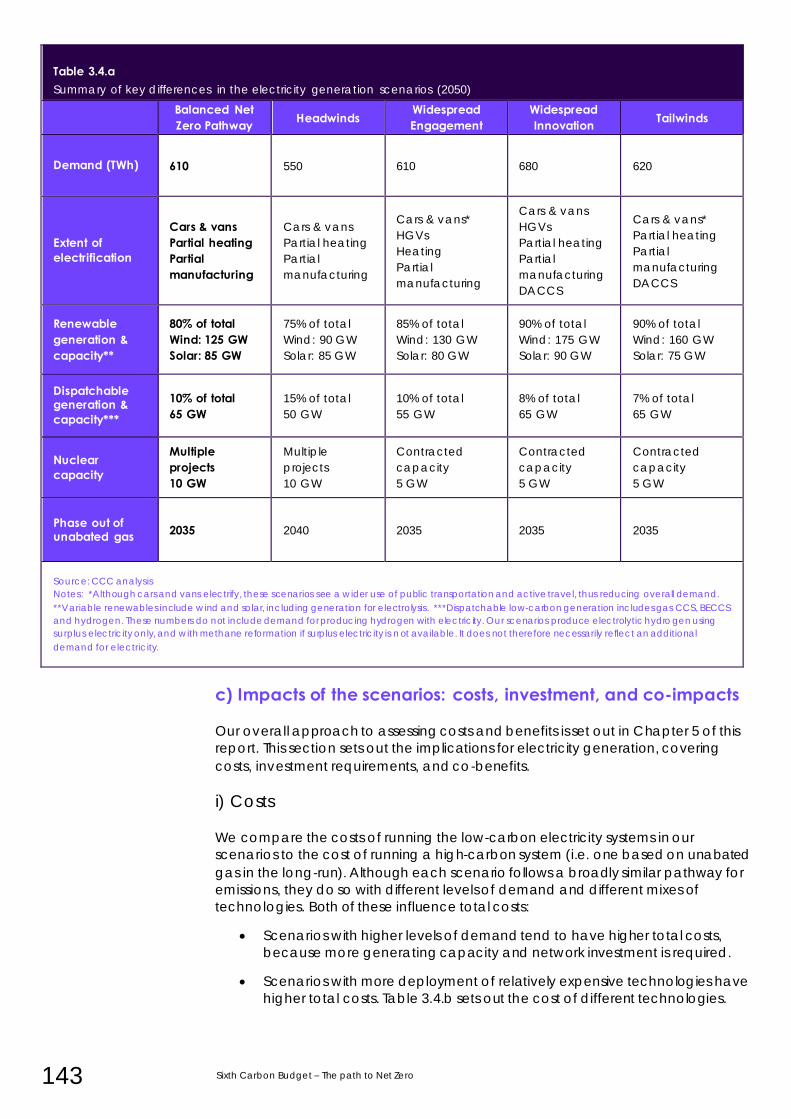
143 Sixth Carbon Budget – The path to Net Zero
Table 1.11:Table 1.11 Table 3.4.a Summary of key differences in the electricity generation scenarios (2050)
Balanced Net Zero Pathway Headwinds
Widespread Engagement
Widespread Innovation Tailwinds
Demand (TWh) 610 550 610 680 620
Extent of electrification
Cars & vans Partial heating Partial manufacturing
Cars & vans
Partial heating
Partial
manufacturing
Cars & vans*
HGVs
Heating
Partial
manufacturing
Cars & vans
HGVs
Partial heating
Partial
manufacturing
DACCS
Cars & vans*
Partial heating
Partial
manufacturing
DACCS
Renewable generation & capacity**
80% of total Wind: 125 GW Solar: 85 GW
75% of total
Wind: 90 GW
Solar: 85 GW
85% of total
Wind: 130 GW
Solar: 80 GW
90% of total
Wind: 175 GW
Solar: 90 GW
90% of total
Wind: 160 GW
Solar: 75 GW
Dispatchable generation & capacity***
10% of total 65 GW
15% of total
50 GW
10% of total
55 GW
8% of total
65 GW
7% of total
65 GW
Nuclear capacity
Multiple projects 10 GW
Multiple
projects
10 GW
Contracted
capacity
5 GW
Contracted
capacity
5 GW
Contracted
capacity
5 GW
Phase out of unabated gas 2035 2040 2035 2035 2035
Source: CCC analysis
Notes: *Although cars and vans electrify, these scenarios see a wider use of public transportation and active travel, thus reducing overall demand.
**Variable renewables include wind and solar, including generation for electrolysis. ***Dispatchable low-carbon generation includes gas CCS, BECCS
and hydrogen. These numbers do not include demand for producing hydrogen with electricity. Our scenarios produce electrolytic hydrogen using
surplus electricity only, and with methane reformation if surplus electricity is n ot available. It does not therefore necessarily reflect an additional
demand for electricity.
c) Impacts of the scenarios: costs, investment, and co-impacts
Our overall approach to assessing costs and benefits is set out in Chapter 5 of this
report. This section sets out the implications for electricity generation, covering
costs, investment requirements, and co-benefits.
i) Costs
We compare the costs of running the low-carbon electricity systems in our
scenarios to the cost of running a high-carbon system (i.e. one based on unabated
gas in the long-run). Although each scenario follows a broadly similar pathway for
emissions, they do so with different levels of demand and different mixes of
technologies. Both of these influence total costs:
• Scenarios with higher levels of demand tend to have higher total costs,
because more generating capacity and network investment is required.
• Scenarios with more deployment of relatively expensive technologies have
higher total costs. Table 3.4.b sets out the cost of different technologies.
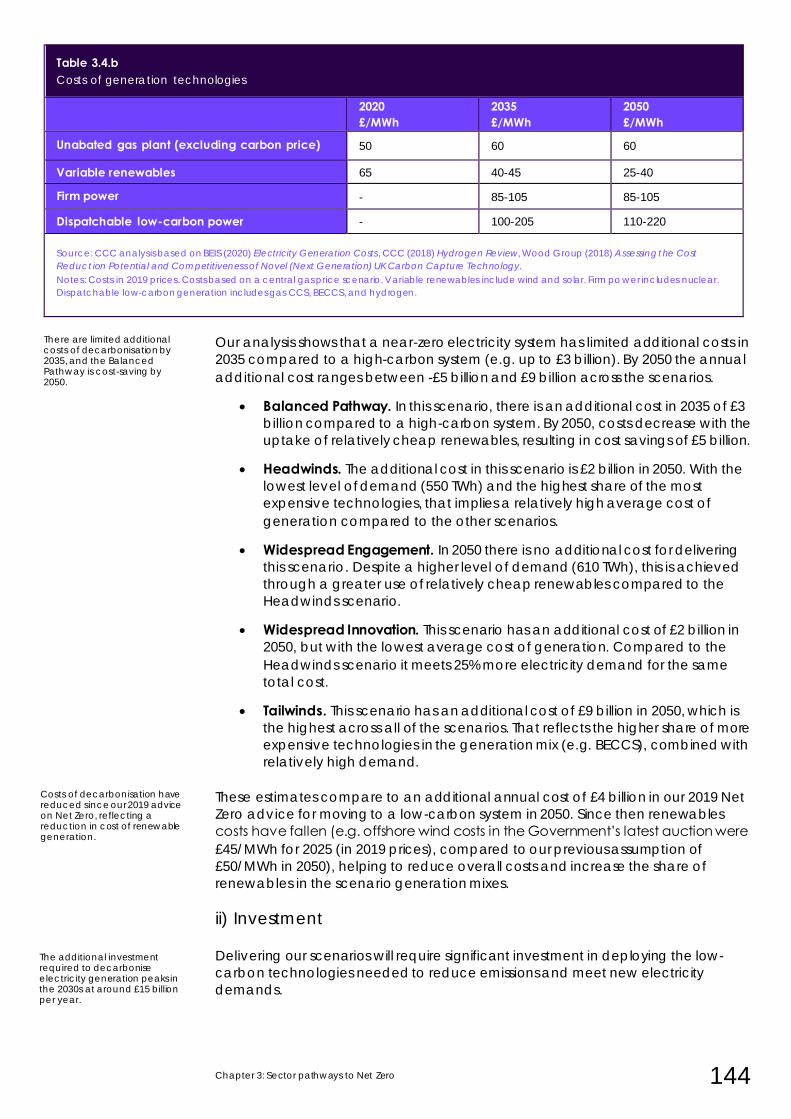
Chapter 3: Sector pathways to Net Zero 144
Table 3.4.b Costs of generation technologies
2020 £/MWh
2035 £/MWh
2050 £/MWh
Unabated gas plant (excluding carbon price) 50 60 60
Variable renewables 65 40-45 25-40
Firm power - 85-105 85-105
Dispatchable low-carbon power - 100-205 110-220
Source: CCC analysis based on BEIS (2020) Electricity Generation Costs , CCC (2018) Hydrogen Review, Wood Group (2018) Assessing the Cost
Reduct ion Potential and Competitiveness of Novel (Next Generation) UK Carbon Capture Technology.
Notes: Costs in 2019 prices. Costs based on a central gas price scenario. Variable renewables include wind and solar. Firm po wer includes nuclear.
Dispatchable low-carbon generation includes gas CCS, BECCS, and hydrogen.
Our analysis shows that a near-zero electricity system has limited additional costs in
2035 compared to a high-carbon system (e.g. up to £3 billion). By 2050 the annual
additional cost ranges between -£5 billion and £9 billion across the scenarios.
• Balanced Pathway. In this scenario, there is an additional cost in 2035 of £3
billion compared to a high-carbon system. By 2050, costs decrease with the
uptake of relatively cheap renewables, resulting in cost savings of £5 billion.
• Headwinds. The additional cost in this scenario is £2 billion in 2050. With the
lowest level of demand (550 TWh) and the highest share of the most
expensive technologies, that implies a relatively high average cost of
generation compared to the other scenarios.
• Widespread Engagement. In 2050 there is no additional cost for delivering
this scenario. Despite a higher level of demand (610 TWh), this is achieved
through a greater use of relatively cheap renewables compared to the
Headwinds scenario.
• Widespread Innovation. This scenario has an additional cost of £2 billion in
2050, but with the lowest average cost of generation. Compared to the
Headwinds scenario it meets 25% more electricity demand for the same
total cost.
• Tailwinds. This scenario has an additional cost of £9 billion in 2050, which is
the highest across all of the scenarios. That reflects the higher share of more
expensive technologies in the generation mix (e.g. BECCS), combined with
relatively high demand.
These estimates compare to an additional annual cost of £4 billion in our 2019 Net
Zero advice for moving to a low-carbon system in 2050. Since then renewables
costs have fallen (e.g. offshore wind costs in the Government’s latest auction were
£45/MWh for 2025 (in 2019 prices), compared to our previous assumption of
£50/MWh in 2050), helping to reduce overall costs and increase the share of
renewables in the scenario generation mixes.
ii) Investment
Delivering our scenarios will require significant investment in deploying the low-
carbon technologies needed to reduce emissions and meet new electricity
demands.
There are limited additional costs of decarbonisation by 2035, and the Balanced Pathway is cost-saving by 2050.
Costs of decarbonisation have reduced since our 2019 advice on Net Zero, reflecting a reduction in cost of renewable generation.
The additional investment required to decarbonise electricity generation peaks in the 2030s at around £15 billion per year.
145 Sixth Carbon Budget – The path to Net Zero
Figure 3.4.g shows the additional capital expenditure, and operational cost
savings, for the Balanced Pathway compared to a high-carbon baseline.
• The total additional capital investment required (compared to a high-
carbon system) rises to around £15 billion in 2035 and £5 billion in 2050.
– Investment requirements peak in the 2030s, and are lower in the
following period as costs of low-carbon technologies fall.
– These investment costs include the additional cost of strengthening
the electricity network to accommodate higher levels of demand.
These costs make up around 30% of the total on average.
– Capital investment in electricity generation helps avoid operational
costs in other sectors, as those sectors electrify.
• Total costs are lower than investment costs, given the significantly lower
operational costs of running low-carbon technologies (i.e. renewables
have no fuel input costs). The Balanced Pathway saves £10 billion in
operational costs in 2050 compared to the high-carbon baseline.
Overall, by 2050 the operational cost savings under the Balanced Pathway more
than offset the additional investment required in electricity generation.
This capital investment is more than offset by the operational cost savings it enables.
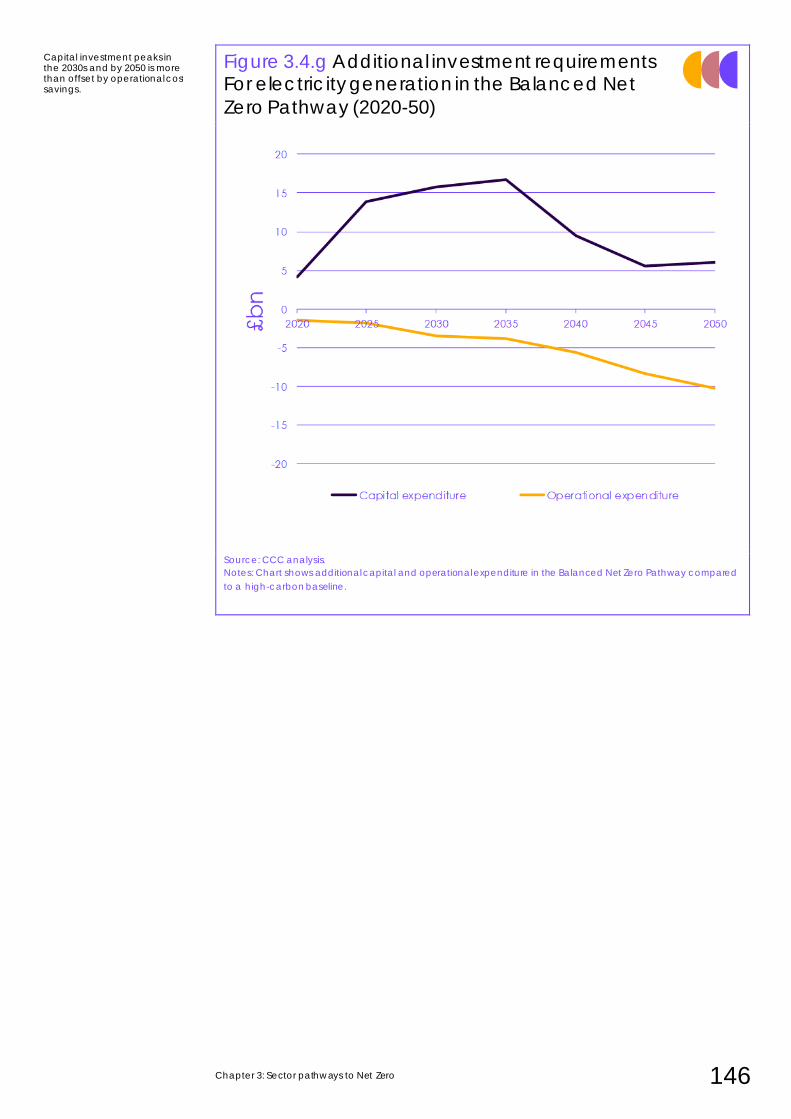
Chapter 3: Sector pathways to Net Zero 146
Figure 3.4.g Additional investment requirements For electricity generation in the Balanced Net
Zero Pathway (2020-50)
Source: CCC analysis.
Notes: Chart shows additional capital and operational expenditure in the Balanced Net Zero Pathway compared
to a high-carbon baseline.
Capital investment peaks in the 2030s and by 2050 is more than offset by operational cost savings.
147 Sixth Carbon Budget – The path to Net Zero
iii) Co-impacts
Reducing emissions in line with our scenarios will bring a range of co-benefits:
• Air quality. Switching from use of unabated fossil fuel for electricity
generation to zero-carbon generation (i.e. variable renewables, nuclear)
will help improve air quality, given these have no emissions. In addition,
there will be wider improvements in air quality through the electrification of
buildings, transport, and industry.12
• Electricity prices. Policy should ensure that electricity prices are cost-
reflective (i.e. they reflect the low cost of adding low-carbon capacity and
account for any system costs they impose), so that barriers to electrification
are reduced and electricity consumers benefit from cost reductions in
these technologies. That could include moving some costs away from
electricity bill payers and onto general taxation, including for legacy costs
of early renewables deployment. Chapter 6 sets out our analysis on energy
bills.
• Industrial opportunities and Just Transition. The investment required to
expand renewable generation, and to develop new markets in CCS and
hydrogen, will help create new opportunities for firms, exports, and jobs. A
strong signal from Government on the long-term pathway for these new
sectors will help give industry and investors confidence to undertake the
long-term investments required to unlock these benefits.
– Exports. There is a significant opportunity for the UK to export
engineering expertise, components, and services to the rapidly
growing EU and global market for offshore wind. Similar opportunities
would exist for CCS, where the UK is well placed to develop this
industry, and hydrogen.
– Just Transition and employment. New offshore wind, hydrogen and
CCS industries could help support the Government’s ‘levelling up’
agenda through investment in regional economies, and by providing
new jobs. A recent Policy Exchange study13 estimated these could
lead to a net gain of 40,000 direct jobs, plus more across the wider
supply chain.
Further detail on the economy-wide co-benefits of the transition to Net Zero is set
out in Chapter 5.
There could be significant co-benefits from decarbonising power, including for air quality, electricity prices, exports, and jobs
Chapter 3: Sector pathways to Net Zero 148
5. Fuel supply
Introduction and key messages Our Balanced Net Zero Pathway for Fuel Supply involves a transition from
producing 1,100 TWh of fossil fuels and 170 TWh of bioenergy in 2018 to producing
425 TWh of low-carbon hydrogen and bioenergy in 2050, for sectors of the
economy that are likely to use fuels, rather than electricity. Production of fossil fuels
will be much lower by 2050.
Recent cost reductions for renewables mean that electrolytic hydrogen plays a
greater role than in our previous work, especially after 2035. However, there is an
important role for hydrogen produced from fossil gas with CCS in the medium term
to enable applications for hydrogen to grow as necessary.
Bioenergy resources increase in line with expanding UK production of forestry
residues and perennial energy crops, with a wholesale shift to use with CCS
accelerating during the 2030s.
The Balanced Pathway also requires action to reduce emissions from the remaining
fossil fuel supply (the main source of Fuel Supply emissions) by 75% by 2035 from
2018 levels. Mitigation actions include fuel switching, CCS and technologies to
reduce methane flaring, venting and leakage.
The analysis draws on new consultancy work from Element Energy, existing
bioenergy resource work from our 2018 Biomass in a low-carbon economy report,
and aligns with our new waste resource assumptions from the Waste sector
(section 9). Further details are set out in our Methodology Report.
This section is split into three sub-sections:
a) The Balanced Net Zero Pathway for Fuel Supply
b) Alternative pathways to delivering abatement and fuel supplies
c) Scenario impacts
a) The Balanced Net Zero Pathway for Fuel Supply
The Balanced Net Zero Pathway includes actions to i) reduce emissions from Fuel
Supply, which mainly derive from fossil fuel supply ii) scale up hydrogen supply to
enable decarbonisation in other sectors iii) provide bioenergy to other sectors
while managing sustainability and achieving negative emissions.
i) Decarbonising fuel supply Our Balanced Net Zero Pathway requires fossil fuel supply emissions to be reduced
by 75% by 2035 from 2018 levels. While the Fuel Supply emissions category is
dominated by emissions from fossil fuel supply, there are also some new emissions
arising from future production of low-carbon hydrogen fuel.* This is reflected by the
emissions wedge from hydrogen production above the baseline in Figure 3.5.a.
* Existing UK high-carbon hydrogen production for use as an industrial feedstock is included within our manufacturing
sector. Our Fuel Supply sector contains low-carbon hydrogen to be used as a fuel.
Growth in UK forestry and perennial energy crops is needed to supply sustainable biomass across the economy.
Renewable electrolysis plays an increasingly important role in hydrogen supply, with CCS important in the medium term.
The Balanced Pathway also requires action to reduce emissions from the remaining fossil fuel supply.
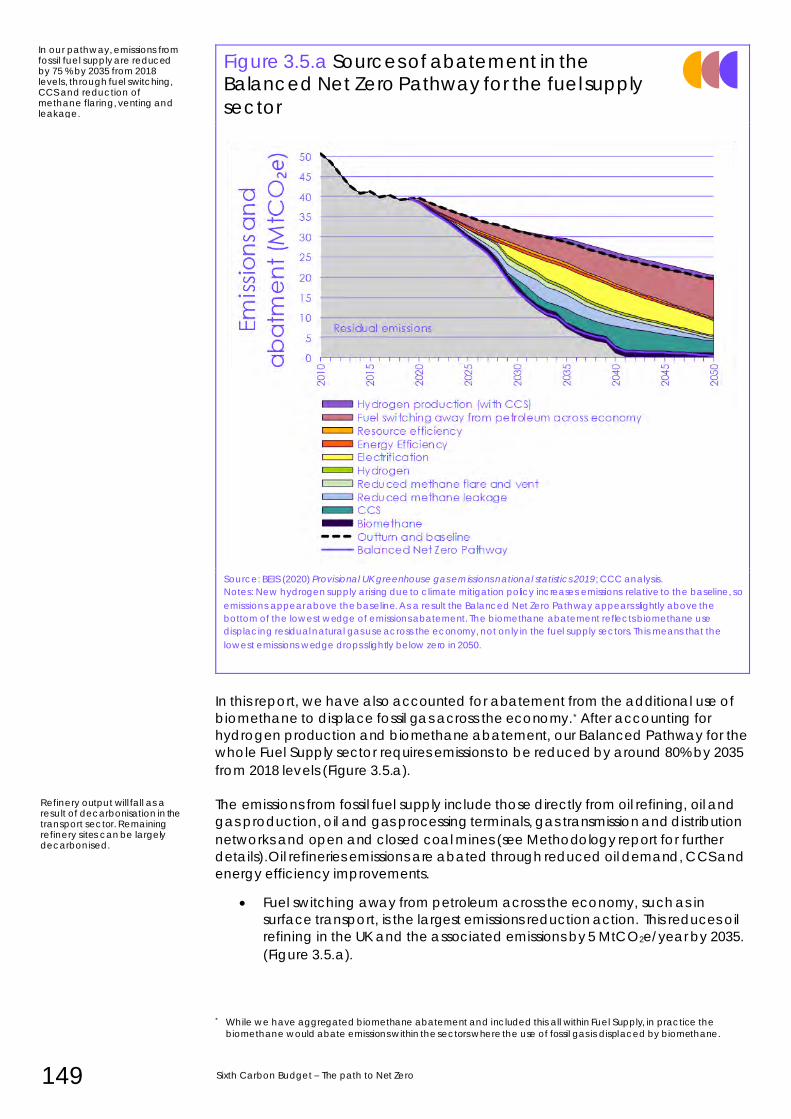
149 Sixth Carbon Budget – The path to Net Zero
Figure 3.5.a Sources of abatement in the Balanced Net Zero Pathway for the fuel supply
sector
Source: BEIS (2020) Provisional UK greenhouse gas emissions national statistics 2019; CCC analysis.
Notes: New hydrogen supply arising due to climate mitigation policy increases emissions relative to the baseline, so
emissions appear above the baseline. As a result the Balanced Net Zero Pathway appears slightly above the
bottom of the lowest wedge of emissions abatement. The biomethane abatement reflects biomethane use
displacing residual natural gas use across the economy, not only in the fuel supply sectors. This means that the
lowest emissions wedge drops slightly below zero in 2050.
In this report, we have also accounted for abatement from the additional use of
biomethane to displace fossil gas across the economy.* After accounting for
hydrogen production and biomethane abatement, our Balanced Pathway for the
whole Fuel Supply sector requires emissions to be reduced by around 80% by 2035
from 2018 levels (Figure 3.5.a).
The emissions from fossil fuel supply include those directly from oil refining, oil and
gas production, oil and gas processing terminals, gas transmission and distribution
networks and open and closed coal mines (see Methodology report for further
details).Oil refineries emissions are abated through reduced oil demand, CCS and
energy efficiency improvements.
• Fuel switching away from petroleum across the economy, such as in
surface transport, is the largest emissions reduction action. This reduces oil
refining in the UK and the associated emissions by 5 MtCO2e/year by 2035.
(Figure 3.5.a).
* While we have aggregated biomethane abatement and included this all within Fuel Supply, in practice the
biomethane would abate emissions within the sectors where the use of fossil gas is displaced by biomethane.
Refinery output will fall as a result of decarbonisation in the transport sector. Remaining refinery sites can be largely decarbonised.
In our pathway, emissions from fossil fuel supply are reduced by 75 % by 2035 from 2018 levels, through fuel switching, CCS and reduction of methane flaring, venting and leakage.
Chapter 3: Sector pathways to Net Zero 150
• CCS is the main emissions reduction measure for the remaining emissions
from oil refineries, with 1.5 MtCO2e/year of abatement in 2030, 3
MtCO2e/year in 2035 and 4.5 MtCO2e/year in 2040. Energy efficiency
measures also reduce emissions by 0.5 MtCO2e/year in 2035.
Emissions from oil and gas production, predominantly from offshore platforms and
from onshore processing terminals, are decarbonised mainly by fuel switching and
measures to reduce methane flaring and venting:
• Electrification of offshore platforms and processing terminals contributes 5
MtCO2e/year of abatement in 2035. This involves 4 MtCO2e/year of
electrification of compressors and generators on oil and gas platforms,
which requires connecting the platforms to either the onshore electricity
grid or offshore wind generation. The remaining 1 MtCO2e/year of
electrification is at oil and gas processing terminals. These actions start in
the mid-2020s, with some action electrification of platforms assumed to
occur within our baseline.
• Use of hydrogen plays a smaller role in the fossil fuel abatement pathways,
providing 1 MtCO2e/year of abatement across platforms and terminals.
• Measures to reduce methane flaring and venting, such as capturing the
gas and selling it, and switching from venting to flaring (where safety
requires at least one or the other) save 1.5 MtCO2e/year in 2030 and 1
MtCO2e/year in 2035.
Methane leaks from the gas distribution and transmission networks are reduced in
the Balanced Pathway using a combination of Leakage Detection and Repair
(LDAR) technologies and continuous monitoring technologies, resulting in 3.5
MtCO2e/year in 2035.
Other abatement measures in the fuel supply Balanced Pathway include 0.5
MtCO2e/year of abatement in 2035 from a variety of resource efficiency measures
across the economy and 1.5 MtCO2e/year of abatement from the use of
biomethane to displace fossil gas in the gas grid.
The largest sources of remaining emissions from fossil fuel supply in 2050 is from
closed coal mines (0.4 MtCO2e/year). From the wider Fuel Supply sector, there is
also 1 MtCO2e/year remaining from hydrogen production in 2050.
ii) Low-carbon hydrogen supply
The role for the hydrogen supply sector is to enable decarbonisation in other
sectors while managing costs and wider energy system impacts. Hydrogen
appears to be essential for reaching Net Zero, but it is important for it to be
focused on the applications of highest value, where electrification is less feasible,
and for it to be produced in a low-carbon way.
Hydrogen demands in the Balanced Pathway start growing in the second half of
the 2020s, before strong growth over the period 2030 to 2045. Manufacturing,
shipping (as ammonia), and back-up power generation are the largest three
sectors in terms of demand, with smaller contributions from other sectors including
buildings and surface transport.
Emissions from oil and gas production can be reduced by measures including increased electrification and reduced venting and flaring of gas.
Monitoring systems are important to catch methane leaks from the gas network quickly.
Low-carbon hydrogen will mainly be used in manufacturing, shipping and back-up power.
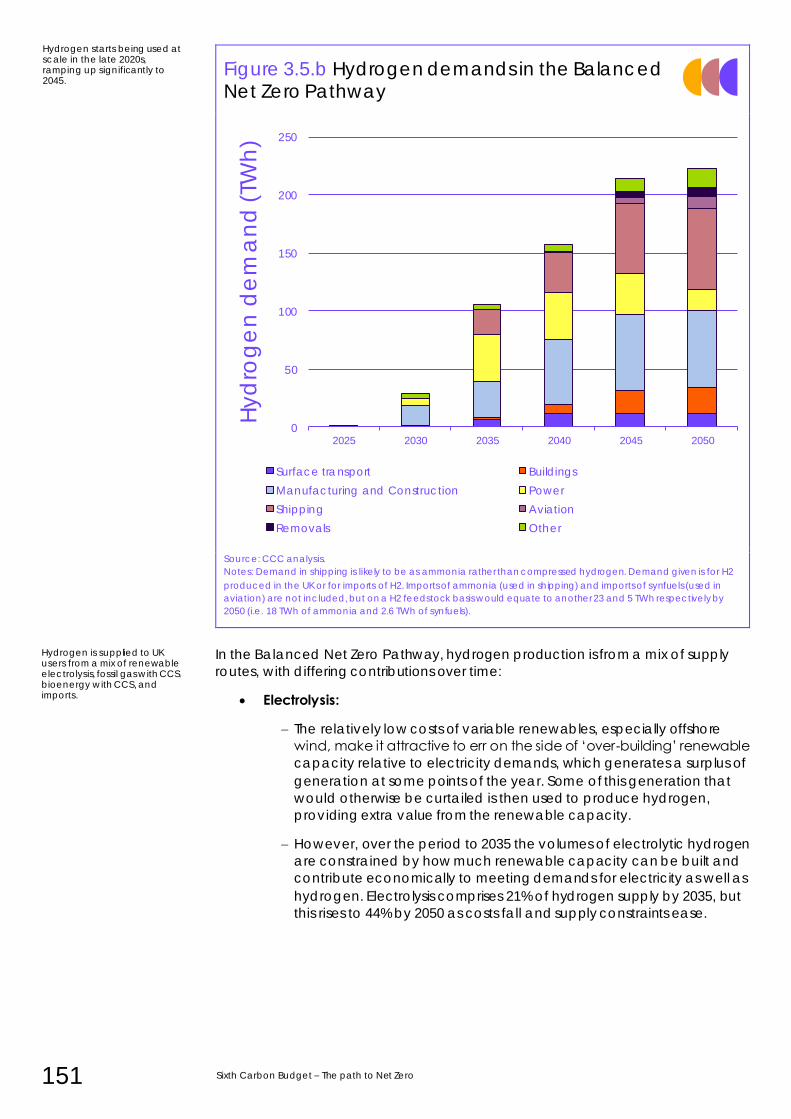
151 Sixth Carbon Budget – The path to Net Zero
Figure 3.5.b Hydrogen demands in the Balanced Net Zero Pathway
Source: CCC analysis.
Notes: Demand in shipping is likely to be as ammonia rather than compressed hydrogen. Demand given is for H2
produced in the UK or for imports of H2. Imports of ammonia (used in shipping) and imports of synfuels (used in
aviation) are not included, but on a H2 feedstock basis would equate to another 23 and 5 TWh respectively by
2050 (i.e. 18 TWh of ammonia and 2.6 TWh of synfuels).
In the Balanced Net Zero Pathway, hydrogen production is from a mix of supply
routes, with differing contributions over time:
• Electrolysis:
– The relatively low costs of variable renewables, especially offshore
wind, make it attractive to err on the side of ‘over-building’ renewable
capacity relative to electricity demands, which generates a surplus of
generation at some points of the year. Some of this generation that
would otherwise be curtailed is then used to produce hydrogen,
providing extra value from the renewable capacity.
– However, over the period to 2035 the volumes of electrolytic hydrogen
are constrained by how much renewable capacity can be built and
contribute economically to meeting demands for electricity as well as
hydrogen. Electrolysis comprises 21% of hydrogen supply by 2035, but
this rises to 44% by 2050 as costs fall and supply constraints ease.
0
50
100
150
200
250
2025 2030 2035 2040 2045 2050
Hyd
rog
en
de
ma
nd
(TW
h)
Surface transport Buildings
Manufacturing and Construction Power
Shipping Aviation
Removals Other
Hydrogen is supplied to UK users from a mix of renewable electrolysis, fossil gas with CCS, bioenergy with CCS, and imports.
Hydrogen starts being used at scale in the late 2020s, ramping up significantly to 2045.
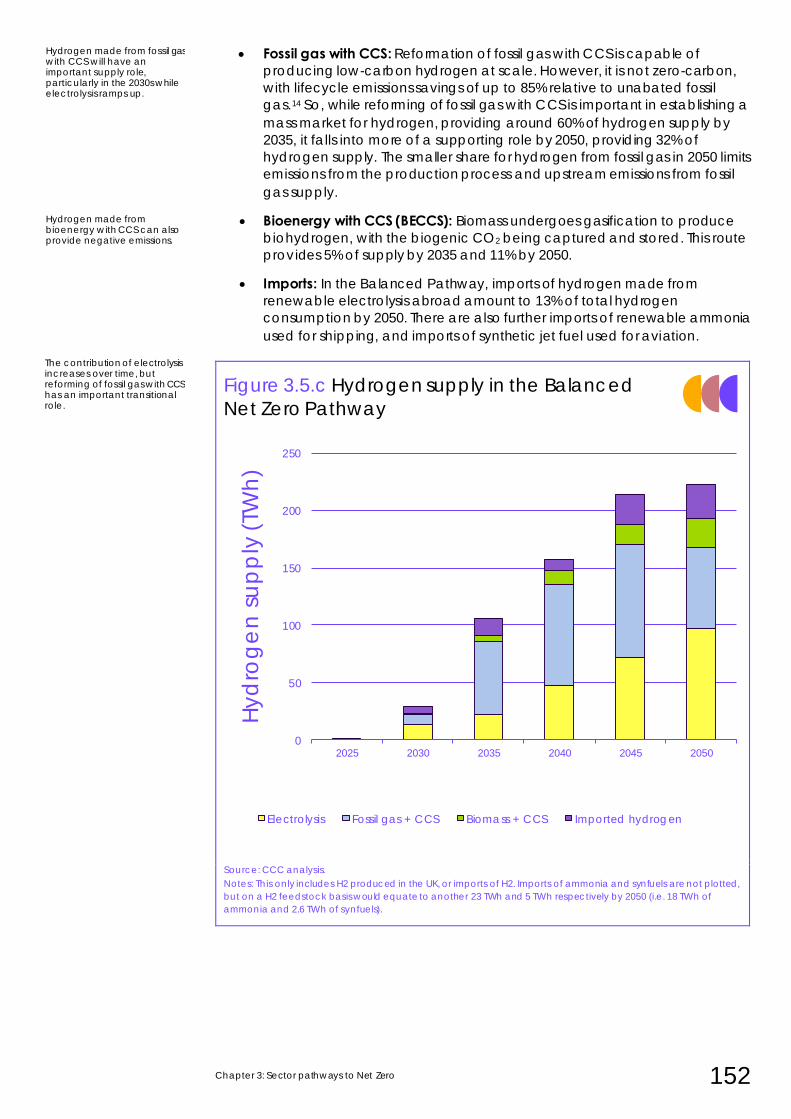
Chapter 3: Sector pathways to Net Zero 152
• Fossil gas with CCS: Reformation of fossil gas with CCS is capable of
producing low-carbon hydrogen at scale. However, it is not zero-carbon,
with lifecycle emissions savings of up to 85% relative to unabated fossil
gas.14 So, while reforming of fossil gas with CCS is important in establishing a
mass market for hydrogen, providing around 60% of hydrogen supply by
2035, it falls into more of a supporting role by 2050, providing 32% of
hydrogen supply. The smaller share for hydrogen from fossil gas in 2050 limits
emissions from the production process and upstream emissions from fossil
gas supply.
• Bioenergy with CCS (BECCS): Biomass undergoes gasification to produce
biohydrogen, with the biogenic CO2 being captured and stored. This route
provides 5% of supply by 2035 and 11% by 2050.
• Imports: In the Balanced Pathway, imports of hydrogen made from
renewable electrolysis abroad amount to 13% of total hydrogen
consumption by 2050. There are also further imports of renewable ammonia
used for shipping, and imports of synthetic jet fuel used for aviation.
Figure 3.5.c Hydrogen supply in the Balanced
Net Zero Pathway
Source: CCC analysis.
Notes: This only includes H2 produced in the UK, or imports of H2. Imports of ammonia and synfuels are not plotted,
but on a H2 feedstock basis would equate to another 23 TWh and 5 TWh respectively by 2050 (i.e. 18 TWh of
ammonia and 2.6 TWh of synfuels).
0
50
100
150
200
250
2025 2030 2035 2040 2045 2050
Hyd
rog
en
su
pp
ly (TW
h)
Electrolysis Fossil gas + CCS Biomass + CCS Imported hydrogen
Hydrogen made from fossil gas with CCS will have an important supply role, particularly in the 2030s while electrolysis ramps up.
Hydrogen made from bioenergy with CCS can also provide negative emissions.
The contribution of electrolysis increases over time, but reforming of fossil gas with CCS has an important transitional role.
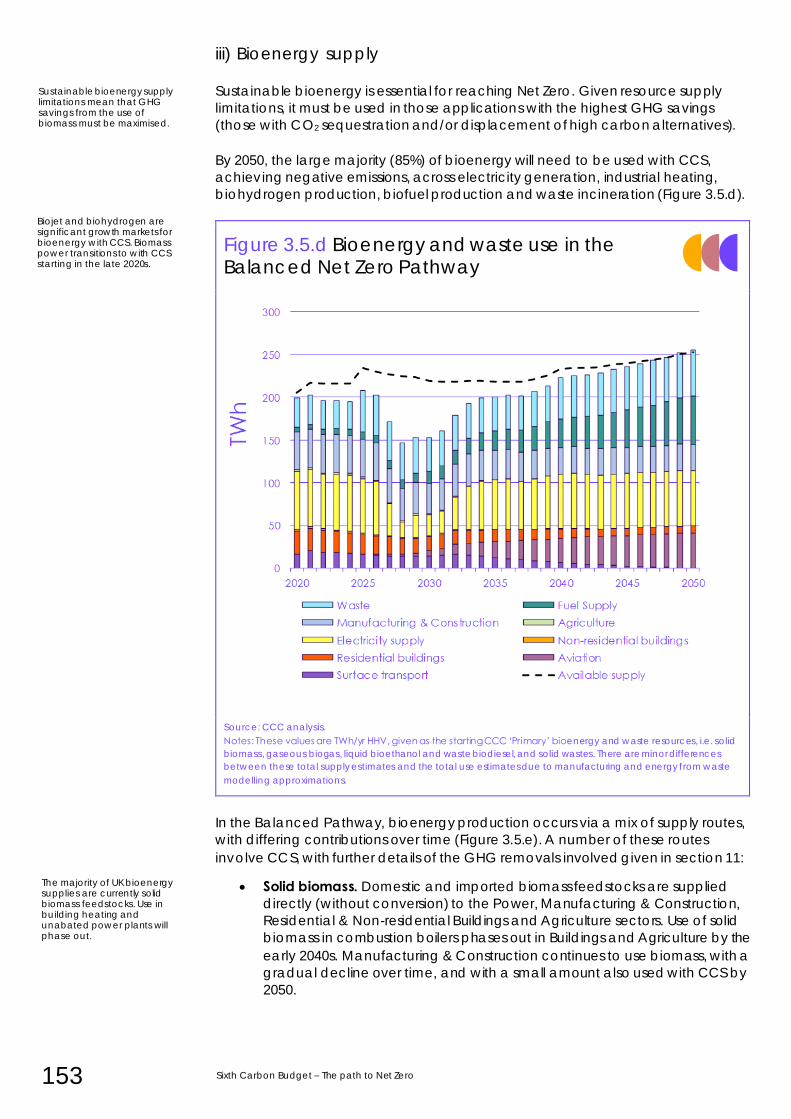
153 Sixth Carbon Budget – The path to Net Zero
iii) Bioenergy supply
Sustainable bioenergy is essential for reaching Net Zero. Given resource supply
limitations, it must be used in those applications with the highest GHG savings
(those with CO2 sequestration and/or displacement of high carbon alternatives).
By 2050, the large majority (85%) of bioenergy will need to be used with CCS,
achieving negative emissions, across electricity generation, industrial heating,
biohydrogen production, biofuel production and waste incineration (Figure 3.5.d).
Figure 3.5.d Bioenergy and waste use in the Balanced Net Zero Pathway
Source: CCC analysis.
Notes: These values are TWh/yr HHV, given as the starting CCC ‘Primary’ bioenergy and waste resources, i.e. solid
biomass, gaseous biogas, liquid bioethanol and waste biodiesel, and solid wastes. There are minor differences
between these total supply estimates and the total use estimates due to manufacturing and energy from waste
modelling approximations.
In the Balanced Pathway, bioenergy production occurs via a mix of supply routes,
with differing contributions over time (Figure 3.5.e). A number of these routes
involve CCS, with further details of the GHG removals involved given in section 11:
• Solid biomass. Domestic and imported biomass feedstocks are supplied
directly (without conversion) to the Power, Manufacturing & Construction,
Residential & Non-residential Buildings and Agriculture sectors. Use of solid
biomass in combustion boilers phases out in Buildings and Agriculture by the
early 2040s. Manufacturing & Construction continues to use biomass, with a
gradual decline over time, and with a small amount also used with CCS by
2050.
Sustainable bioenergy supply limitations mean that GHG savings from the use of biomass must be maximised.
Biojet and biohydrogen are significant growth markets for bioenergy with CCS. Biomass power transitions to with CCS starting in the late 2020s.
The majority of UK bioenergy supplies are currently solid biomass feedstocks. Use in building heating and unabated power plants will phase out.
Chapter 3: Sector pathways to Net Zero 154
Use in unabated biomass power plants quickly phases out in the late 2020s,
while use in power with CCS starts to slowly ramp-up from the late 2020s (via
retrofits and newbuild BECCS plants) to reach significant levels by 2040,
providing 4% of electricity generation. Biomass imports comprise 21% of
total bioenergy & waste supplies by 2050.
• Biohydrogen. Solid biomass feedstocks are gasified then converted into
hydrogen, with CCS. Deployment starts in 2030, and ramps-up as described
in section ii) above.
• Biojet. Solid biomass feedstocks are gasified then converted into aviation
biofuel, with CCS. Starting from the mid-2020s, this route ramps-up to meet
11% of aviation fuel demand by 2050. In addition, waste fats/oils are
converted into biojet, with a transition from biodiesel in the 2030s, with their
use alongside limited biojet imports ultimately meeting 6% of aviation
demand by 2050.
• Biodiesel. Solid biomass feedstocks are gasified then converted into
biodiesel, with CCS. Starting from the mid-2020s, this route increases
production to meet 2% of car/van diesel demand by the early 2030s, and
10% of HGV/bus diesel demand by 2040. As liquid fuel volumes fall in each
road transport mode, these plants transition to focus on biojet production.
Biodiesel made from waste fats/oils in existing facilities, and imports,
continue to supply 3% of road diesel. There is some additional use in off-
road machinery and agricultural equipment ramping up to the early 2030s,
before phasing out by 2040.
• Heating biofuels. A range of liquid biofuels made from biomass (with CCS)
or from waste fats/oils can be used for home heating, including bio-LPG
and biokerosene amongst other options. Starting from the mid-2020s, use of
bioliquids ramps up to 5 TWh/year in the 2040s, supplying hybrid heat pump
systems situated in homes off the gas-grid.
• Bioethanol. Arable crops are fermented into bioethanol in existing facilities.
After the 2021 increase of bioethanol blended into petrol (to 10% by
volume, 7% by energy), supplies stay at this % of road petrol use.
• Biomethane & biogas. Biogas produced from anaerobic digestion of food
waste, sewage sludge & animal manures, plus captured landfill gas, can
be upgraded to biomethane for gas grid injection, along with the capture
of biogenic CO2 for sequestration. Biomethane injection more than trebles
by 2030 from today’s levels. Biogas also continues to be used in Power and
Manufacturing, although its use declines in the near-term with the fall in
landfill gas. Combined, these routes could displace 10% of fossil gas in 2050.
• Residual waste. After re-use & recycling, any residual waste volumes not
exported or landfilled are predominantly incinerated in energy from waste
plants, with some small use in Manufacturing. All energy from waste plants
fit CCS by 2050, to capture the fossil and biogenic CO2 emissions resulting
from the mixed fossil/biogenic waste fractions.
Waste fats/oils currently used for road transport biodiesel will transition to biojet during the 2030s.
Biodiesel has a potential transitional role in HGVs and buses, but over time will increasingly focus on biojet for aviation.
Biomethane & biogas could displace up to 10% of UK gas demand, and biomethane injection into the gas grid more than trebles in the next 10 years.
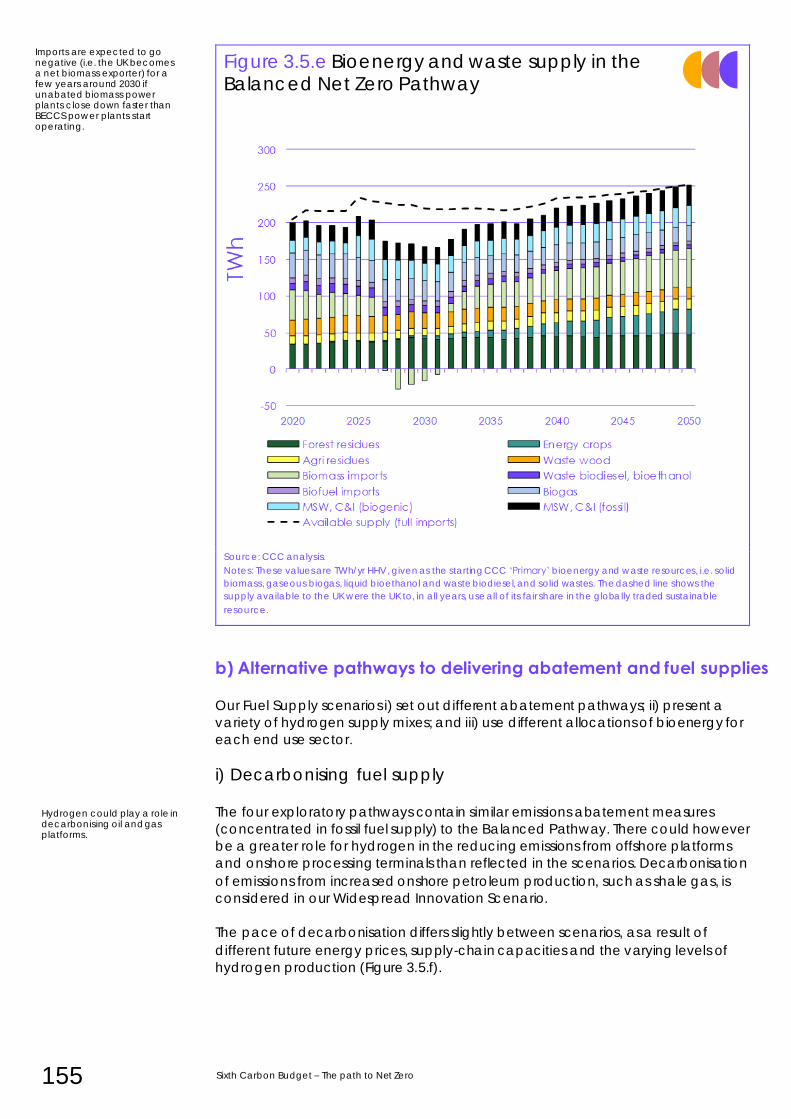
155 Sixth Carbon Budget – The path to Net Zero
Figure 3.5.e Bioenergy and waste supply in the Balanced Net Zero Pathway
Source: CCC analysis.
Notes: These values are TWh/yr HHV, given as the starting CCC ‘Primary’ bioenergy and waste resources, i.e. solid
biomass, gaseous biogas, liquid bioethanol and waste biodiesel, and solid wastes. The dashed line shows the
supply available to the UK were the UK to, in all years, use all of its fair share in the globally traded sustainable
resource.
b) Alternative pathways to delivering abatement and fuel supplies
Our Fuel Supply scenarios i) set out different abatement pathways; ii) present a
variety of hydrogen supply mixes; and iii) use different allocations of bioenergy for
each end use sector.
i) Decarbonising fuel supply
The four exploratory pathways contain similar emissions abatement measures
(concentrated in fossil fuel supply) to the Balanced Pathway. There could however
be a greater role for hydrogen in the reducing emissions from offshore platforms
and onshore processing terminals than reflected in the scenarios. Decarbonisation
of emissions from increased onshore petroleum production, such as shale gas, is
considered in our Widespread Innovation Scenario.
The pace of decarbonisation differs slightly between scenarios, as a result of
different future energy prices, supply-chain capacities and the varying levels of
hydrogen production (Figure 3.5.f).
Hydrogen could play a role in decarbonising oil and gas platforms.
Imports are expected to go negative (i.e. the UK becomes a net biomass exporter) for a few years around 2030 if unabated biomass power plants close down faster than BECCS power plants start operating.
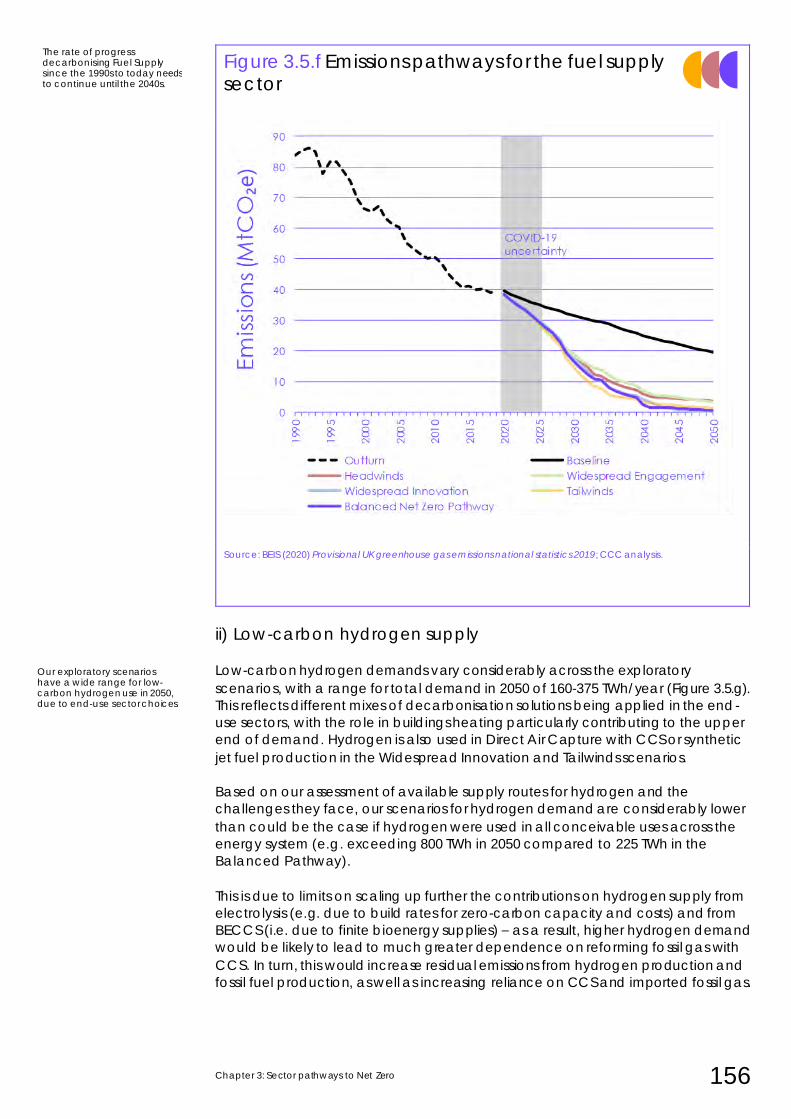
Chapter 3: Sector pathways to Net Zero 156
Figure 3.5.f Emissions pathways for the fuel supply sector
Source: BEIS (2020) Provisional UK greenhouse gas emissions national statistics 2019; CCC analysis.
ii) Low-carbon hydrogen supply
Low-carbon hydrogen demands vary considerably across the exploratory
scenarios, with a range for total demand in 2050 of 160-375 TWh/year (Figure 3.5.g).
This reflects different mixes of decarbonisation solutions being applied in the end-
use sectors, with the role in buildings heating particularly contributing to the upper
end of demand. Hydrogen is also used in Direct Air Capture with CCS or synthetic
jet fuel production in the Widespread Innovation and Tailwinds scenarios.
Based on our assessment of available supply routes for hydrogen and the
challenges they face, our scenarios for hydrogen demand are considerably lower
than could be the case if hydrogen were used in all conceivable uses across the
energy system (e.g. exceeding 800 TWh in 2050 compared to 225 TWh in the
Balanced Pathway).
This is due to limits on scaling up further the contributions on hydrogen supply from
electrolysis (e.g. due to build rates for zero-carbon capacity and costs) and from
BECCS (i.e. due to finite bioenergy supplies) – as a result, higher hydrogen demand
would be likely to lead to much greater dependence on reforming fossil gas with
CCS. In turn, this would increase residual emissions from hydrogen production and
fossil fuel production, as well as increasing reliance on CCS and imported fossil gas.
Our exploratory scenarios have a wide range for low-carbon hydrogen use in 2050, due to end-use sector choices.
The rate of progress decarbonising Fuel Supply since the 1990s to today needs to continue until the 2040s.
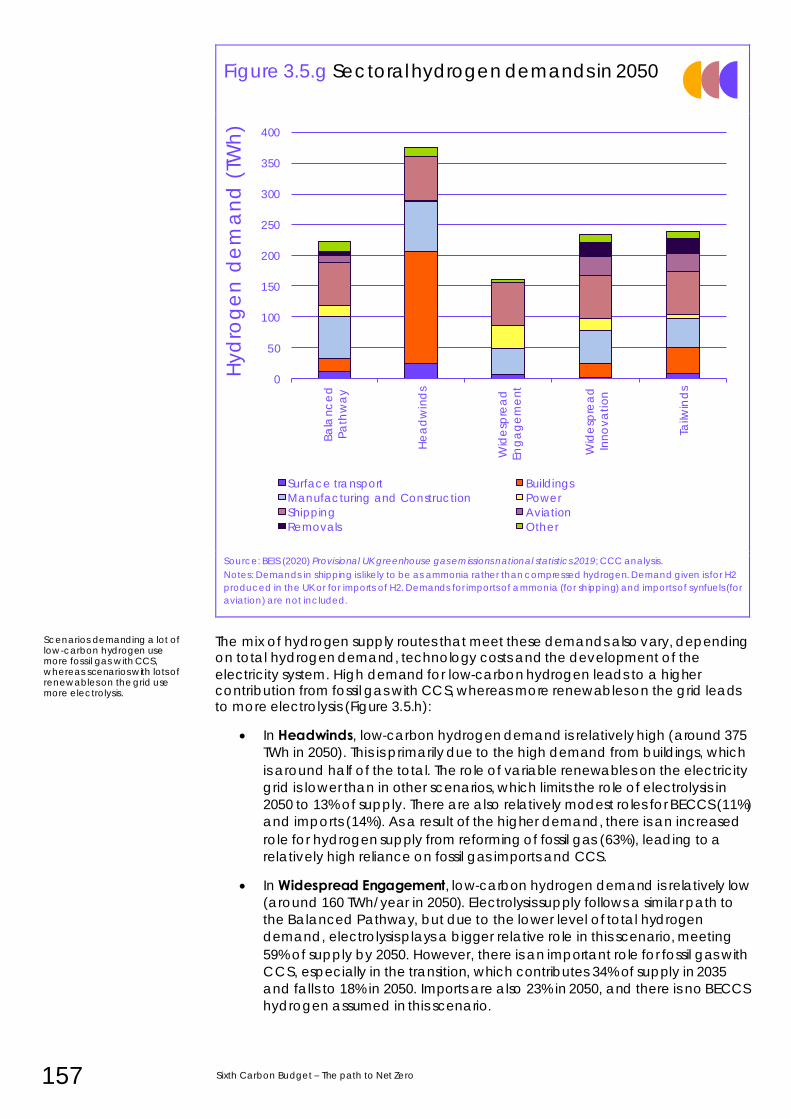
157 Sixth Carbon Budget – The path to Net Zero
Figure 3.5.g Sectoral hydrogen demands in 2050
Source: BEIS (2020) Provisional UK greenhouse gas emissions national statistics 2019; CCC analysis.
Notes: Demands in shipping is likely to be as ammonia rather than compressed hydrogen. Demand given is for H2
produced in the UK or for imports of H2. Demands for imports of ammonia (for shipping) and imports of synfuels (for
aviation) are not included.
The mix of hydrogen supply routes that meet these demands also vary, depending on total hydrogen demand, technology costs and the development of the
electricity system. High demand for low-carbon hydrogen leads to a higher contribution from fossil gas with CCS, whereas more renewables on the grid leads to more electrolysis (Figure 3.5.h):
• In Headwinds, low-carbon hydrogen demand is relatively high (around 375
TWh in 2050). This is primarily due to the high demand from buildings, which
is around half of the total. The role of variable renewables on the electricity
grid is lower than in other scenarios, which limits the role of electrolysis in
2050 to 13% of supply. There are also relatively modest roles for BECCS (11%)
and imports (14%). As a result of the higher demand, there is an increased
role for hydrogen supply from reforming of fossil gas (63%), leading to a
relatively high reliance on fossil gas imports and CCS.
• In Widespread Engagement, low-carbon hydrogen demand is relatively low
(around 160 TWh/year in 2050). Electrolysis supply follows a similar path to
the Balanced Pathway, but due to the lower level of total hydrogen
demand, electrolysis plays a bigger relative role in this scenario, meeting
59% of supply by 2050. However, there is an important role for fossil gas with
CCS, especially in the transition, which contributes 34% of supply in 2035
and falls to 18% in 2050. Imports are also 23% in 2050, and there is no BECCS
hydrogen assumed in this scenario.
0
50
100
150
200
250
300
350
400
Ba
lan
ce
d
Pa
thw
ay
He
ad
win
ds
Wid
esp
rea
d
En
ga
ge
me
nt
Wid
esp
rea
d
Inn
ov
ati
on
Tailw
ind
s
Hyd
rog
en
de
ma
nd
(TW
h)
Surface transport Buildings
Manufacturing and Construction Power
Shipping Aviation
Removals Other
Scenarios demanding a lot of low-carbon hydrogen use more fossil gas with CCS, whereas scenarios with lots of renewables on the grid use more electrolysis.
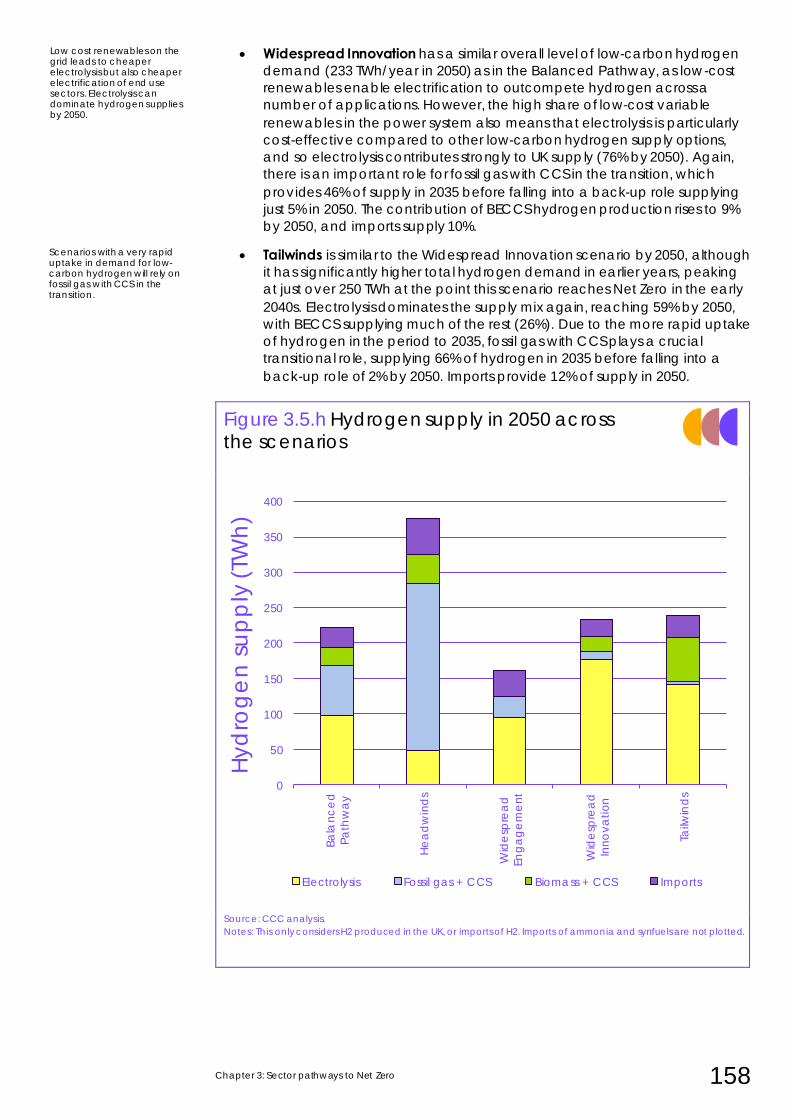
Chapter 3: Sector pathways to Net Zero 158
• Widespread Innovation has a similar overall level of low-carbon hydrogen
demand (233 TWh/year in 2050) as in the Balanced Pathway, as low-cost
renewables enable electrification to outcompete hydrogen across a
number of applications. However, the high share of low-cost variable
renewables in the power system also means that electrolysis is particularly
cost-effective compared to other low-carbon hydrogen supply options,
and so electrolysis contributes strongly to UK supply (76% by 2050). Again,
there is an important role for fossil gas with CCS in the transition, which
provides 46% of supply in 2035 before falling into a back-up role supplying
just 5% in 2050. The contribution of BECCS hydrogen production rises to 9%
by 2050, and imports supply 10%.
• Tailwinds is similar to the Widespread Innovation scenario by 2050, although
it has significantly higher total hydrogen demand in earlier years, peaking
at just over 250 TWh at the point this scenario reaches Net Zero in the early
2040s. Electrolysis dominates the supply mix again, reaching 59% by 2050,
with BECCS supplying much of the rest (26%). Due to the more rapid uptake
of hydrogen in the period to 2035, fossil gas with CCS plays a crucial
transitional role, supplying 66% of hydrogen in 2035 before falling into a
back-up role of 2% by 2050. Imports provide 12% of supply in 2050.
Figure 3.5.h Hydrogen supply in 2050 across the scenarios
Source: CCC analysis.
Notes: This only considers H2 produced in the UK, or imports of H2. Imports of ammonia and synfuels are not plotted.
0
50
100
150
200
250
300
350
400
Ba
lan
ce
d
Pa
thw
ay
He
ad
win
ds
Wid
esp
rea
d
En
ga
ge
me
nt
Wid
esp
rea
d
Inn
ov
ati
on
Tailw
ind
s
Hyd
rog
en
su
pp
ly (TW
h)
Electrolysis Fossil gas + CCS Biomass + CCS Imports
Low cost renewables on the grid leads to cheaper electrolysis but also cheaper electrification of end use sectors. Electrolysis can dominate hydrogen supplies by 2050.
Scenarios with a very rapid uptake in demand for low-carbon hydrogen will rely on fossil gas with CCS in the transition.
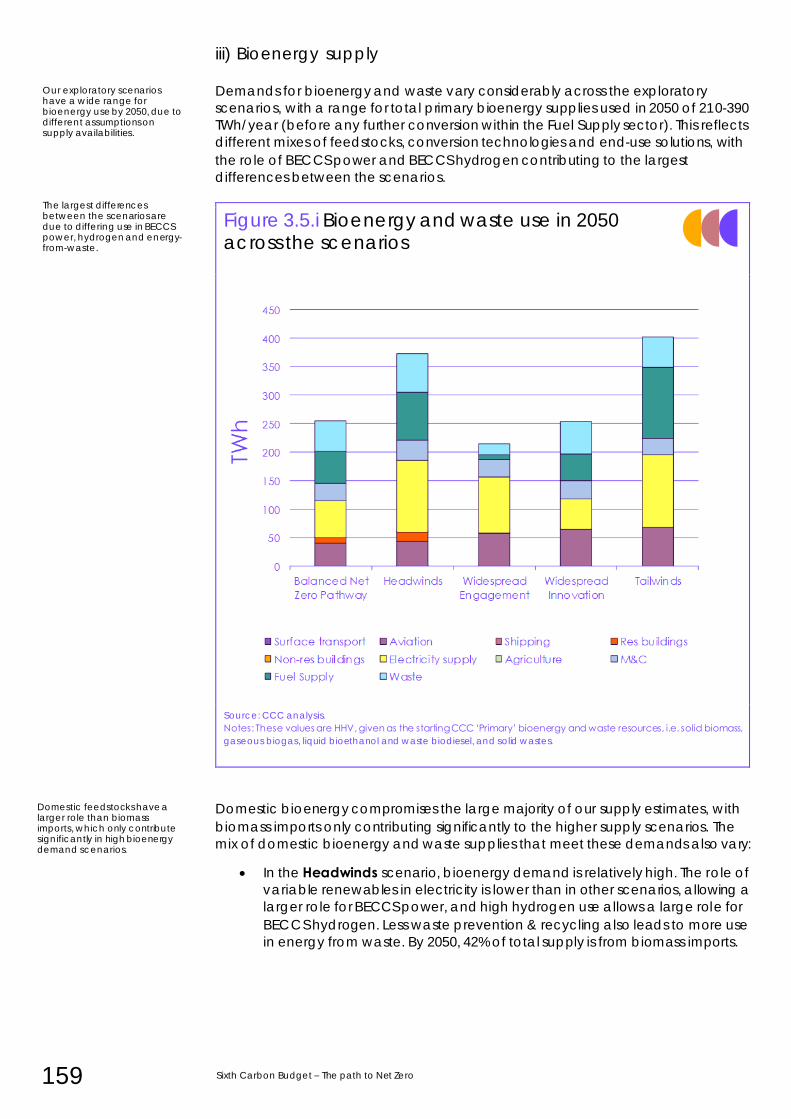
159 Sixth Carbon Budget – The path to Net Zero
iii) Bioenergy supply
Demands for bioenergy and waste vary considerably across the exploratory
scenarios, with a range for total primary bioenergy supplies used in 2050 of 210-390
TWh/year (before any further conversion within the Fuel Supply sector). This reflects
different mixes of feedstocks, conversion technologies and end-use solutions, with
the role of BECCS power and BECCS hydrogen contributing to the largest
differences between the scenarios.
Figure 3.5.i Bioenergy and waste use in 2050 across the scenarios
Source: CCC analysis.
Notes: These values are HHV, given as the starting CCC ‘Primary’ bioenergy and waste resources, i.e. solid biomass,
gaseous biogas, liquid bioethanol and waste biodiesel, and solid wastes.
Domestic bioenergy compromises the large majority of our supply estimates, with
biomass imports only contributing significantly to the higher supply scenarios. The
mix of domestic bioenergy and waste supplies that meet these demands also vary:
• In the Headwinds scenario, bioenergy demand is relatively high. The role of
variable renewables in electricity is lower than in other scenarios, allowing a
larger role for BECCS power, and high hydrogen use allows a large role for
BECCS hydrogen. Less waste prevention & recycling also leads to more use
in energy from waste. By 2050, 42% of total supply is from biomass imports.
Our exploratory scenarios have a wide range for bioenergy use by 2050, due to different assumptions on supply availabilities.
The largest differences between the scenarios are due to differing use in BECCS power, hydrogen and energy-from-waste.
Domestic feedstocks have a larger role than biomass imports, which only contribute significantly in high bioenergy demand scenarios.
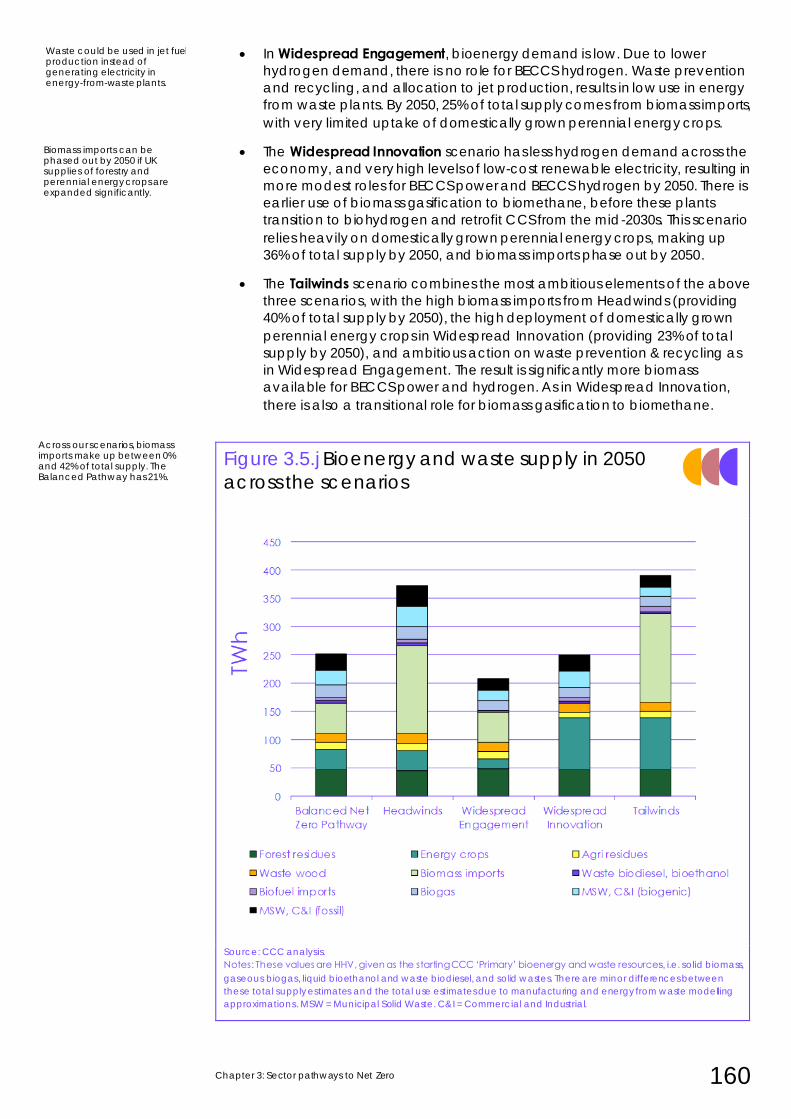
Chapter 3: Sector pathways to Net Zero 160
• In Widespread Engagement, bioenergy demand is low. Due to lower
hydrogen demand, there is no role for BECCS hydrogen. Waste prevention
and recycling, and allocation to jet production, results in low use in energy
from waste plants. By 2050, 25% of total supply comes from biomass imports,
with very limited uptake of domestically grown perennial energy crops.
• The Widespread Innovation scenario has less hydrogen demand across the
economy, and very high levels of low-cost renewable electricity, resulting in
more modest roles for BECCS power and BECCS hydrogen by 2050. There is
earlier use of biomass gasification to biomethane, before these plants
transition to biohydrogen and retrofit CCS from the mid-2030s. This scenario
relies heavily on domestically grown perennial energy crops, making up
36% of total supply by 2050, and biomass imports phase out by 2050.
• The Tailwinds scenario combines the most ambitious elements of the above
three scenarios, with the high biomass imports from Headwinds (providing
40% of total supply by 2050), the high deployment of domestically grown
perennial energy crops in Widespread Innovation (providing 23% of total
supply by 2050), and ambitious action on waste prevention & recycling as
in Widespread Engagement. The result is significantly more biomass
available for BECCS power and hydrogen. As in Widespread Innovation,
there is also a transitional role for biomass gasification to biomethane.
Figure 3.5.j Bioenergy and waste supply in 2050
across the scenarios
Source: CCC analysis.
Notes: These values are HHV, given as the starting CCC ‘Primary’ bioenergy and waste resources, i.e. solid biomass,
gaseous biogas, liquid bioethanol and waste biodiesel, and solid wastes. There are minor differences between
these total supply estimates and the total use estimates due to manufacturing and energy from waste modelling
approximations. MSW = Municipal Solid Waste. C&I = Commercial and Industrial.
Waste could be used in jet fuel production instead of generating electricity in energy-from-waste plants.
Biomass imports can be phased out by 2050 if UK supplies of forestry and perennial energy crops are expanded significantly.
Across our scenarios, biomass imports make up between 0% and 42% of total supply. The Balanced Pathway has 21%.
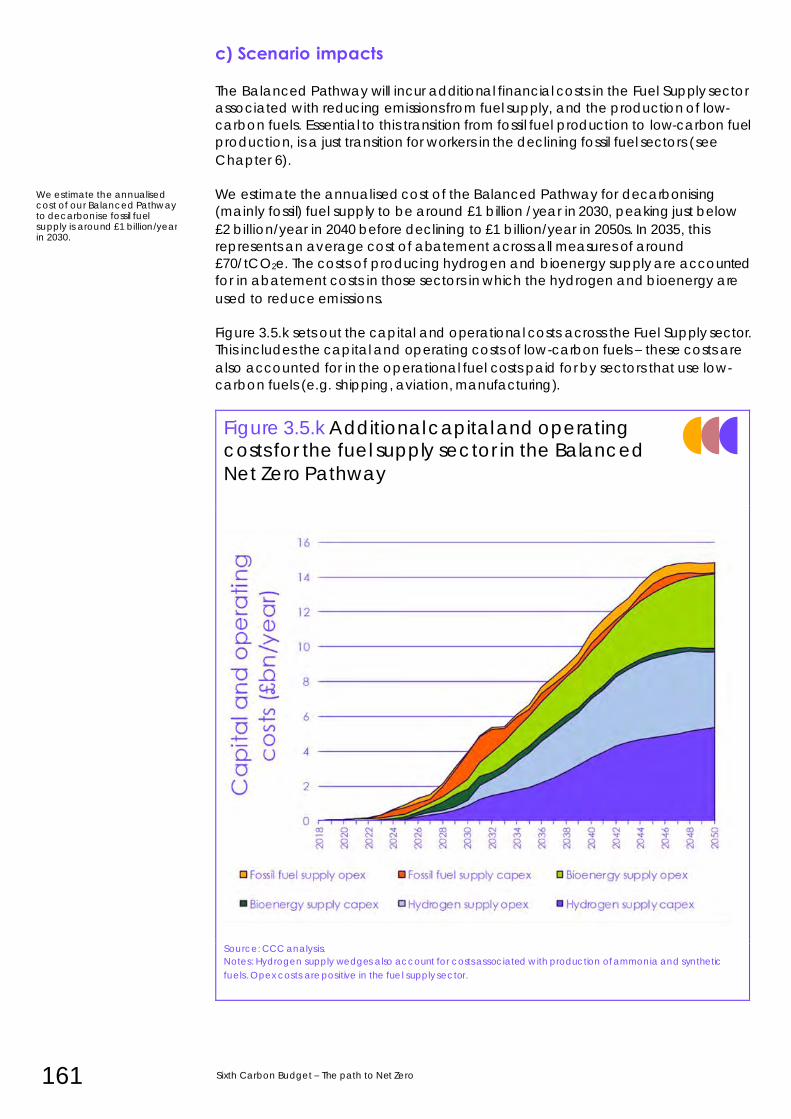
161 Sixth Carbon Budget – The path to Net Zero
c) Scenario impacts
The Balanced Pathway will incur additional financial costs in the Fuel Supply sector
associated with reducing emissions from fuel supply, and the production of low-
carbon fuels. Essential to this transition from fossil fuel production to low-carbon fuel
production, is a just transition for workers in the declining fossil fuel sectors (see
Chapter 6).
We estimate the annualised cost of the Balanced Pathway for decarbonising
(mainly fossil) fuel supply to be around £1 billion /year in 2030, peaking just below
£2 billion/year in 2040 before declining to £1 billion/year in 2050s. In 2035, this
represents an average cost of abatement across all measures of around
£70/tCO2e. The costs of producing hydrogen and bioenergy supply are accounted
for in abatement costs in those sectors in which the hydrogen and bioenergy are
used to reduce emissions.
Figure 3.5.k sets out the capital and operational costs across the Fuel Supply sector.
This includes the capital and operating costs of low-carbon fuels – these costs are
also accounted for in the operational fuel costs paid for by sectors that use low-
carbon fuels (e.g. shipping, aviation, manufacturing).
Figure 3.5.k Additional capital and operating costs for the fuel supply sector in the Balanced
Net Zero Pathway
Source: CCC analysis.
Notes: Hydrogen supply wedges also account for costs associated with production of ammonia and synthetic
fuels. Opex costs are positive in the fuel supply sector.
We estimate the annualised cost of our Balanced Pathway to decarbonise fossil fuel supply is around £1 billion/year in 2030.
Chapter 3: Sector pathways to Net Zero 162
Investment costs for hydrogen supply result from development of hydrogen
storage and network infrastructure, plus investment in electrolysis and fossil gas with
CCS capacity. Overall capital investment for hydrogen supply increases to around
£4 billion/year by the 2040s, with operating costs peaking at around £4 billion/year
during the 2040s.
These hydrogen supply cost wedges include the investment and operating costs
for new ammonia (for shipping) and synthetic jet fuel (for aviation) production
facilities, that use some of the low-carbon hydrogen produced in the Fuel Supply
sector. In the Balanced Pathway, building UK ammonia plants will require capital
investment of around £400 million/year in the early 2030s and early 2040s, and UK
synthetic jet fuel plants will require investment of £250 million/year by 2040.
There is also a share of ammonia and synthetic jet supplied via imports (25%
assumed for both sectors in the Balanced Pathway). These imports are assumed to
be produced from renewable electrolysis and air separation/direct air capture,
and this fuel cost is only counted in the relevant end-use sectors.
Investment costs for bioenergy supply result from the construction of new biojet,
biodiesel, heating bioliquids, biomethane and biohydrogen conversion facilities.
These are capital intensive, as well as having significant ongoing operating costs
due to biomass feedstock costs. However, the added costs of installing CCS onto a
biofuel/biohydrogen plant are generally modest, given the availability of high
concentration CO2 streams at these facilities.
Bioenergy conversion plant investment costs peak at £670 million/year around
2030, due to this being the fastest period of growth in these bioenergy facilities,
before falling to £200 million/year by 2050. Operating costs, including biomass
feedstock costs, ramp-up over time to reach £2.8 billion/year by 2050. On both
capital and operating metrics, biojet and biohydrogen conversion plants
dominate these bioenergy fuel supply costs.
Ammonia and synthetic jet fuel plants will require significant investment, and local low-cost hydrogen sources.
Bioenergy conversion costs within the Fuel Supply sector are dominated by biohydrogen and biojet routes.
Low-carbon hydrogen supply investment costs are dominated by storage and network costs.
163 Sixth Carbon Budget – The path to Net Zero
6. Agriculture and land use, land-use change and forestry
Introduction and key messages Combined agriculture and land greenhouse gas (GHG) emissions were 67 MtCO2e
in 2018, which could fall to 40 MtCO2e by 2035 in our Balanced Net Zero Pathway. Annual savings total 25 MtCO2e when compared to emissions in the Business as Usual scenario in 2035 (Figure 3.6.a). By 2050 residual emissions reach 16 MtCO2e
under the Balanced Pathway but fall to Net Zero by 2047 in the Wider Innovation and Tailwinds scenarios.
Delivering this transition requires a transformation in the use of land. Around 9% of agricultural land will be needed for actions to reduce emissions and sequester carbon by 2035 with 21% needed by 2050.* Improvements in agricultural
productivity and a trend towards healthier diets are key to releasing land for afforestation, peatland restoration and bioenergy crops.
Investment of £1.5 billion per year by 2035 will be required to implement the necessary changes, but there will be co-benefits for health and recreation, air quality, flood alleviation and biodiversity.
Our analysis balances the need to reduce emissions from land with other essential functions of land including maintaining food production and adapting to climate
impacts. We draw on our previous reports,15 new modelling work by the Centre for Ecology and Hydrology (CEH) on land-based pathways,16 and Scotland’s Rural College (SRUC)17 on options to reduce agricultural emissions as well as extensive
literature reviews and stakeholder engagement. The rest of this section is set out in five parts:
a) The Balanced Net Zero Pathway for agriculture
b) Alternative routes to reducing agriculture emissions
c) The Balanced Net Zero Pathway for the land use sector
d) Alternative routes to reducing land use emissions
e) Scenario impacts: costs, benefits and co-impacts on society
* Rises to 11% and 23% when including land for settlement growth.
Land is a critical natural asset providing a range of essential goods and services as well as carbon storage.
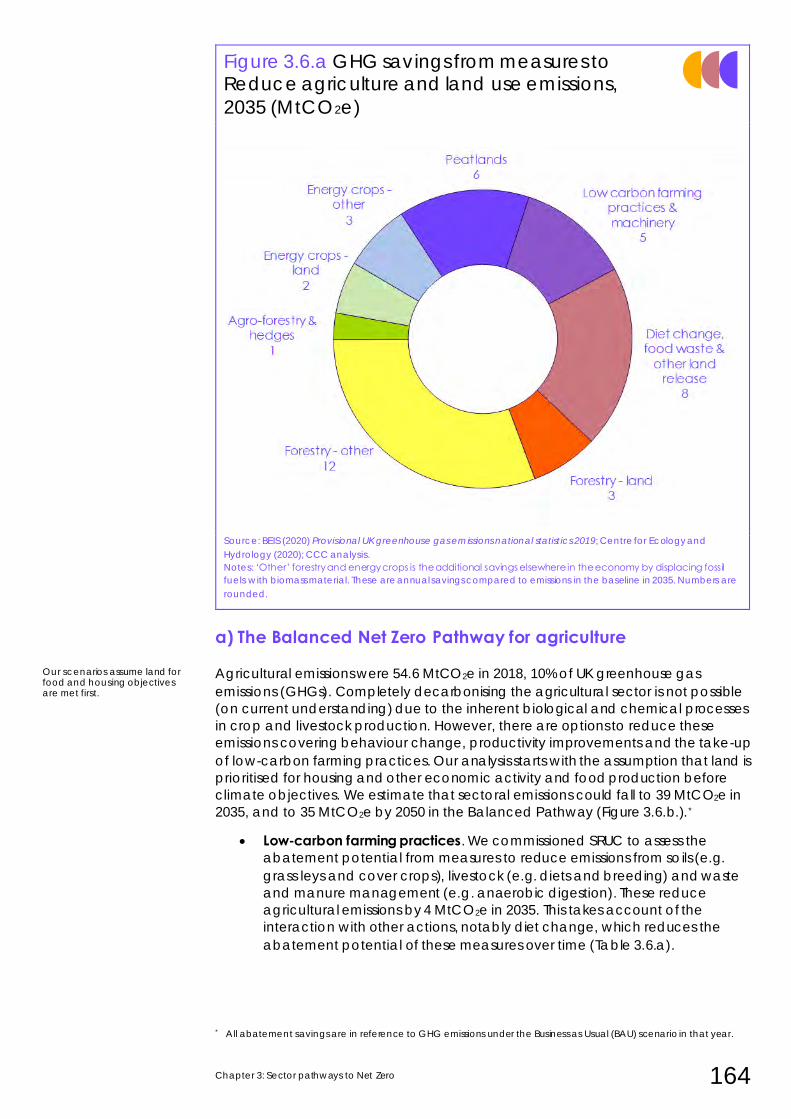
Chapter 3: Sector pathways to Net Zero 164
Figure 3.6.a GHG savings from measures to Reduce agriculture and land use emissions,
2035 (MtCO2e)
Source: BEIS (2020) Provisional UK greenhouse gas emissions national statistics 2019; Centre for Ecology and
Hydrology (2020); CCC analysis.
Notes: ‘Other’ forestry and energy crops is the additional savings elsewhere in the economy by displacing fossil
fuels with biomass material. These are annual savings compared to emissions in the baseline in 2035. Numbers are
rounded.
a) The Balanced Net Zero Pathway for agriculture
Agricultural emissions were 54.6 MtCO2e in 2018, 10% of UK greenhouse gas
emissions (GHGs). Completely decarbonising the agricultural sector is not possible
(on current understanding) due to the inherent biological and chemical processes
in crop and livestock production. However, there are options to reduce these
emissions covering behaviour change, productivity improvements and the take-up
of low-carbon farming practices. Our analysis starts with the assumption that land is
prioritised for housing and other economic activity and food production before
climate objectives. We estimate that sectoral emissions could fall to 39 MtCO2e in
2035, and to 35 MtCO2e by 2050 in the Balanced Pathway (Figure 3.6.b.).*
• Low-carbon farming practices. We commissioned SRUC to assess the
abatement potential from measures to reduce emissions from soils (e.g.
grass leys and cover crops), livestock (e.g. diets and breeding) and waste
and manure management (e.g. anaerobic digestion). These reduce
agricultural emissions by 4 MtCO2e in 2035. This takes account of the
interaction with other actions, notably diet change, which reduces the
abatement potential of these measures over time (Table 3.6.a).
* All abatement savings are in reference to GHG emissions under the Business as Usual (BAU) scenario in that year.
Our scenarios assume land for food and housing objectives are met first.
165 Sixth Carbon Budget – The path to Net Zero
• Fossil fuel use in agriculture. Currently 18 TWh of fossil fuels are used in
agricultural vehicles, buildings and machinery, resulting in emissions of 4.6
MtCO2e. Options to decarbonise fossil fuel use are similar to those in surface
transport, off-road machinery in industry and commercial buildings. These
cover electrification, biofuels, hydrogen and hybrid vehicles. Our Balanced
Pathway assumes biofuels and electrification options are taken-up from the
mid-2020s and hydrogen from 2030, reducing emissions to 2 MtCO2e in
2035.
• Measures to release land. Changes in consumer and farmer behaviour can
release land from agriculture while maintaining a strong food production
sector. We considered five measures that could release land covering
societal changes and improvements in agricultural productivity. Our
analysis implies that these five measures could reduce annual agricultural
GHG emissions by 8 MtCO2e by 2035, rising to just over 11 MtCO2e by 2050,
with diet change the most significant:
– Diet change. Our Balanced Pathway involves a 20% shift away from
meat and dairy products by 2030, with a further 15% reduction of meat
products by 2050. These are substituted with plant-based options. This
is within range of the Climate Assembly’s recommendations for a 20-
40% reduction in meat and dairy consumption by 2050.18 Our pathway
results in a reduction in livestock numbers and grassland area,
delivering annual abatement of 7 MtCO2e by 2035, rising to nearly 10
MtCO2e by 2050.
– Food waste. We assume food waste is halved across the supply chain
by 2030 in line with the Waste and Resources Action Programme’s
(WRAP) UK Food Waste Reduction Roadmap. This would reduce UK
emissions by almost 1 MtCO2e in 2035.
– Productivity improvements. There is scope for further abatement from
measures to increase agricultural productivity, which in our Balanced
Pathway could reduce emissions by 1 MtCO2e in 2035 and 2050. These
cover crops and livestock:
• Improving crop yields without the need for additional inputs such
as fertiliser and pesticides can be achieved through improved
agronomic practices, technology and innovation while taking
account of climate impacts. Our Balanced Pathway assumes that
wheat yields increase from an average of 8 tonnes/hectare
currently to 11 tonnes/hectare by 2050 (with equivalent increases
for other crops).
• Stocking rates for livestock can be increased through improving
productivity of grasslands and management practices such as
rotational grazing. Evidence suggests there is scope to sustainably
increase stocking rates in the UK.19
– Moving horticulture indoors. Shifting 10% of horticulture production
indoors under a controlled environment reduces the carbon, nutrient,
land and water footprint.
Delivering emissions reduction should not be at the expense of increasing food
imports that risk ‘carbon leakage’. Therefore, both production and consumption of
the highest carbon foods need to fall.
Deep emissions reduction in agriculture and land cannot be achieved without changes in the way land is used in the UK
Productivity improvement in agriculture through innovation and better agronomy are vital.
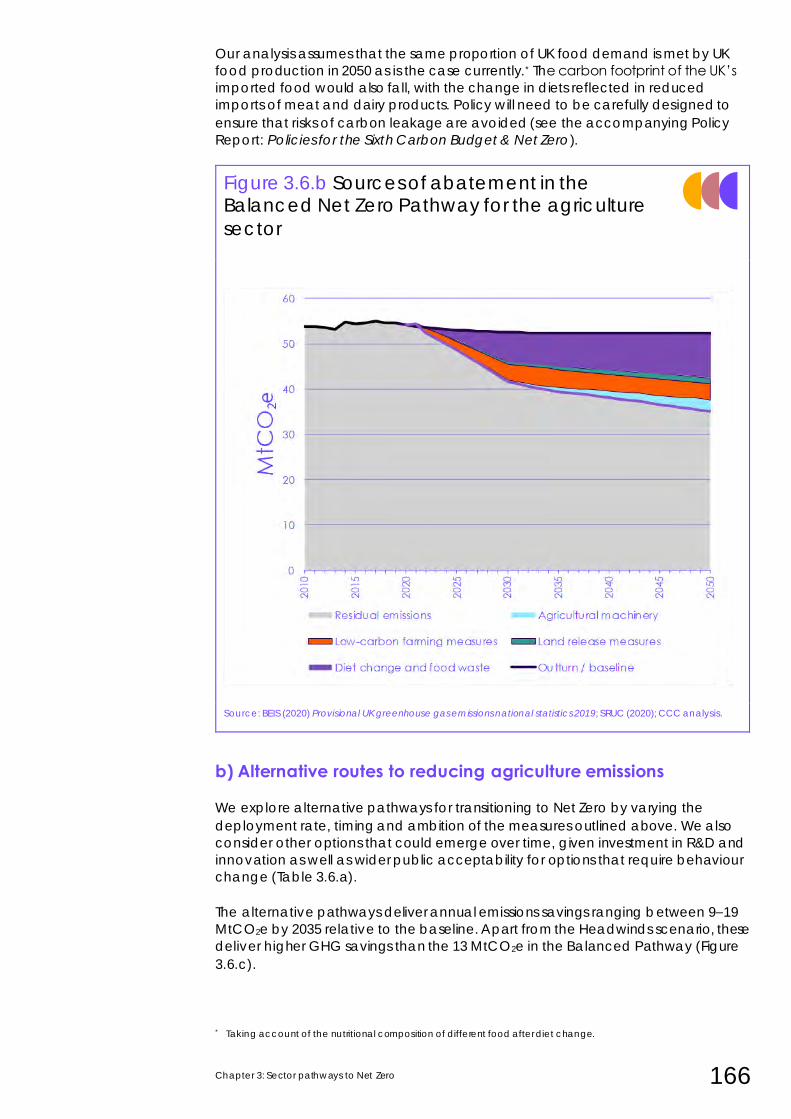
Chapter 3: Sector pathways to Net Zero 166
Our analysis assumes that the same proportion of UK food demand is met by UK
food production in 2050 as is the case currently.* The carbon footprint of the UK’s
imported food would also fall, with the change in diets reflected in reduced
imports of meat and dairy products. Policy will need to be carefully designed to
ensure that risks of carbon leakage are avoided (see the accompanying Policy
Report: Policies for the Sixth Carbon Budget & Net Zero).
Figure 3.6.b Sources of abatement in the Balanced Net Zero Pathway for the agriculture
sector
Source: BEIS (2020) Provisional UK greenhouse gas emissions national statistics 2019; SRUC (2020); CCC analysis.
b) Alternative routes to reducing agriculture emissions
We explore alternative pathways for transitioning to Net Zero by varying the
deployment rate, timing and ambition of the measures outlined above. We also
consider other options that could emerge over time, given investment in R&D and
innovation as well as wider public acceptability for options that require behaviour
change (Table 3.6.a).
The alternative pathways deliver annual emissions savings ranging between 9–19
MtCO2e by 2035 relative to the baseline. Apart from the Headwinds scenario, these
deliver higher GHG savings than the 13 MtCO2e in the Balanced Pathway (Figure
3.6.c).
* Taking account of the nutritional composition of different food after diet change.
167 Sixth Carbon Budget – The path to Net Zero
• Low-carbon farming measures. We assume the take-up of measures associated
with changing farming practices (e.g. planting cover crops, livestock health
measures and feeding cattle a high starch diet) is highest in the Widespread
Engagement scenario, and take-up of more innovative options (e.g. 3NOP
additives, GM cattle, and breeding) is highest in Widespread Innovation.
However, there is relatively little difference in emissions savings across these
scenarios, which vary from 4 MtCO2e in Widespread Engagement to 5 MtCO2e
under Headwinds by 2035.
• Agricultural machinery. While the mix of technologies differ across the
pathways, they all achieve the same level of abatement by 2050. Which
technologies emerge will depend on technology development and costs.
• Measures to release land. Among the measures to release land, moving diets
away from the most carbon-intensive foods delivers the highest emissions
savings. A higher or lower willingness to act on changing diets, reducing food
waste and productivity improvements could change emissions relative to the
Balanced Pathway:
– Under the Widespread Engagement scenario, a greater shift away
from meat and dairy (e.g. a 50% switch by 2050) and a greater
willingness to act on food waste results in additional GHG savings of 2
MtCO2e in 2035.
– In the Widespread Innovation scenario, we assume that technology
develops lab-grown meat for the market, such that 30% of the higher
level of diet shift is towards lab-grown meat rather than plant-based
alternatives. This results in 5 MtCO2e additional GHG savings by 2035.
– In the Headwinds scenario we assume a 20% shift away from meat
and dairy products is achieved by 2050 instead of 2035. There is no
further reduction in food waste beyond the 50% target reached in
2030. This results in 6 MtCO2e lower GHGs savings in 2035 than the
Balanced Pathway.
– Crop breeding (e.g. development of new cultivars /traits) could lead
to higher yields (e.g. to 13 tonnes/hectare for wheat by 2050). Higher
livestock stocking densities on permanent grassland releases around
0.8 million more hectares of land out of agricultural production under
the Widespread Innovation and Tailwinds scenarios compared with
the Balanced Pathway. These result in 1 MtCO2e additional GHG
savings in 2035.
Implementing low-carbon practices offers some emissions reduction but is not enough for Net Zero.
Diet change away from meat and dairy offers the biggest potential to release agricultural land for other uses.
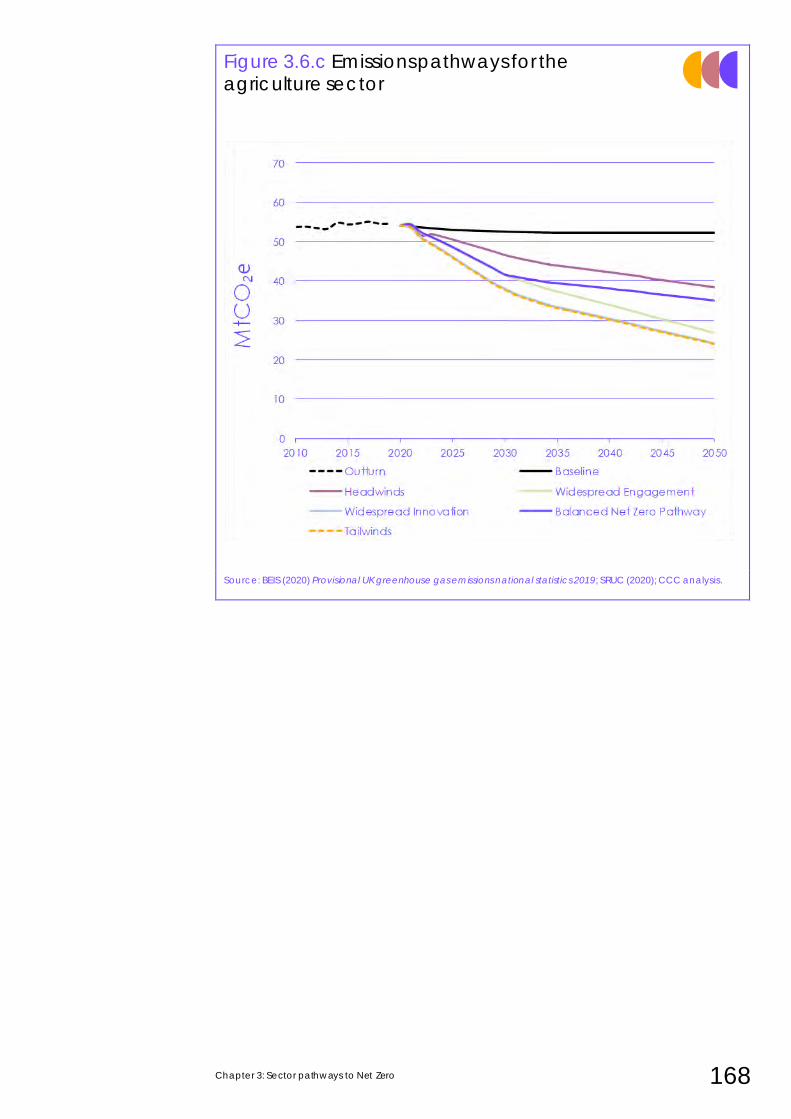
Chapter 3: Sector pathways to Net Zero 168
Figure 3.6.c Emissions pathways for the agriculture sector
Source: BEIS (2020) Provisional UK greenhouse gas emissions national statistics 2019; SRUC (2020); CCC analysis.
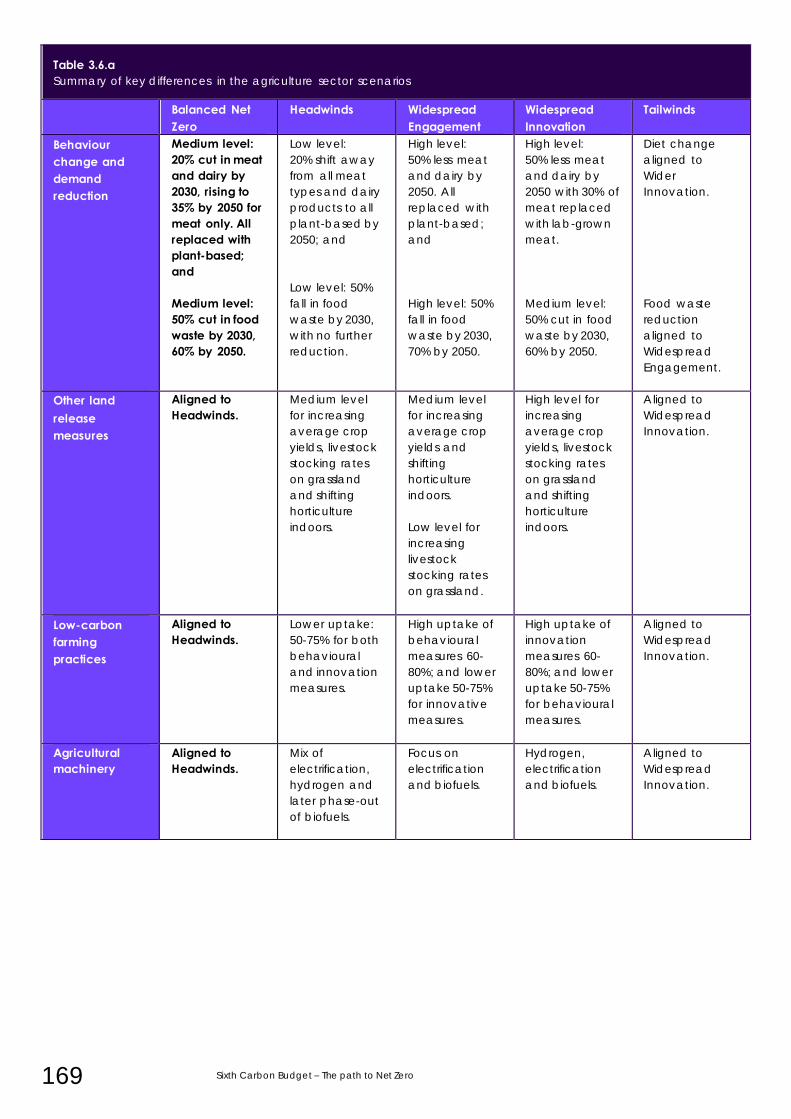
169 Sixth Carbon Budget – The path to Net Zero
Table 3.6.a
Summary of key differences in the agriculture sector scenarios
Balanced Net Zero
Headwinds Widespread Engagement
Widespread Innovation
Tailwinds
Behaviour change and demand reduction
Medium level: 20% cut in meat and dairy by 2030, rising to 35% by 2050 for meat only. All replaced with plant-based; and Medium level: 50% cut in food waste by 2030, 60% by 2050.
Low level:
20% shift away
from all meat
types and dairy
products to all
plant-based by
2050; and
Low level: 50%
fall in food
waste by 2030,
with no further
reduction.
High level:
50% less meat
and dairy by
2050. All
replaced with
plant-based;
and
High level: 50%
fall in food
waste by 2030,
70% by 2050.
High level:
50% less meat
and dairy by
2050 with 30% of
meat replaced
with lab-grown
meat.
Medium level:
50% cut in food
waste by 2030,
60% by 2050.
Diet change
aligned to
Wider
Innovation.
Food waste
reduction
aligned to
Widespread
Engagement.
Other land release measures
Aligned to Headwinds.
Medium level
for increasing
average crop
yields, livestock
stocking rates
on grassland
and shifting
horticulture
indoors.
Medium level
for increasing
average crop
yields and
shifting
horticulture
indoors.
Low level for
increasing
livestock
stocking rates
on grassland.
High level for
increasing
average crop
yields, livestock
stocking rates
on grassland
and shifting
horticulture
indoors.
Aligned to
Widespread
Innovation.
Low-carbon farming practices
Aligned to Headwinds.
Lower uptake:
50-75% for both
behavioural
and innovation
measures.
High uptake of
behavioural
measures 60-
80%; and lower
uptake 50-75%
for innovative
measures.
High uptake of
innovation
measures 60-
80%; and lower
uptake 50-75%
for behavioural
measures.
Aligned to
Widespread
Innovation.
Agricultural machinery
Aligned to Headwinds.
Mix of
electrification,
hydrogen and
later phase-out
of biofuels.
Focus on
electrification
and biofuels.
Hydrogen,
electrification
and biofuels.
Aligned to
Widespread
Innovation.
Chapter 3: Sector pathways to Net Zero 170
c) The Balanced Net Zero Pathway for the land use sector
Land sector emissions were 12.8 MtCO2e in 2018, equivalent to 2% of UK GHG
emissions. The land-based measures in the Balanced Pathway could deliver annual
savings (against a baseline) of 12 MtCO2e in 2035, and 30 MtCO2e by 2050, moving
the sector to a net sink of 19 MtCO2e by 2050 (Figure 3.6.d). Further emissions
reduction could be delivered in other sectors from the use of biomass material e.g.
in displacing fossil fuels or when used with Carbon Capture and Storage (CCS). Key
measures to achieve this are:
• Afforestation. Scaling up afforestation rates to 30,000 hectares a year by
2025 in line with the UK Government’s commitment, rising to 50,000
hectares annually by 2035. This would increase woodland cover from 13%
of UK land area to around 18% by 2050*, with a mix of tree types that focus
on broadleaves. This could deliver annual savings of over 2 MtCO2e in 2035
and 12 MtCO2e in 2050. It is important that the right tree is planted in the
right place. Decisions on tree planting should take account of biophysical
suitability of different species, projected climate impacts and other
constraints and uses of land.
• Peatlands. Full restoration of upland peat by 2045 (or stabilisation if
degradation is too severe to restore) and re-wetting and sustainable
management of 60% of lowland peat by 2050. These would deliver annual
saving of nearly 6 MtCO2e by 2035 and around 10 MCO2e by 2050.
• Energy crops. Planting perennial energy crops (e.g. miscanthus and short-
rotation coppice) alongside short rotation forestry needs to accelerate
quickly to at least 30,000 hectares a year by 2035, so that 700,000 hectares
are planted by 2050. This could sequester 2 MtCO2e by 2035 and over 6
MtCO2e by 2050. When used with Carbon Capture and Storage (CCS)
technologies this could displace a further 3 MtCO2e of GHG emissions
elsewhere in the economy by 2035, increasing to 10 MtCO2e by 2050.
• Other land measures. Increasing on-farm diversification with the integration
of trees on 10% of farmland and extending the length of hedgerows by 40%
by 2050. Together with better woodland and hedge management, these
could increase annual carbon removals by over 1 MtCO2e by 2035 and by
nearly 3 MtCO2e in 2050.
Our analysis balances the need to reduce land-based emissions with other
essential functions of land. The Balanced Pathway sets out a desirable and
achievable level of ambition across all options. Together, our measures result in
more land released out of agriculture than is required and choices will need to be
made on how to use this land:
• The Balanced Pathway requires 9% of land to be released from agriculture
for measures that reduce emissions and sequester carbon by 2035, rising to
a fifth by 2050.† This rises to 11% and almost a quarter when taking account
of land needed for settlement growth by 2035 and 2050 respectively.
• The measures we identify to release land result in 2 million more hectares
than is required by our scenarios by 2035.
* Total woodland area increases to 18.6% if we include the 15% open ground area assumed in the afforestation
target.
† A further 1% of non-agricultural land that is forested peat and peat extraction sites is also restored by 2035.
Planting 50,000 hectares a year would increase woodland cover from 13% to 18% of UK land area by 2050.
As well as carbon sequestration peatlands provide other vital services such as water regulation, flood protection and habitats for wildlife.
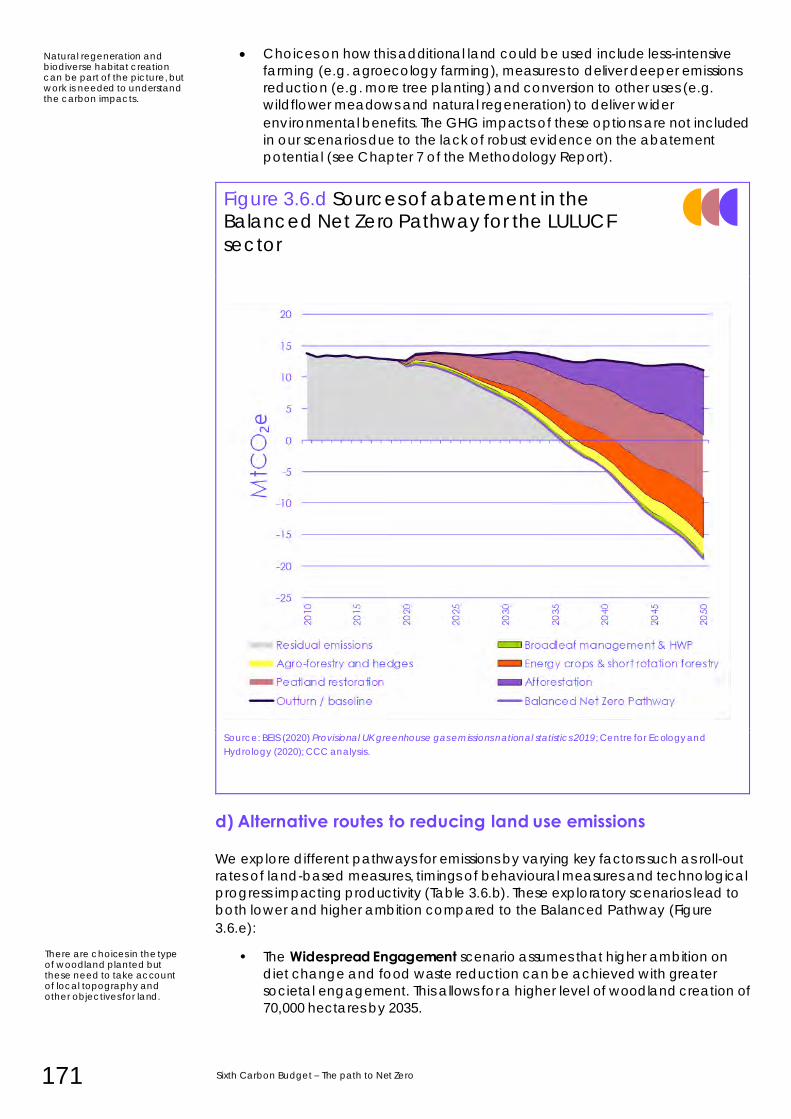
171 Sixth Carbon Budget – The path to Net Zero
• Choices on how this additional land could be used include less-intensive
farming (e.g. agroecology farming), measures to deliver deeper emissions
reduction (e.g. more tree planting) and conversion to other uses (e.g.
wildflower meadows and natural regeneration) to deliver wider
environmental benefits. The GHG impacts of these options are not included
in our scenarios due to the lack of robust evidence on the abatement
potential (see Chapter 7 of the Methodology Report).
Figure 3.6.d Sources of abatement in the Balanced Net Zero Pathway for the LULUCF
sector
Source: BEIS (2020) Provisional UK greenhouse gas emissions national statistics 2019; Centre for Ecology and
Hydrology (2020); CCC analysis.
d) Alternative routes to reducing land use emissions
We explore different pathways for emissions by varying key factors such as roll-out
rates of land-based measures, timings of behavioural measures and technological
progress impacting productivity (Table 3.6.b). These exploratory scenarios lead to
both lower and higher ambition compared to the Balanced Pathway (Figure
3.6.e):
• The Widespread Engagement scenario assumes that higher ambition on
diet change and food waste reduction can be achieved with greater
societal engagement. This allows for a higher level of woodland creation of
70,000 hectares by 2035.
Natural regeneration and biodiverse habitat creation can be part of the picture, but work is needed to understand the carbon impacts.
There are choices in the type of woodland planted but these need to take account of local topography and other objectives for land.
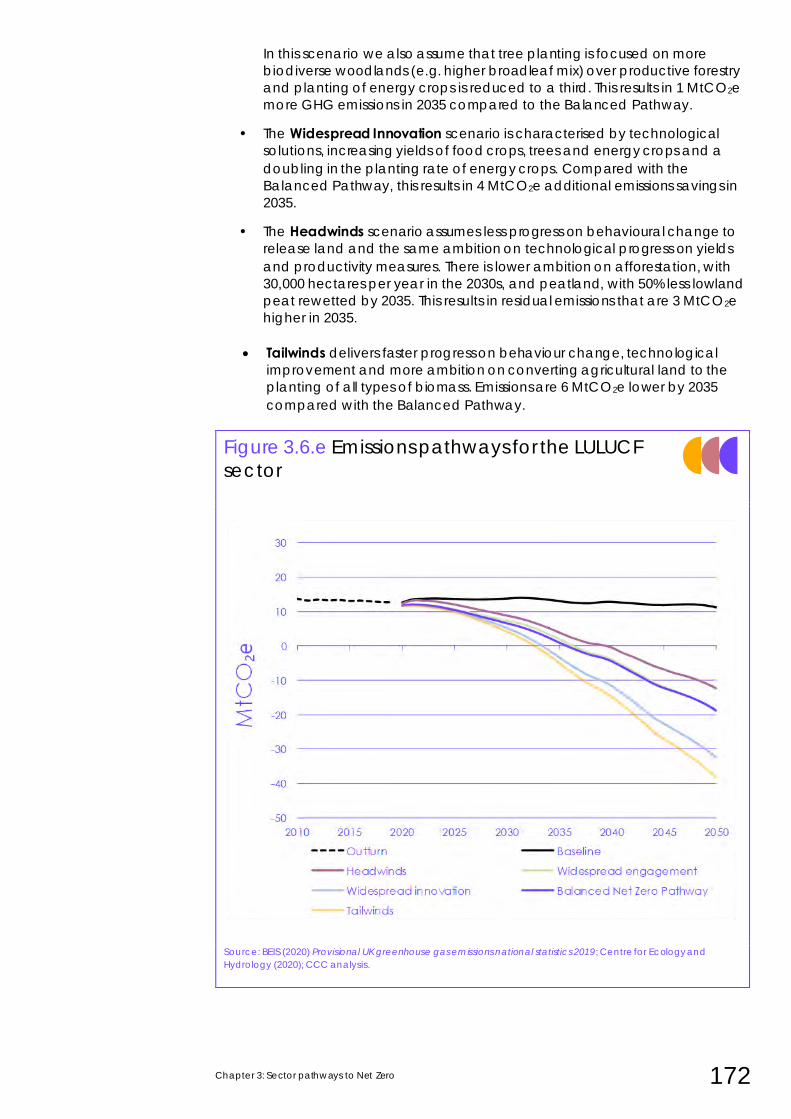
Chapter 3: Sector pathways to Net Zero 172
In this scenario we also assume that tree planting is focused on more
biodiverse woodlands (e.g. higher broadleaf mix) over productive forestry
and planting of energy crops is reduced to a third. This results in 1 MtCO2e
more GHG emissions in 2035 compared to the Balanced Pathway.
• The Widespread Innovation scenario is characterised by technological
solutions, increasing yields of food crops, trees and energy crops and a
doubling in the planting rate of energy crops. Compared with the
Balanced Pathway, this results in 4 MtCO2e additional emissions savings in
2035.
• The Headwinds scenario assumes less progress on behavioural change to
release land and the same ambition on technological progress on yields
and productivity measures. There is lower ambition on afforestation, with
30,000 hectares per year in the 2030s, and peatland, with 50% less lowland
peat rewetted by 2035. This results in residual emissions that are 3 MtCO2e
higher in 2035.
• Tailwinds delivers faster progress on behaviour change, technological
improvement and more ambition on converting agricultural land to the
planting of all types of biomass. Emissions are 6 MtCO2e lower by 2035
compared with the Balanced Pathway.
Figure 3.6.e Emissions pathways for the LULUCF
sector
Source: BEIS (2020) Provisional UK greenhouse gas emissions national statistics 2019; Centre for Ecology and
Hydrology (2020); CCC analysis.
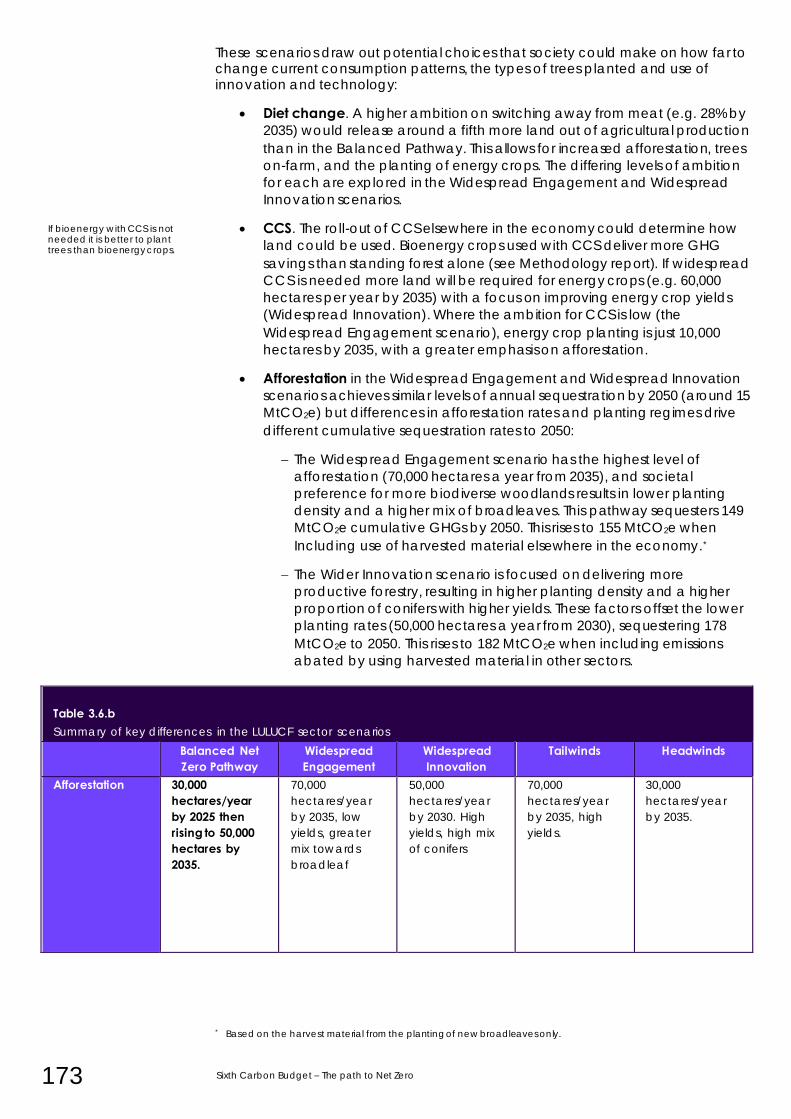
173 Sixth Carbon Budget – The path to Net Zero
These scenarios draw out potential choices that society could make on how far to change current consumption patterns, the types of trees planted and use of innovation and technology:
• Diet change. A higher ambition on switching away from meat (e.g. 28% by
2035) would release around a fifth more land out of agricultural production
than in the Balanced Pathway. This allows for increased afforestation, trees
on-farm, and the planting of energy crops. The differing levels of ambition
for each are explored in the Widespread Engagement and Widespread
Innovation scenarios.
• CCS. The roll-out of CCS elsewhere in the economy could determine how
land could be used. Bioenergy crops used with CCS deliver more GHG
savings than standing forest alone (see Methodology report). If widespread
CCS is needed more land will be required for energy crops (e.g. 60,000
hectares per year by 2035) with a focus on improving energy crop yields
(Widespread Innovation). Where the ambition for CCS is low (the
Widespread Engagement scenario), energy crop planting is just 10,000
hectares by 2035, with a greater emphasis on afforestation.
• Afforestation in the Widespread Engagement and Widespread Innovation
scenarios achieves similar levels of annual sequestration by 2050 (around 15
MtCO2e) but differences in afforestation rates and planting regimes drive
different cumulative sequestration rates to 2050:
– The Widespread Engagement scenario has the highest level of
afforestation (70,000 hectares a year from 2035), and societal
preference for more biodiverse woodlands results in lower planting
density and a higher mix of broadleaves. This pathway sequesters 149
MtCO2e cumulative GHGs by 2050. This rises to 155 MtCO2e when
Including use of harvested material elsewhere in the economy.*
– The Wider Innovation scenario is focused on delivering more
productive forestry, resulting in higher planting density and a higher
proportion of conifers with higher yields. These factors offset the lower
planting rates (50,000 hectares a year from 2030), sequestering 178
MtCO2e to 2050. This rises to 182 MtCO2e when including emissions
abated by using harvested material in other sectors.
Table 1.11:Table 1.11 Table 3.6.b Summary of key differences in the LULUCF sector scenarios
Balanced Net Zero Pathway
Widespread Engagement
Widespread Innovation
Tailwinds Headwinds
Afforestation 30,000 hectares/year by 2025 then rising to 50,000 hectares by 2035.
70,000
hectares/year
by 2035, low
yields, greater
mix towards
broadleaf
50,000
hectares/year
by 2030. High
yields, high mix
of conifers
70,000
hectares/year
by 2035, high
yields.
30,000
hectares/year
by 2035.
* Based on the harvest material from the planting of new broadleaves only.
If bioenergy with CCS is not needed it is better to plant trees than bioenergy crops.
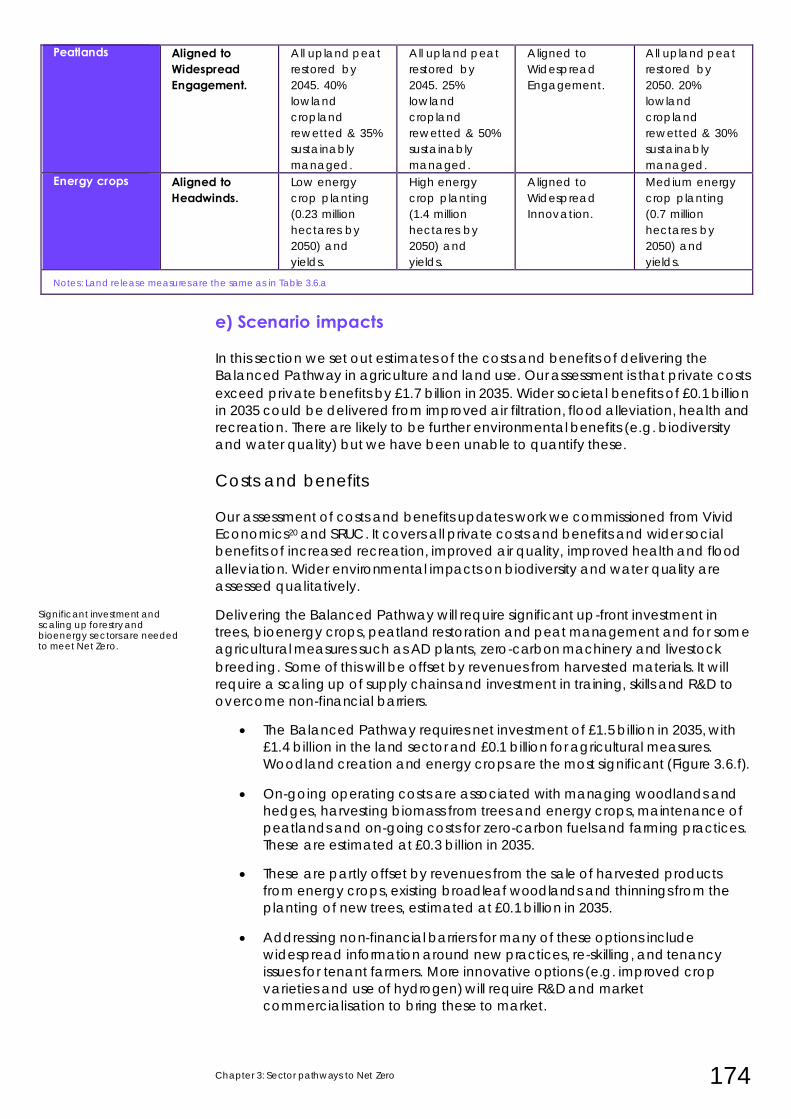
Chapter 3: Sector pathways to Net Zero 174
Peatlands Aligned to Widespread Engagement.
All upland peat
restored by
2045. 40%
lowland
cropland
rewetted & 35%
sustainably
managed.
All upland peat
restored by
2045. 25%
lowland
cropland
rewetted & 50%
sustainably
managed.
Aligned to
Widespread
Engagement.
All upland peat
restored by
2050. 20%
lowland
cropland
rewetted & 30%
sustainably
managed.
Energy crops Aligned to Headwinds.
Low energy
crop planting
(0.23 million
hectares by
2050) and
yields.
High energy
crop planting
(1.4 million
hectares by
2050) and
yields.
Aligned to
Widespread
Innovation.
Medium energy
crop planting
(0.7 million
hectares by
2050) and
yields.
Notes: Land release measures are the same as in Table 3.6.a
e) Scenario impacts
In this section we set out estimates of the costs and benefits of delivering the
Balanced Pathway in agriculture and land use. Our assessment is that private costs
exceed private benefits by £1.7 billion in 2035. Wider societal benefits of £0.1 billion
in 2035 could be delivered from improved air filtration, flood alleviation, health and
recreation. There are likely to be further environmental benefits (e.g. biodiversity
and water quality) but we have been unable to quantify these.
Costs and benefits
Our assessment of costs and benefits updates work we commissioned from Vivid
Economics20 and SRUC. It covers all private costs and benefits and wider social
benefits of increased recreation, improved air quality, improved health and flood
alleviation. Wider environmental impacts on biodiversity and water quality are
assessed qualitatively.
Delivering the Balanced Pathway will require significant up-front investment in
trees, bioenergy crops, peatland restoration and peat management and for some
agricultural measures such as AD plants, zero-carbon machinery and livestock
breeding. Some of this will be offset by revenues from harvested materials. It will
require a scaling up of supply chains and investment in training, skills and R&D to
overcome non-financial barriers.
• The Balanced Pathway requires net investment of £1.5 billion in 2035, with
£1.4 billion in the land sector and £0.1 billion for agricultural measures.
Woodland creation and energy crops are the most significant (Figure 3.6.f).
• On-going operating costs are associated with managing woodlands and
hedges, harvesting biomass from trees and energy crops, maintenance of
peatlands and on-going costs for zero-carbon fuels and farming practices.
These are estimated at £0.3 billion in 2035.
• These are partly offset by revenues from the sale of harvested products
from energy crops, existing broadleaf woodlands and thinnings from the
planting of new trees, estimated at £0.1 billion in 2035.
• Addressing non-financial barriers for many of these options include
widespread information around new practices, re-skilling, and tenancy
issues for tenant farmers. More innovative options (e.g. improved crop
varieties and use of hydrogen) will require R&D and market
commercialisation to bring these to market.
Significant investment and scaling up forestry and bioenergy sectors are needed to meet Net Zero.
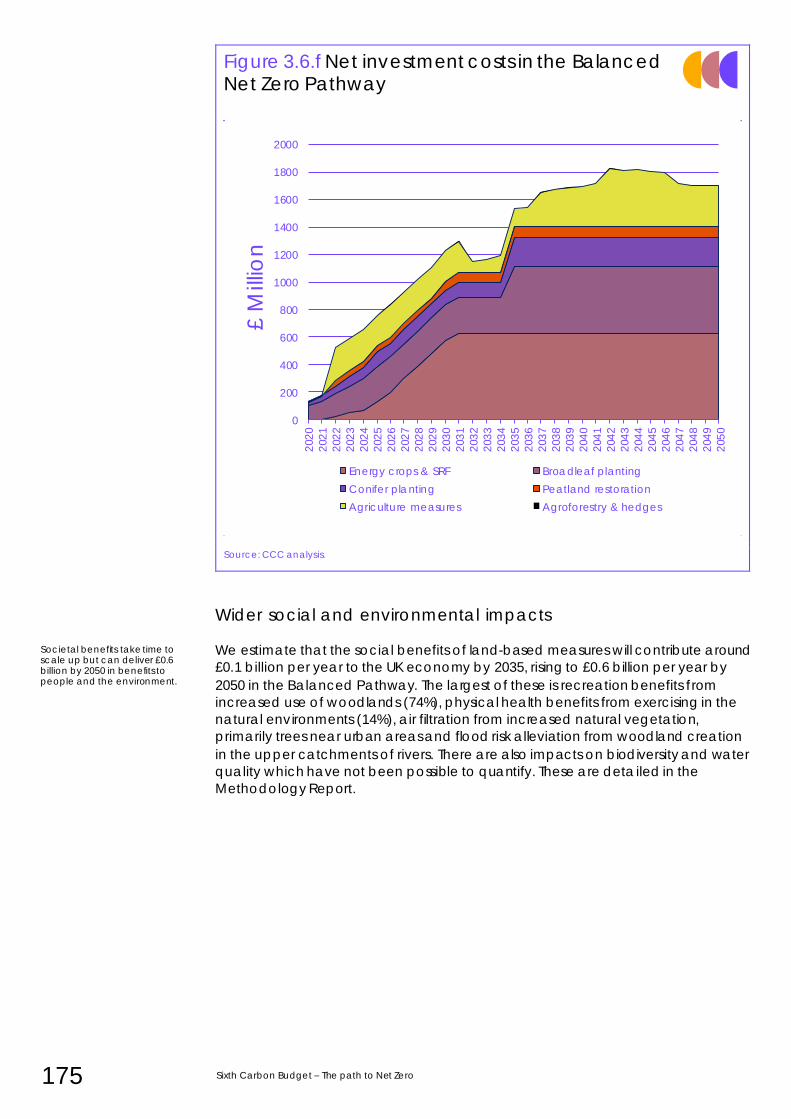
175 Sixth Carbon Budget – The path to Net Zero
Figure 3.6.f Net investment costs in the Balanced Net Zero Pathway
Source: CCC analysis.
Wider social and environmental impacts We estimate that the social benefits of land-based measures will contribute around
£0.1 billion per year to the UK economy by 2035, rising to £0.6 billion per year by
2050 in the Balanced Pathway. The largest of these is recreation benefits from
increased use of woodlands (74%), physical health benefits from exercising in the
natural environments (14%), air filtration from increased natural vegetation,
primarily trees near urban areas and flood risk alleviation from woodland creation
in the upper catchments of rivers. There are also impacts on biodiversity and water
quality which have not been possible to quantify. These are detailed in the
Methodology Report.
0
200
400
600
800
1000
1200
1400
1600
1800
2000
202
0
202
1
202
2
202
3
202
4
202
5
202
6
202
7
202
8
202
9
203
0
203
1
203
2
203
3
203
4
203
5
203
6
203
7
203
8
203
9
204
0
204
1
204
2
204
3
204
4
204
5
204
6
204
7
204
8
204
9
205
0
£ M
illio
n
Energy crops & SRF Broadleaf planting
Conifer planting Peatland restoration
Agriculture measures Agroforestry & hedges
Societal benefits take time to scale up but can deliver £0.6 billion by 2050 in benefits to people and the environment.
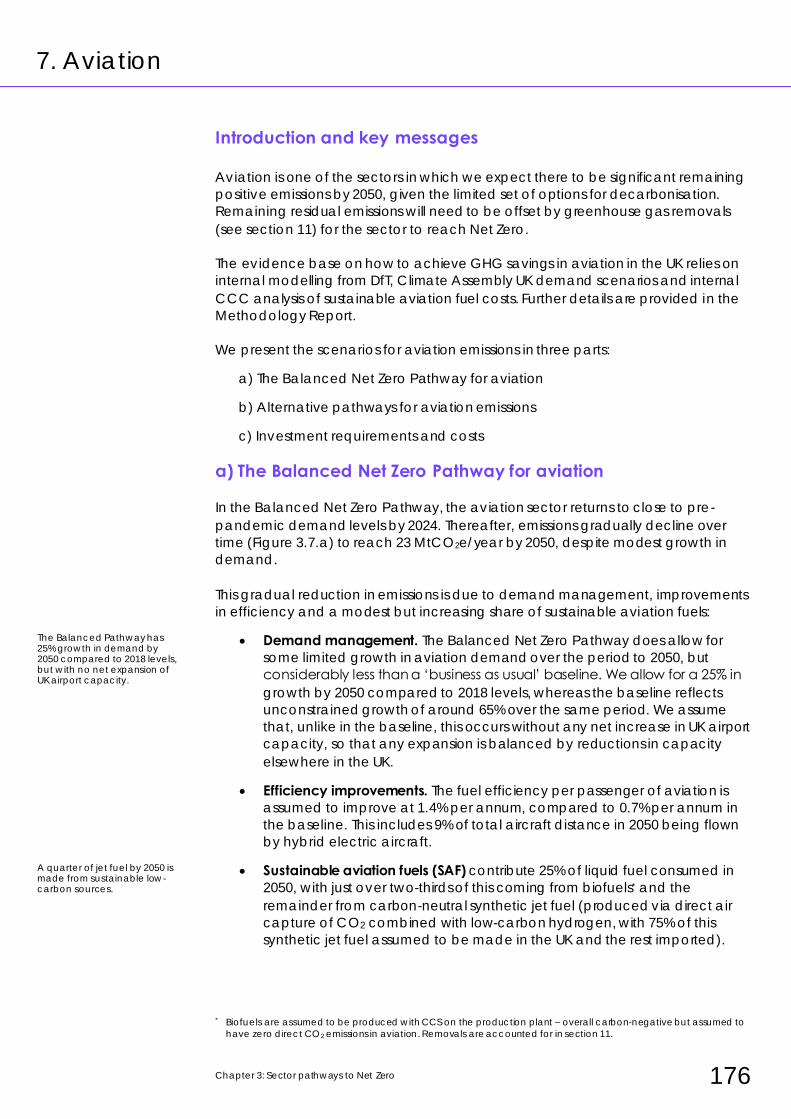
Chapter 3: Sector pathways to Net Zero 176
7. Aviation
Introduction and key messages Aviation is one of the sectors in which we expect there to be significant remaining
positive emissions by 2050, given the limited set of options for decarbonisation.
Remaining residual emissions will need to be offset by greenhouse gas removals
(see section 11) for the sector to reach Net Zero.
The evidence base on how to achieve GHG savings in aviation in the UK relies on
internal modelling from DfT, Climate Assembly UK demand scenarios and internal
CCC analysis of sustainable aviation fuel costs. Further details are provided in the
Methodology Report.
We present the scenarios for aviation emissions in three parts:
a) The Balanced Net Zero Pathway for aviation
b) Alternative pathways for aviation emissions
c) Investment requirements and costs
a) The Balanced Net Zero Pathway for aviation
In the Balanced Net Zero Pathway, the aviation sector returns to close to pre-
pandemic demand levels by 2024. Thereafter, emissions gradually decline over
time (Figure 3.7.a) to reach 23 MtCO2e/year by 2050, despite modest growth in
demand.
This gradual reduction in emissions is due to demand management, improvements
in efficiency and a modest but increasing share of sustainable aviation fuels:
• Demand management. The Balanced Net Zero Pathway does allow for
some limited growth in aviation demand over the period to 2050, but
considerably less than a ‘business as usual’ baseline. We allow for a 25% in
growth by 2050 compared to 2018 levels, whereas the baseline reflects
unconstrained growth of around 65% over the same period. We assume
that, unlike in the baseline, this occurs without any net increase in UK airport
capacity, so that any expansion is balanced by reductions in capacity
elsewhere in the UK.
• Efficiency improvements. The fuel efficiency per passenger of aviation is
assumed to improve at 1.4% per annum, compared to 0.7% per annum in
the baseline. This includes 9% of total aircraft distance in 2050 being flown
by hybrid electric aircraft.
• Sustainable aviation fuels (SAF) contribute 25% of liquid fuel consumed in
2050, with just over two-thirds of this coming from biofuels* and the
remainder from carbon-neutral synthetic jet fuel (produced via direct air
capture of CO2 combined with low-carbon hydrogen, with 75% of this
synthetic jet fuel assumed to be made in the UK and the rest imported).
* Biofuels are assumed to be produced with CCS on the production plant – overall carbon-negative but assumed to
have zero direct CO2 emissions in aviation. Removals are accounted for in section 11.
The Balanced Pathway has 25% growth in demand by 2050 compared to 2018 levels, but with no net expansion of UK airport capacity.
A quarter of jet fuel by 2050 is made from sustainable low-carbon sources.
177 Sixth Carbon Budget – The path to Net Zero
Figure 3.7.a Sources of abatement in the Balanced Net Zero Pathway for the aviation
sector
Source: BEIS (2020) Provisional UK greenhouse gas emissions national statistics 2019; CCC analysis.
Demand management plays a critical role in ensuring GHG emissions continue to decrease, particularly while efficiency benefits and SAF take time to scale up.
Chapter 3: Sector pathways to Net Zero 178
b) Alternative pathways for aviation emissions Each of our exploratory scenarios for aviation sees emissions fall from 2018 to 2050
by more than 35% (Figure 3.7.b), though with different contributions from efficiency
improvements, sustainable fuels and constraints on demand (Table 3.7):
• Headwinds assumes the same 25% growth in demand from 2018 to 2050 as
in the Balanced Pathway, although with higher demand in the 2030s due to
a net increase in airport capacity. Improvements in efficiency are as in the
Balanced Pathway, while biofuels comprise 20% of the fuel mix by 2050.
Emissions are 25 MtCO2e in 2050, 36% below 2018 levels.
• Widespread Engagement has lower demand, with an overall reduction of
15% on 2018 levels and therefore around half the 2050 demand as in the
baseline. This is in line with the Climate Assembly UK’s ‘flying less’ scenario. It
includes a substantial reduction in business aviation due to widespread
near-term adoption of videoconferencing. Efficiency improvements are
slightly faster than those in the Balanced Pathway at 1.6% per annum, while
the share of biofuels in 2050 is slightly lower at 20%, with a further 5%
contribution from the biogenic fraction of waste-based fuels.* Emissions in
2050 are 15 MtCO2e, 62% below 2018 levels.
• Widespread Innovation has a greater contribution from technological
performance, both in terms of improved efficiency (2.1% per annum) and
the contribution of sustainable aviation fuels. By 2050, around a quarter of
fuel use is biofuel, with a further quarter carbon-neutral synthetic jet fuel.
These technical improvements lead to a lower carbon-intensity and lower
cost of aviation, although demand in this scenario is considerably higher,
reaching 50% above 2018 levels by 2050 (in line with the Climate Assembly
UK’s ‘technological change’ scenario). Emissions in 2050 are 15 MtCO2e,
63% below 2018 levels.
• In Tailwinds, the reductions in demand under Widespread Engagement are
combined with the technology improvements in Widespread Innovation.
Demand in 2050 is 15% below 2018 levels and efficiency improves at 2.1%
per annum. Very similar volumes of sustainable fuels are used as in
Widespread Innovation, but when applied to the lower fuel consumption in
Tailwinds these comprise a higher combined share of 95% of fuel use.
Emissions in 2050 are 1 MtCO2e, 97% below 2018 levels.
In each case, for the aviation sector to reach Net Zero by 2050, the remaining
emissions will need to be offset with greenhouse gas removals (see section 11).
In addition to the GHG emissions presented here, aviation also has non-CO2
warming impacts due to contrails, NOx emissions and other factors. While outside
of the emissions accounting framework used by UK carbon budgets (see Chapter
10), we estimate the additional warming from these non-CO2 effects in section 4 of
Chapter 8.
* Waste-based fuels save less CO2 than biofuels, due to approximately half of the waste carbon content being of fossil
origin. Only the biogenic fraction of wastes save CO2 compared to fossil jet fuel.
Widespread Innovation assumes much higher demand growth is possible, due to rapid technology development.
Widespread Engagement assumes lower demand in 2050 than in 2018, due mainly to reduced business travel.
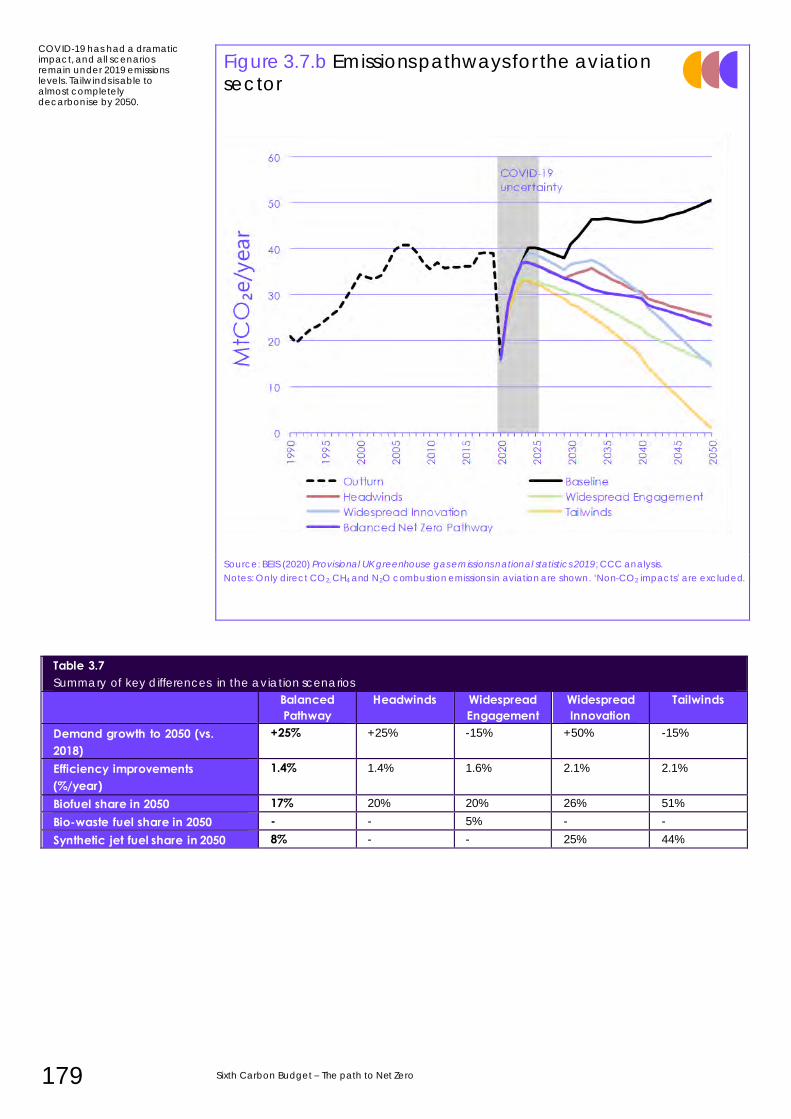
179 Sixth Carbon Budget – The path to Net Zero
Figure 3.7.b Emissions pathways for the aviation sector
Source: BEIS (2020) Provisional UK greenhouse gas emissions national statistics 2019; CCC analysis.
Notes: Only direct CO2, CH4 and N2O combustion emissions in aviation are shown. ‘Non-CO2 impacts’ are excluded.
Table 3.7 Summary of key differences in the aviation scenarios
Balanced Pathway
Headwinds Widespread Engagement
Widespread Innovation
Tailwinds
Demand growth to 2050 (vs. 2018)
+25% +25% -15% +50% -15%
Efficiency improvements (%/year)
1.4% 1.4% 1.6% 2.1% 2.1%
Biofuel share in 2050 17% 20% 20% 26% 51%
Bio-waste fuel share in 2050 - - 5% - -
Synthetic jet fuel share in 2050 8% - - 25% 44%
COVID-19 has had a dramatic impact, and all scenarios remain under 2019 emissions levels. Tailwinds is able to almost completely decarbonise by 2050.
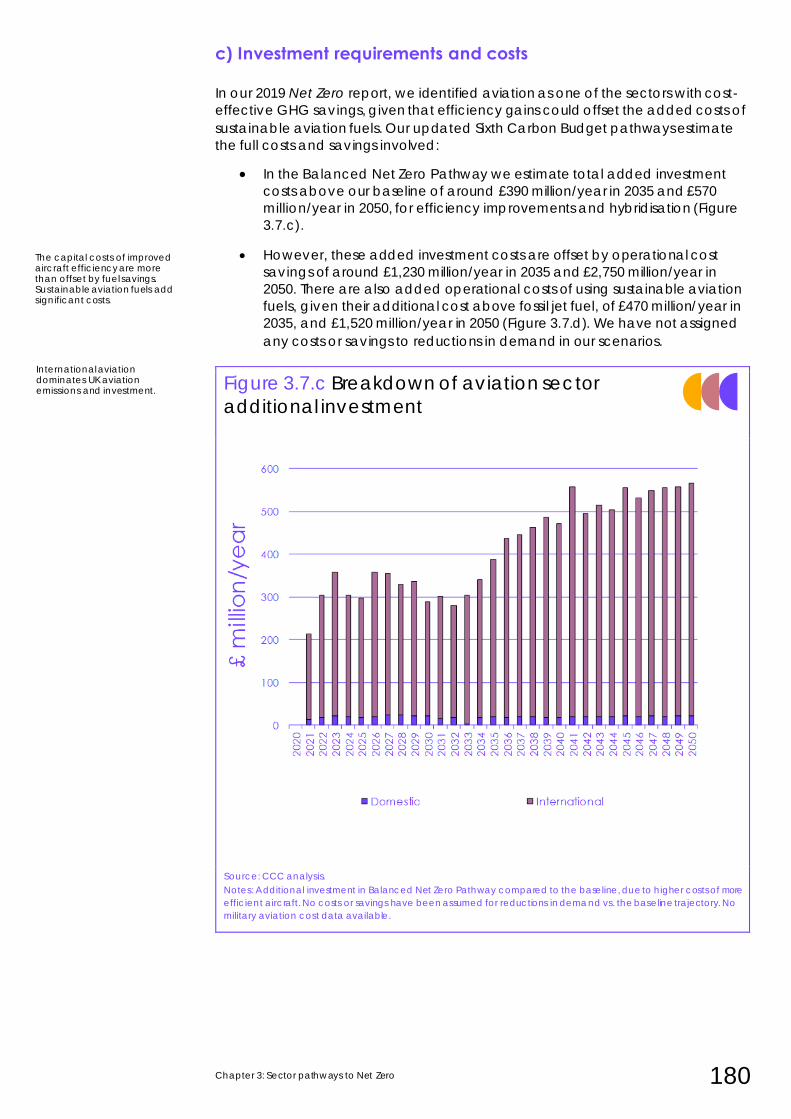
Chapter 3: Sector pathways to Net Zero 180
c) Investment requirements and costs In our 2019 Net Zero report, we identified aviation as one of the sectors with cost-
effective GHG savings, given that efficiency gains could offset the added costs of
sustainable aviation fuels. Our updated Sixth Carbon Budget pathways estimate
the full costs and savings involved:
• In the Balanced Net Zero Pathway we estimate total added investment
costs above our baseline of around £390 million/year in 2035 and £570
million/year in 2050, for efficiency improvements and hybridisation (Figure
3.7.c).
• However, these added investment costs are offset by operational cost
savings of around £1,230 million/year in 2035 and £2,750 million/year in
2050. There are also added operational costs of using sustainable aviation
fuels, given their additional cost above fossil jet fuel, of £470 million/year in
2035, and £1,520 million/year in 2050 (Figure 3.7.d). We have not assigned
any costs or savings to reductions in demand in our scenarios.
Figure 3.7.c Breakdown of aviation sector
additional investment
Source: CCC analysis.
Notes: Additional investment in Balanced Net Zero Pathway compared to the baseline, due to higher costs of more
efficient aircraft. No costs or savings have been assumed for reductions in demand vs. the baseline trajectory. No
military aviation cost data available.
The capital costs of improved aircraft efficiency are more than offset by fuel savings. Sustainable aviation fuels add significant costs.
International aviation dominates UK aviation emissions and investment.
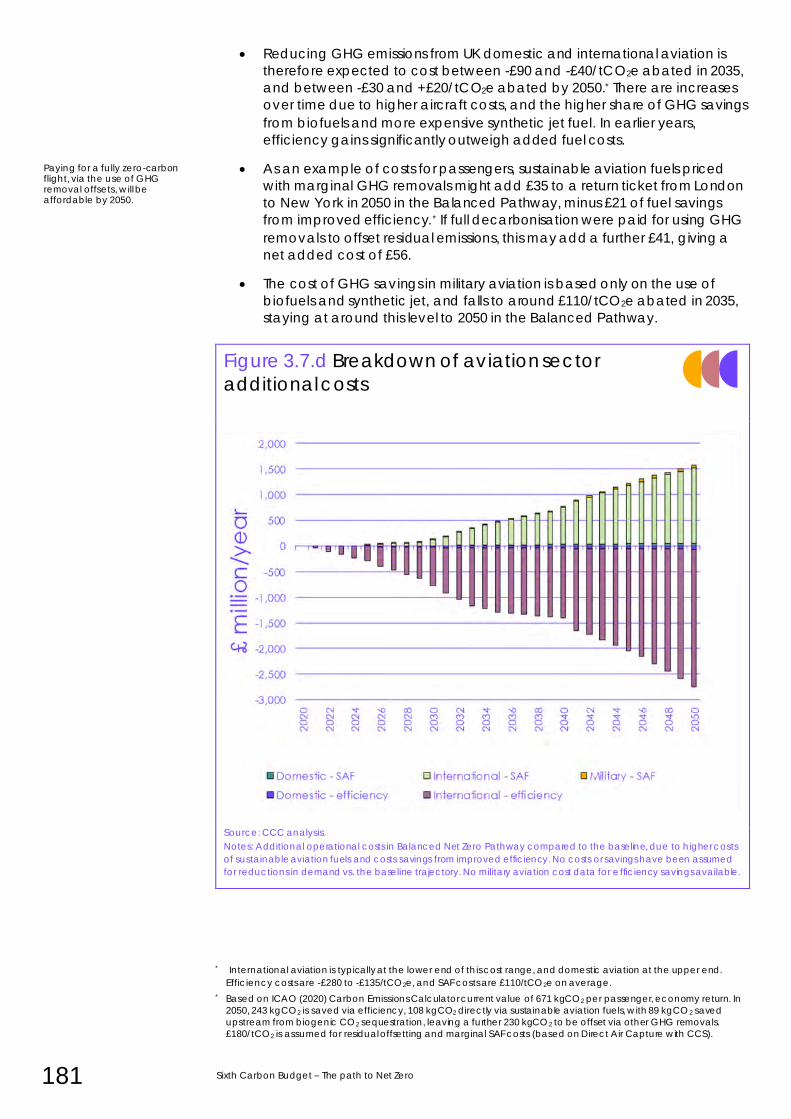
181 Sixth Carbon Budget – The path to Net Zero
• Reducing GHG emissions from UK domestic and international aviation is
therefore expected to cost between -£90 and -£40/tCO2e abated in 2035,
and between -£30 and +£20/tCO2e abated by 2050.* There are increases
over time due to higher aircraft costs, and the higher share of GHG savings
from biofuels and more expensive synthetic jet fuel. In earlier years,
efficiency gains significantly outweigh added fuel costs.
• As an example of costs for passengers, sustainable aviation fuels priced
with marginal GHG removals might add £35 to a return ticket from London
to New York in 2050 in the Balanced Pathway, minus £21 of fuel savings
from improved efficiency.* If full decarbonisation were paid for using GHG
removals to offset residual emissions, this may add a further £41, giving a
net added cost of £56.
• The cost of GHG savings in military aviation is based only on the use of
biofuels and synthetic jet, and falls to around £110/tCO2e abated in 2035,
staying at around this level to 2050 in the Balanced Pathway.
Figure 3.7.d Breakdown of aviation sector
additional costs
Source: CCC analysis.
Notes: Additional operational costs in Balanced Net Zero Pathway compared to the baseline, due to higher costs
of sustainable aviation fuels and costs savings from improved efficiency. No costs or savings have been assumed
for reductions in demand vs. the baseline trajectory. No military aviation cost data for efficiency savings available.
* International aviation is typically at the lower end of this cost range, and domestic aviation at the upper end.
Efficiency costs are -£280 to -£135/tCO2e, and SAF costs are £110/tCO2e on average.
* Based on ICAO (2020) Carbon Emissions Calculator current value of 671 kgCO2 per passenger, economy return. In
2050, 243 kgCO2 is saved via efficiency, 108 kgCO2 directly via sustainable aviation fuels, with 89 kgCO2 saved
upstream from biogenic CO2 sequestration, leaving a further 230 kgCO2 to be offset via other GHG removals.
£180/tCO2 is assumed for residual offsetting and marginal SAF costs (based on Direct Air Capture with CCS).
Paying for a fully zero-carbon flight, via the use of GHG removal offsets, will be affordable by 2050.
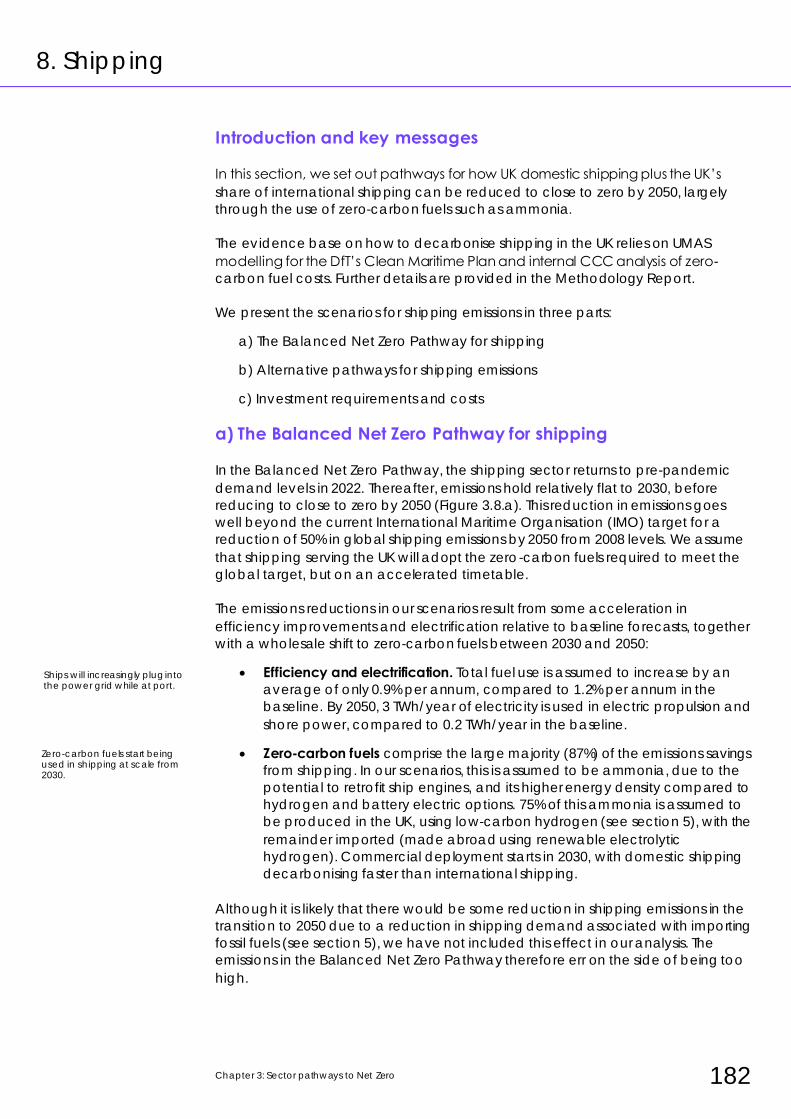
Chapter 3: Sector pathways to Net Zero 182
8. Shipping
Introduction and key messages
In this section, we set out pathways for how UK domestic shipping plus the UK’s
share of international shipping can be reduced to close to zero by 2050, largely
through the use of zero-carbon fuels such as ammonia.
The evidence base on how to decarbonise shipping in the UK relies on UMAS
modelling for the DfT’s Clean Maritime Plan and internal CCC analysis of zero-
carbon fuel costs. Further details are provided in the Methodology Report.
We present the scenarios for shipping emissions in three parts:
a) The Balanced Net Zero Pathway for shipping
b) Alternative pathways for shipping emissions
c) Investment requirements and costs
a) The Balanced Net Zero Pathway for shipping
In the Balanced Net Zero Pathway, the shipping sector returns to pre-pandemic
demand levels in 2022. Thereafter, emissions hold relatively flat to 2030, before
reducing to close to zero by 2050 (Figure 3.8.a). This reduction in emissions goes
well beyond the current International Maritime Organisation (IMO) target for a
reduction of 50% in global shipping emissions by 2050 from 2008 levels. We assume
that shipping serving the UK will adopt the zero-carbon fuels required to meet the
global target, but on an accelerated timetable.
The emissions reductions in our scenarios result from some acceleration in
efficiency improvements and electrification relative to baseline forecasts, together
with a wholesale shift to zero-carbon fuels between 2030 and 2050:
• Efficiency and electrification. Total fuel use is assumed to increase by an
average of only 0.9% per annum, compared to 1.2% per annum in the
baseline. By 2050, 3 TWh/year of electricity is used in electric propulsion and
shore power, compared to 0.2 TWh/year in the baseline.
• Zero-carbon fuels comprise the large majority (87%) of the emissions savings
from shipping. In our scenarios, this is assumed to be ammonia, due to the
potential to retrofit ship engines, and its higher energy density compared to
hydrogen and battery electric options. 75% of this ammonia is assumed to
be produced in the UK, using low-carbon hydrogen (see section 5), with the
remainder imported (made abroad using renewable electrolytic
hydrogen). Commercial deployment starts in 2030, with domestic shipping
decarbonising faster than international shipping.
Although it is likely that there would be some reduction in shipping emissions in the
transition to 2050 due to a reduction in shipping demand associated with importing
fossil fuels (see section 5), we have not included this effect in our analysis. The
emissions in the Balanced Net Zero Pathway therefore err on the side of being too
high.
Ships will increasingly plug into the power grid while at port.
Zero-carbon fuels start being used in shipping at scale from 2030.
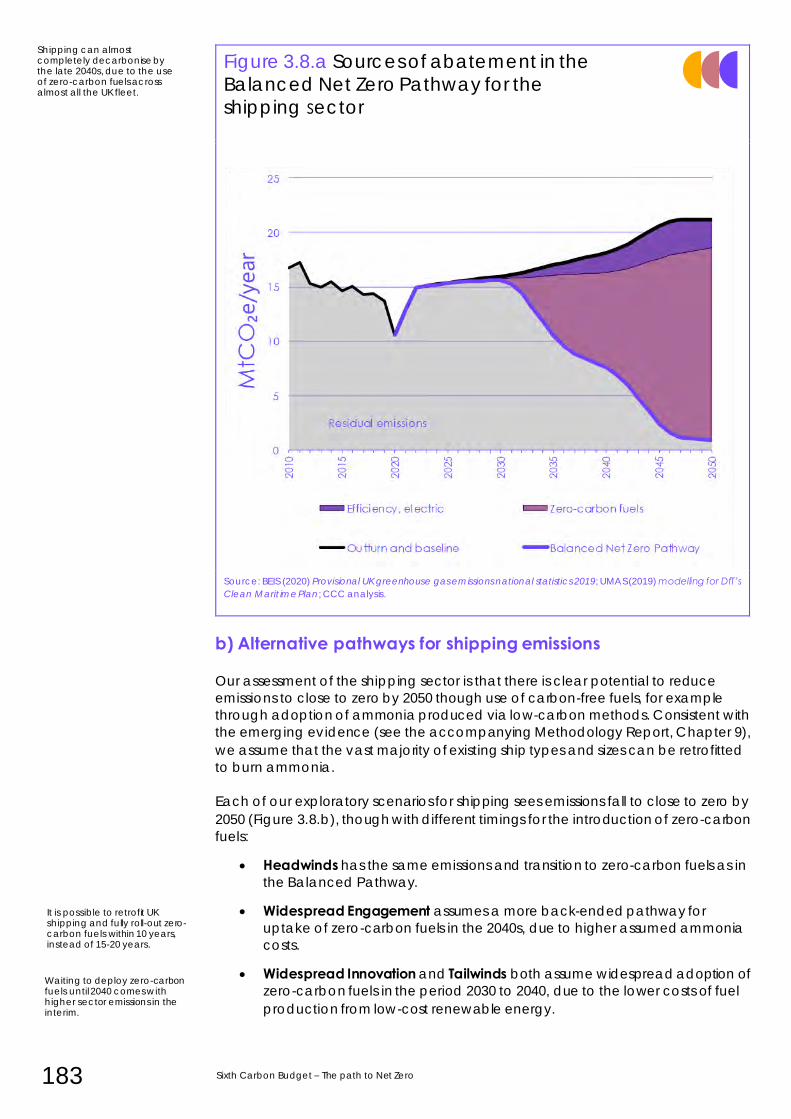
183 Sixth Carbon Budget – The path to Net Zero
Figure 3.8.a Sources of abatement in the Balanced Net Zero Pathway for the shipping sector
Source: BEIS (2020) Provisional UK greenhouse gas emissions national statistics 2019; UMAS (2019) modelling for DfT’s
Clean Marit ime Plan; CCC analysis.
b) Alternative pathways for shipping emissions
Our assessment of the shipping sector is that there is clear potential to reduce
emissions to close to zero by 2050 though use of carbon-free fuels, for example
through adoption of ammonia produced via low-carbon methods. Consistent with
the emerging evidence (see the accompanying Methodology Report, Chapter 9),
we assume that the vast majority of existing ship types and sizes can be retrofitted
to burn ammonia.
Each of our exploratory scenarios for shipping sees emissions fall to close to zero by
2050 (Figure 3.8.b), though with different timings for the introduction of zero-carbon
fuels:
• Headwinds has the same emissions and transition to zero-carbon fuels as in
the Balanced Pathway.
• Widespread Engagement assumes a more back-ended pathway for
uptake of zero-carbon fuels in the 2040s, due to higher assumed ammonia
costs.
• Widespread Innovation and Tailwinds both assume widespread adoption of
zero-carbon fuels in the period 2030 to 2040, due to the lower costs of fuel
production from low-cost renewable energy.
Shipping can almost completely decarbonise by the late 2040s, due to the use of zero-carbon fuels across almost all the UK fleet.
It is possible to retrofit UK shipping and fully roll-out zero-carbon fuels within 10 years, instead of 15-20 years.
Waiting to deploy zero-carbon fuels until 2040 comes with higher sector emissions in the interim.
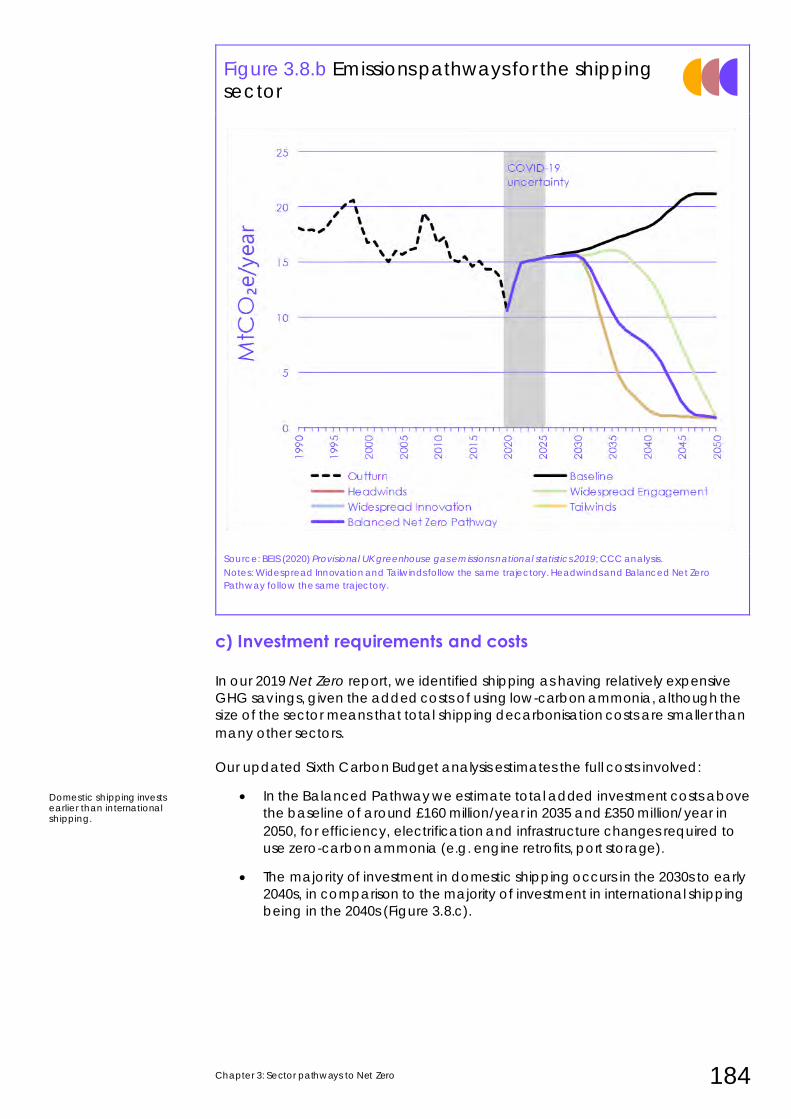
Chapter 3: Sector pathways to Net Zero 184
Figure 3.8.b Emissions pathways for the shipping sector
Source: BEIS (2020) Provisional UK greenhouse gas emissions national statistics 2019; CCC analysis.
Notes: Widespread Innovation and Tailwinds follow the same trajectory. Headwinds and Balanced Net Zero
Pathway follow the same trajectory.
c) Investment requirements and costs In our 2019 Net Zero report, we identified shipping as having relatively expensive
GHG savings, given the added costs of using low-carbon ammonia, although the
size of the sector means that total shipping decarbonisation costs are smaller than
many other sectors.
Our updated Sixth Carbon Budget analysis estimates the full costs involved:
• In the Balanced Pathway we estimate total added investment costs above
the baseline of around £160 million/year in 2035 and £350 million/year in
2050, for efficiency, electrification and infrastructure changes required to
use zero-carbon ammonia (e.g. engine retrofits, port storage).
• The majority of investment in domestic shipping occurs in the 2030s to early
2040s, in comparison to the majority of investment in international shipping
being in the 2040s (Figure 3.8.c).
Domestic shipping invests earlier than international shipping.
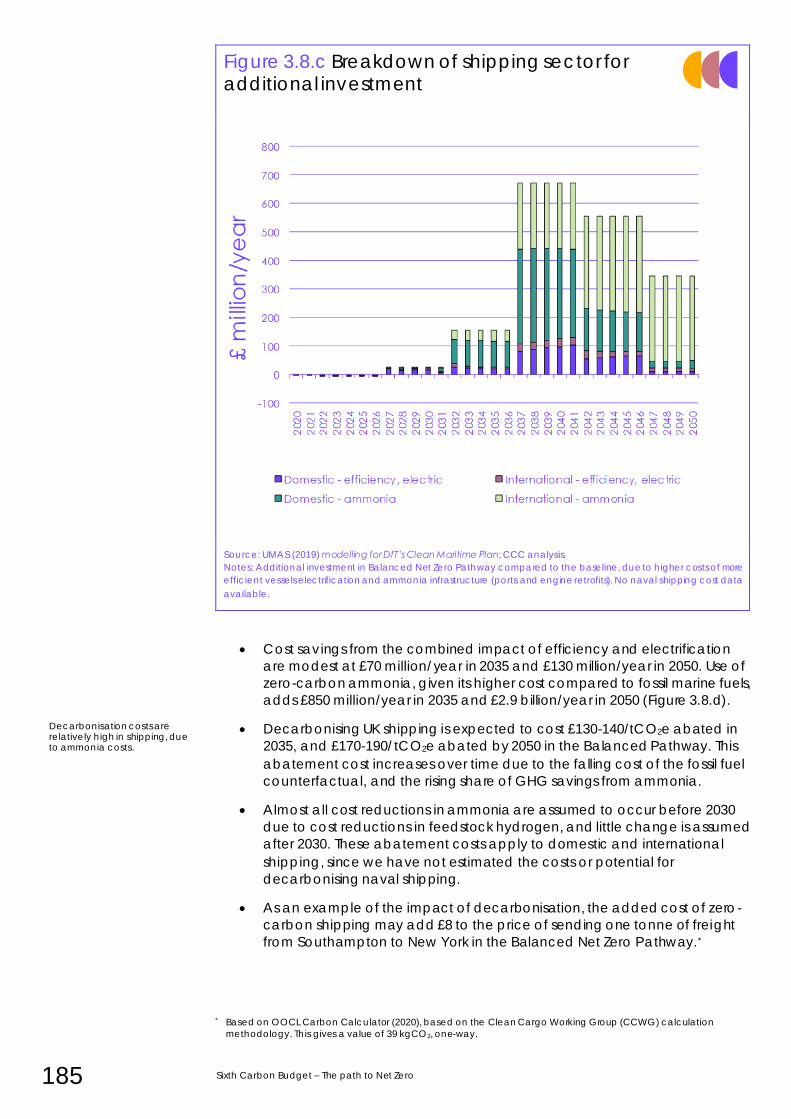
185 Sixth Carbon Budget – The path to Net Zero
Figure 3.8.c Breakdown of shipping sector for additional investment
Source: UMAS (2019) modelling for DfT’s Clean Maritime Plan; CCC analysis.
Notes: Additional investment in Balanced Net Zero Pathway compared to the baseline, due to higher costs of more
efficient vessels electrification and ammonia infrastructure (ports and engine retrofits). No naval shipping cost data
available.
• Cost savings from the combined impact of efficiency and electrification
are modest at £70 million/year in 2035 and £130 million/year in 2050. Use of
zero-carbon ammonia, given its higher cost compared to fossil marine fuels,
adds £850 million/year in 2035 and £2.9 billion/year in 2050 (Figure 3.8.d).
• Decarbonising UK shipping is expected to cost £130-140/tCO2e abated in
2035, and £170-190/tCO2e abated by 2050 in the Balanced Pathway. This
abatement cost increases over time due to the falling cost of the fossil fuel
counterfactual, and the rising share of GHG savings from ammonia.
• Almost all cost reductions in ammonia are assumed to occur before 2030
due to cost reductions in feedstock hydrogen, and little change is assumed
after 2030. These abatement costs apply to domestic and international
shipping, since we have not estimated the costs or potential for
decarbonising naval shipping.
• As an example of the impact of decarbonisation, the added cost of zero-
carbon shipping may add £8 to the price of sending one tonne of freight
from Southampton to New York in the Balanced Net Zero Pathway.*
* Based on OOCL Carbon Calculator (2020), based on the Clean Cargo Working Group (CCWG) calculation
methodology. This gives a value of 39 kgCO2, one-way.
Decarbonisation costs are relatively high in shipping, due to ammonia costs.
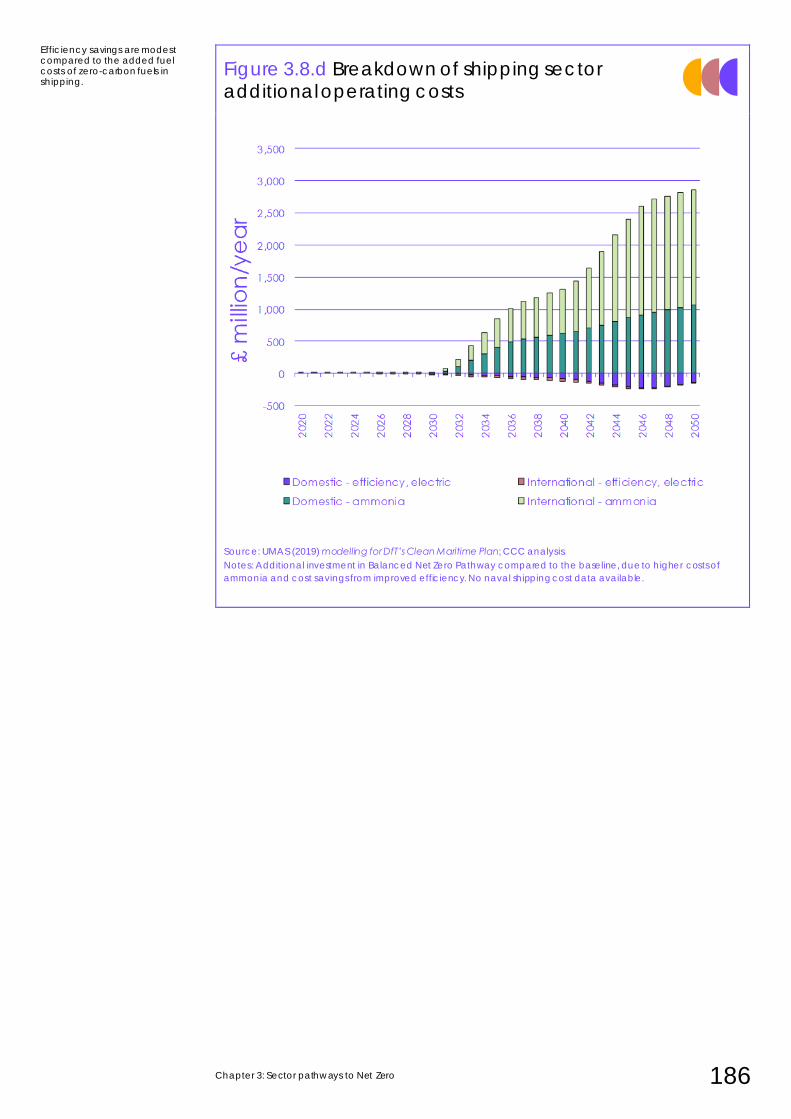
Chapter 3: Sector pathways to Net Zero 186
Figure 3.8.d Breakdown of shipping sector additional operating costs
Source: UMAS (2019) modelling for DfT’s Clean Maritime Plan; CCC analysis.
Notes: Additional investment in Balanced Net Zero Pathway compared to the baseline, due to higher costs of
ammonia and cost savings from improved efficiency. No naval shipping cost data available.
Efficiency savings are modest compared to the added fuel costs of zero-carbon fuels in shipping.
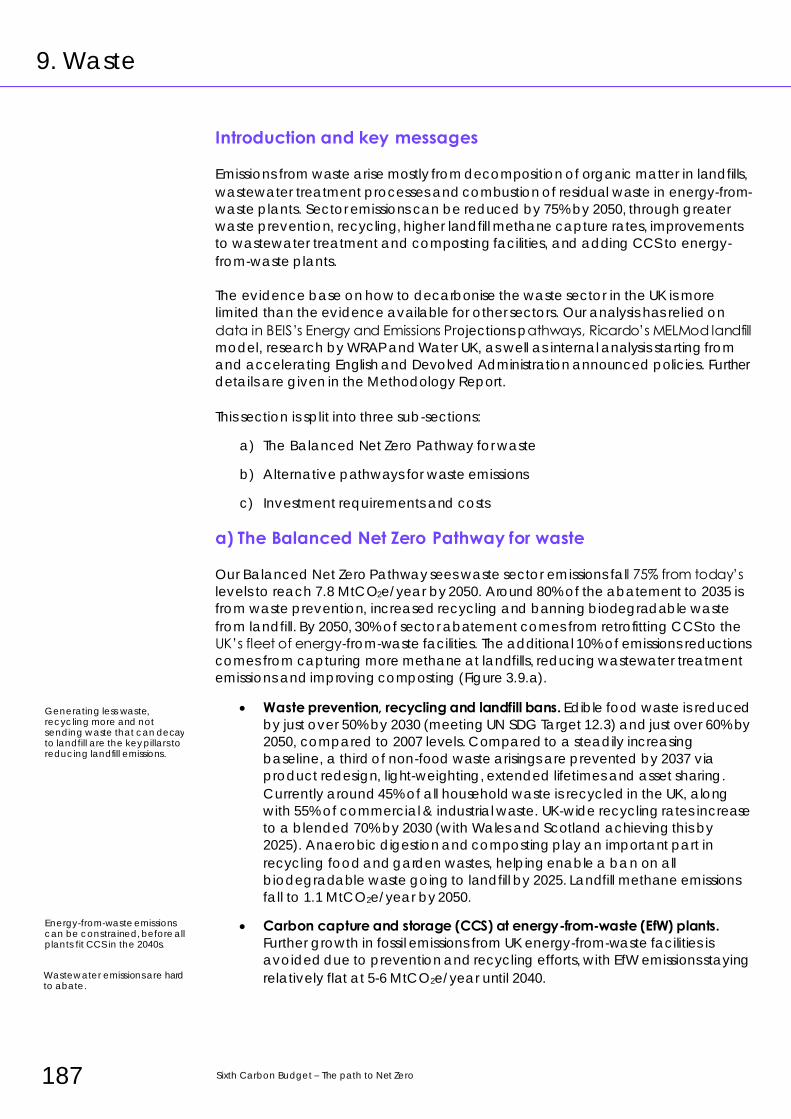
187 Sixth Carbon Budget – The path to Net Zero
9. Waste
Introduction and key messages
Emissions from waste arise mostly from decomposition of organic matter in landfills,
wastewater treatment processes and combustion of residual waste in energy-from-
waste plants. Sector emissions can be reduced by 75% by 2050, through greater
waste prevention, recycling, higher landfill methane capture rates, improvements
to wastewater treatment and composting facilities, and adding CCS to energy-
from-waste plants.
The evidence base on how to decarbonise the waste sector in the UK is more
limited than the evidence available for other sectors. Our analysis has relied on
data in BEIS’s Energy and Emissions Projections pathways, Ricardo’s MELMod landfill
model, research by WRAP and Water UK, as well as internal analysis starting from
and accelerating English and Devolved Administration announced policies. Further
details are given in the Methodology Report.
This section is split into three sub-sections:
a) The Balanced Net Zero Pathway for waste
b) Alternative pathways for waste emissions
c) Investment requirements and costs
a) The Balanced Net Zero Pathway for waste
Our Balanced Net Zero Pathway sees waste sector emissions fall 75% from today’s
levels to reach 7.8 MtCO2e/year by 2050. Around 80% of the abatement to 2035 is
from waste prevention, increased recycling and banning biodegradable waste
from landfill. By 2050, 30% of sector abatement comes from retrofitting CCS to the
UK’s fleet of energy-from-waste facilities. The additional 10% of emissions reductions
comes from capturing more methane at landfills, reducing wastewater treatment
emissions and improving composting (Figure 3.9.a).
• Waste prevention, recycling and landfill bans. Edible food waste is reduced
by just over 50% by 2030 (meeting UN SDG Target 12.3) and just over 60% by
2050, compared to 2007 levels. Compared to a steadily increasing
baseline, a third of non-food waste arisings are prevented by 2037 via
product redesign, light-weighting, extended lifetimes and asset sharing.
Currently around 45% of all household waste is recycled in the UK, along
with 55% of commercial & industrial waste. UK-wide recycling rates increase
to a blended 70% by 2030 (with Wales and Scotland achieving this by
2025). Anaerobic digestion and composting play an important part in
recycling food and garden wastes, helping enable a ban on all
biodegradable waste going to landfill by 2025. Landfill methane emissions
fall to 1.1 MtCO2e/year by 2050.
• Carbon capture and storage (CCS) at energy-from-waste (EfW) plants. Further growth in fossil emissions from UK energy-from-waste facilities is
avoided due to prevention and recycling efforts, with EfW emissions staying
relatively flat at 5-6 MtCO2e/year until 2040.
Generating less waste, recycling more and not sending waste that can decay to landfill are the key pillars to reducing landfill emissions.
Energy-from-waste emissions can be constrained, before all plants fit CCS in the 2040s.
Wastewater emissions are hard to abate.
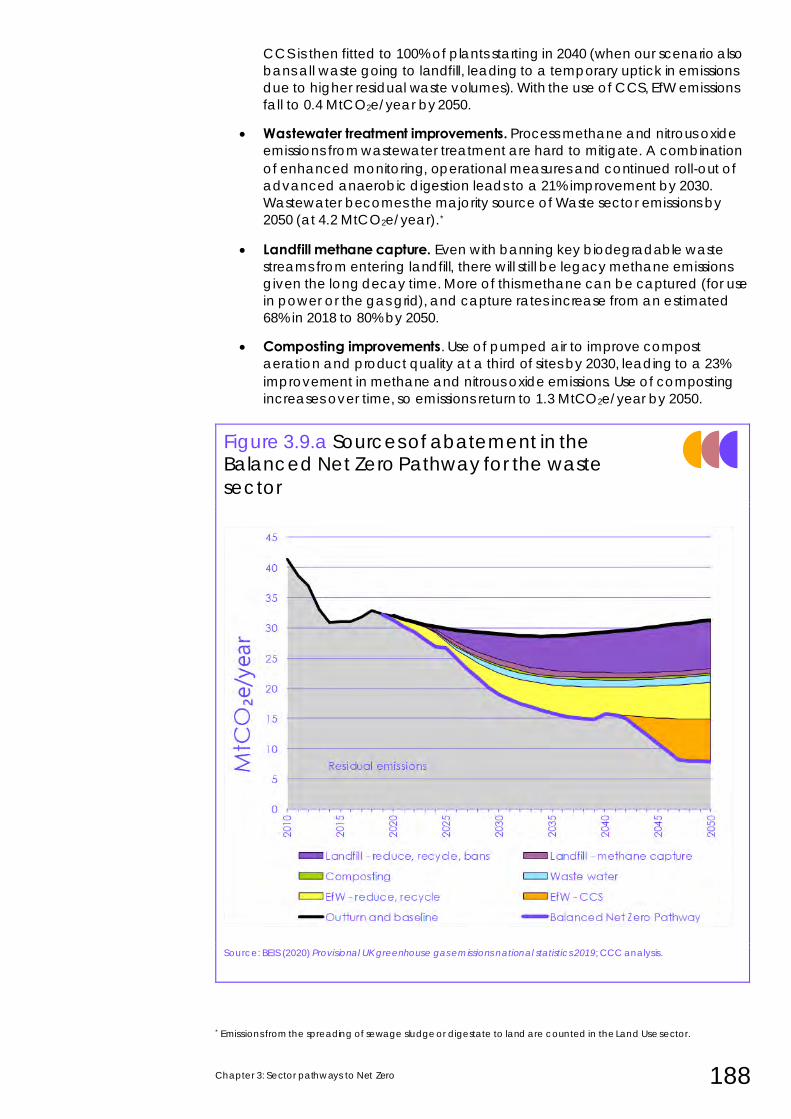
Chapter 3: Sector pathways to Net Zero 188
CCS is then fitted to 100% of plants starting in 2040 (when our scenario also
bans all waste going to landfill, leading to a temporary uptick in emissions
due to higher residual waste volumes). With the use of CCS, EfW emissions
fall to 0.4 MtCO2e/year by 2050.
• Wastewater treatment improvements. Process methane and nitrous oxide
emissions from wastewater treatment are hard to mitigate. A combination
of enhanced monitoring, operational measures and continued roll-out of
advanced anaerobic digestion leads to a 21% improvement by 2030.
Wastewater becomes the majority source of Waste sector emissions by
2050 (at 4.2 MtCO2e/year).*
• Landfill methane capture. Even with banning key biodegradable waste
streams from entering landfill, there will still be legacy methane emissions
given the long decay time. More of this methane can be captured (for use
in power or the gas grid), and capture rates increase from an estimated
68% in 2018 to 80% by 2050.
• Composting improvements. Use of pumped air to improve compost
aeration and product quality at a third of sites by 2030, leading to a 23%
improvement in methane and nitrous oxide emissions. Use of composting
increases over time, so emissions return to 1.3 MtCO2e/year by 2050.
Figure 3.9.a Sources of abatement in the Balanced Net Zero Pathway for the waste
sector
Source: BEIS (2020) Provisional UK greenhouse gas emissions national statistics 2019; CCC analysis.
* Emissions from the spreading of sewage sludge or digestate to land are counted in the Land Use sector.
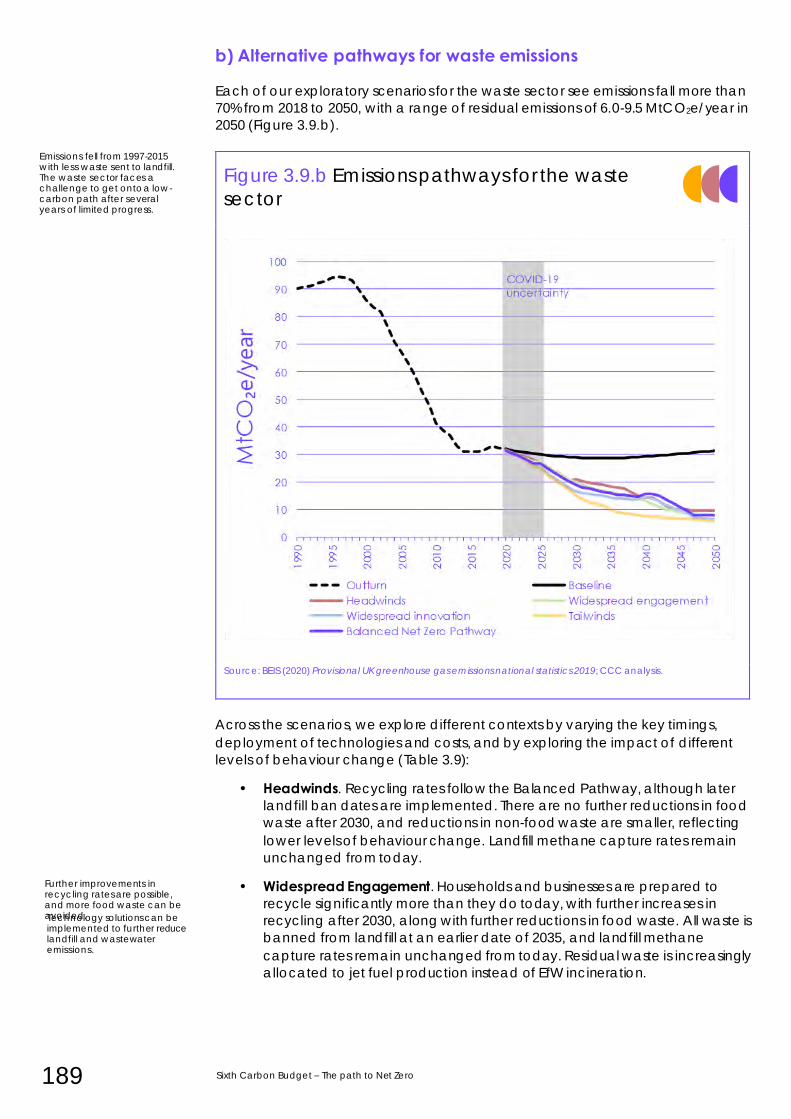
189 Sixth Carbon Budget – The path to Net Zero
b) Alternative pathways for waste emissions
Each of our exploratory scenarios for the waste sector see emissions fall more than
70% from 2018 to 2050, with a range of residual emissions of 6.0-9.5 MtCO2e/year in
2050 (Figure 3.9.b).
Figure 3.9.b Emissions pathways for the waste
sector
Source: BEIS (2020) Provisional UK greenhouse gas emissions national statistics 2019; CCC analysis.
Across the scenarios, we explore different contexts by varying the key timings,
deployment of technologies and costs, and by exploring the impact of different
levels of behaviour change (Table 3.9):
• Headwinds. Recycling rates follow the Balanced Pathway, although later
landfill ban dates are implemented. There are no further reductions in food
waste after 2030, and reductions in non-food waste are smaller, reflecting
lower levels of behaviour change. Landfill methane capture rates remain
unchanged from today.
• Widespread Engagement. Households and businesses are prepared to
recycle significantly more than they do today, with further increases in
recycling after 2030, along with further reductions in food waste. All waste is
banned from landfill at an earlier date of 2035, and landfill methane
capture rates remain unchanged from today. Residual waste is increasingly
allocated to jet fuel production instead of EfW incineration.
Further improvements in recycling rates are possible, and more food waste can be avoided.
Emissions fell from 1997-2015 with less waste sent to landfill. The waste sector faces a challenge to get onto a low-carbon path after several years of limited progress.
Technology solutions can be implemented to further reduce landfill and wastewater emissions.
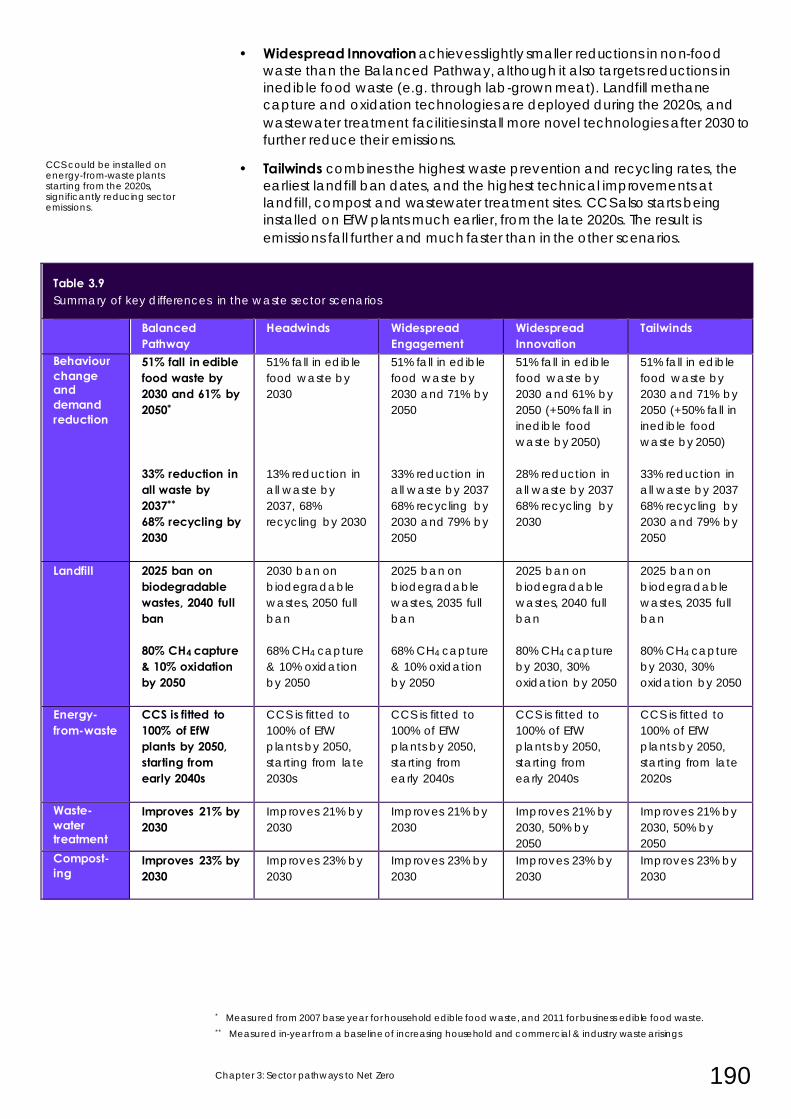
Chapter 3: Sector pathways to Net Zero 190
• Widespread Innovation achieves slightly smaller reductions in non-food
waste than the Balanced Pathway, although it also targets reductions in
inedible food waste (e.g. through lab-grown meat). Landfill methane
capture and oxidation technologies are deployed during the 2020s, and
wastewater treatment facilities install more novel technologies after 2030 to
further reduce their emissions.
• Tailwinds combines the highest waste prevention and recycling rates, the
earliest landfill ban dates, and the highest technical improvements at
landfill, compost and wastewater treatment sites. CCS also starts being
installed on EfW plants much earlier, from the late 2020s. The result is
emissions fall further and much faster than in the other scenarios.
Table 3.9 Summary of key differences in the waste sector scenarios
Balanced Pathway
Headwinds Widespread Engagement
Widespread Innovation
Tailwinds
Behaviour change and demand reduction
51% fall in edible food waste by 2030 and 61% by 2050*
33% reduction in all waste by 2037** 68% recycling by 2030
51% fall in edible
food waste by
2030
13% reduction in
all waste by
2037, 68%
recycling by 2030
51% fall in edible
food waste by
2030 and 71% by
2050
33% reduction in
all waste by 2037
68% recycling by
2030 and 79% by
2050
51% fall in edible
food waste by
2030 and 61% by
2050 (+50% fall in
inedible food
waste by 2050)
28% reduction in
all waste by 2037
68% recycling by
2030
51% fall in edible
food waste by
2030 and 71% by
2050 (+50% fall in
inedible food
waste by 2050)
33% reduction in
all waste by 2037
68% recycling by
2030 and 79% by
2050
Landfill 2025 ban on biodegradable wastes, 2040 full ban 80% CH4 capture & 10% oxidation by 2050
2030 ban on
biodegradable
wastes, 2050 full
ban
68% CH4 capture
& 10% oxidation
by 2050
2025 ban on
biodegradable
wastes, 2035 full
ban
68% CH4 capture
& 10% oxidation
by 2050
2025 ban on
biodegradable
wastes, 2040 full
ban
80% CH4 capture
by 2030, 30%
oxidation by 2050
2025 ban on
biodegradable
wastes, 2035 full
ban
80% CH4 capture
by 2030, 30%
oxidation by 2050
Energy-from-waste
CCS is fitted to 100% of EfW plants by 2050, starting from early 2040s
CCS is fitted to
100% of EfW
plants by 2050,
starting from late
2030s
CCS is fitted to
100% of EfW
plants by 2050,
starting from
early 2040s
CCS is fitted to
100% of EfW
plants by 2050,
starting from
early 2040s
CCS is fitted to
100% of EfW
plants by 2050,
starting from late
2020s
Waste-water treatment
Improves 21% by 2030
Improves 21% by
2030
Improves 21% by
2030
Improves 21% by
2030, 50% by
2050
Improves 21% by
2030, 50% by
2050
Compost-ing
Improves 23% by 2030
Improves 23% by
2030
Improves 23% by
2030
Improves 23% by
2030
Improves 23% by
2030
* Measured from 2007 base year for household edible food waste, and 2011 for business edible food waste.
** Measured in-year from a baseline of increasing household and commercial & industry waste arisings
CCS could be installed on energy-from-waste plants starting from the 2020s, significantly reducing sector emissions.
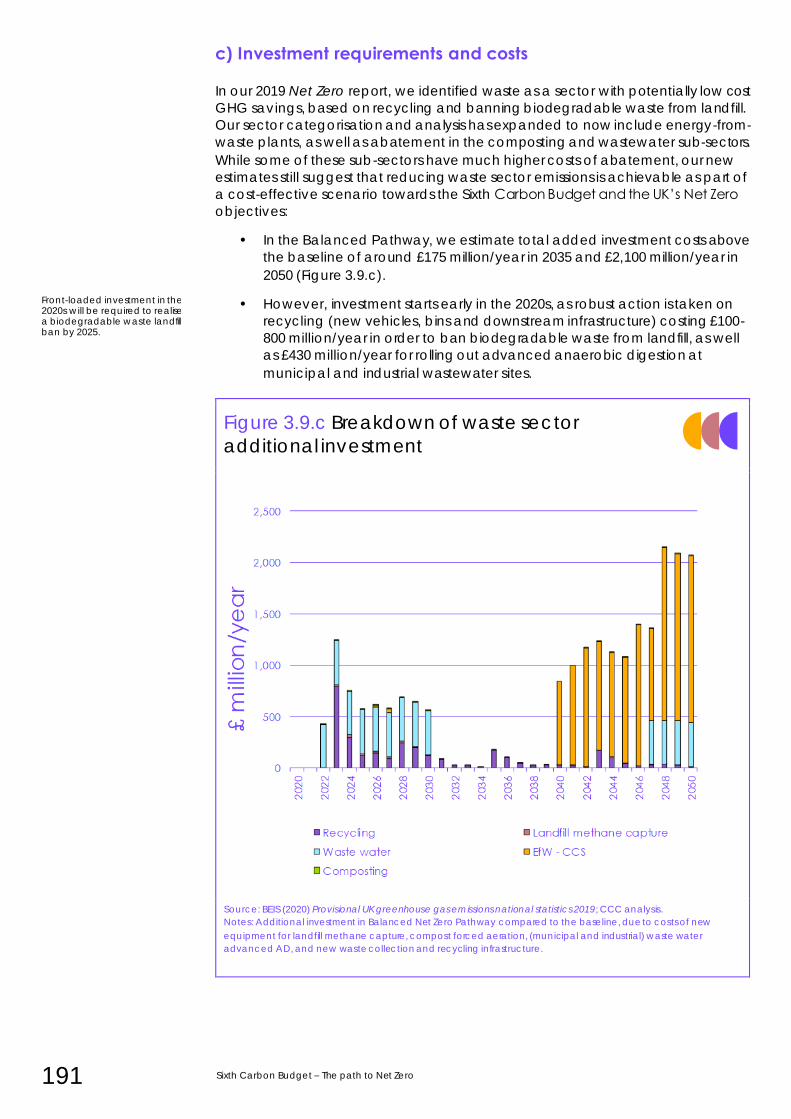
191 Sixth Carbon Budget – The path to Net Zero
c) Investment requirements and costs
In our 2019 Net Zero report, we identified waste as a sector with potentially low cost
GHG savings, based on recycling and banning biodegradable waste from landfill.
Our sector categorisation and analysis has expanded to now include energy-from-
waste plants, as well as abatement in the composting and wastewater sub-sectors.
While some of these sub-sectors have much higher costs of abatement, our new
estimates still suggest that reducing waste sector emissions is achievable as part of
a cost-effective scenario towards the Sixth Carbon Budget and the UK’s Net Zero
objectives:
• In the Balanced Pathway, we estimate total added investment costs above
the baseline of around £175 million/year in 2035 and £2,100 million/year in
2050 (Figure 3.9.c).
• However, investment starts early in the 2020s, as robust action is taken on
recycling (new vehicles, bins and downstream infrastructure) costing £100-
800 million/year in order to ban biodegradable waste from landfill, as well
as £430 million/year for rolling out advanced anaerobic digestion at
municipal and industrial wastewater sites.
Figure 3.9.c Breakdown of waste sector
additional investment
Source: BEIS (2020) Provisional UK greenhouse gas emissions national statistics 2019; CCC analysis.
Notes: Additional investment in Balanced Net Zero Pathway compared to the baseline, due to costs of new
equipment for landfill methane capture, compost forced aeration, (municipal and industrial) waste water
advanced AD, and new waste collection and recycling infrastructure.
Front-loaded investment in the 2020s will be required to realise a biodegradable waste landfill ban by 2025.
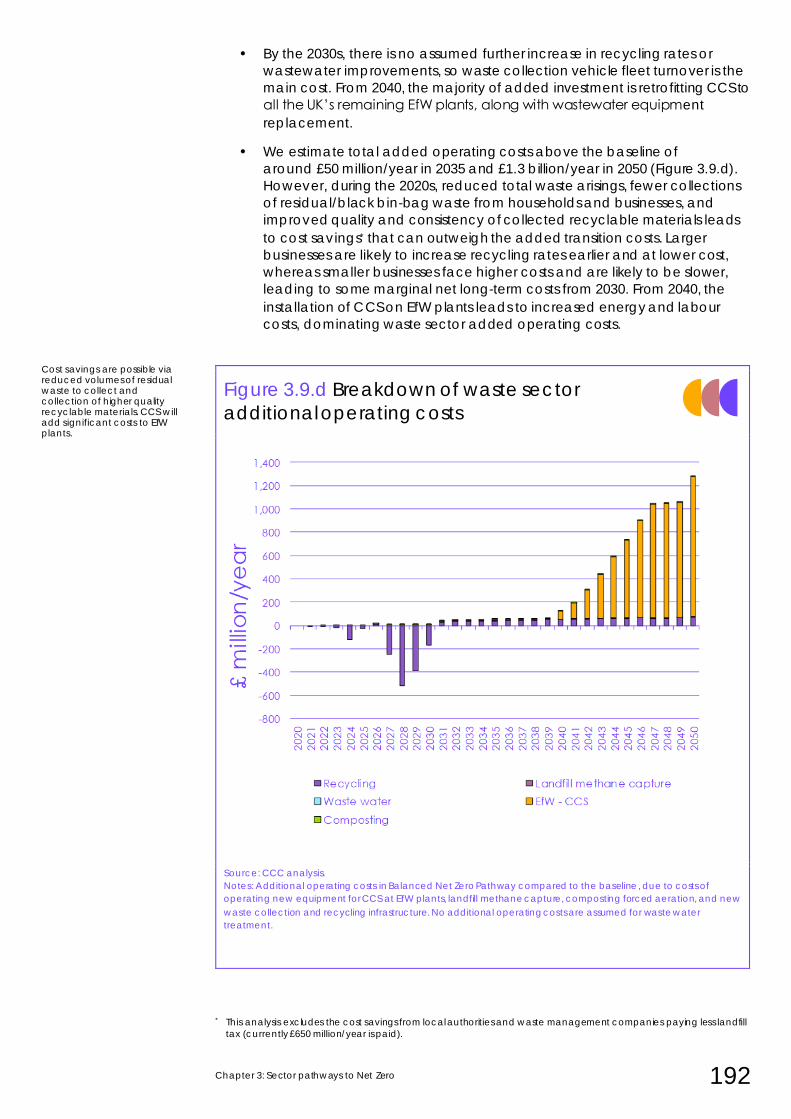
Chapter 3: Sector pathways to Net Zero 192
• By the 2030s, there is no assumed further increase in recycling rates or
wastewater improvements, so waste collection vehicle fleet turnover is the
main cost. From 2040, the majority of added investment is retrofitting CCS to
all the UK’s remaining EfW plants, along with wastewater equipment
replacement.
• We estimate total added operating costs above the baseline of
around £50 million/year in 2035 and £1.3 billion/year in 2050 (Figure 3.9.d).
However, during the 2020s, reduced total waste arisings, fewer collections
of residual/black bin-bag waste from households and businesses, and
improved quality and consistency of collected recyclable materials leads
to cost savings* that can outweigh the added transition costs. Larger
businesses are likely to increase recycling rates earlier and at lower cost,
whereas smaller businesses face higher costs and are likely to be slower,
leading to some marginal net long-term costs from 2030. From 2040, the
installation of CCS on EfW plants leads to increased energy and labour
costs, dominating waste sector added operating costs.
Figure 3.9.d Breakdown of waste sector
additional operating costs
Source: CCC analysis.
Notes: Additional operating costs in Balanced Net Zero Pathway compared to the baseline, due to costs of
operating new equipment for CCS at EfW plants, landfill methane capture, composting forced aeration, and new
waste collection and recycling infrastructure. No additional operating costs are assumed for waste water
treatment.
* This analysis excludes the cost savings from local authorities and waste management companies paying less landfill
tax (currently £650 million/year is paid).
Cost savings are possible via reduced volumes of residual waste to collect and collection of higher quality recyclable materials. CCS will add significant costs to EfW plants.
193 Sixth Carbon Budget – The path to Net Zero
• For comparison, baseline costs (investment plus operations combined) are
estimated at approximately £8.6 billion/year for solid waste handling across
the UK, so the added costs of recycling and banning biodegradable waste
from landfill are estimated at under 10%. The added investment in
municipal wastewater treatment (excluding industrial wastewater) would
add £4 a year to each UK household water bill during the 2020s.
• Reducing emissions from UK waste comes at an average cost of around
£70/tCO2e, although there is significant variation between sub-sectors, with
wastewater abatement having very high costs compared to low cost
methane capture and composting improvements.
• Reducing waste emissions will also produce benefits with improved air, soil
and water quality, and recreational benefits from faster return of landfill
sites to other uses. Lower landfill methane generation results in less methane
captured for energy generation, although this decline is compensated for
via increased use of anaerobic digestion for food wastes, sewage sludge
and animal manures.
Chapter 3: Sector pathways to Net Zero 194
10. F-gases
Introduction and key messages
Fluorinated gases (F-gas) are man-made gases that can stay in the atmosphere for
centuries. Their emissions account for around 3% of total UK GHG emissions. Major
emissions sources are refrigerants, aerosols, solvents, insulating gases, or blowing
agents for foams and medical equipment. They can also arise as fugitive emissions
from other manufacturing processes. Most of the emissions reduction to 2050 will
be driven via F-Gas regulations, with further abatement possible through a faster
shift to lower Global Warming Potential (GWP) F-gases, behavioural shifts to Dry
Powder Inhalers (DPI) and reduced leakage.
The evidence base on how to decarbonise F-gases builds on our 2019 Net Zero
report, and in particular a 2019 report commissioned by the CCC from Ricardo and
Gluckman Consulting on decarbonising the F-gases sector.
This section is split into three sub-sections:
a) The Balanced Net Zero pathway for F-gases
b) Alternative routes to delivering abatement in the mid-2030s
c) Impacts of the scenarios: costs, benefits and co-impacts on society
a) The Balanced Net Zero pathway for F-gases
F-gas emission levels were 15 MtCO2e in 2018, accounting for 3% of total UK GHG
emissions (Figure 3.10). Emissions were 14% below 1990 levels and 40% below the
peak in 1997.
Approximately 95% of F-gas emissions are hydrofluorocarbons (HFCs) which are
emitted from the production, use and manufacture of refrigeration and air-
conditioning equipment; aerosols; foams; metered-dose inhalers; and fire
equipment. Sulphur hexafluoride (SF6), perfluorocarbons (PFCs), and NF3 comprise
the remaining percentage and are released in various industrial processes and
from electrical insulation.
F-gases are emitted in small volumes but have a high global warming potentials
(GWPs)* and can be several thousand times more warming than CO2 (GWP = 1):
• HFCs have GWPs ranging from approximately 100 to over 10,000
• SF6 has a GWP of 26,087
• PFCs have GWPs of approximately 7,000 to approximately 19,000
• NF3 has a GWP of 16,100. These emissions are very low (less than 0.001
MtCO2e) and do not count towards the UK’s climate targets.
Our pathways start from an existing policy baseline where the UK maintains
comparable legislation to the EU F-Gas Regulation that was introduced in 2014.
* Values given are AR5 GWPs with carbon-cycle feedbacks.
There is strong existing regulation for the F-gases sector.
The majority of F-gases emissions come from HFCs used in refrigeration and air-conditioning.
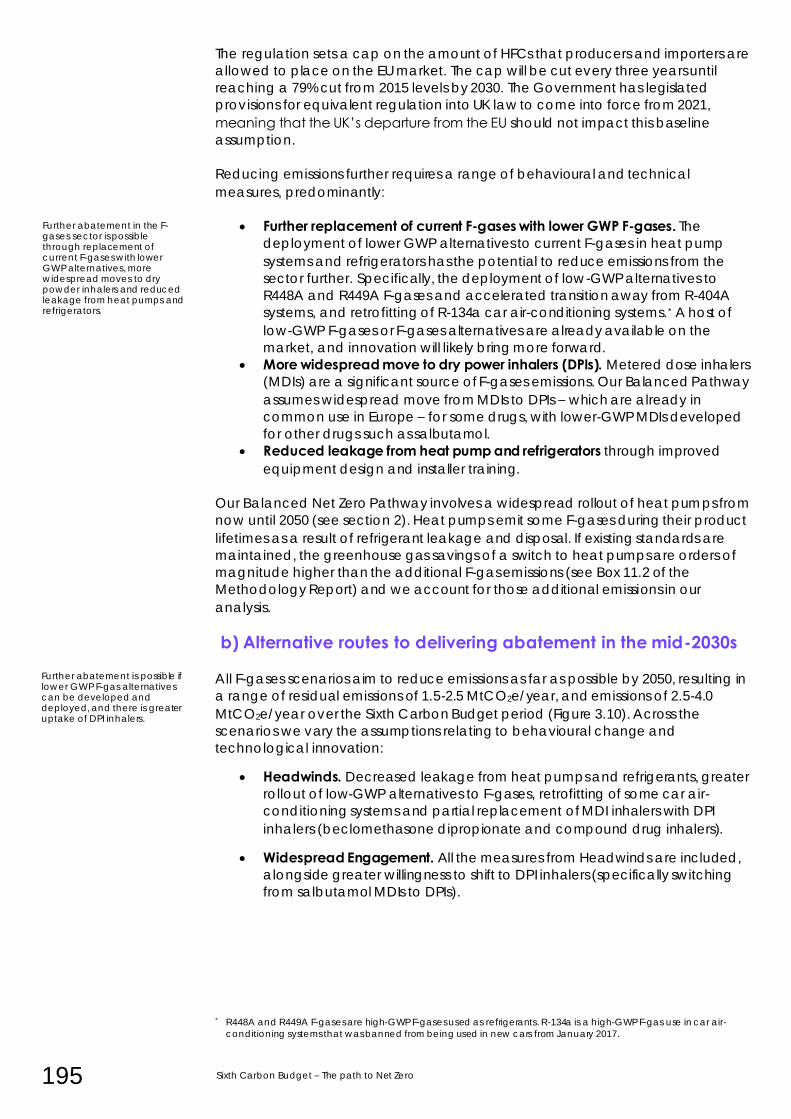
195 Sixth Carbon Budget – The path to Net Zero
The regulation sets a cap on the amount of HFCs that producers and importers are
allowed to place on the EU market. The cap will be cut every three years until
reaching a 79% cut from 2015 levels by 2030. The Government has legislated
provisions for equivalent regulation into UK law to come into force from 2021,
meaning that the UK’s departure from the EU should not impact this baseline
assumption.
Reducing emissions further requires a range of behavioural and technical
measures, predominantly:
• Further replacement of current F-gases with lower GWP F-gases. The
deployment of lower GWP alternatives to current F-gases in heat pump
systems and refrigerators has the potential to reduce emissions from the
sector further. Specifically, the deployment of low-GWP alternatives to
R448A and R449A F-gases and accelerated transition away from R-404A
systems, and retrofitting of R-134a car air-conditioning systems.* A host of
low-GWP F-gases or F-gases alternatives are already available on the
market, and innovation will likely bring more forward.
• More widespread move to dry power inhalers (DPIs). Metered dose inhalers
(MDIs) are a significant source of F-gases emissions. Our Balanced Pathway
assumes widespread move from MDIs to DPIs – which are already in
common use in Europe – for some drugs, with lower-GWP MDIs developed
for other drugs such as salbutamol. • Reduced leakage from heat pump and refrigerators through improved
equipment design and installer training.
Our Balanced Net Zero Pathway involves a widespread rollout of heat pumps from
now until 2050 (see section 2). Heat pumps emit some F-gases during their product
lifetimes as a result of refrigerant leakage and disposal. If existing standards are
maintained, the greenhouse gas savings of a switch to heat pumps are orders of
magnitude higher than the additional F-gas emissions (see Box 11.2 of the
Methodology Report) and we account for those additional emissions in our
analysis.
b) Alternative routes to delivering abatement in the mid-2030s
All F-gases scenarios aim to reduce emissions as far as possible by 2050, resulting in
a range of residual emissions of 1.5-2.5 MtCO2e/year, and emissions of 2.5-4.0
MtCO2e/year over the Sixth Carbon Budget period (Figure 3.10). Across the
scenarios we vary the assumptions relating to behavioural change and
technological innovation:
• Headwinds. Decreased leakage from heat pumps and refrigerants, greater
rollout of low-GWP alternatives to F-gases, retrofitting of some car air-
conditioning systems and partial replacement of MDI inhalers with DPI
inhalers (beclomethasone dipropionate and compound drug inhalers).
• Widespread Engagement. All the measures from Headwinds are included,
alongside greater willingness to shift to DPI inhalers (specifically switching
from salbutamol MDIs to DPIs).
* R448A and R449A F-gases are high-GWP F-gases used as refrigerants. R-134a is a high-GWP F-gas use in car air-
conditioning systems that was banned from being used in new cars from January 2017.
Further abatement in the F-gases sector is possible through replacement of current F-gases with lower GWP alternatives, more widespread moves to dry powder inhalers and reduced leakage from heat pumps and refrigerators.
Further abatement is possible if lower GWP F-gas alternatives can be developed and deployed, and there is greater uptake of DPI inhalers.
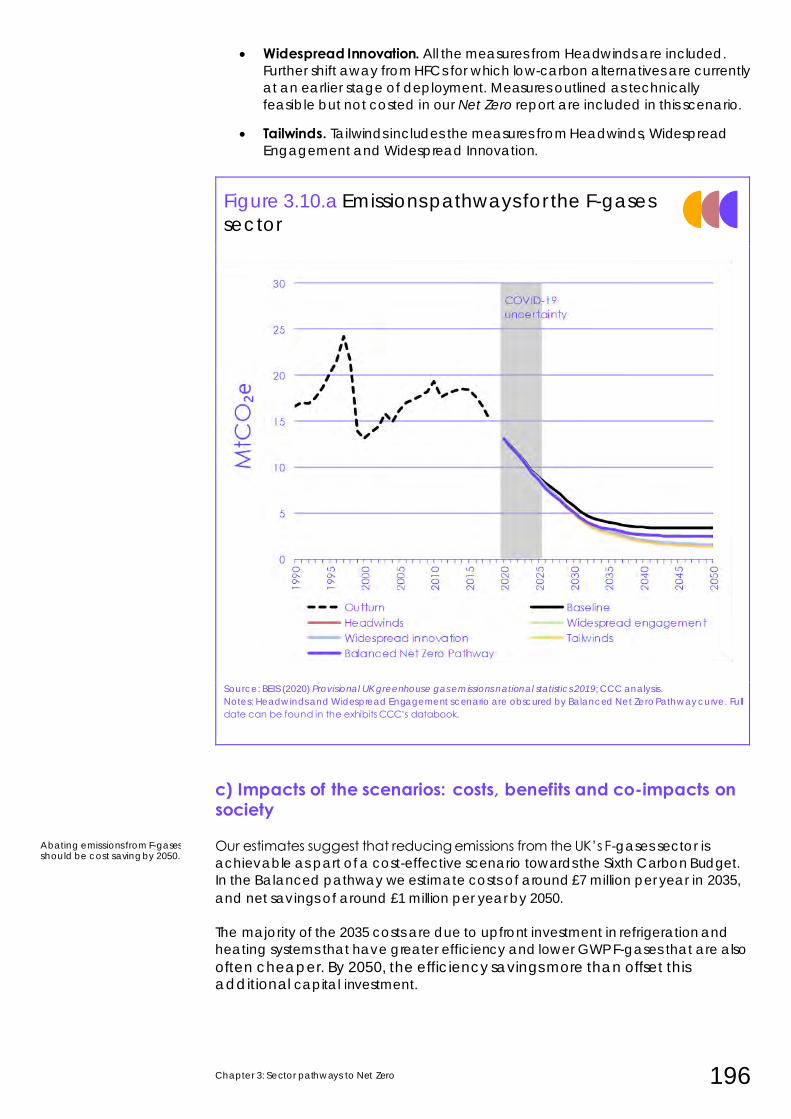
Chapter 3: Sector pathways to Net Zero 196
• Widespread Innovation. All the measures from Headwinds are included.
Further shift away from HFCs for which low-carbon alternatives are currently
at an earlier stage of deployment. Measures outlined as technically
feasible but not costed in our Net Zero report are included in this scenario.
• Tailwinds. Tailwinds includes the measures from Headwinds, Widespread
Engagement and Widespread Innovation.
Figure 3.10.a Emissions pathways for the F-gases
sector
Source: BEIS (2020) Provisional UK greenhouse gas emissions national statistics 2019; CCC analysis.
Notes: Headwinds and Widespread Engagement scenario are obscured by Balanced Net Zero Pathway curve. Full
date can be found in the exhibits CCC’s databook.
c) Impacts of the scenarios: costs, benefits and co-impacts on society
Our estimates suggest that reducing emissions from the UK’s F-gases sector is
achievable as part of a cost-effective scenario towards the Sixth Carbon Budget.
In the Balanced pathway we estimate costs of around £7 million per year in 2035,
and net savings of around £1 million per year by 2050.
The majority of the 2035 costs are due to upfront investment in refrigeration and
heating systems that have greater efficiency and lower GWP F-gases that are also
often cheaper. By 2050, the efficiency savings more than offset this additional capital investment.
Abating emissions from F-gases should be cost saving by 2050.
197 Sixth Carbon Budget – The path to Net Zero
11. Greenhouse gas removals
Introduction and key messages
Engineered greenhouse gas removals, such as Bioenergy with carbon capture and
storage (BECCS), Direct Air Capture of CO2 with storage (DACCS) and increased
use of Wood in Construction will be required to permanently remove carbon from
the atmosphere, in order to offset remaining residual emissions in the UK and
achieve Net Zero by 2050. As set out in Chapter 1, our scenarios aim to reduce
emissions where decarbonisation solutions exist, and minimise the need for
removals.
The evidence base used for our analysis on GHG removals is largely that compiled
for the Committee’s 2019 Net Zero report, but is supplemented by new data on
costs and efficiencies for DACCS from The Royal Society and International Energy
Agency (IEA), and updated BECCS data from the Energy System Catapult’s ESME
model and bespoke analysis for industrial and energy-from-waste plants.
Evidence on the potential supply of sustainable low-carbon bioenergy is drawn
from our detailed work in the 2018 Bioenergy in a low-carbon economy report, as
detailed in the accompanying Methodology report, Chapter 6.
This section is split into three sub-sections:
a) The Balanced Net Zero Pathway for GHG Removals
b) Alternative routes to delivering abatement in the mid-2030s
c) Investment requirements and costs
a) The Balanced Net Zero Pathway for GHG removals
In the Balanced Net Zero Pathway we estimate that engineered emissions
removals of 58 MtCO2/year are required in 2050 (Figure 3.11.a), in addition to
nature-based sinks of 39 MtCO2/year from UK land (covered in section 6).
Engineered greenhouse gas removals are a group of technologies (also known as
‘GGRs’ or ‘negative emissions technologies’) that can remove carbon from the
atmosphere.* BECCS and DACCS are not currently operating at scale in the UK,
although there are demonstration plants operating globally and larger
commercial projects proposed. Biogenic CO2 is already captured at commercial
scale from bioethanol and anaerobic digestion plants, although it is typically used
(e.g. for drinks manufacture and horticulture) rather than sequestered.
In constructing the Balanced Pathway, we have taken into account the time
needed to scale-up BECCS and its supply chains starting in the late 2020s, the
need to demonstrate DACCS in the 2020s for scale-up late in the 2030s, and the
new-build market potential for wood in construction.
* The use of engineered removals raises concerns around sustainability, particularly around the large-scale use of
bioenergy, and the potential moral hazard of reduced mitigation efforts. For discussion of these issues, see CCC
(2019) Net Zero Technical Report (Chapter 10), and CCC (2018) Bioenergy in a low-carbon economy.
Engineered GHG removal are not yet available at scale, but progress is being made globally.
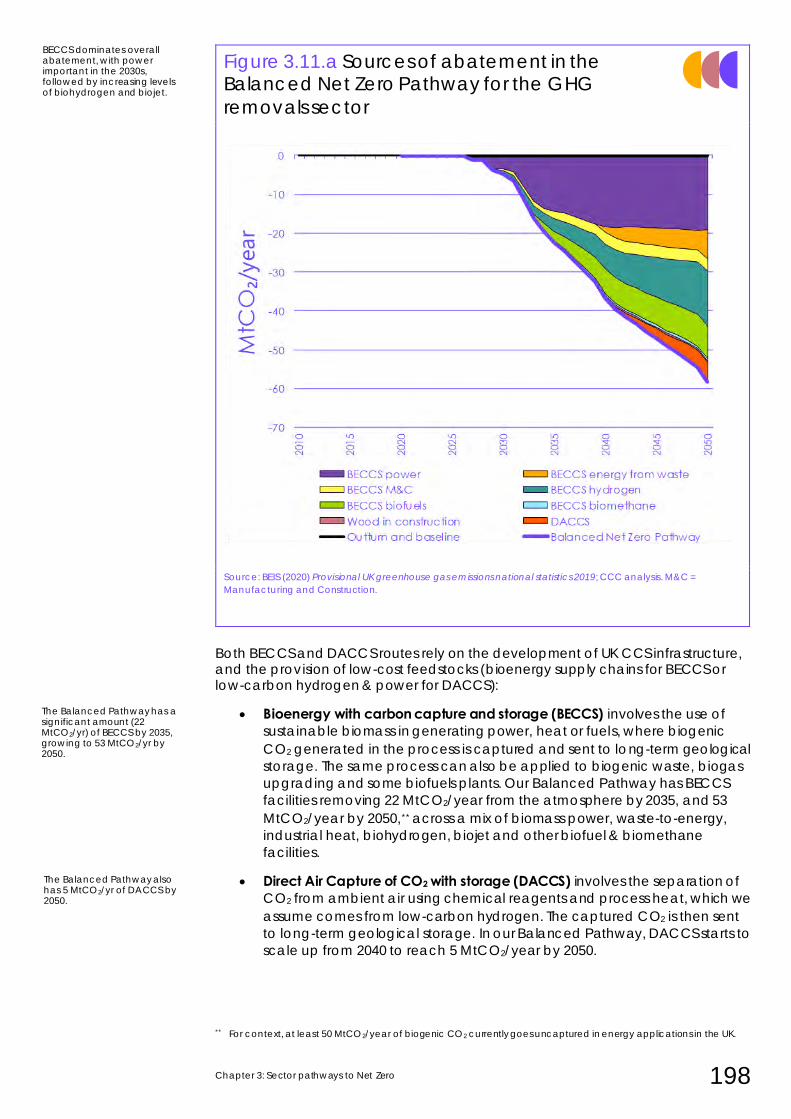
Chapter 3: Sector pathways to Net Zero 198
Figure 3.11.a Sources of abatement in the Balanced Net Zero Pathway for the GHG
removals sector
Source: BEIS (2020) Provisional UK greenhouse gas emissions national statistics 2019; CCC analysis. M&C =
Manufacturing and Construction.
Both BECCS and DACCS routes rely on the development of UK CCS infrastructure, and the provision of low-cost feedstocks (bioenergy supply chains for BECCS or low-carbon hydrogen & power for DACCS):
• Bioenergy with carbon capture and storage (BECCS) involves the use of
sustainable biomass in generating power, heat or fuels, where biogenic
CO2 generated in the process is captured and sent to long-term geological
storage. The same process can also be applied to biogenic waste, biogas
upgrading and some biofuels plants. Our Balanced Pathway has BECCS
facilities removing 22 MtCO2/year from the atmosphere by 2035, and 53
MtCO2/year by 2050,** across a mix of biomass power, waste-to-energy,
industrial heat, biohydrogen, biojet and other biofuel & biomethane
facilities.
• Direct Air Capture of CO2 with storage (DACCS) involves the separation of
CO2 from ambient air using chemical reagents and process heat, which we
assume comes from low-carbon hydrogen. The captured CO2 is then sent
to long-term geological storage. In our Balanced Pathway, DACCS starts to
scale up from 2040 to reach 5 MtCO2/year by 2050.
** For context, at least 50 MtCO2/year of biogenic CO2 currently goes uncaptured in energy applications in the UK.
The Balanced Pathway has a significant amount (22 MtCO2/yr) of BECCS by 2035, growing to 53 MtCO2/yr by 2050.
The Balanced Pathway also has 5 MtCO2/yr of DACCS by 2050.
BECCS dominates overall abatement, with power important in the 2030s, followed by increasing levels of biohydrogen and biojet.
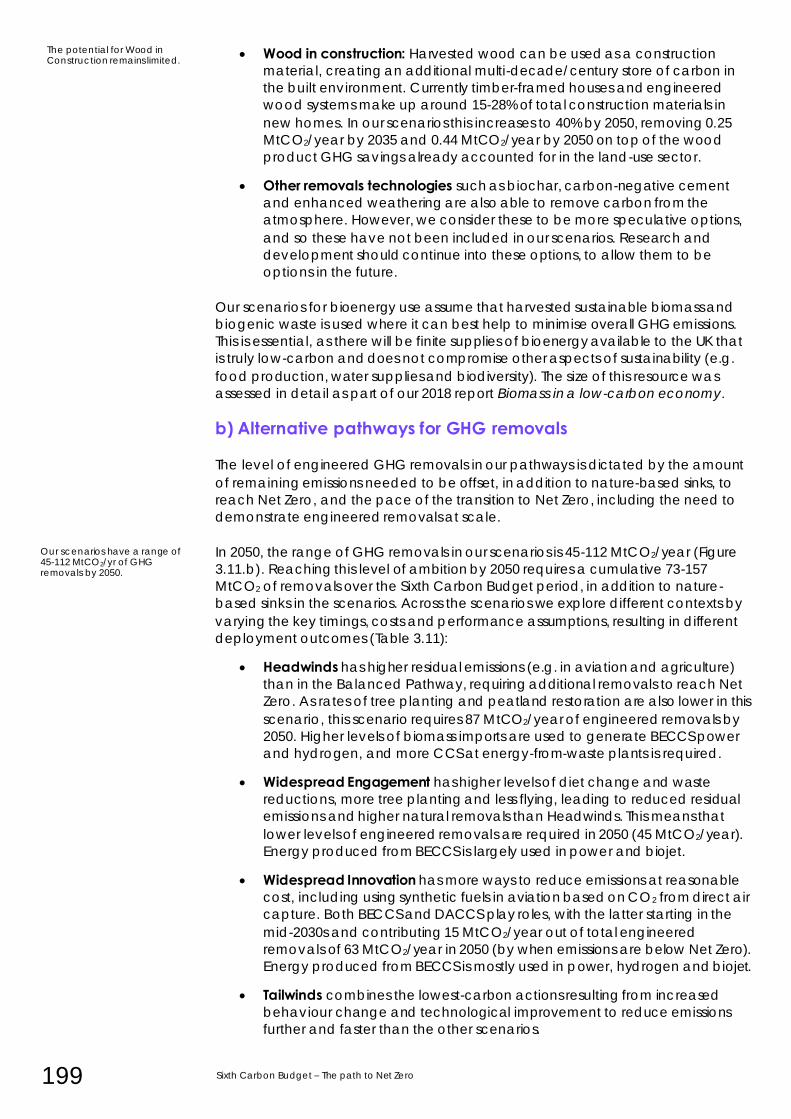
199 Sixth Carbon Budget – The path to Net Zero
• Wood in construction: Harvested wood can be used as a construction
material, creating an additional multi-decade/century store of carbon in
the built environment. Currently timber-framed houses and engineered
wood systems make up around 15-28% of total construction materials in
new homes. In our scenarios this increases to 40% by 2050, removing 0.25
MtCO2/year by 2035 and 0.44 MtCO2/year by 2050 on top of the wood
product GHG savings already accounted for in the land-use sector.
• Other removals technologies such as biochar, carbon-negative cement
and enhanced weathering are also able to remove carbon from the
atmosphere. However, we consider these to be more speculative options,
and so these have not been included in our scenarios. Research and
development should continue into these options, to allow them to be
options in the future.
Our scenarios for bioenergy use assume that harvested sustainable biomass and
biogenic waste is used where it can best help to minimise overall GHG emissions.
This is essential, as there will be finite supplies of bioenergy available to the UK that
is truly low-carbon and does not compromise other aspects of sustainability (e.g.
food production, water supplies and biodiversity). The size of this resource was
assessed in detail as part of our 2018 report Biomass in a low-carbon economy.
b) Alternative pathways for GHG removals
The level of engineered GHG removals in our pathways is dictated by the amount
of remaining emissions needed to be offset, in addition to nature-based sinks, to
reach Net Zero, and the pace of the transition to Net Zero, including the need to
demonstrate engineered removals at scale.
In 2050, the range of GHG removals in our scenarios is 45-112 MtCO2/year (Figure
3.11.b). Reaching this level of ambition by 2050 requires a cumulative 73-157
MtCO2 of removals over the Sixth Carbon Budget period, in addition to nature-
based sinks in the scenarios. Across the scenarios we explore different contexts by
varying the key timings, costs and performance assumptions, resulting in different
deployment outcomes (Table 3.11):
• Headwinds has higher residual emissions (e.g. in aviation and agriculture)
than in the Balanced Pathway, requiring additional removals to reach Net
Zero. As rates of tree planting and peatland restoration are also lower in this
scenario, this scenario requires 87 MtCO2/year of engineered removals by
2050. Higher levels of biomass imports are used to generate BECCS power
and hydrogen, and more CCS at energy-from-waste plants is required.
• Widespread Engagement has higher levels of diet change and waste
reductions, more tree planting and less flying, leading to reduced residual
emissions and higher natural removals than Headwinds. This means that
lower levels of engineered removals are required in 2050 (45 MtCO2/year).
Energy produced from BECCS is largely used in power and biojet.
• Widespread Innovation has more ways to reduce emissions at reasonable
cost, including using synthetic fuels in aviation based on CO2 from direct air
capture. Both BECCS and DACCS play roles, with the latter starting in the
mid-2030s and contributing 15 MtCO2/year out of total engineered
removals of 63 MtCO2/year in 2050 (by when emissions are below Net Zero).
Energy produced from BECCS is mostly used in power, hydrogen and biojet.
• Tailwinds combines the lowest-carbon actions resulting from increased
behaviour change and technological improvement to reduce emissions
further and faster than the other scenarios.
The potential for Wood in Construction remains limited.
Our scenarios have a range of 45-112 MtCO2/yr of GHG removals by 2050.
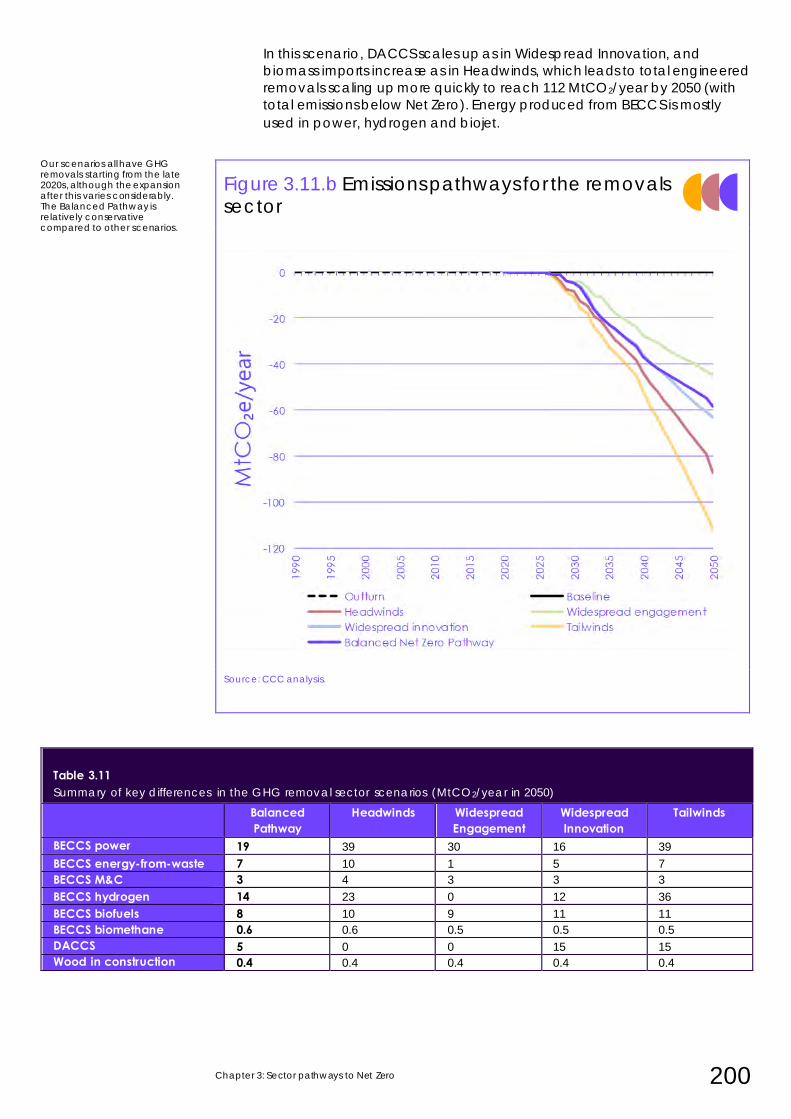
Chapter 3: Sector pathways to Net Zero 200
In this scenario, DACCS scales up as in Widespread Innovation, and
biomass imports increase as in Headwinds, which leads to total engineered
removals scaling up more quickly to reach 112 MtCO2/year by 2050 (with
total emissions below Net Zero). Energy produced from BECCS is mostly
used in power, hydrogen and biojet.
Figure 3.11.b Emissions pathways for the removals sector
Source: CCC analysis.
Table 1.11:Table 1.11 Table 3.11 Summary of key differences in the GHG removal sector scenarios (MtCO2/year in 2050)
Balanced Pathway
Headwinds Widespread Engagement
Widespread Innovation
Tailwinds
BECCS power 19 39 30 16 39
BECCS energy-from-waste 7 10 1 5 7
BECCS M&C 3 4 3 3 3
BECCS hydrogen 14 23 0 12 36
BECCS biofuels 8 10 9 11 11
BECCS biomethane 0.6 0.6 0.5 0.5 0.5
DACCS 5 0 0 15 15
Wood in construction 0.4 0.4 0.4 0.4 0.4
Our scenarios all have GHG removals starting from the late 2020s, although the expansion after this varies considerably. The Balanced Pathway is relatively conservative compared to other scenarios.
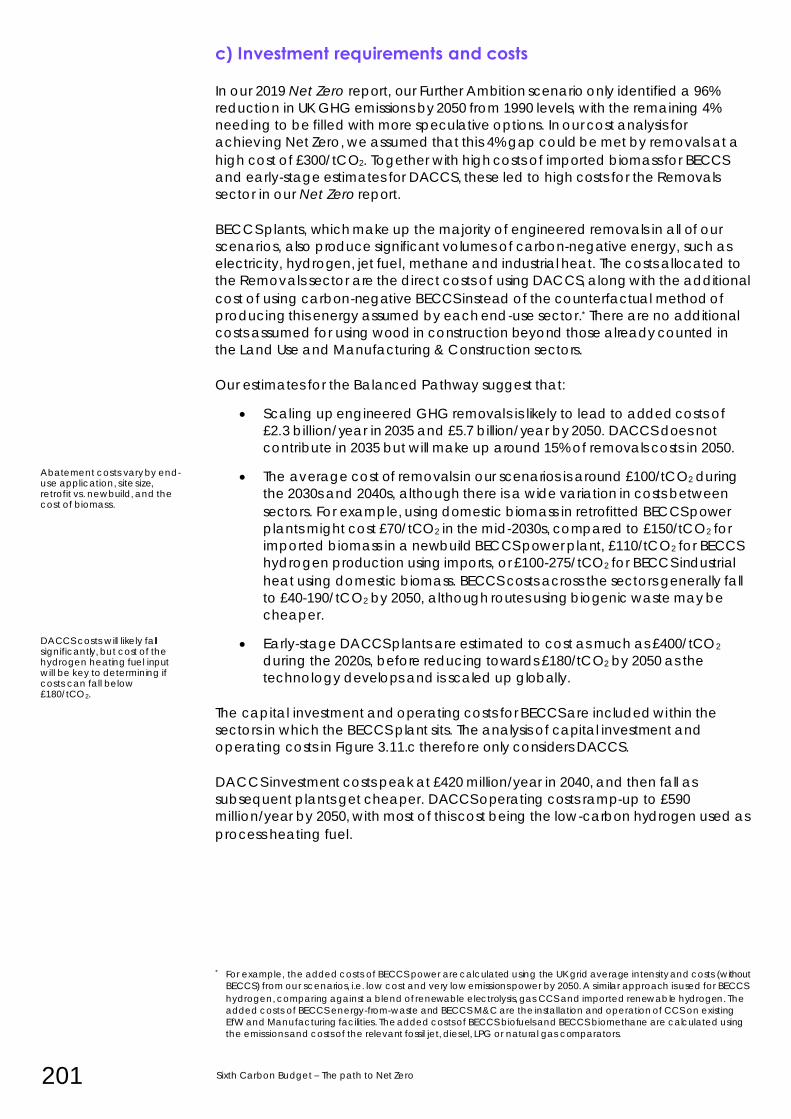
201 Sixth Carbon Budget – The path to Net Zero
c) Investment requirements and costs
In our 2019 Net Zero report, our Further Ambition scenario only identified a 96%
reduction in UK GHG emissions by 2050 from 1990 levels, with the remaining 4%
needing to be filled with more speculative options. In our cost analysis for
achieving Net Zero, we assumed that this 4% gap could be met by removals at a
high cost of £300/tCO2. Together with high costs of imported biomass for BECCS
and early-stage estimates for DACCS, these led to high costs for the Removals
sector in our Net Zero report.
BECCS plants, which make up the majority of engineered removals in all of our
scenarios, also produce significant volumes of carbon-negative energy, such as
electricity, hydrogen, jet fuel, methane and industrial heat. The costs allocated to
the Removals sector are the direct costs of using DACCS, along with the additional
cost of using carbon-negative BECCS instead of the counterfactual method of
producing this energy assumed by each end-use sector.* There are no additional
costs assumed for using wood in construction beyond those already counted in
the Land Use and Manufacturing & Construction sectors.
Our estimates for the Balanced Pathway suggest that:
• Scaling up engineered GHG removals is likely to lead to added costs of
£2.3 billion/year in 2035 and £5.7 billion/year by 2050. DACCS does not
contribute in 2035 but will make up around 15% of removals costs in 2050.
• The average cost of removals in our scenarios is around £100/tCO2 during
the 2030s and 2040s, although there is a wide variation in costs between
sectors. For example, using domestic biomass in retrofitted BECCS power
plants might cost £70/tCO2 in the mid-2030s, compared to £150/tCO2 for
imported biomass in a newbuild BECCS power plant, £110/tCO2 for BECCS
hydrogen production using imports, or £100-275/tCO2 for BECCS industrial
heat using domestic biomass. BECCS costs across the sectors generally fall
to £40-190/tCO2 by 2050, although routes using biogenic waste may be
cheaper.
• Early-stage DACCS plants are estimated to cost as much as £400/tCO2
during the 2020s, before reducing towards £180/tCO2 by 2050 as the
technology develops and is scaled up globally.
The capital investment and operating costs for BECCS are included within the
sectors in which the BECCS plant sits. The analysis of capital investment and
operating costs in Figure 3.11.c therefore only considers DACCS.
DACCS investment costs peak at £420 million/year in 2040, and then fall as
subsequent plants get cheaper. DACCS operating costs ramp-up to £590
million/year by 2050, with most of this cost being the low-carbon hydrogen used as
process heating fuel.
* For example, the added costs of BECCS power are calculated using the UK grid average intensity and costs (without
BECCS) from our scenarios, i.e. low cost and very low emissions power by 2050. A similar approach is used for BECCS
hydrogen, comparing against a blend of renewable electrolysis, gas CCS and imported renewable hydrogen. The
added costs of BECCS energy-from-waste and BECCS M&C are the installation and operation of CCS on existing
EfW and Manufacturing facilities. The added costs of BECCS biofuels and BECCS biomethane are calculated using
the emissions and costs of the relevant fossil jet, diesel, LPG or natural gas comparators.
Abatement costs vary by end-use application, site size, retrofit vs. newbuild, and the cost of biomass.
DACCS costs will likely fall significantly, but cost of the hydrogen heating fuel input will be key to determining if costs can fall below £180/tCO2.
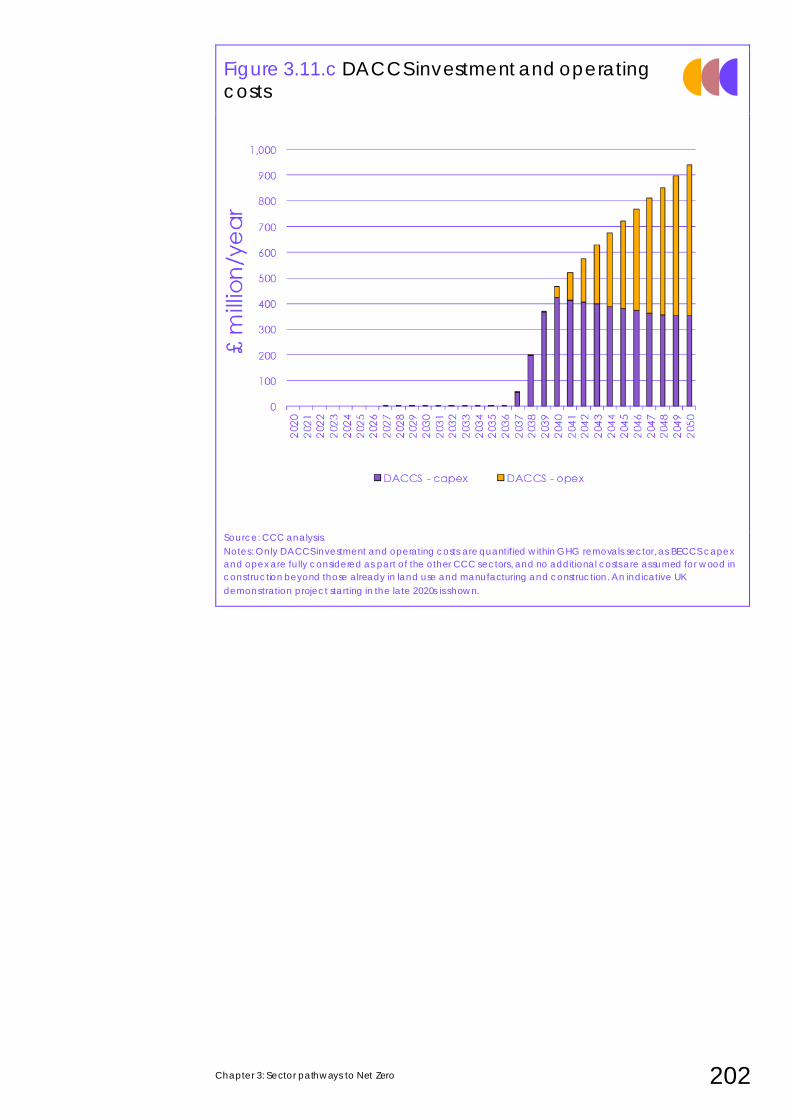
Chapter 3: Sector pathways to Net Zero 202
Figure 3.11.c DACCS investment and operating costs
Source: CCC analysis.
Notes: Only DACCS investment and operating costs are quantified within GHG removals sector, as BECCS capex
and opex are fully considered as part of the other CCC sectors, and no additional costs are assumed for wood in
construction beyond those already in land use and manufacturing and construction. An indicative UK
demonstration project starting in the late 2020s is shown.
203 Sixth Carbon Budget – The path to Net Zero
1 Element Energy for the CCC (2020), Analysis to provide costs, efficiencies and roll-out trajectories
for zero-emission HGVs, buses and coaches.
2 Department for Transport (2019) Road traffic estimates: Great Britain 2019.
3 Centre for Sustainable Road Freight for the CCC (2015) An assessment of the potential for
demand-side fuel savings in the Heavy Goods Vehicle (HGV) sector.
4 For further discussion see The Carbon Trust and Rawlings Support Services for BEIS (2016) Evidence
Gathering – Low Carbon Heating Technologies and Delta EE for BEIS (2018) Technical feasibility
of electric heating in rural off-gas grid dwellings.
5 Government response to BEIS Select Committee’s recommendations.
6 Nicol S. et al. (2015), The cost of poor housing to the NHS. 7 Gersen, S. Darmeveil, H. Van Essen, M. Martinus, G.H. and Teerlingc, O.J (2020) Domestic
hydrogen boilers in practice: enabling the use of hydrogen in the built environment. These
findings are supported by testing currently being undertaken by Worcester Bosch.
8 Element Energy for the CCC (2020) Development of trajectories for residential heat
decarbonisation to inform the sixth carbon budget
9 UCL (2020) Analysis work to refine fabric energy efficiency assumptions for use in developing the
sixth carbon budget; Currie & Brown (2019) The costs and benefits of tighter standards for new
buildings; Element Energy for the CCC (2020) Development of trajectories for residential heat
decarbonisation to inform the sixth carbon budget.
10 Jacobs (2020) Strategy for Long-Term Energy Storage in the UK
11 Ofgem https://www.ofgem.gov.uk/electricity/transmission-networks/electricity-interconnectors
12 Air Quality Expert Group (2020) Impacts of Net Zero pathways on future air quality in the UK 13 Policy Exchange (2020) The Future of the North Sea
14 CCC (2018) Hydrogen in a low-carbon economy
1515 CCC (2020) Land Use – Policies for a Net Zero UK; CCC (2019) Net Zero – Technical Report
16 Centre for Ecology and Hydrology (2020) Updated quantification of the impact of future land
use scenarios to 2050 and beyond.
17 Scottish Rural College (2020) Non-CO2 abatement in the UK agricultural sector by 2035 and
2050.
18 Climate Assembly UK (2020) The path to net zero. 19 ADAS (2016) Refining estimates of land for bioenergy.
20 Vivid (2020) Economic impacts of Net Zero land use scenarios.
Chapter 4: Scotland, Wales and Northern Ireland’s contribution to Net Zero 204
Scotland, Wales and Northern
Ireland’s contribution to Net Zero
1. Opportunities to reduce emissions 208
2. Pathways for Scottish, Welsh and Northern Irish emissions 216
3. Implications for targets 228
4. Costs and benefits in Scotland, Wales and Northern Ireland 231
5. Recommendations for policy 233
Chapter 4: Scotland, Wales and Northern Ireland’s contribution to Net Zero 206
Introduction and key messages
Scotland, Wales and Northern Ireland have an integral role to play in delivering the
UK’s Sixth Carbon Budget on the path to Net Zero. Combined, they produced 23%
of UK emissions in 2018, while accounting for 16% of the UK’s population, 13% of
economic activity and nearly half of the UK’s land area (46%) (Table 4.1).
They have fully or partially devolved powers (Table 4.5) in a number of areas
relevant to emissions reduction. Key areas of devolved responsibilities include
demand-side transport measures, energy efficiency and heat in off-gas properties,
agriculture, land use and waste, and most energy policy in Northern Ireland.
The devolved administrations can also ensure that UK policy in reserved areas (e.g.
a regulatory phase-out of petrol and diesel car sales) is delivered effectively
through the provision of additional incentives, public engagement, and supporting
policies such as planning. The UK cannot achieve its climate targets without strong
policy action across Scotland, Wales and Northern Ireland.
This chapter sets out what the different pathways for UK Net Zero mean for
emissions in Scotland, Wales and Northern Ireland, the costs of action, and high-
level policy recommendations for the devolved administrations. A full discussion of
costs and their distribution can be found in Chapter 5 and 6, and a detailed set of
policy recommendations is laid out in the Policy Report that accompanies this
report.
Scotland, Wales and Northern Ireland are at different stages of developing their
own climate legislation, targets and policy:
• Scotland has already legislated a Net Zero target for 2045 and a set of
legally binding targets between 2020 and 2045. The Scottish Government is
now preparing an update to the Climate Change Plan containing policies
and proposals to meet those targets that will be published shortly after this
report.
• The Welsh Government already has a climate legislation framework and
currently has a legal target to reduce emissions by 80% in 2050 compared
to 1990 levels. The Welsh Government is in the process of defining and
legislating new targets that are consistent with UK Net Zero by 2050. In 2019,
Wales committed to setting a 95% reduction target in 2050, with an
ambition to set a Net Zero target if possible.1
• The Northern Ireland Executive is planning to introduce new climate
change legislation as part of the New Decade, New Approach power-
sharing agreement.2
We will shortly publish two joint reports reflecting on progress towards meeting
Wales’ existing climate targets and giving new recommendations on the level of
the Wales’ third carbon budget (2026-2030) and other emissions reduction targets
including the 2050 target.
In parallel with this advice, the Committee has written to the Scottish Government
and the Northern Ireland Executive to give further advice on meeting and setting
climate targets.
Scotland, Wales and Northern Ireland have an integral role to play in delivering the UK’s emissions targets.
While some important policy levers are held in Westminster, powers are fully or partially devolved in most key areas.
We are providing separate advice to each of Wales, Scotland and Northern Ireland alongside the UK advice.
207 Sixth Carbon Budget – The path to Net Zero
Our key messages in this chapter are:
• The credibility of the Sixth Carbon Budget rests on action in all parts of the UK. 23% of the abatement in our Balanced Net Zero Pathway during the
Sixth Carbon Budget period is delivered in Scotland, Wales and Northern
Ireland.
• The technical and behavioural challenges and solutions to tackling greenhouse gas emissions are broadly similar across the UK. This does not
mean that each country will follow the exact same emissions reduction
pathway, nor does it lessen the need for policies that are tailored for
national, regional and local needs (see Local authorities and the Sixth
Carbon Budget in the Policy Report).
• Equal effort towards UK Net Zero will lead to different emissions pathways. The balance of activity across different sectors - particularly aviation,
agriculture and land use, manufacturing and construction, fuel supply and
greenhouse gas removals - means different levels of emissions reduction
are possible in different parts of the UK through the Sixth Carbon Budget
period and by 2050.
• The scale of action required in Scotland, Wales and Northern Ireland is broadly comparable to the current share of UK emissions. The costs of
decarbonisation in Scotland, Wales and Northern Ireland will likely be
shared across the whole of the UK to some degree.
• Devolved policies have a crucial role to play. 11% of all the abatement in
the UK Balanced Net Zero Pathway is in areas where some or all key powers
are reserved to the Scottish Government, Welsh Government and Northern
Ireland Executive.
• Nearly 60% all the abatement in Scotland, Wales and Northern Ireland is in sectors where key powers are partially or mostly devolved. Priority sectors
for devolved policy include agriculture and land use, buildings efficiency
and heat, demand-side transport measures and waste.
Our pathways for each part of the UK entail consistent amounts of effort, but lead to different overall reductions in emissions.
Chapter 4: Scotland, Wales and Northern Ireland’s contribution to Net Zero 208
1. Opportunities to reduce emissions
Chapter 2 of this report sets out the actions that are required for the UK to meet our
recommended Sixth Carbon Budget on the pathway to reach UK Net Zero by
2050.
All our scenarios reflect strong contributions from a set of key technologies and
behaviours. The technical and behavioural challenges and solutions to tackling
greenhouse gas emissions in the 2020s and beyond are broadly similar across the
UK:
• Consumer and business choices. Significant changes in behaviour can be
made alongside improvements to people’s lives. In some cases that means
adopting new technologies that provide the same service (e.g. electric
cars), in others it means larger changes (e.g. shifting to home-working or
walking/cycling). Particularly important in our scenarios are a continued
shift in diets away from meat products, a slow-down in growth of flying and
reductions in travel demand.
• Efficiency. Much of our use of energy, and wider resources, is currently
inefficient. By better insulating buildings, improving vehicle efficiency and
improving efficiency in industry the UK can use the energy we produce and
the resources we consume most productively.
• Electrification. Low-carbon electricity can now be produced more cheaply
than high-carbon electricity and has potential to be rolled out at a scale
many times larger than the UK’s current entire electricity demand.
• Hydrogen & CCS. Low-carbon hydrogen can be produced from electricity
or from natural gas with carbon capture and storage. Carbon capture and
storage (CCS) is used to avoid further emissions from industry, alongside a
role in permanent removal of CO2 from the atmosphere and potentially in
electricity and hydrogen production.
• Land and removals. A transformation is needed in the UK’s land. Our
scenarios involve planting of 300,000 hectares of mixed woodland by 2035
across Scotland, Wales and Northern Ireland, accelerating to 850,000
hectares by 2050. Peatlands must be restored widely and managed
sustainably. Food waste will need to be reduced and diets will need to shift
away from the most carbon-intensive products. Low-carbon farming
practices must be adopted widely, and farm productivity raised. Alongside
these nature-based removals, by 2035 the UK should be using bioenergy
with CCS to deliver engineered removals of CO2 at scale – some of which
could be located in the devolved administrations.
The key factors determining the rate at which the devolved administrations can
reduce their emissions before, during and beyond the Sixth Carbon Budget period
are: different levels of activity and emissions in each sector today; existing land
usage and opportunities for land-based removals; existing infrastructure;
opportunities to remove CO2 from the atmosphere; and existing policy.
Each part of the UK has a different starting point and set of opportunities to contribute to UK Net Zero.

209 Sixth Carbon Budget – The path to Net Zero
Table 4.1 Greenhouse gas emissions relative to population, economic activity, and land area
UK Scotland Wales Northern Ireland
GHG emissions in 2018 (MtCO2e) 539 55 42 25
Population
Population in 2018
(million) 67 5 3 2
GHG emissions per
person
(tCO2e/person)
8 10 13 13
Economic activity
GDP in 2018
(£ billion) 2,140 160 70 50
GHG emission per
GDP
(tCO2e/£)
252 340 562 505
Land area
Land area
(km2) 250,000 80,000 21,000 14,000
GHG emissions per
area
(tCO2e/km2)
2,200 700 2,000 1700
Source: ONS (2020) Population estimates for the UK, England and Wales, Scotland and Northern Ireland: mid-2019; ONS (2020) Regional economic
activity by gross domestic product, UK: 1998 to 2018; ONS (2020) The Countries of the UK; NAEI (2020) Greenhouse Gas Inventories for England, Scotland,
Wales & Northern Ireland: 1990-2018.
a) Existing levels of emissions and activity in each sector
The current sectoral shares of total emissions are different in each devolved
administration (Figure 4.1), due to different levels of activity and output in these
areas.
Higher or lower shares of current emissions and activity in each sector mean that
the pace and scale of mitigation actions - or failures to act - will have a
proportionally higher or lower impact on the economy-wide emissions pathways
for Scotland, Wales and Northern Ireland. Higher shares of emissions in sectors that
can decarbonise rapidly in the next decade will mean that economy-wide
emissions will fall more quickly.
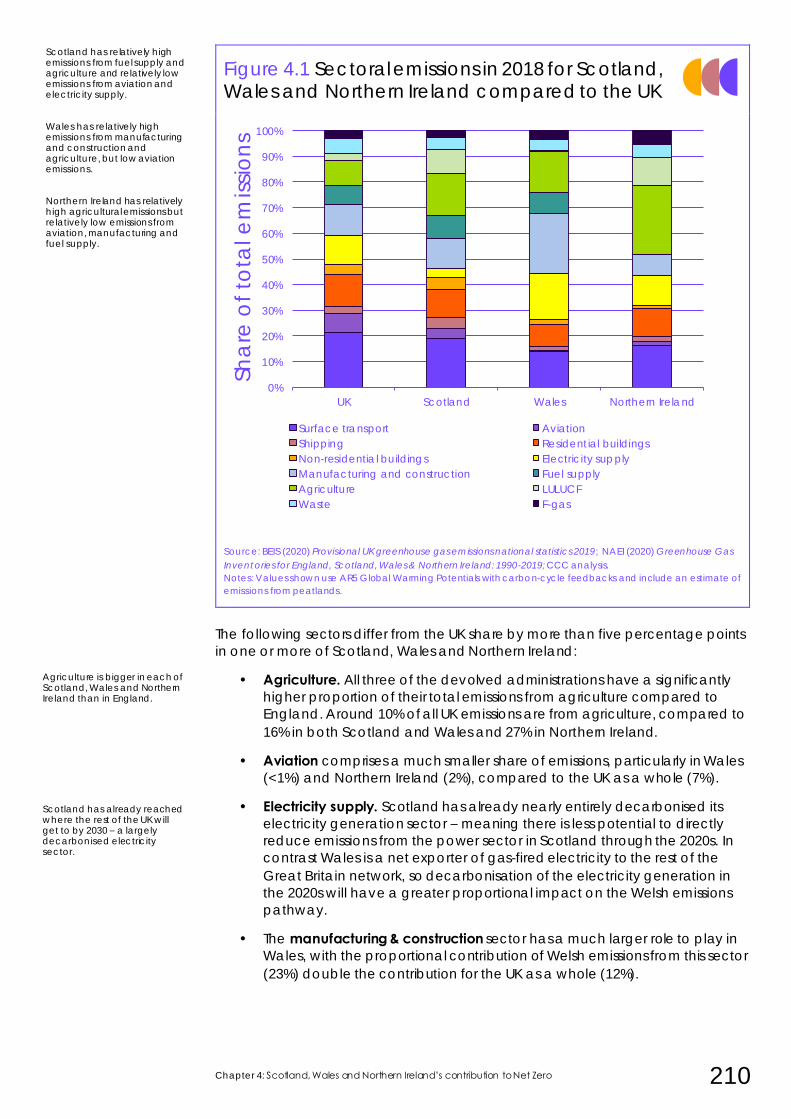
Chapter 4: Scotland, Wales and Northern Ireland’s contribution to Net Zero 210
Figure 4.1 Sectoral emissions in 2018 for Scotland, Wales and Northern Ireland compared to the UK
Source: BEIS (2020) Provisional UK greenhouse gas emissions national statistics 2019; NAEI (2020) Greenhouse Gas
Inventories for England, Scotland, Wales & Northern Ireland: 1990-2019; CCC analysis.
Notes: Values shown use AR5 Global Warming Potentials with carbon-cycle feedbacks and include an estimate of
emissions from peatlands.
The following sectors differ from the UK share by more than five percentage points
in one or more of Scotland, Wales and Northern Ireland:
• Agriculture. All three of the devolved administrations have a significantly
higher proportion of their total emissions from agriculture compared to
England. Around 10% of all UK emissions are from agriculture, compared to
16% in both Scotland and Wales and 27% in Northern Ireland.
• Aviation comprises a much smaller share of emissions, particularly in Wales
(<1%) and Northern Ireland (2%), compared to the UK as a whole (7%).
• Electricity supply. Scotland has already nearly entirely decarbonised its
electricity generation sector – meaning there is less potential to directly
reduce emissions from the power sector in Scotland through the 2020s. In
contrast Wales is a net exporter of gas-fired electricity to the rest of the
Great Britain network, so decarbonisation of the electricity generation in
the 2020s will have a greater proportional impact on the Welsh emissions
pathway.
• The manufacturing & construction sector has a much larger role to play in
Wales, with the proportional contribution of Welsh emissions from this sector
(23%) double the contribution for the UK as a whole (12%).
Scotland has relatively high emissions from fuel supply and agriculture and relatively low emissions from aviation and electricity supply. Wales has relatively high emissions from manufacturing and construction and agriculture, but low aviation emissions. Northern Ireland has relatively high agricultural emissions but relatively low emissions from aviation, manufacturing and fuel supply.
Scotland has already reached where the rest of the UK will get to by 2030 – a largely decarbonised electricity sector.
Agriculture is bigger in each of Scotland, Wales and Northern Ireland than in England.
0%
10%
20%
30%
40%
50%
60%
70%
80%
90%
100%
UK Scotland Wales Northern Ireland
Sh
are
of
tota
l e
mis
sio
ns
Surface transport Aviation
Shipping Residential buildings
Non-residential buildings Electricity supply
Manufacturing and construction Fuel supply
Agriculture LULUCF
Waste F-gas
211 Sixth Carbon Budget – The path to Net Zero
• Surface transport emissions make up a smaller proportion of total emissions
in Wales (14%) and Northern Ireland (16%) than in the UK (21%), but this is
not due to a more carbon-efficient surface transport sector. Other sources
of emissions increase the total national emissions that surface transport
emissions are compared to (i.e. agriculture in Northern Ireland and
manufacturing in Wales) making the share of transport emissions of the total
smaller. Per person, surface transport emissions are actually higher in both
Northern Ireland and Wales than the UK average.
• Fuel supply emissions are very low in Northern Ireland compared to the rest
of the UK, with virtually zero emissions from oil and gas production or
refining.
• Offshore oil and gas emissions. Around 15 MtCO2e of GHGs from offshore oil
and gas exploration and production are classified within the UK
Greenhouse Gas Inventory as ‘unallocated’ emissions and are not
attributed to any of the devolved administrations totals. Decarbonising
these sources of UK emissions will not directly affect the pathways for
Scotland, Wales or Northern Ireland – though there will be knock-on
impacts for onshore emissions from oil and gas production.
b) Existing land use and opportunities to remove CO2 from the atmosphere
Emissions from land use, land-use change and forestry (LULUCF) are inherently
location-specific. Across the UK, there are differences in the types of existing land
use, as well as in the types of land-use change needed to deliver the UK Net Zero
target and the costs associated with those changes.
As a result, the costs and benefits for England, Scotland, Wales and Northern
Ireland differ to the results for the UK as a whole. The two main differences across
the UK that have been incorporated in our analysis are:
• Different combinations of measures that can be deployed across England,
Scotland, Wales and Northern Ireland based on differences in geographies
and existing land use (Figure 4.2).
– Scotland. Around 18% of land in Scotland is currently forested, the
highest proportion in the UK, but emissions from degraded peatland
compared to net total emissions are much higher in Scotland
(potentially up to 20%) than the UK as a whole (around 5%).
– Wales. Wales has a comparable level of forest coverage to the UK,
and has a very low amount of emission associated with degraded
peatland, which is expected to add less than 0.5 MtCO2e to estimates
of emissions once it is included in the inventory. Wales has a much
lower proportion of land area used for crops compared to grasslands.
– Northern Ireland. The livestock sector dominates agriculture in Northern
Ireland (over 90% of agricultural GVA in 2017), particularly beef and
dairy. This is reflected in the high proportion of grassland in Northern
Ireland and low proportion of cropland. Forest coverage is also lower
than the rest of the UK at around 8% (including small woodland area).
• Differences in land acquisition costs in England, Scotland, Wales and
Northern Ireland. Other costs are also likely to vary (e.g. based on
remoteness of land) but it has not been possible to take this into account.
Scotland already has a large forest area, but also a lot of degraded peatland.
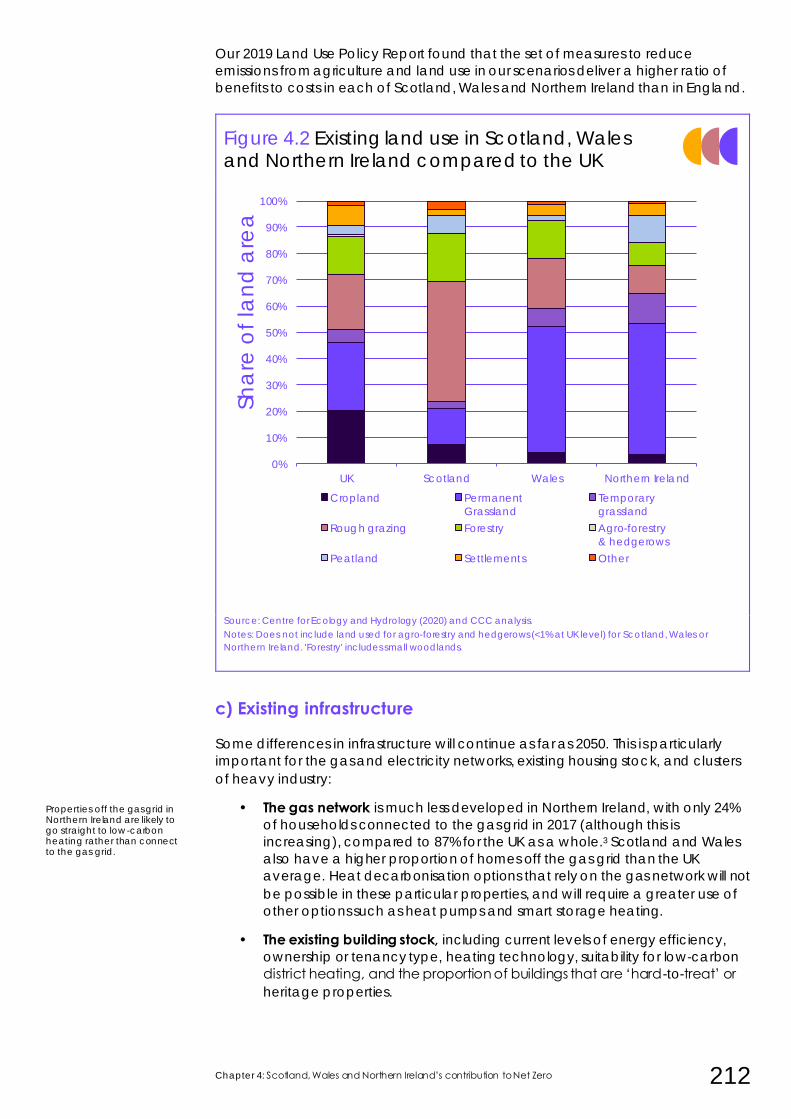
Chapter 4: Scotland, Wales and Northern Ireland’s contribution to Net Zero 212
Our 2019 Land Use Policy Report found that the set of measures to reduce
emissions from agriculture and land use in our scenarios deliver a higher ratio of
benefits to costs in each of Scotland, Wales and Northern Ireland than in England.
Figure 4.2 Existing land use in Scotland, Wales and Northern Ireland compared to the UK
Source: Centre for Ecology and Hydrology (2020) and CCC analysis.
Notes: Does not include land used for agro-forestry and hedgerows (<1% at UK level) for Scotland, Wales or
Northern Ireland. 'Forestry' includes small woodlands.
c) Existing infrastructure
Some differences in infrastructure will continue as far as 2050. This is particularly
important for the gas and electricity networks, existing housing stock, and clusters
of heavy industry:
• The gas network is much less developed in Northern Ireland, with only 24%
of households connected to the gas grid in 2017 (although this is
increasing), compared to 87% for the UK as a whole.3 Scotland and Wales
also have a higher proportion of homes off the gas grid than the UK
average. Heat decarbonisation options that rely on the gas network will not
be possible in these particular properties, and will require a greater use of
other options such as heat pumps and smart storage heating.
• The existing building stock, including current levels of energy efficiency,
ownership or tenancy type, heating technology, suitability for low-carbon
district heating, and the proportion of buildings that are ‘hard-to-treat’ or
heritage properties.
Properties off the gas grid in Northern Ireland are likely to go straight to low-carbon heating rather than connect to the gas grid.
0%
10%
20%
30%
40%
50%
60%
70%
80%
90%
100%
UK Scotland Wales Northern Ireland
Sh
are
of
lan
d a
rea
Cropland Permanent
Grassland
Temporary
grassland
Rough grazing Forestry Agro-forestry
& hedgerows
Peatland Settlements Other
213 Sixth Carbon Budget – The path to Net Zero
Our analysis takes into account the different characteristics of buildings in
Scotland, Wales and Northern Ireland using a detailed model of the
housing stock. Differences in population density also affects the number of
miles driven by people in different parts of the UK.
• Large point sources of emissions. Existing fossil-fuelled power stations and
industrial clusters (e.g. the South Wales industrial cluster and Grangemouth
in Scotland) are large point-sources of emissions that will continue to pollute
until effective measures to decarbonise them are put in place (see Chapter
3 and the Methodology Report). Reducing emissions from any large point-
source of emissions will have a larger proportional impact on Scottish, Welsh
and Northern Irish emissions than it will on the UK total. The timing and pace
of the transition to low-carbon technologies at individual locations will have
larger impact on the total emissions pathway for each nation.
• The UK’s airport infrastructure is concentrated in England, particularly
around London. This means that successful abatement of – or failures to act
on – aviation emissions will have a smaller impact on the total emissions
pathways for Scotland, Wales and Northern Ireland.
• The Integrated Single Electricity Market is the all-island electricity network
shared between Northern Ireland and the Republic of Ireland. As
interconnection increases, energy policy in Northern Ireland must support
an efficient, low-carbon electricity market to operate on both sides of the
border.
d) Potential to store CO2
Carbon capture and storage (CCS) is crucial for the transition to Net Zero. In
addition to playing a central role in reducing emissions from industrial processes
and combustion, as well in electricity generation and potentially hydrogen
production, CO2 will also need to be removed from the atmosphere through
greenhouse gas removals technologies, such as bioenergy with CCS (BECCS) and
direct air CO2 capture with storage (DACCS).
Under IPCC accounting rules the emissions credit for BECCS removals is allocated
where the CO2 capture occurs (i.e. where the biomass is combusted), rather than
where the biomass is grown. Greenhouse gas removal technologies could – in
theory – be located anywhere in the UK and would count towards UK emissions
reductions.
However, there are strategic reasons why BECCS and DACCS might be best
located in certain areas of the country – such as co-location with industrial CCS
clusters, in close proximity to CO2 storage sites (Figure 4.3), or in close proximity to
sources of biomass.
The timing with which industrial clusters in Scotland and Wales decarbonise will have a big impact on total emissions.
Unlike emissions reductions, deployment of greenhouse gas removals is not tied to specific location.
It would be sensible for engineered removals to be located close to CO2 stores.
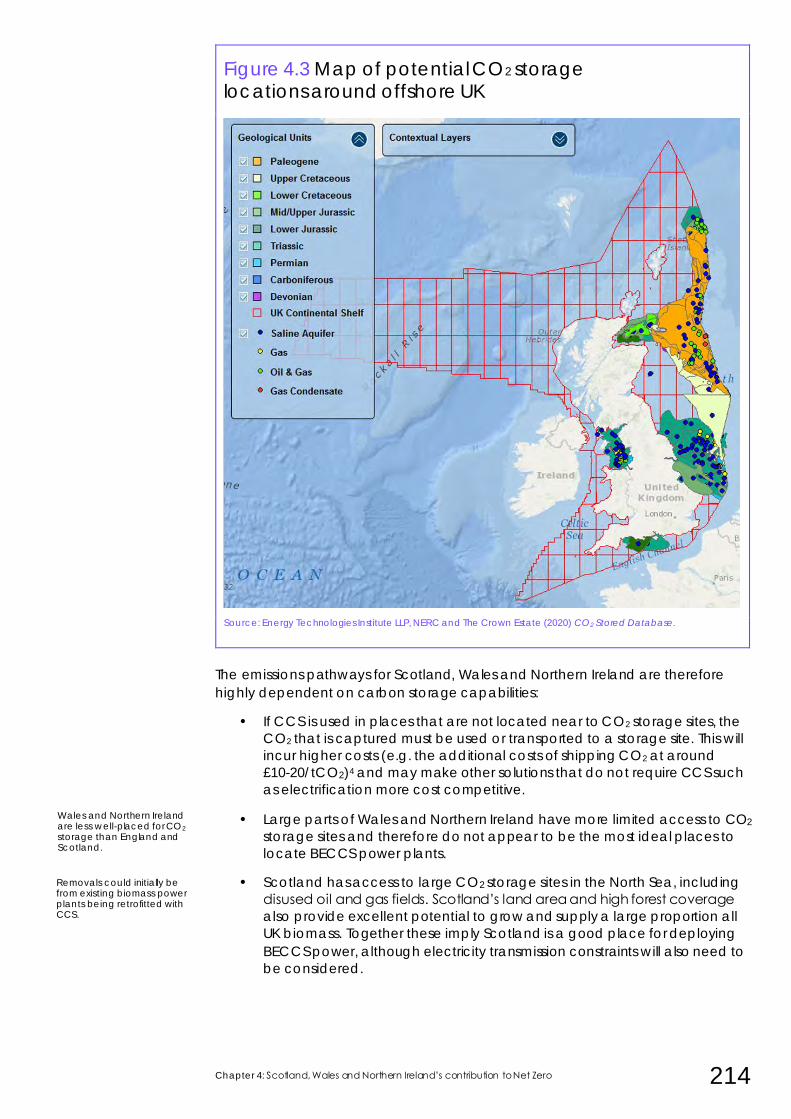
Chapter 4: Scotland, Wales and Northern Ireland’s contribution to Net Zero 214
Figure 4.3 Map of potential CO2 storage locations around offshore UK
Source: Energy Technologies Institute LLP, NERC and The Crown Estate (2020) CO2 Stored Database.
The emissions pathways for Scotland, Wales and Northern Ireland are therefore
highly dependent on carbon storage capabilities:
• If CCS is used in places that are not located near to CO2 storage sites, the
CO2 that is captured must be used or transported to a storage site. This will
incur higher costs (e.g. the additional costs of shipping CO2 at around
£10-20/tCO2)4 and may make other solutions that do not require CCS such
as electrification more cost competitive.
• Large parts of Wales and Northern Ireland have more limited access to CO2
storage sites and therefore do not appear to be the most ideal places to
locate BECCS power plants.
• Scotland has access to large CO2 storage sites in the North Sea, including
disused oil and gas fields. Scotland’s land area and high forest coverage
also provide excellent potential to grow and supply a large proportion all
UK biomass. Together these imply Scotland is a good place for deploying
BECCS power, although electricity transmission constraints will also need to
be considered.
Wales and Northern Ireland are less well-placed for CO2 storage than England and Scotland.
Removals could initially be from existing biomass power plants being retrofitted with CCS.
215 Sixth Carbon Budget – The path to Net Zero
Particularly in the 2020s and early 2030s, the location of existing biomass power
generation capacity in the UK will be important as these sites could be the first to
be retrofitted with carbon capture and storage.
e) Existing policies Existing and planned policies will have lasting effects for emissions pathways for
Scotland, Wales and Northern Ireland. To the extent possible, we include these
impacts in our analysis. These include:
• Long-term contracts for electricity production that will drive new offshore
wind capacity in the 2020s and recent UK Government decisions on other
low-carbon electricity generation projects, including nuclear and tidal
energy.
• Tree planting. The trees that are planted today will continue to sequester
carbon over time – particularly in Scotland where planting rates have more
than doubled in the last five years, a supply chain is in place and funding is
already secured for the next decade.
• Peatland restoration. The Scottish Government is already carrying out
significant peatland restoration actions, and has committed to fund the
restoration of 220,000 hectares of peatland before 2030. These actions are
included in the baseline emissions projections for Scotland, and our
scenarios include the impacts of peatland restoration that is already taking
place in Scotland but not yet accounted for in the existing GHG inventory.
• Waste management policy is mostly devolved and differs across devolved
administrations. This has been reflected in our analysis, with Wales and
Scotland achieving higher recycling rates than England in our scenarios
before 2030. Waste sent to landfill today can continue to emit greenhouse
gases for decades, so existing policy will have an impact on long-term
emissions pathways in the waste management sector.
Wales and Scotland are outperforming the rest of the UK on recycling.
Chapter 4: Scotland, Wales and Northern Ireland’s contribution to Net Zero 216
2. Pathways for Scottish, Welsh and Northern Irish emissions
Chapter 1 of this report sets out how the Committee has developed new scenarios
to explore a range of ways to achieve Net Zero by 2050 at the latest, and used
those exploratory scenarios to identify a balanced pathway towards Net Zero for
the UK.
In this section, we present an analysis of what the Balanced Net Zero Pathway and
exploratory scenarios and the for the UK mean for emissions pathways in Scotland,
Wales and Northern Ireland. It is in four parts:
a) Defining pathways for Scotland, Wales and Northern Ireland
b) Balance of sectoral emissions in 2050
c) Scenarios on the path to Net Zero emissions for the UK
d) Range of greenhouse gas removals needed to reach Net Zero
a) Defining pathways for Scotland, Wales and Northern Ireland
We have derived pathways for the devolved administrations in parallel with our UK
scenarios as described in Chapter 1 (Figure 4.4). Broadly, this approach entails:
• Deriving a baseline emissions projection for each sector to 2050 for each of
the devolved administrations that takes into account, as far as possible,
differences in current and projected trends across Scotland, Wales and
Northern Ireland.
• Analysing the amount of abatement in each country that is consistent with
the UK-wide scenario in each sector.
• Combining these to provide five scenarios for each of Scotland, Wales and
Northern Ireland for the period 2020-2050.
• Assessing the costs, savings and co-impacts of these actions.
More detail on sector-specific methodologies for deriving sectoral pathways for
Scotland, Wales and Northern Ireland is available in each chapter of the
accompanying Methodology Report.
A challenge in defining these scenarios has been to determine where greenhouse
gas removals in the UK scenarios could be located geographically as – unlike
reductions in existing emissions – these are not tied to a specific geographical
location or existing activities.
The Committee’s pathway analysis does not allocate specific levels of greenhouse
gas removals that are used in UK scenarios. This includes the combustion of
biomass to generate electricity with CCS (BECCS power) or the use of direct air
capture with carbon capture and storage (DACCS).
All of the emissions pathways in this chapter are therefore presented without the inclusion of any engineered greenhouse gas removals.
Here we present the results of our Balanced Pathway and exploratory scenarios for Wales, Scotland and Northern Ireland.
Due to the difficulty of allocating UK removals to different parts of the UK, we present results without these.
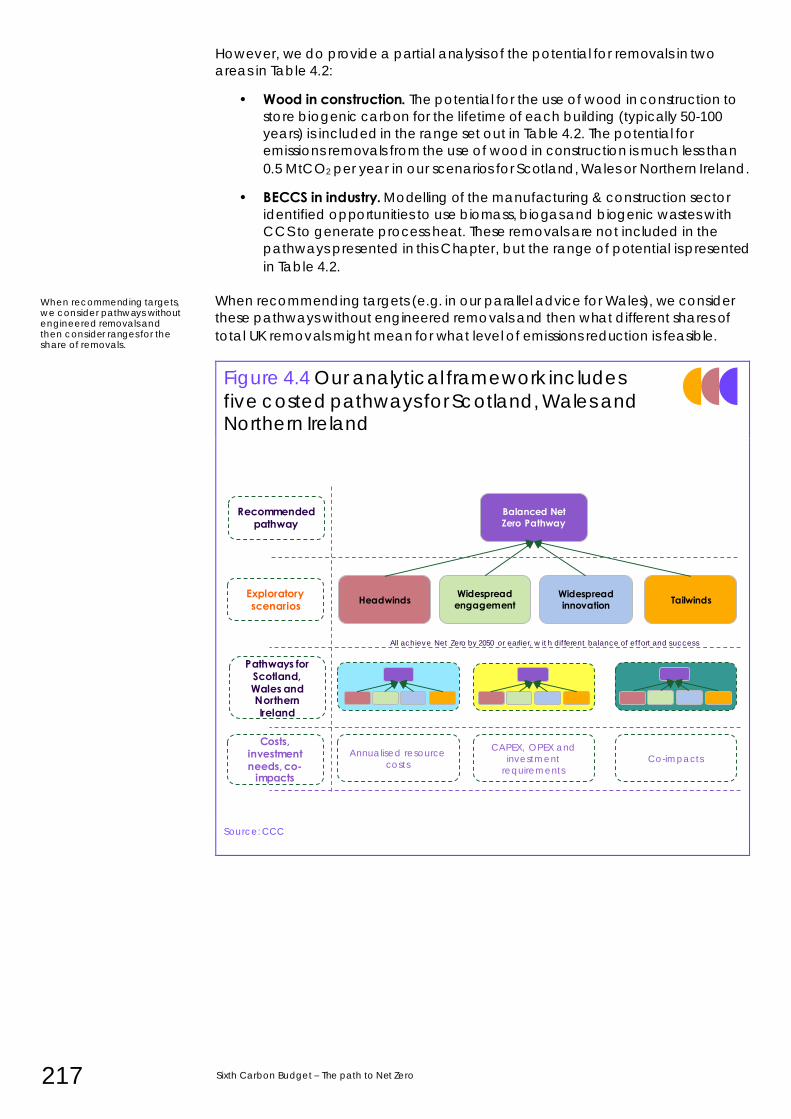
217 Sixth Carbon Budget – The path to Net Zero
However, we do provide a partial analysis of the potential for removals in two
areas in Table 4.2:
• Wood in construction. The potential for the use of wood in construction to
store biogenic carbon for the lifetime of each building (typically 50-100
years) is included in the range set out in Table 4.2. The potential for
emissions removals from the use of wood in construction is much less than
0.5 MtCO2 per year in our scenarios for Scotland, Wales or Northern Ireland.
• BECCS in industry. Modelling of the manufacturing & construction sector
identified opportunities to use biomass, biogas and biogenic wastes with
CCS to generate process heat. These removals are not included in the
pathways presented in this Chapter, but the range of potential is presented
in Table 4.2.
When recommending targets (e.g. in our parallel advice for Wales), we consider
these pathways without engineered removals and then what different shares of
total UK removals might mean for what level of emissions reduction is feasible.
Figure 4.4 Our analytical framework includes
five costed pathways for Scotland, Wales and Northern Ireland
Source: CCC
When recommending targets, we consider pathways without engineered removals and then consider ranges for the share of removals.
Widespread innovation Tailwinds
Balanced Net Zero Pathway
Headwinds Widespread engagement
All achieve Net Zero by 2050 or earlier, w it h different balance of effort and success
Recommended pathway
Exploratory scenarios
Pathways for Scotland, Wales and Northern Ireland
Annualised resource
costs
CAPEX, OPEX and
investment
requirements
Co-impacts
Costs, investment needs, co-
impacts
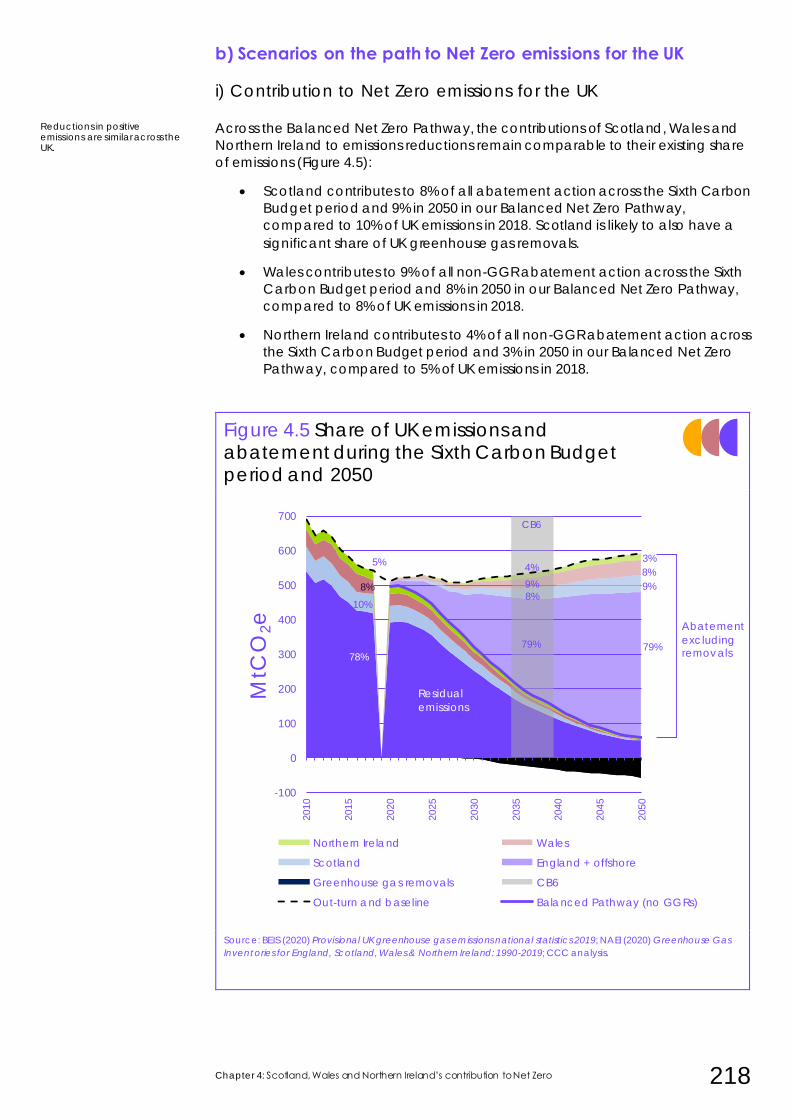
Chapter 4: Scotland, Wales and Northern Ireland’s contribution to Net Zero 218
b) Scenarios on the path to Net Zero emissions for the UK
i) Contribution to Net Zero emissions for the UK
Across the Balanced Net Zero Pathway, the contributions of Scotland, Wales and
Northern Ireland to emissions reductions remain comparable to their existing share
of emissions (Figure 4.5):
• Scotland contributes to 8% of all abatement action across the Sixth Carbon
Budget period and 9% in 2050 in our Balanced Net Zero Pathway,
compared to 10% of UK emissions in 2018. Scotland is likely to also have a
significant share of UK greenhouse gas removals.
• Wales contributes to 9% of all non-GGR abatement action across the Sixth
Carbon Budget period and 8% in 2050 in our Balanced Net Zero Pathway,
compared to 8% of UK emissions in 2018.
• Northern Ireland contributes to 4% of all non-GGR abatement action across
the Sixth Carbon Budget period and 3% in 2050 in our Balanced Net Zero
Pathway, compared to 5% of UK emissions in 2018.
Figure 4.5 Share of UK emissions and abatement during the Sixth Carbon Budget period and 2050
Source: BEIS (2020) Provisional UK greenhouse gas emissions national statistics 2019; NAEI (2020) Greenhouse Gas
Inventories for England, Scotland, Wales & Northern Ireland: 1990-2019; CCC analysis.
Reductions in positive emissions are similar across the UK.
-100
0
100
200
300
400
500
600
700
2010
2015
2020
2025
2030
2035
2040
2045
2050
MtC
O2e
Northern Ireland Wales
Scotland England + offshore
Greenhouse gas removals CB6
Out-turn and baseline Balanced Pathway (no GGRs)
CB6
79%
78%
9%
8%
3%
10%
8%
5%
8%
9%
4%
79%
Abatement
excludingremovals
Residual
emissions
219 Sixth Carbon Budget – The path to Net Zero
ii) Balance of sectoral emissions in 2050
As set out in Chapter 2, the balance of sectoral emissions in the UK in our scenarios
for Net Zero in 2050 is most sensitive to residual emissions from aviation, agriculture
and the amount of CO2 that can be removed from the atmosphere through
forestry and greenhouse gas removals.
As the size of the existing aviation sector in Scotland, Wales and Northern Ireland is
much smaller than England, the net emissions for each nation in 2050 are
determined mostly by emissions from LULUCF and agriculture, and the amount of
greenhouse gas removals that can be deployed.
Figure 4.7, Figure 4.9 and Figure 4.11 show the breakdown of residual emissions in
each scenario excluding any greenhouse gas removals.
These charts also allow a comparison to the ‘Further Ambition’ scenario that was
set out in our 2019 Net Zero report.5 Compared to the Further Ambition scenario:
• The Balanced Pathway has lower emissions from manufacturing &
construction and fuel supply (defined as ‘industry’ in our Further Ambition
scenario). This is particularly important for Scotland and Wales where our
sectoral analysis has focused on clusters at Grangemouth and South Wales.
• The Balanced Pathway typically has comparable - or slightly higher -
emissions in the agriculture sector.
• The scenarios are typically lower than in the 2019 Net Zero Report, despite
the fact that they do not have any greenhouse gas removals allocated to
them.
The Headwinds, Widespread Engagement, Widespread Innovation and Tailwinds
scenarios explore a wider range of sectoral pathways in 2050. For Scotland, Wales
and Northern Ireland, the sectors which have the biggest impact on emissions in
2050 are:
• The size of the net land use sink in 2050 which varies based on the scale of
measures to remove carbon from the atmosphere, particularly tree
planting.
• The potential for further reductions in the agriculture sector due to
behaviour changes and technological innovations.
iii) Emissions pathways for Scotland
Scotland’s emissions pathway gets to very low levels in 2050, reaching virtually Net
Zero emissions in 2050 (99% reduction) even before accounting for Scotland’s
excellent capability for greenhouse gas removals technology (Figure 4.7). Scotland
would likely get to net-negative emissions well before 2050 in the Balanced
Pathway once greenhouse gas removals are deployed across the UK:
• The Balanced pathway is 64% lower than 1990 levels in 2030, and an
average of 76% lower during the Sixth Carbon Budget period, rising to a
99% reduction by 2050 without greenhouse gas removals (Figure 4.6).
Scotland has high potential for natural removals and relatively low aviation emissions, so it can reach Net Zero by 2050 even without engineered removals.
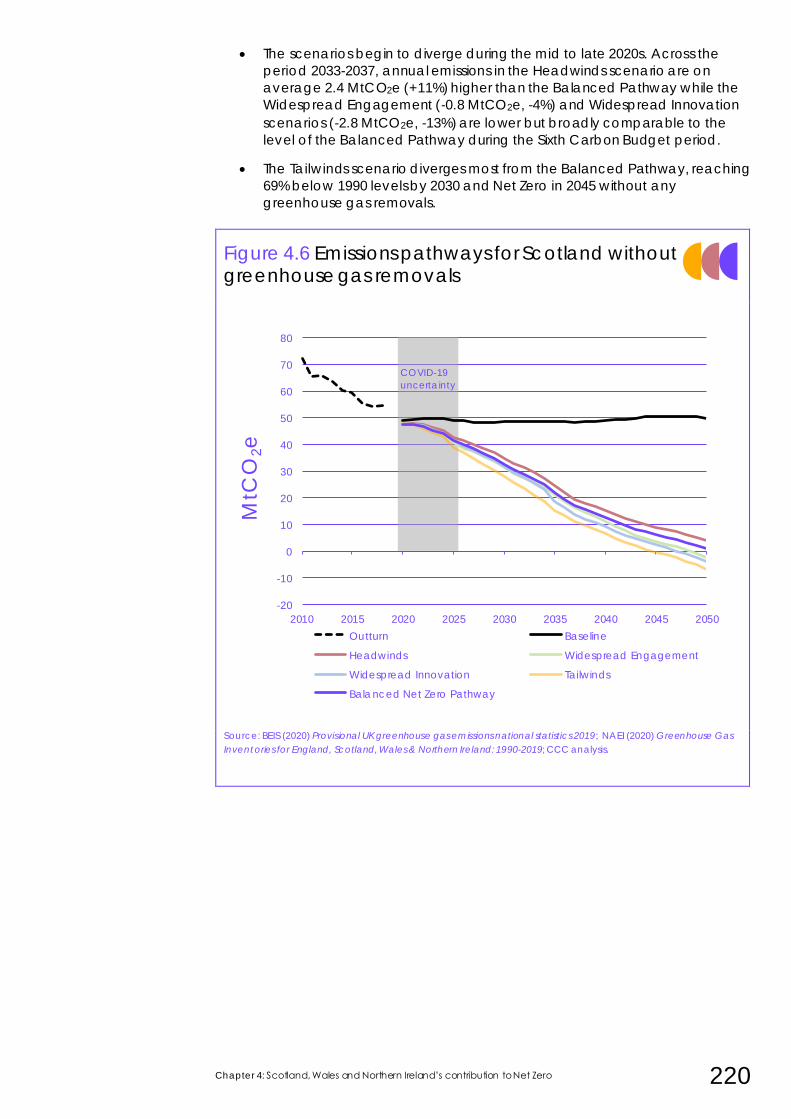
Chapter 4: Scotland, Wales and Northern Ireland’s contribution to Net Zero 220
• The scenarios begin to diverge during the mid to late 2020s. Across the
period 2033-2037, annual emissions in the Headwinds scenario are on
average 2.4 MtCO2e (+11%) higher than the Balanced Pathway while the
Widespread Engagement (-0.8 MtCO2e, -4%) and Widespread Innovation
scenarios (-2.8 MtCO2e, -13%) are lower but broadly comparable to the
level of the Balanced Pathway during the Sixth Carbon Budget period.
• The Tailwinds scenario diverges most from the Balanced Pathway, reaching
69% below 1990 levels by 2030 and Net Zero in 2045 without any
greenhouse gas removals.
Figure 4.6 Emissions pathways for Scotland without greenhouse gas removals
Source: BEIS (2020) Provisional UK greenhouse gas emissions national statistics 2019; NAEI (2020) Greenhouse Gas
Inventories for England, Scotland, Wales & Northern Ireland: 1990-2019; CCC analysis.
-20
-10
0
10
20
30
40
50
60
70
80
2010 2015 2020 2025 2030 2035 2040 2045 2050
MtC
O2e
Outturn Baseline
Headwinds Widespread Engagement
Widespread Innovation Tailwinds
Balanced Net Zero Pathway
COVID-19
uncertainty
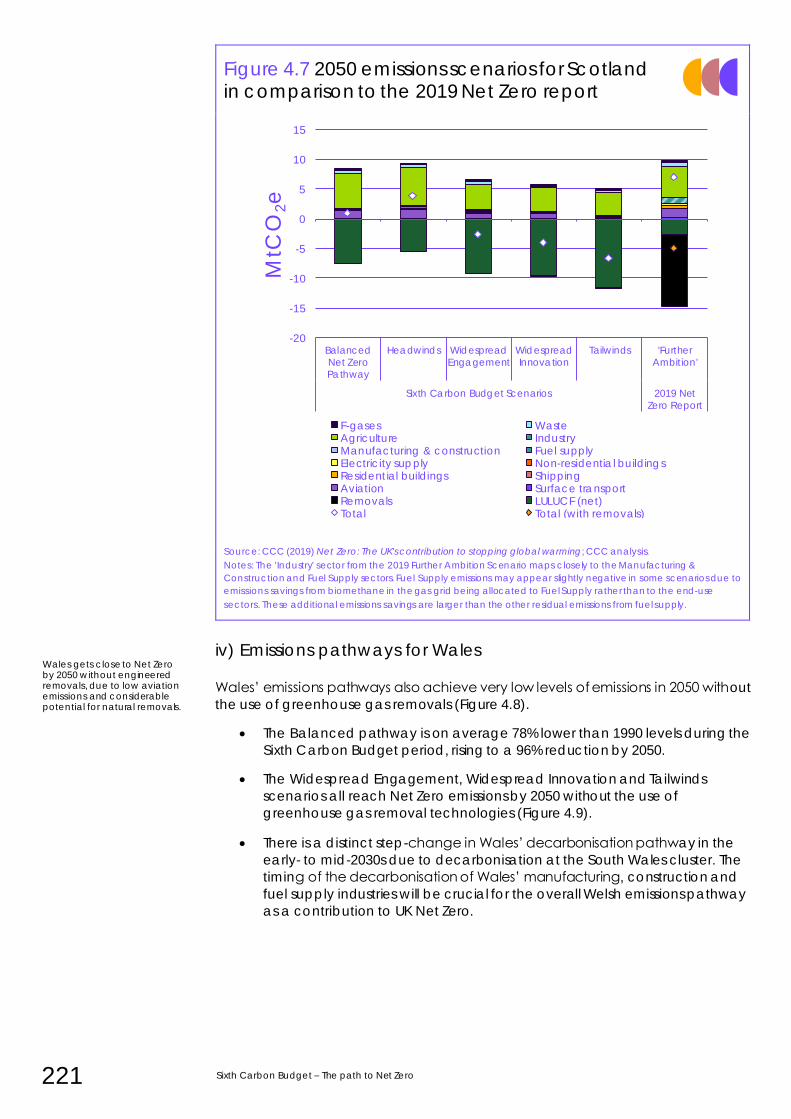
221 Sixth Carbon Budget – The path to Net Zero
Figure 4.7 2050 emissions scenarios for Scotland in comparison to the 2019 Net Zero report
Source: CCC (2019) Net Zero: The UK's contribution to stopping global warming; CCC analysis.
Notes: The 'Industry' sector from the 2019 Further Ambition Scenario maps closely to the Manufacturing &
Construction and Fuel Supply sectors. Fuel Supply emissions may appear slightly negative in some scenarios due to
emissions savings from biomethane in the gas grid being allocated to Fuel Supply rather than to the end-use
sectors. These additional emissions savings are larger than the other residual emissions from fuel supply.
iv) Emissions pathways for Wales
Wales’ emissions pathways also achieve very low levels of emissions in 2050 without
the use of greenhouse gas removals (Figure 4.8).
• The Balanced pathway is on average 78% lower than 1990 levels during the
Sixth Carbon Budget period, rising to a 96% reduction by 2050.
• The Widespread Engagement, Widespread Innovation and Tailwinds
scenarios all reach Net Zero emissions by 2050 without the use of
greenhouse gas removal technologies (Figure 4.9).
• There is a distinct step-change in Wales’ decarbonisation pathway in the
early- to mid-2030s due to decarbonisation at the South Wales cluster. The
timing of the decarbonisation of Wales’ manufacturing, construction and
fuel supply industries will be crucial for the overall Welsh emissions pathway
as a contribution to UK Net Zero.
Wales gets close to Net Zero by 2050 without engineered removals, due to low aviation emissions and considerable potential for natural removals.
-20
-15
-10
-5
0
5
10
15
BalancedNet ZeroPathway
Headwinds WidespreadEngagement
WidespreadInnovation
Tailwinds 'FurtherAmbition'
Sixth Carbon Budget Scenarios 2019 NetZero Report
MtC
O2e
F-gases WasteAgriculture IndustryManufacturing & construction Fuel supplyElectricity supply Non-residential buildingsResidential buildings ShippingAviation Surface transportRemovals LULUCF (net)Total Total (with removals)
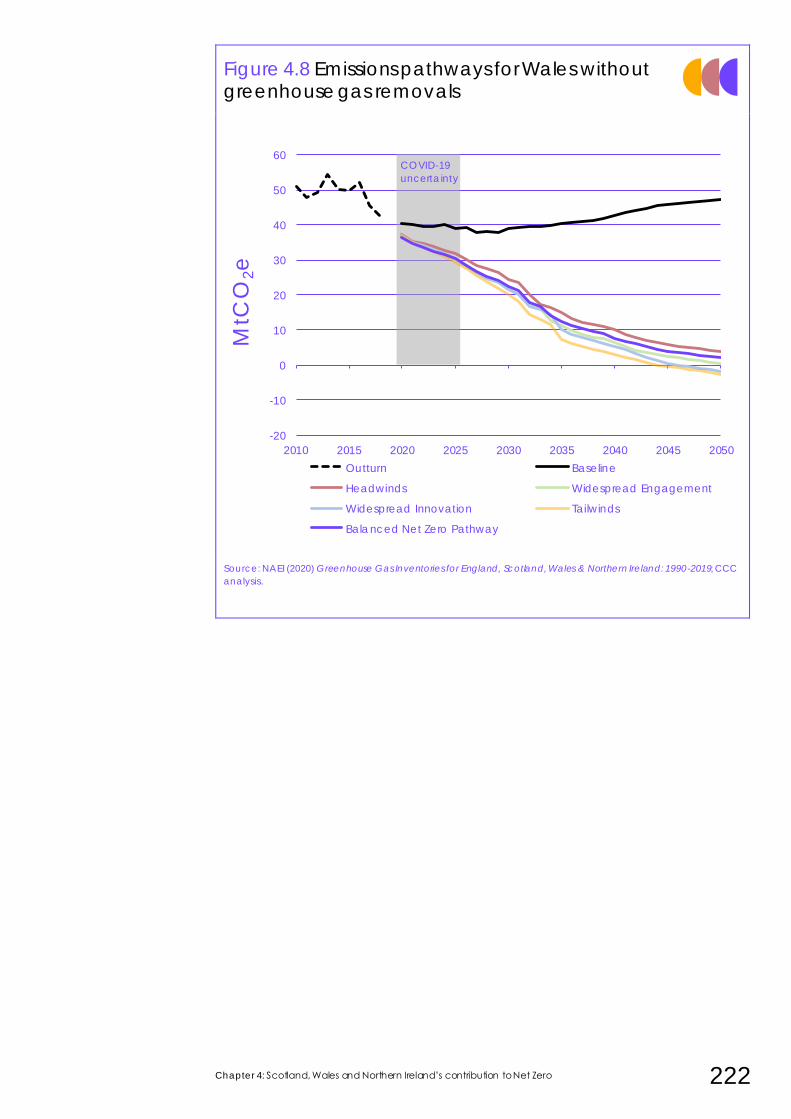
Chapter 4: Scotland, Wales and Northern Ireland’s contribution to Net Zero 222
Figure 4.8 Emissions pathways for Wales without greenhouse gas removals
Source: NAEI (2020) Greenhouse Gas Inventories for England, Scotland, Wales & Northern Ireland: 1990-2019; CCC
analysis.
-20
-10
0
10
20
30
40
50
60
2010 2015 2020 2025 2030 2035 2040 2045 2050
MtC
O2e
Outturn Baseline
Headwinds Widespread Engagement
Widespread Innovation Tailwinds
Balanced Net Zero Pathway
COVID-19
uncertainty
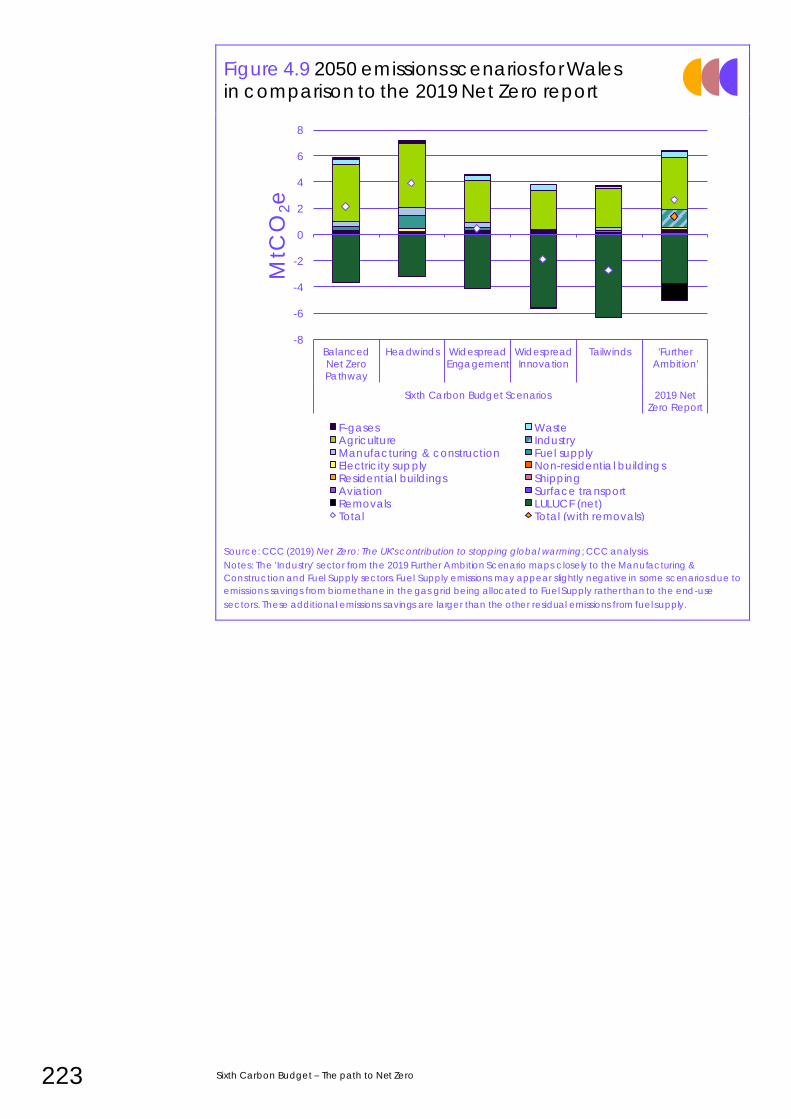
223 Sixth Carbon Budget – The path to Net Zero
Figure 4.9 2050 emissions scenarios for Wales in comparison to the 2019 Net Zero report
Source: CCC (2019) Net Zero: The UK's contribution to stopping global warming; CCC analysis.
Notes: The 'Industry' sector from the 2019 Further Ambition Scenario maps closely to the Manufacturing &
Construction and Fuel Supply sectors. Fuel Supply emissions may appear slightly negative in some scenarios due to
emissions savings from biomethane in the gas grid being allocated to Fuel Supply rather than to the end-use
sectors. These additional emissions savings are larger than the other residual emissions from fuel supply.
-8
-6
-4
-2
0
2
4
6
8
BalancedNet ZeroPathway
Headwinds WidespreadEngagement
WidespreadInnovation
Tailwinds 'FurtherAmbition'
Sixth Carbon Budget Scenarios 2019 NetZero Report
MtC
O2e
F-gases WasteAgriculture IndustryManufacturing & construction Fuel supplyElectricity supply Non-residential buildingsResidential buildings ShippingAviation Surface transportRemovals LULUCF (net)Total Total (with removals)
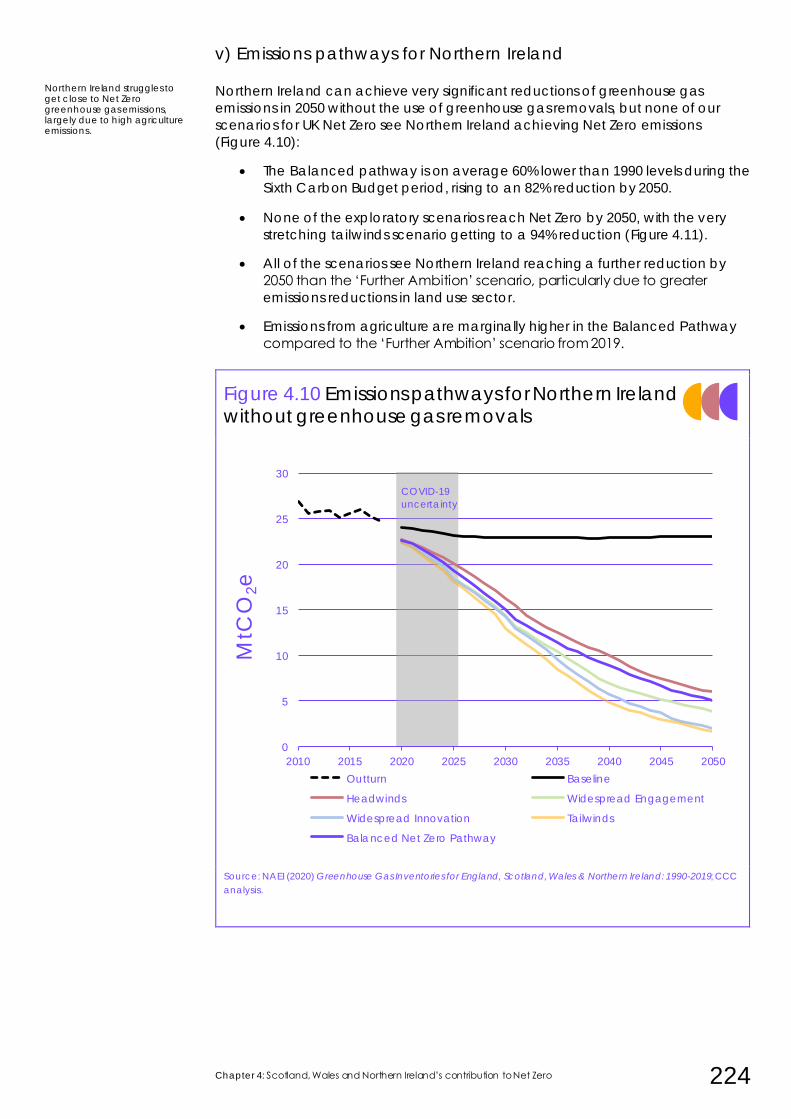
Chapter 4: Scotland, Wales and Northern Ireland’s contribution to Net Zero 224
v) Emissions pathways for Northern Ireland
Northern Ireland can achieve very significant reductions of greenhouse gas
emissions in 2050 without the use of greenhouse gas removals, but none of our
scenarios for UK Net Zero see Northern Ireland achieving Net Zero emissions
(Figure 4.10):
• The Balanced pathway is on average 60% lower than 1990 levels during the
Sixth Carbon Budget period, rising to an 82% reduction by 2050.
• None of the exploratory scenarios reach Net Zero by 2050, with the very
stretching tailwinds scenario getting to a 94% reduction (Figure 4.11).
• All of the scenarios see Northern Ireland reaching a further reduction by
2050 than the ‘Further Ambition’ scenario, particularly due to greater
emissions reductions in land use sector.
• Emissions from agriculture are marginally higher in the Balanced Pathway
compared to the ‘Further Ambition’ scenario from 2019.
Figure 4.10 Emissions pathways for Northern Ireland without greenhouse gas removals
Source: NAEI (2020) Greenhouse Gas Inventories for England, Scotland, Wales & Northern Ireland: 1990-2019; CCC
analysis.
Northern Ireland struggles to get close to Net Zero greenhouse gas emissions, largely due to high agriculture emissions.
0
5
10
15
20
25
30
2010 2015 2020 2025 2030 2035 2040 2045 2050
MtC
O2e
Outturn Baseline
Headwinds Widespread Engagement
Widespread Innovation Tailwinds
Balanced Net Zero Pathway
COVID-19
uncertainty
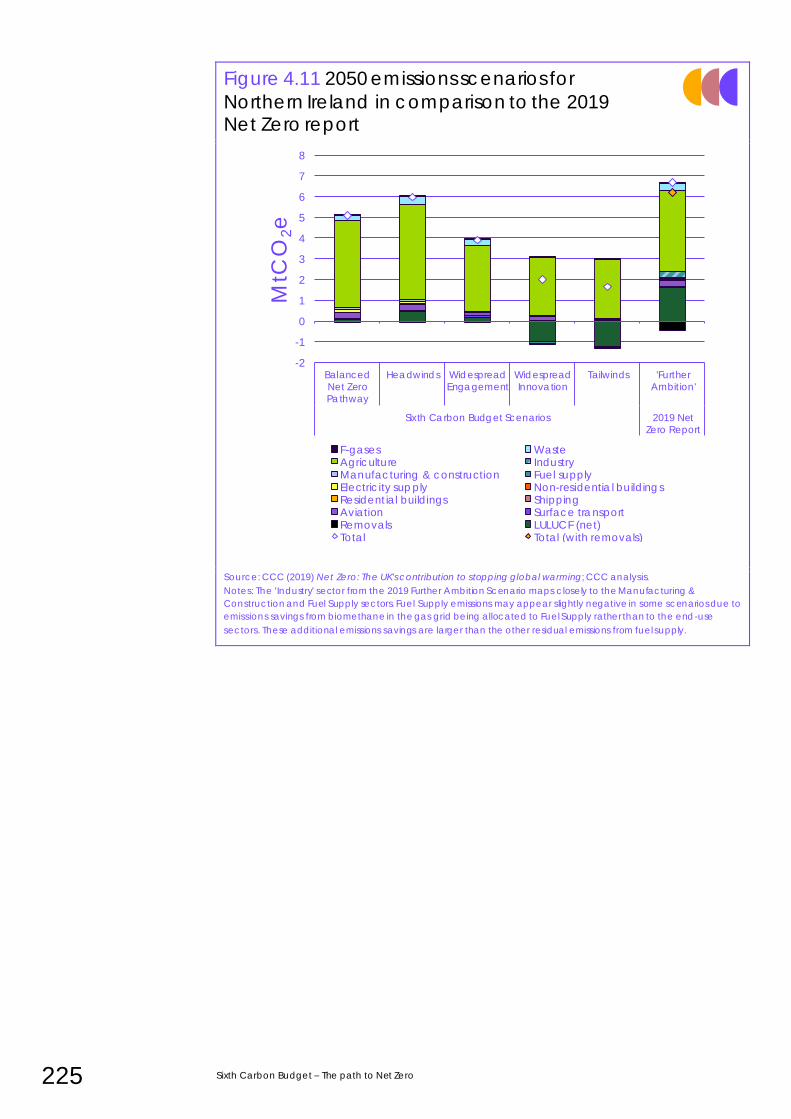
225 Sixth Carbon Budget – The path to Net Zero
Figure 4.11 2050 emissions scenarios for
Northern Ireland in comparison to the 2019 Net Zero report
Source: CCC (2019) Net Zero: The UK's contribution to stopping global warming; CCC analysis.
Notes: The 'Industry' sector from the 2019 Further Ambition Scenario maps closely to the Manufacturing &
Construction and Fuel Supply sectors. Fuel Supply emissions may appear slightly negative in some scenarios due to
emissions savings from biomethane in the gas grid being allocated to Fuel Supply rather than to the end-use
sectors. These additional emissions savings are larger than the other residual emissions from fuel supply.
-2
-1
0
1
2
3
4
5
6
7
8
BalancedNet ZeroPathway
Headwinds WidespreadEngagement
WidespreadInnovation
Tailwinds 'FurtherAmbition'
Sixth Carbon Budget Scenarios 2019 NetZero Report
MtC
O2e
F-gases WasteAgriculture IndustryManufacturing & construction Fuel supplyElectricity supply Non-residential buildingsResidential buildings ShippingAviation Surface transportRemovals LULUCF (net)Total Total (with removals)
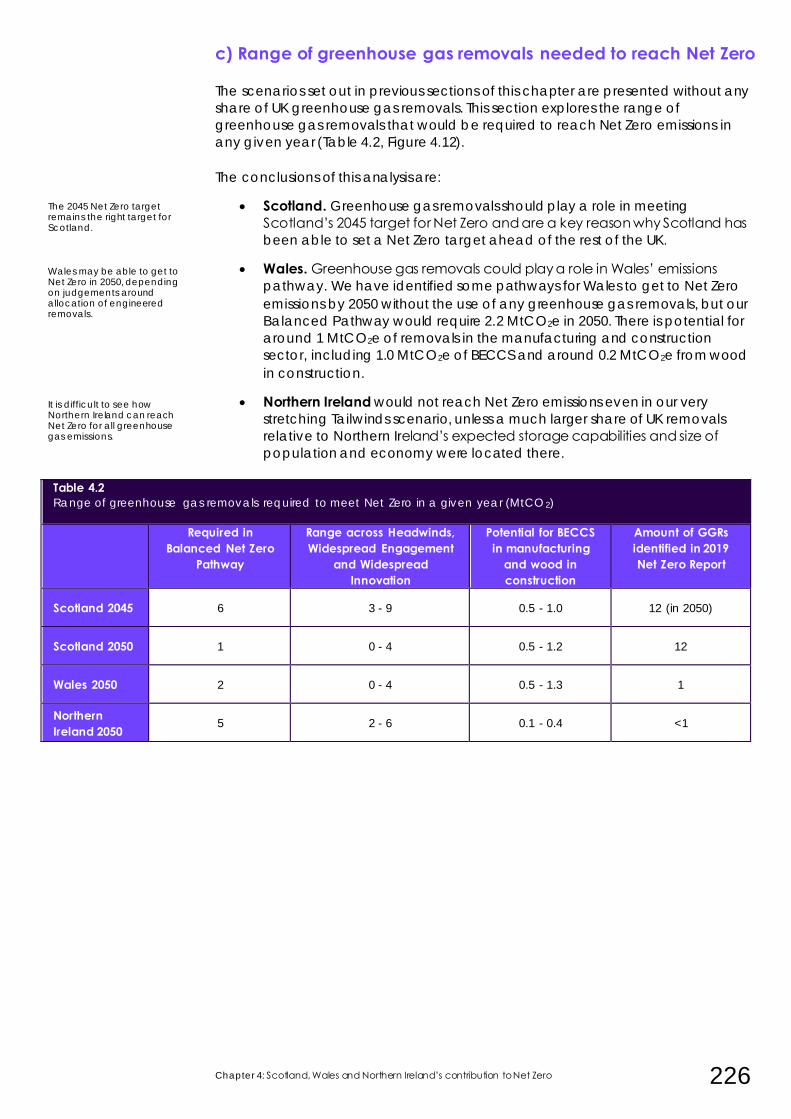
Chapter 4: Scotland, Wales and Northern Ireland’s contribution to Net Zero 226
c) Range of greenhouse gas removals needed to reach Net Zero
The scenarios set out in previous sections of this chapter are presented without any
share of UK greenhouse gas removals. This section explores the range of
greenhouse gas removals that would be required to reach Net Zero emissions in
any given year (Table 4.2, Figure 4.12).
The conclusions of this analysis are:
• Scotland. Greenhouse gas removals should play a role in meeting
Scotland’s 2045 target for Net Zero and are a key reason why Scotland has
been able to set a Net Zero target ahead of the rest of the UK.
• Wales. Greenhouse gas removals could play a role in Wales’ emissions
pathway. We have identified some pathways for Wales to get to Net Zero
emissions by 2050 without the use of any greenhouse gas removals, but our
Balanced Pathway would require 2.2 MtCO2e in 2050. There is potential for
around 1 MtCO2e of removals in the manufacturing and construction
sector, including 1.0 MtCO2e of BECCS and around 0.2 MtCO2e from wood
in construction.
• Northern Ireland would not reach Net Zero emissions even in our very
stretching Tailwinds scenario, unless a much larger share of UK removals
relative to Northern Ireland’s expected storage capabilities and size of
population and economy were located there.
Table 4.2
Range of greenhouse gas removals required to meet Net Zero in a given year (MtCO2)
Required in Balanced Net Zero
Pathway
Range across Headwinds, Widespread Engagement
and Widespread Innovation
Potential for BECCS in manufacturing
and wood in construction
Amount of GGRs identified in 2019 Net Zero Report
Scotland 2045 6 3 - 9 0.5 - 1.0 12 (in 2050)
Scotland 2050 1 0 - 4 0.5 - 1.2 12
Wales 2050 2 0 - 4 0.5 - 1.3 1
Northern Ireland 2050
5 2 - 6 0.1 - 0.4 <1
The 2045 Net Zero target remains the right target for Scotland.
Wales may be able to get to Net Zero in 2050, depending on judgements around allocation of engineered removals.
It is difficult to see how Northern Ireland can reach Net Zero for all greenhouse gas emissions.
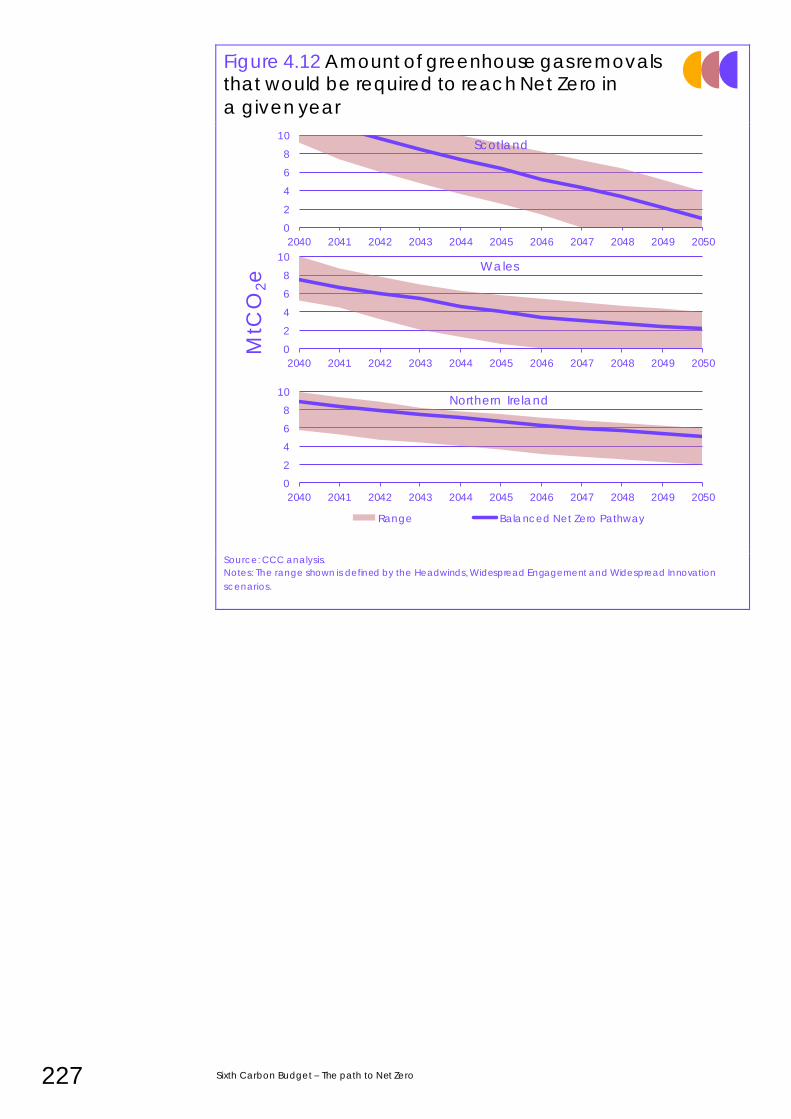
227 Sixth Carbon Budget – The path to Net Zero
Figure 4.12 Amount of greenhouse gas removals that would be required to reach Net Zero in
a given year
Source: CCC analysis.
Notes: The range shown is defined by the Headwinds, Widespread Engagement and Widespread Innovation
scenarios.
0
2
4
6
8
10
2040 2041 2042 2043 2044 2045 2046 2047 2048 2049 2050
MtC
O2e
Wales
0
2
4
6
8
10
2040 2041 2042 2043 2044 2045 2046 2047 2048 2049 2050
Northern Ireland
Range Balanced Net Zero Pathway
0
2
4
6
8
10
2040 2041 2042 2043 2044 2045 2046 2047 2048 2049 2050
Scotland
Chapter 4: Scotland, Wales and Northern Ireland’s contribution to Net Zero 228
3. Implications for targets
This report does not set out specific recommendations relating to climate
legislation of Scotland and Wales, nor the creation of new climate legislation in
Northern Ireland.
We will shortly publish two joint reports reflecting on progress towards meeting
Wales’ existing climate targets, and giving new recommendations on the level of
the Wales’ Third Carbon Budget (2026-2030) and other emissions reduction targets,
including the 2050 target.
In parallel with this advice, the Committee has written to the Scottish Government
and the Northern Ireland Executive to give further advice on meeting and setting
climate targets.
a) Targets under the Environment (Wales) Act
Wales’ existing set of targets on the pathway to an 80% reduction in emissions by
2050 are not consistent with the UK’s Net Zero target or our recommended Sixth
Carbon Budget level. • In 2019, when recommending the UK Net Zero target, the Committee
recommended that Wales should a target for a 95% reduction in emissions
by 2050 relative to 1990.
• The Welsh Government accepted the 95% target, and requested further
advice from the Committee on whether a Net Zero target was feasible for
Wales.
• On 17 December 2020, we will give advice, as requested by Welsh
ministers, on Wales’ Second and Third Carbon Budgets (2021-2025 and
2026-2030) and targets for 2030, 2040 and 2050. This advice will include a
recommendation on whether or not there is new evidence that would
allow Wales to set a Net Zero target.
Our advice on targets for Wales in the next decade is made more complex by the
uncertainty associated with COVID-19. The lasting impacts of the pandemic on
Wales’ emissions pathway in the next decade – either through permanent
changes in behaviours or through reduced economic output – are still unclear.
Future changes to the emissions inventory – particularly for emissions associated
with forested peatland – add further uncertainty to setting those targets.
b) Targets under the Climate Change (Scotland) Act
Achieving Net Zero by 2045, ahead of the rest of the UK, remains the appropriate
goal in Scotland. In our Balanced Net Zero Pathway, Scotland can achieve Net
Zero in 2045 with a lower level of greenhouse gas removals than we assumed for
2050 in the Further Ambition scenario for Scotland in our 2019 advice on Net Zero.
In placing the Net Zero target for 2045 in legislation that amended the Climate
Change (Scotland) Act, the Scottish Parliament also set in law a target for a 75%
reduction in greenhouse gas emissions for 2030 on 1990 levels. This went beyond
the 2019 Committee’s recommendation for a target of 70%.
Our advice on 17 December 2020 will provide advice on the various targets under the Environment (Wales) Act.
Achieving Net Zero by 2045, ahead of the rest of the UK, remains the appropriate goal in Scotland.
229 Sixth Carbon Budget – The path to Net Zero
Scotland’s 75% target for 2030 will be extremely challenging to meet, even if
Scotland gets on track for Net Zero by 2045. Our Balanced Net Zero Pathway for the UK would not meet Scotland’s 2030 target – reaching a 64% reduction by 2030 –
while our most stretching Tailwinds scenario reaches a 69% reduction.
Decisions on the greenhouse gas accounting methodology made by the UK
Government could shift Scotland’s 2030 target more in line with our analysis for this
report:
• Our analysis uses conservative assumptions for how the global warming
impacts of methane emissions and the way that emissions from wetlands
are measured in the greenhouse gas inventory in future (see Chapter 2, Box
2.1). This is to ensure that our recommended targets can be met regardless
of the inventory methodology that is chosen.
• The choice of methodology for the forthcoming inventory changes makes
a particular difference in Scotland, of around five percentage points.
Therefore, if the lower range of both of these methodologies (‘low-low’) is
used our Balanced Pathway would equate to a 68% reduction by 2030 and
our Tailwinds scenario would be 73% below the baseline.
The Scottish Government should not rely on uncertain methodology changes to
meet the legal target set by the Scottish Parliament. Contingency plans must be in
place to ensure the 2030 target can be met regardless of the inventory choices
made.
In our Balanced Net Zero Pathway, Scotland would not reach a 75% reduction in
emissions until 2035 (range of 2033-2036 across all scenarios). This suggests the need
to potentially accelerate fifteen years of mitigation actions by around five years in
order to meet that target, across all sectors of the economy. This would be
extremely challenging, as these pathways already lie near the limits of technical
feasibility.
As set out in Chapter 2, the Tailwinds scenario – our most optimistic scenario, for
which we currently lack the evidence to have full confidence, even if good policy
is in place – only reduces emissions in 2030 by marginally more than the Balanced
Pathway. The analysis presented in this Chapter suggests that even full delivery of
the Tailwinds scenario in 2030 and ‘low-low’ inventory changes would leave
Scotland short of the 2030 target.
We give further recommendations on policy actions and external factors that
could allow the 2030 target to be met in more detail in a letter to the Scottish
Government published in parallel with this advice.
c) A Climate Change Act for Northern Ireland
Achieving the Net Zero emissions for the UK by 2050 does not necessitate that
every part of the UK gets to Net Zero. Some parts of the UK will be ‘net sources’ of
greenhouse gases by 2050 with emissions offset in other parts of the UK that are
‘net sinks’.
The analysis carried out for this report suggests that Northern Ireland achieving Net
Zero greenhouse gas emissions is not necessary for the UK to meet its climate
targets.
Our most optimistic scenario would not reach the legislated 2030 target, even with best-case impacts of forthcoming inventory changes.
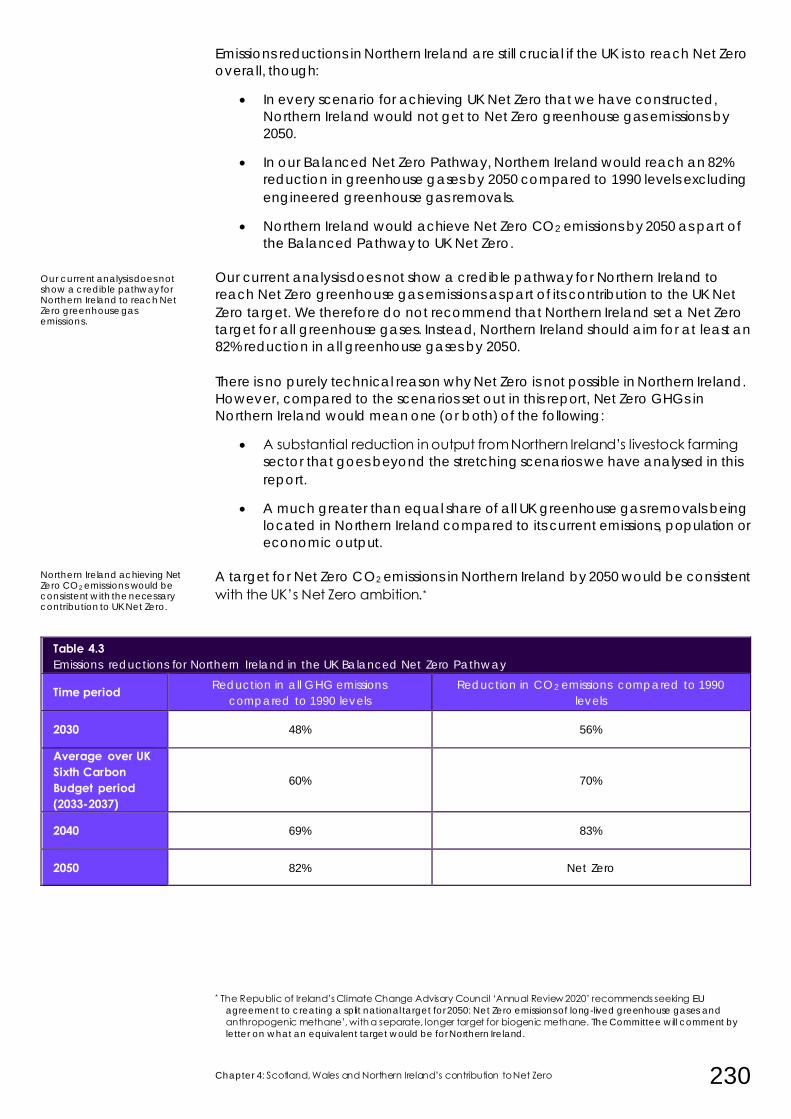
Chapter 4: Scotland, Wales and Northern Ireland’s contribution to Net Zero 230
Emissions reductions in Northern Ireland are still crucial if the UK is to reach Net Zero
overall, though:
• In every scenario for achieving UK Net Zero that we have constructed,
Northern Ireland would not get to Net Zero greenhouse gas emissions by
2050.
• In our Balanced Net Zero Pathway, Northern Ireland would reach an 82%
reduction in greenhouse gases by 2050 compared to 1990 levels excluding
engineered greenhouse gas removals.
• Northern Ireland would achieve Net Zero CO2 emissions by 2050 as part of
the Balanced Pathway to UK Net Zero.
Our current analysis does not show a credible pathway for Northern Ireland to
reach Net Zero greenhouse gas emissions as part of its contribution to the UK Net
Zero target. We therefore do not recommend that Northern Ireland set a Net Zero
target for all greenhouse gases. Instead, Northern Ireland should aim for at least an
82% reduction in all greenhouse gases by 2050.
There is no purely technical reason why Net Zero is not possible in Northern Ireland.
However, compared to the scenarios set out in this report, Net Zero GHGs in
Northern Ireland would mean one (or both) of the following:
• A substantial reduction in output from Northern Ireland’s livestock farming
sector that goes beyond the stretching scenarios we have analysed in this
report.
• A much greater than equal share of all UK greenhouse gas removals being
located in Northern Ireland compared to its current emissions, population or
economic output.
A target for Net Zero CO2 emissions in Northern Ireland by 2050 would be consistent
with the UK’s Net Zero ambition.*
Table 4.3
Emissions reductions for Northern Ireland in the UK Balanced Net Zero Pathway
Time period Reduction in all GHG emissions
compared to 1990 levels Reduction in CO2 emissions compared to 1990
levels
2030 48% 56%
Average over UK Sixth Carbon Budget period (2033-2037)
60% 70%
2040 69% 83%
2050 82% Net Zero
* The Republic of Ireland’s Climate Change Advisory Council ‘Annual Review 2020’ recommends seeking EU
agreement to creating a split national target for 2050: Net Zero emissions of long-lived greenhouse gases and
anthropogenic methane’, with a separate, longer target for biogenic methane. The Committee will comment by
letter on what an equivalent target would be for Northern Ireland.
Our current analysis does not show a credible pathway for Northern Ireland to reach Net Zero greenhouse gas emissions.
Northern Ireland achieving Net Zero CO2 emissions would be consistent with the necessary contribution to UK Net Zero.
231 Sixth Carbon Budget – The path to Net Zero
4. Costs and benefits in Scotland, Wales and Northern Ireland
Chapters 5 and 6 of this report analyse the costs and benefits of meeting the Sixth
Carbon Budget for the UK and how those costs are distributed fairly and efficiently
across society.
The economic resource costs of reducing emissions in Scotland, Wales and
Northern Ireland will vary by scenario and over time, as the balance of measures to
reduce emissions will be different than for the UK as a whole. That is reflected in the
cost estimates presented in this Chapter.
We estimate the costs of taking action but do not identify how these will be paid
for, either in terms of policy design or who pays. Chapter 6 expands on the
distributional considerations of meeting the Sixth Carbon Budget, covering:
• ensuring a just transition;
• jobs and opportunities in the transition;
• distribution of costs, household energy bills and fuel poverty;
• competitiveness; and
• fiscal circumstances.
The net resource costs we report in this section should not be interpreted as the
costs that would be delivered via devolved budget expenditure, nor as costs that
only Scottish, Welsh or Northern Irish businesses and consumers have to bear.
Many of the actions to reduce emissions will likely be paid for at UK level and/or
socialised across the whole of the UK. For example:
• The costs associated with building new low-carbon generation will be
shared across all consumers of electricity on the GB grid. We have reflected
this by allocating resource costs for electricity supply in proportion to
consumption, rather than make assumptions on where new zero-carbon
generating capacity (e.g. nuclear power stations) are located.
• The costs of decarbonising industrial clusters could be met through a
combination of direct financing from the UK Exchequer and/or be passed
through to the end-users of low-carbon products.
• A market mechanism for greenhouse gas removals could see the UK
aviation industry offsetting emissions by paying for removals, including
planting trees, in all areas of the UK.
The extent to which costs and savings are shared across the UK – including the
amount of expenditure through devolved administrations’ budgets – will be
determined by policy at UK and devolved level.
Table 4.4 sets out the range of annualised resource costs* associated with action in
the devolved administrations in the Balanced Pathway. A more detailed set of
sectoral costs will be available on the CCC website.
* Annualised resource costs are the annualised additional investment, cost of capital and operating cost implications
in a given year of a given measure relative to costs in an alternative scenario (generally a hypothetical world with
no new climate action or climate damages).
Estimates of overall resource costs at devolved level do not imply that these costs will be borne locally.
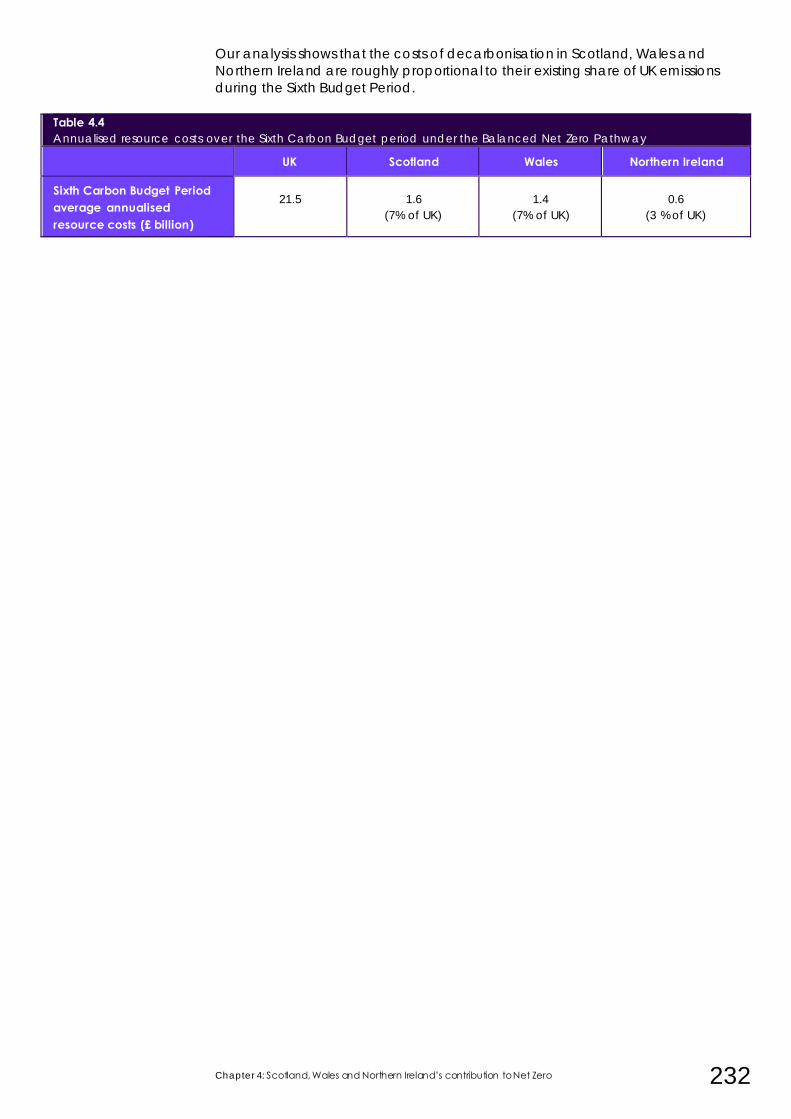
Chapter 4: Scotland, Wales and Northern Ireland’s contribution to Net Zero 232
Our analysis shows that the costs of decarbonisation in Scotland, Wales and
Northern Ireland are roughly proportional to their existing share of UK emissions
during the Sixth Budget Period.
Table 4.4 Annualised resource costs over the Sixth Carbon Budget period under the Balanced Net Zero Pathway
UK Scotland Wales Northern Ireland
Sixth Carbon Budget Period average annualised resource costs (£ billion)
21.5
1.6
(7% of UK)
1.4
(7% of UK)
0.6
(3 % of UK)
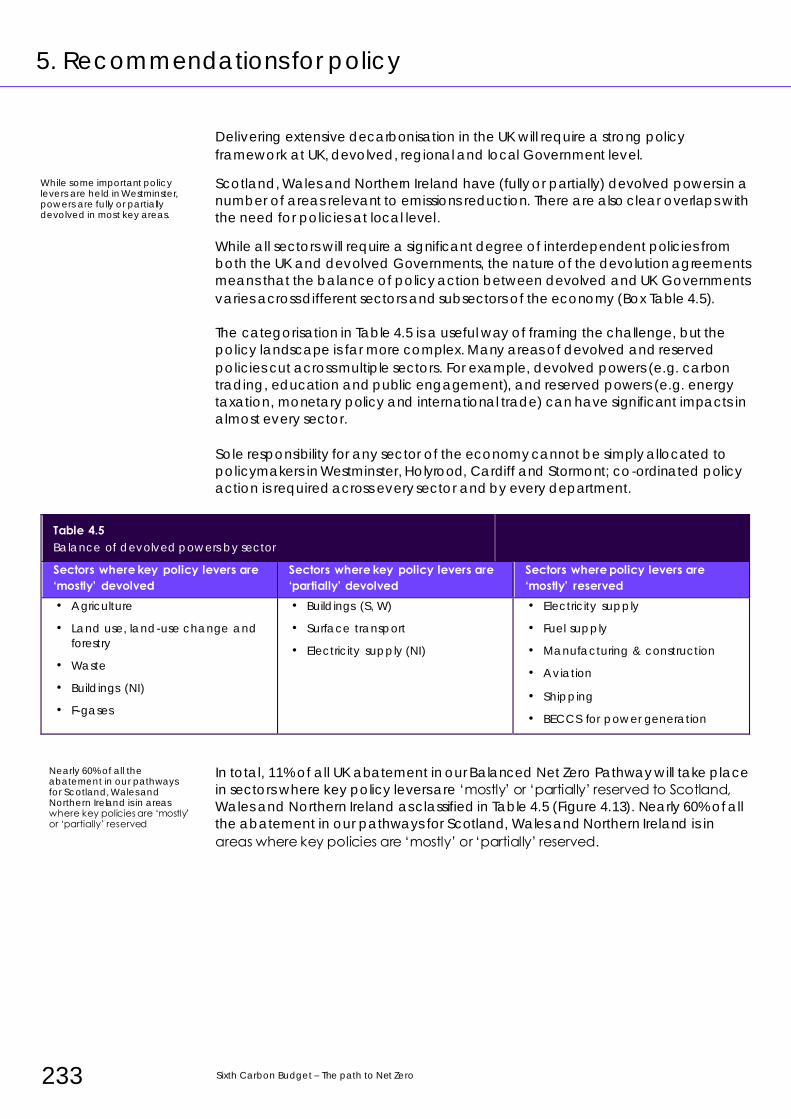
233 Sixth Carbon Budget – The path to Net Zero
5. Recommendations for policy
Delivering extensive decarbonisation in the UK will require a strong policy
framework at UK, devolved, regional and local Government level.
Scotland, Wales and Northern Ireland have (fully or partially) devolved powers in a
number of areas relevant to emissions reduction. There are also clear overlaps with
the need for policies at local level.
While all sectors will require a significant degree of interdependent policies from
both the UK and devolved Governments, the nature of the devolution agreements
means that the balance of policy action between devolved and UK Governments
varies across different sectors and subsectors of the economy (Box Table 4.5).
The categorisation in Table 4.5 is a useful way of framing the challenge, but the
policy landscape is far more complex. Many areas of devolved and reserved
policies cut across multiple sectors. For example, devolved powers (e.g. carbon
trading, education and public engagement), and reserved powers (e.g. energy
taxation, monetary policy and international trade) can have significant impacts in
almost every sector.
Sole responsibility for any sector of the economy cannot be simply allocated to
policymakers in Westminster, Holyrood, Cardiff and Stormont; co-ordinated policy
action is required across every sector and by every department.
Table 4.5 Balance of devolved powers by sector Sectors where key policy levers are ‘mostly’ devolved
Sectors where key policy levers are ‘partially’ devolved
Sectors where policy levers are ‘mostly’ reserved
• Agriculture
• Land use, land-use change and
forestry
• Waste
• Buildings (NI)
• F-gases
• Buildings (S, W)
• Surface transport
• Electricity supply (NI)
• Electricity supply
• Fuel supply
• Manufacturing & construction
• Aviation
• Shipping
• BECCS for power generation
In total, 11% of all UK abatement in our Balanced Net Zero Pathway will take place
in sectors where key policy levers are ‘mostly’ or ‘partially’ reserved to Scotland,
Wales and Northern Ireland as classified in Table 4.5 (Figure 4.13). Nearly 60% of all
the abatement in our pathways for Scotland, Wales and Northern Ireland is in
areas where key policies are ‘mostly’ or ‘partially’ reserved.
While some important policy levers are held in Westminster, powers are fully or partially devolved in most key areas.
Nearly 60% of all the abatement in our pathways for Scotland, Wales and Northern Ireland is in areas where key policies are ‘mostly’ or ‘partially’ reserved
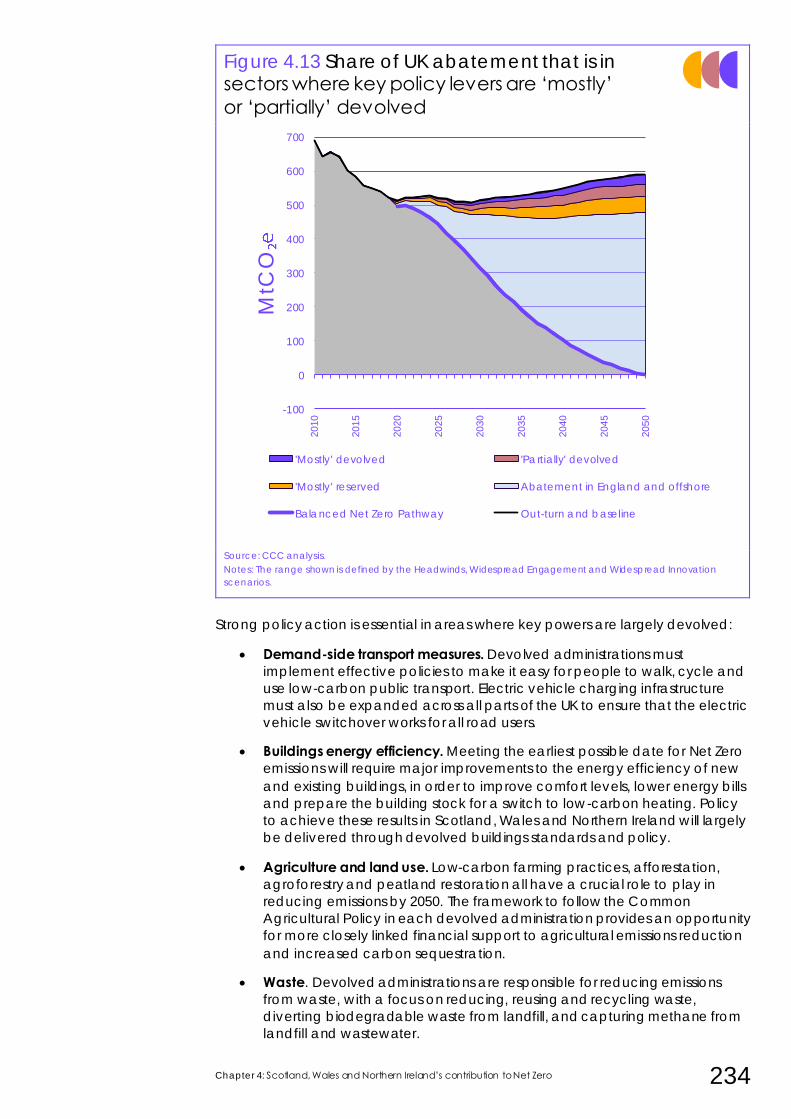
Chapter 4: Scotland, Wales and Northern Ireland’s contribution to Net Zero 234
Figure 4.13 Share of UK abatement that is in sectors where key policy levers are ‘mostly’
or ‘partially’ devolved
Source: CCC analysis.
Notes: The range shown is defined by the Headwinds, Widespread Engagement and Widespread Innovation
scenarios.
Strong policy action is essential in areas where key powers are largely devolved:
• Demand-side transport measures. Devolved administrations must
implement effective policies to make it easy for people to walk, cycle and
use low-carbon public transport. Electric vehicle charging infrastructure
must also be expanded across all parts of the UK to ensure that the electric
vehicle switchover works for all road users.
• Buildings energy efficiency. Meeting the earliest possible date for Net Zero
emissions will require major improvements to the energy efficiency of new
and existing buildings, in order to improve comfort levels, lower energy bills
and prepare the building stock for a switch to low-carbon heating. Policy
to achieve these results in Scotland, Wales and Northern Ireland will largely
be delivered through devolved buildings standards and policy.
• Agriculture and land use. Low-carbon farming practices, afforestation,
agroforestry and peatland restoration all have a crucial role to play in
reducing emissions by 2050. The framework to follow the Common
Agricultural Policy in each devolved administration provides an opportunity
for more closely linked financial support to agricultural emissions reduction
and increased carbon sequestration.
• Waste. Devolved administrations are responsible for reducing emissions
from waste, with a focus on reducing, reusing and recycling waste,
diverting biodegradable waste from landfill, and capturing methane from
landfill and wastewater.
-100
0
100
200
300
400
500
600
700
2010
2015
2020
2025
2030
2035
2040
2045
2050
MtC
O
'Mostly' devolved 'Partially' devolved
'Mostly' reserved Abatement in England and offshore
Balanced Net Zero Pathway Out-turn and baseline
235 Sixth Carbon Budget – The path to Net Zero
• Electricity and heat in Northern Ireland. Unlike Scotland and Wales,
Northern Ireland has devolved control of its power sector, although the
operation of Northern Irish I-SEM is affected by both UK and Republic of
Ireland policy. For the UK to achieve Net Zero emissions, Northern Ireland
must achieve equally ambitious decarbonisation in the power sector.
• Heat off-gas properties in Scotland and Wales. Heat policy, energy
efficiency and building standards are devolved, while regulation of energy
markets, oil and gas, electricity and gas networks and consumer protection
remain reserved to the UK Government. The Scottish Government can
introduce measures to decarbonise heat in buildings without using mains
gas, though it currently participates in the GB-wide Renewable Heat
Incentive scheme.
• Carbon trading is a devolved matter and the devolved administrations and
UK Government have consulted on a UK-wide Emissions Trading System that
is collectively agreed with the rest of the UK.
• Leadership role. Effective policies in Scotland, Wales and Northern Ireland
can set the standard for the rest of the UK. Recent examples include the
Energy Efficient Scotland Programme and the Welsh Government’s Towards
zero waste strategy.
Where powers are reserved to the UK level, the devolved administrations have an
important role in ensuring that the emissions reductions take place. In particular,
the devolved administrations should focus on the following areas:
• Planning. Planning frameworks are another useful lever over infrastructure
that needs to be well aligned to objectives for emissions reduction in
devolved administrations (e.g. through encouraging walking, cycling and
use of public transport, ensuring readiness for or installation of electric
vehicle charging points in new developments, and a favourable planning
regime for low-cost onshore wind).
• Procurement. The public sector in devolved administrations can use
procurement rules positively to help drive emissions reductions in a number
of areas (e.g. uptake of ultra-low emission vehicles, energy efficiency and
low-carbon heat in buildings, low-carbon products).
• Convening role. It is important the devolved administrations maximise their
potential to bring stakeholders together, and facilitate dialogue and
strengthen relationships, to enable the development of mutually beneficial
projects that contribute to decarbonisation.
• Working with the UK Government to ensure that UK-wide policies work for
devolved administrations.
• Access to UK-wide funding. The devolved administrations should seek to
ensure that households and businesses have good access to UK-wide
funding opportunities where possible and appropriate.
• Communication and public engagement of climate risks and the options
and choices available to reduce emissions across the UK.
Actions by the UK Government will be necessary to deliver the Welsh and Scottish
targets, and actions by the devolved administrations will be necessary to deliver
the UK target.
Even where the main policy levers are reserved to Westminster, there is a range of ways that devolved Governments can contribute.
Chapter 4: Scotland, Wales and Northern Ireland’s contribution to Net Zero 236
1 Welsh Government (2019) Wales accepts Committee on Climate Change 95% emissions
reduction target.
2 UK Government and Irish Government (2020) New Decade, New Approach.
3 CCC (2019) Reducing emissions in Northern Ireland. 4 BEIS (2018) Shipping CO2 – UK Cost Estimation Study.
5 CCC (2019) Net Zero – The UK’s contribution to stopping global warming.
237 Sixth Carbon Budget – The path to Net Zero
Investment, costs and benefits of
the Sixth Carbon Budget
1. Background to assessing economic implications 241
2. Capital investment and operational savings 243
3. Annualised resource costs during the transition 254
4. Macroeconomic impacts 266
5. Co-impacts along the path to Net Zero 271

239 Sixth Carbon Budget – The path to Net Zero
Introduction & key messages
As the world increasingly embraces a trajectory towards Net Zero emissions around
mid-century (see Chapter 7), the costs for any country of following that trajectory
are likely to fall, while the risks of following an alternative path increase. Our
scenarios reflect that, by transitioning as fast as possible within constraints such as
for stock turnover and supply chain capacity. Our proposed budget would send a
clear signal that the UK welcomes low-carbon investment.
The transition to Net Zero emissions will be capital-intensive, with increased upfront
spending that in turn yields ongoing savings in fuel costs. Much of these
investments and savings will come from and go to the private sector, both
businesses and individuals. Overall, we find that the net costs of the transition
(including upfront investment, ongoing running costs and costs of financing) will be
less than 1% of GDP over the entirety of 2020-2050, lower than we concluded in our
2019 Net Zero report.
In the near-term, against the backdrop of the economic damage from the COVID-
19 crisis, the required investment can support the UK’s recovery. Longer term, it
provides benefits in reduced operating costs, lower emissions and benefits to
health and the environment, and possible intangible benefits for the UK
internationally.
Our conclusions reflect analysis of the pathways set out in Chapters 2-4, new
research on the macroeconomic impact of those pathways, and advice from
expert groups convened for this and our previous reports.
Our key conclusions in this chapter are:
• UK low-carbon investment each year will have to increase from around £10 billion in 2020 to around £50 billion by 2030, continuing at around that level
through to 2050. That compares to total investment in the UK of around
£390 billion in 2019. Similar scale-ups to this have been seen in the past in
the key sectors of power, transport and buildings. The increase is
deliverable, primarily by private companies and individuals, alongside other
investment, provided effective policy is put in place. A key focus must be to
continue effective low-risk policy for the power sector and extend it to
other sectors, especially residential heating and energy efficiency.
• Much of the investment spending can be recouped through lower operating costs. These savings, many of which relate to reduced reliance
on imported fossil fuels, will rise to around £35 billion by 2035 and £60 billion
by 2050.
• Our estimates of annualised resource costs have fallen to less than 1% of GDP for the entirety of the period 2020 to 2050. That is lower than our 2019
estimate for the cost of reaching Net Zero emissions (we previously
expected cost to rise to 1-2% of GDP by 2050).
• UK GDP may well be boosted. In the near-term, especially as the economy
rebuilds after the COVID-19 crisis, increased investment can provide a
multiplier effect to stimulate activity (and employment) in the rest of the
economy. Although investments will have to be repaid in later years, there
will be offsetting operating cost savings. Modelling commissioned for this
report indicates a potential boost to GDP of around 2% by 2035. At worst
the economy would return to similar levels to those expected without
climate action.
The required investment leads to large reductions in operating costs.
The UK’s pathway to Net Zero requires a major investment programme that can help the UK’s economic recovery.
The net annualised cost will be less than 1% of GDP through to 2050.
Chapter 5: Investment, costs and benefits of the Sixth Carbon Budget 240
• There may be further economic benefits from innovation or industrial opportunities. Our analysis is based on reasonably conservative
assumptions over development of low-carbon technologies. Particularly
with the recent strengthening apparent in global climate action,
technology costs could fall very much faster (e.g. as witnessed previously
for offshore wind), implying greater economic benefit. We have also not
assumed any boost to GDP from UK firms capturing valuable parts of the
growing global value chain for low-carbon products (the size of the UK
manufacturing sector remains relatively constant in our pathways).
• Health, well-being and the environment will also benefit. Our pathways to
meet the Sixth Carbon Budget involve several changes with wider benefits.
Increased walking and cycling and healthier diets would, if achieved,
improve health, as will improved air quality as fossil fuel use is reduced and
more comfortable homes as energy efficiency is improved. Transformations
in our land to restore peatland and to plant trees and hedges provide
opportunities to deliver environmental and well-being benefits, as well as
improving our resilience to the impacts of climate change.
This chapter focuses on the aggregate economic impact. While costs are small
overall, they could be large for particular people, sectors or areas. The risk of
localised impacts should be a key focus for the Government. The next chapter
considers these related issues of how the costs are spread within the economy,
including jobs and the just transition, energy bills, public finances and
competitiveness.
This chapter is in five sections:
1. Background to assessing the economic implications
2. Capital investment and operational savings
3. Annualised resource costs during the transition
4. Macroeconomic impacts
5. Co-impacts along the path to Net Zero
There may be wider economic benefits and benefits to health and the environment.
241 Sixth Carbon Budget – The path to Net Zero
1. Background to assessing economic implications
a) The economic background
When the Committee recommended the UK’s Net Zero target for 2050 we
demonstrated that the overall economic impact was likely to be small and could
turn out to be positive. Action is clearly preferable to inaction given the large risks
and costs from unchecked climate change.
The COVID-19 crisis has sharply changed the economic backdrop in the UK and
globally. The has UK lost almost 800,000 payroll jobs since the beginning of the
pandemic as of October 2020,1 with several million additional citizens receiving in-
work support from the Job Retention Scheme. Relative to August 2019, GDP was
9% lower in August 2020.2 Business investment also fell by around a quarter. These
effects bring their own challenges but imply considerable spare capacity in the
economy and therefore that increasing investment could support the UK’s
recovery.
In our 2020 Progress Report to Parliament we outlined the opportunity for a ‘green’
recovery - many climate investments can be delivered quickly, have high
economic multipliers (i.e. they in turn stimulate further boosts to economic activity),
create high numbers of jobs, and boost spending in the UK (rather than overseas).
They can also bring a range of wider benefits, including for health and well-being.3
b) Our approach in this report
Our analysis in this report builds on our 2050 analysis in our 2019 Net Zero report by
evaluating the path for costs and benefits from 2020 to 2050. We have updated
our assumptions to reflect new evidence (e.g. the latest offshore wind auctions
and new research) and our wider range of pathways allows us further to explore
uncertainty. We continue to draw on the advice from our expert advisory group on
costs and benefits4 and have also drawn on new advisory groups on finance and
health (see sections 2 and 5).
Cost estimates are made relative to a hypothetical counterfactual of no-further-
climate-action: the costs and benefits are those of additional action relative to
today. However, we note that such a ‘no-further-action’ world would increasingly
bring its own costs and risks that we have not attempted to characterise. These
would include costs from the impacts of climate change and increased risk and
disruption by pursuing a direction that runs strongly counter to that adopted by
and expected by businesses across the economy.5 Therefore our approach is likely
to overstate the costs - which nevertheless are relatively small.
The chapter first presents cost estimates for capital and operating costs (in section
2), before grouping them together to look at the overall annualised cost of the
transition with borrowing costs included (in section 3). We then consider the
potential effect on GDP (in section 4), as well as the co-benefits of climate action
(in section 5).
Even with lower or positive economic impacts overall, we continue to emphasise
the importance of a more granular analysis, particularly focussed on regional,
sectoral and distributional impacts. We discuss these issues in Chapter 5.
There is a clear opportunity for a ‘green’ recovery from the COVID-19 pandemic.
Cost estimates are reported relative to a baseline of ‘no-further-climate-action’.
Chapter 5: Investment, costs and benefits of the Sixth Carbon Budget 242
Box 5.1 Different metrics in this chapter
This chapter discusses many different measures of cost, which have different
applications:
• Change in capital investment. Additional capital investment reflects the in-year
spending required to deploy a given measure of abatement (excluding cost of
capital). Much of the costs of this investment will be annualised through financial
products and services, meaning that end payers (e.g. electricity users) will likely spread payments over longer time periods and also incur an additional cost of
capital. However, the initial spending, and therefore stimulus, will occur in the years of
the investment.
• Change in operational costs. Additional operating costs refer to the difference in in-
year running costs between an abatement measure and the technology it replaces.
For example, the difference in cost between buying gas for a boiler and electricity for
a heat pump that replaces it. In most cases operating costs fall.
• Annualised resource costs. Annualised resource costs are estimated by adding up costs and savings from carbon abatement measures and comparing them to costs in
an alternative scenario of no-further-climate-action. Capital investments are
annualised and include costs of capital so that capital-intense and fuel-intense
technologies are more easily compared. Broadly, annualised resource costs measure the extra amount that needs to be spent each year to deliver the same services
without emissions. This has been our headline measure for reporting economy-wide
costs in previous reports, such as our 2019 Net Zero report and our 2015 advice on the
Fifth Carbon Budget.
– For example, installing energy efficiency measures (e.g. loft insulations,
cavity wall insulations) in homes has an upfront cost but reduces demand
and emissions.
– There is an investment cost from installing the measures (e.g. labour costs, costs of building materials) followed by an ongoing stream of fuel and cost
savings as well as costs of capital. The annualised resource cost measures
its annualised investment costs less its cost savings.
– This exercise is applied to all abatement measures in the economy to
estimate total annualised resource costs. We treat demand-side measures
(e.g. changes in travel choices and diets) as hav ing zero cost – they would generally have operating cost savings but could also imply welfare losses
(though we note that the changes in our scenarios, such as a shift to
walking and cycling, could well be welfare enhancing).
• GDP impacts. As resource costs do not consider the structural changes implied by
different costs (for example, the effect of shifting resources from imported fossil fuels
to UK investment), we consider also the wider macroeconomic impact through economic modelling. Further impacts could result from increasing business
confidence to invest and through capturing some of the value of growing global
markets for low-carbon goods and services.
• Co-impacts. The changes in our scenarios imply important additional impacts, which
are generally positive, such as for health and the environment. Although it is possible
to monetise these, the evidence is incomplete and they generally do not map clearly to the economic measures above. As with the impacts of climate change that we
are seeking to mitigate, they are often better understood in terms of their actual
impact (e.g. as the number of lives potentially saved), so we present them separately
to the economic figures.
243 Sixth Carbon Budget – The path to Net Zero
2. Capital investment and operational savings
The Net Zero transition will be capital intensive as many low-carbon technologies
have high upfront investment cost, in return for low ongoing operational costs. This
represents a change from the technologies they are replacing, which tend to
have higher ongoing costs but lower upfront costs.
This section considers those two components of cost in turn: required investment
upfront and then savings in operational costs. Section 3 then combines these
elements to show a holistic view of annualised resource costs on the path to Net
Zero.
This section is in two parts:
a) Investment required for the Net Zero transition
b) Operating costs and savings
a) Investment required for the Net Zero transition
i) What our ‘investment’ estimates measure
This section sets out estimates for the additional in-year gross capital investment of
building a low-carbon economy.
• The investment estimates represent the additional cost of purchasing or
installing low-carbon technologies and providing the associated
infrastructure for a low-carbon system, compared to a high-carbon system.
We do not deduct reduced downstream investment, for example in fossil
fuel extraction (but the reduced costs of purchasing fossil fuels are included
in our operating cost savings below).
• They are ‘money out the door’ in a given year, recognising that some
assets take multiple years to build (e.g. a wind farm), and are presented in
real £2019 values. We do not attempt to split out supply chain investments
or development spending that may occur earlier in reality and may or may
not take place in the UK.
• The investment estimates do not include the costs of borrowing (we cover
cost of capital in the section 3).
As an example, transport sector ‘investment’ includes the additional upfront cost
(not the finance payments) in each year of electric vehicle purchases compared
to if fossil-fuelled vehicles had been bought instead, to which we add costs of
additional charging infrastructure. We do not include investment in factories to
produce electric vehicles or their batteries, nor do we reflect lower investment in
fossil fuel extraction, refining or distribution. This avoids double-counting costs that
are components of the costs of vehicles and their fuels.
ii) The investment estimates
In our Balanced Net Zero Pathway, this in-year capital investment ramps up
significantly during the 2020s and early 2030s from around £10 billion in 2020 to
around £50 billion by 2030.
Investment estimates are the in-year additional cost of purchasing or installing low-carbon technologies compared to a high-carbon system.
Chapter 5: Investment, costs and benefits of the Sixth Carbon Budget 244
It remains at approximately this level or slightly above until 2050 (Figure 5.1). By
comparison, Gross Fixed Capital Formation in the UK in 2019 was approximately
£390 billion (17% of GDP).*
We have not explicitly modelled in-year capital investment post-2050, but it is likely
that it will decrease as costs of low-carbon technologies continue to fall and as
capital replacements can be deployed more cheaply than the projects they
replace.
While all sectors considered require additional capital investment relative to the
no-action counterfactual, the main drivers of additional capital expenditure are:
• Electricity supply (yellow in Figure 5.1). The additional capital investment
(on average £15 billion over the Sixth Carbon Budget period) reflects the
upfront cost of building capital-intensive low-carbon capacity such as wind
farms, as well as the need to at least double the size of the electricity sector
by 2050. The investment is considerably larger than for gas-fired power
plants and confers later savings in fuel use. The additional investment falls
after the 2030s as the required build rate for low-carbon capacity begins to
fall and as costs of low-carbon technologies fall.
• Fuel supply (grey green) covers the investment to build production and
storage facilities for a low-carbon hydrogen supply.
• Networks (grey). Networks refer to the infrastructure investment (i.e. ‘pipes
and wires’) required to enable our pathways, principally investment in
electricity transmission and distribution networks, but also development of
Carbon Capture and Storage (CCS) infrastructure. In our scenarios,
deployment of electricity network infrastructure tracks the demand and
capacity of electricity generation.† It therefore increases over time. Should
this deployment be front loaded to ‘future-proof’ the electricity network this
investment will occur earlier.
• Surface transport (purple). Additional investment in this sector mainly refers
to the higher upfront purchase price of zero-emissions vehicles and the
costs of the supporting charging/refuelling infrastructure. Although we
expect battery costs to fall, we assume that conventional cars would also
have become cheaper if they remained mass market, so our estimates
reflect a continued upfront premium for electric cars throughout the period
– this is likely to be conservative but remains much smaller than the resulting
fuel saving. The rise from the 2030s reflects the large-scale roll-out of low-
carbon HGVs which have higher upfront costs than fossil-fuelled
alternatives.
• Buildings (orange). Investment in energy efficiency measures, such as
insulation, are prioritised between 2020 and 2030 in our analysis, explaining
the initial ramp up in investment. From 2030 onwards, the primary driver of
additional capital investment is the deployment of low-carbon heating,
especially heat pumps, in residential and non-residential buildings. Heat
pumps are more efficient than gas boilers, but more expensive to install.
* Our investment estimates do not directly align with ONS’s GFCF data. Differences in the calculations include
transport and retrofitting housing. Whilst investment in transport equipment is included in GFCF, increased upfront
spending for private car purchases is not – this is captured under ONS consumer spending. Permanent fixtures
installed in residences are captured under GFCF, but boilers and heat pumps would be captured under ONS
consumer spending. Nevertheless, GFCF provides a useful comparator for economy-wide investment.
† This excludes network balancing costs (e.g. storage and frequency management). These costs are estimated to be
around £1 billion per annum.
The Sixth Carbon Budget requires a large investment programme, worth around £50 billion each year from 2030 to 2050.
Most of this investment is in electricity generation, energy networks, buildings and surface transport.
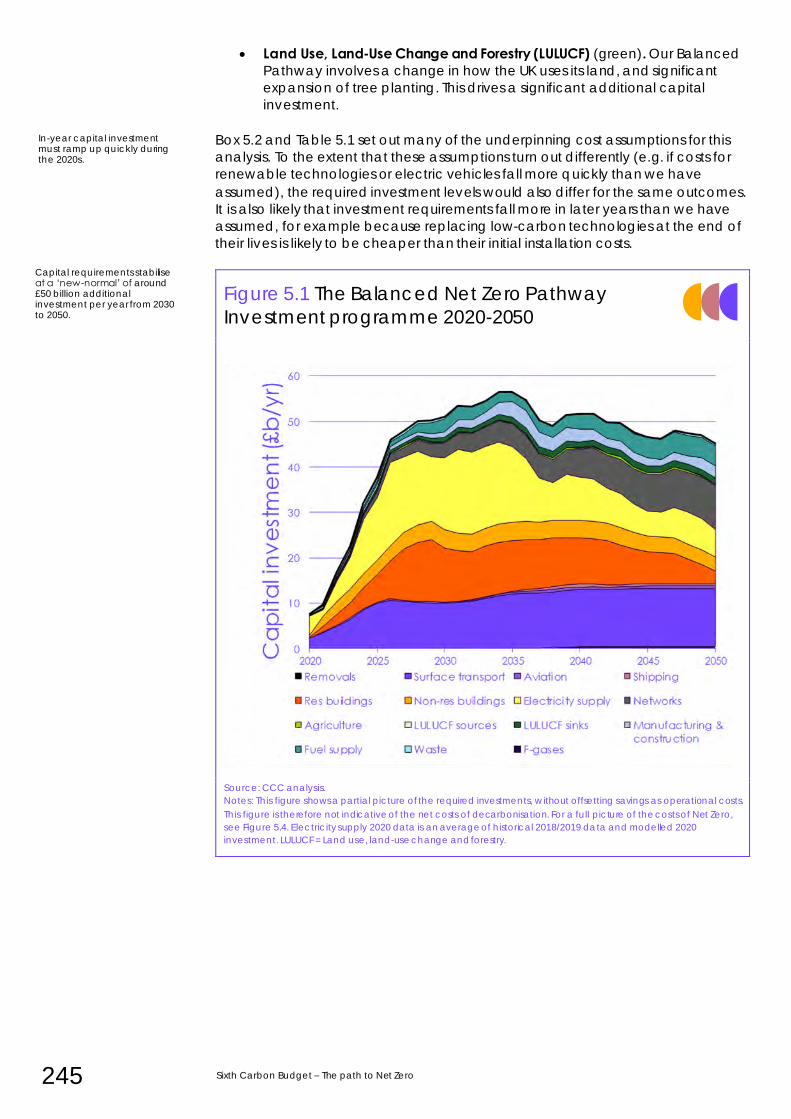
245 Sixth Carbon Budget – The path to Net Zero
• Land Use, Land-Use Change and Forestry (LULUCF) (green). Our Balanced
Pathway involves a change in how the UK uses its land, and significant
expansion of tree planting. This drives a significant additional capital
investment.
Box 5.2 and Table 5.1 set out many of the underpinning cost assumptions for this
analysis. To the extent that these assumptions turn out differently (e.g. if costs for
renewable technologies or electric vehicles fall more quickly than we have
assumed), the required investment levels would also differ for the same outcomes.
It is also likely that investment requirements fall more in later years than we have
assumed, for example because replacing low-carbon technologies at the end of
their lives is likely to be cheaper than their initial installation costs.
Figure 5.1 The Balanced Net Zero Pathway
Investment programme 2020-2050
Source: CCC analysis.
Notes: This figure shows a partial picture of the required investments, without offsetting savings as operational costs.
This figure is therefore not indicative of the net costs of decarbonisation. For a full picture of the costs of Net Zero,
see Figure 5.4. Electricity supply 2020 data is an average of historical 2018/2019 data and modelled 2020
investment. LULUCF = Land use, land-use change and forestry.
In-year capital investment must ramp up quickly during the 2020s.
Capital requirements stabilise at a ‘new-normal’ of around £50 billion additional investment per year from 2030 to 2050.
Chapter 5: Investment, costs and benefits of the Sixth Carbon Budget 246
Box 5.2 Cost assumptions for our Balanced Net Zero Pathway
Some of the key technologies required to achieve Net Zero have proven to be far
cheaper than even the most optimistic forecasts. There is also potential for as-yet-
unknown technologies to emerge in the next 30 years that further reduce costs. Th is could
enable faster, cheaper progress to be made reducing the UK’s emissions to zero.
The Committee discussed in detail the impacts that innovation has on costs in our 2019
Net Zero report (see Chapter 7).6 The costs and benefits of mass production have
continued to become clear. As in our 2019 report, we have been conservative in our
assumptions around falling cost of different technologies. Our Widespread Innovation
scenario explores how costs might fall further. Our Balanced Pathway reflects the
following key assumptions:
• Renewable power generation. We have assumed modest reductions in the cost of
renewables, incorporating the most recent offshore wind auction prices. There remains
scope for costs of these technologies to fall further through learning-by-doing during
deployment, which continues to increase globally.
• Nuclear power. Nuclear is a mature technology, but we assume cost reductions for future plants after Hinkley Point C from utilising similar plant design and lower-cost
financing arrangements (which the Government are currently considering).
• Batteries. Batteries, like renewables, are commercialised at scale and have come
down in cost significantly in recent years. With significant increases in expected roll-out
of electric vehicles globally, cost reductions should continue.
• Heat pumps. Heat pumps follow similar assumptions to our Net Zero report. We assume
no major decreases in the cost of the technology, but future cost savings should arise
from efficiencies in installation as the UK industry scales up. This may be a conservative assumption overall, as equipment costs could also fall, for example if different heat
pump technologies are developed, or reflecting that the air-to-water heat pumps
expected in the UK are a much less established technology.
• Hydrogen. The hydrogen used in our scenarios is assumed to come mainly from
electrolytic production of hydrogen using renewables and gas reformation in the UK
with CCS. While reformation currently appears to be the lowest-cost option, we do not expect large cost reductions. We do expect cost reductions in the capital costs of
electrolyser technologies, though the majority of the cost is likely to remain the
operating costs of the technology. Towards 2050, as renewables make up a large
proportion of the electricity mix, we see opportunities for low-cost electrolytic
hydrogen to be produced by renewable electricity that may otherwise be curtailed.
• Carbon capture and storage. CCS is still at the technology development and demonstration phase, although 51 large-scale projects are now operating or under
development around the world.7 Commercialisation and wide scale development of
CCS is likely to be needed globally as decarbonisation efforts increase. There is scope
for cost reductions in capture plants as the technology enters this development stage
and less scope for cost reductions in CCS transport and storage infrastructure.
• Bioenergy with CCS (BECCS). Sustainable harvested biomass or biogenic waste sources used with CCS results in negative emissions. Our scenarios include costs for a
range of BECCS applications (e.g. producing electricity, hydrogen, av iation biofuels
and industrial combustion) which can provide similar overall net emissions reductions.
Though our scenarios are conservative on the cost assumptions for CCS, we do see some opportunities for retrofitting of CCS plant to existing bioenergy facilities to reduce
overall BECCS costs. Almost all bioenergy facilities install CCS by 2050.
• Direct air capture of CO2 with storage (DACCS). Direct Air Capture is currently at the
pilot stage, with a small number of test facilities in operation globally. Given the early
stage of development, costs of DACCS both now and at larger scales in the future are
highly uncertain. Our scenarios suggest that the cost of DACCS could fall by 50-70% compared to today. The modular nature of DACCS could see faster cost reductions
with mass roll-out, although energy requirements are likely to remain high. Direct Air
Capture of CO2 can also be combined with low-carbon hydrogen to produce
synthetic transport fuels, although costs will be higher than DACCS.
Source: CCC analysis.
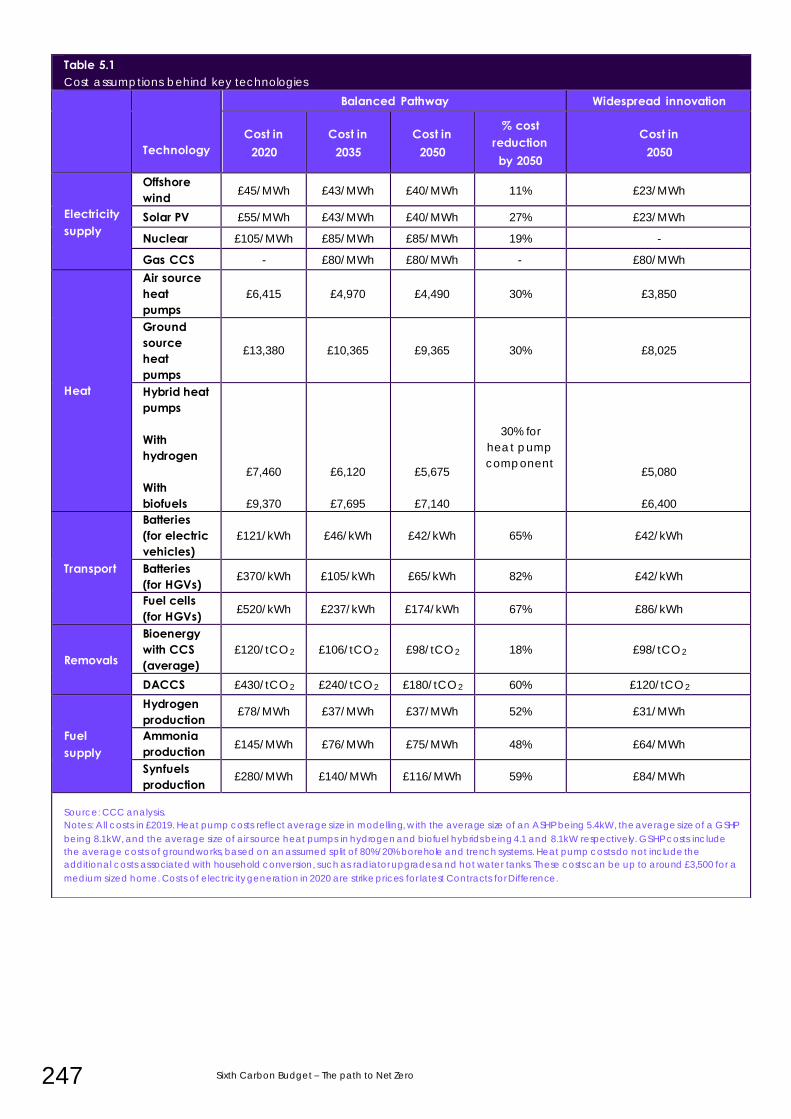
247 Sixth Carbon Budget – The path to Net Zero
Table 5.1 Cost assumptions behind key technologies
Technology
Balanced Pathway Widespread innovation
Cost in 2020
Cost in 2035
Cost in 2050
% cost reduction by 2050
Cost in 2050
Electricity supply
Offshore wind £45/MWh £43/MWh £40/MWh 11% £23/MWh
Solar PV £55/MWh £43/MWh £40/MWh 27% £23/MWh
Nuclear £105/MWh £85/MWh £85/MWh 19% -
Gas CCS - £80/MWh £80/MWh - £80/MWh
Heat
Air source heat pumps
£6,415 £4,970 £4,490 30% £3,850
Ground source heat pumps
£13,380 £10,365 £9,365 30% £8,025
Hybrid heat pumps With hydrogen With biofuels
£7,460
£9,370
£6,120
£7,695
£5,675
£7,140
30% for
heat pump
component
£5,080
£6,400
Transport
Batteries (for electric vehicles)
£121/kWh £46/kWh £42/kWh 65% £42/kWh
Batteries (for HGVs)
£370/kWh £105/kWh £65/kWh 82% £42/kWh
Fuel cells (for HGVs) £520/kWh £237/kWh £174/kWh 67% £86/kWh
Removals
Bioenergy with CCS (average)
£120/tCO2 £106/tCO2 £98/tCO2 18% £98/tCO2
DACCS £430/tCO2 £240/tCO2 £180/tCO2 60% £120/tCO2
Fuel supply
Hydrogen production
£78/MWh £37/MWh £37/MWh 52% £31/MWh
Ammonia production £145/MWh £76/MWh £75/MWh 48% £64/MWh
Synfuels production
£280/MWh £140/MWh £116/MWh 59% £84/MWh
Source: CCC analysis.
Notes: All costs in £2019. Heat pump costs reflect average size in modelling, with the average size of an ASHP being 5.4kW, the average size of a GSHP
being 8.1kW, and the average size of air source heat pumps in hydrogen and biofuel hybrids being 4.1 and 8.1kW respectively. GSHP costs include
the average costs of groundworks, based on an assumed split of 80%/20% borehole and trench systems. Heat pump costs do not include the
additional costs associated with household conversion, such as radiator upgrades and hot water tanks. These costs can be up to around £3,500 for a
medium sized home. Costs of electricity generation in 2020 are strike prices for latest Contracts for Difference.
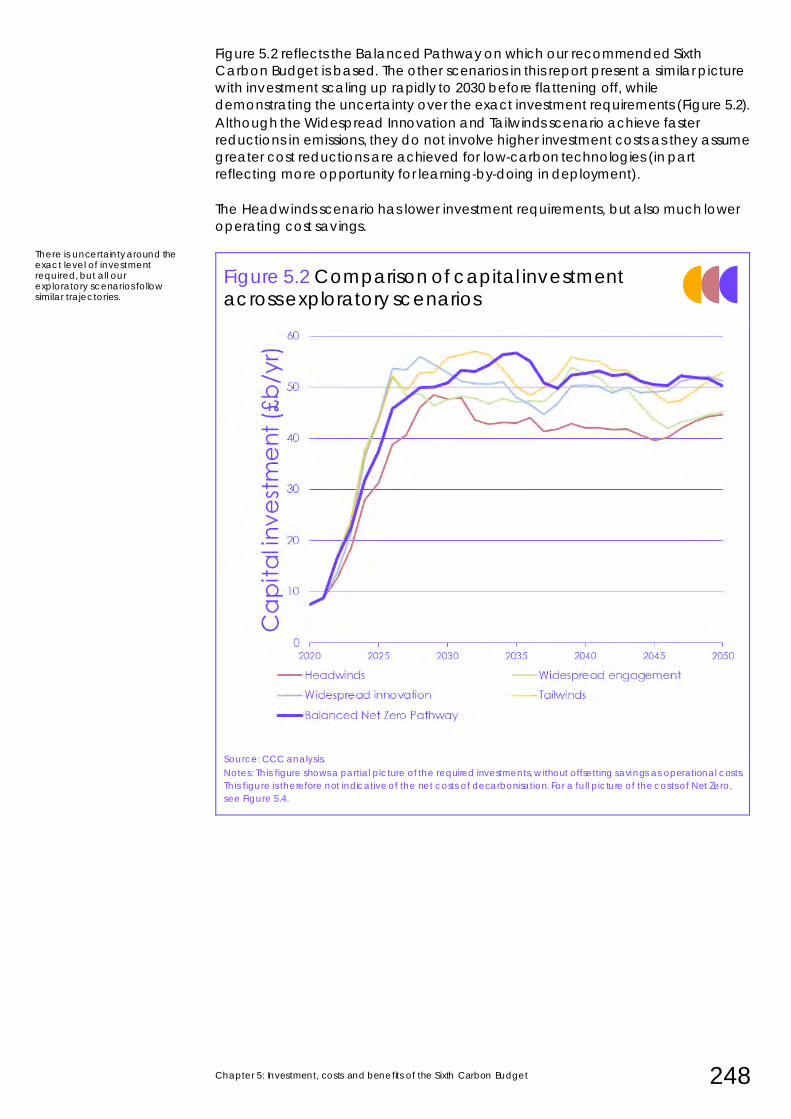
Chapter 5: Investment, costs and benefits of the Sixth Carbon Budget 248
Figure 5.2 reflects the Balanced Pathway on which our recommended Sixth
Carbon Budget is based. The other scenarios in this report present a similar picture
with investment scaling up rapidly to 2030 before flattening off, while
demonstrating the uncertainty over the exact investment requirements (Figure 5.2).
Although the Widespread Innovation and Tailwinds scenario achieve faster
reductions in emissions, they do not involve higher investment costs as they assume
greater cost reductions are achieved for low-carbon technologies (in part
reflecting more opportunity for learning-by-doing in deployment).
The Headwinds scenario has lower investment requirements, but also much lower
operating cost savings.
Figure 5.2 Comparison of capital investment across exploratory scenarios
Source: CCC analysis.
Notes: This figure shows a partial picture of the required investments, without offsetting savings as operational costs.
This figure is therefore not indicative of the net costs of decarbonisation. For a full picture of the costs of Net Zero,
see Figure 5.4.
There is uncertainty around the exact level of investment required, but all our exploratory scenarios follow similar trajectories.
249 Sixth Carbon Budget – The path to Net Zero
b) Operating costs and savings i) What our ‘operating cost’ estimates measure
This section sets out estimates for the additional operating costs or savings that
occur in-year through operating a low-carbon system. As the low-carbon system is
typically more energy efficient, operational costs are generally cost saving and
represent a pay back on the investments outlined above:
• The operating cost estimates represent additional costs or saving of running
low-carbon solutions once they have been deployed relative to the cost of
the high-carbon option they replace.
• There are costs or savings each year. For example, the avoided
maintenance costs of electric vehicles would be an operational saving, as
would the savings in petrol and diesel to run the vehicle. The cost of buying
the vehicle would not be included, as we include that in our estimates of
investment above.
• As for all of our cost estimates, we do not include the impacts of taxes or
other transfers.
Most of the costs of generating low-carbon electricity are in the upfront costs of
building generation capacity (with the exception of generation with carbon
capture and storage, where the fuel costs are more important).8 Since those costs
are included in our investment figures, we do not ‘double count’ the costs of using
that electricity to power electric vehicles or heat pumps. We also allocate the
small remaining operational cost for operating a low-carbon electricity system to
the electricity sector.
ii) The operating cost implications of the Balanced Pathway
Many - though not all - of the technologies deployed in our Balanced Net Zero
Pathway have considerably lower running costs than the alternatives they replace.
The transport sector has by far the largest opportunity to save costs, with some
further savings available for buildings and electricity supply.
• Electric vehicles and HGVs. Electrified surface transport is far more efficient
than high-carbon alternatives and has significantly lower maintenance
costs. Overall, this can deliver annual operating cost savings of over £30
billion by 2050. The majority of this (over £20 billion) is from eliminating the
need for petrol and diesel in road vehicles (noting that the costs of
electrification are largely reflected in the increased investment cost in
vehicles and generating capacity). A further £7 billion is saved in annual
maintenance, reflecting the fewer moving parts associated with electric
drivetrains. Electrifying and improving efficiency for rail saves a further £4
billion.
• Electricity supply. Low-carbon electricity generation is typically capital-
intensive. It has high upfront costs and low costs in operation, in particular
by avoiding fuel costs. The complete decarbonisation of the electricity
sector by 2035 in our Balanced Pathway reduces operating costs by
around £10 billion per year relative to the high-carbon alternative, even
allowing for the operational costs of meeting the extra demand from
electrification.*
* Low-carbon generation already makes up around half of UK electricity generation, otherwise savings would be
higher.
Many of the technologies deployed during the transition have considerably lower running costs than the alternatives they replace.
Electric vehicles are far more efficient than fossil-fuel powered alternatives and their deployment will result in operating savings of over £30 billion per year by 2050.
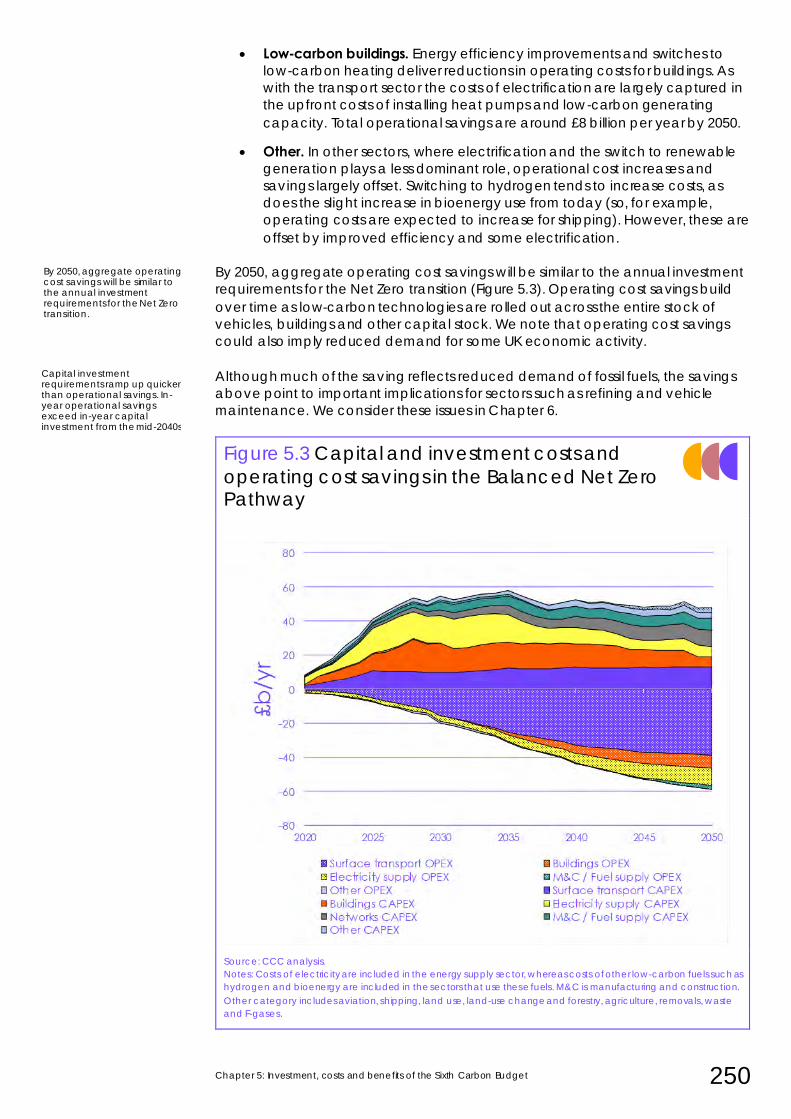
Chapter 5: Investment, costs and benefits of the Sixth Carbon Budget 250
• Low-carbon buildings. Energy efficiency improvements and switches to
low-carbon heating deliver reductions in operating costs for buildings. As
with the transport sector the costs of electrification are largely captured in
the upfront costs of installing heat pumps and low-carbon generating
capacity. Total operational savings are around £8 billion per year by 2050.
• Other. In other sectors, where electrification and the switch to renewable
generation plays a less dominant role, operational cost increases and
savings largely offset. Switching to hydrogen tends to increase costs, as
does the slight increase in bioenergy use from today (so, for example,
operating costs are expected to increase for shipping). However, these are
offset by improved efficiency and some electrification.
By 2050, aggregate operating cost savings will be similar to the annual investment
requirements for the Net Zero transition (Figure 5.3). Operating cost savings build
over time as low-carbon technologies are rolled out across the entire stock of
vehicles, buildings and other capital stock. We note that operating cost savings
could also imply reduced demand for some UK economic activity.
Although much of the saving reflects reduced demand of fossil fuels, the savings
above point to important implications for sectors such as refining and vehicle
maintenance. We consider these issues in Chapter 6.
Figure 5.3 Capital and investment costs and
operating cost savings in the Balanced Net Zero Pathway
Source: CCC analysis.
Notes: Costs of electricity are included in the energy supply sector, whereas costs of other low-carbon fuels such as
hydrogen and bioenergy are included in the sectors that use these fuels. M&C is manufacturing and construction.
Other category includes aviation, shipping, land use, land-use change and forestry, agriculture, removals, waste
and F-gases.
By 2050, aggregate operating cost savings will be similar to the annual investment requirements for the Net Zero transition.
Capital investment requirements ramp up quicker than operational savings. In-year operational savings exceed in-year capital investment from the mid-2040s.
251 Sixth Carbon Budget – The path to Net Zero
iii) Financing the Net Zero investment programme
Now is an ideal time for the UK to invest. There are historically low interest rates and
a potential demand shortage for that cheap capital. Economic recovery from the
COVID-19 pandemic necessitates stimulus and many of the measures detailed in
this report have been shown to have high economic multipliers. The challenge for
Government is to make sure sufficient investment comes forward and to design
policies to ensure that is done at the lowest possible cost.
The Committee convened an expert advisory group to explore how the investment
programme required to deliver the Sixth Carbon Budget could be financed, and
what mechanisms could help to do this at lowest cost (Box 5.3).
Our advisory group concluded that the ‘depth of the UK’s capital markets along
with its growing expertise in sustainable finance means that this significant ramp-up
in the scale of investment is eminently deliverable.’
Key to scaling up financing will be implementing real-economy policies to ensure
enough demand for finance (for example, stimulating the demand in the
residential buildings sector to retrofit homes with low-carbon heating). The group’s
policy recommendations, including for a National Investment Bank, are
summarised in Box 5.3 and set out in more detail in the Committee’s
accompanying Policy Report and in the group’s own report. 9
While the aggregate investment programme is clearly large and would materially
affect the economy, the scale of change is not dissimilar to those observed over
recent decades.
• UK aggregate investment has fluctuated since 1970 between 15% and 28%
of GDP and was near the bottom of that range in 2019 at 17%.10 Delivering
the additional capital investment outlined would raise UK investment to
around 20% of GDP (if other investments remain the same).
• The UK power sector has already scaled up annual investment since 2004
from around £4 billion to around £18 billion in the late 2010s as renewable
deployment increased, driven by effective policy support.11 Contracts have
already been awarded through Government auctions to increase that
further into the mid-2020s in line with our Pathway.
• The £10 billion increase in annual spending on vehicles can be compared
to a (real terms) increased spend on cars of around £4 billion over the last
decade and £10 billion in the previous decade.12 More recently, increased
costs reflect a trend towards larger cars, especially SUVs. That shift would
have increased motoring costs, whereas the extra £10 billion required
largely to shift to electric vehicles will bring large cost savings.
• Between 2010 and 2019, yearly investments in renovating residential
buildings increased from £27 billion to £32 billion. The 2013 homes energy
efficiency programme resulted in approximately £1.4 billion of additional
investment per year. Larger increases also occurred in new buildings. 13
It is therefore reasonable to expect that the required increase in investment will be
deliverable by private firms and individuals provided effective policy is used to
ensure that these investments can be profitable.
Now is an ideal time to invest, with historically low interest rates and a need for economic stimulus.
The UK is well positioned to deliver the investment required to achieve Net Zero, so long as policy is well designed.
The scale-up in investment needed is large but has abundant historical analogues.
Chapter 5: Investment, costs and benefits of the Sixth Carbon Budget 252
Box 5.3 Expert Advisory Group on financing Net Zero
In March 2020, the CCC convened an expert advisory group on Net Zero finance to
advise on the question: What is the role for finance in delivering the Sixth Carbon Budget
and how can Government support it at least cost?
The group was chaired by Professor Nick Robins of the London School of Economics
supported by Roberta Pierfederici, and consisted of Andy Howard (Schroders), Dr Ben
Caldecott (Oxford University), Daniel Klier (HSBC), Ingrid Holmes (Federated Hermes),
Rishi Madlani (RBS), Dr Rhian-Mari Thomas (Green Finance Institute) and Steve Waygood
(Aviva).
The group were convened for four meetings between March and September 2020.
During these meetings the group mapped the financial system’s current ability to deliver
a Net Zero target, analysed the investment requirements to deliver the CCC’s Balanced
Pathway, identified potential barriers to delivery, and discussed issues relating to fairness
and just transition. An additional meeting was scheduled to specifically analyse the
impacts of COVID-19 on the UK’s ability to achieve Net Zero.
The report made many observations and conclusions about the current state of the UK
financial sector and its future ability to deliver Net Zero and the Sixth Carbon Budget.
The key outputs of the report were 15 specific recommendations as well as guiding
principles for Government and the sector.
Headline conclusions of the report: • Deliverability of investment programme. The depth of the UK’s capital markets and its
globally leading position in sustainable finance mean that the significant ramp up of
capital investment needed is wholly achievable, providing that key barriers are
addressed.
• COVID-19 has deepened rather than deflected financial sector commitment to
climate action. The way that the UK exits the economic crisis associated with the pandemic will profoundly shape its ability to meet climate targets, whilst also being
an opportunity to achieve broader economic and equity goals.
• Systemic interventions. Delivering the investment programme will require the UK
financial system to adapt so that it is fit for the Net Zero age. This will require all
aspects of the system to undergo shifts including public finance at all levels of
Government and institutions, private finance, regulators and end-users.
Recommendations of the report:
• Strategic recommendations. The UK should commit to be the world’s first Net Zero
financial system, focus on making Net Zero projects and plans investable and design
all Net Zero policies so that investments are resilient, fair and enable local action.
• Private finance recommendations. The UK should publish both sector-specific
strategies and system-wide instruments to enable market innovation. Climate skills and knowledge of the UK’s financial practitioners should be deepened. The literacy,
expertise and confidence of the end users of financial services should be built to
increase demand for climate-aligned products.
• Financial regulation recommendations. The UK should fully integrate climate risk and
Net Zero into financial regulation and monetary policy. Net Zero targets should be
made mandatory for financial institutions. Investor stewardship should be extended to incorporate achievement of Net Zero. Clear metrics are needed for the Net Zero
transition at an institutional and investment level.
• Public finance recommendations. The post-COVID-19 recovery plan should be used
to fast track climate investment, reset fiscal investment and connect public debt with
climate goals. Net Zero and sustainability goals should be set for existing public
financial institutions. A National Investment Bank with a clear green mandate should
be established.
• International recommendations. The UK should build the international frameworks
needed that can accelerate the financing of Net Zero, resilience and just transition.
253 Sixth Carbon Budget – The path to Net Zero
• Tracking recommendations. The UK should establish a regular assessment of
investment needs and financial flows for climate action in the UK.
Principles outlined in the report: • The investment requirement to achieve Net Zero can be met if effective policies and
market frameworks are in place.
• The mindset needs to shift from measuring the risks of climate change on finance to
the alignment of finance with Net Zero, resilience and just transition.
• Real-economy policies need to be investable to attract increased amounts of
capital at low cost.
• Financial policy and regulations need to be designed with Net Zero in mind and
institutional gaps filled to increase the efficiency of capital intermediation.
• Successful Net Zero financing depends on an effective financial architecture.
Tracking financial flows
The group highlighted the importance of increased tracking of capital into different areas of the UK’s economy. To enable this, the UK financial sector will need to be capable of classifying ‘green’, ‘brown’ and ‘grey’ investments.
• Green investments. Investments into low-carbon technologies or sectors (e.g. a
company that exclusively builds wind turbines).
• Brown investments. Investments into high-carbon, non-transitioning technologies or
sectors (e.g. a company specialised in building coal fired power plants with no CCS).
• Grey investments. These investments are more difficult to classify, and refer to
technologies or sectors that may be transitioning, or capable of transitioning (e.g. a
utilities company with high current emissions but a robust Net Zero target).
The Government should work with the financial sector to create clear guidance as to
what composes a green, brown and grey investment, and how they should be treated in ESG portfolios. The recent announcements by HMT are positive first steps (Box 5.5).
Tracking these flows will require a new or expanded institution, distinct from Government,
with analytical capability and expertise in the financial sector.
Source: The Road to Net Zero Finance, CCC Advisory Group on Finance. Professor Nick Robins, Roberta
Pierfederici, Dr Ben Caldecott, Ingrid Holmes, Andy Howard, Daniel Klier, Rishi Madlani, Dr Rhian-Mari Thomas and
Steve Waygood.
Chapter 5: Investment, costs and benefits of the Sixth Carbon Budget 254
3. Annualised resource costs during the transition
Section 2 presented the large investment programme for our Net Zero pathways
and the significant operational savings that it yields over time. Investment costs
were allocated to the years in which the investments occurred, not spread over
the lifetimes of those investments based on an assumed cost of capital.
This section annualises the investment costs to present the annualised resource
costs for our scenarios, which is the basis on which we have presented costs in
previous reports, including our 2019 Net Zero report. We find annualised resource
costs that are expected to peak at less than 1% of GDP during the Sixth Carbon
Budget period, remain relatively constant through the 2030s and early 2040s.
This section is in four parts:
a) Annualised resource cost estimates
b) Average abatement cost estimates
c) Uncertainties and sensitivities on annualised resource cost estimates
d) Risks of higher costs and unintended consequences
a) Annualised resource costs to achieve the Sixth Carbon Budget
To calculate annualised resource costs we annualise the capital investment costs
over their lifetimes using a suitable cost of capital (Box 5.4) and subtract in-year
operating cost savings. The result indicates the extra spend required each year to
provide the same goods and services but in a low-carbon way. We aim to include
all relevant costs (for example, for electric vehicles we include the cost of buying,
running and maintaining the vehicle, the charging infrastructure including network
reinforcements, and ancillary costs such as insurance).
We report these annualised resource costs for comparability with our previous
estimates, but they should not be taken to imply an overall economic effect given
the important stimulus benefits that the investment programme can bring during
the recovery from the impact of the pandemic (section 4) as well as other co-
impacts (section 5), nor the avoided costs of additional climate change.
Our analysis indicates that the annualised resource cost of reducing GHG emissions
to Net Zero would rise towards 0.6% of GDP by the early 2030s, remain at
approximately this level through the 2030s and early 2040s, before falling to
approximately 0.5% by 2050. Our scenarios demonstrate the potential for slightly
higher or lower costs, all around 1% of GDP or less (Figure 5.4).
This is lower than the estimates in our Net Zero report for the costs of meeting the
Net Zero 2050 target (1-2% of GDP), which themselves were in line with the cost
deemed acceptable by Parliament when the Climate Change Act was passed for
an 80% target in 2008.
Annualised resource costs are the net of annualised capital investments (including cost of capital) and the in-year cost savings.
Annualised resource costs of meeting the Sixth Carbon Budget would rise toward around 0.6% of GDP by the early 2030s.
Our updated cost estimates are lower than estimated in our 2019 Net Zero report.
255 Sixth Carbon Budget – The path to Net Zero
The change reflects new evidence and new assumptions: *
• Cheaper electricity. Our latest technology costs for low-carbon electricity
are lower than assumed previously. This reduces costs for the electricity
sector and for sectors where electrification is an important option. This is
based upon more recent costs of key renewable energy technologies
reducing dramatically. In 2019 we assumed that the cost of offshore wind
would be £50/MWh by 2050. In early 2020, the Government awarded
contracts at just over £45/MWh for projects commissioned in 2023-25.
• Increased deployment of lower-cost technologies. Some sectors see
reduced costs because of more extensive roll-out of lower-cost low-carbon
technologies, which our updated analysis suggests is feasible. For example,
in the electricity supply sector we assume a higher percentage of
renewables by 2050 than we did in our Net Zero report, and expect these
to be cheaper than CCS plants or nuclear power. In manufacturing and
construction, our detailed new research has indicated more scope for
lower cost electrification.
• Lower engineered removals. Our 2019 estimates included high estimates for
the cost of the final 4% of emissions reductions – we described the various
options as ‘Speculative’ and assumed a cost based on an estimate for the
cost of CO2 removal of up to £300/tCO2. Our detailed bottom-up
assessments for this report have identified and included more low-cost
options, including for changed behaviours, reducing the need for
expensive CO2 removals.
We continue to expect the highest annualised resource costs to occur in the
buildings and manufacturing and construction sectors and, in later years, from CO2
removal from the atmosphere (Figure 5.5). We expect significant cost savings from
the transport sector and in the longer-term from the electricity supply sector, with
relatively similar costs as in the no-action world for agriculture, aviation and waste.
These findings reflect the latest understanding of the costs of the most important
options, set out in subsection (d) below.
The balance of annualised resource costs across Scotland, Wales and Northern
Ireland is broadly in line with their shares of emissions.
* A small part of the impact is a result of our using a different baseline in this analysis. In 2019, we used a counterfactual
world where no action on climate had occurred. As discussed in section 1, the analysis in this report uses a baseline
of no-further-action. This means that a degree of the investment is already in the baseline in this analysis rather than
included in future costs. It also means some of the cost reductions from existing climate policy (e.g. vehicle and
building efficiency improvements that have already occurred) are not included. However, these changes are
offsetting and do not materially affect 2050 estimates, by when most investment cycles will have completed.
The highest annualised resource costs are expected in the buildings, removals and manufacturing and construction sectors.
Chapter 5: Investment, costs and benefits of the Sixth Carbon Budget 256
Box 5.4 Cost of capital and the importance of good policy
To calculate annualised resource costs we use a cost of capital of 3.5% for any
investments by Government or by households (e.g. purchase of electric cars and
installation of energy efficiency in homes) and a range of higher costs of capital for
investments by private companies (e.g. 6%-10% in the electricity supply sector
depending upon the technology used). Given current record-low interest rates, this is
arguably a conservative approach.
Good policy can ensure that the cost of capital is reduced significantly, bringing
material cost savings. Ensuring competition will also help cut costs and prices.
• To illustrate the impact that cost of capital could have upon the cost of the transition
the Finance advisory group proposed a best possible Weighted Average Cost of
Capital (WACC) as well as an illustrative high WACC – 1.5% and 7.5% respectively.
• The difference between a 1.5% and 7.5% WACC for the investment programme in Figure 5.1. is worth an additional £14 billion of annual borrowing costs (for an
illustrative 7.5 year payback period).
• While there is high uncertainty around the likely future costs of capital this analysis
indicates the importance of keeping costs of capital low through good policy.
The Finance advisory group (Box 5.3) pointed to the UK’s Electricity Market Reform as an
example of a well-designed, coherent and effective package of policies to encourage
low-carbon investment:
• A clear direction. Since the Climate Change Act was passed, it has been widely
understood that the power sector would have to decarbonise heavily given its high
emissions and to support electrification in other sectors.
• A stable, predictable carbon price. The UK introduced a carbon price floor in 2013 to
underpin the price in the EU Emissions Trading System.
• Investable market instruments. Following initial progress under the Renewables
Obligation, long-term contracts for low-carbon power generation were announced
in 2011, to be awarded by competitive auction. Emerging technologies (e.g. offshore
wind) were explicitly supported in addition to more mature options.
• Product standards. European efficiency standards for lights and household
appliances drove down electricity use as products were replaced over time with
more efficient models.
• Enabling measures. Potential blocks on progress were addressed, guided by public-
private collaboration, for example, through the Green Investment Bank.
A recent report indicated that the average Weighted Average Cost of Capital (WACC)
of UK offshore wind farms has decreased from over 10% in 2010 to below 7% in 2020.14
This has contributed nearly 20% of the cost reductions over the same period.
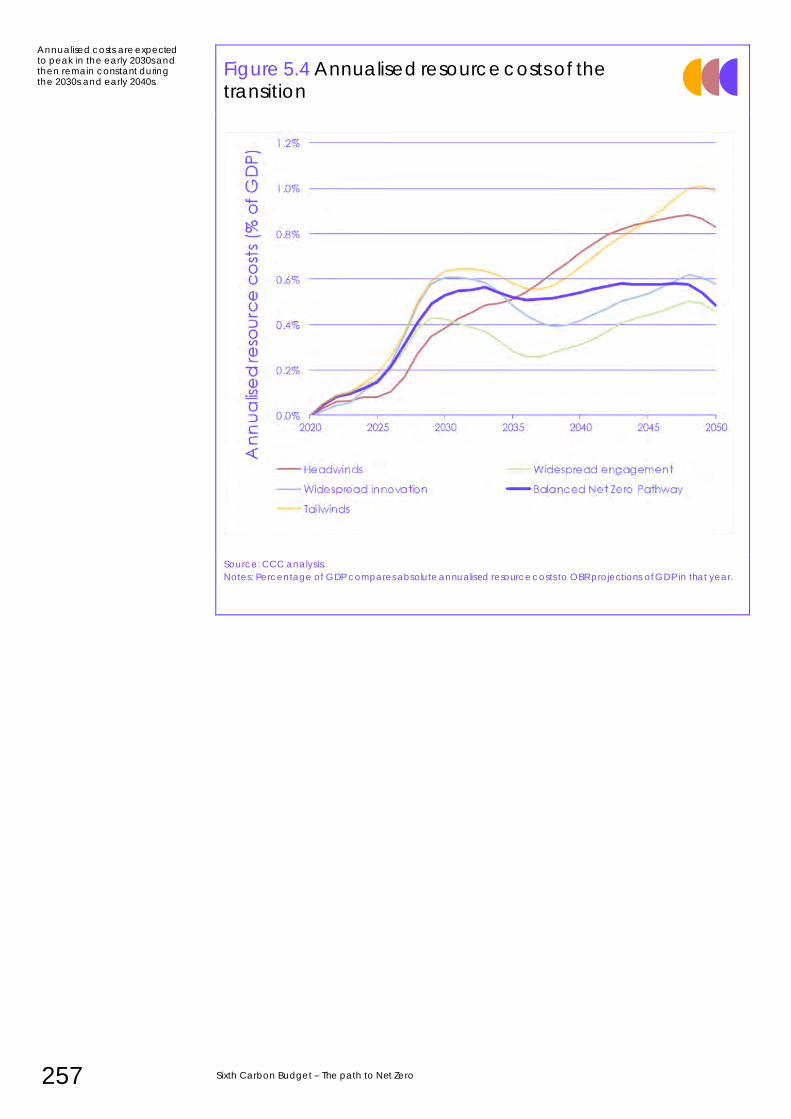
257 Sixth Carbon Budget – The path to Net Zero
Figure 5.4 Annualised resource costs of the transition
Source: CCC analysis.
Notes: Percentage of GDP compares absolute annualised resource costs to OBR projections of GDP in that year.
Annualised costs are expected to peak in the early 2030s and then remain constant during the 2030s and early 2040s.
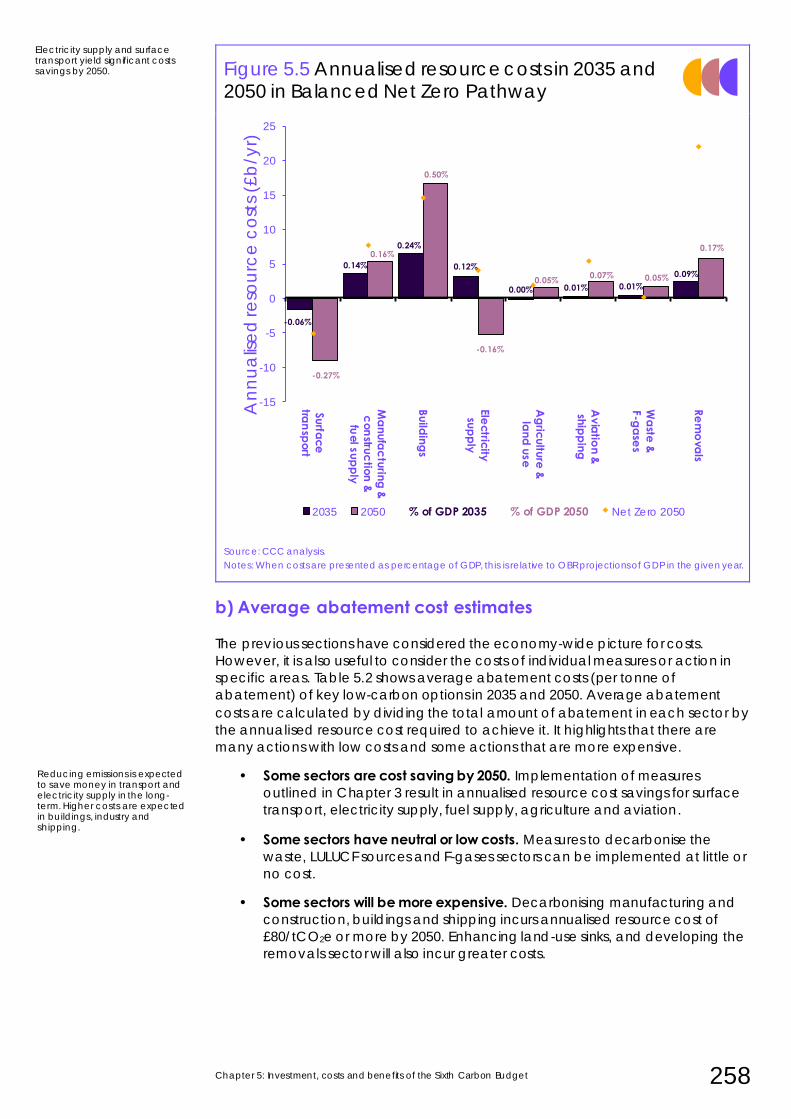
Chapter 5: Investment, costs and benefits of the Sixth Carbon Budget 258
Figure 5.5 Annualised resource costs in 2035 and 2050 in Balanced Net Zero Pathway
Source: CCC analysis.
Notes: When costs are presented as percentage of GDP, this is relative to OBR projections of GDP in the given year.
b) Average abatement cost estimates
The previous sections have considered the economy-wide picture for costs.
However, it is also useful to consider the costs of individual measures or action in
specific areas. Table 5.2 shows average abatement costs (per tonne of
abatement) of key low-carbon options in 2035 and 2050. Average abatement
costs are calculated by dividing the total amount of abatement in each sector by
the annualised resource cost required to achieve it. It highlights that there are
many actions with low costs and some actions that are more expensive.
• Some sectors are cost saving by 2050. Implementation of measures
outlined in Chapter 3 result in annualised resource cost savings for surface
transport, electricity supply, fuel supply, agriculture and aviation.
• Some sectors have neutral or low costs. Measures to decarbonise the
waste, LULUCF sources and F-gases sectors can be implemented at little or
no cost.
• Some sectors will be more expensive. Decarbonising manufacturing and
construction, buildings and shipping incurs annualised resource cost of
£80/tCO2e or more by 2050. Enhancing land-use sinks, and developing the
removals sector will also incur greater costs.
-0.06%
0.14%
0.24%
0.12%
0.00% 0.01% 0.01%0.09%
-0.27%
0.16%
0.50%
-0.16%
0.05% 0.07% 0.05%
0.17%
-15
-10
-5
0
5
10
15
20
25
Surfacetransport
Manufacturing &
construction &fuel supply
Buildings
Electricitysupply
Agriculture &land use
Aviation &
shipping
Waste &
F-gases
Removals
An
nu
alis
ed
reso
urc
e c
ost
s (£
b/y
r)
2035 2050 % of GDP 2035 % of GDP 2050 Net Zero 2050
Electricity supply and surface transport yield significant costs savings by 2050.
Reducing emissions is expected to save money in transport and electricity supply in the long-term. Higher costs are expected in buildings, industry and shipping.
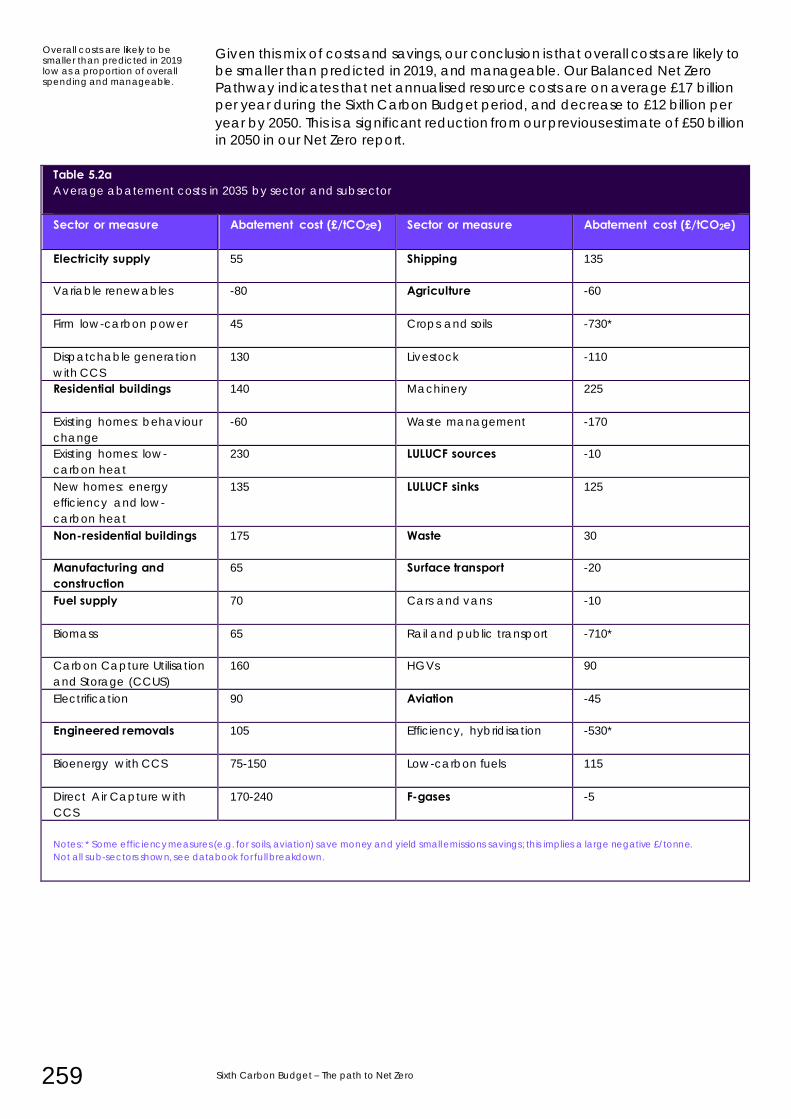
259 Sixth Carbon Budget – The path to Net Zero
Given this mix of costs and savings, our conclusion is that overall costs are likely to
be smaller than predicted in 2019, and manageable. Our Balanced Net Zero
Pathway indicates that net annualised resource costs are on average £17 billion
per year during the Sixth Carbon Budget period, and decrease to £12 billion per
year by 2050. This is a significant reduction from our previous estimate of £50 billion
in 2050 in our Net Zero report.
Table 5.2a Average abatement costs in 2035 by sector and subsector Sector or measure Abatement cost (£/tCO2e) Sector or measure Abatement cost (£/tCO2e)
Electricity supply
55 Shipping 135
Variable renewables
-80 Agriculture -60
Firm low-carbon power
45 Crops and soils -730*
Dispatchable generation
with CCS 130 Livestock -110
Residential buildings
140 Machinery 225
Existing homes: behaviour
change -60 Waste management -170
Existing homes: low-
carbon heat 230 LULUCF sources -10
New homes: energy
efficiency and low-
carbon heat
135 LULUCF sinks 125
Non-residential buildings
175 Waste 30
Manufacturing and construction
65 Surface transport -20
Fuel supply
70 Cars and vans -10
Biomass
65 Rail and public transport -710*
Carbon Capture Utilisation
and Storage (CCUS) 160 HGVs 90
Electrification
90 Aviation -45
Engineered removals
105 Efficiency, hybridisation -530*
Bioenergy with CCS
75-150 Low-carbon fuels 115
Direct Air Capture with
CCS 170-240 F-gases -5
Notes: * Some efficiency measures (e.g. for soils, aviation) save money and yield small emissions savings; this implies a large negative £/tonne.
Not all sub-sectors shown, see databook for full breakdown.
Overall costs are likely to be smaller than predicted in 2019, low as a proportion of overall spending and manageable.
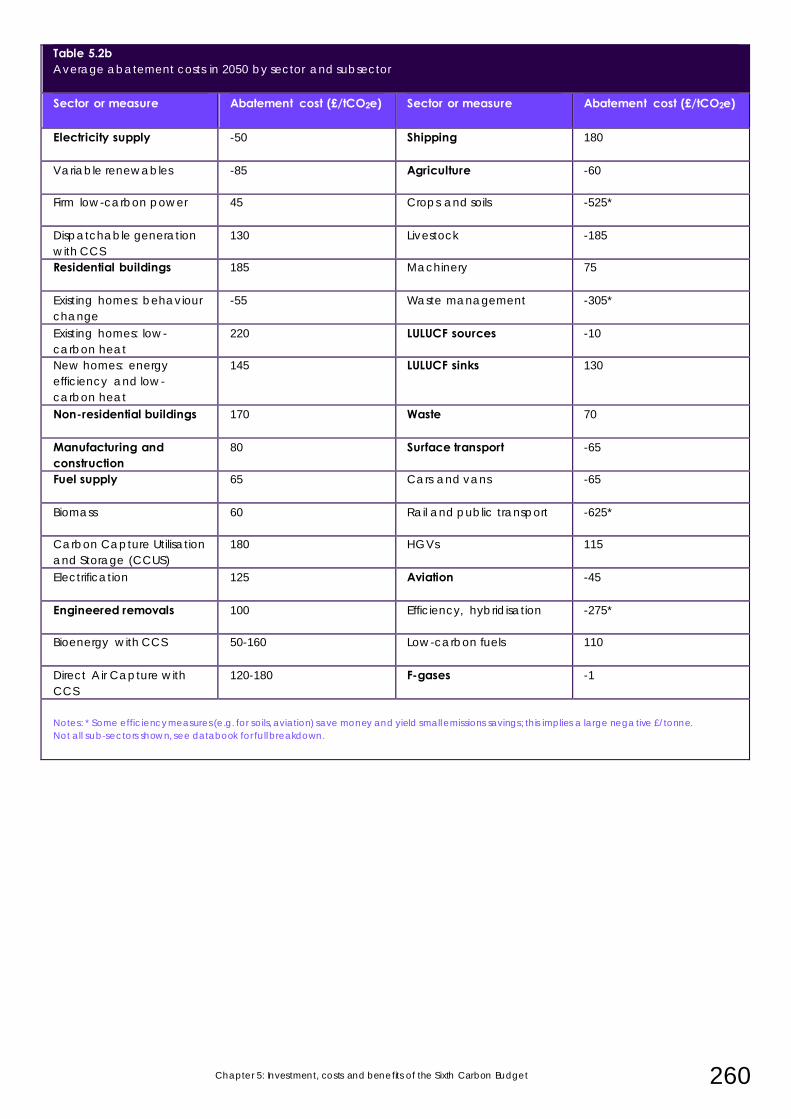
Chapter 5: Investment, costs and benefits of the Sixth Carbon Budget 260
Table 5.2b Average abatement costs in 2050 by sector and subsector Sector or measure Abatement cost (£/tCO2e) Sector or measure Abatement cost (£/tCO2e)
Electricity supply
-50 Shipping 180
Variable renewables
-85 Agriculture -60
Firm low-carbon power
45 Crops and soils -525*
Dispatchable generation
with CCS 130 Livestock -185
Residential buildings
185 Machinery 75
Existing homes: behaviour
change -55 Waste management -305*
Existing homes: low-
carbon heat 220 LULUCF sources -10
New homes: energy
efficiency and low-
carbon heat
145 LULUCF sinks 130
Non-residential buildings
170 Waste 70
Manufacturing and construction
80 Surface transport -65
Fuel supply
65 Cars and vans -65
Biomass
60 Rail and public transport -625*
Carbon Capture Utilisation
and Storage (CCUS) 180 HGVs 115
Electrification
125 Aviation -45
Engineered removals
100 Efficiency, hybridisation -275*
Bioenergy with CCS
50-160 Low-carbon fuels 110
Direct Air Capture with
CCS 120-180 F-gases -1
Notes: * Some efficiency measures (e.g. for soils, aviation) save money and yield small emissions savings; this implies a large negative £/tonne.
Not all sub-sectors shown, see databook for full breakdown.
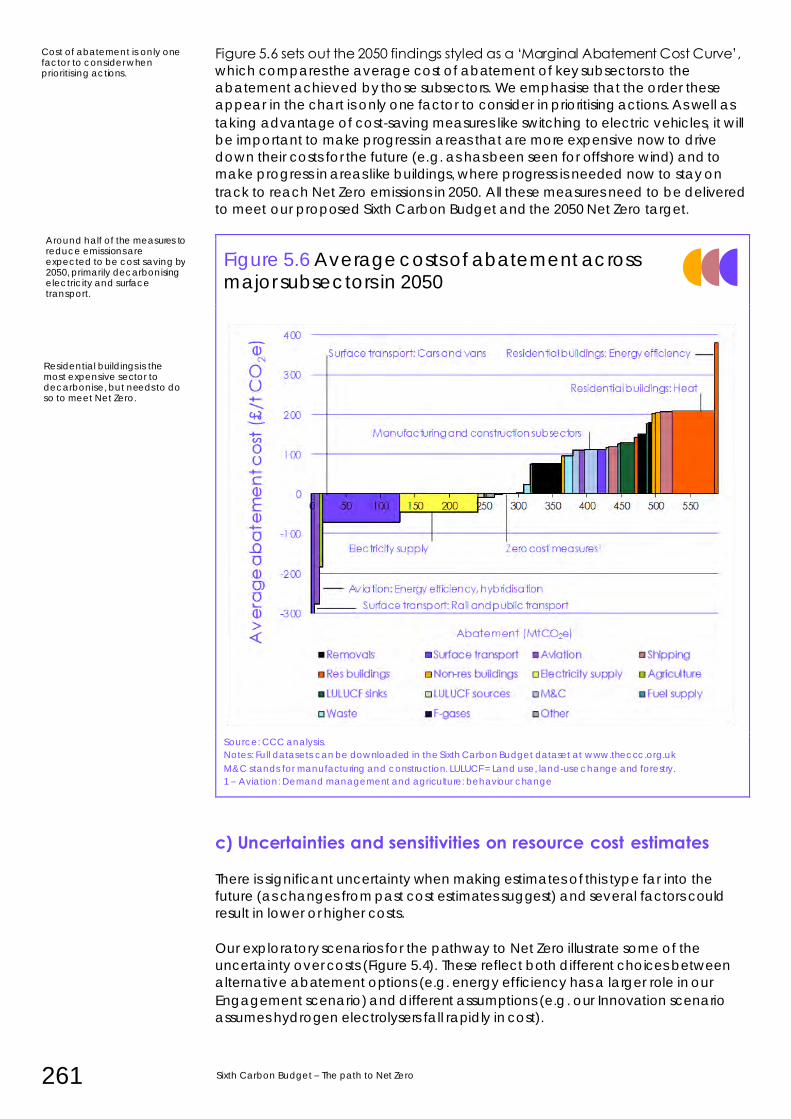
261 Sixth Carbon Budget – The path to Net Zero
Figure 5.6 sets out the 2050 findings styled as a ‘Marginal Abatement Cost Curve’,
which compares the average cost of abatement of key subsectors to the
abatement achieved by those subsectors. We emphasise that the order these
appear in the chart is only one factor to consider in prioritising actions. As well as
taking advantage of cost-saving measures like switching to electric vehicles, it will
be important to make progress in areas that are more expensive now to drive
down their costs for the future (e.g. as has been seen for offshore wind) and to
make progress in areas like buildings, where progress is needed now to stay on
track to reach Net Zero emissions in 2050. All these measures need to be delivered
to meet our proposed Sixth Carbon Budget and the 2050 Net Zero target.
Figure 5.6 Average costs of abatement across major subsectors in 2050
Source: CCC analysis.
Notes: Full datasets can be downloaded in the Sixth Carbon Budget dataset at www.theccc.org.uk
M&C stands for manufacturing and construction. LULUCF = Land use, land-use change and forestry.
1 – Aviation: Demand management and agriculture: behaviour change
c) Uncertainties and sensitivities on resource cost estimates
There is significant uncertainty when making estimates of this type far into the
future (as changes from past cost estimates suggest) and several factors could
result in lower or higher costs.
Our exploratory scenarios for the pathway to Net Zero illustrate some of the
uncertainty over costs (Figure 5.4). These reflect both different choices between
alternative abatement options (e.g. energy efficiency has a larger role in our
Engagement scenario) and different assumptions (e.g. our Innovation scenario
assumes hydrogen electrolysers fall rapidly in cost).
Cost of abatement is only one factor to consider when prioritising actions.
Around half of the measures to reduce emissions are expected to be cost saving by 2050, primarily decarbonising electricity and surface transport.
Residential buildings is the most expensive sector to decarbonise, but needs to do so to meet Net Zero.
Chapter 5: Investment, costs and benefits of the Sixth Carbon Budget 262
They also reflect somewhat different levels of effort (e.g. the Tailwinds scenario,
which benefits from widespread innovation and engagement, reduces emissions
to Net Zero by 2042 rather than 2050). Broader uncertainties imply a similar range
around our cost estimates.
• Long-term GDP growth. We use the Office for Budget Responsibility's (OBR)
baseline GDP growth assumption to estimate GDP our to 2050, which
assumes annual GDP growth of 1.6% from 2027 to 2050. If GDP growth were
lower out to 2050 (e.g. if growth were just 1% per annum in the longer term)
the annual costs of achieving the Net Zero target would be 0.6% rather
than 0.5% of GDP in 2050. This estimate does not allow for any reduction in
the absolute abatement cost that could follow from lower energy demand
under a lower GDP growth rate.
• Lower fossil fuel prices. The central cost estimates above use BEIS's central
values for future gas and oil prices. If fossil fuel prices were at the lower end
of the BEIS estimate then the relative costs of low-carbon technologies
would be higher. For our 2019 Net Zero report we calculated sensitivities for
the BEIS low and high fossil fuel price scenarios that increased or reduced
overall costs in 2050 by around 0.5% of GDP.*
• Technology costs. Innovation could bring technology costs down faster
than expected. We note that the signs of strengthening climate action
internationally (e.g. Net Zero targets announced for China, the EU, Japan
and South Korea) imply a possibility of more rapid technology development
driven by global deployment.
– Electricity price sensitivity. A 10% reduction in the electricity price we
assumed for our analysis in 2050 would further reduce annualised
resource costs for end use sectors by up to £6 billion per year in 2050
(0.16% of GDP in 2050).
– Hydrogen price sensitivity. A 10% reduction in the price of low-carbon
hydrogen assumed for 2050 would further reduce annualised resource
cost for end use sectors by up to £1.5 billion per year in 2050 (0.05% of
GDP in 2050).
• Costs of capital and discounting. Interest rates are at record lows (e.g. 0.1%
for most of 2020) and the economy needs attractive investment
opportunities. However, for the purposes of this analysis we have continued
to use Green Book guidance based on a social discount rate of 3.5% and
increased costs of capital for business investments. As set out in Box 5.4, a
lower cost of capital would reduce annual borrowing costs by billions of
pounds.
These uncertainties mean it is not sensible to be overly precise in reporting cost
estimates. We emphasise our estimate of less than 1% of GDP, rather than our
central estimates of 0.6% for the Sixth Carbon Budget period and 0.5% for 2050.
Other studies have found similarly small overall costs (Box 5.5).
* We note that fossil fuel sensitivities are potentially mis-leading as they are endogenous to climate action – as the
world has more success in reducing fossil fuel use, so fossil fuels are likely to become cheaper. That is a benefit of
global climate action, but appears to increase cost in this characterisation.
Broader sensitivities imply costs the order 0.5% of GDP higher or lower than we identify.
263 Sixth Carbon Budget – The path to Net Zero
d) Risks of higher costs and unintended consequences
The uncertainties on costs in the previous section do not change the conclusion
that aggregate costs are likely to be relatively small compared to GDP.
In this section we consider more qualitative and systemic risks, in particular the risks
of poor policy leading to escalating costs. However, the Committee’s view is that
these are risks best managed through careful policy design, rather than by
adopting less ambitious targets. That view is reinforced by considering the
implications of a slower transition, and the risks that it would also entail. The risk of
localised negative impacts should have particular attention – as we discuss further
in Chapter 6.
The Net Zero transition will be a policy-led transition across the economy. That
brings risks that poorly implemented policy leads to much greater than expected
costs:
• A failure to allow suitably for competitiveness risks could lead to loss of
viable installations or deep damage to particular sectors. This could lead to
localised impacts that are not easily compensated by increased activity
elsewhere in the economy. The Government has previously recognised that
by introducing exemptions and compensations for energy-intensive
industries from climate policy costs.
• A failure to develop electricity market arrangements, such as the capacity
market and balancing markets, to ensure security of supply as the share of
intermittent renewables increases could cause wider economic damage if
confidence in the reliability of UK energy supplies is affected.
• Poor policies leading to poor implementation could result in extra costs that
are not considered here. For example, poorly installed insulation that leads
to damp, over-heating or safety issues may need to be removed and
replaced, leading to unnecessary costs.
Box 5.5 External cost estimates
External estimates of the costs of reducing emissions to Net Zero also support the
conclusion that costs are unlikely to be more than a very small fraction of GDP (and there
could be benefits):
• European Union. The European Commission’s 2050 long-term strategy estimated that a Net Zero GHG scenario for 2050 could be achieved at an annual GDP impact to the European Union of between a 1% GDP cost and a 0.6% GDP boost in 2050, relative to an 80% reduction scenario. The impact relative to a current policies baseline ranged from a cost of 1.3% to a boost of 2.2% of GDP in 2050.
• G20. The OECD’s modelling also suggests a small impact to GDP from climate change mitigation. It estimated an average annual GDP cost across G20 countries of 0.3% in 2050 for a scenario with 66% probability of limiting temperature rise to 2°C, relative to a scenario with 50% probability, and benefit of 2.5% of GDP in 2050 relative to a baseline.
These estimates assume a 'decisive transition', where structural reform, fiscal initiatives
and green innovation accompany carbon abatement policies.
• The Energy Transitions Commission estimates that decarbonising the 'hard-to-treat' sectors (heavy industry and heavy transport) would cost less than 0.5% of global GDP by mid-century.
While these analyses suggest a range of uncertainty, they all point to a small overall
effect and suggest that it is possible that GDP could end up higher under scenarios with
strong action to cut emissions.
Uncertainties on cost will not change the conclusion that aggregate costs are likely to be relatively small compared to GDP.
As with any policy-led programme, there are risks of higher costs from poor implementation and design.
Chapter 5: Investment, costs and benefits of the Sixth Carbon Budget 264
• Administrative costs could be high or implementation could prove more
difficult than expected - for example, the roll-out of smart meters has been
repeatedly delayed.
• A failure to provide a stable direction and policy certainty could introduce
a risk premium and significantly increase costs of capital. Electricity market
reform has been successful in this regard (Box 5.4).
• More generally, any large transition brings risks of unexpected or
unintended consequences not yet identified.
It is important to consider these sorts of risks, particularly in policy design, but we do
not consider them reasons to adopt a less ambitious carbon budget:
• We have designed our scenarios to allow time for effective policy to be
implemented and for markets and supply chains to respond. There is time
to deliver provided decisive progress begins immediately.
• The required changes are well understood and research continues across
all areas, including in policy design. The history of, for example, electricity
market reform demonstrates that the UK has the capacity to develop and
implement effective policies to deliver changes, and at lower costs than
often assumed in predictive scenarios like the ones in this report.
• Even if costs did increase materially above our projections, their aggregate
would remain relatively small. For example, if we add an arbitrary
£100/tonne premium to half of the abatement required to 2035, the
aggregate cost would increase by around 0.6% of GDP. Given our
assessment in the next section that the wider economic impact of our
scenarios could be a boost of around 2% to GDP, this could still imply a
programme that was economically beneficial overall.
• There are also potential unknown or unintended upsides, for example from
spill-overs arising from innovations driven by the Net Zero transition. For
example, historical reductions in costs of solar panels driven by global
deployment have enabled greater energy access globally. Spill -overs from
battery development for electric vehicles could bring new benefits for
consumer electronics.
A slower path to Net Zero would also bring its own large-scale risks that would also
be hard to manage:
• As COP26 president the UK is uniquely placed to lead a more rapid global
transition. A less ambitious UK transition could lead to a slower global
programme and higher levels of climate change.
• Our proposed budget implies a decisive and clear pathway supported by
policies that can give businesses confidence that their investments will be
future-proofed. A slower path could introduce more uncertainty and more
room for indecision that will increase costs of capital and lead to more
capital scrappage as high-carbon investments continue unnecessarily.
• Slow progress can also lead to unnecessary costs. For example, the
historical failure to ensure that new homes are built to high zero-carbon
standards has meant that over a million homes have been built that will
require more expensive retrofit in later years and that have higher than
necessary energy bills for their occupants.
• A slower path would miss opportunities for increased investment to provide
a boost to the recovery and to use under-utilised resources in the economy.
A slower path to Net Zero would bring its own large-scale risks.
265 Sixth Carbon Budget – The path to Net Zero
• The recent increase in climate commitments in other countries also
emphasises there are risks attached to moving too slowly. For example, the
EU are considering introducing border tariffs targeted at high-carbon
imports and has signalled raising its 2030 emissions reduction target to 55%.
These conclusions align to those of our Net Zero expert advisory group on costs and
benefits. Their report emphasised that the benefits (including decreased climate risk) of Net Zero outweigh the costs, that good policy design is vital to keep costs low and maximise benefits and that clarity around the decarbonisation pathway is
a key enabler of innovation. They also echo the Bank of England’s assessment, which identified the material risk that ‘transition risk’ poses to financial and economic stability in the UK. They highlight the importance of disclosure and
forward planning to smooth out this risk.
Our Net Zero expert advisory group on costs and benefits concluded that the benefits of Net Zero outweigh the costs, good policy design is vital and clarity will enable innovation.
Chapter 5: Investment, costs and benefits of the Sixth Carbon Budget 266
4. Macroeconomic impacts
While they are a useful indicator, estimates of annualised resource costs such as
those set out in section 3, are not the same as macroeconomic impacts. In
particular, the shift in spending from imported fossil fuels to UK investment is likely to
affect the economy. Against the current backdrop of low investment, low interest
rates and high unemployment the impact is likely to be positive. When we
reconvened our costs and benefits advisory group in May 2020, they reinforced this
message, concluding that the economic recovery from COVID-19: ‘gives the UK a
chance to grow back in a way that is fit for the low-carbon future to which it
aspires, and that can benefit from the industrial and economic developments that
this future offers’.
In this section we summarise the Committee’s conclusions on the need for a green
recovery and set out the results of modelling we commissioned on the economic
impacts of our recommended pathway. We also consider potential industrial
opportunities.
While this section focuses on the aggregate effect on the economy, there will also
be important effects, both positive and negative, within the economy – for
particular sectors, regions and groups of people. Those are considered in Chapter
5.
a) A ‘green recovery’
The pandemic and the measures introduced to respond to it have had huge
effects on the economy that have not yet had their full impact:
• Unemployment increased from 3.9% over April-June 2019 to 4.5% over the
same period for 2020. An additional 9.6 million jobs (over 20% of the
workforce) were on temporary furlough under the Government’s Job
Retention Scheme.15 It remains to be seen how many of those jobs return as
policy support is removed.
• The impact on production output has remained significant. In August 2020
production output was 6% below February 2020, the last full month of
‘normal’ operating conditions.
• In the wake of the initial pandemic, the Bank of England cut its interest rate
to 0.1%.
The Committee previously identified opportunities to use the investment
programme needed for Net Zero to help support the recovery:16
• Green stimulus policies can be economically advantageous in the short-run
when compared to traditional fiscal stimulus. They have been shown to
create more jobs and have higher short-run multipliers.
• In the long run, investments in low-carbon and adaptation technologies
create a ‘virtuous reinforcing cycle’ as initial investments lower costs and
help to accelerate deployment and innovation. This has been seen most
dramatically in the wind, solar and battery technology industries.
Given the opportunity for investments to help stimulate the UK’s economic
recovery, it is more important than ever to assess the potential economic effects
beyond annualised resource costs.
Annualised resource costs are not the same as macroeconomic impacts.
Green stimulus policies would support the UK’s recovery from the economic down-turn.
267 Sixth Carbon Budget – The path to Net Zero
b) Estimated GDP impact
To identify the potential effect of our recommended pathway for the Sixth Carbon
Budget we commissioned Cambridge Econometrics (CE) to use their macro-
econometric model. Their analysis suggests a boost to GDP growing to around 2%
of GDP by 2030, with an accompanying boost to employment of around 1%:
• Box 5.6 summarises the CE work. It demonstrates that despite the added
costs involved the transition is expected to boost GDP. This reflects that the
stimulus impact of the increased investment brings more resources into the
economy and economic multipliers are increased as less UK spending goes
on imported oil and gas.
• The conclusions of this analysis are consistent with the findings of other
studies (Box 5.5).
The CE analysis indicates an ongoing benefit throughout the period considered (to
2050). It may be that over time the relative boost is eroded as spare capacity in
the economy drops, although there are also likely to be longer-term benefits for
productivity and innovation from shifting resources to low-carbon options:
• The CE analysis expects the GDP boost to continue growing after 2030
before levelling off at around a 3% boost by 2050. This largely reflects the
impact of reducing imports of oil and gas and directing spend instead to
the UK economy. It also reflects an assumption of ongoing spare capacity
in the economy, which could prove hard to sustain – the CE analysis
assumes that employment will be 1% higher than it would have been across
the full period 2020-2050.
• If in the long run there is less spare capacity in the economy than assumed
by CE, then the GDP boost could be lower, but still positive. The resource
cost of up to around 1% of GDP provides a worst-case estimate for the
economic impact, but appears unlikely given the various economic
dynamics it ignores.
• The low-carbon technologies deployed in our Sixth Carbon Budget
pathways are likely to have more scope for innovation and productivity
improvements than continued imports of fossil fuels. The markets for oil and
gas are mature, meaning that significant productivity and cost
improvements are unlikely to occur. By comparison we are seeing rapid
improvements in the cost and productivity of low-carbon technologies (e.g.
renewable energy and batteries for electric cars).
• Our budget advice comes against a background of increasing numbers of
businesses committing to their own Net Zero targets and trajectories. An
ambitious Sixth Carbon Budget that ensures policy follows the same
direction can help support business confidence and certainty in what to
expect from policy.
We conclude that the investment programme set out in section 2 can provide a
significant economic boost in the coming years and support the UK’s economic
recovery.
These benefits may well persist into the longer-term and could grow if the new
technologies continue to develop rapidly and provide spill-overs to other sectors.
At worst the economy would return to something similar to what would have been
expected without climate action, but with lower risks from the impacts of climate
change and valuable co-benefits as set out in section 5.
Modelling by Cambridge Econometrics indicates a boost to GDP of around 2% by 2030, alongside a 1% boost to employment from the actions to meet the Sixth Carbon Budget.
This reflects the shift in spending from oil and gas imports to UK investment.
Chapter 5: Investment, costs and benefits of the Sixth Carbon Budget 268
Box 5.6 Cambridge Econometrics analysis of the economic impacts of the Sixth Carbon Budget
This chapter so far has outlined the investment requirements, operating cost savings and
financing costs associated with the deployment of low -carbon technologies and
behaviours in our scenarios. Although this implies a net cost (of less than 1% of GDP) th is
does not give a comprehensive view of the wider implications for the UK economy of
the programme of decarbonisation envisaged for the Sixth Carbon Budget.
Therefore, alongside our work for the Sixth Carbon Budget we commissioned Cambridge
Econometrics to run their E3ME model, which replicated activity across the whole
economy using our Balanced Pathway, and compared this to a world with no further
climate action. In order to simplify assumptions this modelling assumed that the majority
of increased costs incurred to pay for decarbonisation were paid through increased
taxation, and no impacts of COVID-19 (e.g. higher unemployment) were considered.
The results show that despite there being an overall cost in bringing about the
technologies to reduce carbon emissions, there is an increase in economic prosperity, in
terms of an aggregate increase in GDP, jobs and real disposable incomes. In particular,
this is due to:
• Investment in capital. The transition to a low-carbon economy requires that investment is brought forward into relatively capital-intensive technologies. The
private and public investment stimulus makes use of spare capacity in the economy
(i.e. unemployed resources, assumed to be available throughout the period to 2050
in the modelling) and therefore increases the level of output (GDP).
• Reduction in oil and gas imports. A particular feature of the UK economy is the high
proportion of imports in the supply of oil and gas. As the economy transitions from ongoing spending on imported oil and gas in favour of low-carbon domestic
investments, leakage from the UK economy is reduced and the implied economic
multiplier increases, leading to increases in GDP and employment.
• Falling electricity prices, from switching to a low-cost, renewables-led system.
Overall, the increased level of economic output, as measured by GDP, creates demand
for additional employment both in low-carbon jobs, and in the wider economy, as a
result of increased GDP. Over the projection period employment is around 1% higher,
equivalent to around 300,000 jobs.* As increased costs are assumed to be paid through
increased taxation, the transition is progressive, and leads to increased income across all
income brackets (including through paying less for electricity).
The study presents a simplistic illustration of what a transition to Net Zero could look like
for the UK, and key limitations include not having assessed multiple alternative pathways,
not considering the near-term impacts of COVID-19 (which would likely reinforce the
results, driven by increased spare capacity in the economy), and major uncertainties
such as fossil fuel prices, and different levels of climate action in other countries were not
considered.
* This figure represents a net increase in employment, recognising that there is a reduction in employment in some
sectors, such as refining, and an increase in others such as manufacturing and construction.
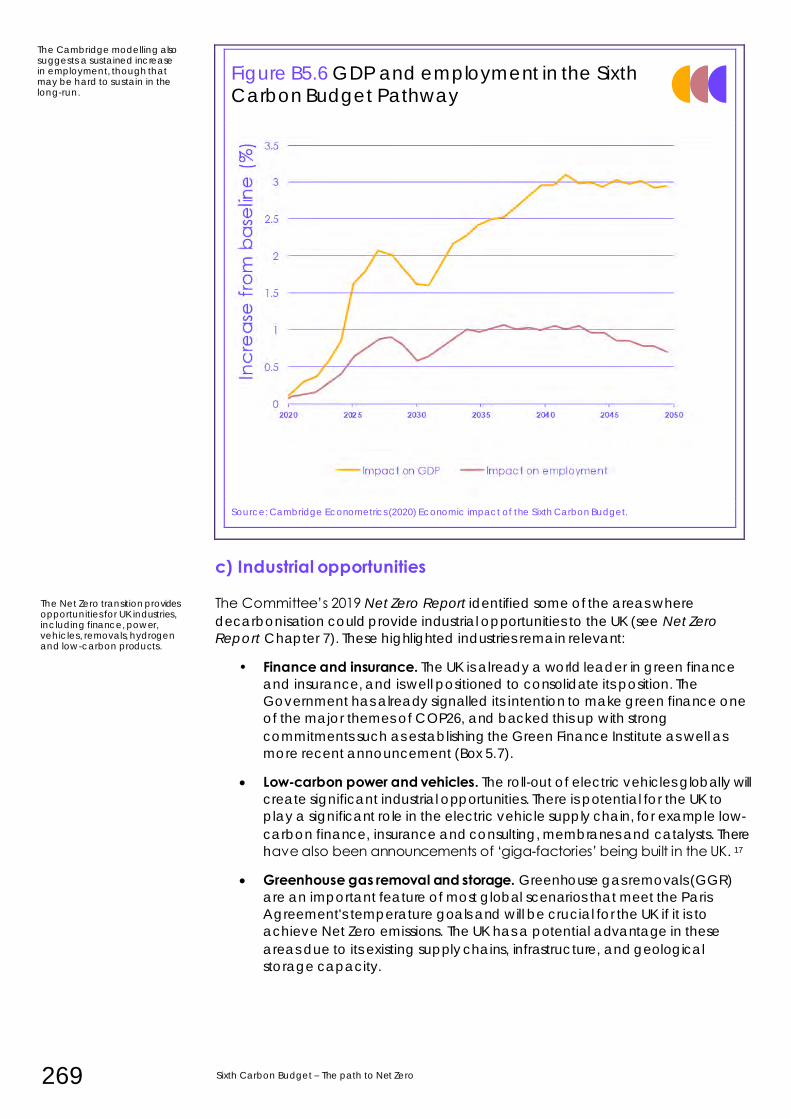
269 Sixth Carbon Budget – The path to Net Zero
Figure B5.6 GDP and employment in the Sixth Carbon Budget Pathway
Source: Cambridge Econometrics (2020) Economic impact of the Sixth Carbon Budget.
c) Industrial opportunities
The Committee’s 2019 Net Zero Report identified some of the areas where
decarbonisation could provide industrial opportunities to the UK (see Net Zero
Report Chapter 7). These highlighted industries remain relevant:
• Finance and insurance. The UK is already a world leader in green finance
and insurance, and is well positioned to consolidate its position. The
Government has already signalled its intention to make green finance one
of the major themes of COP26, and backed this up with strong
commitments such as establishing the Green Finance Institute as well as
more recent announcement (Box 5.7).
• Low-carbon power and vehicles. The roll-out of electric vehicles globally will
create significant industrial opportunities. There is potential for the UK to
play a significant role in the electric vehicle supply chain, for example low-
carbon finance, insurance and consulting, membranes and catalysts. There
have also been announcements of ‘giga-factories’ being built in the UK. 17
• Greenhouse gas removal and storage. Greenhouse gas removals (GGR)
are an important feature of most global scenarios that meet the Paris
Agreement's temperature goals and will be crucial for the UK if it is to
achieve Net Zero emissions. The UK has a potential advantage in these
areas due to its existing supply chains, infrastructure, and geological
storage capacity.
The Cambridge modelling also suggests a sustained increase in employment, though that may be hard to sustain in the long-run.
The Net Zero transition provides opportunities for UK industries, including finance, power, vehicles, removals, hydrogen and low-carbon products.
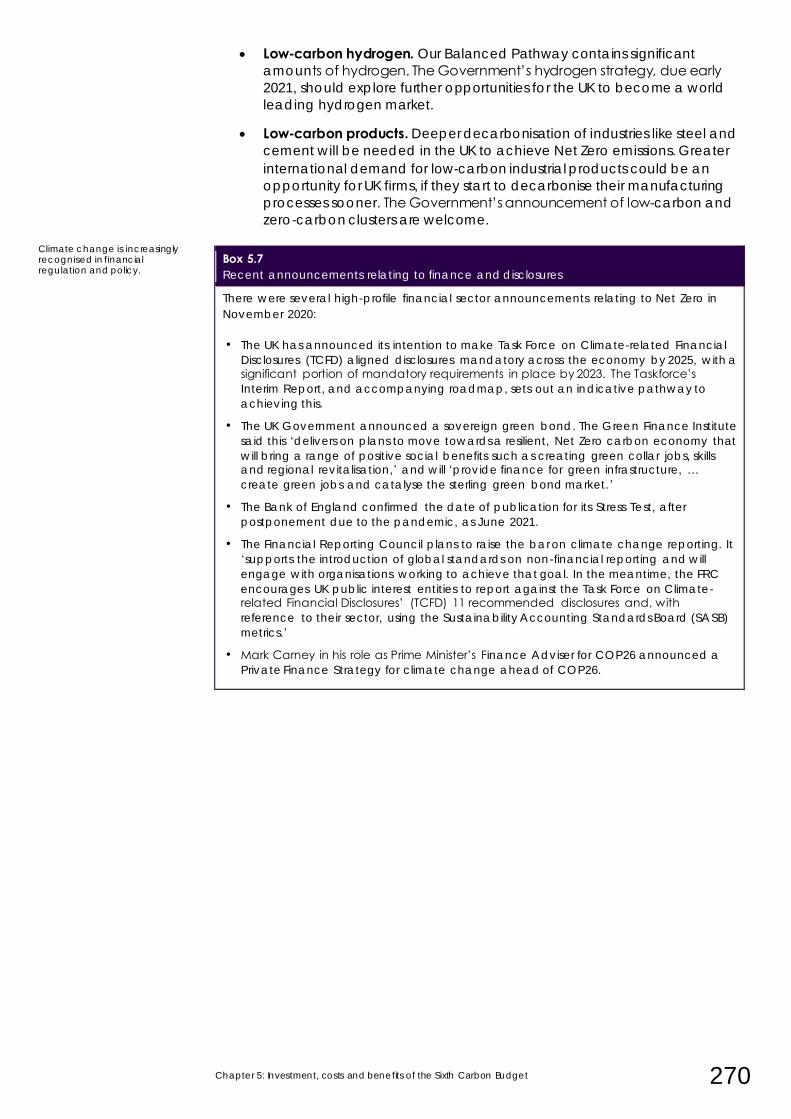
Chapter 5: Investment, costs and benefits of the Sixth Carbon Budget 270
• Low-carbon hydrogen. Our Balanced Pathway contains significant
amounts of hydrogen. The Government’s hydrogen strategy, due early
2021, should explore further opportunities for the UK to become a world
leading hydrogen market.
• Low-carbon products. Deeper decarbonisation of industries like steel and
cement will be needed in the UK to achieve Net Zero emissions. Greater
international demand for low-carbon industrial products could be an
opportunity for UK firms, if they start to decarbonise their manufacturing
processes sooner. The Government’s announcement of low-carbon and
zero-carbon clusters are welcome.
Box 5.7 Recent announcements relating to finance and disclosures
There were several high-profile financial sector announcements relating to Net Zero in
November 2020:
• The UK has announced its intention to make Task Force on Climate-related Financial
Disclosures (TCFD) aligned disclosures mandatory across the economy by 2025, with a significant portion of mandatory requirements in place by 2023. The Taskforce’s
Interim Report, and accompanying roadmap, sets out an indicative pathway to
achieving this.
• The UK Government announced a sovereign green bond. The Green Finance Institute
said this ‘delivers on plans to move towards a resilient, Net Zero carbon economy that
will bring a range of positive social benefits such as creating green collar jobs, skills and regional revitalisation,’ and will ‘provide finance for green infrastructure, …
create green jobs and catalyse the sterling green bond market.’
• The Bank of England confirmed the date of publication for its Stress Test, after
postponement due to the pandemic, as June 2021.
• The Financial Reporting Council plans to raise the bar on climate change reporting. It
‘supports the introduction of global standards on non-financial reporting and will
engage with organisations working to achieve that goal. In the meantime, the FRC
encourages UK public interest entities to report against the Task Force on Climate-related Financial Disclosures’ (TCFD) 11 recommended disclosures and, with
reference to their sector, using the Sustainability Accounting Standards Board (SASB)
metrics.’
• Mark Carney in his role as Prime Minister’s Finance Adviser for COP26 announced a
Private Finance Strategy for climate change ahead of COP26.
Climate change is increasingly recognised in financial regulation and policy.
271 Sixth Carbon Budget – The path to Net Zero
5. Co-impacts along the path to Net Zero
The main motivation for Net Zero is limiting the impact of climate change. Through
the UK acting on its own emissions, it contributes and accelerates the global effort
and therefore reaps the rewards of a world with a lower amount of warming.
Alongside this primary driver, and the potential economic benefits set out above,
there are additional benefits on the path to Net Zero, namely significant, tangible
improvements to public health and environment and biodiversity benefits.
There are also potential negative impacts, and these risks must be planned for and
mitigated. For example, switching to electric vehicles will not resolve congestion or air pollution caused by wear on tyres (as fossil fuel power vehicles do). Bioenergy too brings the risk of negative air quality impacts.
Our scenarios are designed to limit the negative impacts while increasing the positive co-impacts. For example, walking, cycling and public transport replace a
significant proportion of car-miles in the Balanced Pathway, and decarbonising buildings is primarily through efficiency and electrification and/or hydrogen rather than deploying domestic biomass boilers.
The positive co-impacts of reaching Net Zero overwhelmingly outweigh the
negatives, especially if supported by the right policy decisions from the Government to maximise societal benefits and minimise the risks.
a) Climate benefits
Avoiding warming will result in significant benefits for the UK. The climate impacts
the UK experiences will ultimately be driven by the global decarbonisation
pathway. However, by the Government pursuing an emissions pathway aligned
with the Paris Agreement, it can better influence the global emissions trajectory.
Table 5.3 highlights the avoided impacts for the UK on a path to 2°C of warming
compared to a path to 4°C of warming.
1.5-2°C of warming will still require the UK to adapt, however the risks at 3-4°C
warming, and hence the costs of adaptation, are significantly higher. Our third
Climate Change Risk Assessment will be published in 2021, and will review the
current state of adaptation in the UK.
Alongside limiting the impact of climate change, there are a host of wider economic, social, health and bio-diversity benefits.
The adaptation burden to the UK of 3-4°C will be substantially higher than 1.5-2°C of warming.
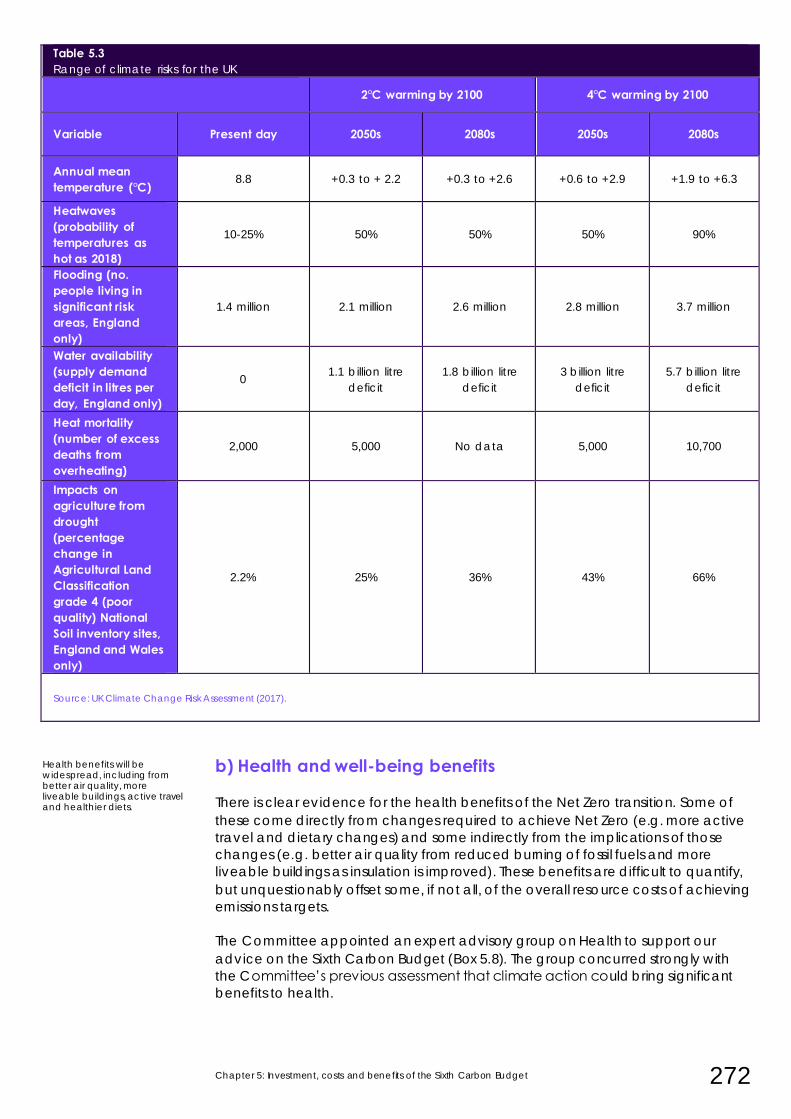
Chapter 5: Investment, costs and benefits of the Sixth Carbon Budget 272
Table 5.3 Range of climate risks for the UK
2°C warming by 2100 4°C warming by 2100
Variable Present day 2050s 2080s 2050s 2080s
Annual mean temperature (°C)
8.8 +0.3 to + 2.2 +0.3 to +2.6 +0.6 to +2.9 +1.9 to +6.3
Heatwaves (probability of temperatures as hot as 2018)
10-25% 50% 50% 50% 90%
Flooding (no. people living in significant risk areas, England only)
1.4 million 2.1 million 2.6 million 2.8 million 3.7 million
Water availability (supply demand deficit in litres per day, England only)
0 1.1 billion litre
deficit
1.8 billion litre
deficit
3 billion litre
deficit
5.7 billion litre
deficit
Heat mortality (number of excess deaths from overheating)
2,000 5,000 No data 5,000 10,700
Impacts on agriculture from drought (percentage change in Agricultural Land Classification grade 4 (poor quality) National Soil inventory sites, England and Wales only)
2.2% 25% 36% 43% 66%
Source: UK Climate Change Risk Assessment (2017).
b) Health and well-being benefits
There is clear evidence for the health benefits of the Net Zero transition. Some of
these come directly from changes required to achieve Net Zero (e.g. more active
travel and dietary changes) and some indirectly from the implications of those
changes (e.g. better air quality from reduced burning of fossil fuels and more
liveable buildings as insulation is improved). These benefits are difficult to quantify,
but unquestionably offset some, if not all, of the overall resource costs of achieving
emissions targets.
The Committee appointed an expert advisory group on Health to support our
advice on the Sixth Carbon Budget (Box 5.8). The group concurred strongly with
the Committee’s previous assessment that climate action could bring significant
benefits to health.
Health benefits will be widespread, including from better air quality, more liveable buildings, active travel and healthier diets.
273 Sixth Carbon Budget – The path to Net Zero
They emphasised the importance of health inequalities and identified areas for
prioritising climate actions that would bring benefits to public health and climate
change, and made a set of related recommendations.
The health benefits are generally higher on demand-side measures of abatement,
such as diets and active travel.
• Shift toward active travel. Our scenarios include higher rates of walking and
cycling, with a shift away from car trips. Active travel brings with it a host of
health benefits.
• Healthier diets. Our scenarios explore different degrees of diet shift away
from meat products. Shifting meat consumption more in line with
Government guidance would have significant health impacts. A 2013
report that the Committee commissioned from Ricardo indicated that the
health impacts of reducing red meat consumption by 50% amounted to an
annual monetised benefit of 0.5% of GDP.18
• Air quality. Poor air quality causes significant harm to health. It is associated
with heart disease and stroke, and particulates cause up to 40,000 deaths
per year in the UK.19 Many sources of air pollution are decreased by
reducing GHG emissions. Ricardo's 2013 estimates suggest that air quality
and noise impacts of a low-carbon scenario result in annual monetised
benefits of close to 0.1% of GDP in 2030.
• More liveable homes. The health cost to the NHS due to poor housing
exacerbating existing conditions is estimated to be £1.4-2 billion per year. 20
Thermally comfortable housing has the potential to reduce the risk of heat
and cold related illness and death.
• Mental health improvements. There are a host of benefits to mental health
that are also promised by a Net Zero UK. The improved physical health
resulting from and contributing to decarbonisation has knock on impacts
on mental health. Some of the changes in our scenarios, for example the
expansion of mixed woodlands, have also been shown to have positive
effects on mental health. Further to this, ‘climate anxiety’ is a growing
phenomenon, and action contributes to alleviating this burden.
While noting the potential the above benefits will bring to public health, our
advisory group noted that the biggest driver of health outcomes in the UK remains
economic inequality. A just transition is therefore an essential part of a successful
climate policy and health policy. It is vital for both acceptance and efficacy that
policies that reduce emissions do not place burdens on those least able to pay.
Delivering the Sixth Carbon Budget would materially improve air quality.
The transition to Net Zero must not place additional financial burden on regions or households suffering deprivation.
Chapter 5: Investment, costs and benefits of the Sixth Carbon Budget 274
Box 5.7 Health Expert Advisory Group
The Health Expert Advisory Group was convened by the Committee in 2020 to advise on
assessing the health impacts of setting the Sixth Carbon Budget and ensuring the
Committee’s recommendations are aligned with improving public health in the UK. The
Group was chaired by Professor Sir Michael Marmot, UCL Institute of Health Equity, and
its members were drawn primarily from the academic community with expertise in a
variety of fields, plus representation from the NHS Sustainable Development Unit.
The central message of the Chair's report is that a strategy to achieve Net Zero emissions
should have health equity - the fair distribution of health - as an explicit policy goal, and
that a health- equity-in-all-policies approach be adopted. Action to improve health
equity can be consistent with measures to reduce greenhouse gas emissions and adapt
to climate change, but it is evident that this requires careful consideration of who
benefits from and who pays for different policy measures.
The clear positive co-impacts of health outcomes and Net Zero
The Group found that the near-term benefits to health of taking action on climate
change are manifold.
The group identified five key areas in which action would bring benefits to public health
and reduction of health inequalities while contributing to the mitigation of - and
adaptation to - climate change:
• Improved air quality delivered by a move to a cleaner energy system and moving
away from fossil fuel combustion in most sectors of the UK.
• Healthier modes of transport, particularly due to the health benefits of walking and
cycling and reducing air pollution from road vehicles.
• More comfortable and efficient homes that are low-carbon, energy-efficient and
designed for a changing climate.
• Better diets with a focus on healthy and sustainable alternatives to the highest-
carbon foods.
• Sustainable economic and employment models that better support health and well-
being.
Achieving the UK’s target of reaching Net Zero by 2050 will necessitate transformational
changes that have potential to generate significant health benefits in the near term,
including via improved air quality, better diets, increased levels of physical activity,
improved building standards and better work-life balance.
Health equity: the fair distribution of health The health benefits of mitigation and adaptation measures will be maximised if they are
designed to reach the people facing the greatest disadvantage. However, this is not
inevitable. Decisions made in all Government departments have implications for health,
health equity, and climate change.
Action to improve health equity can be consistent with measures to reduce GHG
emissions, but this requires careful consideration of who benefits and who pays for
different policy measures: the costs should not be unfairly borne by people on low
incomes, who bear least responsibility for the emissions that cause climate change. A
failure to deliver a just transition would risk exacerbating the health inequality that
already exists in the UK.
Meanwhile, policy measures that widen inequalities should be mitigated via greater
redistribution of benefits. Minimising health inequalities will require systemic changes to
enable and support all of the UK population to benefit from uptake of active travel,
sustainable diets and energy efficiency measures, among others.
275 Sixth Carbon Budget – The path to Net Zero
Factoring health equity effects into policies requires a more nuanced approach to both
mitigation and adaptation: for example, home energy efficiency measures must also
benefit indoor air quality and temperature, and reach those most exposed to
temperature extremes and indoor air pollution; reducing meat and dairy consumption
needs to involve substitution with healthy, low-carbon alternatives that are affordable
and accessible; and decarbonisation of transport must involve low pollution and safe
forms of transport that are preferably active and, at the very least, accessible to all.
Recommendations for Government The Group’s headline recommendations for the UK Government to maximise the health
impacts of meeting the Sixth Carbon Budget and Net Zero target are:
• Health-equity-in-all-policies approach. The UK Government should avoid increasing
health and economic inequalities by ensuring the costs of measures to mitigate
climate change are distributed progressively and that the benefits reach those who
have the potential to be most positively impacted. The aim should be to reduce health inequalities and to advance health equity, for example by applying a health
equity impact assessment to legislation, including the Sixth Carbon Budget.
• Support a just energy transition that minimises air pollution from all sources. Continue
to reduce dependence on fossil fuels and accelerate the transition to clean energy
sources with decarbonisation of power generation and industrial, commercial and
domestic energy.
• Design and retrofit homes to be energy efficient, climate resilient and healthy. The
dual need to reduce domestic CO2 emissions whilst building and retrofitting healthy and climate-resilient homes requires a fine balance of interventions that will depend
on the age, design and location of homes. New building standards should be revised
to become near-zero or zero-carbon with flexibility to adapt to local environmental
needs.
• Build a sustainable and healthy food system. Enable a wider range of national and
local powers to shape food systems, and combine these with the resources and
statutory duties to support the transition to healthier and more sustainable diets.
• Develop a transport system that promotes active travel and road safety, and which minimises pollution. A transport system that is accessible to all and which maximises
the physical and mental health benefits of active and decarbonised transport will
require a range of policy interventions to encourage walking and cycling, more local
journeys, the use of public transport and ride-sharing, and to reduce traffic. Electrification of transport will also play a necessary role in reducing transport -related
CO2 emissions, but continued private vehicle dependence does not constitute
behaviour change towards more active and inclusive forms of travel, and will
continue to be a significant source of harmful particulate matter.
• Develop healthy and sustainable models of work. Prioritise the health and well-being
of citizens and environmental sustainability in economic recovery/growth policies. Shift from measuring economic success in terms of GDP to prioritising a well-being
approach. Support more inclusive local economic growth and shift towards circular
economy principles.
Source: CCC Advisory Group on Health (2020) Sustainable Health Equity: Achieving a Net Zero UK.
Chapter 5: Investment, costs and benefits of the Sixth Carbon Budget 276
c) Environment and biodiversity benefits
Natural capital is difficult to quantify, but economists and citizens are clear that it
has a value. The pathways outlined in this report contribute to greater biodiversity,
water quality and air quality. Reducing emissions from land use and agriculture
could deliver annual co-benefits of £0.6 billion in 2050 in our Balanced Pathway,
covering recreational benefits of creating new woodland, improved air quality,
improved health from increased physical activity and flood alleviation. These will
continue to rise after 2050.
Other benefits such as improved soil health and water quality and greater
biodiversity could also be important but are not included as there is insufficient
evidence to quantify their impact.18
• Restoration of peatlands. Peatland restoration increases the likelihood that
upland peat biodiversity could withstand shifts to the hotter, drier conditions
we can expect over the rest of this century. It also brings benefits for air and
water quality, biodiversity and habitat creation and further climate change
adaptation benefits (flood alleviation and water quality).
• Increased woodland and hedgerow planting. Increasing woodland and
hedgerows results in benefits to biodiversity through habitat creation (so
long as mixed planting is followed) and can help towards flood alleviation.
Many trees can also bring air quality benefits. More woodland close to
populated areas would also bring recreational benefits, while increased
tree cover in agricultural land could improve animal welfare (providing
shade for livestock on hot days).
• Changes to farming practices. Practices that optimise the efficient use of
nitrogen on cropland and grassland can reduce N2O emissions on
agricultural soils. There are also air quality improvements to be gained from
a reduction in ammonia. If farms are located near water courses, these
measures can help reduce water pollution with benefits for water quality,
biodiversity, habitat condition, and resilience to climate change.
• Increasing adaptation to climate change. The changes to land use
proposed in this report can also help the UK adapt to impacts of climate
change. Greater forest cover has been shown to protect from severe
flooding for example.
d) International benefits
Chapter 6 sets out the international basis for our recommended Sixth Carbon
Budget. As we demonstrate in that chapter, the UK is well-placed to be a global
leader on climate change as it becomes an increasingly important geopolitical
issue and as the UK seeks to re-define its position outside the European Union.
The UK was the first country to pass over-arching climate legislation (the Climate
Change Act), it was the first member of the G20 to adopt a Net Zero target and it
has the most rapid historical reductions in emissions in the G20.
Reinforcing that leadership position with a strong Sixth Carbon Budget and
accompanying nationally-determined contribution to the Paris Agreement as part
of an ambitious package as host of the next UN climate talks and President of the
G7, can help the UK to unlock potential economic, reputational and diplomatic
opportunities.
Actions to reduce emissions from land-use and agriculture could deliver annual benefits of £0.6 billion from recreational benefits, air quality improvements, flood alleviation and increased physical activity.
The UK is well placed to be a global leader on climate change – an increasingly important geopolitical issue.
277 Sixth Carbon Budget – The path to Net Zero
1 Financial Times (2020) Record surge in redundancies pushes UK unemployment to 4.8%
2 Office of National Statistics figure’s (2020) GDP monthly estimates 3 CCC (2020) 2020 Progress Report to Parliament
4 CCC expert advisory group on costs and benefits (2019, 2020) Net Zero – The UK’s contribution to
stopping climate change, 2020 Progress Report to Parliament
5 E.g. Race to Zero, UN
6 CCC (2020) Net Zero – The UK’s contribution to stopping climate change
7 Global CCS institute (2019) New wave of CCS activity: Ten large-scale projects announced 8 For simplicity, our calculations classify all costs of renewable electricity as investment costs.
9 CCC expert advisory group on Net Zero finance (2020) The Road to Net Zero Finance
10 The World Bank (2020) United Kingdom capital investment, percent of GDP
11 Energy UK (2019) Energy in the UK 12 Based on a comparison of 2017-19 to 2007-09 and 1997-99 to strip out year-to-year fluctuations
and the effects of the financial crisis (which led to a sharp drop in spending from 2010). 13 BEIS figures (2019)
14 UCL, Carbon Trust (2020) Policy, innovation and cost reduction in UK offshore wind
15 HMRC (2020) COVID-19 statistics
16 CCC (2020) 2020 Progress Report to Parliament 17 Guardian (2020) UK’s first car battery ‘gigafactory’ to be built by two startups
18 CCC (2020) Land-use policies for a Net Zero UK
19 CCC expert advisory group on health (2020) Sustainable health equity: achieving a Net Zero UK
20 CCC (2019) UK housing: Fit for the future?
Chapter 6: A just transition to the Sixth Carbon Budget and Net Zero 278
A just transition to the Sixth
Carbon Budget and Net Zero
1. Jobs and the Just Transition 282
2. Competitiveness 291
3. Fuel poverty, energy bills and other household costs 295
4. Fiscal circumstances 304
Chapter 6: A just transition to the Sixth Carbon Budget and Net Zero 280
Introduction and key messages
Fairness is fundamental to public support and must be embedded throughout
policy. Only a transition that is perceived as fair, and where people, places and
communities are well-supported, will succeed. UK Government policy, including on
skills and jobs, must join up with local, regional and devolved policy on the just
transition. Vulnerable people must be protected from the costs of the transition
and benefits should be shared broadly.
This chapter considers the aspects of a just transition to Net Zero in the UK. We
consider jobs and competitiveness, and we consider the impacts for households,
including potential impacts on energy bills and fuel poverty. Costs must be fairly
shared in the transition, so this chapter also considers the implications for the public
finances. Our analysis is based on the scenarios we set out in Chapters 2 and 3 to
meet the Sixth Carbon Budget goal of reducing emissions by 78% by 2035 relative
to 1990 on the path to Net Zero by 2050.
Our key conclusions are:
• A strategy for a just transition is required. Across many areas, including
energy bills and regional employment, fairness is already an issue. The
transition to Net Zero will require a shift of hundreds of thousands of workers
into low-carbon roles, as well as large numbers shifting out of high-carbon
roles, which could be in different places and use different skills. Navigating
this transition must start now and will require effective plans, widespread
public involvement and an embedding of the principle of fairness
throughout climate policy. Regional and local considerations are vital.
• The transition brings many benefits for UK households. By 2035, in our
scenarios, people’s homes will be better insulated, their cars will be
cheaper to drive, they will have cleaner air, quieter streets, more access to
green spaces and more opportunities to improve their health. Policy should
aim to share these benefits broadly across the population.
• The transition also brings risks of uneven costs. In the long term, energy
costs and energy bills are expected to fall significantly. However, in the
coming decade our scenarios involve further increases in electricity costs
before these begin to fall. Although improvements to energy efficiency
could largely offset these costs they should not be automatically added to
energy bills, which is a regressive approach. Continuing to add climate
policy costs primarily to electricity prices, but not gas prices, adversely
affects particular groups (those with electric heating) and undermines the
case for electrification, which plays a major role in meeting the Sixth
Carbon Budget.
• Policies must provide a level playing field where competitiveness is a concern. It is clearly possible to deliver the Sixth Carbon Budget and Net
Zero without carbon leakage, provided a suitable policy package is in
place. Sectors at risk of carbon leakage must be supported through the
transition, initially with taxpayer-funded subsidies. Longer term policy should
move away from subsidies towards an international level playing field, for
example by using product standards or carbon border tariffs. Work should
start now on these options, for example by developing better metrics of
carbon-intensity and building an international consensus on the need for
border carbon adjustments.
281 Sixth Carbon Budget – The path to Net Zero
• Up to around £4-7 billion of extra annual Exchequer funding is needed by 2030 for low-carbon solutions. Alongside extension of funding from existing
schemes (including the temporary Green Homes Grant scheme), this could
provide the initial support required for deep industrial decarbonisation and
for retrofitting the UK’s buildings without increasing household energy bills.
Additional funding for low-carbon electricity is also likely to be required
initially, though this is currently levied on bills. However, the vast majority of
the required investment programme will be funded and delivered privately.
Offsetting revenues could be raised by greater use of carbon taxes,
especially for sectors like aviation that are currently under-taxed and where
equity concerns are less present.
This chapter is in four sections:
1. Jobs and the Just Transition
2. Competitiveness
3. Fuel poverty, energy bills and other household costs
4. Fiscal circumstances
Chapter 6: A just transition to the Sixth Carbon Budget and Net Zero 282
1. Jobs and the Just Transition
The International Labour Organisation (ILO) define a just transition as being a
transition towards an environmentally sustainable economy that is well managed
and contributes to the goals of decent work for all, social inclusion and the
eradication of poverty.1
It is often strongly associated with the implications for jobs and employment. As
well as jobs (the focus of this section), we consider impacts on energy bills and
other impacts on consumers (section 2) and the competitiveness of particular
industries (section 3), as required under the Climate Change Act. Where possible
we consider regional and localised effects.
The transition to Net Zero will need more of some jobs and fewer of others. There is
no reason to think that the total number of jobs should be any lower than in a high-
carbon world. In fact the balance of spending identified in Chapter 5, with a shift
from expenditure on imported fossil fuels towards higher UK investment if anything
points to the potential for higher overall employment, at least in the near term
during the economic recovery. But the shift in jobs from some current areas to
others brings a significant transition risk.
The transition will affect the whole of the UK, with impacts differing across regions,
sectors and workers. The risk of negative localised impacts must be a particular
focus for policy. A strategy for the just transition is required to ensure no group is left
behind.
This section considers:
a) Existing low-carbon jobs in the UK and historical changes in energy jobs
b) New job opportunities in a low-carbon future
c) Pressure on existing jobs in a low-carbon future
d) Regional aspects of the just transition
e) Support for low-carbon jobs and a just transition
a) Existing low-carbon jobs in the UK and historical changes in energy jobs
The Office for National Statistics (ONS) estimates that 225,000 people are currently
employed in the UK’s low-carbon technology and renewable energy economy,
representing around 0.7% of the total UK workforce, with an additional 5,000-10,000
jobs being added each year.2
• Around three quarters of these jobs are in energy efficient products and
services, with an additional 14% in the renewable energy sector, electric
vehicle production (7%) and nuclear power (6%).
• Of these jobs, almost 40% are involved in direct manufacturing of low-
carbon technologies, and an additional 37% in constructing infrastructures
to support low-carbon technologies.
• Additional jobs exist in the supply chains of companies directly involved in
these industries, therefore overall employment in low-carbon industries will
be higher.
Low-carbon jobs already make up nearly 1% of all jobs in the UK.
283 Sixth Carbon Budget – The path to Net Zero
Increasingly jobs in other sectors will have a low-carbon remit. For example,
financial services will be required to finance and insure the growing capital
investment in the UK’s transition to Net Zero. Others have noted opportunities for
data and digital technology to play an important role in a low-carbon future, with
associated jobs.3 Separately, as businesses commit to Net Zero targets, purchasing
managers will increasingly need to take sustainability into account.
Until now, the UK’s transition to Net Zero has been highly concentrated in the
electricity sector, with important positive localised impacts. New jobs have been
created in the renewables sector, but some jobs have been lost in coal.
Separately, jobs have been lost in the oil and gas sector due to global shifts.
• Jobs in manufacturing of renewables have led to a boost in employment in
certain regions. For example, the Siemens Gamesa and ABP investments in
offshore wind manufacturing in Hull have been attributed with reducing
unemployment benefit claims by close to 60% and increasing Gross Value
Added (GVA) in the region.4
• However the UK’s industrial policy has also been criticised for not
maximising investment in renewable energy supply chains in the UK, for the
renewables that have been installed to date.5 Partly to address this, the UK
Government is now, as part of its ‘sector deal’, working with the UK
renewables industry to ensure that at least 60% of the money spent on
offshore wind farms goes to UK companies and workers.6
• Over the past decade fossil fuel power stations have closed, or reduced in
output. The Scottish Just Transition Commission notes the success of a
Government initiated taskforce in managing the immediate threat of job
losses resulting from the closure of Longannet coal power station, but that
more could have been done to bring local community into discussions.7
Further research should be encouraged into similar closures in the rest of
the UK.
• A prolonged downturn in the UK’s oil and gas sector has seen employment
drop by 35% between 2013 and 2019.8 This, compounded by regular
volatility in the sector including as a result of COVID-19, has led to job
insecurity and mandatory pay cuts.9
• The UK’s efforts to transition workers away from coal production, in the
1970s and 1980s have been criticised for providing new, replacement, jobs
that were not sufficiently well paid.10
All these scales are also relevant for the future – from the sector-level across the
economy through to individual towns and installations.
b) New job opportunities in a low-carbon future
The opportunities for jobs growth have, to date, largely been focused on
deploying renewable electricity. Countries that manufacture wind turbines and
solar panels have been able to export these technologies to a growing global
market. Jobs in installing and servicing wind and solar have expanded locally.
Renewables jobs are likely to continue growing as the world decarbonises and
electrifies.11
The next phase of decarbonisation will go beyond renewable electricity towards
electric vehicles, low-carbon hydrogen, carbon capture usage and storage
(CCUS) and, particularly in the UK, buildings decarbonisation. Low-carbon industrial
products will be in increasing demand across the world.
Lessons can be learned from how low-carbon jobs have been created, and how high carbon jobs have been affected in the past.
Jobs will be needed not just in renewables, but in low-carbon hydrogen, electric vehicles, CCS, buildings retrofits and more.
Chapter 6: A just transition to the Sixth Carbon Budget and Net Zero 284
The scenarios we set out in Chapters 2 and 3, and the profiles in Chapter 5 for
investment and operating costs give indications of potential job impacts, but
outcomes will depend on the balance of UK provision and imports. For some
sectors, like buildings, it is clear that the balance of new jobs must be in the UK.
• Buildings. Our scenarios involve an additional annual investment in UK
buildings of over £10 billion per year. The Construction Industry Training
Board (CITB) modelled the employment requirements to deliver a
programme of housing retrofit in line with our Balanced Pathway. Their
analysis suggests that the energy efficiency programme in the 2020s and
following low-carbon heat programme would require an additional
workforce of over 200,000 new full-time equivalent roles from the late 2020s
through to 2050 (Figure 6.1). More roles may be required in the heat pump
and other supply chains if those are UK based.
• Low-carbon energy. Our scenarios involve additional annual investment in
the electricity sector and energy networks growing to around £20 billion by
2030. Work done for National Grid on the energy system employment
opportunities in a transition to Net Zero suggest up to 400,000 low-carbon
jobs could be needed over the next 30 years, including jobs in buildings
retrofit. This is comparable to direct employment in the UK’s energy sector
of 144,000 today. 260,000 will be in new roles, while the remainder will be
replacing those who have left the workforce. Importantly, they note the
opportunity for these jobs to be spread across all regions of the UK.12
• Transport. Our scenarios involve around a £10 billion increase in annual
investment in the transport sector, largely from the extra upfront cost we
assume for low-carbon vehicles. LSE, in a recent study, note an opportunity
for up to 80,000 UK jobs in manufacturing of electric vehicles and batteries.
However, without Government action to encourage investment in this
sector, they suggest EV manufacturing could move elsewhere.13
• Manufacturing. There may also be employment opportunities for the UK
from exports if it becomes a market-leader in the production of low-carbon
technologies. The Energy Innovation Needs Assessment (EINAs) recently
conducted by BEIS assessed these opportunities and found innovations in
low-carbon manufacturing technologies including CCUS could support up
to 80,000 jobs in the UK by 2050.14 These jobs would also be high quality,
with wages above the UK average.*
The EINAs also highlighted sectors where the UK already has a comparative
advantage compared to other countries as being offshore wind, smart systems
and CCUS, complemented by strength in engineering services that can be
applied to CCUS, hydrogen and bioenergy.15
The macroeconomic modelling we set out in Chapter 4 also provides some insights
on employment effects. It identifies boosts to the utilities sector and to
manufacturing and construction, while fewer jobs may be needed in oil and gas
production and aviation. It also identifies potential boosts for employment in the
broader economy (e.g. services) resulting from the economic stimulus effect of the
major investment programme in our Balanced Net Zero Pathway.
* Note that the EINAs only consider the jobs and GVA that could be provided in the production of technologies,
rather than in the operation of these technologies (for example jobs/GVA provided in the production of cement
kilns, rather than in the cement sector itself).
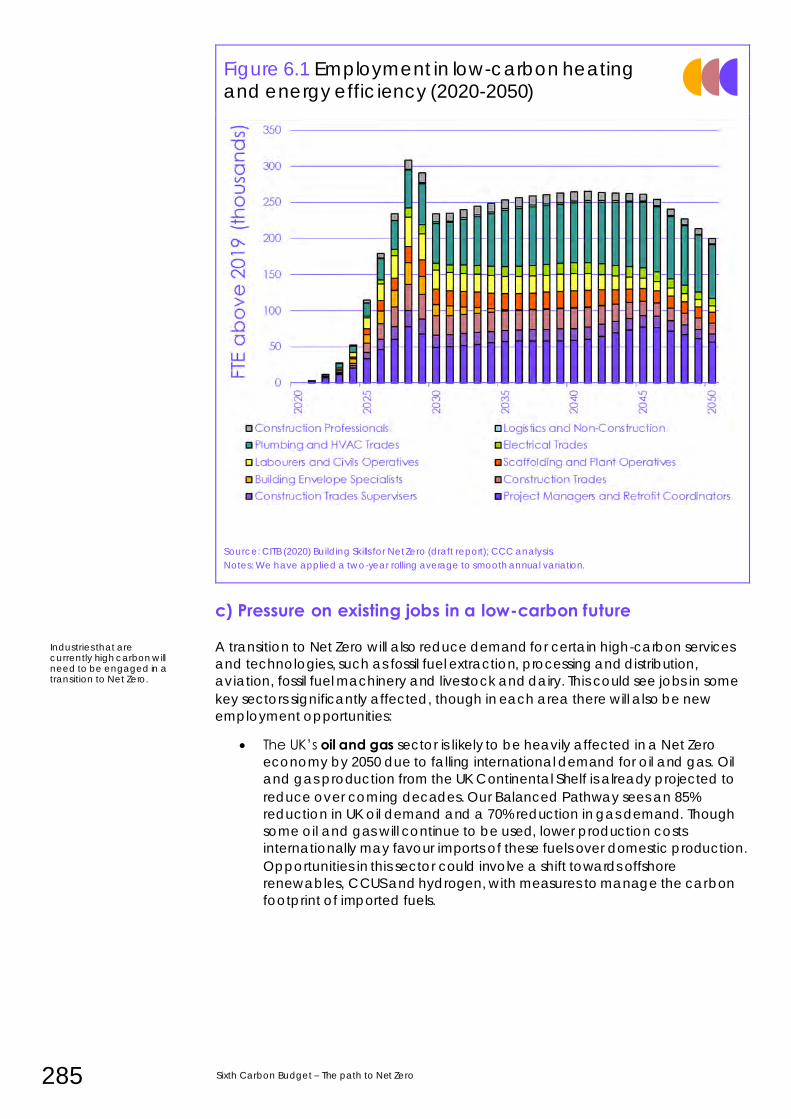
285 Sixth Carbon Budget – The path to Net Zero
Figure 6.1 Employment in low-carbon heating and energy efficiency (2020-2050)
Source: CITB (2020) Building Skills for Net Zero (draft report); CCC analysis.
Notes: We have applied a two-year rolling average to smooth annual variation.
c) Pressure on existing jobs in a low-carbon future
A transition to Net Zero will also reduce demand for certain high-carbon services
and technologies, such as fossil fuel extraction, processing and distribution,
aviation, fossil fuel machinery and livestock and dairy. This could see jobs in some
key sectors significantly affected, though in each area there will also be new
employment opportunities:
• The UK’s oil and gas sector is likely to be heavily affected in a Net Zero
economy by 2050 due to falling international demand for oil and gas. Oil
and gas production from the UK Continental Shelf is already projected to
reduce over coming decades. Our Balanced Pathway sees an 85%
reduction in UK oil demand and a 70% reduction in gas demand. Though
some oil and gas will continue to be used, lower production costs
internationally may favour imports of these fuels over domestic production.
Opportunities in this sector could involve a shift towards offshore
renewables, CCUS and hydrogen, with measures to manage the carbon
footprint of imported fuels.
Industries that are currently high carbon will need to be engaged in a transition to Net Zero.
Chapter 6: A just transition to the Sixth Carbon Budget and Net Zero 286
• The UK’s automotive industry largely produces conventional fossil-fuelled
vehicles for export*.16 The sector’s nearly 450,000 workers will need to be
engaged in a transition to electric vehicles that is already underway, in the
UK and globally. Falling demand for fossil fuelled vehicles, resulting from a
transition to electric vehicles, is likely to reduce the number of jobs
available in manufacturing and servicing these vehicles in the UK. In our
Balanced Pathway we estimate a reduced spend on vehicle maintenance
of around £7 billion annually by 2050. The UK already produces electric
vehicles, and opportunities exist for the UK to have a large share of future
electric vehicle, and potentially battery, production.17 Broader economic
circumstances, including the UK’s future trading relationships, will clearly be
important.
• Our scenarios suggest growth in flying may need to be limited, or levels
decrease, from pre-COVID levels. Therefore jobs in UK aviation and aeronautics sectors could be impacted.
• Income to livestock and dairy farms could be affected if meat and dairy
consumption falls by the 20-50% envisaged in our scenarios. The UK’s farms
and their 450,000 workers will need to be engaged and supported in the
transition to low-carbon farming practices.18 The Government’s
Environmental Land Management Scheme (ELMS), the UK’s successor to
the EU’s Common Agricultural Policy, will be critical.
– Multiple opportunities exist, including transitioning to plant-
based food (e.g. cereals and legumes), growing bioenergy
crops, lower-carbon livestock production and receiving income
for low-carbon land management (such as increased tree-
planting or peatland restoration, much of which in our scenarios
occurs on land released from raising livestock).
– For farmers, raising awareness and the provision of training on
the adoption of sustainable management practices is crucial.
• Demand for manufacturing of some products or materials would likely
reduce within the more circular economy represented in our scenarios. This
could lead to a shift of some manufacturing towards recycling-based
manufacturing and re-use-based services. However, the increased
demand for materials for the major investment programme required is likely
to more than offset this.
The transition will also require some industries, such as manufacturing, to change
the technologies, fuels or processes they use to costlier ones, while they continue
to provide the same type of products or services. This could impact their
competitiveness and affect jobs (while causing ‘carbon leakage’) if Government
does not enable companies to operate on a level playing field with their
international competitors. Therefore, Government should ensure a level playing
field, where required, to maintain and potentially grow low-carbon UK industry
(section 3).
* In 2019, 1.3 million cars were built in the UK, 1.1 million of which were exported, LSE (2020) Seizing sustainable growth
opportunities from zero emission passenger vehicles in the UK.
The Government can ensure its successor to the EU’s farming subsidy scheme rewards farmers for environmental gains.
287 Sixth Carbon Budget – The path to Net Zero
d) Regional aspects of the just transition
The jobs opportunities and challenges of the low-carbon transition will vary
regionally. Regional changes to manufacturing jobs are particularly important
because the sector tends to be highly concentrated in specific regions (Figure 6.2)
and the jobs often pay more than those in other sectors in these regions. In some
regions (e.g. North East Yorkshire), manufacturing provides nearly 20% of all full-time
equivalent jobs, and it can be even more important at smaller scales (e.g. one
third of all jobs at some local authority levels). 19
Importantly, many of the regions where manufacturing jobs are concentrated are
also those where jobs are likely to be required in the low-carbon hydrogen, CCS
and renewable energy industries.
The UK already has high levels of regional inequality compared to other OECD
countries20 and transitions are already occurring in the UK that affect regions in
different ways. Unless carefully managed, a transition to Net Zero could
exacerbate these inequalities. Besides jobs, the costs and benefits of the transition
will also differ across regions.
• The deindustrialisation that has occurred in the UK to date has already left some regions disproportionately worse off. 21 For example, IDDRI notes the
limited success of efforts to transition former coal mining communities to
new jobs, noting that though new jobs have been created, they have
often been lower paid than previous jobs in the region and high levels of
worklessness still prevail. 22
• The costs of the transition may be higher than average in some regions of the country. For example areas with older, energy inefficient housing could
face higher energy bills. Rural areas off the gas grid, who typically pay
more for heating fuel, have more to gain from a switch to low-carbon
heating. Current and future transport infrastructure can limit the ability of
the local population to walk, cycle or use public transport, and may affect
the opportunity for and costs of running an electric vehicle. Relative wealth
will also be important, including for the ability to fund changes locally.
• Many of the benefits of a transition to Net Zero will be felt at the local level. For example, a transition to electric vehicles, alongside an increase in
active travel will lead to a decrease in local air pollution, benefitting health.
A shift to healthy diets, and improved quality of housing is expected to lead
to lower costs for the health service. An increase in tree-planting and urban
green spaces will provide more green recreational space.
Decarbonisation strategies will need to be tailored to local circumstances and
local communities. Maximising the economic and employment opportunities
arising from the transition will require targeting new investment towards areas that
are likely to be the most impacted. This should be tied to a dialogue between
local, regional and national Governments, alongside a public engagement
strategy that gives local people a say in how a transition to Net Zero will affect their
area.
Manufacturing jobs are highly concentrated in specific regions of the UK.
A just transition will need to consider how costs and benefits can balanced across regions.
Opportunities also exist to target investment towards poorer regions.
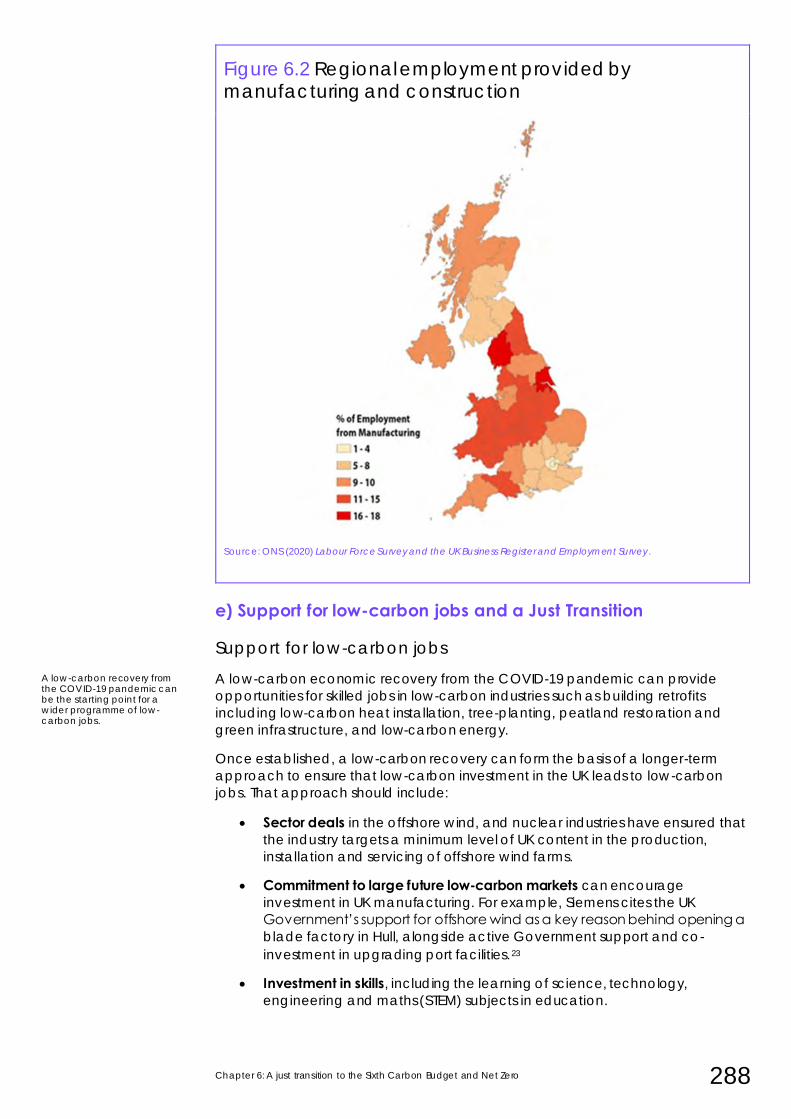
Chapter 6: A just transition to the Sixth Carbon Budget and Net Zero 288
Figure 6.2 Regional employment provided by manufacturing and construction
Source: ONS (2020) Labour Force Survey and the UK Business Register and Employment Survey.
e) Support for low-carbon jobs and a Just Transition
Support for low-carbon jobs
A low-carbon economic recovery from the COVID-19 pandemic can provide
opportunities for skilled jobs in low-carbon industries such as building retrofits
including low-carbon heat installation, tree-planting, peatland restoration and
green infrastructure, and low-carbon energy.
Once established, a low-carbon recovery can form the basis of a longer-term
approach to ensure that low-carbon investment in the UK leads to low-carbon
jobs. That approach should include:
• Sector deals in the offshore wind, and nuclear industries have ensured that
the industry targets a minimum level of UK content in the production,
installation and servicing of offshore wind farms.
• Commitment to large future low-carbon markets can encourage
investment in UK manufacturing. For example, Siemens cites the UK
Government’s support for offshore wind as a key reason behind opening a
blade factory in Hull, alongside active Government support and co-
investment in upgrading port facilities.23
• Investment in skills, including the learning of science, technology,
engineering and maths (STEM) subjects in education.
A low-carbon recovery from the COVID-19 pandemic can be the starting point for a wider programme of low-carbon jobs.
289 Sixth Carbon Budget – The path to Net Zero
• Reskilling and retraining programmes for workers in high carbon industries.
Particular skills gaps, such as those identified by the Committee in heat
pump and energy efficiency installation, should be identified and action to
address these prioritised. The ability of a decarbonised UK manufacturing
sector to compete in global markets is dependent on having a labour
force with the requisite skills, not only in manufacturing products and
materials, but also engineering, procurement and construction
management services.
• Developing policy to provide favourable investment conditions. Policies
that provide businesses with clarity and confidence are vital and can be
supplemented by use of other policies, such as business rates, to
encourage low-carbon investment.
• Investment in research and innovation, and in translating that to effective
business models.
• Trade-deals can be used to ensure that low-carbon industries in the UK
maintain their competitiveness with industries abroad, maintaining
opportunities for workers in the UK.
In developing its approach to low-carbon jobs, Government should use these tools,
work with industry and collaborate with devolved as well as local Government.
Supporting a just transition
Scotland’s Just Transition Commission was appointed to advise on a Net Zero
economy that is fair for all. It has identified four priorities for achieving a just
transition:
• 1) Planning ahead –clear transition plans need to be developed down to
the sectoral level so that surprises are minimised. Unplanned transitions tend
to be unjust transitions.
• 2) Engagement – people need to be brought into the decision-making
process and derive a sense of ownership of the Net Zero project.
• 3) Bringing equity to the heart of climate change policies. Climate policies
need to be systematically screened for their impact on vulnerable and
excluded groups and for the opportunity to address existing inequalities.
• 4) Start now. The transition is already underway both in the UK and around
the world. A strategy that recognises this can put the UK at the forefront of
addressing fairness in a transition to Net Zero.
For the UK, the Treasury’s Net Zero Review will be the first comprehensive look at
elements of the just transition to Net Zero. It will consider how the transition to Net
Zero will be funded, and where the costs will fall. It will assess:
• The range of choices for how households, businesses and the taxpayer
could contribute towards different elements of the transition to Net Zero.
• Mechanisms to create an equitable balance of contributions.
• Opportunities for economic growth as we transition to a green economy.
• The trade-offs between cost, competitiveness, effects on consumers and
impacts on the taxpayer.
The transition to Net Zero is already underway, so a strategy for a just transition is needed now.
Chapter 6: A just transition to the Sixth Carbon Budget and Net Zero 290
The Treasury’s funding review will be a crucial first step in demonstrating that strong
leadership and coordination at the centre of Government can ensure the action
to deliver Net Zero is delivered in a fair and equitable way. Its interim report was
due to be published around the same time as this report, but had not been at the
time of writing.
The Treasury’s final report of their Net Zero Review, due in Spring 2021 should:
• Develop a plan for funding decarbonisation and review the distribution of costs for businesses, households and the Exchequer. This should set out the
main areas where action and funding will be required, the principles on
which the distribution of costs should be determined and clarity over how
costs will be allocated.
• Consider near-term as well as long-term decarbonisation funding needs and policy implications. The Government cannot make funding
commitments that bind future Governments, but the review can set out
principles to inform the scale and nature of long-term Government funding
and make concrete proposals for action and funding over the next five to
ten years, or at least be accompanied by a spending review or budget
which does the same.
• Give due weight to issues of fairness, including assessing:
– Where the costs of policies are likely to fall and how they can be
mitigated where vulnerable groups or industries are likely to be
affected. This should include adverse distributional impacts of current
policies.
– Impacts on jobs and job quality and how to manage them, including
consideration of reskilling and retraining.
– Plans to monitor and to report publicly on progress towards achieving
a fair transition and protecting vulnerable groups.
– The benefits of Net Zero and where they fall, which will have
implications for individuals, specific regions and the Exchequer.
We will review the Treasury’s final publication as part of our 2020 Progress Report to
Parliament. Managing the just transition will be an ongoing process and must
continue beyond the report’s publication. A full strategy is needed.
The Review should deliver a plan for funding decarbonisation that is fair.
The Treasury’s Net Zero review can be the starting point for a Just Transition strategy for the UK.
291 Sixth Carbon Budget – The path to Net Zero
2. Competitiveness
For climate action to be effective, it must reduce global emissions, not just UK
emissions. Emissions reductions from industry must result from decarbonising the
UK’s own manufacturing and wider industrial base, rather than ‘offshoring’ it to
other countries (i.e. 'carbon leakage'). It is vital therefore to consider
competitiveness.
In our scenarios UK industry is decarbonised, not offshored. Our assessment of the
policy options (in consultation with researchers and industry representatives)
supports a clear conclusion that it is possible to deliver those scenarios without
carbon leakage, provided a suitable policy package is in place. This section
summarises some of the policy options, with more details in our accompanying
Policy report.
a) Context and approach
The context for action to reduce emissions from industry is shifting, with significantly
more climate action emerging internationally than just a year ago, when we
recommended that the UK adopt its Net Zero 2050 target.
• Policy is developing internationally with a similar objective of decarbonising
industry without offshoring. For example, the EU plans to introduce border
carbon adjustments (BCAs) from 2023. The European Commission plans to
bring forward legislation for BCAs in Q2 2021 as part of its European Green
Deal.24 It plans to roll out BCAs from 2023, starting in a few sectors, reported
to be cement, steel and electricity.25 The incoming US Biden administration
has also committed to a carbon adjustment fee on imported products.
• Businesses and sector bodies have also made new commitments. For
example, the European Cement Association set a Net Zero target for 2050.
• Wider adoption of Net Zero targets internationally, including by countries
with large industrial sectors like China and South Korea, is providing a
stronger signal that multinational industry will need to decarbonise at some
stage, whichever country they are based in.
• New projects and demonstrations are emerging. For example, the Hybrit
iron & steel project in Sweden is testing the use of hydrogen instead of
coking coal to produce low-carbon steel, and the NorCem cement factory
in Norway is close to receiving a final investment decision for a full-scale
CCS project.26
We also have a better understanding of where the opportunities to reduce
emissions lie across the emitting industrial sectors, including the roles of resource
and energy efficiency, electrification, use of low-carbon hydrogen and
application of carbon capture and storage (CCS).
• We estimate the annualised cost of decarbonising the manufacturing and
fuel supply sectors with these measures to be around £3.5 billion per year by
2035 and £5.5 billion per year by 2050.
• The scenarios we set out in this report, backed up by our new research (as
described in Chapter 3, sections 3 and 5, are designed to ensure that
industry has time to decarbonise.
A global transition to low-carbon manufacturing and construction is underway.
For climate action to be effective, it must reduce global emissions, not just UK emissions.
The costs of decarbonising manufacturing and construction is smaller than other high emitting sectors, though still significant.
Chapter 6: A just transition to the Sixth Carbon Budget and Net Zero 292
That includes time to roll out new infrastructure (e.g. a CCS network), for
supply chains to scale up and for effective policy to be developed and
implemented in consultation with industry.
We note that global analyses have also identified the potential to decarbonise
global industry at relatively low cost and on similar timescales to our UK scenarios:
• The global pathways we set out in Chapter 7 involve deep decarbonisation
of industry by 2050, with significant progress, particularly in developed
countries like the UK, in earlier years.
• Global analyses have identified potential to reduce industrial emissions to
Net Zero. For example, the Energy Transitions Commission set out pathways
to reduce emissions from cement, steel, chemicals and aluminium to Net
Zero by 2050 in developed countries and by 2060 globally, as part of an
overall transition to Net Zero at a cost of less than 0.5% of global GDP.27
The Committee was particularly careful to consider the needs of industries that
could be at risk of carbon leakage (based on the EU’s list for industries at risk) and
the policy options to support these industries in the Net Zero transition:
• We commissioned new work from the Energy Systems Catapult to evaluate
carbon policies to mitigate leakage and alleviate competitiveness
concerns.
• We asked the University of Leeds to undertake independent research to
evaluate a range of industrial decarbonisation policy options and how
these might be combined to deliver the emissions reductions required,
while avoiding carbon leakage.
• We undertook a deep-dive review of the potential role of product
standards to support deep decarbonisation of industry with an
independent consultant.28
• We convened an industry policy steering group that included trade
representatives from relevant industrial sectors (e.g. steel, cement, paper,
fertiliser), international agencies and policymakers. The group had a series
of meetings to guide the ESC and Leeds research projects and have
informed the Committee’s conclusions in this section.
b) Policy to decarbonise industry and maintain competitiveness
Our work has identified various policy options that should be used for reducing
industry emissions while maintaining competitiveness of UK industry. These would
help enable costlier deep decarbonisation actions, such as electrification, use of
hydrogen and application of CCS. We would expect mechanisms to develop over
time with a transition away from costs initially being borne by taxpayers.
• Free allowance allocation in a UK Emissions Trading System (ETS) would
continue to provide competitiveness protection for industry, although
planned cuts to free allowances have left some concerned at the level of
protection. While free allowances within an ETS can protect
competitiveness, an ETS alone is unlikely to provide a sufficient incentive to
enable deep decarbonisation of industry as a) costs for early industrial
deep decarbonisation deployment will likely come at a premium above
expected carbon prices b) the uncertainty of the carbon price level adds
a further risk premium to costs. c) upfront capital support is likely to be
required by manufacturers that seek very short payback periods (in
addition to an ongoing carbon price incentive).
To meet the Paris Agreement, industry must decarbonise across the world.
It is possible to decarbonise UK industry in line with the scenarios in this report without leading to carbon leakage or offshoring of industry, provided a suitable policy package is in place
293 Sixth Carbon Budget – The path to Net Zero
If a carbon tax combined with rebates or exemptions is implemented from
January 2021 instead of a trading system, this is likely further to reduce
incentives for deep industrial decarbonisation, without further policy.
• Taxpayer funding of industrial deep decarbonisation projects would
manage competitiveness and bring down project cost of capital.
Government has consulted on a Contract for Difference scheme to support
both some capital and operational costs of industrial CCS projects. This, or
other funding approaches, should be rolled out across further deep
industrial decarbonisation. Given the estimated costs of our scenarios set
out in Chapter 5, and that only part of industry is at risk of carbon leakage,
the required support to decarbonise manufacturers at risk of carbon
leakage would be around £2-3 billion per year, assuming manufacturers do
not face additional policy costs on their electricity bills.
• Border carbon tariffs* would raise the price of high-carbon imported goods,
stopping the need for free allowances and allowing all UK emissions to be
subject to carbon pricing without compensation for costs not faced by
international competitors. This could enable carbon pricing to support
deep decarbonisation in sectors that would otherwise be at risk of carbon
leakage. It would also send a signal to other manufacturing countries to
decarbonise their production. Under this approach industry would pay for
the emissions reductions, which could then be passed through to
consumers in higher prices without competitiveness impacts.
• Minimum standards applied to imported goods (in line with domestic
standards) would also allow domestic production to decarbonise without
threat of being undercut by high-carbon imports. Standards could be
applied on producers of goods or on purchasers, and applied at the
primary, intermediary or tertiary product stage. As with border carbon
tariffs, this would lead to a premium price for low-carbon goods so
consumers would bear the cost. Standards mandating near-zero-carbon
intensity may need to be introduced later than the more flexible border
carbon tariffs. Other formulations of standards may have an earlier role,
either directly on carbon intensity with partial reductions or indirectly
through other requirements, or in particular sub-sectors. Public procurement
may also have a role.
It will be for Government to decide on the appropriate mix of instruments, in
consultation with the affected industrial sectors. The broad pathway is likely to be a
transition from subsidised deployment in the near-term towards an international
level playing field that does not require subsidy in the longer-run, although
mechanisms such as contracts for difference may still have a role in removing risks
around carbon pricing.
Work towards the longer-term solution should begin immediately; the substantial
time it will require to develop these solutions means they are on the critical path to
decarbonisation. Most pressing is the development of improved metrics for
carbon-intensity on which border tariffs or standards can be based, along with
international negotiation and consensus building on these measures. Ultimately
implementation of standards and tariffs is likely to be product-by-product rather
than a single over-arching policy – clearly it will be important to ensure consistency
while respecting specific circumstances.
* These are typically referred to as border carbon adjustments (BCA); however, some stakeholders also use the term
BCAs to encompass the application of standards at the border, which we treat separately. Therefore, we use the
Border Carbon Tariff terminology for clarity.
Government must decide on the appropriate mix of instruments, in consultation with the affected industrial sectors.
Chapter 6: A just transition to the Sixth Carbon Budget and Net Zero 294
We note that some of the policies above are more obviously applied to imports to
provide a level playing field for UK producers, but they could also be applied to UK
exporters. For example, border tariffs could also involve rebates to exports from UK
firms that have reduced emissions without full taxpayer support.
While the assessment above focuses on industry, the principles also apply to other
trade-exposed sectors like agriculture. Future trade deals should ensure that UK
standards are also applied to imported goods, and a level playing field is provided
for UK producers operating to high standards. We also note that policies in other
parts of the economy also affect trade-exposed sectors – it will be important to
continue policies such as the exemptions and compensations for UK carbon price
support.
Similarly, for sectors like aviation and shipping, which are inherently international,
the focus should be on developing international policy approaches (though as we
set out in Chapter 10, UK influence and UK levers have an important role to play).
Here, sectoral agreements are already in place (e.g. CORSIA for aviation) or
possibly emerging (for shipping), but will need to strengthen significantly.
A global shift is beginning, towards low-carbon industrial products. The UK should
aim to be part of the manufacturing base for those products, and is well-placed
given our access to plentiful low-cost CO2 storage sites under the North Sea and
elsewhere, and our history of strong infrastructure provision engineering expertise.
Government can maximise the UK’s potential by providing a clear and early low-
carbon policy offer to manufacturers. There are challenges in developing policy to
drive emissions reductions while maintaining competitiveness, but there are also
opportunities and it is increasingly apparent that the low-carbon path is the most
likely path to future success for UK industry.
Other trade exposed sectors, such as agriculture, aviation and shipping could also be at risk of carbon leakage.
295 Sixth Carbon Budget – The path to Net Zero
3. Fuel poverty, energy bills and other household costs
The Climate Change Act requires us to advise on the likely impacts of our
recommended budget on fuel poverty. That is part of a wider issue of fairness
regarding the impact on energy bills, where any increases tend to be regressive.
Our scenarios also imply broader potential costs and benefits for households.
Our analysis in Chapter 5 demonstrates that our scenarios imply growing and
enduring savings in operating costs, alongside a major investment programme. To
2030 the largest cost increases affecting households are in the electricity sector
and for decarbonising buildings. If these are paid fully through energy bills, then
bills would rise to 2030 with likely regressive effects. Alternatively, an extension of
and modest increase in existing Exchequer funding could be sufficient if backed
by effective policy design.
Large savings are available for household in other areas, most notably in transport
from the shift to electric cars, and significant benefits are available for health, well-
being and access to the natural environment. However, even in areas where costs
are likely to fall relative to today, the distribution of costs and savings could create
both ‘winners’ and ‘losers’ during the transition.
Effective policy design, and continued monitoring and intervention should aim to
limit increases in costs to those that are able to pay, while sharing the benefits
broadly.
This section considers
a) Current energy bills and fuel poverty
b) Future energy bills and fuel poverty
c) Wider household costs and benefits
a) Energy bills and fuel poverty
Current energy bills
Ofgem estimate an annual bill for dual-fuel households (using gas for heating and
electricity for lights and appliances) of £1,170 in 2019. Around £150 of the bill was
attributed to environmental and social costs, including the cost of low-carbon
policies.29
The impact of low-carbon policy costs on energy bills is regressive, making up a
larger proportion of the household income of lower-income groups than higher-
income groups (Figure 6.3). It also makes decarbonisation of heating more difficult
as most policy costs are currently recovered from use of electricity rather than gas.
A household switching from a gas boiler to a heat pump for its heating would face
an extra policy cost of over £100 a year on its energy bill, despite reducing its
emissions in the process.
The Committee last published a detailed assessment of energy bills in 2017.30 That
assessment concluded that improvements in energy efficiency had more than
offset increased costs of funding low-carbon technologies such that overall bills
had fallen in real terms since the Climate Change Act was passed in 2008.
Household gas and electricity use has fallen by around 20% since 2008, reducing bills.
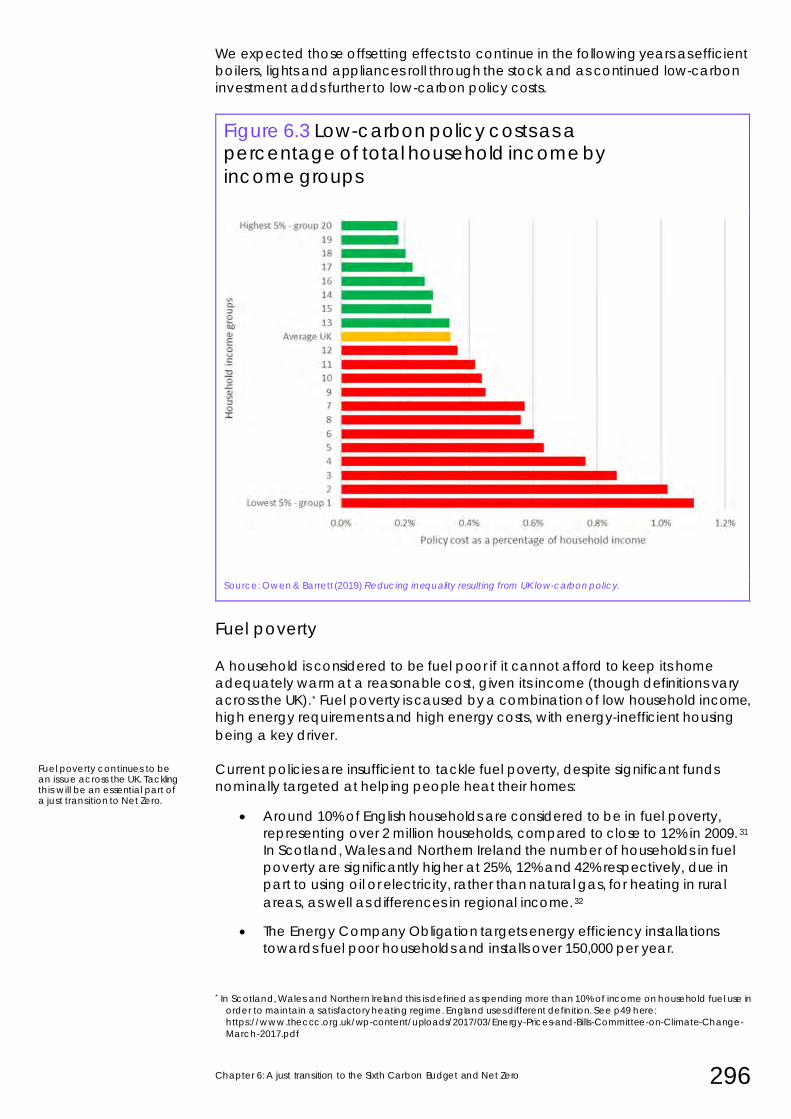
Chapter 6: A just transition to the Sixth Carbon Budget and Net Zero 296
We expected those offsetting effects to continue in the following years as efficient
boilers, lights and appliances roll through the stock and as continued low-carbon
investment adds further to low-carbon policy costs.
Figure 6.3 Low-carbon policy costs as a percentage of total household income by
income groups
Source: Owen & Barrett (2019) Reducing inequality resulting from UK low-carbon policy.
Fuel poverty
A household is considered to be fuel poor if it cannot afford to keep its home
adequately warm at a reasonable cost, given its income (though definitions vary
across the UK).* Fuel poverty is caused by a combination of low household income,
high energy requirements and high energy costs, with energy-inefficient housing
being a key driver.
Current policies are insufficient to tackle fuel poverty, despite significant funds
nominally targeted at helping people heat their homes:
• Around 10% of English households are considered to be in fuel poverty,
representing over 2 million households, compared to close to 12% in 2009. 31
In Scotland, Wales and Northern Ireland the number of households in fuel
poverty are significantly higher at 25%, 12% and 42% respectively, due in
part to using oil or electricity, rather than natural gas, for heating in rural
areas, as well as differences in regional income.32
• The Energy Company Obligation targets energy efficiency installations
towards fuel poor households and installs over 150,000 per year.
* In Scotland, Wales and Northern Ireland this is defined as spending more than 10% of income on household fuel use in
order to maintain a satisfactory heating regime. England uses different definition. See p49 here:
https://www.theccc.org.uk/wp-content/uploads/2017/03/Energy-Prices-and-Bills-Committee-on-Climate-Change-
March-2017.pdf
Fuel poverty continues to be an issue across the UK. Tackling this will be an essential part of a just transition to Net Zero.
297 Sixth Carbon Budget – The path to Net Zero
This year, an additional £1.5 billion of funding for the Green Homes Grant
was also introduced, with the scheme available to social landlords,
alongside targeted funding for fuel poor homes, via local authorities.
• Joint research that we published with the Committee on Fuel Poverty in
2017 identified potential savings on the Winter Fuel Payment (WFP) and
Warm Home discount, which are poorly targeted at helping households in
fuel poverty. We estimate that less than 10% of the combined £2 billion per
year of these budgets for England is received by households in fuel poverty.
Nationwide rollouts of energy efficiency and low-carbon heating solutions offer an
opportunity to reduce energy bills for the fuel poor while decarbonising their
heating, particularly for those off the gas grid. Our scenarios have these homes at
the forefront of the required low-carbon heating installation programme.
b) Future energy bills and fuel poverty
By 2050 we expect the combined operational cost savings from our scenarios for
the electricity and buildings sectors to more than offset the extra investment
requirement for those sectors. That reflects the significant cost reductions expected
for renewable power generation and their increasing share of the UK generation
mix. It implies significant potential for lower bills in the long term, particularly
compared to the current situation where support for historical low-carbon
investments in the power sector is adding significantly to current energy bills.
Electricity costs and appliance efficiency
However, in the early 2030s, we expect low-carbon electricity investment to
continue to add costs to energy bills. Improving energy efficiency can continue
largely to offset these increasing costs in aggregate.
• Costs of low-carbon electricity. Although we expect electricity costs to fall
in the long run, we first expect costs to rise to 2030.
• This reflects both the costs of support for low-carbon investment and
costs of network reinforcement, which is also recovered through
energy bills, albeit spread over a long period as part of the UK’s
regulated asset base. Many of the costs have already been
committed by existing policies.
• Low-carbon investment in the 2020s includes some more expensive
options, such as renewables that were contracted several years ago,
new nuclear power stations that have either agreed a higher price for
their electricity or that we assume will cost more than renewables, and
early carbon capture and storage plants that we expect to be
relatively expensive. Together, this adds costs of up to £9 billion per
year, peaking in 2030 and falling away by 2040. We expect these to
add over £100 by 2030 to the average annual energy bill for a typical
household, though this will depend on policy design (e.g. the
Government has proposed use of a regulated asset base model for
future nuclear investments).
• From the late 2020s the costs of supporting legacy low-carbon
investments (i.e. renewable generation deployed 15-20 years earlier)
will begin to end, reducing the £150 policy costs currently levied on
bills.
Opportunities exist to target existing funding better towards fuel poor households.
Support for low-carbon electricity is likely to add costs to 2030, but fall shortly after.
Chapter 6: A just transition to the Sixth Carbon Budget and Net Zero 298
• Savings from lights, appliances and boilers. In our 2017 energy bills analysis
we estimated that by 2030 households could save around £125 on average
each year by replacing appliances, lights and boilers at the end of their
lives with the latest equivalent models.* Beginning from 2019 instead of 2016
that implies a potential saving by 2030 of around £100.
However, these costs and savings will not be evenly distributed between
households. Recovery of the extra costs should be carefully considered – it should
not be automatically assumed that they will be added to energy bills, given the
regressive effect of such an approach. In particular continuing to recover costs
only from electricity bills would adversely affect those with electric heating and
undermine the attractiveness of electrification.
Paying for low-carbon buildings retrofits
Our analysis in Chapters 3 and 5 (Figure 6.4) identifies an additional investment
requirement in buildings energy efficiency and low-carbon heating of around £9
billion each year from the late 2020s through to 2050 to fully decarbonise the
existing housing stock. This averages at under £10,000 investment per existing
home. This additional investment delivers an operating cost saving of around £1.5
billion a year, with an additional £1.2 billion from lighting and appliances savings
(mentioned above) and on top of savings from improvements to boiler efficiency
assumed in our baseline.
In our accompanying Policy Report we identify a need for policy costs that are
currently charged primarily on electricity bills to be rebalanced. That could involve
moving them to Exchequer spend (in which case energy bills would fall
substantially, but tax rises may be required), or spreading them more evenly over
electricity and gas bills (which would have offsetting increases on gas bills and
decreases on electricity bills). We also identify the importance of standards in
driving progress, but for such a policy to be seen as fair it is likely that some
Exchequer support will be needed, for example as grant funding towards the costs
of investments.
Such an approach can achieve the major upgrade required to the UK’s homes
without large increases in consumers’ energy bills and with a modest increase
Exchequer funding. Indeed, policy can be designed to ensure that vulnerable
customers benefit from lower energy bills, given the lower operating costs resulting
from improvements in energy efficiency of homes and heating systems.
• Low-income households. Our scenarios meet the Government fuel poverty
target to improve all fuel poor owner-occupied homes to an Energy
Performance Certificate rating of ‘C’ by 2030. Investment costs for these
homes are around £2 billion a year to 2030. This reduces to £1 billion a year
to 2050 once the 2030 target has been met. These investment costs can
broadly be covered by existing Government schemes, if current temporary
schemes are extended or other budgets increased (Box 6.3). Providing the
remaining funding gap is closed, this will deliver ongoing savings in annual
energy bills for fuel poor homes of around £70 from 2030 on average.
• Other households. Our scenarios involve investment rising to £7 billion a year
for non-fuel-poor households by 2030. The Government has already
proposed policies to pass some of these through (e.g. to landlords through
the private-rented sector minimum standards, though some may then be
recovered through rents).
* These estimates do not include bill reductions from improving the energy efficiency of the building (e.g. insulation).
Some of these costs are expected to be offset through improved efficiency in appliances over the same period.
Decarbonising our existing homes is associated with investment costs of under £10,000 per home to 2050.
It is possible to achieve this without large increases to energy bills and with a modest increase to Exchequer funding. This would mean people would see the lower operating costs from energy efficient, low-carbon homes reflected in their energy bills.
This investment delivers cost savings of £1.5 billion per year, with a further £1.2 billion per year savings from lights and appliances.
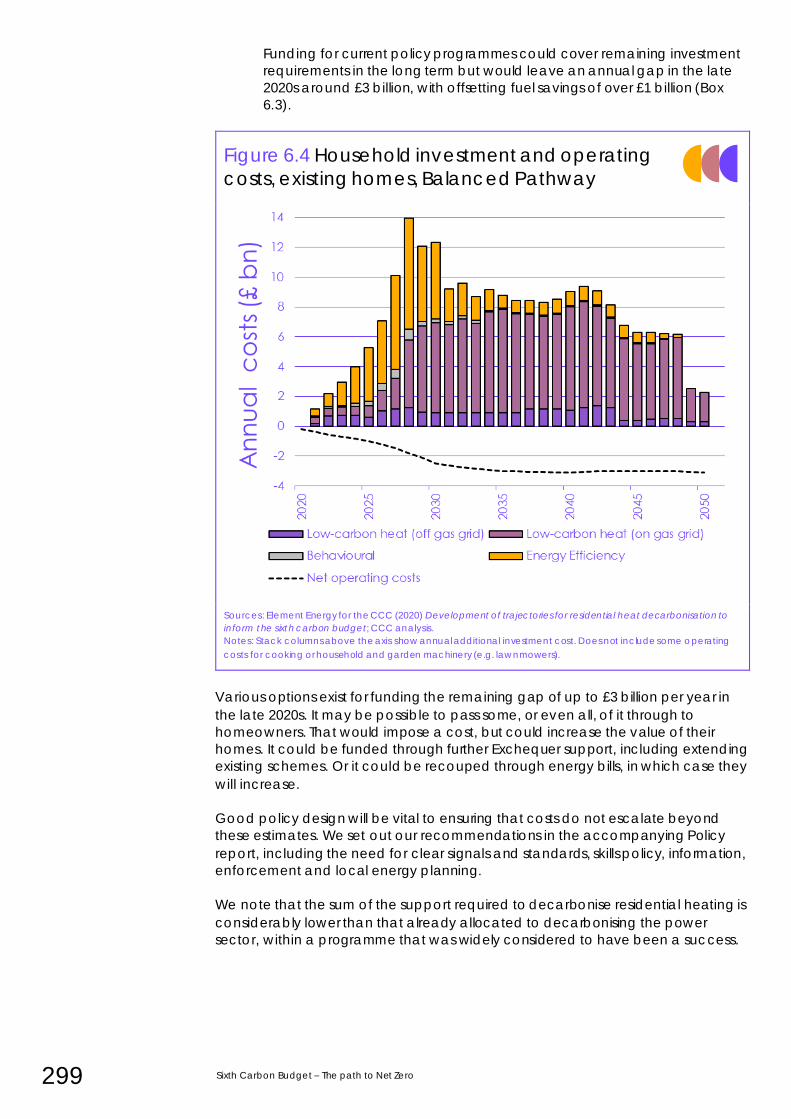
299 Sixth Carbon Budget – The path to Net Zero
Funding for current policy programmes could cover remaining investment
requirements in the long term but would leave an annual gap in the late
2020s around £3 billion, with offsetting fuel savings of over £1 billion (Box
6.3).
Figure 6.4 Household investment and operating
costs, existing homes, Balanced Pathway
Sources: Element Energy for the CCC (2020) Development of trajectories for residential heat decarbonisation to
inform the sixth carbon budget; CCC analysis.
Notes: Stack columns above the axis show annual additional investment cost. Does not include some operating
costs for cooking or household and garden machinery (e.g. lawnmowers).
Various options exist for funding the remaining gap of up to £3 billion per year in
the late 2020s. It may be possible to pass some, or even all, of it through to
homeowners. That would impose a cost, but could increase the value of their
homes. It could be funded through further Exchequer support, including extending
existing schemes. Or it could be recouped through energy bills, in which case they
will increase.
Good policy design will be vital to ensuring that costs do not escalate beyond
these estimates. We set out our recommendations in the accompanying Policy
report, including the need for clear signals and standards, skills policy, information,
enforcement and local energy planning.
We note that the sum of the support required to decarbonise residential heating is
considerably lower than that already allocated to decarbonising the power
sector, within a programme that was widely considered to have been a success.
Chapter 6: A just transition to the Sixth Carbon Budget and Net Zero 300
The overall investment programme in the building stock will deliver important
benefits besides reducing emissions – making homes comfortable and healthier
places to live in, improving affordability in inefficient stock and tackling fuel
poverty, and helping make homes resilient to future climate impacts such as
overheating (see Chapter 3 for more details).
Box 6.3 Existing support schemes and the need for low-carbon funding
The Balanced Pathway to Net Zero set out in Chapters 2 and 3 sees the UK invest in a
major energy efficiency programme over the next 10-15 years, in line with Government
policy. This prepares the stock for a full-scale transition to low-carbon heating in homes on
the gas grid from 2030-2050. Annual investment costs rise to around £9 billion a year by
2030, with an offsetting saving in annual operating costs of £1.5 billion. Funding for current
policy programmes would cover part, but not all, of that gap.
Fuel poor homes. There are several Exchequer-funded programmes which cover £1-2
billion a year of investment costs between now and 2028, mainly focussed on making fuel
poor homes more efficient:
• Fuel poverty programmes. The Energy Company Obligation currently funds energy
efficiency for the fuel poor, at £0.6 billion a year through to 2028. There are further
publicly funded schemes in Scotland, Wales and Northern Ireland which add around £0.1 billion a year. An extra £2 billion is earmarked for fuel poor homes under the
Homes Upgrade Grant under the 2019 Conservative party manifesto.
• Government funding for social housing. Government has earmarked a further £3.8
billion of funding for energy efficiency upgrades in the 5 million social homes, at
around £0.5 billion a year. We estimate that around 40% of this would cover homes
currently in fuel poverty. It does not cover low-carbon heat investments currently,
which would add a further £4 billion to 2030.
• Green Homes Grants. As part of its stimulus package, the Exchequer is currently providing £2.0 billion for grants for energy efficiency and low-carbon heating in
residential homes through to April 2021 (including the £500 million Local Authority
Scheme). These cover the full costs for low income households (capped at £10,000 per
home), and two-thirds for others (capped at £5,000 per home). We assume here that up to 50% covers fuel poor homes – the exact split between fuel poor and other
homes will be determined by demand.
Policy proposals to extend private-rented sector minimum standards will affect who pays
for these investments over the next decade:
• The UK Government published proposals in September 2020 to require all private-
rented homes to get to EPC C by 2028. This would apply to all new lettings from 2025.
• Based on our analysis, this suggests that up £2.5 billion a year could be passed through
to landlords between 2025-2028. The high end of the range is if the Government takes
a ‘dual-metric’ approach targeting both efficiency and carbon emissions, as set out in
its 2020 consultation.* An approach which includes carbon intensity is associated with an additional take up of 700,000 heat pumps to 2028 in the Impact Assessment. BEIS
has published cost estimates of £4,700 per home, or £6,200 per home for the ‘dua l-
metric’ proposal. Pass-through could be higher around 2028, when the total annual
investment programme peaks above £9 billion.
• Between a quarter to just under half of PRS investments cover fuel poor homes, with
the low estimate based on BEIS’ recent Impact Assessment.
• These investments would increase the value of the landlord’s asset (i.e. the home).
However, it remains possible that some of the costs may get passed on to tenants
through rents.
* ‘Dual-metric’ refers here to the energy efficiency rating (EER) which is the typical cost rating on household energy
performance certificates (EPCs).
301 Sixth Carbon Budget – The path to Net Zero
Existing Exchequer support through other schemes could also fund some of the required
investment.
• The domestic RHI subsidises renewable heat technologies such as heat pumps and
biomass boilers, with subsidies paid over a seven-year period. Current forecast spend is
around £400 million this year against an allocated budget of £1.15 billion budget for
this financial year.
• The existing £400 million spending will reduce to zero over the next seven years.
• Similarly, the Green Homes Grant could be extended, which would cover an
additional £2 billion per year.
Implementing these proposals could cover £6-7.5 billion through to 2028 of the £9 billion
investment required annually, and £4 billion from 2030 once the energy efficiency
programme has been completed in most homes. The range in the 2020s is a function of
policy design, in particular for the PRS standards (e.g. whether they cover the full
investment in the Balanced Pathway, including whether they cover low -carbon heat).
This leaves a gap of up to £3 billion a year in the late 2020s, rising to £4 billion a year in the
2030s.
c) Wider household costs and benefits
While we expect costs to increase to the early 2030s in the electricity sector and for
buildings, we expect a large fall in the costs of transport.
• When private costs (e.g. tax) are included savings are large for individual
consumers. For example, owners of petrol and diesel cars driving 250km
(156 miles) in a week currently pay around £17 for their fuel.
• Driving the same 250km in a typical electric vehicle could cost around £6,
saving the driver £11 each week, equivalent to over £500 each year.33
• Even with tax excluded, savings would be significant, at around £100-200
per year.
We have not undertaken a distributional assessment for motoring given the large
cost savings expected overall – though as we note below there could still be
potential issues of fairness.
There are also considerable opportunities to improve people’s health, well -being
and access to the natural environment. We set those out in Chapter 5 at an
economy-wide level. Delivering these in a fair way and ensuring broad access to
the benefits should be a policy focus, alongside avoiding unfair distributions of
cost.
We also identify various other risks in our scenarios of potentially regressive or unfair
effects that can be foreseen and should be planned for.
• Savings from electric vehicles may not be equally available. If infrastructure
in urban areas is prioritised, rural drivers risk missing some of these benefits.
Similarly vehicle charging at home is cheaper than charging in public
places, favouring those with off-street parking. All electricity consumers may
end up paying for network upgrades that are required for electric vehicles,
regardless of whether, or how much they drive. As well as incentivising EV
uptake, tax decisions must be seen to be fair to those who cannot afford to
buy new EVs.
• Gas networks. As homes are electrified, the usage of the UK’s gas networks
will decline, and the costs of managing this infrastructure could fall on
We can already foresee some of the risks of the transition, including in areas where costs are likely to rise such as heat in buildings.
The transition to electric vehicles offers a major cost saving to consumers.
Chapter 6: A just transition to the Sixth Carbon Budget and Net Zero 302
fewer and fewer billpayers, disproportionately affecting those who remain
on the gas grid. This could exacerbate fuel poverty and regional income
inequality.
• Decarbonising the UK’s manufacturing and construction sectors, including
sectors like food processing and beverages, will lead to an increase in the
costs of some goods. Where these are essential products, passing through
these costs to consumers could be regressive. However, even with full pass
through impacts on the prices of final goods is likely to be relatively limited.
• The costs of aviation could increase, as airlines pay for engineered CO2
removals to offset the emissions of flights, despite fuel cost savings from
higher efficiency and lower emissions per flight than currently. For example,
paying for CO2 removal could add over £100 to a £500 return flight to New
York in 2035.* While generally, people who fly have a higher ability to pay
for these costs – 70% of flights are taken by 15% of people,34 added costs
could be seen as unfair to families who go abroad infrequently. Frequent
flyer levies have been suggested as a means of paying for this and were
favoured by the Climate Assembly.
• When costs are paid for can raise questions around intergenerational fairness. Given the length of the transition, and a distribution of costs over
30 years in the CCC’s scenarios, young people will bear a portion of the
costs of the transition, and also deal with the impacts of a warming planet.
This points against any backloading of costs, which would need to be paid
by future generations, and towards the need for a smooth transition to Net
Zero.
These risks emphasise the importance of planning for a just transition and to share
costs, and benefits, fairly. They should be considered carefully within the Treasury’s
Net Zero Review and in ongoing policy design to drive the transition. Towards 2050,
the falling costs of transport and electricity have the scope to offset the costs of
switching to low-carbon heat (Figure 6.5).
* Aviation emissions are not fully offset through emissions removals in our scenarios by 2035, but are by 2050.
Paying for emissions removals, could add £100 to a return flight to New York in 2035.
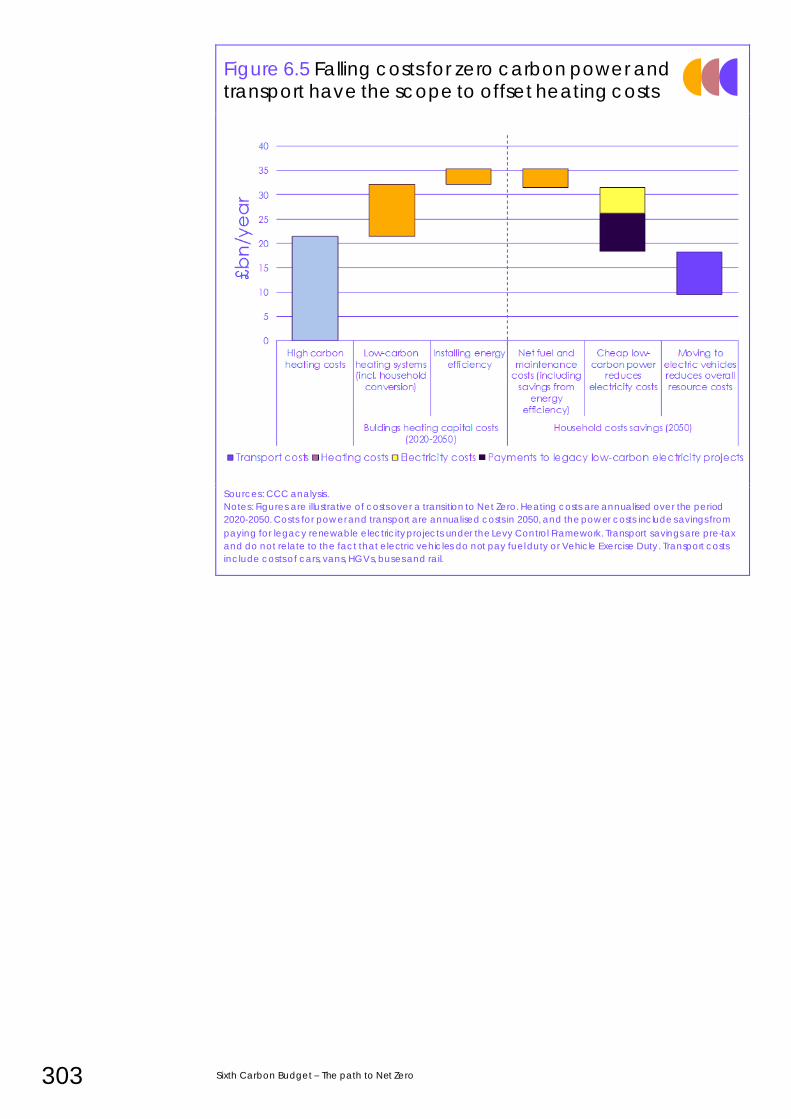
303 Sixth Carbon Budget – The path to Net Zero
Figure 6.5 Falling costs for zero carbon power and transport have the scope to offset heating costs
Sources: CCC analysis.
Notes: Figures are illustrative of costs over a transition to Net Zero. Heating costs are annualised over the period
2020-2050. Costs for power and transport are annualised costs in 2050, and the power costs include s avings from
paying for legacy renewable electricity projects under the Levy Control Framework. Transport savings are pre-tax
and do not relate to the fact that electric vehicles do not pay fuel duty or Vehicle Exercise Duty. Transport costs
include costs of cars, vans, HGVs, buses and rail.
Chapter 6: A just transition to the Sixth Carbon Budget and Net Zero 304
4. Fiscal circumstances
The Climate Change Act requires that we consider ‘fiscal circumstances, and in
particular the likely impact of the decision on taxation, public spending and public
borrowing.’ We note that the UK is starting from a position of stretched public
finances and high borrowing and debt as a result of the response to the COVID-19
pandemic.
Our scenarios can be delivered without major implications for the public finances.
Market mechanisms can be used to ensure that the private sector brings forward
the majority of the required investment. The areas we identify as benefiting most
from public spending require up to around £4-6 billion extra annual funding by
2030. Greater use of carbon taxes could bring in significantly more revenue to
balance this spending. There may also be benefits to general taxation in the near-
term to the extent that the low-carbon investment programme supports economy-
wide investment and the UK’s economic recovery. A particular priority will be
considering how to replace lost annual revenues from fuel duty (£28 billion) and
Vehicle Excise Duty (£7 billion), for which a switch to road charging is an option.
This section considers:
a) Current environmental taxes and public spending
b) Implications of the Net Zero pathway for taxation
c) Implications of the Net Zero pathway for public spending
a) Current environmental taxes and spending
The UK Government already supports decarbonisation programmes, spending an
estimated over £5 billion/year (around 0.25% of GDP), via low-carbon energy
support paid through direct Exchequer spending (around £1billion per year on the
Renewable Heat Incentive, and grants for electric vehicles), and payments for
environmental land management under the EU’s Common Agricultural Policy
(‘CAP’ – around £0.5 billion/year).35
Additionally the Government supports low-carbon energy via levies on bills,
including for renewable electricity (around £10 billion/year forecast in 2020-21) and
energy efficiency (around £0.6 billion/year – Table 6.1).
Further spending also takes place through Government department budgets and
research institutions. Similarly, tax reliefs, such as reduced rates of VAT or
exemptions, are classed as Government spending, making it hard to build up a
comprehensive picture of current low-carbon public spending. The UK spends a
significant amount on International Climate Finance (£5.8 billion over 2016-2021,
doubling for the following five years).
The Government also collects environmental taxes of over £3 billion per year from
revenue from carbon pricing (including CRC, CCL and auctioned allowances
under the EU ETS)* and around £0.7 billion per year through landfill tax. Receipts
from fuel duty are around £28 billion per year from sales of petrol and diesel to
road vehicles, and a further £7 billion is raised from Vehicle Excise Duty.
* CCL = Climate Change Levy, a levy on the fossil fuel content of fuels. CRC = Carbon Reduction Commitment, a
Government energy efficiency scheme.
Our scenarios can be delivered without major implications for the public finances.
The Government already supports decarbonisation programmes in the UK via direct funding, and levies on energy bills.
305 Sixth Carbon Budget – The path to Net Zero
Additional support for decarbonisation programmes come from the Governments
of Scotland, Wales and Northern Ireland, however this funding is not considered
directly in this chapter.
More broadly, across the UK policies with objectives that are not directly related to
climate change mitigation indirectly reflect a carbon price and are applied, to
varying extents, in the surface transport (e.g. fuel duty, VED) and waste sectors
(e.g. landfill tax), and to energy use in commercial and residential buildings (e.g.
reduced VAT on energy - see section iii).
b) Implications of the Net Zero pathway for taxation
Most changes to the Government balance sheet resulting from the transition to
Net Zero will be relatively gradual, playing out through to 2050. There is time and
scope within annual budgets to make adjustments to the fiscal framework, and
develop suitable policy and funding instruments to avoid fundamentally changing
the burden of taxation.
Changes in tax receipts
Our pathways have two significant implications for receipts from current UK taxes.
First, they will have an effect across the economy on growth and investment, with
implications for tax receipts. Second, they will affect receipts from particular taxes.
We have not attempted to quantify the cross-economy impacts, given the
uncertainties set out in Chapter 5 for predicting the impact of the low-carbon
investment programme on GDP (e.g. we identify an annualised resource cost in
2035 of less than 1% of GDP, while macroeconomic modelling suggests a potential
2% GDP boost). To the extent that the investment programme supports the UK’s
economic recovery it could have a large positive impact on general taxation. The
increased spending from the investment programme (i.e. £50 billion annually by
2030, continuing to 2050) could translate to increased tax receipts.
The clearest single measure affecting taxation directly is the shift to low-carbon
transport, eliminating petrol and diesel use by 2050. Under current tax treatment, as
low-carbon vehicles reach 100% of vehicle sales by 2030, fuel duty receipts, which
currently account for £28 billion of Government tax receipts annually (equivalent
to 4% of total Government spending, and 1.4% of GDP), would drop to zero. So too
would Vehicle Excise Duty (VED) of £7 billion per year. A shift towards road
charging could address these impacts (Box 6.8).
Much smaller changes would also be seen in other taxes. For example, landfill tax
(currently £0.7 billion per year) would fall as waste is reduced and diverted to other
means of disposal in our scenarios. Income from carbon taxes and trading
schemes will tend to fall as emissions fall (the power sector switches over fully to
low-carbon options by 2035 in our scenarios), but that may be offset by rising
carbon prices and falling levels of free allocation (and potentially longer term by
carbon border tariffs levied on high-carbon imports or by extension of carbon
trading/taxes to other sectors).
A transition to electric vehicles puts at risk around £35 billion per year of current Government tax receipts. Options exist to address this.
Chapter 6: A just transition to the Sixth Carbon Budget and Net Zero 306
The role of carbon taxes
To incentivise the transition to Net Zero, relative prices will need to reflect carbon
content sufficiently to favour low-carbon options over high-carbon options. That
can be achieved through explicit carbon pricing or other levers.
In principle, all sectors of the economy can be exposed to carbon pricing. In the
UK at present, carbon pricing is applied inconsistently:
• Electricity prices currently carry most climate policy costs. That increases
electricity prices relative to natural gas and discourages a switch to lower-
carbon electric heating. These costs must be a priority area for reform.
• Other sectors face less explicit carbon prices but can be judged indirectly
to reflect a carbon price. For example, in the surface transport and waste
sectors, and energy use in commercial and residential buildings.36
• However, some sectors do not face a carbon price at all, or face reduced
tax rates that are judged by some to be, in effect, negative carbon prices
or fossil fuel subsidies.37
• For example, home heating (often using natural gas) faces a reduced
rate of VAT.* Red diesel fuel for tractors is another example. These
examples demonstrate the importance of wider considerations,
including equity and fairness, given the regressive nature of charges
on energy bills and the wider policy package to support farmers.
• Similarly, aviation fuel faces no taxes at all, meaning that international
flights that go beyond EU borders (where they are covered by the EU
Emissions Trading System) do not face a carbon price or fuel taxation.
Equity arguments are less relevant for this sector, although as set out
above, the Climate Assembly favoured a frequent flyer levy on
account of fairness concerns.
• Energy-from-waste plants also face very little carbon taxation.
Greater use of carbon taxes can also support the public finances while
strengthening incentives to reduce emissions. They are particularly attractive when
global oil prices, and therefore consumers' energy costs, are low, as they are now.
The Zero Carbon Commission estimate that carbon pricing could raise up to £27
billion per year by 2030, though this could increase costs to households, raising a
further need for an equitable redistribution of costs. †38 Recognising this need, the
ZCC suggests that some carbon pricing revenue could be redirected towards the
most affected households. We set out further considerations on the role of carbon
pricing and options for broadening it in our accompanying Policy Report.
* A Green Gas Levy has been proposed, paid through gas bills, that will fund the injection of biomethane into the
natural gas grid. It is expected to come into place in 2021.
† The Zero Carbon Commission estimate that £27 billion/year could be raised via a £75/tCO2 charge across most
domestic sectors, revenue from a Border Carbon Adjustment for industry, energy and agriculture, and removal of
the Red Diesel subsidy for agriculture and shipping. This is an increase on carbon revenues of over £2 billion/year
today.
Carbon taxes could be expanded, but without careful management this could raise issues around the equitable distribution of these costs.
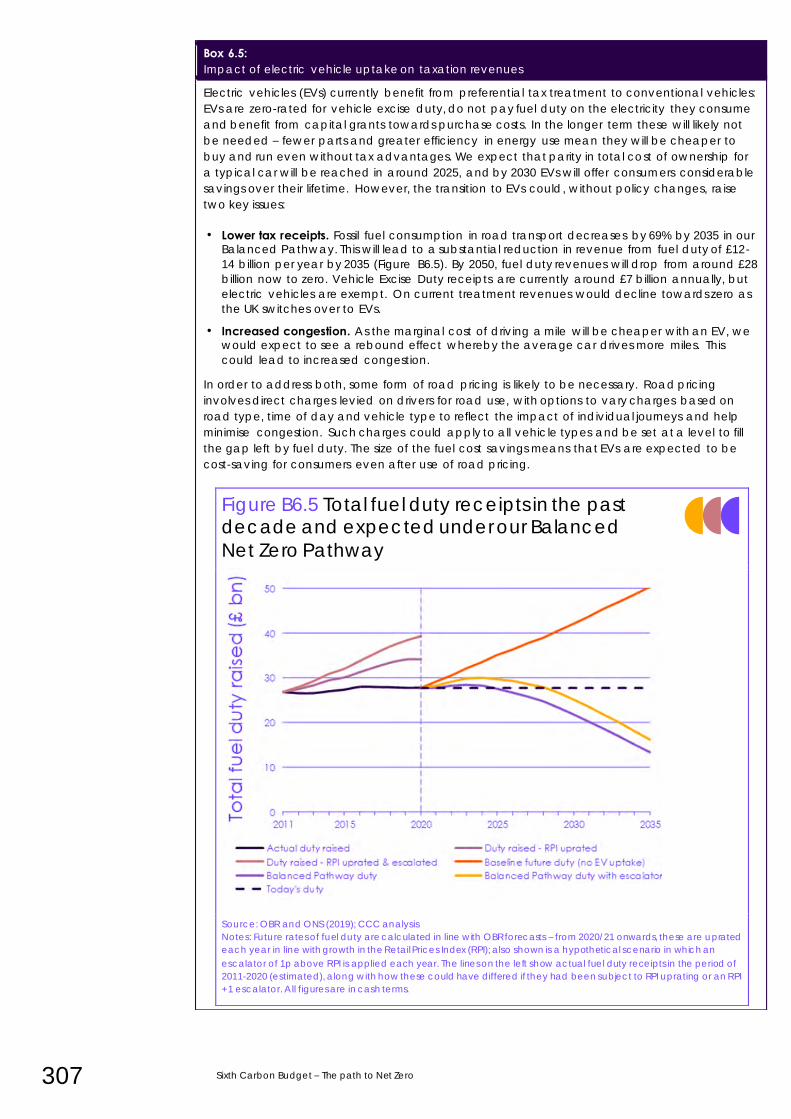
307 Sixth Carbon Budget – The path to Net Zero
Box 6.5: Impact of electric vehicle uptake on taxation revenues
Electric vehicles (EVs) currently benefit from preferential tax treatment to conventional vehicles:
EVs are zero-rated for vehicle excise duty, do not pay fuel duty on the electricity they consume
and benefit from capital grants towards purchase costs. In the longer term these will likely not
be needed – fewer parts and greater efficiency in energy use mean they will be cheaper to
buy and run even without tax advantages. We expect that parity in total cost of ownership for
a typical car will be reached in around 2025, and by 2030 EVs will offer consumers considerable
savings over their lifetime. However, the transition to EVs could, without policy changes, raise
two key issues:
• Lower tax receipts. Fossil fuel consumption in road transport decreases by 69% by 2035 in our Balanced Pathway. This will lead to a substantial reduction in revenue from fuel duty of £12-
14 billion per year by 2035 (Figure B6.5). By 2050, fuel duty revenues will drop from around £28
billion now to zero. Vehicle Excise Duty receipts are currently around £7 billion annually, but
electric vehicles are exempt. On current treatment revenues would decline towards zero as
the UK switches over to EVs.
• Increased congestion. As the marginal cost of driving a mile will be cheaper with an EV, we would expect to see a rebound effect whereby the average car drives more miles. This
could lead to increased congestion.
In order to address both, some form of road pricing is likely to be necessary. Road pricing
involves direct charges levied on drivers for road use, with options to vary charges based on
road type, time of day and vehicle type to reflect the impact of individual journeys and help
minimise congestion. Such charges could apply to all vehicle types and be set at a level to fill
the gap left by fuel duty. The size of the fuel cost savings means that EVs are expected to be
cost-saving for consumers even after use of road pricing.
Figure B6.5 Total fuel duty receipts in the past decade and expected under our Balanced
Net Zero Pathway
Source: OBR and ONS (2019); CCC analysis
Notes: Future rates of fuel duty are calculated in line with OBR forecasts – from 2020/21 onwards, these are uprated
each year in line with growth in the Retail Prices Index (RPI); also shown is a hypothetical scenario in which an
escalator of 1p above RPI is applied each year. The lines on the left show actual fuel duty receipts in the period of
2011-2020 (estimated), along with how these could have differed if they had been subject to RPI uprating or an RPI
+1 escalator. All figures are in cash terms.
Chapter 6: A just transition to the Sixth Carbon Budget and Net Zero 308
c) Implications of the Net Zero pathway for public spending
Chapter 5 set out the need for additional investment in low-carbon technologies
and infrastructure to increase from around £10 billion per year today to over £50
billion per year by 2030. Most of these investments will be funded and delivered by
the private sector. Government borrowing rates are particularly low, but so are
those for the private sector. The use of Government policy to de-risk private sector
investment is likely to be more important than direct public investment in most
areas, and can be used to leverage many multiples of any Government spend.
In many areas funding instruments are already in place, and Government can
build on these to deliver policy packages that use some public funding, backed by
strong policy, to leverage private investment in the 2020s (Table 6.1).
• New renewable electricity projects are now cheaper than high-carbon electricity in the UK. However targeted support will still be required in some
areas, such as port infrastructure for offshore wind (e.g. the recently
announced £160m funding for ports servicing offshore wind farms). Larger-
scale funding (which is currently levied on bills, and therefore covered in
our analysis above) is likely to be needed to support nuclear power (e.g.
via a regulated asset base – RAB – model), novel renewables (such as
wave, floating wind, and tidal) and funding for hydrogen and CCS power
projects.
• Switching homes to low-carbon heating and improving energy efficiency remains a major challenge. Standards and regulation can incentivise
housebuilders and landlords to improve the efficiency and install low-
carbon heat in new and existing homes. As set out in Box 6.5 above several
schemes exist that draw on Exchequer spending. Continuing that spending
(including temporary schemes like the Green Home Grants) and directing
funding towards grants could support the majority of the required
investment programme without adding to energy bills if extra annual
funding of up to £3 billion was provided from the late 2020s. Longer term
this could fall as low-carbon heating costs fall and standards pass more of
the investment cost onto consumers. Around £1 billion is required annually
for public sector buildings.
• Deep decarbonisation measures in manufacturing and construction have a
combined capital and operating cost of the order of £2.5 billion a year by
2030, and £5 billion a year by 2050. Some of this could be passed onto
industry, however, trade-exposed industries will require a level playing field
to ensure that emissions are reduced, not offshored (see section 2). For an
interim period, industrial decarbonisation of trade-exposed sectors should
be funded by taxpayers, but this can be reduced over time by introducing
policy on imports and as other countries take action to meet their
commitments under the Paris Agreement. Some early deployment support
may also be needed for less trade-exposed sectors.
• Farmers and land managers currently receive large subsidies from the EU's
Common Agricultural Policy (CAP), but not for reducing GHG emissions. The
UK Agriculture Bill intends to redirect subsidies towards public goods and
could support the major transition in land use and farming practices
required by the Net Zero target and our recommended Sixth Carbon
Budget. Realising the changes in UK land use in our scenarios could require
funding of at least £1 billion/year, which can be partly provided by the
private sector and partly through public funding.
Government de-risking of private sector investment can bring forward most of the investment in our scenarios.
309 Sixth Carbon Budget – The path to Net Zero
• The annual costs of removing emissions from the atmosphere are
potentially large in our scenarios (e.g. of the order of £6 billion/year by 2050,
from an initial scale of around £1 billion/year in 2030). Initial development of
these technologies is likely to require some Exchequer funding, however in
the long-term costs should be paid for by polluting industries (e.g. aviation).
• As electric vehicles continue to fall in costs, current purchase subsidies can
be phased out. By 2050, we expect the shift to low-carbon options like
electrification to cut the annual costs of UK transport by around £19 billion
per year. That can be achieved while maintaining transport's tax
contribution and allows for the costs of charge-points and other
infrastructure, whilst phasing out the capital subsidies, and lower vehicle
and fuel taxation that EVs currently benefit from.
• Additional Exchequer support is likely to be required for large scale demonstration projects in low-carbon hydrogen production, CCS
infrastructure, HGV trials and local projects such as Net Zero Pathfinder
cities.
In total these areas imply a need for Exchequer funding rising to at least £9-12
billion per year by 2030, an increase on the £5 billion per year of direct Exchequer
funding spent today (Table 6.1). Spending through low-carbon levies also will need
to increase, as set out in section 3 on energy bills. Other spending that we have not
identified may be appropriate in support of the just transition.
Generally, we would expect a move away from Exchequer funding over time – a
continued need for subsidies is unlikely to inspire business confidence in low-carbon
markets. Standards and regulation complemented by carbon pricing can be used
to ensure the low-carbon option is favoured, and where appropriate, the high-
carbon option is phased out. The role of Government then becomes ensuring
efficient markets and avoiding inequalities.
• Supporting cost reduction. As seen in the power sector over the past
decade, initial Government support can enable technology cost
reductions, allowing support to be reduced over time. Our scenarios
involve increasing roles for other emerging technologies (e.g. emissions
removals, low-carbon HGV trials, and floating wind).
• Standards and regulation can be used to mandate suppliers of higher-
carbon technologies and fuels to provide low-carbon alternatives, driving
deployment at scale.
• Where possible, costs can be passed through, such as in sectors that are
not exposed to international trade, or in buildings, where the cost the low-
carbon heating could be absorbed into property values for new build and
existing homes. Where the costs of decarbonisation are higher, premiums
for low-carbon goods may be acceptable, if applied universally. For
example, product standards (possibly alongside border carbon tariffs) in
the UK could ultimately create a market for low-carbon steel a slightly
higher price.
• Carbon markets and carbon trading can be used instead, or alongside
standards and regulation to incentivise an efficient balancing of positive
and negative emissions (see next section).
• Ongoing Government funding will still be needed, to support innovation,
build skills and ensure the equitable distribution of costs.
Chapter 1 of the policy report that accompanies our advice has further detail
on the role of all actors, including Government, over the transition to Net Zero.
Exchequer funding will need to increase to around £9-12 billion/year by 2030, from £5 billion today.
Beyond 2030, we except Government funding to decrease as part of a transition to standards, regulations and market-based mechanisms.
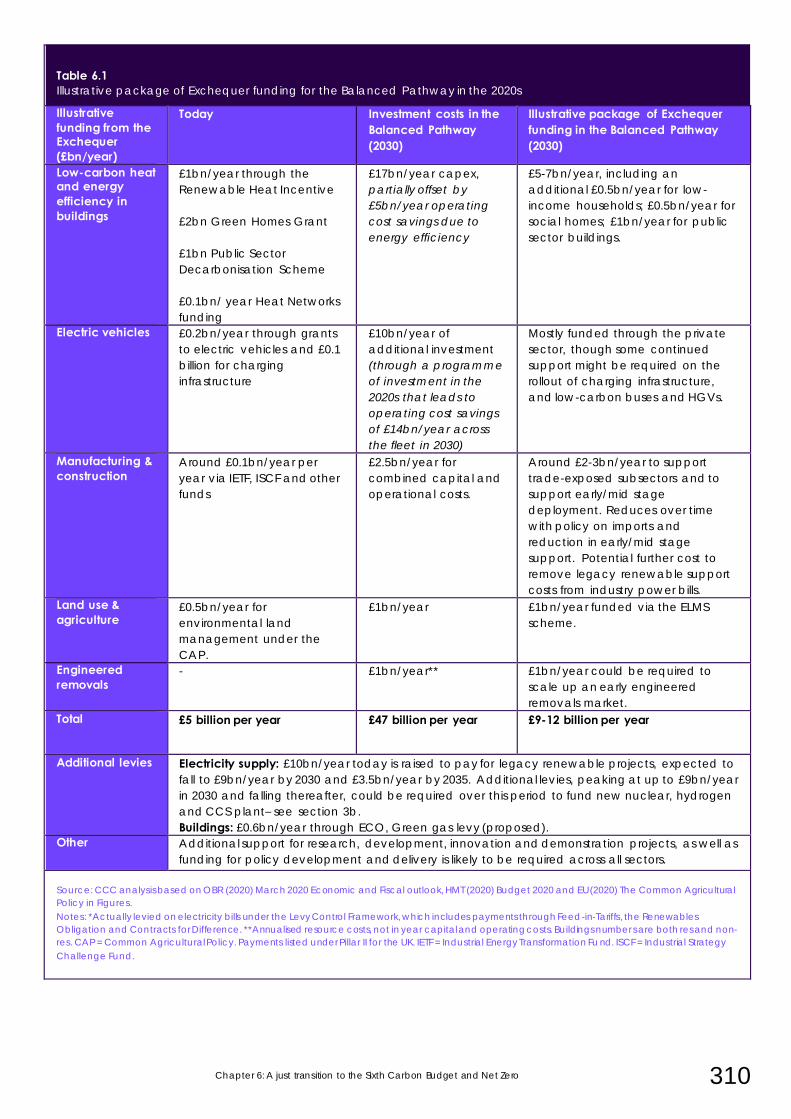
Chapter 6: A just transition to the Sixth Carbon Budget and Net Zero 310
Table 1.11:Table 1.11
Table 6.1 Illustrative package of Exchequer funding for the Balanced Pathway in the 2020s
Illustrative funding from the Exchequer (£bn/year)
Today Investment costs in the Balanced Pathway (2030)
Illustrative package of Exchequer funding in the Balanced Pathway (2030)
Low-carbon heat and energy efficiency in buildings
£1bn/year through the
Renewable Heat Incentive
£2bn Green Homes Grant
£1bn Public Sector
Decarbonisation Scheme
£0.1bn/ year Heat Networks
funding
£17bn/year capex,
partially offset by
£5bn/year operating
cost savings due to
energy efficiency
£5-7bn/year, including an
additional £0.5bn/year for low-
income households; £0.5bn/year for
social homes; £1bn/year for public
sector buildings.
Electric vehicles £0.2bn/year through grants
to electric vehicles and £0.1
billion for charging
infrastructure
£10bn/year of
additional investment
(through a programme
of investment in the
2020s that leads to
operating cost savings
of £14bn/year across
the fleet in 2030)
Mostly funded through the private
sector, though some continued
support might be required on the
rollout of charging infrastructure,
and low-carbon buses and HGVs.
Manufacturing & construction
Around £0.1bn/year per
year via IETF, ISCF and other
funds
£2.5bn/year for
combined capital and
operational costs.
Around £2-3bn/year to support
trade-exposed subsectors and to
support early/mid stage
deployment. Reduces over time
with policy on imports and
reduction in early/mid stage
support. Potential further cost to
remove legacy renewable support
costs from industry power bills.
Land use & agriculture
£0.5bn/year for
environmental land
management under the
CAP.
£1bn/year £1bn/year funded via the ELMS
scheme.
Engineered removals
- £1bn/year** £1bn/year could be required to
scale up an early engineered
removals market.
Total £5 billion per year £47 billion per year £9-12 billion per year
Additional levies Electricity supply: £10bn/year today is raised to pay for legacy renewable projects, expected to
fall to £9bn/year by 2030 and £3.5bn/year by 2035. Additional levies, peaking at up to £9bn/year
in 2030 and falling thereafter, could be required over this period to fund new nuclear, hydrogen
and CCS plant– see section 3b.
Buildings: £0.6bn/year through ECO, Green gas levy (proposed).
Other Additional support for research, development, innovation and demonstration projects, as well as
funding for policy development and delivery is likely to be required across all sectors.
Source: CCC analysis based on OBR (2020) March 2020 Economic and Fiscal outlook, HMT (2020) Budget 2020 and EU (2020) The Common Agricultural
Policy in Figures. Notes: *Actually levied on electricity bills under the Levy Control Framework, which includes payments through Feed-in-Tariffs, the Renewables
Obligation and Contracts for Difference. **Annualised resource costs, not in year capital and operating costs. Buildings number s are both res and non-
res. CAP = Common Agricultural Policy. Payments listed under Pillar II for the UK. IETF = Industrial Energy Transformation Fu nd. ISCF = Industrial Strategy
Challenge Fund.
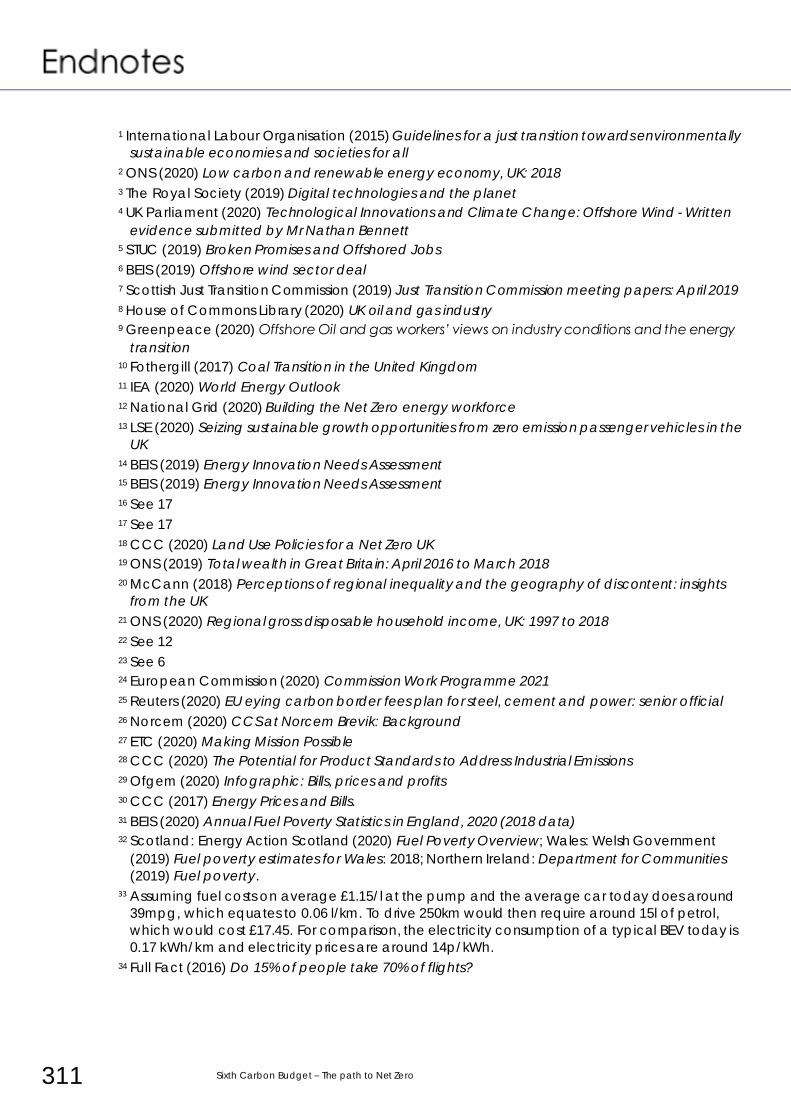
311 Sixth Carbon Budget – The path to Net Zero
1 International Labour Organisation (2015) Guidelines for a just transition towards environmentally
sustainable economies and societies for all
2 ONS (2020) Low carbon and renewable energy economy, UK: 2018
3 The Royal Society (2019) Digital technologies and the planet 4 UK Parliament (2020) Technological Innovations and Climate Change: Offshore Wind - Written
evidence submitted by Mr Nathan Bennett 5 STUC (2019) Broken Promises and Offshored Jobs
6 BEIS (2019) Offshore wind sector deal
7 Scottish Just Transition Commission (2019) Just Transition Commission meeting papers: April 2019
8 House of Commons Library (2020) UK oil and gas industry 9 Greenpeace (2020) Offshore Oil and gas workers’ views on industry conditions and the energy
transition 10 Fothergill (2017) Coal Transition in the United Kingdom
11 IEA (2020) World Energy Outlook
12 National Grid (2020) Building the Net Zero energy workforce
13 LSE (2020) Seizing sustainable growth opportunities from zero emission passenger vehicles in the
UK
14 BEIS (2019) Energy Innovation Needs Assessment 15 BEIS (2019) Energy Innovation Needs Assessment
16 See 17
17 See 17
18 CCC (2020) Land Use Policies for a Net Zero UK 19 ONS (2019) Total wealth in Great Britain: April 2016 to March 2018
20 McCann (2018) Perceptions of regional inequality and the geography of discontent: insights
from the UK
21 ONS (2020) Regional gross disposable household income, UK: 1997 to 2018
22 See 12
23 See 6 24 European Commission (2020) Commission Work Programme 2021
25 Reuters (2020) EU eying carbon border fees plan for steel, cement and power: senior official
26 Norcem (2020) CCS at Norcem Brevik: Background
27 ETC (2020) Making Mission Possible 28 CCC (2020) The Potential for Product Standards to Address Industrial Emissions
29 Ofgem (2020) Infographic: Bills, prices and profits
30 CCC (2017) Energy Prices and Bills.
31 BEIS (2020) Annual Fuel Poverty Statistics in England, 2020 (2018 data) 32 Scotland: Energy Action Scotland (2020) Fuel Poverty Overview; Wales: Welsh Government
(2019) Fuel poverty estimates for Wales: 2018; Northern Ireland: Department for Communities
(2019) Fuel poverty. 33 Assuming fuel costs on average £1.15/l at the pump and the average car today does around
39mpg, which equates to 0.06 l/km. To drive 250km would then require around 15l of petrol,
which would cost £17.45. For comparison, the electricity consumption of a typical BEV today is
0.17 kWh/km and electricity prices are around 14p/kWh.
34 Full Fact (2016) Do 15% of people take 70% of flights?

Chapter 6: A just transition to the Sixth Carbon Budget and Net Zero 312
35 CCC analysis based on OBR (2020) March 2020 fiscal supplementary tables forecast for 2020-21
and EU (2020) The Common Agricultural Policy in Figures. Note this does not include all
payments under CAP, only those for Pillar II. 36 ESC (2019) Rethinking decarbonisation incentives
37 Institute for Fiscal Studies (2013) Energy use policies and carbon pricing in the UK. Where
reduced tax rates are applied to fossil fuels, this is sometimes referred to as fossil fuel subsidies.
38 Zero Carbon Commission (2020) How carbon pricing can help Britain achieve Net Zero by 2050
313 Sixth Carbon Budget – The path to Net Zero
The Sixth Carbon Budget as a
contribution to the Paris
Agreement
1. Reflecting the Paris Agreement in our scenarios 317
2. Is the Balanced Pathway a fair and ambitious contribution? 322
3. Supporting global efforts to reduce emissions 333
4. Reducing the UK’s carbon footprint 344

315 Sixth Carbon Budget – The path to Net Zero
Introduction and key messages
Climate change is a global problem requiring a global response. The 2015 Paris
Agreement frames that response by setting a long-term global temperature goal
and requiring bottom-up nationally determined contributions from each country
that reflect their particular responsibilities and capabilities. Together, these
commitments should deliver the long-term temperature goal.
The Sixth Carbon Budget recommended in this report – requiring that UK territorial
greenhouse emissions (GHG) emissions are reduced 78% by 2035 relative to 1990 –
would form part of the UK’s contribution to this global effort. Chapters 2 to 6 set out
pathways to deliver the budget, and the impacts that these may have. This
chapter sets out why the Committee considers these pathways to be an
appropriate contribution from the UK towards the global goals of the Paris
Agreement.
This chapter also sets out the implications of the pathways from Chapters 2 and 3
for the UK’s consumption emissions and considers the options available to the UK
for supplementing reducing UK territorial emissions to Net Zero with additional
support for emissions reductions overseas consistent with its Paris Agreement
obligations.
The key findings of this chapter are:
• The Balanced Net Zero Pathway represents a fair and ambitious contribution to the Paris Agreement. This pathway, which is the basis for our
recommended Sixth Carbon Budget, would require the UK to deploy all the
actions necessary for the world to keep warming to below 1.5°C at or
before when they are required from the world as a whole, consistent with
the UK’s obligation as a developed country to take a lead. Pursing the
highest feasible ambition for rapid reductions in emissions to 2035 would
help minimise the UK’s contribution to global warming between now and
reaching Net Zero and would see UK emissions per person in 2035 consistent
with the global average in scenarios expected to keep warming to 1.5°C.
• The UK’s Nationally Determined Contribution to the Paris Agreement should be set based on the same pathway as the Sixth Carbon Budget. We have
considered the required principles for an NDC under the Paris Agreement,
particularly the need for ‘highest possible ambition’, in constructing the
Balanced Pathway. The UK should also use the opportunity of its role as the
host of the international negotiations to reaffirm and strengthen other
aspects of its contribution to tackling climate change, in particular the
need to strengthen adaptation planning for the inevitable future increases
in climate risks, both around the world and in the UK.
• Action to develop and deploy deeper decarbonisation options over the 2020s in the Balanced Net Zero Pathway can have significant global benefits in the decades thereafter. Our Balanced Pathway deploys most
low-carbon options at scale before they must reach similar scales for the
world as a whole, but in line with emerging commitments from other
climate leaders. That is particularly important for deeper decarbonisation
options including widespread electrification in industry, carbon capture
and storage (CCS) and low-carbon hydrogen, some which are currently
relatively expensive and need early-stage support before a global scale-up
would be credible. The UK is well-placed to help pioneer developments in
these areas alongside other developed countries.
This chapter provides the Committee’s assessment of the international circumstances and the UK’s contribution to the Paris Agreement.
Chapter 7: The Sixth Carbon Budget as a contribution to the Paris Agreement 316
Slower progress in these areas over the coming decade would risk
undermining the rapid global scale-up required in these technologies over
the 2030s and beyond to deliver on the Paris Agreement.
• The UK can and should do more to support the global effort than just delivering its domestic emissions reduction pathways. Climate risks globally
and in the UK will only stop increasing when global emissions decline to
close to zero. As a developed country, the UK has a responsibility to do
more to support the global decarbonisation effort than just deliver
ambitious domestic commitments to reduce emissions. Opportunities exist
for the UK to help drive up global ambition across many areas alongside
other developed countries. In particular, the UK’s role as host of COP26 and
President of the G7 group in 2021 give it an opportunity and a responsibility
to coordinate efforts to align the economic responses to COVID-19 with the
significant shifts in investment patterns needed over the coming decade to
keep the Paris Agreement long-term temperature goal within reach. The UK
is an important provider of climate finance for both mitigation and
adaptation. And the UK’s role as a global financial hub indicates additional
opportunities to do so through financial system reform.
• Part of the UK’s effort to support global decarbonisation should involve actions to track and reduce its overseas consumption footprint. A variety of
levers are available to the UK to support reductions in the overseas
emissions that help meet UK consumption. Under successful efforts to
reduce global emissions in line with the Paris Agreement, exploratory
modelling indicates that the UK’s consumption emissions footprint could be
reduced as much as 90% below 1990 levels. The Government should track
these emissions against a target trajectory consistent with global outcomes
achieving the Paris Agreement.
We set out our analysis in four sections:
1. Reflecting the Paris Agreement in our scenarios
2. Is the Balanced Net Zero Pathway a fair and ambitious contribution?
3. Supporting the global effort to reduce emissions
4. Reducing the UK’s consumption footprint
317 Sixth Carbon Budget – The path to Net Zero
1. Reflecting the Paris Agreement in our scenarios
The Paris Agreement is the globally agreed framework for tackling climate change,
created at the 21st Conference of Parties (COP21) to the United Nations
Framework Convention on Climate Change (UNFCCC) in 2015 and has been in
force since 2016. It has been ratified by 188 countries representing around 80% of
current global greenhouse gas emissions.
This section summarises the aims of the Paris Agreement and the obligations on the
UK to reduce its territorial GHG emissions as a Party to the Agreement and explains
how they are reflected in the scenarios developed in this report. It is in two sub-
sections:
a) National contributions to the Paris Agreement
b) How the scenarios in this report reflect the Paris Agreement
a) National contributions to the Paris Agreement
The Paris Agreement set a long-term temperature target of keeping warming ‘well-
below’ 2°C above pre-industrial levels, and ‘pursuing efforts’ to keep it below
1.5°C.
To achieve that temperature goal, the Agreement identified three high-level
milestones for global GHG emissions:
• Global peaking of greenhouse gas emissions as soon as possible
• Rapid reductions thereafter
• Achieving a balance between anthropogenic emissions by sources and
removals by sinks of greenhouse gases in the second half of this century
To achieve these global objectives, the Paris Agreement also created a system
requiring countries to produce regular nationally determined contributions (NDCs)
to the long-term goals of the Agreement. This system has several important
features:
• An obligation to produce an NDC: All countries must produce or update
NDCs on a regular 5-yearly cycle. Countries are requested to
‘communicate’ or ‘update’ their existing NDCs (for emissions reductions
prior to 2030) ‘by 2020’. The UK was previously covered by the EU NDC
(currently a 40% reduction in GHG emissions by 2030 against a 1990
baseline) but is required to submit its own NDC having left the European
Union. Our advice on the level of the UK’s Fifth Carbon Budget estimated
that the UK’s contribution to this EU target would be approximately a 53%
reduction in GHG emissions relative to 1990 levels, slightly less than the
legislated level of the Fifth Carbon Budget.
• Nationally determined emissions reduction targets: NDC targets are
determined in a ‘bottom-up’ fashion by the countries themselves.
– Parties are encouraged to commit to absolute economy-wide
emissions reduction targets for a defined single year, but can
currently choose a narrower sectoral coverage, or alternative
metrics such as carbon intensity (e.g. India).
The Paris Agreement is the main international framework to tackle climate change.
The Paris Agreement sets a long-term temperature goal and aims to reduce global emissions to Net Zero.
All countries have an obligation to produce a pledge to reduce emissions but set the levels of the targets themselves.
Chapter 7: The Sixth Carbon Budget as a contribution to the Paris Agreement 318
– Producing an NDC is a legal obligation under the Paris
Agreement, but meeting the emissions reduction targets in the
NDC is only legally binding if countries choose to enshrine those
targets in national law.
– In 2018 the Parties to the Paris Agreement agreed a ‘rulebook’
to help further standardise NDC accounting between countries
– although some aspects of this rulebook (such as the rules for
the interaction of NDCs with global carbon markets) remain to
be agreed. This includes a requirement to use the global
warming potential values (at a 100-year time horizon) from the
IPCC 5th Assessment Report (IPCC-AR5) to aggregate GHG
emissions.*
• Principles for national contributions: The Paris Agreement requires that NDCs
reflect each party’s highest possible ambition and their common-but-
differentiated responsibilities and respective capabilities, while accounting
for their national circumstances.
– Highest possible ambition. Each Country’s successive NDC
should be a ‘progression’ beyond its previous one (the so-called
ratchet mechanism) and should reflect its ‘highest possible
ambition’ to reduce emissions.
– Common-but-differentiated responsibilities and respective
capabilities (CBDR-RC) in the light of different national
circumstances. This refers to the principle that, while all countries
have responsibility to take actions to support the global goal,
developed countries (that are generally wealthier and have
contributed more to past climate change) should take a lead.
Similarly, the capability to reduce emissions depends on wealth,
development needs, and the sources of emissions that make up
a country’s footprint.
The first NDCs from all parties to the agreement, which mostly extend out to 2030,
are required to be updated or recommunicated by the end of 2020 according to
a decision of the UNFCCC at the 21st annual Conference of Parties (COP21) in
2015, and reinforced by a decision at COP25 in 2019.
The required NDC commitments for the UK are related to, but formally
independent of, its obligations for emissions reductions under the domestic carbon
budget framework (Figure 7.1). The UK’s NDC under the Paris Agreement should
extend up to 2030, the mid-point of the Fifth Carbon Budget period. The UK will be
required to submit its second NDC by 2025 for emissions reductions after 2030. This
should be for 2035, the mid-year of the Sixth Carbon Budget period, or for a later
period, depending on future international negotiations on establishing common
timeframes.
* The IPCC 5th Assessment report contains two sets of values for the global warming potential to a 100-year time-
horizon (GWP100), those including and excluding climate-carbon feedbacks. We use the set of values with climate-
carbon feedbacks reflecting the IPCC-AR5 assessment that ‘it is likely that including the climate–carbon feedback
for non-CO2 gases as well as for CO2 provides a better estimate of the metric value than including it only for CO2’.
All countries are asked to be as ambitious as possible with their emissions reductions, with an expectation that levels of action would be different between countries.
The UK’s commitments under the Paris Agreement are related to, but are formally independent of, the UK’s domestic carbon budgets.
The UK will have to produce a pledge to reduce emissions over the period to 2030.
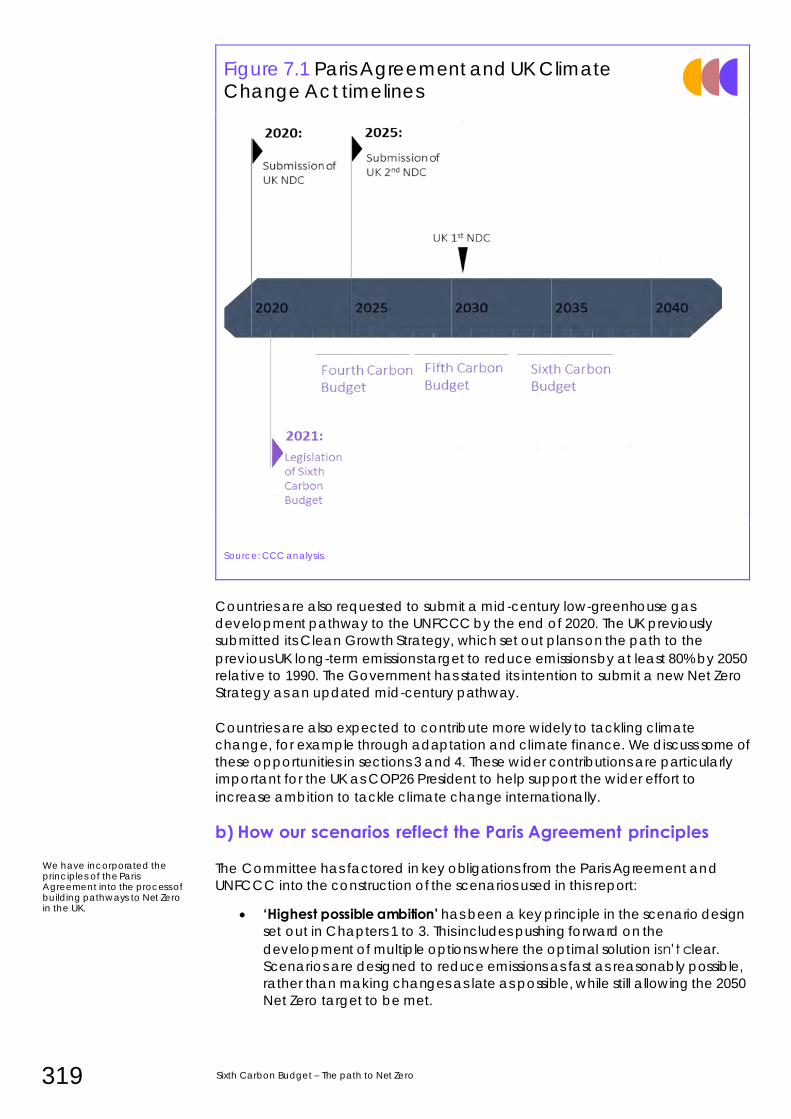
319 Sixth Carbon Budget – The path to Net Zero
Figure 7.1 Paris Agreement and UK Climate Change Act timelines
Source: CCC analysis.
Countries are also requested to submit a mid-century low-greenhouse gas
development pathway to the UNFCCC by the end of 2020. The UK previously
submitted its Clean Growth Strategy, which set out plans on the path to the
previous UK long-term emissions target to reduce emissions by at least 80% by 2050
relative to 1990. The Government has stated its intention to submit a new Net Zero
Strategy as an updated mid-century pathway.
Countries are also expected to contribute more widely to tackling climate
change, for example through adaptation and climate finance. We discuss some of
these opportunities in sections 3 and 4. These wider contributions are particularly
important for the UK as COP26 President to help support the wider effort to
increase ambition to tackle climate change internationally.
b) How our scenarios reflect the Paris Agreement principles
The Committee has factored in key obligations from the Paris Agreement and
UNFCCC into the construction of the scenarios used in this report:
• ‘Highest possible ambition’ has been a key principle in the scenario design
set out in Chapters 1 to 3. This includes pushing forward on the
development of multiple options where the optimal solution isn’t clear.
Scenarios are designed to reduce emissions as fast as reasonably possible,
rather than making changes as late as possible, while still allowing the 2050
Net Zero target to be met.
We have incorporated the principles of the Paris Agreement into the process of building pathways to Net Zero in the UK.
Chapter 7: The Sixth Carbon Budget as a contribution to the Paris Agreement 320
All scenarios in this report involve a considerable progression in effort from
the existing EU NDC (which has covered the UK’s formal commitment to the
Paris Agreement to date) and existing UK carbon budgets. These scenarios
require the UK to deploy actions necessary for the world to keep warming
below 1.5°C before they are required from the world as a whole (Section
2).
• Common-but-differentiated responsibilities in the light of different national circumstances. The UK’s Net Zero target for 2050 covers all greenhouse
gases (GHGs). This Net Zero date is around two decades earlier than when
global GHG emissions reach Net Zero in emissions pathways assessed by
the IPCC as limiting warming to 1.5°C (50% probability with no or low
overshoot). An earlier Net Zero date for the UK than the world is consistent
with the UK’s responsibilities as a relatively rich country with a high historical
contribution to climate change and high overseas consumption emissions
footprint. Consistent with this principle, our pathways to this Net Zero target
are constructed to require ambitious early action to reduce emissions, with
most emissions reductions occurring within the first half (2020 – 2035) of this
30-year period.
• Respective capabilities. The pathways in this report are built based on
detailed bottom-up analysis of the UK’s circumstances, challenges and
opportunities. This helps inform judgements around the feasible limits for
ambitious but credible emissions reductions targets in the near-term. Our
international modelling, set out in section 2, draws out how these relate to
opportunities in other countries.
Section 2 considers whether the resulting pathways can be considered a ‘fair and
appropriate’ contribution from the UK, recognising the various accounting
complexities (Box 7.1).
Box 7.1 Accounting rules for NDCs
International accounting conventions mean that the UK NDC is expected to be set as a
percentage reduction target for the year 2030 with greenhouse gas emissions
aggregated together, using the global warming potential metric (with a time horizon of
100 years – GWP100) from the IPCC 5th Assessment Report. This represents an accounting
change from the current UK inventory basis of aggregating using GWP 100 values from the
IPCC 4th Assessment Report. The status of emissions from international aviation and
shipping (IAS) are not explicitly addressed under the Paris Agreement.
• Under the Kyoto Protocol (the agreement that committed developed countries to
emissions reductions over 2005 – 2012 with an extension to 2020), responsibility for IAS
emissions was delegated to alternative UN bodies – the International Civil Aviation
Authority (ICAO) and the International Maritime Organisation (IMO), and parties only report their IAS emissions (calculated from the use of bunker fuels) to the UNFCCC as a
memo item in national inventories that aren’t included within the all-economy total.
• The status of IAS emissions within NDC targets also remains unclear – most countries’
NDCs exclude IAS emissions, although the current EU NDC is aligned to a package to
achieve a 40% reduction in emissions (relative to 1990) including international aviation
emissions, but not including shipping emissions. The EU Commission’s recent impact assessment for its proposed 55% reduction NDC includes multiple scopes, with extra-EU
aviation and shipping emissions fully included and excluded from possible scopes for
the proposed 55% reduction.
The 2030 percentage reduction consistent with the Balanced Net Zero Pathway varies
from a 64% reduction from 1990 levels including the UK’s share of IAS emissions to a 68%
reduction when IAS emissions are excluded from the scope (Figure B7.1). Chapter 10
discusses the Committee’s recommendation on the appropriate scope for a UK NDC.
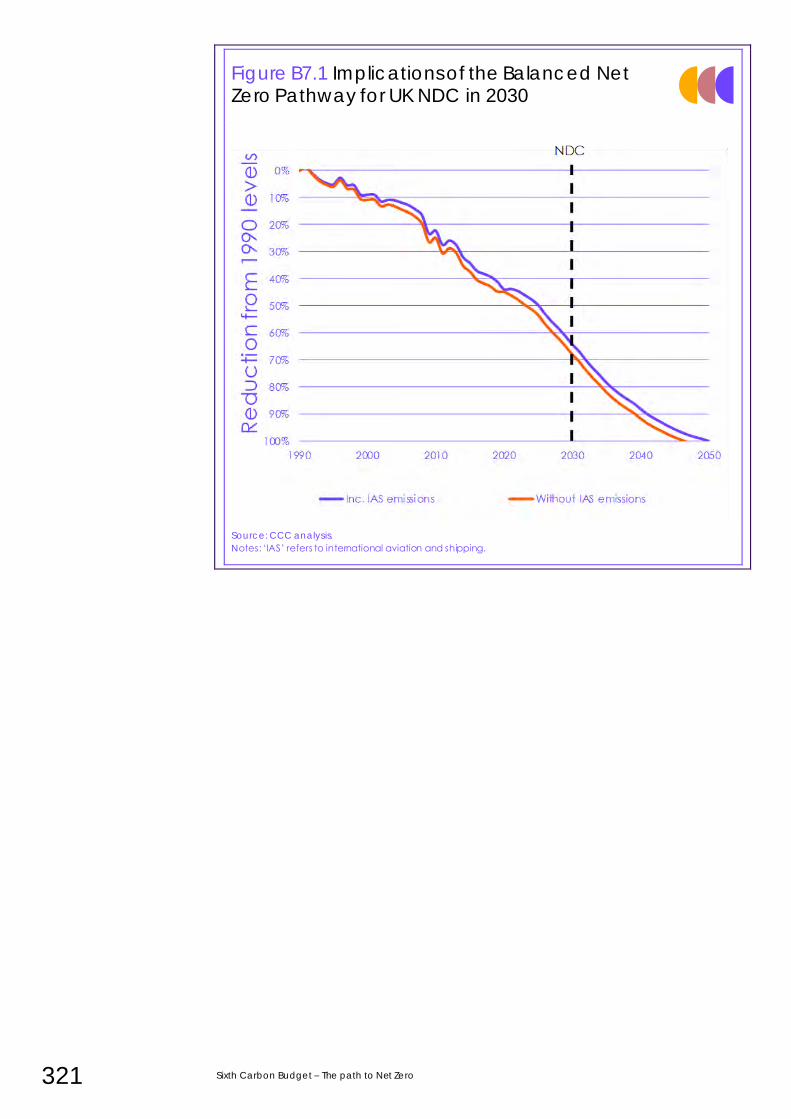
321 Sixth Carbon Budget – The path to Net Zero
Figure B7.1 Implications of the Balanced Net Zero Pathway for UK NDC in 2030
Source: CCC analysis.
Notes: ‘IAS’ refers to international aviation and shipping.
Chapter 7: The Sixth Carbon Budget as a contribution to the Paris Agreement 322
2. Is the Balanced Pathway a fair and ambitious contribution?
Under the UNFCCC, the UK is required to justify how its NDC is a ‘fair and ambitious’
contribution to achieving the goals of the Paris Agreement. This section compares
the recommended Balanced Net Zero Pathway to global pathways expected to
achieve the Paris Agreement long-term temperature goal.
In this section we set out how we interpret ‘fair and ambitious’ and compare the
Balanced Net Zero Pathway for consistency on a variety of metrics that capture
both the economy-wide emissions outcomes and actions underlying this transition.
This is outlined in three sub-sections:
a) Principles for a ‘fair and ambitious’ contribution
b) Comparing with global pathways
c) Comparing with international commitments
a) Principles for a ‘fair and ambitious’ contribution The Paris Agreement does not specify how the global goals should be translated to
national contributions beyond the principles set out in the previous section – Parties
are themselves required to judge how to balance the different principles, and to
be accountable for their contributions to domestic and global public opinion.
In this report we take a hybrid (i.e. top-down and bottom-up) and holistic (i.e.
considering all aspects of the UK’s contribution to tackling climate change)
approach to assessing a ‘fair and ambitious’ contribution from the UK to the Paris
Agreement:
• Recognising the need to go further than global averages. We recognise
that a robust result from top-down analyses is that a ‘fair’ contribution from
the UK (alongside other developed nations) is to take responsibility for
reducing emissions faster than needed from the world as whole to achieve
the Paris Agreement long-term temperature goal (Box 7.2).
• Using bottom-up modelling to test feasibility. We use our bottom-up
assessment to identify the credible limits of ‘highest possible ambition’ for
UK (domestic) reductions that are likely to support the global efforts to
rapidly reduce emissions and reach Net Zero globally. In practice, this will
mean ambitious but still credible pathways to lead the development and
deployment of actions to reduce emissions sooner than required from the
world as a whole.
• Considering all aspects of the UK’s contribution to causing and tackling climate change. We also recognise that some top-down allocation
formulas suggest more ambitious emissions reductions than the Committee
currently deems credible as the basis for legally binding targets. Therefore,
we also consider additional contributions that the UK can make to reducing
global emissions in the round to complement rapid domestic
decarbonisation. This includes contributions through actions to reduce the
UK’s overseas consumption emissions and wider international climate
policy, including climate finance, to support critical parts of the global
decarbonisation transition.
Countries are required to provide justification for how they believe their commitments are consistent with the Paris Agreement.
We consider fairness and ambition in the round incorporating top-down analyses with bottom-up modelling.
We also consider how best the UK can help reduce global emissions as fast as possible.
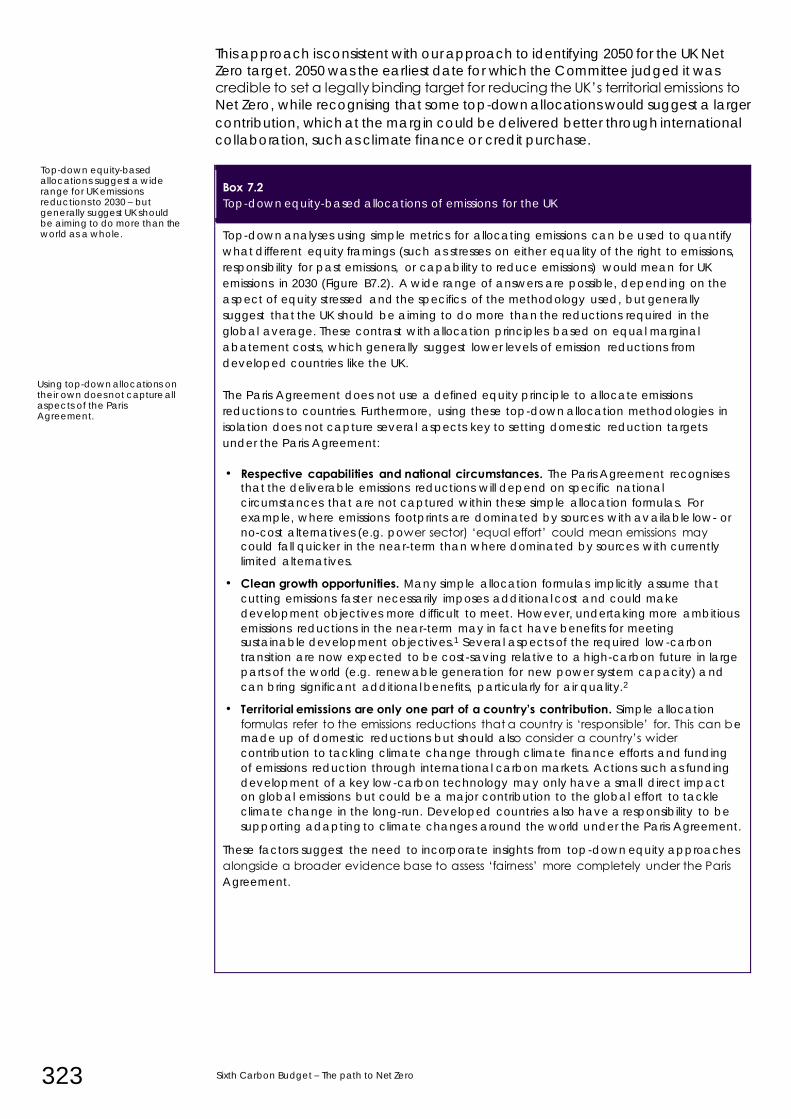
323 Sixth Carbon Budget – The path to Net Zero
This approach is consistent with our approach to identifying 2050 for the UK Net
Zero target. 2050 was the earliest date for which the Committee judged it was
credible to set a legally binding target for reducing the UK’s territorial emissions to
Net Zero, while recognising that some top-down allocations would suggest a larger
contribution, which at the margin could be delivered better through international
collaboration, such as climate finance or credit purchase.
Box 7.2 Top-down equity-based allocations of emissions for the UK
Top-down analyses using simple metrics for allocating emissions can be used to quantify
what different equity framings (such as stresses on either equality of the right to emissions,
responsibility for past emissions, or capability to reduce emissions) would mean for UK
emissions in 2030 (Figure B7.2). A wide range of answers are possible, depending on the
aspect of equity stressed and the specifics of the methodology used, but generally
suggest that the UK should be aiming to do more than the reductions required in the
global average. These contrast with allocation principles based on equal marginal
abatement costs, which generally suggest lower levels of emission reductions from
developed countries like the UK.
The Paris Agreement does not use a defined equity principle to allocate emissions
reductions to countries. Furthermore, using these top-down allocation methodologies in
isolation does not capture several aspects key to setting domestic reduction targets
under the Paris Agreement:
• Respective capabilities and national circumstances. The Paris Agreement recognises that the deliverable emissions reductions will depend on specific national
circumstances that are not captured within these simple allocation formulas. For
example, where emissions footprints are dominated by sources with av ailable low- or
no-cost alternatives (e.g. power sector) ‘equal effort’ could mean emissions may could fall quicker in the near-term than where dominated by sources with currently
limited alternatives.
• Clean growth opportunities. Many simple allocation formulas implicitly assume that
cutting emissions faster necessarily imposes additional cost and could make
development objectives more difficult to meet. However, undertaking more ambitious
emissions reductions in the near-term may in fact have benefits for meeting sustainable development objectives.1 Several aspects of the required low-carbon
transition are now expected to be cost-saving relative to a high-carbon future in large
parts of the world (e.g. renewable generation for new power system capacity) and
can bring significant additional benefits, particularly for air quality.2
• Territorial emissions are only one part of a country’s contribution. Simple allocation
formulas refer to the emissions reductions that a country is ‘responsible’ for. This can be made up of domestic reductions but should also consider a country’s wider
contribution to tackling climate change through climate finance efforts and funding
of emissions reduction through international carbon markets. Actions such as funding
development of a key low-carbon technology may only have a small direct impact on global emissions but could be a major contribution to the global effort to tackle
climate change in the long-run. Developed countries also have a responsibility to be
supporting adapting to climate changes around the world under the Paris Agreement.
These factors suggest the need to incorporate insights from top-down equity approaches
alongside a broader evidence base to assess ‘fairness’ more completely under the Paris
Agreement.
Top-down equity-based allocations suggest a wide range for UK emissions reductions to 2030 – but generally suggest UK should be aiming to do more than the world as a whole.
Using top-down allocations on their own does not capture all aspects of the Paris Agreement.
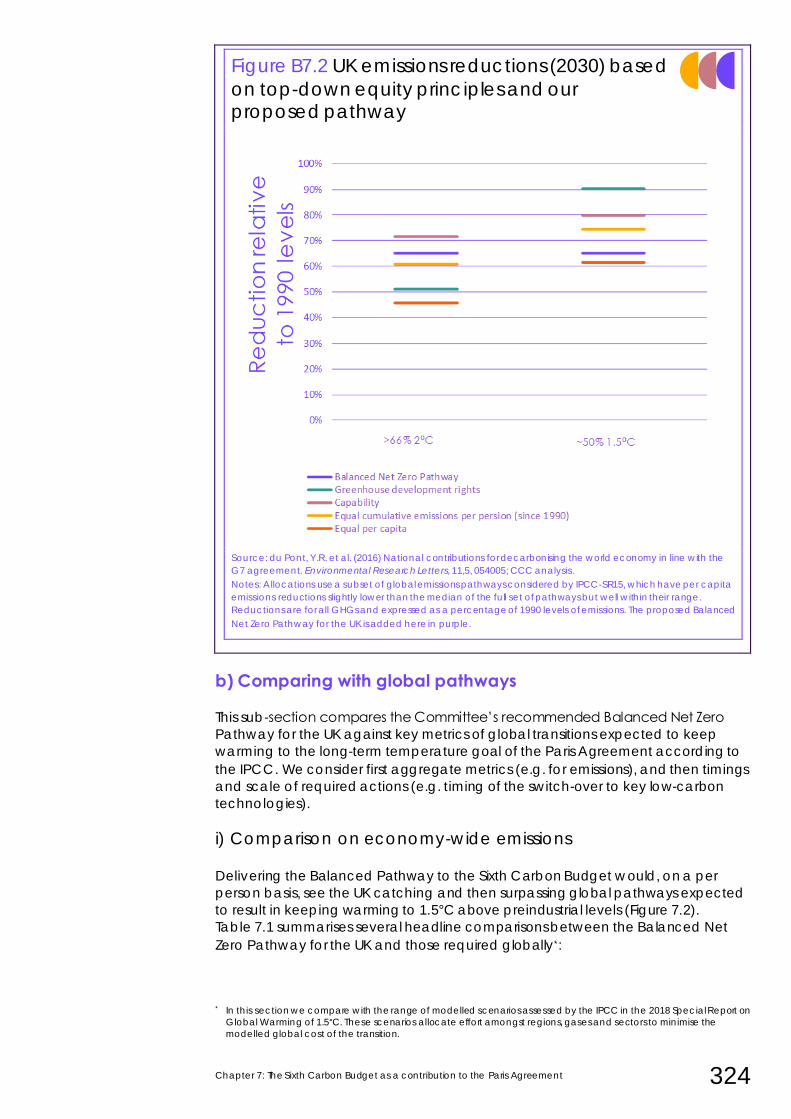
Chapter 7: The Sixth Carbon Budget as a contribution to the Paris Agreement 324
Figure B7.2 UK emissions reductions (2030) based
on top-down equity principles and our proposed pathway
Source: du Pont, Y.R. et al. (2016) National contributions for decarbonising the world economy in line with the
G7 agreement. Environmental Research Letters, 11,5, 054005; CCC analysis.
Notes: Allocations use a subset of global emissions pathways considered by IPCC-SR15, which have per capita
emissions reductions slightly lower than the median of the full set of pathways but well within their range.
Reductions are for all GHGs and expressed as a percentage of 1990 levels of emissions. The proposed Balanced
Net Zero Pathway for the UK is added here in purple.
b) Comparing with global pathways
This sub-section compares the Committee’s recommended Balanced Net Zero
Pathway for the UK against key metrics of global transitions expected to keep
warming to the long-term temperature goal of the Paris Agreement according to
the IPCC. We consider first aggregate metrics (e.g. for emissions), and then timings
and scale of required actions (e.g. timing of the switch-over to key low-carbon
technologies).
i) Comparison on economy-wide emissions
Delivering the Balanced Pathway to the Sixth Carbon Budget would, on a per
person basis, see the UK catching and then surpassing global pathways expected
to result in keeping warming to 1.5°C above preindustrial levels (Figure 7.2).
Table 7.1 summarises several headline comparisons between the Balanced Net
Zero Pathway for the UK and those required globally*:
* In this section we compare with the range of modelled scenarios assessed by the IPCC in the 2018 Special Report on
Global Warming of 1.5°C. These scenarios allocate effort amongst regions, gases and sectors to minimise the
modelled global cost of the transition.
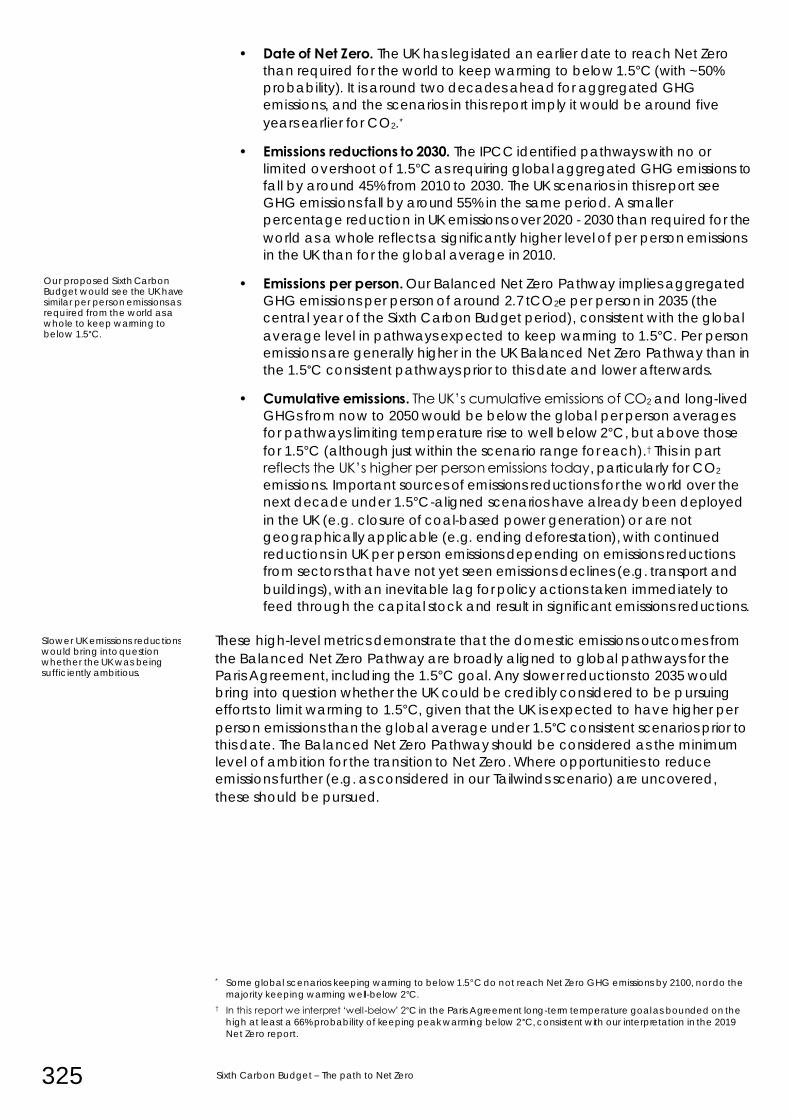
325 Sixth Carbon Budget – The path to Net Zero
• Date of Net Zero. The UK has legislated an earlier date to reach Net Zero
than required for the world to keep warming to below 1.5°C (with ~50%
probability). It is around two decades ahead for aggregated GHG
emissions, and the scenarios in this report imply it would be around five
years earlier for CO2.*
• Emissions reductions to 2030. The IPCC identified pathways with no or
limited overshoot of 1.5°C as requiring global aggregated GHG emissions to
fall by around 45% from 2010 to 2030. The UK scenarios in this report see
GHG emissions fall by around 55% in the same period. A smaller
percentage reduction in UK emissions over 2020 - 2030 than required for the
world as a whole reflects a significantly higher level of per person emissions
in the UK than for the global average in 2010.
• Emissions per person. Our Balanced Net Zero Pathway implies aggregated
GHG emissions per person of around 2.7 tCO2e per person in 2035 (the
central year of the Sixth Carbon Budget period), consistent with the global
average level in pathways expected to keep warming to 1.5°C. Per person
emissions are generally higher in the UK Balanced Net Zero Pathway than in
the 1.5°C consistent pathways prior to this date and lower afterwards.
• Cumulative emissions. The UK’s cumulative emissions of CO2 and long-lived
GHGs from now to 2050 would be below the global per person averages
for pathways limiting temperature rise to well below 2°C, but above those
for 1.5°C (although just within the scenario range for each).† This in part
reflects the UK’s higher per person emissions today, particularly for CO2
emissions. Important sources of emissions reductions for the world over the
next decade under 1.5°C-aligned scenarios have already been deployed
in the UK (e.g. closure of coal-based power generation) or are not
geographically applicable (e.g. ending deforestation), with continued
reductions in UK per person emissions depending on emissions reductions
from sectors that have not yet seen emissions declines (e.g. transport and
buildings), with an inevitable lag for policy actions taken immediately to
feed through the capital stock and result in significant emissions reductions.
These high-level metrics demonstrate that the domestic emissions outcomes from
the Balanced Net Zero Pathway are broadly aligned to global pathways for the
Paris Agreement, including the 1.5°C goal. Any slower reductions to 2035 would
bring into question whether the UK could be credibly considered to be pursuing
efforts to limit warming to 1.5°C, given that the UK is expected to have higher per
person emissions than the global average under 1.5°C consistent scenarios prior to
this date. The Balanced Net Zero Pathway should be considered as the minimum
level of ambition for the transition to Net Zero. Where opportunities to reduce
emissions further (e.g. as considered in our Tailwinds scenario) are uncovered,
these should be pursued.
* Some global scenarios keeping warming to below 1.5°C do not reach Net Zero GHG emissions by 2100, nor do the
majority keeping warming well-below 2°C.
† In this report we interpret ‘well-below’ 2°C in the Paris Agreement long-term temperature goal as bounded on the
high at least a 66% probability of keeping peak warming below 2°C, consistent with our interpretation in the 2019
Net Zero report.
Our proposed Sixth Carbon Budget would see the UK have similar per person emissions as required from the world as a whole to keep warming to below 1.5°C.
Slower UK emissions reductions would bring into question whether the UK was being sufficiently ambitious.
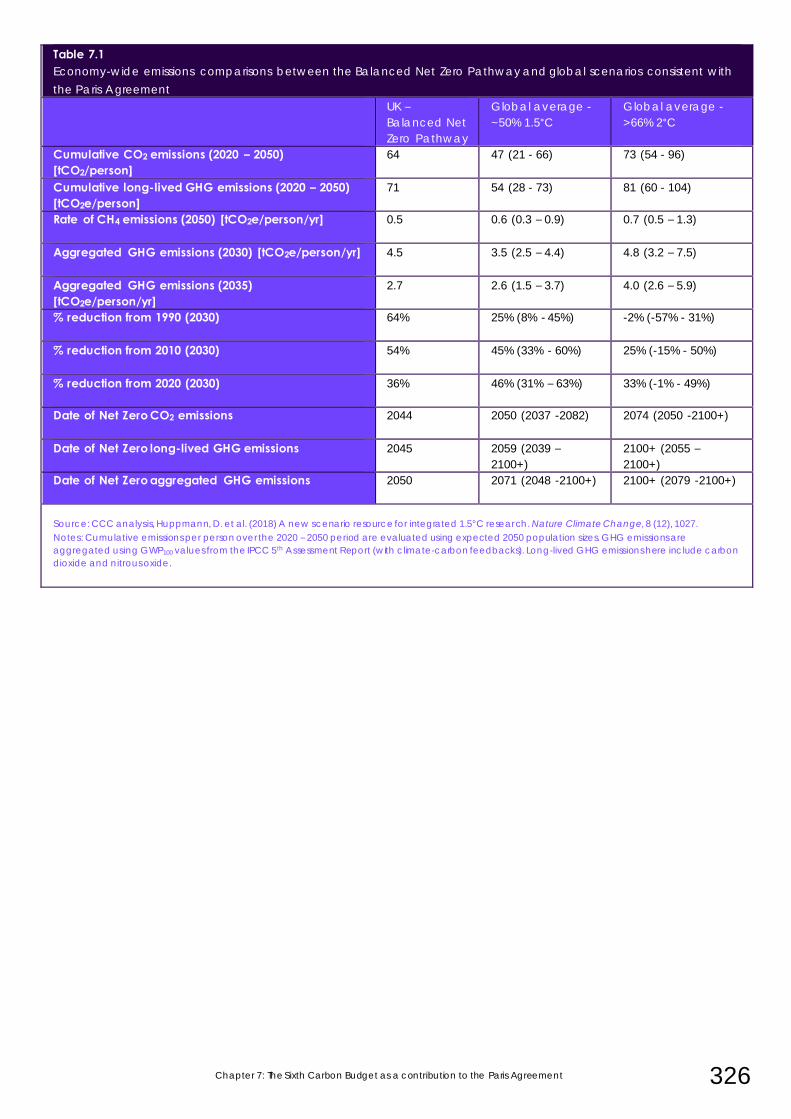
Chapter 7: The Sixth Carbon Budget as a contribution to the Paris Agreement 326
Table 7.1 Economy-wide emissions comparisons between the Balanced Net Zero Pathway and global scenarios consistent with
the Paris Agreement
UK –
Balanced Net
Zero Pathway
Global average -
~50% 1.5°C
Global average -
>66% 2°C
Cumulative CO2 emissions (2020 – 2050) [tCO2/person]
64 47 (21 - 66) 73 (54 - 96)
Cumulative long-lived GHG emissions (2020 – 2050) [tCO2e/person]
71 54 (28 - 73) 81 (60 - 104)
Rate of CH4 emissions (2050) [tCO2e/person/yr]
0.5 0.6 (0.3 – 0.9) 0.7 (0.5 – 1.3)
Aggregated GHG emissions (2030) [tCO2e/person/yr]
4.5 3.5 (2.5 – 4.4) 4.8 (3.2 – 7.5)
Aggregated GHG emissions (2035) [tCO2e/person/yr]
2.7 2.6 (1.5 – 3.7) 4.0 (2.6 – 5.9)
% reduction from 1990 (2030)
64% 25% (8% - 45%) -2% (-57% - 31%)
% reduction from 2010 (2030)
54% 45% (33% - 60%) 25% (-15% - 50%)
% reduction from 2020 (2030)
36% 46% (31% – 63%) 33% (-1% - 49%)
Date of Net Zero CO2 emissions
2044 2050 (2037 -2082) 2074 (2050 -2100+)
Date of Net Zero long-lived GHG emissions 2045 2059 (2039 –
2100+)
2100+ (2055 –
2100+)
Date of Net Zero aggregated GHG emissions
2050 2071 (2048 -2100+) 2100+ (2079 -2100+)
Source: CCC analysis, Huppmann, D. et al. (2018) A new scenario resource for integrated 1.5°C research. Nature Climate Change, 8 (12), 1027.
Notes: Cumulative emissions per person over the 2020 – 2050 period are evaluated using expected 2050 population sizes. GHG emissions are
aggregated using GWP100 values from the IPCC 5th Assessment Report (with climate-carbon feedbacks). Long-lived GHG emissions here include carbon
dioxide and nitrous oxide.
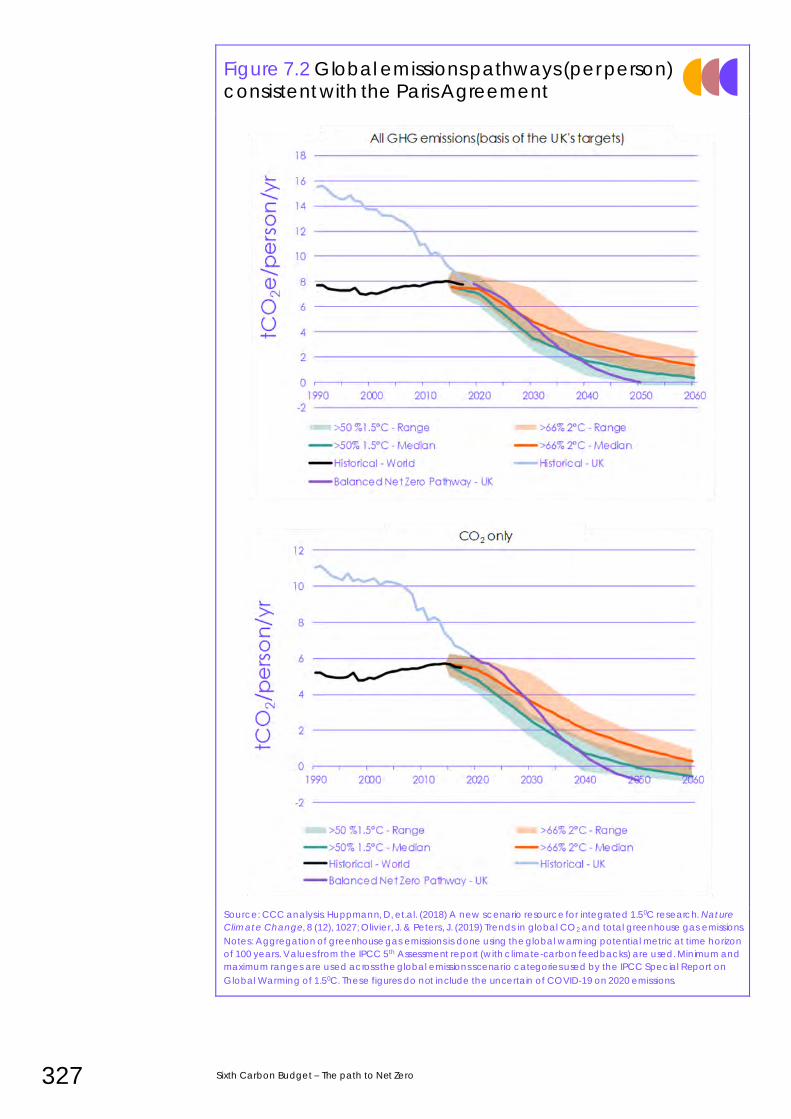
327 Sixth Carbon Budget – The path to Net Zero
Figure 7.2 Global emissions pathways (per person) consistent with the Paris Agreement
Source: CCC analysis. Huppmann, D, et.al. (2018) A new scenario resource for integrated 1.50C research. Nature
Climate Change, 8 (12), 1027; Olivier, J. & Peters, J. (2019) Trends in global CO2 and total greenhouse gas emissions.
Notes: Aggregation of greenhouse gas emissions is done using the global warming potential metric at time horizon
of 100 years. Values from the IPCC 5th Assessment report (with climate-carbon feedbacks) are used. Minimum and
maximum ranges are used across the global emissions scenario categories used by the IPCC Special Report on
Global Warming of 1.50C. These figures do not include the uncertain of COVID-19 on 2020 emissions.
Chapter 7: The Sixth Carbon Budget as a contribution to the Paris Agreement 328
ii) Comparison on deployment rates
The Balanced Net Zero Pathway would see the UK taking actions earlier than
required for the global average in pathways expected to keep warming to below
1.5°C (Table 7.2).
• Power sector: Power sector decarbonisation under the Balanced Net Zero
Pathway would be well advanced by 2030 with renewable sources the
cheapest form of new power generation in the UK. This would keep the UK
ahead of a global transition aligned to 1.5°C on all power sector metrics.
• Decarbonising household heating and transport: Decarbonisation options in
these sectors are now starting to be available at scale with low or no
additional cost. The UK has high per person emissions in these sectors
compared to the global average highlighting the importance of the UK
pushing ahead with deploying low-carbon options more rapidly.
– Close to half of the UK fleet of passenger vehicles could be electric
(both battery and plug-in hybrid) by 2030, considerably more than in
the global average and consistent with that expected from
developed regions such as the EU (40-55%) as part of the global
scenarios.
– UK heat pump installations would reach over one million a year by
2030 under the Balanced Pathway. This would be 1.7% of the global
total installations consistent with a scenario keeping warming ‘well-
below’ 2°C and 1.4% for a scenario expected to keep warming to
1.5°C.
• Deeper decarbonisation options: The Balanced Net Zero Pathway would
see the UK deploy deeper decarbonisation options (e.g. carbon capture
and storage (CCS), low-carbon hydrogen, and engineered greenhouse
gas removals) at-scale ahead of the global average. These aspects of the
decarbonisation challenge currently continue to have some costs relative
to high carbon alternatives but are expected to be significant for the
global effort to keep to the Paris Agreement, particularly after 2030 (section
3).
Moving ahead of the global average in the deployment of these options does not
mean that this imposes an additional burden on the UK. Our analysis throughout
this report suggests that many aspects of this transition will be cost saving and have
additional co-benefits associated with them. The overall impact on UK GDP could
be very limited or an overall boost to the UK economy (Chapter 5).
Our Balanced Pathway would see the UK decarbonising its economy more rapidly than for the world in 1.5°C scenarios.
Progress in developing and deploying deeper decarbonisation options in the UK could be a critical contribution to achieving the Paris Agreement.
Moving faster than the world as whole does not mean this would be a burden on the UK.
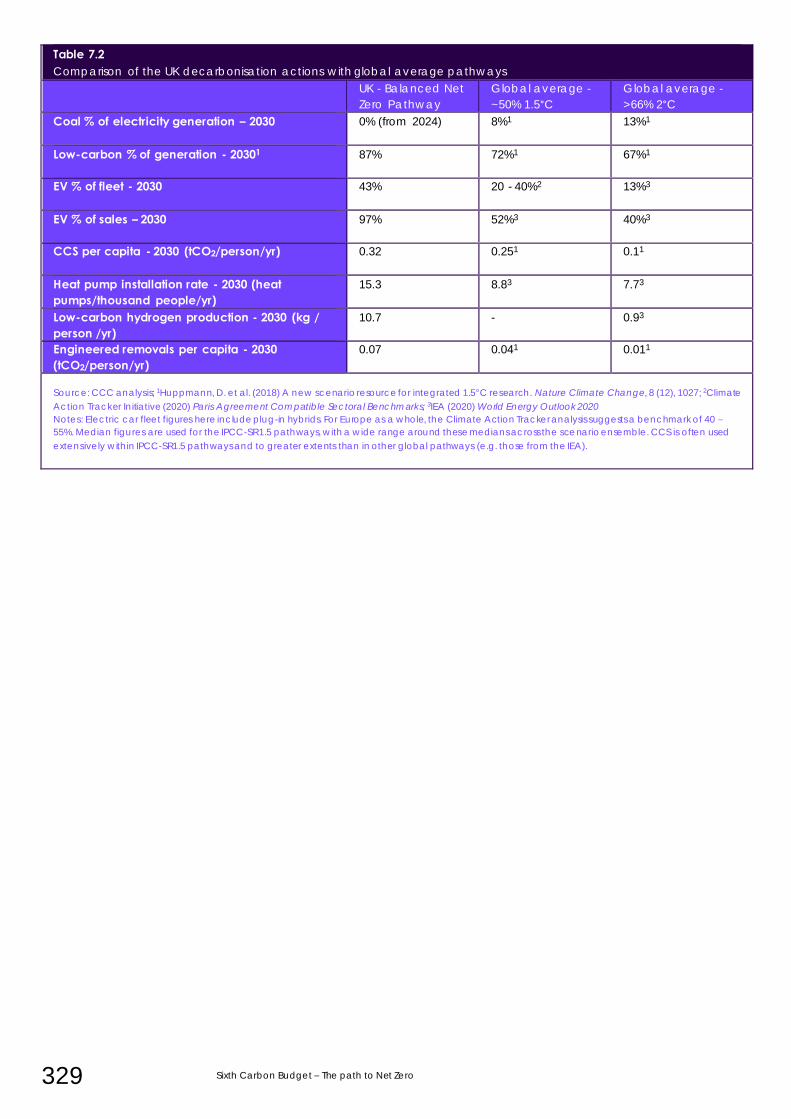
329 Sixth Carbon Budget – The path to Net Zero
Table 7.2 Comparison of the UK decarbonisation actions with global average pathways
UK - Balanced Net
Zero Pathway
Global average -
~50% 1.5°C
Global average -
>66% 2°C
Coal % of electricity generation – 2030
0% (from 2024) 8%1 13%1
Low-carbon % of generation - 20301
87% 72%1 67%1
EV % of fleet - 2030
43% 20 - 40%2 13%3
EV % of sales – 2030
97% 52%3 40%3
CCS per capita - 2030 (tCO2/person/yr)
0.32 0.251 0.11
Heat pump installation rate - 2030 (heat pumps/thousand people/yr)
15.3 8.83 7.73
Low-carbon hydrogen production - 2030 (kg / person /yr)
10.7 - 0.93
Engineered removals per capita - 2030 (tCO2/person/yr)
0.07 0.041 0.011
Source: CCC analysis; 1Huppmann, D. et al. (2018) A new scenario resource for integrated 1.5°C research. Nature Climate Change, 8 (12), 1027; 2Climate
Action Tracker Initiative (2020) Paris Agreement Compatible Sectoral Benchmarks; 3IEA (2020) World Energy Outlook 2020
Notes: Electric car fleet figures here include plug-in hybrids. For Europe as a whole, the Climate Action Tracker analysis suggests a benchmark of 40 –
55%. Median figures are used for the IPCC-SR1.5 pathways, with a wide range around these medians across the scenario ensemble. CCS is often used
extensively within IPCC-SR1.5 pathways and to greater extents than in other global pathways (e.g. those from the IEA).
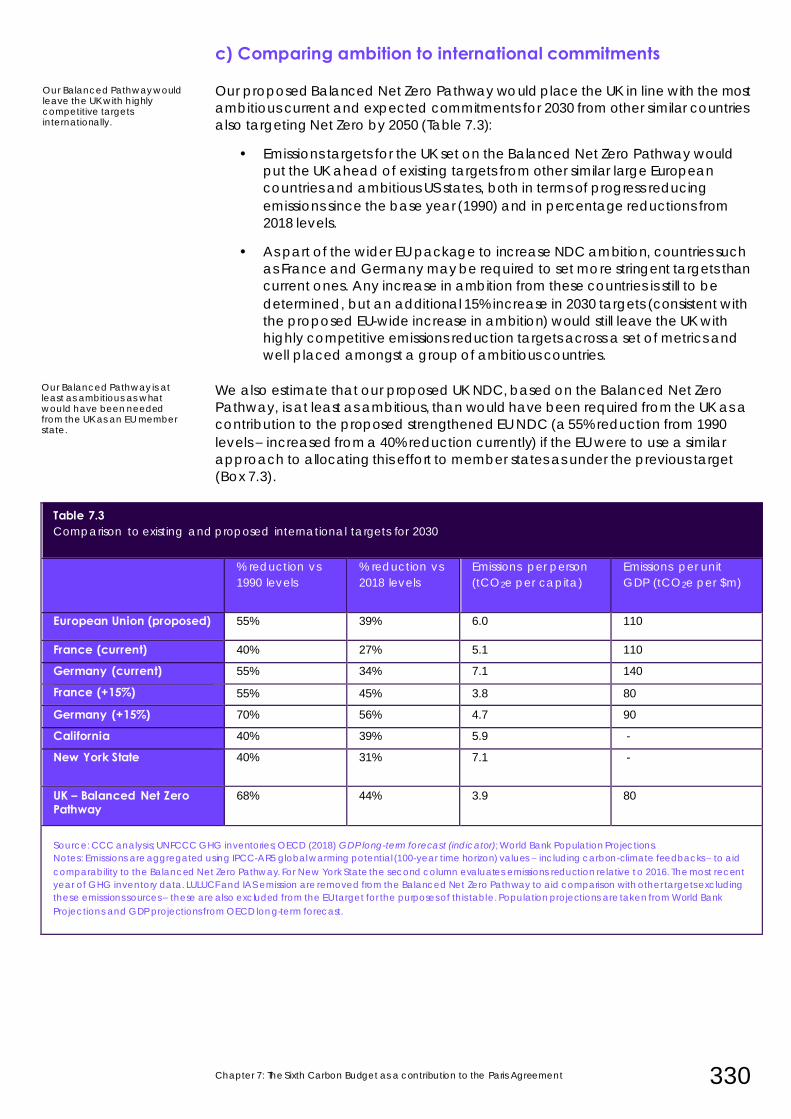
Chapter 7: The Sixth Carbon Budget as a contribution to the Paris Agreement 330
c) Comparing ambition to international commitments
Our proposed Balanced Net Zero Pathway would place the UK in line with the most
ambitious current and expected commitments for 2030 from other similar countries
also targeting Net Zero by 2050 (Table 7.3):
• Emissions targets for the UK set on the Balanced Net Zero Pathway would
put the UK ahead of existing targets from other similar large European
countries and ambitious US states, both in terms of progress reducing
emissions since the base year (1990) and in percentage reductions from
2018 levels.
• As part of the wider EU package to increase NDC ambition, countries such
as France and Germany may be required to set more stringent targets than
current ones. Any increase in ambition from these countries is still to be
determined, but an additional 15% increase in 2030 targets (consistent with
the proposed EU-wide increase in ambition) would still leave the UK with
highly competitive emissions reduction targets across a set of metrics and
well placed amongst a group of ambitious countries.
We also estimate that our proposed UK NDC, based on the Balanced Net Zero
Pathway, is at least as ambitious, than would have been required from the UK as a
contribution to the proposed strengthened EU NDC (a 55% reduction from 1990
levels – increased from a 40% reduction currently) if the EU were to use a similar
approach to allocating this effort to member states as under the previous target
(Box 7.3).
Table 7.3 Comparison to existing and proposed international targets for 2030
What would have % reduction vs
1990 levels
% reduction vs
2018 levels
Emissions per person
(tCO2e per capita)
Emissions per unit
GDP (tCO2e per $m)
European Union (proposed) 55% 39% 6.0 110
France (current) 40% 27% 5.1 110
Germany (current) 55% 34% 7.1 140
France (+15%) 55% 45% 3.8 80
Germany (+15%) 70% 56% 4.7 90
California 40% 39% 5.9 -
New York State 40% 31% 7.1 -
UK – Balanced Net Zero Pathway
68% 44% 3.9 80
Source: CCC analysis; UNFCCC GHG inventories; OECD (2018) GDP long-term forecast (indicator); World Bank Population Projections.
Notes: Emissions are aggregated using IPCC-AR5 global warming potential (100-year time horizon) values – including carbon-climate feedbacks – to aid
comparability to the Balanced Net Zero Pathway. For New York State the second column evaluates emissions reduction relative to 2016. The most recent
year of GHG inventory data. LULUCF and IAS emission are removed from the Balanced Net Zero Pathway to aid comparison with other targets excluding
these emissions sources – these are also excluded from the EU target for the purposes of this table. Population projections are taken from World Bank
Projections and GDP projections from OECD long-term forecast.
Our Balanced Pathway is at least as ambitious as what would have been needed from the UK as an EU member state.
Our Balanced Pathway would leave the UK with highly competitive targets internationally.
331 Sixth Carbon Budget – The path to Net Zero
Box 7.3: What would have been the UK’s share of the EU 55% reduction target?
The European Commission has recently proposed to update the EU’s NDC for 2030 to a
55% reduction relative to 1990 levels, from the current 40% reduction.* This now needs to
be agreed amongst the member states at the European Council, and then new targets
for the EU Emissions Trading System (EU-ETS) and individual member states in the non-ETS
and LULUCF sectors agreed to achieve it. Based on the previous methodology for the
2030 target it is possible to estimate what might have been the UK’s share if it was still an
EU member state:
• ETS sectors are expected to have to decline by between 58-65% in modelling to achieve the EU wide goals.3 Assuming a similar UK share of the ETS cap as in the advice on the Fifth Carbon Budget then UK ‘traded sector’ emissions would have to fall to between 80 - 91 MtCO2e/yr by 2030.
• Non-ETS sectors have been allocated to member states in the past based on relative differences in average GDP per person. For the proposed 55% EU reduction the member state allocations are yet to be determined, but allocation based on a similar methodology to the current 2030 target would suggest a UK reduction in the region of 53 - 62% below 2005 levels, depending on the range of possible contributions from non-
ETS sectors to the overall target. A more complex allocation mechanism may be required for the non-ETS sectors for the strengthened 2030 target to effectively capture differences in cost effective abatement options between member states in non-ETS sectors.
• Land-use, land-use change and forestry (LULUCF) emissions have only been included within the current EU 2030 package based on a ‘no-debt’ rule to date. The EU Commission has now proposed to include fully LULUCF within the accounting for the revised 55% target.
Overall, we estimate that the UK’s share would have been around a 65 - 69% reduction,
excluding emissions from international aviation and shipping (but including LULUCF
emissions) if it was still an EU member state.
While the Balanced Pathway requires the UK to go further and faster in the low-
carbon transition, it is not out of step with the pace and scale of change expected
in other comparable economies considering their own pathways to Net Zero by
2050.
• Phase out of the sale of high-carbon assets. Ending petrol and diesel car
sales by the mid-2030s has been committed to by many Governments.
Many European countries have committed to this by 2030, including
Denmark, Ireland, the Netherlands and now the UK, with Norway having
the most ambitious date of 2025.4 California has made a recent
commitment to achieve this by 2035. European countries are also starting
to propose the phase outs of fossil fuel heating systems. The Netherlands is
developing legislation to ensure new homes are no longer connected to
the gas grid ahead of the 2025 phase out date shared by Ireland’s and the
UK’s current Future Homes Standard.
• Scale up deployment of low-carbon technology. Other countries are also
planning for high penetration of renewable electricity generation by 2030.
Germany is expected to achieve a 65% renewable share, similar to the UK
under the Balanced Net Zero Pathway, with higher shares anticipated in
other European countries such as Spain (74%) and the Netherlands (70%).5
Proposals for deeper decarbonisation in other countries are also being
developed.
* Several scopes for this target have been proposed in the Commissions impact assessment including with and without
emissions from international aviation and navigation (shipping).
Other countries are also making or considering similarly ambitious actions to deliver their own decarbonisation targets.
Chapter 7: The Sixth Carbon Budget as a contribution to the Paris Agreement 332
By 2030, significant electrolyser capacity (for hydrogen production) is being
planned for in both France and Germany (5 GW and 6.5 GW respectively)
and the European Commission has recently released a new hydrogen
strategy aiming to reach 40 GW of electrolyser capacity across the EU.6
Norway has committed to developing a full-scale carbon capture and
storage supply chain with capacity of up to 5 MtCO2 per year, which would
be just under half of what the UK would be expected to deliver under the
Balanced Net Zero Pathway by 2030.
The Balanced Net Zero Pathway, and an NDC based on it, would leave the UK
well-placed to support raising international ambition as the host of COP26 and
President of the G7. The UK would not be doing this alone. Other countries and
regions are committing to similarly ambitious transitions over the next decade,
highlighting the growing international momentum behind delivering the scale and
speed of transition outlined in our scenarios. Adopting lower ambition for 2030
would limit the UK’s ability to credibly call for the raising of ambition to the level
required globally, and risk being left behind by similar economies, missing out on
the clean growth opportunities that the transition is expected to bring.
Ambition at the level of our Balanced Pathway will be necessary for the UK to support the global effort as host of the international negotiations in 2021.
333 Sixth Carbon Budget – The path to Net Zero
3. Supporting global efforts to reduce emissions
In this section we look at what would be needed from the rest of the world to
deliver on the overall ambition of the Paris Agreement and how the UK can
support this. If other developed countries adopted pathways with similar ambition
and developing countries followed rapidly soon after, then the global temperature
rise can be limited to well below 2°C. Achieving a 1.5°C temperature goal will likely
need maximum ambition in every sector and every region. It will be important that
large emerging economies with most capability contribute significant ambition.
The proposed UK ambition within the Balanced Net Zero Pathway should
encourage this and will be expected of the UK with its role as COP26 President.
There are two subsections:
a) A global pathway to deliver on the Paris Agreement
b) UK action to support the global effort
a) A global pathway to deliver on the Paris Agreement
This subsection lays out the key aspects of the global transition to achieve the Paris
Agreement. There are three parts to it:
i) Introducing ‘leadership’ to Paris-aligned global pathways
ii) Key elements of the global decarbonisation transition
iii) Additional efforts for pursuing 1.5°C
i) Introducing ‘leadership’ to Paris-aligned global pathways
Most pathways of a global transition expected to be consistent with the Paris
Agreement use a cost-effective framework, meaning that modelled cost is the
only factor used to allocate emissions reductions across regions, sectors and gases.
We developed the concept of ‘leadership-driven’ pathways within our advice on
setting a Net Zero target for the UK in 2019, which aim to build-in aspects of other
important factors (e.g. obligations for developed country leadership) into the
scenario. We commissioned Vivid Economics and UCL to further develop this
framework for this report.7 These scenarios contained three groups of regions,
broadly aligned to the principles of the Paris Agreement (Figure 7.3):
• Developed regions take the lead in deploying the solutions that are
necessary to reduce emissions globally and reach Net Zero emissions first. In
accordance with many emerging commitments, these regions achieve or
go beyond Net Zero CO2 emissions by 2050. Near-term emissions reductions
are made consistent with achieving these 2050 objectives and keeping
warming to the Paris Agreement long-term temperature goal.
• Large industrial economies, which includes China, represent a large
fraction of future cumulative CO2 emissions and will be very important for
the future global emissions trajectory. Keeping warming to the long-term
temperature goal of the Paris Agreement requires that they peak their
emissions very soon (significantly improving on their current NDCs) and
reduce them rapidly in the next two decades to reach Net Zero CO2
emissions around 2050 - 2070.
We consider what needs to happen globally to achieve the Paris Agreement to identify how the UK can support this.
We build in aspects of leadership from developed countries into our modelled pathways of the global effort.
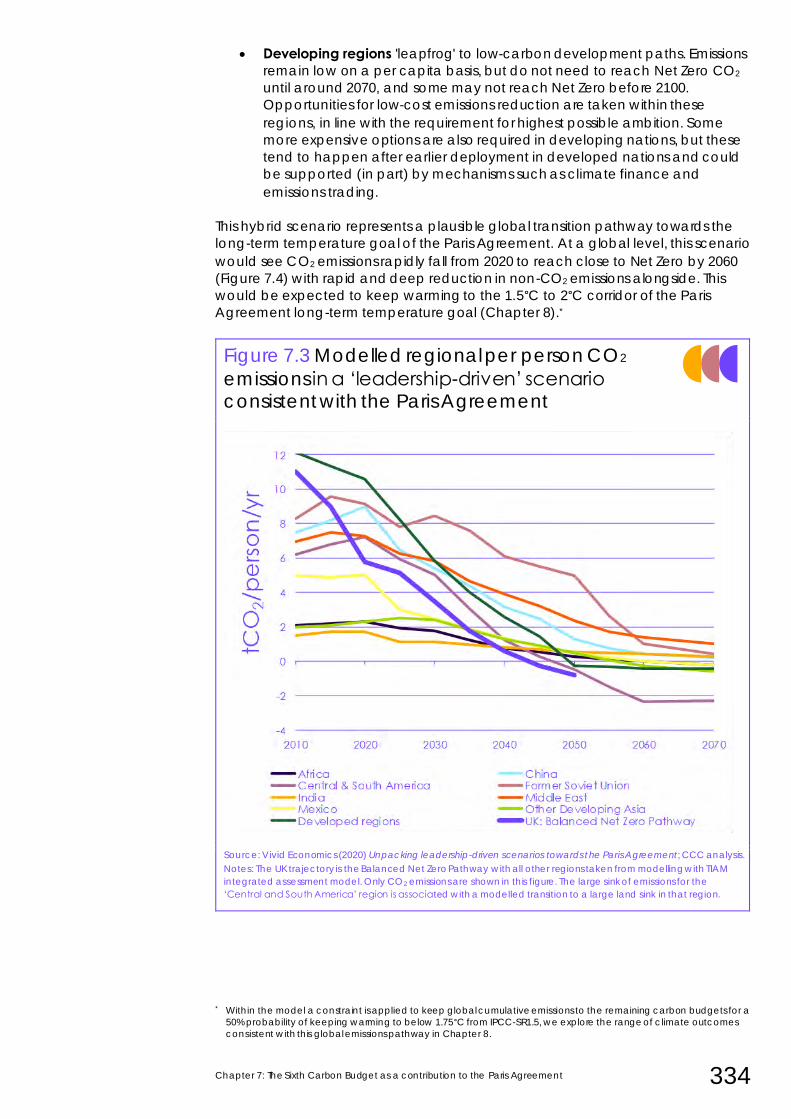
Chapter 7: The Sixth Carbon Budget as a contribution to the Paris Agreement 334
• Developing regions 'leapfrog' to low-carbon development paths. Emissions
remain low on a per capita basis, but do not need to reach Net Zero CO2
until around 2070, and some may not reach Net Zero before 2100.
Opportunities for low-cost emissions reduction are taken within these
regions, in line with the requirement for highest possible ambition. Some
more expensive options are also required in developing nations, but these
tend to happen after earlier deployment in developed nations and could
be supported (in part) by mechanisms such as climate finance and
emissions trading.
This hybrid scenario represents a plausible global transition pathway towards the
long-term temperature goal of the Paris Agreement. At a global level, this scenario
would see CO2 emissions rapidly fall from 2020 to reach close to Net Zero by 2060
(Figure 7.4) with rapid and deep reduction in non-CO2 emissions alongside. This
would be expected to keep warming to the 1.5°C to 2°C corridor of the Paris
Agreement long-term temperature goal (Chapter 8).*
Figure 7.3 Modelled regional per person CO2
emissions in a ‘leadership-driven’ scenario consistent with the Paris Agreement
Source: Vivid Economics (2020) Unpacking leadership-driven scenarios towards the Paris Agreement; CCC analysis.
Notes: The UK trajectory is the Balanced Net Zero Pathway with all other regions taken from modelling with TIAM
integrated assessment model. Only CO2 emissions are shown in this figure. The large sink of emissions for the
‘Central and South America’ region is associated with a modelled transition to a large land sink in that region.
* Within the model a constraint is applied to keep global cumulative emissions to the remaining carbon budgets for a
50% probability of keeping warming to below 1.75°C from IPCC-SR1.5, we explore the range of climate outcomes
consistent with this global emissions pathway in Chapter 8.
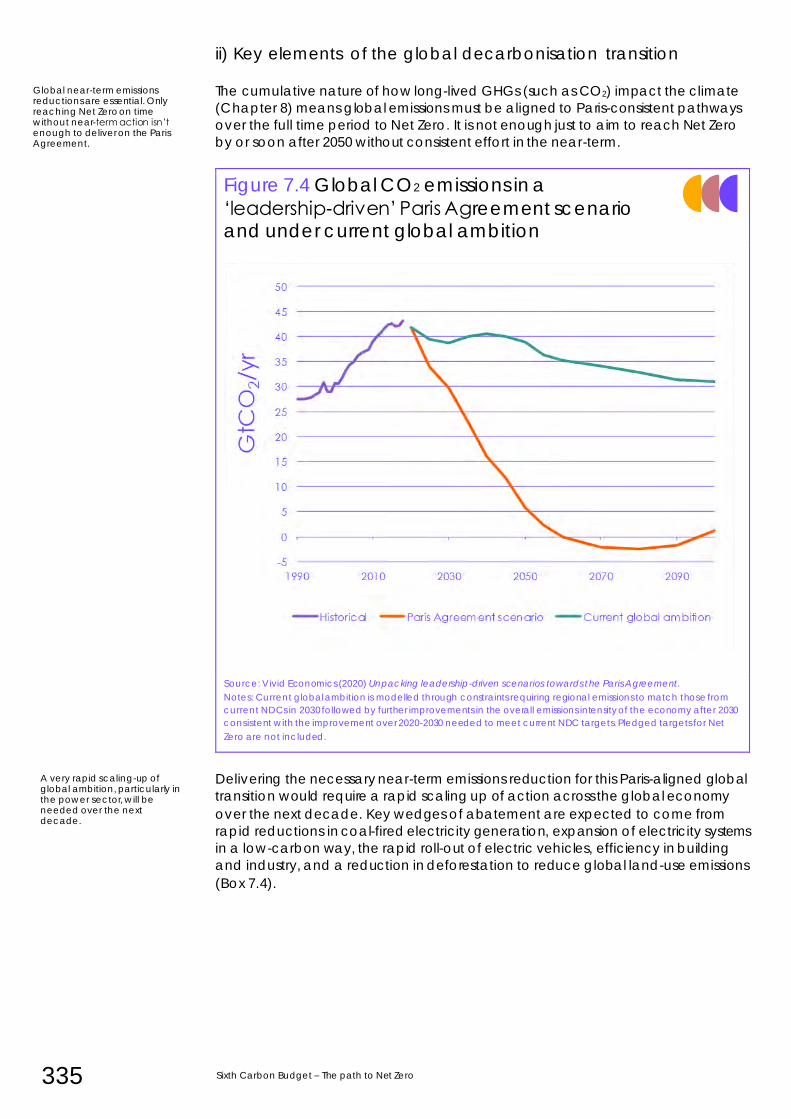
335 Sixth Carbon Budget – The path to Net Zero
ii) Key elements of the global decarbonisation transition
The cumulative nature of how long-lived GHGs (such as CO2) impact the climate
(Chapter 8) means global emissions must be aligned to Paris-consistent pathways
over the full time period to Net Zero. It is not enough just to aim to reach Net Zero
by or soon after 2050 without consistent effort in the near-term.
Figure 7.4 Global CO2 emissions in a
‘leadership-driven’ Paris Agreement scenario and under current global ambition
Source: Vivid Economics (2020) Unpacking leadership-driven scenarios towards the Paris Agreement.
Notes: Current global ambition is modelled through constraints requiring regional emissions to match those from
current NDCs in 2030 followed by further improvements in the overall emissions intensity of the economy after 2030
consistent with the improvement over 2020-2030 needed to meet current NDC targets. Pledged targets for Net
Zero are not included.
Delivering the necessary near-term emissions reduction for this Paris-aligned global
transition would require a rapid scaling up of action across the global economy
over the next decade. Key wedges of abatement are expected to come from
rapid reductions in coal-fired electricity generation, expansion of electricity systems
in a low-carbon way, the rapid roll-out of electric vehicles, efficiency in building
and industry, and a reduction in deforestation to reduce global land-use emissions
(Box 7.4).
Global near-term emissions reductions are essential. Only reaching Net Zero on time without near-term action isn’t enough to deliver on the Paris Agreement.
A very rapid scaling-up of global ambition, particularly in the power sector, will be needed over the next decade.
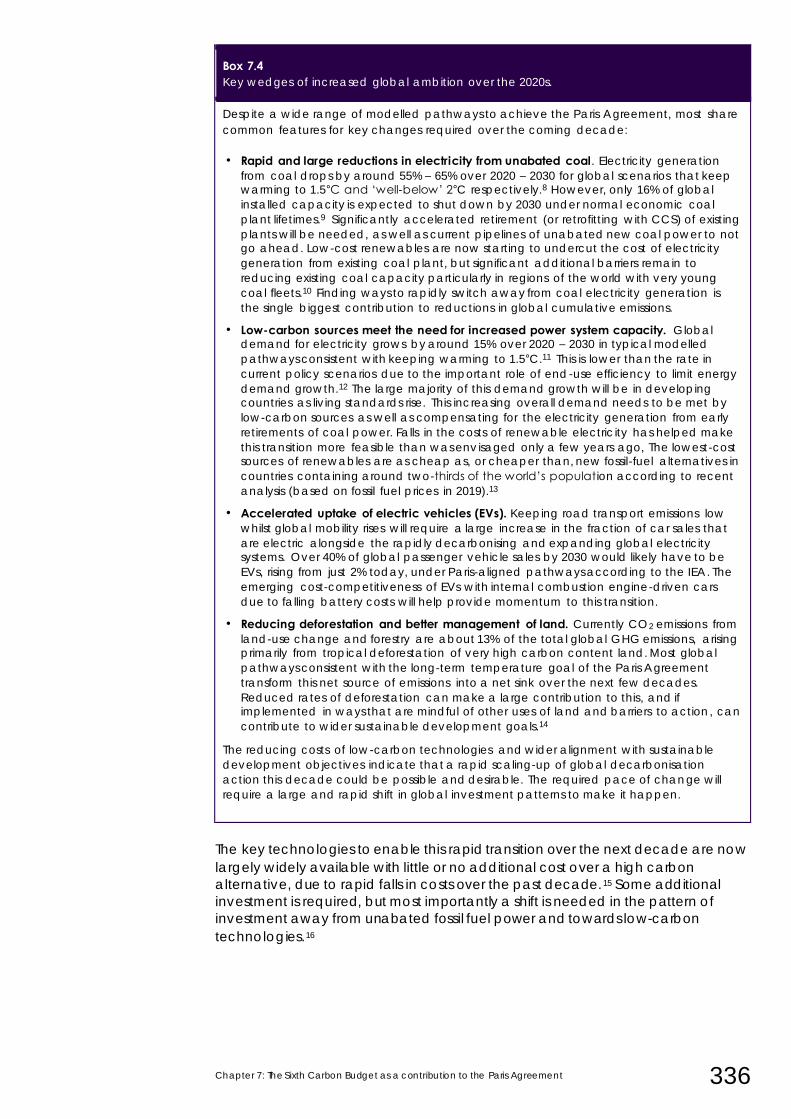
Chapter 7: The Sixth Carbon Budget as a contribution to the Paris Agreement 336
Box 7.4 Key wedges of increased global ambition over the 2020s.
Despite a wide range of modelled pathways to achieve the Paris Agreement, most share
common features for key changes required over the coming decade:
• Rapid and large reductions in electricity from unabated coal. Electricity generation
from coal drops by around 55% – 65% over 2020 – 2030 for global scenarios that keep warming to 1.5°C and ‘well-below’ 2°C respectively.8 However, only 16% of global
installed capacity is expected to shut down by 2030 under normal economic coal
plant lifetimes.9 Significantly accelerated retirement (or retrofitting with CCS) of existing
plants will be needed, as well as current pipelines of unabated new coal power to not go ahead. Low-cost renewables are now starting to undercut the cost of electricity
generation from existing coal plant, but significant additional barriers remain to
reducing existing coal capacity particularly in regions of the world with very young
coal fleets.10 Finding ways to rapidly switch away from coal electricity generation is
the single biggest contribution to reductions in global cumulative emissions.
• Low-carbon sources meet the need for increased power system capacity. Global demand for electricity grows by around 15% over 2020 – 2030 in typical modelled
pathways consistent with keeping warming to 1.5°C.11 This is lower than the rate in
current policy scenarios due to the important role of end-use efficiency to limit energy
demand growth.12 The large majority of this demand growth will be in developing countries as living standards rise. This increasing overall demand needs to be met by
low-carbon sources as well as compensating for the electricity generation from early
retirements of coal power. Falls in the costs of renewable electricity has helped make
this transition more feasible than was env isaged only a few years ago, The lowest-cost sources of renewables are as cheap as, or cheaper than, new fossil-fuel alternatives in
countries containing around two-thirds of the world’s population according to recent
analysis (based on fossil fuel prices in 2019).13
• Accelerated uptake of electric vehicles (EVs). Keeping road transport emissions low
whilst global mobility rises will require a large increase in the fraction of car sales that
are electric alongside the rapidly decarbonising and expanding global electricity systems. Over 40% of global passenger vehicle sales by 2030 would likely have to be
EVs, rising from just 2% today, under Paris-aligned pathways according to the IEA. The
emerging cost-competitiveness of EVs with internal combustion engine-driven cars
due to falling battery costs will help provide momentum to this transition.
• Reducing deforestation and better management of land. Currently CO2 emissions from
land-use change and forestry are about 13% of the total global GHG emissions, arising primarily from tropical deforestation of very high carbon content land. Most global
pathways consistent with the long-term temperature goal of the Paris Agreement
transform this net source of emissions into a net sink over the next few decades.
Reduced rates of deforestation can make a large contribution to this, and if implemented in ways that are mindful of other uses of land and barriers to action, can
contribute to wider sustainable development goals.14
The reducing costs of low-carbon technologies and wider alignment with sustainable
development objectives indicate that a rapid scaling-up of global decarbonisation
action this decade could be possible and desirable. The required pace of change will
require a large and rapid shift in global investment patterns to make it happen.
The key technologies to enable this rapid transition over the next decade are now
largely widely available with little or no additional cost over a high carbon
alternative, due to rapid falls in costs over the past decade.15 Some additional
investment is required, but most importantly a shift is needed in the pattern of
investment away from unabated fossil fuel power and towards low-carbon
technologies.16
337 Sixth Carbon Budget – The path to Net Zero
From 2030-onwards, global deployment of additional deeper decarbonisation
technologies will be needed to maintain global emissions reductions and move
towards Net Zero emissions globally:
• Expansion of low-carbon electricity systems enables electrification to
decarbonise much of end-sectors such as transport, buildings and industrial
processes.
• A global hydrogen economy is likely to be required to decarbonise areas
where electrification may be challenging (e.g. some parts of industry, long-
distance heavy goods vehicles) and to provide flexibility in high variable
renewable power systems.
• Carbon capture and storage (CCS) is required to deal with process
emissions in industry and enables at-scale active removal of CO2 from the
air (e.g. biomass energy with carbon capture and storage – BECCS - or
direct air capture), a necessary feature of most pathways that reach
global Net Zero CO2 emissions.
Many of these technologies are available at protype or demonstration stage
today but have not yet been deployed at significant scale. Our modelled global
‘leadership’ transition involves a higher and earlier concentrations of these ‘harder’
decarbonisation actions in the developed regions of the world. Early actions over
the 2020s by developed regions, consistent with their responsibilities under the Paris
Agreement, are likely to have an important role in driving forward the necessary
developments and cost reductions to make subsequent global deployment more
possible.
Progress is currently being made on many of these fronts, for example:
• The heat pump installation market is rapidly expanding in Europe, with
around a 12% annual average growth since 2015 with Scandinavian
countries having some highest penetration rates.17
• Announced plans for low-carbon hydrogen production indicate that global
production would quadruple by 2023. Several large European countries
have announced plans to scale-up hydrogen use, along with the European
Union.18
• The first large-scale (1 MtCO2/yr) direct air capture plant could be
operational in the USA by 2023. The UK has plans to deploy large-scale
carbon removal through BECCS over the 2020s and beyond.19
Our Balanced Net Zero Pathway aims to ensure that the UK helps to drive forward
developments in these key technologies over the 2020s. Slower deployment of
these technologies than in our Balanced Net Zero Pathway would risk undermining
the plausibility of the necessary post-2030 global transition to keep warming to the
long-term temperature goal of the Paris Agreement.
Deeper decarbonisation technologies will be needed at global scale, particularly after 2030.
Action by developed countries over the 2020s will be important for enabling this rapid global roll-out of new decarbonisation technologies from 2030 onwards.
Chapter 7: The Sixth Carbon Budget as a contribution to the Paris Agreement 338
iii) Additional efforts for pursuing 1.5°C
Keeping peak warming to below 1.5°C will likely require additional ambition
beyond the ‘leadership-driven’ scenario outlined previously.* This would require
global Net Zero CO2 to be reached earlier (around 2050) and more rapid global
emissions reductions on the path to Net Zero.
In models able to simulate this level of ambition there are two key aspects to this
additional ambition:
• All regions reach Net Zero CO2 emissions around 2050. Published scenarios
capable of achieving this level of additional ambition generally show all
regions converging to reach Net Zero CO2 emissions around 2050, with very
little variation between them.
• Significantly increased global ambition prior to 2030. Significant extra
ambition in the global power sector is likely to be necessary to achieve this.
According to the IEA World Energy Outlook 2020, global power sector CO2
emissions would need to fall by 60% over 2019 – 2030, with power
generation from unabated coal essentially ended by this date. Around half
of new car sales globally would need to be electric by 2030 relative to
around 40% in below 2°C scenarios. The switch to low-carbon fuels in global
industry is likely to need to have made significant progress by 2030.
Changes on the demand-side are also key.
Further accelerations in domestic emissions reductions by developed regions
beyond the levels in this scenario can only play a marginal role in delivering this
additional ambition need for a fully 1.5°C aligned transition, due to the declining
share of emissions they will comprise, although additional opportunities to reduce
their emissions should be taken where they become feasible.† For this ambition to
be realised it will be essential for all mitigation actions to proceed immediately in
all global regions with no significant space for differing dates of deployment across
the world. Developed regions will need to provide additional support for this
required global increase in effort.
* Significant net negative global CO2 emissions after reaching global Net Zero could help decline global warming
back to 1.5°C after peaking at higher levels but would not significantly affect the level of peak warming reached.
† Only around 25% of cumulative CO2 emissions come from developed regions in our simulated Paris Agreement
scenario over 2020 – 2050.
Fully aligning the global effort with 1.5°C allows very little space for different speeds of reduction in different regions.
Even faster emissions reductions in developed regions could only play a limited role in the additional global ambition needed for 1.5C, but their support of the global effort will be essential.
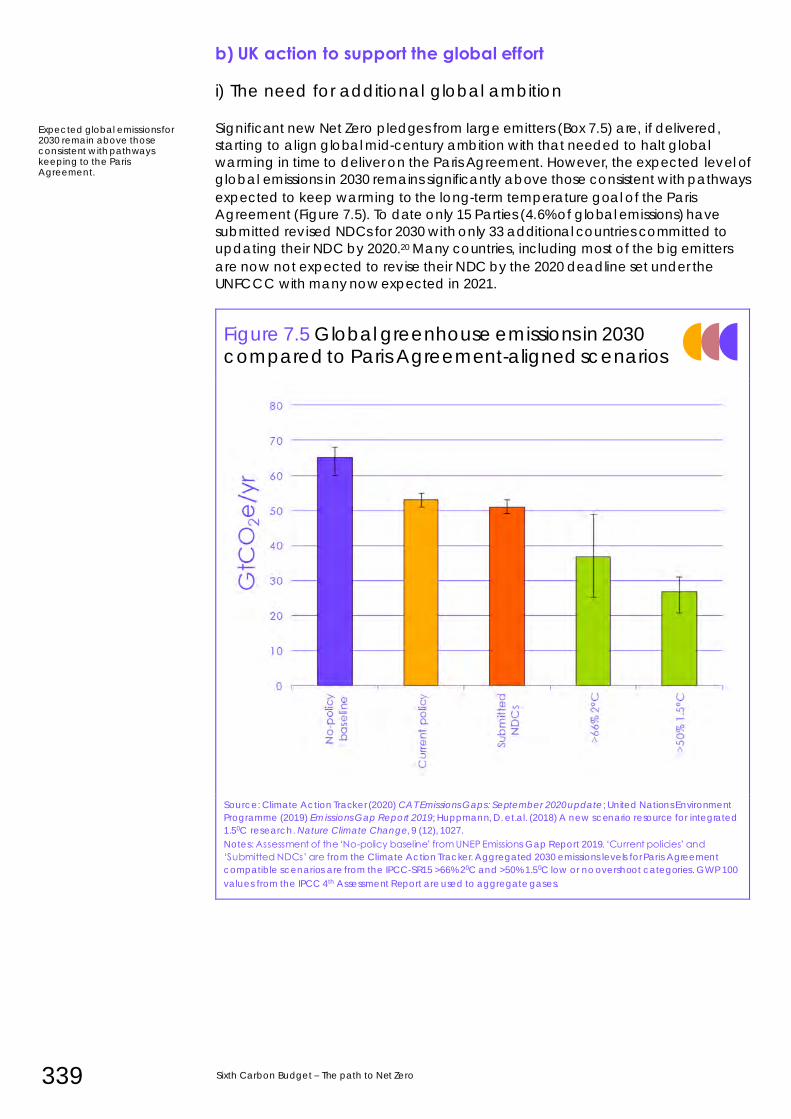
339 Sixth Carbon Budget – The path to Net Zero
b) UK action to support the global effort
i) The need for additional global ambition
Significant new Net Zero pledges from large emitters (Box 7.5) are, if delivered,
starting to align global mid-century ambition with that needed to halt global
warming in time to deliver on the Paris Agreement. However, the expected level of
global emissions in 2030 remains significantly above those consistent with pathways
expected to keep warming to the long-term temperature goal of the Paris
Agreement (Figure 7.5). To date only 15 Parties (4.6% of global emissions) have
submitted revised NDCs for 2030 with only 33 additional countries committed to
updating their NDC by 2020.20 Many countries, including most of the big emitters
are now not expected to revise their NDC by the 2020 deadline set under the
UNFCCC with many now expected in 2021.
Figure 7.5 Global greenhouse emissions in 2030 compared to Paris Agreement-aligned scenarios
Source: Climate Action Tracker (2020) CAT Emissions Gaps: September 2020 update; United Nations Environment
Programme (2019) Emissions Gap Report 2019; Huppmann, D. et.al. (2018) A new scenario resource for integrated
1.50C research. Nature Climate Change, 9 (12), 1027.
Notes: Assessment of the ‘No-policy baseline’ from UNEP Emissions Gap Report 2019. ‘Current policies’ and
‘Submitted NDCs’ are from the Climate Action Tracker. Aggregated 2030 emissions levels for Paris Agreement
compatible scenarios are from the IPCC-SR15 >66% 20C and >50% 1.50C low or no overshoot categories. GWP 100
values from the IPCC 4th Assessment Report are used to aggregate gases.
Expected global emissions for 2030 remain above those consistent with pathways keeping to the Paris Agreement.
Chapter 7: The Sixth Carbon Budget as a contribution to the Paris Agreement 340
Box 7.5 New Net Zero commitments and 2030 ambition in high emitting regions
Closing the gap between current trajectories and those expected to achieve the Paris
Agreement will require increased ambition across the world, but particularly so in the
large emitters. G20 countries make up 78% of global GHG emissions, with around half of
global emissions coming from the largest four emitters (China, USA, EU and India).
There has been developing ambition across several large emitters over the last year:
• China (25% of global emissions) has recently announced that it intends to reach
carbon-neutrality by 2060 as well as committing to enhancing its 2030 ambition. Given the size of China’s emissions, achieving its carbon-neutrality aim would be expected
to reduce global temperatures by 0.2 - 0.3°C.21 However, what China does in the next
10-15 years matters hugely given the scale of Chinese emissions. China’s response to
the pandemic to date has seen emissions rebound beyond pre-COVID-19 levels and a
large increase in permitting for new coal fired power plants.22
• USA (12.5% of global emissions) The incoming Democrat administration has an ambition to ‘put the United States on an irreversible path to achieve Net Zero
emissions, economy-wide, by no later than 2050’, and is also expected to re-join the
Paris Agreement. There has not yet been a proposed new NDC target for 2030, but
the incoming administration has also expressed an ambition to achieve carbon-free
power by 2035 (power sector emissions were 27% of US GHG emissions in 2018).23
• The European Union (8% of global emissions) is currently considering raising its NDC ambition to a 55% reduction (relative to 1990 levels) from the current 40%
commitment. The EU Commission has also proposed a new climate law and European
Green Deal framework to help achieve it and to give the 2050 Net Zero objective
legal status. The European Green Deal framework includes a substantial international facing component, including a proposed carbon border tax to help increase
international ambition in trade-exposed sectors and prevent carbon leakage.
• India (7% of global emissions) has not yet indicated that it will increase its 2030 NDC
ambition. It remains on track to overachieve its NDC commitments but there is
significant scope for this to become more ambitious. India is yet to announce a Net
Zero target.
• Japan (3% of global emissions) has recently pledged to become carbon neutral by
2050, requiring the country to transition away from coal power which currently is a significant fraction (approximately one-third) of its electricity mix. Prior to the
announcement of the 2050 carbon-neutrality target Japan had already resubmitted
its 2030 NDC without increasing ambition from the levels pledged in 2015.
• South Korea (1.3% of global emissions) has recently pledged to become carbon
neutral by 2050 and has proposed a Green New Deal to invest in low -carbon
infrastructure and shift away from coal power. The proposed Green New Deal also
signals a planned end to the financing of coal power plants overseas.
Including the USA, around 75% of global GDP is now covered by Net Zero targets for mid-
century and over 60% of global CO2 emissions.
ii) Opportunities for UK action to help global effort
We commissioned work from Vivid Economics and UCL to identify ways through
which developed countries like the UK could support the necessary increases in
global ambition to achieve the Paris Agreement. This independent piece of work is
published alongside our Sixth Carbon Budget advice.24 A short summary of this
report is provided in Box 7.6.
There is growing momentum behind Net Zero targets for mid-century in the biggest emitting countries and regions, but only limited indications of plans to raise 2030 ambition.
341 Sixth Carbon Budget – The path to Net Zero
Box 7.6 Unpacking leadership-driven global pathways towards the Paris Agreement
Research commissioned by the Committee to support its work on the Sixth Carbon
Budget developed a categorisation of actions for how a developed country such as the
UK can support the global effort to raise ambition:
• Demonstrating Net Zero: Ambitious domestic emissions reductions can help develop
technologies and bring their costs down.
• Diplomatic influencing: Accelerating decarbonisation efforts around the world
through formal and informal diplomatic channels, including multilaterally (e.g. through
the UNFCCC) and bilaterally.
• Trade measures: Implementing carbon pricing and/or product standards on imported products through trade deals could provide an incentive to accelerate the
decarbonisation of global production processes.
• Capacity building: Providing technical assistance to other countries to help develop
their capacity and capability in introducing climate mitigation solutions.
• Direct financial support: Financial transfers to directly fund the deployment of low and
Net Zero carbon technology elsewhere in the world.
• Action on overseas supply chains: Addressing the overseas emissions ‘embedded’
within global supply chains of products consumed by the UK.
The most effective ways to assist global decarbonisation will vary across key ‘wedges’ of
the global transition. For example, areas with more global interconnectedness will likely
have a greater role for trade-related levers, while capacity building will be essential
where there are large non-cost barriers to overcome.
The report identified a wide range of actions that developed countries could take to
support important parts of the global transition in a ‘leadership -driven’ scenario. These include capacity building to help enable the rapid shift to stable high variable
renewable electricity systems in the developing world, coordinated trade measures by
developed countries to develop large markets for low-carbon manufactured products
and drive changes in production methods elsewhere in the world, and setting high standards for the global trade of biomass, carbon removals and offset credits to ensure
that these deliver true benefits for the climate.
For the UK specifically this report highlights opportunities in:
• Coal phase out diplomacy. Rapidly ending power generation from coal is the single biggest contributor to aligning global trajectories with those expected to deliver on
the Paris Agreement, requiring retirements in Asian countries with young coal fleets.
The UK can help others learn from its own experience phasing out coal.
• Building on UK experience to help offshore wind to play a large role in global low -
carbon power generation.
• Leading the development of CCS and low-carbon hydrogen technologies given the
UK’s access to geological carbon storage, expertise base, and offshore wind resource.
• Leading on developing a Net Zero framework and pathway for aviation given the UK’s
high per person aviation emissions.
• Developing GHG removals incentives and sustainability standards. The UK is expected
to be among the first countries to deploy key new technologies for greenhouse gas
removal at large-scales, including bioenergy with carbon capture and storage
(BECCS).
• Green recovery and greening the UK financial sector. The UK is one of the leading providers of international climate finance to developing countries. The UK should use
its position as a global financial sector with substantial cross-border investment to help
drive financial sector reform to provide the necessary shift in private sector investment.
These opportunities are not unique to the UK, but the UK could be well placed to
significantly contribute to all of them.
Source: Vivid Economics (2020) Unpacking leadership-driven global scenarios towards the Paris Agreement.
There are several ways through which the UK could effectively contribute to raising global ambition.
Chapter 7: The Sixth Carbon Budget as a contribution to the Paris Agreement 342
The priority for the UK should be to focus on actions that will have the largest
impact in the transition to a low-carbon economy globally, while at the same time
being consistent with the achievement of sustainable development goals (SDGs)
and building on the areas where it has particular advantages. The largest priority
over the next year will be the UK’s responsibilities for hosting COP26 in Glasgow at
the end of 2021 and at the same time holding the presidency of the G7 group of
countries. 2021 will see Governments around the world produce economic
recovery packages following COVID-19 induced recessions. If aligned to climate
goals these can help stimulate some of the required investments needed to deliver
the low-carbon transition this decade. The UK can put decarbonisation at the
forefront of these recovery efforts in its role as lead for the UN’s global workstream
on ensuring an inclusive and sustainable recovery, alongside its 2021 international
presidencies.
The Government should bring forward ambitious commitments for all aspects of
the Paris Agreement as part of its strengthened commitments this year. This
includes finance, technology transfer, capacity building and supporting efforts to
adapt to current and future climate impacts around the world. This should involve
putting in place much stronger climate adaptation planning, which has
languished for the last decade, alongside its strengthened emissions reduction
commitments. The UK has recently announced a doubling of its climate finance
commitments over the coming five-year period. This funding should continue to be
split between climate mitigation and climate adaption, as adapting to climate
risks is significantly underfunded at a global level.25 The UK should encourage other
large providers of climate finance to do the same.
iii) Conclusions on the purchase of international carbon units
The Paris Agreement allows countries and other bodies (e.g. private companies
and international aviation) to collaborate to achieve the NDCs (Article 6). The rules
on Article 6 have yet to be finalised – the UK will coordinate efforts aiming to
establish a robust and credible centralised global carbon market and rules to
avoid double counting of emissions reductions at COP26.
The Committee does not recommend setting a Sixth Carbon Budget that either
requires the purchase of international carbon units or allows for international
carbon units to contribute to meeting the budget (Chapter 10). The Balanced Net
Zero Pathway fully achieves our recommended budget through domestic actions.
Using international carbon units in place of domestic action to meet the Balanced
Pathway poses several risks including:
• The UK has an internationally influential record of domestic emissions
reductions. The usage of international carbon units to substitute for
emissions reductions that could be achieved domestically could
undermine this influence and legitimise other countries to weaken their
commitments to domestic actions.
• Usage of credits could impair the clarity of the sectoral actions required to
meet the budget by suggesting possible flexibility in the need to deliver
emissions reductions.
• Substituting domestic effort with purchased emissions reductions from
outside the UK could make it more difficult to achieve the necessary
domestic transitions needed to reach Net Zero by 2050.
Strong commitments across all aspects of the Paris Agreement will be necessary from the UK, including on supporting adapting to climate risks.
Our Balanced Pathway can and should be met without the use of international emissions reduction credits.
The UK’s role as host of the international negotiations in 2021 will be the focus for its international climate policy next year.
343 Sixth Carbon Budget – The path to Net Zero
Outside of use for compliance with the UK emissions targets, some use of credit
purchase may be a useful part of the UK’s international climate policy in addition
to domestic delivery of the Balanced Pathway. For many aspects of the global
transition supporting the global effort with capacity building and climate finance
would likely have more benefits for sustainable development and transformational
change towards deeper decarbonisation than funding through global carbon
markets. However, modelled leadership-driven scenarios achieving the Paris
Agreement still involve a large amount of expensive effort (e.g. CCS and removals)
in developing and middle-income countries. These are likely to need an ongoing
income stream, which carbon markets and transfers of carbon units could help
provide.
Any credits purchased for this purpose must be robust and represent real and
equitable action to effectively support the global effort to achieve the Paris
Agreement. There should be clear evidence of additionality to emissions
reductions that would be expected to be achieved otherwise, and they must fulfil
sustainability criteria including at a minimum: resulting in no net harm, being fully
compatible with sustainable development goals and avoiding detriment to local
communities. This is particularly important for credits dependent on significant use
of land or biomass. We outlined a set of principles for robust credit purchase in our
2019 Net Zero report.
Credit purchase outside of the UK’s emissions targets could be a way of supporting some parts of the global effort but would need strong robustness conditions.
Chapter 7: The Sixth Carbon Budget as a contribution to the Paris Agreement 344
4. Reducing the UK’s carbon footprint
Under the UNFCCC and the Paris Agreement, emissions accounting is based on
territorial emissions (the emissions produced within the territorial bounds of
countries). This is the internationally agreed accounting methodology for NDCs
and is aligned to who has sovereignty over the sources of emissions. Given the
widespread acceptance of this accounting framework internationally it remains
the right framework under which the UK should set legally binding targets, both for
the domestic carbon budgets and for the UK’s NDC. An alternative perspective
associates emissions caused during the production of goods and services with the
country that is the final consumer of those goods and services independent of
where in the world those emissions occurred. This is known as consumption-based
accounting.
The UK has a larger consumption emissions footprint than its territorial based
account – as is the case with many developed countries. This section looks at
actions the UK could take to help reduce overseas emissions associated with UK
consumption as part of its efforts to help reduce global emissions.
We conclude that the UK can and should aim to reduce its overseas consumption
footprint as part of its contribution to reducing global emissions. A growing fraction
of the UK’s consumption emissions footprint is now being covered by Net Zero
commitments around the world and there are several levers available to the UK to
help tackle its consumption emissions footprint to support its domestic efforts. Our
analysis suggests it is credible for the UK to reduce its total consumption footprint by
around 90% below 1990 levels if other countries follow pathways consistent with the
Paris Agreement and we will track progress towards this goal.
There are two subsections:
a) The current composition of the UK consumption emissions footprint
b) Levers for tackling UK consumption emissions
a) The current composition of the UK’s consumption footprint
In 2017, the most recent year for which estimates are available, the UK’s
consumption emissions footprint was 772 MtCO2e, about 50% higher than its
territorial emissions.
54% of these consumption footprint emissions were produced in the UK and are
therefore counted in the UK’s territorial account.
• Of these UK produced consumption emissions, a significant fraction (34%)
of these emissions occur directly from households – through driving of cars
and the heating of homes (Figure 7.6). These are parts of the economy
where emissions can be reduced to zero through a combination of
technology and behavioural change as outlined in Chapter 3.
• The other 66% of the UK-produced consumption emissions arise from other
sectors of the UK economy that produce goods and services consumed in
the UK. This will include emissions from electricity generation, some industrial
products, food production, waste services and other transport services. All
these sources are included within our territorial emissions scenarios. Most
can be reduced to close to zero emissions by 2050, but some (e.g. parts of
agriculture and aviation) will remain as positive emission sources.
The UK accounts for emissions consistent with standard practices internationally.
Alternative ‘consumption-based’ accounting assigns more emissions to the UK.
The UK can and should aim to reduce its overseas consumption emissions as part of helping global decarbonisation.
Most of the UK’s consumption emissions occur in the UK.
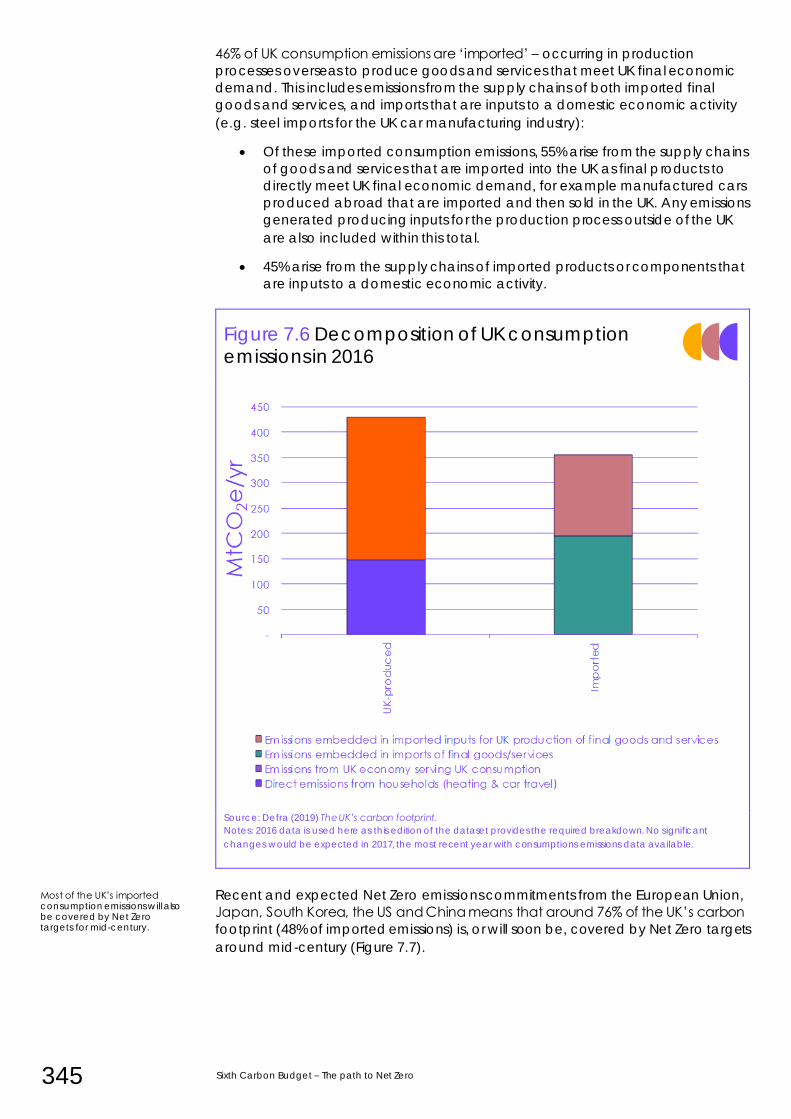
345 Sixth Carbon Budget – The path to Net Zero
46% of UK consumption emissions are ‘imported’ – occurring in production
processes overseas to produce goods and services that meet UK final economic
demand. This includes emissions from the supply chains of both imported final
goods and services, and imports that are inputs to a domestic economic activity
(e.g. steel imports for the UK car manufacturing industry):
• Of these imported consumption emissions, 55% arise from the supply chains
of goods and services that are imported into the UK as final products to
directly meet UK final economic demand, for example manufactured cars
produced abroad that are imported and then sold in the UK. Any emissions
generated producing inputs for the production process outside of the UK
are also included within this total.
• 45% arise from the supply chains of imported products or components that
are inputs to a domestic economic activity.
Figure 7.6 Decomposition of UK consumption emissions in 2016
Source: Defra (2019) The UK’s carbon footprint.
Notes: 2016 data is used here as this edition of the dataset provides the required breakdown. No significant
changes would be expected in 2017, the most recent year with consumptions emissions data available.
Recent and expected Net Zero emissions commitments from the European Union,
Japan, South Korea, the US and China means that around 76% of the UK’s carbon
footprint (48% of imported emissions) is, or will soon be, covered by Net Zero targets
around mid-century (Figure 7.7).
Most of the UK’s imported consumption emissions will also be covered by Net Zero targets for mid-century.
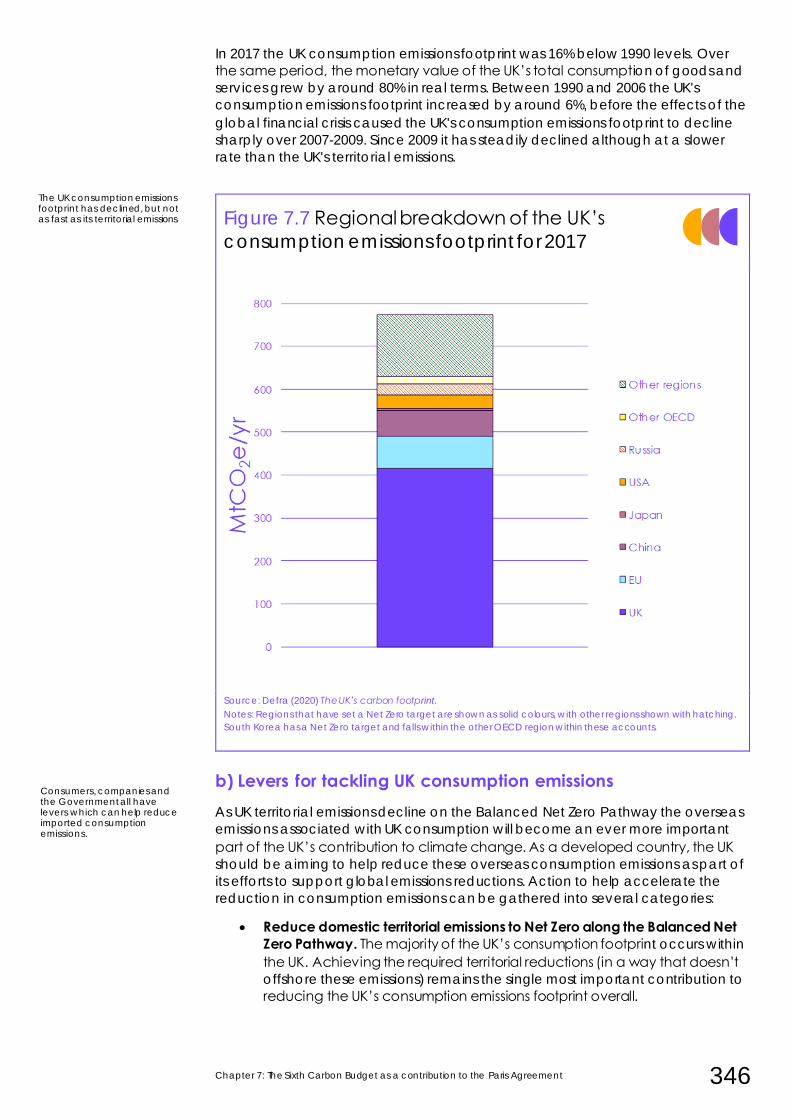
Chapter 7: The Sixth Carbon Budget as a contribution to the Paris Agreement 346
In 2017 the UK consumption emissions footprint was 16% below 1990 levels. Over
the same period, the monetary value of the UK’s total consumption of goods and
services grew by around 80% in real terms. Between 1990 and 2006 the UK's
consumption emissions footprint increased by around 6%, before the effects of the
global financial crisis caused the UK's consumption emissions footprint to decline
sharply over 2007-2009. Since 2009 it has steadily declined although at a slower
rate than the UK's territorial emissions.
Figure 7.7 Regional breakdown of the UK’s
consumption emissions footprint for 2017
Source: Defra (2020) The UK’s carbon footprint.
Notes: Regions that have set a Net Zero target are shown as solid colours, with other regions shown with hatching.
South Korea has a Net Zero target and falls within the other OECD region within these accounts.
b) Levers for tackling UK consumption emissions As UK territorial emissions decline on the Balanced Net Zero Pathway the overseas
emissions associated with UK consumption will become an ever more important
part of the UK’s contribution to climate change. As a developed country, the UK
should be aiming to help reduce these overseas consumption emissions as part of
its efforts to support global emissions reductions. Action to help accelerate the
reduction in consumption emissions can be gathered into several categories:
• Reduce domestic territorial emissions to Net Zero along the Balanced Net Zero Pathway. The majority of the UK’s consumption footprint occurs within
the UK. Achieving the required territorial reductions (in a way that doesn’t
offshore these emissions) remains the single most important contribution to
reducing the UK’s consumption emissions footprint overall.
The UK consumption emissions footprint has declined, but not as fast as its territorial emissions.
Consumers, companies and the Government all have levers which can help reduce imported consumption emissions.
347 Sixth Carbon Budget – The path to Net Zero
Domestic decarbonisation also reduces the UK demand for imported fossil
fuels – eliminating additional consumption emissions associated with their
extraction and transport. Changes in consumption patterns needed in our
scenarios to meet Net Zero territorially mean that there will be additional
reductions in the UK’s consumption emissions footprint. This would be further
enhanced with a policy approach that will tend to lower the carbon-
intensity of imported goods and provide a level playing field to domestic
low-carbon production, as discussed in our accompanying policy report.
• Consumer action to reduce demand for high-carbon goods. Our scenarios
to deliver Net Zero domestically involve changes in consumption by
consumers (e.g. reduced meat consumption), alongside waste reduction
and resource efficiency. These changes will have additional benefits for UK
consumption emissions to the extent to which they apply to imports as well
as domestic production.* This can help reduce the 55% of the UK’s imported
consumption emissions that are in the form of final goods and services.
• Corporate action. 45% of the UK’s imported consumption emissions come
from the products that are inputs to a domestic economic activity. Better
measurement of emissions along supply chains will help companies identify
the emissions ‘hotspots’ within their supply chains, work with suppliers to
reduce the carbon intensity of these goods and/or find alternative low-
carbon supply chains. Resource efficiency in production processes (which
is included in our scenarios) can require less use of imported carbon intense
products (e.g. steel).
• Action enabled by effective trade measures and product standards. Both
actions by the final consumer and by UK corporations can be aided by
trade arrangements. Product standards and border carbon adjustments, if
they can be made effective, create markets for both final and
intermediate consumption that help consumers and firms make low-carbon
choices. They can also play a role in preventing ‘offshoring’ of emissions
from actions to decarbonise industry in the UK which would otherwise
undermine the benefit of domestic decarbonisation for UK consumption
emissions.
• Avoiding scrappage. Scrapping high-carbon capital stock early in its
lifetime and replacing it with low-carbon alternatives could help reduce
operational emissions that occur within the UK’s territorial emissions
account, but may not bring benefits in terms of consumption emissions
when production emissions occurring overseas are considered. Where
possible we have tried to avoid scrapping capital stock unnecessarily when
constructing our scenarios for reducing the UK’s territorial emissions.
The UK’s changing global trade relationships at the present time presents an
opportunity to stimulate global decarbonisation through trade arrangements and
the Government should explore this alongside the other levers to reduce the UK’s
consumption emissions footprint. The growing spread of mid-century territorial
emissions Net Zero targets could form a basis for possible border carbon
adjustments.
This should be done mindful of the economic challenges in recovering from
COVID-19 in countries all around the world, particularly in developing countries,
who are generally not expected to reach Net Zero emissions on the same timelines
as developed countries under the Paris Agreement. Fair and effective border
carbon adjustment proposals would need to be mindful of these factors.
* We quantified an estimate of the size of changes in overseas consumption emissions from demand changes in our
2019 Net Zero report.
International trade measures would need to be implemented carefully.
Chapter 7: The Sixth Carbon Budget as a contribution to the Paris Agreement 348
We have produced exploratory scenarios for the UK’s future consumption emissions
footprint (Box 7.5) that suggest that if the world is successful in efforts to reduce
global greenhouse gas emissions in-line with scenarios expected to deliver the Paris
Agreement, the UK’s consumption footprint could fall by 65% by 2035 and 90% by
2050 relative to 1990 levels.
We will monitor the UK’s overseas consumption emissions footprint against this
indicative pathway alongside our progress reporting on territorial emissions. The
Government should explore the levers identified above to reduce the UK’s
consumption emissions, alongside its wider support of the global effort (Section 3).
Box 7.7 Approach to developing ‘exploratory’ UK consumption emission pathways
We have projected possible futures for the UK’s consumption emissions footprint, building
on the methodology in our 2013 report Reducing the UK’s carbon footprint and
managing competitiveness risks developed with the University of Leeds. These projections
rely on several assumptions:
• International ambition: We consider two scenarios for how international carbon
intensities of production will evolve in the future, based on the global modelling described in Section 3. The ‘Current global ambition’ case represents countries
meeting currently pledged NDCs for 2030 and continuing to decarbonise at the same
rate after 2030. The ‘Paris Agreement’ scenario sees global CO2 emissions fall to Net
Zero around 2060, consistent with limiting warming to ‘well-below’ 2°C above preindustrial levels. In both cases we consider reductions of UK territorial emissions
along the Balanced Net Zero Pathway to Net Zero.
• Consumption patterns and production structures: We assume overall growth rates in
the consumption of most categories of goods and services consistent with the UK-wide
GDP trajectory we have used throughout the rest of this report. We represent shifts in
the final demand for goods and services consistent with our Balanced Net Zero Pathway where these can easily be mapped to specific groups of goods and services
(e.g. passenger aviation demand). Due to the speculative nature of projecting
changes in the production structure of economies (how sectors interact with each
other in the UK and around the world), we hold this constant at today’s levels.
• Production standards: Delivering the Balanced Pathway requires significant changes in
the methods of production for trade-exposed sectors such as heavy manufacturing. Our supporting policy report recommends exploring trade measures to ensure that this
transition is not undermined by ‘offshoring’ of production reducing the benefits of the
decarbonisation action for global emissions. We include a simple representation of
these standards within our projection for future imported emissions by converging the carbon intensities of production overseas with UK levels within a limited number of
heavy industry and fuel production sectors.
• Coverage: Some sources of emissions fall outside of the consumption emissions
framework. Emissions from land-use, land-use change and forestry around the world
have large uncertainties and are difficult to associate with demands for products at
the level of economic sectors, so are not included within the UK’s consumption
emissions accounts at present.
These exploratory scenarios suggest that significant falls in the UK’s consumption emissions
footprint would be expected over 2020 to 2050 across the range of possible global
emissions reduction ambition. Most of this reduction comes from reducing the UK’s
territorially sourced emissions to Net Zero. In a current global ambition case imported
emissions would only decline by 15% relative to their 1990 levels, with our modelled simple
representation of production standards necessary to keep imported emissions from rising.
With increased global ambition approximately aligned to the Paris Agreement, imported
emissions would also fall – by about 75% relative to 1990 levels in our modelled scenario.
Significant reductions in the UK’s consumption emissions footprint is possible by 2050.
We have developed exploratory scenarios for how the UK’s consumption emissions might evolve and will track against these trajectories.
Significant falls in the UK consumption emissions footprint could be achieved by 2050.
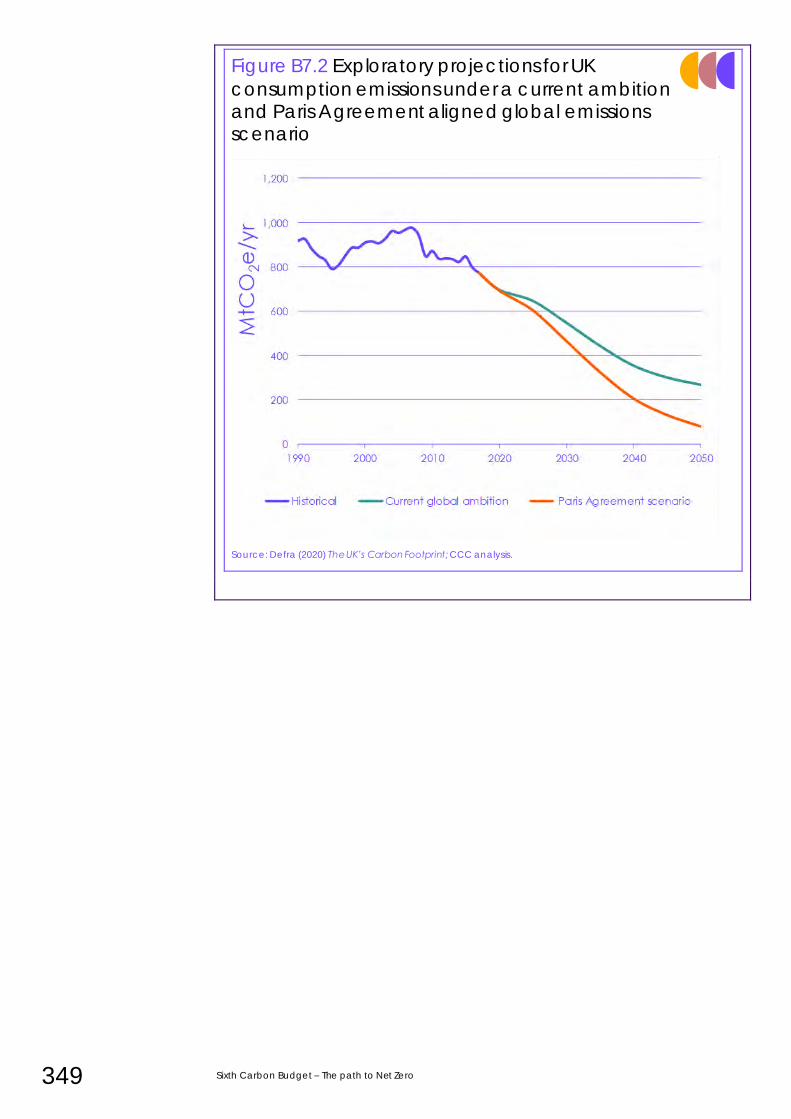
349 Sixth Carbon Budget – The path to Net Zero
Figure B7.2 Exploratory projections for UK
consumption emissions under a current ambition and Paris Agreement aligned global emissions scenario
Source: Defra (2020) The UK’s Carbon Footprint; CCC analysis.
Chapter 7: The Sixth Carbon Budget as a contribution to the Paris Agreement 350
1 Cambridge Econometrics (2020) China’s net zero ambition could boost GDP by 5% during this
decade; Scovronick, N. et al. (2019) The impact of human health co-benefits on evaluations of
global climate policy. Nature Communications, 10, 2095; Luderer, G. et al. (2019) Environmental
co-benefits and adverse side-effects of alternative power sector decarbonization strategies.
Nature Communications, 10, 5229.
2 Bloomberg New Energy Finance (2020) Scale up of solar and wind puts existing coal and gas at
risk. 3 Tsiropoulos I. et al. (2020) Towards net-zero emissions in the EU energy system by 2050– Insights
from scenarios in line with the 2030 and 2050 ambitions of the European Green Deal?
4 Ember (2020) Vision or division? What do National Energy and Climate Plans tell us about the EU
power sector in 2030?
5 Spanish Government (2020) Integrated National Energy and Climate Plan 2021-2030; The
Netherlands Government (2019) Integrated National Energy and Climate Plan.
6 European Commission (2020) A hydrogen strategy for a climate-neutral Europe. 7 Vivid Economics (2020) Unpacking leadership-driven global pathways towards the Paris
Agreement. 8 IPCC (2018) Chapter 2: Mitigation pathways compatible with 1.5°C in the context of sustainable
development in: Special Report on Global Warming of 1.5°C. 9 Cui, R. Y. et al. (2019) Quantifying operational lifetimes for coal power plants under the Paris
goals. Nature Communications,10, 475. 10 IRENA (2020) Renewable Power Generation Costs in 2019; IEA (2020) China’s Emissions Trading
Scheme. 11 IPCC (2018) Chapter 2: Mitigation pathways compatible with 1.5°C in the context of sustainable
development in: Special Report on Global Warming of 1.5°C. 12 IEA (2019) World Energy Outlook 2019.
13 Bloomberg New Energy Finance (2020) Scale up of solar and wind puts existing coal and gas at
risk.
14 IPCC (2019) Special Report on Climate Change and Land.
15 IRENA (2020) 10 Years: Progress to Action.
16 McCollum, D.L. et al. (2018) Energy investment needs for fulfil ling the Paris Agreement and
achieving the Sustainable Development Goals. Nature Energy, 3(7), p.589.
17 IEA (2020) Heat Pumps Tracking Report. 18 IEA (2020) Tracking Hydrogen.
19 Carbon Engineering (2019) CE expanding capacity of commercial Direct Air Capture plant;
Drax (2020) Drax BECCS timeline.
20 World Resources Institute (2020) 2020 NDC Tracker.
21 Climate Action Tracker Initiative (2020) China going carbon neutral before 2060 would lower
warming projections by around 0.2 to 0.3 degrees C .
22 Global Energy Monitor (2020) A New Coal Boom in China.
23 EPA (2020) Sources of Greenhouse Gas Emissions. 24 Vivid Economics (2020) Unpacking leadership-driven global pathways towards the Paris
Agreement. 25 OECD (2019) Climate-related Development Finance Data.
351 Sixth Carbon Budget – The path to Net Zero
Scientific context for setting the
UK’s Sixth Carbon Budget
1. The fundamentals of the physical science basis remain strong 355
2. Updated understanding of the climate system 359
3. Global CO2 budgets as a guide for mitigation pathways 367
4. Minimising the UK’s future contribution to climate change 372
5. The need to adapt to a changing climate 377

353 Sixth Carbon Budget – The path to Net Zero
Introduction and key messages
The Committee is required to consider scientific knowledge about climate change
when providing advice on the level of the UK’s carbon budgets. This chapter
presents our assessment for the purposes of advising on the level of the UK’s Sixth
Carbon Budget.
This chapter builds on our assessment in our Fifth Carbon Budget advice in 2015
and our recent advice on setting a Net Zero target for the UK in 2019. It draws on
recent developments in the scientific literature, the recent Intergovernmental
Panel on Climate Change (IPCC) Special Reports and Fifth Assessment Report
(AR5), which remains the most up-to-date comprehensive assessment by the IPCC
of the physical basis for climate change until the IPCC Sixth Assessment Report is
published in 2021. Our conclusions are:
• Fundamental understanding of climate change and its causes continues to strengthen. The conclusions of our Fifth Carbon Budget assessment are
strengthened by the latest developments in the scientific literature. The
recent Special Report on Global Warming of 1.5°C (SR1.5) has improved the
understanding of how future greenhouse gas emissions affect the climate
and what is required to keep warming to the Paris Agreement long-term
temperature goal. We have drawn on this strengthening knowledge base
to inform the construction of our UK emissions pathways towards the 2050
Net Zero goal.
• Understanding of climate sensitivity has continued to progress since our Fifth Carbon Budget advice and IPCC-AR5. A new community synthesis
(published in 2020) of multiple lines of evidence regarding how sensitive the
climate is to atmospheric carbon dioxide has suggested narrower ranges
for uncertainties in the climate sensitivity than IPCC-AR5. The range of
climate sensitivity from a new generation of complex climate models
extends to higher values than previously. This new knowledge base will be
reviewed by the IPCC next year. The global emissions pathways assessed
by IPCC-SR1.5 currently remain the best indicators of the global ambition
expected to achieve the Paris Agreement temperature goal.
• Minimising cumulative emissions of long-lived greenhouse gases will help minimise additional climate impacts along the pathway to Net Zero. Estimates of the remaining global cumulative CO2 emissions consistent with
keeping warming to the Paris Agreement long-term temperature goal
ultimately depend on a set of choices and definitions, which imply a wide
range could be consistent. This means it is challenging to use these
estimates to constrain national emissions pathways robustly. National
emissions pathways should however seek to minimise cumulative long-lived
greenhouse gas (GHG) emissions on the pathway to Net Zero to minimise
additional climate impacts, highlighting the need for ambitious near-term
emissions reductions to fully align with the Paris Agreement.
• Adapting to climate risks is essential given the wide ranges of climate futures that remain possible. Climate impacts are already being felt in the
UK and around the world. These will increase with further warming – and
some increase is inevitable even under the most ambitious global emissions
reductions. Warming in excess of 2°C cannot be ruled out even under
global emissions scenarios expected to satisfy the Paris Agreement and
warming in excess of 4°C by 2100 remains possible if the current ambition
for reduction in global emissions is not increased. This demonstrates the
importance of considering a wide range of climate outcomes in
adaptation planning and implementation.
This chapter provides the Committee’s assessment of the scientific understanding about climate change as required under the Climate Change Act when advising on carbon budgets.
It builds on the assessments in the Committee’s advice on the Fifth Carbon Budget and on setting a UK Net Zero target.

Chapter 8: Scientific context for setting the UK’s Sixth Carbon Budget 354
We set out our analysis in five sections:
1. The fundamentals of the physical science basis remain strong
2. Updated understanding of the climate system
3. Global CO2 budgets as a guide for mitigation pathways
4. Minimising the UK’s future contribution to climate change
5. The need to adapt to a changing climate
355 Sixth Carbon Budget – The path to Net Zero
1. The fundamentals of the physical science basis remain strong
This report builds on the assessment of the scientific knowledge about climate
change in the Committee’s Fifth Carbon Budget and Net Zero advice reports.1 It is
also informed by the two new Special Reports from the IPCC on The Ocean and
Cryosphere in a Changing Climate and Climate Change and Land. This section
reviews the key messages from those reports.
i) IPCC Fifth Assessment Report
The last time the Committee advised on the level of a UK carbon budget (the Fifth
Carbon Budget in 2015), the recently published IPCC Fifth Assessment report (IPCC-
AR5 - completed in 2014) formed the scientific underpinning of our assessment. It
remains the IPCC’s latest full assessment report, with the IPCC’s Sixth Assessment
report expected in 2021.
IPCC-AR5 clearly demonstrated that the climate is changing as a result of human
activity, causing damaging impacts, and that to stop continued increases in
global temperature, global emissions of greenhouse gases must be reduced to
very close to zero:
• The climate is changing as a result of global greenhouse gas emissions. The
IPCC concluded that it was unequivocal that humans were influencing the
climate. It is extremely likely (>95% probability) that human activity is the
dominant cause of the warming observed since the 1950s, with the best
estimate of the human-induced contribution similar to the observed
warming over the period.
• Many climate impacts are being detected across the world. IPCC-AR5
concluded that 'recent climate changes have had widespread impacts on
human and natural systems on all continents and across the oceans'.
Attributable impacts included an impact of climate change on crop yields,
shrinking glaciers and changing rainfall patterns affecting water availability,
along with changing geographic ranges of species on land and ocean.
• Further emissions will lead to further warming and change. The pathways of
future global greenhouse gas (GHG) emissions will be the primary
determiner of how the climate continues to change in the future. Future
warming will bring additional increases in the climate-related risks already
present, as well as the emergence of new ones.
• There is no simple threshold beyond which climate change moves from safe to dangerous. Climate impacts are being felt today and are having
significant consequences for people and natural systems already. There is
no ‘safe’ level of global warming at which significant climate impacts can
be avoided entirely.
• The increase in global temperature is determined mainly by total carbon dioxide emissions over time, which must fall to near zero in order to limit warming. Long-lived GHGs (such as carbon dioxide – CO2) accumulate in
the atmosphere, meaning continued emission of these gases leads to
continually increasing warming. Warming created by long-lived GHGs is not
naturally reversible on the timescale of decades-to-centuries. Therefore,
reducing this warming would requires the active removal of long-lived
GHGs from the atmosphere.
The IPCC Fifth Assessment Report and the recent IPCC Special Reports summarise the core of the evidence basis for this chapter.
The conclusions of the IPCC Fifth Assessment Report on the fundamentals of climate change remain valid.
Chapter 8: Scientific context for setting the UK’s Sixth Carbon Budget 356
Over the five years since the Committee’s advice on the UK’s Fifth Carbon Budget,
these key messages remain valid. Confidence in these conclusions has increased
as evidence and understanding has continued to accumulate. They have been
reinforced by additional observations of climate change, new climate modelling
efforts and improved understanding of the climate system (Section 2).
ii) IPCC Special Report on Global Warming of 1.5°C
The Committee’s Net Zero report in 2019 built on the recently published IPCC
Special Report on Global Warming of 1.5°C (IPCC-SR1.5) to assess what was
necessary to keep warming to the long-term temperature goal of the Paris
Agreement.
Key messages emerging from that assessment included:
• Any action to reduce emissions helps limit future climate risks. The world
has already started moving away from the highest emissions futures and
the most severe future climate impacts. Meeting the temperature goal of
the Paris Agreement would lead to significantly smaller increases in future
climate risks than projected under current pathways. Any action to reduce
global GHG emissions helps to reduce future global temperature increases
and keep future increases in climate hazards as small as possible.
• Net Zero emissions of long-lived GHGs are needed to stop the planet warming, alongside falling emissions of shorter-lived GHGs. Emissions of
long-lived GHGs (e.g. CO2 and nitrous oxide) lead to increased
atmospheric concentrations for many decades. Emissions of shorter-lived
GHGs (e.g. methane) see atmospheric concentrations return to normal
levels within a few decades after emissions are stopped due to their
removal from the atmosphere by natural chemical cycles.
• Keeping to the long-term temperature goal of the Paris Agreement requires reducing long-lived GHG emissions rapidly over the next few decades to reach Net Zero, alongside rapid reductions in short-lived GHGs. Global
emissions pathways expected to keep peak warming to 1.5°C reach Net
Zero CO2 emissions by around 2050 and around 2075 for 'well-below 2°C'
(Figure 8.1).* Pathways reach Net Zero aggregated GHG emissions around
2070 for a 1.5°C limit with most pathways not yet reaching Net Zero GHG
emissions before 2100 for ‘well-below’ 2°C.†
The emissions pathways assessed by IPCC-SR1.5 were a key part of the analysis
underpinning the Committee’s advice that the UK should set a long-term emissions
target for Net Zero aggregated GHG emissions by 2050 – ahead of the date
necessary for the world as a whole for a 1.5°C pathway. IPCC-SR1.5 remains the
most recent synthesis assessment of global emissions pathways expected to satisfy
the Paris Agreement, and therefore remains the core of the evidence base for the
purposes of this report. An updated assessment is expected from the Working
Group III assessment, as part of the IPCC Sixth Assessment Report, expected in
2021.
* In this report we interpret effort consistent with the ‘well-below’ 2°C limit in the Paris Agreement long-term
temperature goal as bounded on the high end by global emissions scenarios with at least a 66% probability of
keeping peak warming below 2°C. This is consistent with our interpretation in the 2019 Net Zero report.
† GHG emissions are here aggregated using the Global Warming Potential metric with a time horizon of 100 years,
consistent with international GHG reporting practice.
Recent evidence has further strengthened these conclusions.
The IPCC Special Report on Global Warming of 1.5°C provides the most recent comprehensive assessment of the global effort needed to achieve the Paris Agreement.
The key features of global emissions pathways to keep to the Paris Agreement are well understood.
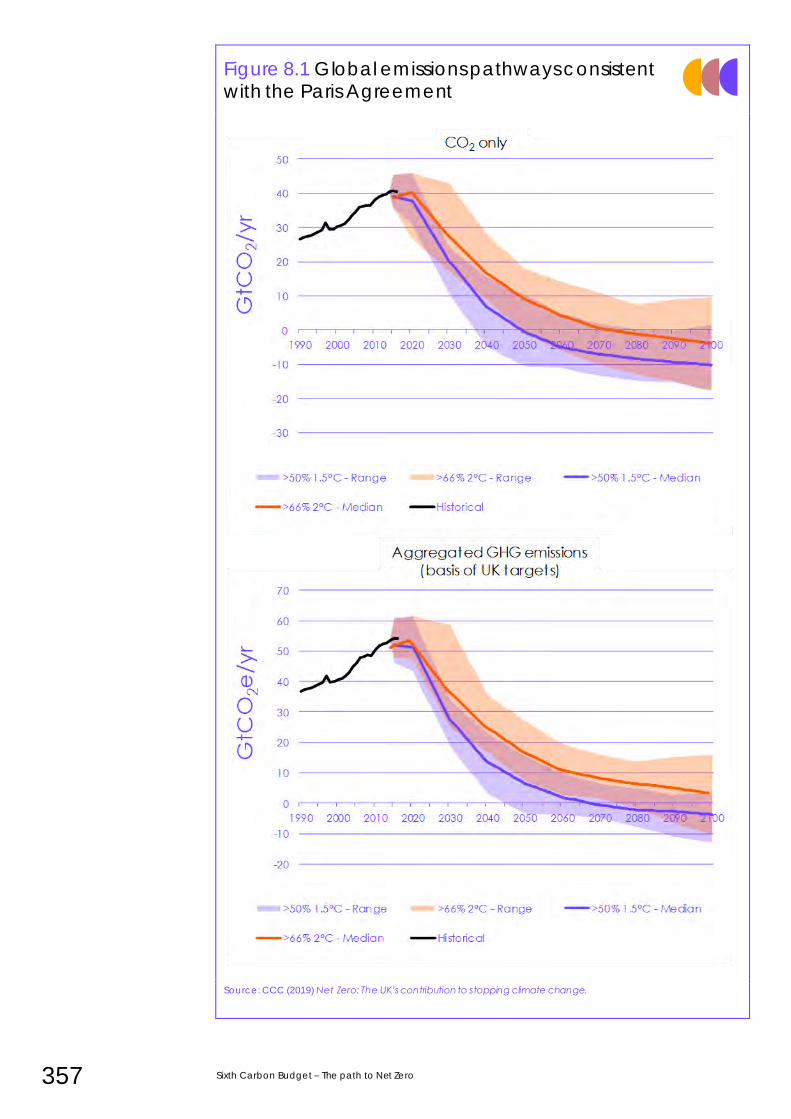
357 Sixth Carbon Budget – The path to Net Zero
Figure 8.1 Global emissions pathways consistent with the Paris Agreement
Source: CCC (2019) Net Zero: The UK’s contribution to stopping climate change.
Chapter 8: Scientific context for setting the UK’s Sixth Carbon Budget 358
iii) IPCC Special Reports on the Ocean and on Land Whilst there has not been a new comprehensive IPCC assessment report since our
advice on the Fifth Carbon Budget and the UK’s Net Zero targets, there have been
additional IPCC Special Reports on The Ocean and Cryosphere in a Changing
Climate and Climate Change and Land, which have helped to document
particular aspects of this improved knowledge base (Box 8.1).
Box 8.1 IPCC Special Reports – Oceans & Cryosphere in Changing Climate; Climate Change and
Land
The IPCC produced a special report on climate change and land (published in August
2019) that assessed literature looking at the role of climate change on desertification,
land degradation, sustainable land management, food security, and greenhouse gas
fluxes in terrestrial ecosystems. Several conclusions on the role of land in climate
mitigation were found:
• Land plays a critical role in supporting human society and is already under pressure
from climate change. Land provides humans with food, freshwater and ecosystem
services. About 70% of the planet’s ice-free surface is directly affected by humans in
some way.
• Land surface temperatures have warmed by over 1.5°C from the pre-industrial period.
This warming, and the associated changes in weather extremes, is already impacting
food security including crop yields and agricultural pests and diseases.
• Land-based mitigation can play an important role in limiting future warming. Emissions from the global food and land-use system contribute 21 - 37% of global GHG emissions
today, but measures to reduce these exist with many bringing other co-benefits for
sustainable development.
• There are limits to what land-based mitigation can achieve by itself. Land will come
under further pressure from future climate change and very large-scale use of land for
mitigation (e.g. afforestation or biomass production) could have negative consequences for other functions of land such as biodiversity, food production and
climate resilience.
The IPCC Special Report on Oceans and the Cryosphere in a Changing Climate was
published in September 2019. The main conclusions were:
• Observations show that the Earth’s oceans are getting warmer and becoming more
acidic; glaciers and ice sheets have reduced in volume and sea ice coverage and
thickness has reduced. The rate of global sea level rise has recently accelerated due
to increased water input, primarily from melting ice sheets and glaciers.
• These changes are having impacts today. Coral reef bleaching events have become
more common and the geographical extent of species’ ranges in the ocean is
changing. Melting glaciers are affecting water availability in some mountain regions.
• Significant additional changes will occur in the oceans ev en if the Paris Agreement long-term temperature goal is achieved. Sea levels will continue to rise for many
hundreds of years even after global temperatures are stabilised. Average sea levels
could rise by 0.3 – 0.6 m (>66% probability range) above 1986-2005 levels by 2100
under a global emissions scenario approximately consistent with achieving the Paris
Agreement long-term temperature goal and would continue rising after 2100.
• The upper end of projections for future sea level rise have been revised upwards from the IPCC Fifth Assessment Report. This is primarily due to increased uncertainty
regarding the contribution from Antarctic melt. Under a scenario with very high future
global GHG emissions, global sea level rise could be 0.6 – 1.1 m (>66% probability
range) above 1986-2005 levels by 2100.
These special reports document the improved understanding of the risks from climate
change to oceans and land. They have strengthened the evidence base on what
mitigation and adaption actions can be taken to help limit future risks.
There have been new IPCC Special Reports summarising the evidence base on aspects of climate change.
359 Sixth Carbon Budget – The path to Net Zero
2. Updated understanding of the climate system
Knowledge about the climate system has continued to progress over recent years.
New observations show continued warming occurring. The fingerprint of human-
induced climate change can increasingly be found in extreme weather events. At
the same time, a new generation of complex climate models is becoming
available with improved representations of physical processes relevant for
projecting future climate change. Together new observations and new modelling
capabilities are leading to new understanding of the climate system.
This section summarises some recent developments in the evidence base relevant
to the Committee’s advice on the level of UK’s Sixth Carbon Budget. It is split into
two sub-sections:
a) New observations of climate change
b) New modelling and understanding of climate sensitivity
a) New observations of climate change Over the five years since our Fifth Carbon Budget advice, further changes in the
climate system have been observed:
• The five years since 2015 have seen the five warmest years (globally) on
record.2
• The global average level of human-induced warming is now in excess of
1.1°C when defined consistent with practices used by the World
Metrological Organisation and IPCC-SR1.5.3* Best estimates indicate that
human activities are responsible for 100% of the warming observed since
1850-1900.† The observed rate of increase in global temperature (~0.2°C
per decade) has proceeded consistent with the near-term warming
projection made by the IPCC-AR5 report in 2013 (a 0.12 - 0.42°C per
decade increase).
• Global sea levels have continued to rise, with the rate of increase over the
last five years being the fastest observed to date. Global average sea
levels are now estimated to be around 20 cm above levels in 1900.4
• In the UK, the 2010 – 2019 decade was the second warmest cardinal
decade on record after 2000 – 2009. In 2019, the highest ever temperature
reached in the UK was recorded as well as the warmest ever recorded
winter temperature.5 Considerably more high temperature records were set
in the UK over than 2010s than low temperature records.
The detection and attribution of the role of human-induced climate change in
extreme weather events has now become firmly established as a scientific
discipline.6 Human-induced climate change has been clearly shown to increase
the frequency and intensity of many (but not all) extreme weather events, with
particularly clear signals in extreme heat and many heavy rainfall events.7
* A blend of near-surface air temperature over land and sea surface temperature over oceans.
† This period is regularly used as an approximation of pre-industrial conditions, including by the IPCC
New observations of climate change and new modelling capabilities are leading to improved understanding of the climate.
Evidence of the changes in climate and its impacts have continued to mount over the last five years.
The role of climate change in extreme weather events is increasingly well understood.
Chapter 8: Scientific context for setting the UK’s Sixth Carbon Budget 360
Attribution studies have also linked the human-induced changes in climate
hazards through to its impact on people, for example an estimated 20% increase in
heat-related mortality in London during the 2003 European heatwave (which was
linked to ~300 additional deaths in the Greater London area).8 Human-induced
climate change is also shown to be increasing the kinds of conditions in which
wildfires can occur including in areas of Western North America and Australia that
have seen recent large fires.9 The impact of other extreme events has also been
shown to be amplified by climate change, for example hurricanes are more
damaging due to higher sea levels, and warmer seas leading to higher wind
speeds and heavier rainfall.10
These continued changes indicate just some of the consequences of the
continued increase in drivers of climate change due to human activities (Box 8.2)
and illustrate the impact of a planet over 1°C warmer than pre-industrial levels.
Box 8.2: Changes in the drivers of climate change since the Fifth Carbon Budget advice
The drivers of climate change have continued to evolve over the period since the
Committee’s advice on the level of the Fifth Carbon Budget in 2015.
• Global annual CO2 emissions have increased by 3% (energy-related emissions only) over 2014 - 2019, a significantly slower rate than over the proceeding five-year
period.11 2019 saw close to zero growth on 2018 levels, with an expected fall in 2020
levels following the effects of COVID-19 on energy use around the world. Projections
from the International Energy Agency now suggest continued slow or no growth in global energy-related CO2 emissions over the coming decade, following the initial
bounce-back from COVID-related declines soon after 2020. It is now very possible that
global CO2 emissions may remain below 2019 levels over the course of the coming
decade.12
• Global non-CO2 GHG emissions. Global methane emissions have been rising steadily
over the past decade, driven largely by rising emissions from the oil and gas sector and from ruminant agriculture.13 Nitrous oxide emissions have also been rising, primarily
due to increased emissions from agricultural soils, whilst F-gas emissions are rapidly
approaching the same magnitude (on a CO2-equivalent basis) as global nitrous oxide
emissions.
• Atmospheric GHG concentrations have continued to rise for major GHGs. CO2
concentrations are driven by accumulating CO2 emissions in the atmosphere, reaching nearly 150% of their pre-industrial values.14 Understanding of the global
atmospheric methane and nitrous oxide budgets has improved.15 Evidence indicates
that rising emissions from both agricultural and energy sectors have underpinned the
recent rise in atmospheric methane concentrations, with limited evidence to date of
increasing methane release from the Arctic.16
• Radiative forcing. The radiative forcing (heat trapping potential) of well-mixed GHGs has increased by around 45% since 1990, dominated by increases in the atmospheric
concentration of CO2.17 A recent community assessment of radiative forcing from
aerosols estimates that between 20% - 50% of the radiative forcing from well-mixed
GHGs is being offset by aerosols.18 There have been no significant changes in natural
climate forcing (e.g. from volcanic eruptions) over the past decade.
The drop in annual global CO2 emissions expected for 2020 due to the impacts of COVID-
19 will not lead to any decrease in the atmospheric concentrations of CO 2 or the levels of
human-induced warming.19 Continued CO2 emissions, even at a declining rate, continue
to increase the global average temperature and will not reverse the changes in the
climate system seen over recent decades.
Global emissions have continued to rise over the past five years, but their growth has slowed recently. Emissions over the 2020s may remain below 2019 levels due to longer-term effects of COVID-19 on global economies.
361 Sixth Carbon Budget – The path to Net Zero
b) New modelling and understanding of climate sensitivity
Since IPCC-AR5 and the Committee’s advice on the UK’s Fifth Carbon Budget
there have been new estimates of the equilibrium climate sensitivity - a predictor of
long-term warming under a future atmospheric concentration scenario - from
complex climate models and from a prominent synthesis of multiple lines of
evidence. We summarise these areas of new evidence before assessing the
expected implications for projections of climate change under rapid global
emissions reductions.
While a comprehensive assessment of this new knowledge will be undertaken by
the IPCC Sixth Assessment Report in 2021, we conclude that available evidence to-
date suggests that the global emissions pathways summarised by the IPCC-SR1.5
remain good guides to the level of ambition expected to be consistent with the
Paris Agreement’s long-term temperature goal.
i) New climate modelling
Equilibrium climate sensitivity (ECS) is an important metric for future climate
changes. It is defined as the amount of global warming that would eventually
occur following a doubling of atmospheric CO2 concentrations (from pre-industrial
levels). Estimates of ECS have extended over a similar range of uncertainty for
many decades, with central estimates around 3°C of warming for a doubling of
CO2 concentrations, but with significant uncertainty intervals extending from 1.5°C
to 4.5°C (>66% confidence) in IPCC-AR5.
Newly updated complex climate models are now available. Some of these models
have a sensitivity to carbon dioxide that is above the range of complex climate
models from the previous generation (Box 8.3). These models raise the possibility
that the risks of very high temperature rises are higher than previously thought, but
the process of understanding the reasons behind these new results - and their
consistency with other lines of evidence - is still ongoing in the scientific community.
Box 8.3 Climate sensitivity in new complex climate models
Computer simulations of the physics, chemistry and biology of the climate system are
used to understand the fundamental processes important for the Earth’s climate and to
project future changes. A new generation of climate models have been developed
around the world over the past five years. These new models improve the resolution (the
size of grid that the world is broken up into) to around 60 km from around 150 km in the
previous generation. Some also include representations of additional physical processes,
such as interactively simulating changes in the nitrogen cycle that previously have not
been possible, and improved representations of cloud physics processes.
This new generation of models (known as CMIP6 models) contain a number of models
with ECS lying outside the assessed 1.5 – 4.5°C likely range from the IPCC-AR5 (this
represents an interval in which the authors have over 66% confidence that the true value
lies), and outside the range of values simulated by complex climate models in the
previous generation (CMIP5). This means the upper end of the range of global
temperature increases simulated under standardised emissions scenarios is now higher in
CMIP6 than CMIP5.20
The process of understanding the reasons behind these new higher sensitivity climate
models is still ongoing in the scientific community, with strong cloud feedback over the
Southern Ocean seemingly a key difference between the highest ECS models and
others.21
New complex climate models have been developed, some with a high warming in response to carbon dioxide. The reasons for this sensitivity are currently being investigated by the scientific community and should be treated with caution for now.
The understanding of the Earth’s climate sensitivity has developed in recent years with advances in several areas.
Climate sensitivity is an important metric for future climate change but has wide uncertainties.
Chapter 8: Scientific context for setting the UK’s Sixth Carbon Budget 362
However, several important caveats have already been identified suggesting caution
over their direct relevance for mitigation policy:
• Very high climate sensitivities can be difficult to reconcile with other lines of evidence
on how the climate responds to forcing. In particular, what we know about how the
climate was different in the Last Glacial Maximum (around 15,000 years ago) suggests
that values for ECS above 4.5°C are unlikely but doesn’t categorically rule them out.
• Some high sensitivity CMIP6 models struggle to accurately simulate the historical
period. The observed rate of warming since the 1980s, which better constrain climate sensitivity due to limited changes in aerosol radiative forcing over this period, is lower
than in many of the highest climate sensitivity models.22 However, this is not the case
for all high sensitivity models with some having a good historical simulation and still a
very high climate sensitivity due to non-linear cloud feedback mechanisms.23
• The equilibrium climate sensitivity is not necessarily the most directly policy relevant
metric of the climate response for this century. It is defined based on a fixed concentration of CO2 in the atmosphere so doesn’t include the effects of carbon
cycle and how it will change in the future. For alternative metrics of the climate
sensitivity that also incorporate carbon cycle responses many of the models with very
high equilibrium climate sensitivity do not lie outside of the assessed ranges from IPCC-
AR5.24
These caveats suggest caution in using the direct CMIP6 model outputs as representative
of the overall range of uncertainty in projections of future climate change, particularly as
the set of available models does not represent an attempt to sample the full range of
uncertainty in climate sensitivity in a structural way. An assessment of these new climate
models will be possible in the forthcoming IPCC Sixth Assessment Report, which we do not
try to pre-empt in this report.
ii) New synthesis of multiple lines of evidence
A recent effort from across the scientific community published in 2020 and
coordinated by the World Climate Research Programme (WCRP) has attempted
to synthesise several lines of evidence on climate sensitivity. It has proposed a
significant narrowing of the range of uncertainty in ECS (Figure 8.2 – right two
columns):25
• This study used constraints from multiple lines of evidence including
observed climate change, evidence from past climate states and
understanding the processes relevant for future climate system feedbacks.
This assessment does not directly rely on the estimates from complex
climate models.
• Combined together these lines of evidence suggest a central estimate for
ECS of 3.1°C, with a >66% probability of it lying in the range of 2.6 - 3.9°C,
narrower than the 1.5 – 4.5°C >66% probability range from IPCC-AR5.
Alternative statistical modelling assumptions in the calculation to estimate
ECS from the same data can extend the upper end of this >66% probability
interval up to 4.5°C, similar to the distribution based on new complex
climate models (‘WCRP uniform prior’ & ‘CMIP6’ – Figure 8.2).
• Values of climate sensitivity below 2°C were found hard to reconcile with all
the lines of evidence, while values above 4.5°C are difficult to reconcile
with what is known about how the climate changed around the Last
Glacial Maximum (around 15,000 years ago).
This WCRP estimate will be assessed, along with all other new studies, in the
forthcoming IPCC Sixth Assessment Report.
These new high sensitivity models will be comprehensively assessed by the IPCC in 2021.
A recent assessment looking at multiple kinds of evidence has proposed a significant narrowing of climate sensitivity uncertainties.
This study did not categorically rule out the possibility of very high climate sensitivity.
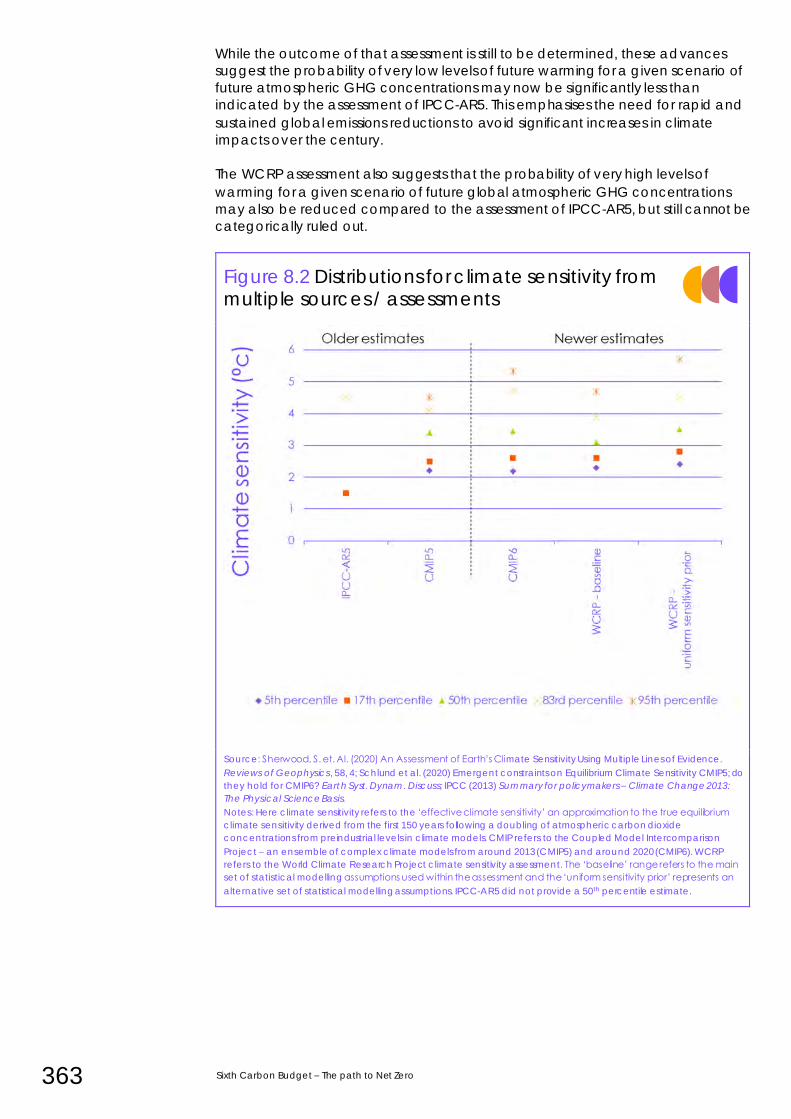
363 Sixth Carbon Budget – The path to Net Zero
While the outcome of that assessment is still to be determined, these advances
suggest the probability of very low levels of future warming for a given scenario of
future atmospheric GHG concentrations may now be significantly less than
indicated by the assessment of IPCC-AR5. This emphasises the need for rapid and
sustained global emissions reductions to avoid significant increases in climate
impacts over the century.
The WCRP assessment also suggests that the probability of very high levels of
warming for a given scenario of future global atmospheric GHG concentrations
may also be reduced compared to the assessment of IPCC-AR5, but still cannot be
categorically ruled out.
Figure 8.2 Distributions for climate sensitivity from multiple sources / assessments
Source: Sherwood, S. et. Al. (2020) An Assessment of Earth’s Climate Sensitivity Using Multiple Lines of Evidence.
Reviews of Geophysics, 58, 4; Schlund et al. (2020) Emergent constraints on Equilibrium Climate Sensitivity CMIP5; do
they hold for CMIP6? Earth Syst. Dynam. Discuss; IPCC (2013) Summary for policymakers – Climate Change 2013:
The Physical Science Basis.
Notes: Here climate sensitivity refers to the ‘effective climate sensitivity’ an approximation to the true equilibrium
climate sensitivity derived from the first 150 years following a doubling of atmospheric carbon dioxide
concentrations from preindustrial levels in climate models. CMIP refers to the Coupled Model Intercomparison
Project – an ensemble of complex climate models from around 2013 (CMIP5) and around 2020 (CMIP6). WCRP
refers to the World Climate Research Project climate sensitivity assessment. The ‘baseline’ range refers to the main
set of statistical modelling assumptions used within the assessment and the ‘uniform sensitivity prior’ represents an
alternative set of statistical modelling assumptions. IPCC-AR5 did not provide a 50th percentile estimate.
Chapter 8: Scientific context for setting the UK’s Sixth Carbon Budget 364
iii) Implications for climate projections under rapid global decarbonisation scenarios
We have worked with the UK Met Office (Box 8.4) to understand the implications of
these new WCRP estimates for climate sensitivity uncertainty on the range of
projected global warming under a global emissions scenario expected to keep
(median) warming to the Paris Agreement long-term temperature target range
according to the IPCC-SR1.5 assessment (Figure 8.3).*
Box 8.4 Modelling of implications of WCRP climate sensitivity distributions and additional Earth
System feedbacks for climate projections
We have worked with the UK Met Office to model the implications of the newly proposed
climate sensitivity distributions from the World Climate Research Programme (WCRP) study
under a rapid global decarbonisation scenario, and a global emissions pathway
consistent with current global emissions reduction ambition:
• These projections use a version of the MAGICC simple climate model, one of the two
simple climate models used to understand the climate implications of global emissions
pathways in the IPCC-SR1.5 report.26
• Distributions of model parameters for the physical climate response are chosen to be
consistent with prescribed climate sensitivity distributions from the WCRP assessment. Other parameters (e.g. carbon cycle responses) remain tuned to span the range of
responses consistent with the conventional use of MAGICC for probabilistic projections
of climate outcomes.
• Global emissions pathways for CO2, CH4 and N2O are taken from those produced
under modelling with the TIAM integrated assessment model (Chapter 7). Two
scenarios are considered: a scenario expected to be consistent with keeping median peak warming to around 1.75°C (based on IPCC-SR1.5 assessment of allowable future
cumulative CO2 emissions), and a scenario in which current 2030 emissions targets
(Nationally Determined Contributions – NDCs) are achieved and a similar level of
global emissions reduction ambition is maintained over the rest of the century. Pathways for other GHGs and aerosol emissions are estimated from relationships
between emissions of different gases across the range of scenarios assessed by IPCC-
SR1.5 with similar socioeconomic development assumptions.27
The effects of incorporating additional Earth system feedbacks that are not typically
included in the definition of climate sensitivity is also modelled:
• These processes include amplifying feedbacks such as the thawing of permafrost as
well as feedbacks that act to reduce climate change, such as the feedback of a
warming climate on the atmospheric lifetime of methane emissions. An initial estimate of the size of these additional climate feedbacks associated with these processes was
provided in the IPCC-AR5, but confidence remains low in many of them.28
• When combined, the net effect of these processes suggests an addit ional amplifying
climate feedback (median estimate), but with substantial uncertainty (spanning an
overall negative feedback through to a more strongly amplifying feedback). The
impact of these additional feedbacks on climate projections over the century is
assessed following published methods, within the same simple climate model.29
These additional feedbacks represent a potentially importance source of uncertainty in
projections of the future climate but are expected to be less important than uncertainty
in well-studied climate and carbon-cycle feedbacks (e.g. cloud feedback uncertainty)
for projections over the coming century.
* This is a scenario that sees rapid falls in global GHG emissions from 2020, with global CO2 emissions falling to Net Zero
around 2060. Based on the assessment of IPCC-SR1.5, this global emissions scenario would be expected to keep
median peak warming to around 1.75°C above preindustrial levels.
We have modelled the implications of the proposed narrowing of climate sensitivity uncertainty for global emissions scenarios expected to keep to the Paris Agreement.
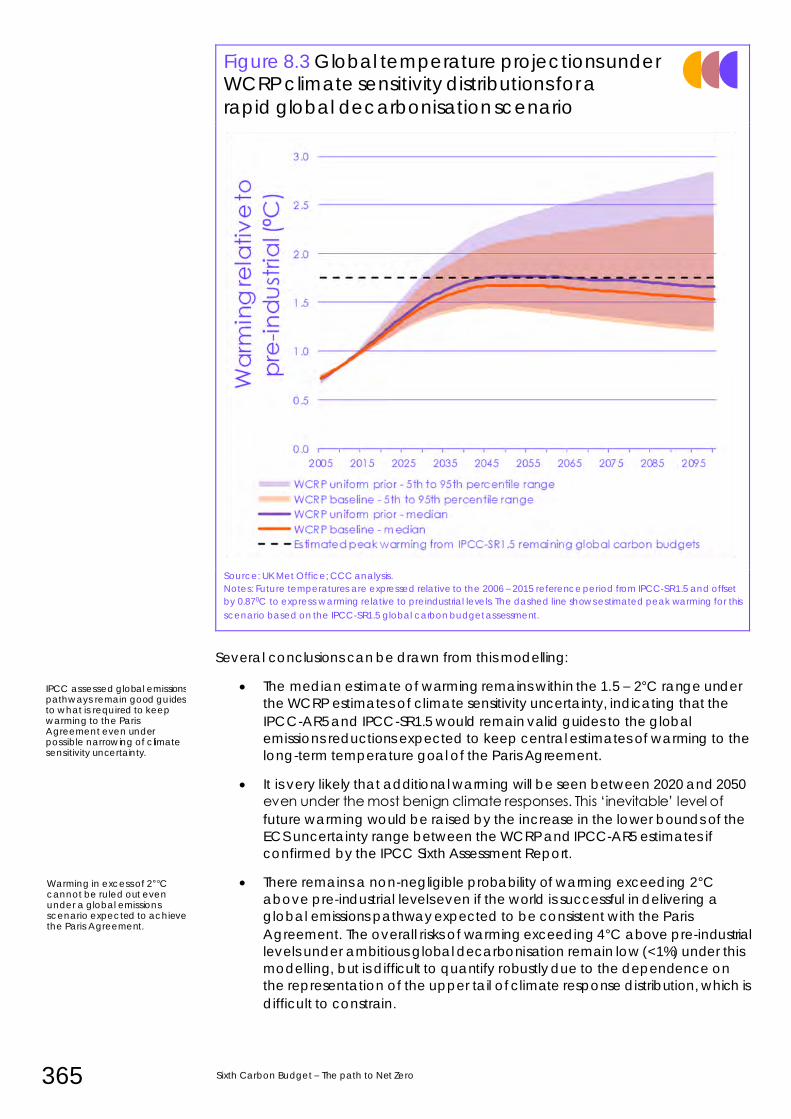
365 Sixth Carbon Budget – The path to Net Zero
Figure 8.3 Global temperature projections under WCRP climate sensitivity distributions for a
rapid global decarbonisation scenario
Source: UK Met Office; CCC analysis.
Notes: Future temperatures are expressed relative to the 2006 – 2015 reference period from IPCC-SR1.5 and offset
by 0.870C to express warming relative to preindustrial levels. The dashed line shows estimated peak warming for this
scenario based on the IPCC-SR1.5 global carbon budget assessment.
Several conclusions can be drawn from this modelling:
• The median estimate of warming remains within the 1.5 – 2°C range under
the WCRP estimates of climate sensitivity uncertainty, indicating that the
IPCC-AR5 and IPCC-SR1.5 would remain valid guides to the global
emissions reductions expected to keep central estimates of warming to the
long-term temperature goal of the Paris Agreement.
• It is very likely that additional warming will be seen between 2020 and 2050
even under the most benign climate responses. This ‘inevitable’ level of
future warming would be raised by the increase in the lower bounds of the
ECS uncertainty range between the WCRP and IPCC-AR5 estimates if
confirmed by the IPCC Sixth Assessment Report.
• There remains a non-negligible probability of warming exceeding 2°C
above pre-industrial levels even if the world is successful in delivering a
global emissions pathway expected to be consistent with the Paris
Agreement. The overall risks of warming exceeding 4°C above pre-industrial
levels under ambitious global decarbonisation remain low (<1%) under this
modelling, but is difficult to quantify robustly due to the dependence on
the representation of the upper tail of climate response distribution, which is
difficult to constrain.
IPCC assessed global emissions pathways remain good guides to what is required to keep warming to the Paris Agreement even under possible narrowing of climate sensitivity uncertainty.
Warming in excess of 2°°C cannot be ruled out even under a global emissions scenario expected to achieve the Paris Agreement.
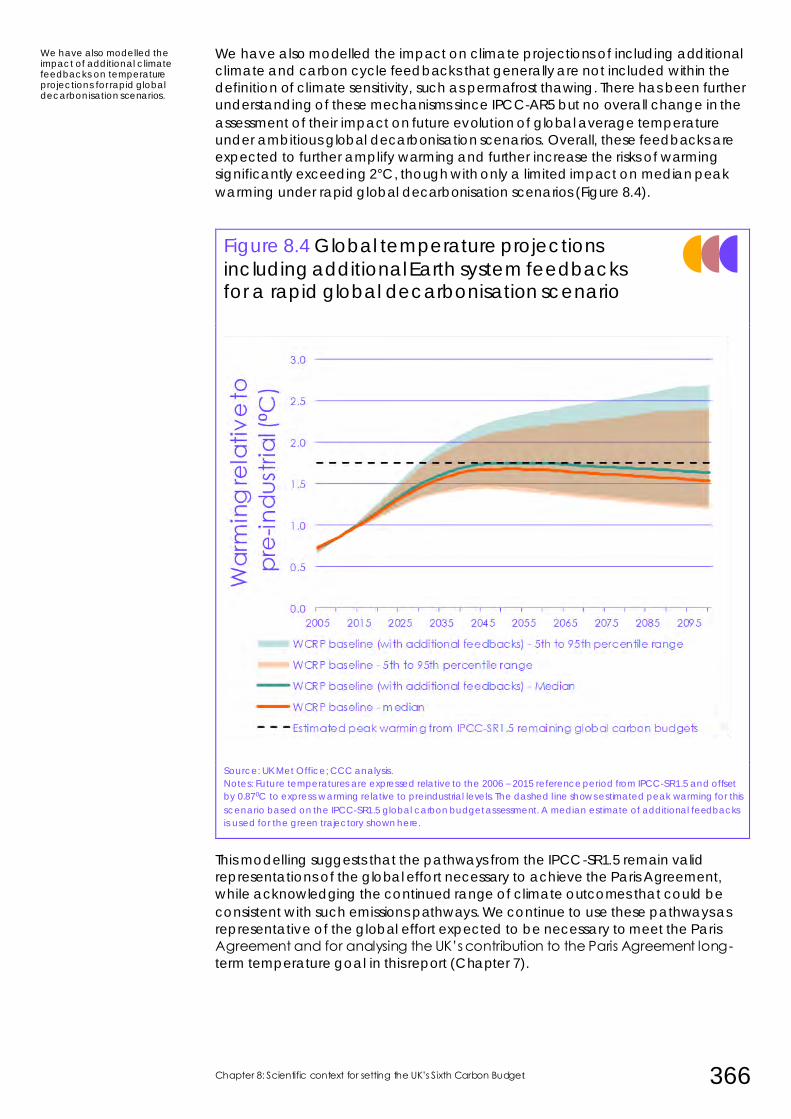
Chapter 8: Scientific context for setting the UK’s Sixth Carbon Budget 366
We have also modelled the impact on climate projections of including additional
climate and carbon cycle feedbacks that generally are not included within the
definition of climate sensitivity, such as permafrost thawing. There has been further
understanding of these mechanisms since IPCC-AR5 but no overall change in the
assessment of their impact on future evolution of global average temperature
under ambitious global decarbonisation scenarios. Overall, these feedbacks are
expected to further amplify warming and further increase the risks of warming
significantly exceeding 2°C, though with only a limited impact on median peak
warming under rapid global decarbonisation scenarios (Figure 8.4).
Figure 8.4 Global temperature projections
including additional Earth system feedbacks for a rapid global decarbonisation scenario
Source: UK Met Office; CCC analysis.
Notes: Future temperatures are expressed relative to the 2006 – 2015 reference period from IPCC-SR1.5 and offset
by 0.870C to express warming relative to preindustrial levels. The dashed l ine shows estimated peak warming for this
scenario based on the IPCC-SR1.5 global carbon budget assessment. A median estimate of additional feedbacks
is used for the green trajectory shown here.
This modelling suggests that the pathways from the IPCC-SR1.5 remain valid
representations of the global effort necessary to achieve the Paris Agreement,
while acknowledging the continued range of climate outcomes that could be
consistent with such emissions pathways. We continue to use these pathways as
representative of the global effort expected to be necessary to meet the Paris
Agreement and for analysing the UK’s contribution to the Paris Agreement long-
term temperature goal in this report (Chapter 7).
We have also modelled the impact of additional climate feedbacks on temperature projections for rapid global decarbonisation scenarios.
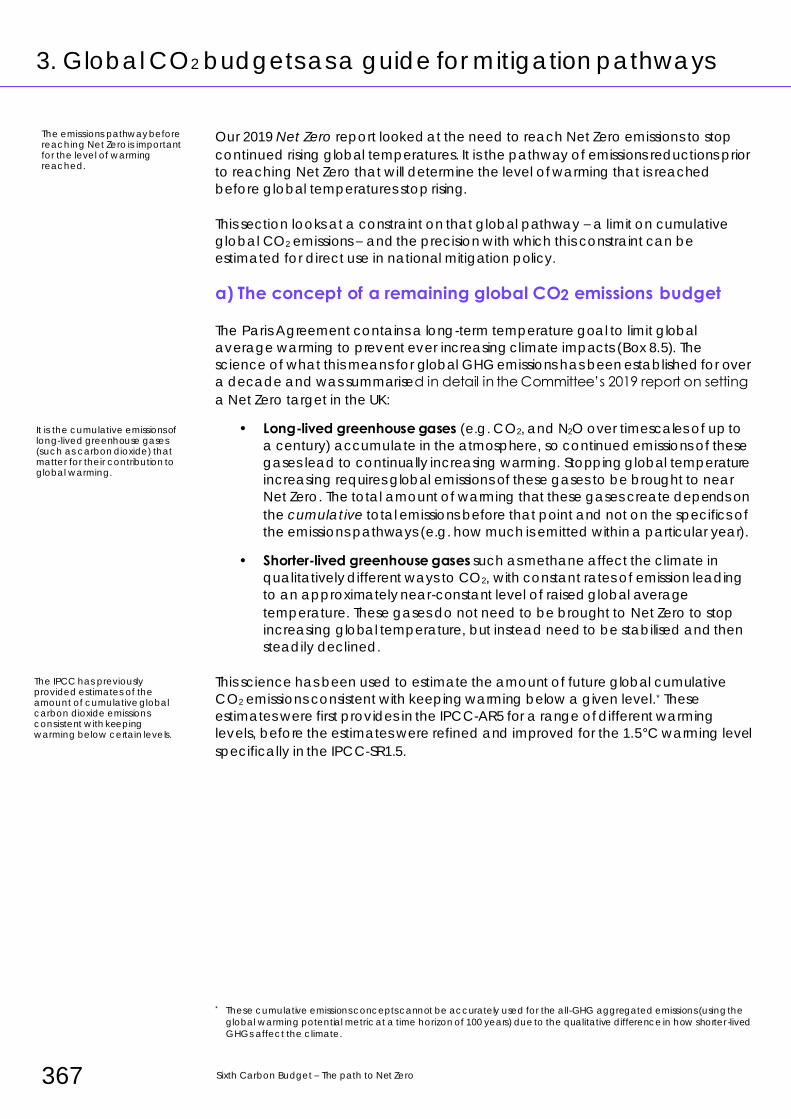
367 Sixth Carbon Budget – The path to Net Zero
3. Global CO2 budgets as a guide for mitigation pathways
Our 2019 Net Zero report looked at the need to reach Net Zero emissions to stop
continued rising global temperatures. It is the pathway of emissions reductions prior
to reaching Net Zero that will determine the level of warming that is reached
before global temperatures stop rising.
This section looks at a constraint on that global pathway – a limit on cumulative
global CO2 emissions – and the precision with which this constraint can be
estimated for direct use in national mitigation policy.
a) The concept of a remaining global CO2 emissions budget
The Paris Agreement contains a long-term temperature goal to limit global
average warming to prevent ever increasing climate impacts (Box 8.5). The
science of what this means for global GHG emissions has been established for over
a decade and was summarised in detail in the Committee’s 2019 report on setting
a Net Zero target in the UK:
• Long-lived greenhouse gases (e.g. CO2, and N2O over timescales of up to
a century) accumulate in the atmosphere, so continued emissions of these
gases lead to continually increasing warming. Stopping global temperature
increasing requires global emissions of these gases to be brought to near
Net Zero. The total amount of warming that these gases create depends on
the cumulative total emissions before that point and not on the specifics of
the emissions pathways (e.g. how much is emitted within a particular year).
• Shorter-lived greenhouse gases such as methane affect the climate in
qualitatively different ways to CO2, with constant rates of emission leading
to an approximately near-constant level of raised global average
temperature. These gases do not need to be brought to Net Zero to stop
increasing global temperature, but instead need to be stabilised and then
steadily declined.
This science has been used to estimate the amount of future global cumulative
CO2 emissions consistent with keeping warming below a given level.* These
estimates were first provides in the IPCC-AR5 for a range of different warming
levels, before the estimates were refined and improved for the 1.5°C warming level
specifically in the IPCC-SR1.5.
* These cumulative emissions concepts cannot be accurately used for the all-GHG aggregated emissions (using the
global warming potential metric at a time horizon of 100 years) due to the qualitative difference in how shorter -lived
GHGs affect the climate.
The emissions pathway before reaching Net Zero is important for the level of warming reached.
It is the cumulative emissions of long-lived greenhouse gases (such as carbon dioxide) that matter for their contribution to global warming.
The IPCC has previously provided estimates of the amount of cumulative global carbon dioxide emissions consistent with keeping warming below certain levels.
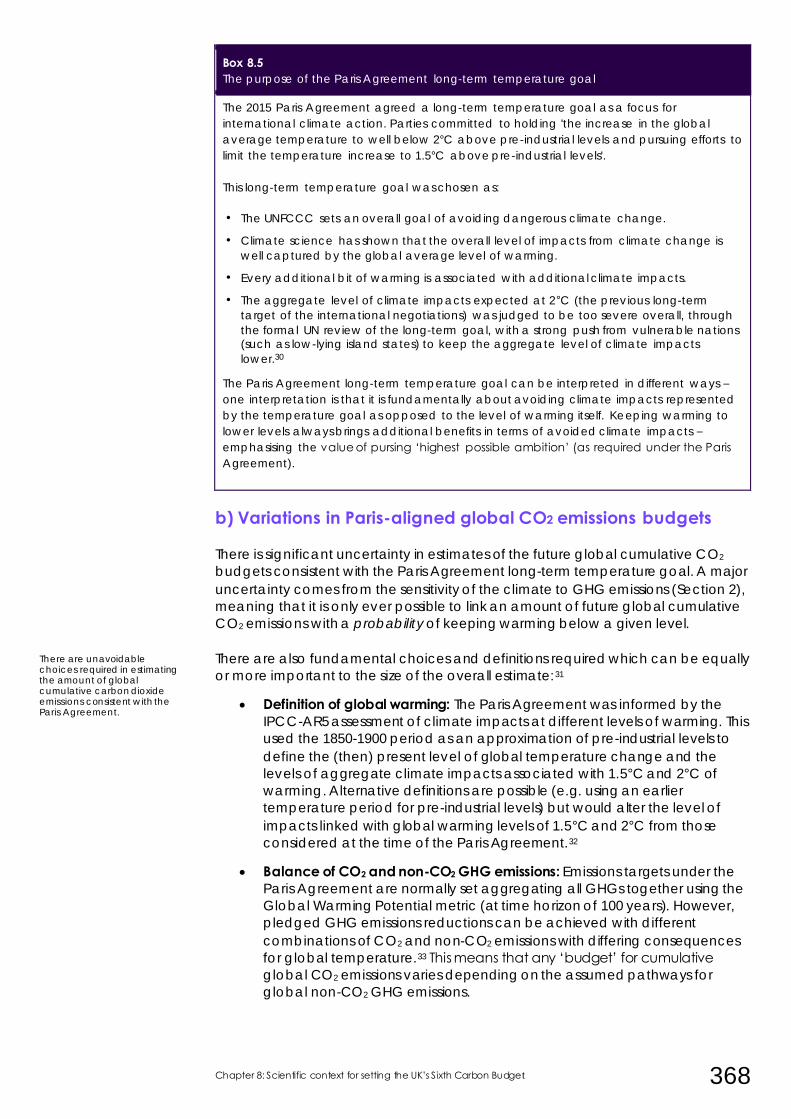
Chapter 8: Scientific context for setting the UK’s Sixth Carbon Budget 368
Box 8.5 The purpose of the Paris Agreement long-term temperature goal
The 2015 Paris Agreement agreed a long-term temperature goal as a focus for
international climate action. Parties committed to holding 'the increase in the global
average temperature to well below 2°C above pre-industrial levels and pursuing efforts to
limit the temperature increase to 1.5°C above pre-industrial levels'.
This long-term temperature goal was chosen as:
• The UNFCCC sets an overall goal of avoiding dangerous climate change.
• Climate science has shown that the overall level of impacts from climate change is
well captured by the global average level of warming.
• Every additional bit of warming is associated with additional climate impacts.
• The aggregate level of climate impacts expected at 2°C (the previous long-term
target of the international negotiations) was judged to be too severe overall, through
the formal UN review of the long-term goal, with a strong push from vulnerable nations (such as low-lying island states) to keep the aggregate level of climate impacts
lower.30
The Paris Agreement long-term temperature goal can be interpreted in different ways –
one interpretation is that it is fundamentally about avoiding climate impacts represented
by the temperature goal as opposed to the level of warming itself. Keeping warming to
lower levels always brings additional benefits in terms of avoided climate impacts –
emphasising the value of pursing ‘highest possible ambition’ (as required under the Paris
Agreement).
b) Variations in Paris-aligned global CO2 emissions budgets
There is significant uncertainty in estimates of the future global cumulative CO2
budgets consistent with the Paris Agreement long-term temperature goal. A major
uncertainty comes from the sensitivity of the climate to GHG emissions (Section 2),
meaning that it is only ever possible to link an amount of future global cumulative
CO2 emissions with a probability of keeping warming below a given level.
There are also fundamental choices and definitions required which can be equally
or more important to the size of the overall estimate:31
• Definition of global warming: The Paris Agreement was informed by the
IPCC-AR5 assessment of climate impacts at different levels of warming. This
used the 1850-1900 period as an approximation of pre-industrial levels to
define the (then) present level of global temperature change and the
levels of aggregate climate impacts associated with 1.5°C and 2°C of
warming. Alternative definitions are possible (e.g. using an earlier
temperature period for pre-industrial levels) but would alter the level of
impacts linked with global warming levels of 1.5°C and 2°C from those
considered at the time of the Paris Agreement.32
• Balance of CO2 and non-CO2 GHG emissions: Emissions targets under the
Paris Agreement are normally set aggregating all GHGs together using the
Global Warming Potential metric (at time horizon of 100 years). However,
pledged GHG emissions reductions can be achieved with different
combinations of CO2 and non-CO2 emissions with differing consequences
for global temperature.33 This means that any ‘budget’ for cumulative
global CO2 emissions varies depending on the assumed pathways for
global non-CO2 GHG emissions.
There are unavoidable choices required in estimating the amount of global cumulative carbon dioxide emissions consistent with the Paris Agreement.
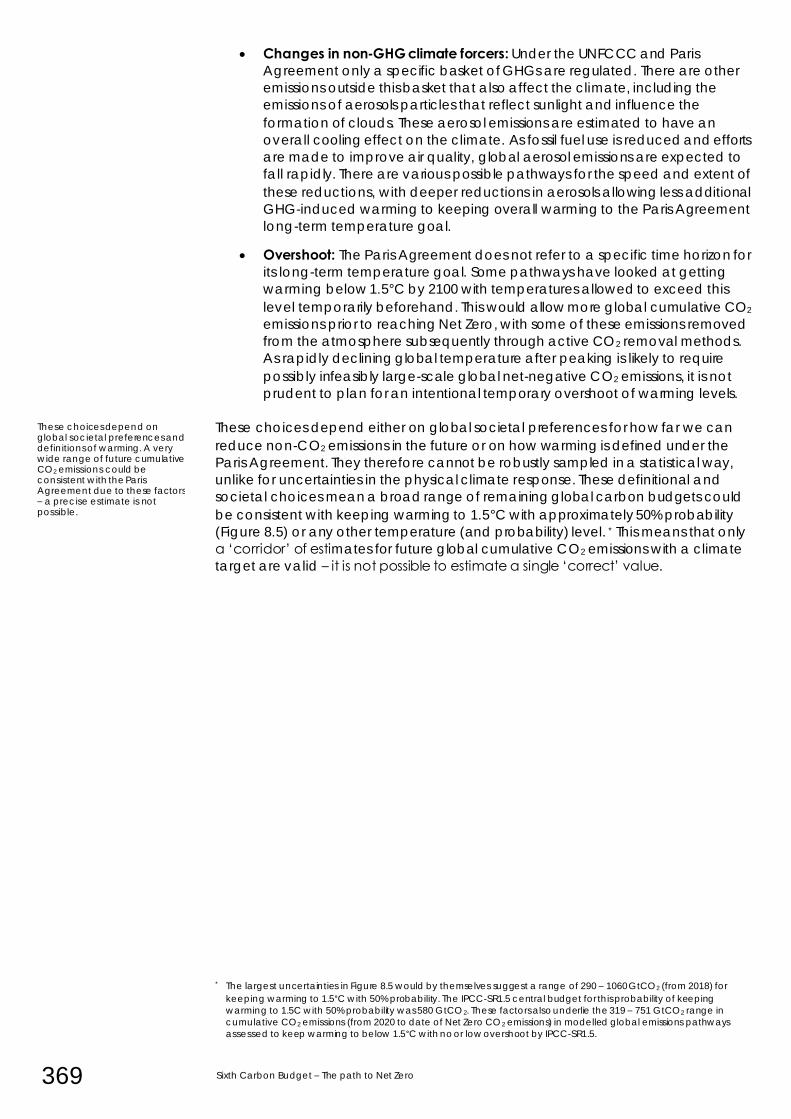
369 Sixth Carbon Budget – The path to Net Zero
• Changes in non-GHG climate forcers: Under the UNFCCC and Paris
Agreement only a specific basket of GHGs are regulated. There are other
emissions outside this basket that also affect the climate, including the
emissions of aerosols particles that reflect sunlight and influence the
formation of clouds. These aerosol emissions are estimated to have an
overall cooling effect on the climate. As fossil fuel use is reduced and efforts
are made to improve air quality, global aerosol emissions are expected to
fall rapidly. There are various possible pathways for the speed and extent of
these reductions, with deeper reductions in aerosols allowing less additional
GHG-induced warming to keeping overall warming to the Paris Agreement
long-term temperature goal.
• Overshoot: The Paris Agreement does not refer to a specific time horizon for
its long-term temperature goal. Some pathways have looked at getting
warming below 1.5°C by 2100 with temperatures allowed to exceed this
level temporarily beforehand. This would allow more global cumulative CO2
emissions prior to reaching Net Zero, with some of these emissions removed
from the atmosphere subsequently through active CO2 removal methods.
As rapidly declining global temperature after peaking is likely to require
possibly infeasibly large-scale global net-negative CO2 emissions, it is not
prudent to plan for an intentional temporary overshoot of warming levels.
These choices depend either on global societal preferences for how far we can
reduce non-CO2 emissions in the future or on how warming is defined under the
Paris Agreement. They therefore cannot be robustly sampled in a statistical way,
unlike for uncertainties in the physical climate response. These definitional and
societal choices mean a broad range of remaining global carbon budgets could
be consistent with keeping warming to 1.5°C with approximately 50% probability
(Figure 8.5) or any other temperature (and probability) level. * This means that only
a ‘corridor’ of estimates for future global cumulative CO2 emissions with a climate
target are valid – it is not possible to estimate a single ‘correct’ value.
* The largest uncertainties in Figure 8.5 would by themselves suggest a range of 290 – 1060 GtCO2 (from 2018) for
keeping warming to 1.5°C with 50% probability. The IPCC-SR1.5 central budget for this probability of keeping
warming to 1.5C with 50% probability was 580 GtCO2. These factors also underlie the 319 – 751 GtCO2 range in
cumulative CO2 emissions (from 2020 to date of Net Zero CO2 emissions) in modelled global emissions pathways
assessed to keep warming to below 1.5°C with no or low overshoot by IPCC-SR1.5.
These choices depend on global societal preferences and definitions of warming. A very wide range of future cumulative CO2 emissions could be consistent with the Paris Agreement due to these factors – a precise estimate is not possible.
Chapter 8: Scientific context for setting the UK’s Sixth Carbon Budget 370
Figure 8.5 Variations in future global cumulative CO2 emissions for keeping warming to 1.50C
Source: IPCC (2018) Special Report on Global Warming of 1.50C; CCC analysis.
Notes: A remaining cumulative emissions budget of 580 GtCO2 (from 2018 onwards) from IPCC-SR1.5 is used as a
reference case to express these changes against (consistent with a 50% chance of keeping warming to this level
when allowing for physical response uncertainties). Impacts on the remaining emissions budget is calculated for
alternative non-CO2 and non-GHG effects using the methodology in Section 2. SM. 112 of IPCC-SR1.5 Chapter 2.
The minimum and maximum reductions across the ensemble of scenarios assessed to be consistent with keeping
warming to 1.50C with no or low overshoot used. A log-normal distribution is used to assess the impact of an
alternative shape for the climate response distribution. The impact of using an earlier period for preindustrial is
quantified using an quantified using an additional 0.10C of historical warming. Budgets using an alternative
definition of global temperature are taken from IPCC-SR1.5.
c) Implications for national pathways to Net Zero
The unavoidable dependence of estimates of remaining global future cumulative
CO2 budgets consistent with the Paris Agreement on societal choices, create large
variations in the estimates for budgets expected to be consistent with the Paris
Agreement long-term temperature goal.
This limits the utility of using global remaining cumulative emissions budgets to
directly constrain the UK’s emissions trajectory towards the 2050 Net Zero target:
• The many different totals for future global cumulative CO2 emissions that
could be consistent with the Paris Agreement long-term temperature goal
span a very large range and do not provide an unambiguous global
starting point for allocating shares to countries.
• Allocating shares to countries requires additional considerations of
common-but-differentiated responsibilities and respective capabilities in
light of national circumstances, as required under the Paris Agreement. This
introduces a further set of choices and value judgements (Chapter 7).
There are limitations on the use of global CO2 budgets to constrain national emissions pathways in a robust way.
371 Sixth Carbon Budget – The path to Net Zero
• UK carbon budgets are set on an aggregated all-GHG emissions basis and
not using CO2 (or long-lived GHG) emissions alone. Global cumulative
emissions budgets are only robustly defined for CO2 and other long-lived
GHGs and not for cumulative aggregated emissions of all GHG emissions.*
The Paris Agreement does not attempt to allocate remaining global cumulative
CO2 emissions estimates to individual countries, but rather requires ‘highest possible
ambition’ from all parties, and that parties put forward commitments that reflect
their common-but-differentiated responsibilities and respective capabilities. We
consider that a sensible approach in the face of the uncertainties and boundaries
of the science and have designed the analysis in this report on that basis.
* When using the Global Warming Potential metric which is standard practice for international GHG accounting and
emissions inventories.
We do not attempt to use these global budgets to derive the UK’s emissions pathway in this advice.
Chapter 8: Scientific context for setting the UK’s Sixth Carbon Budget 372
4. Minimising the UK’s future contribution to climate change
Our advice on setting a Net Zero target in the UK highlighted that reaching Net
Zero GHG emissions in the UK would be consistent with stopping the UK’s
contribution to increasing global temperature (from its territorial emissions) and
beginning to reduce its all-time impact on the global average temperature.
Section 3 highlighted that it is the pathway of global emissions reductions prior to
Net Zero that will determine the amount of warming before global temperature
peaks:
• For long-lived GHG emissions (such as carbon dioxide and nitrous oxide)
the cumulative total emissions prior to reaching Net Zero mainly determines
how emissions of these GHGs contribute to peak global temperatures.
• For shorter-lived GHG emissions (such as methane) the rate of emissions
over the few decades prior to global temperature peaking mainly
determines the contribution from these gases to peak warming.34 As peak
warming occurs around 2050 for scenarios consistent with keeping warming
below 1.5°C, this requires near-term reductions in these emissions to
minimise their contribution to peak warming.
Rapid and sustained reductions in both long-lived and shorter-lived GHG emissions
will be needed over the several decades for the world to keep additional warming
sufficiently low to keep within the warming limits of the Paris Agreement.
Well-mixed GHG emissions affect the climate similarly independent of where they
are emitted, so these principles also apply to the UK’s contribution to global
temperature increase (from its territorial emissions) prior to reaching Net Zero by
2050:
• Reaching Net Zero emissions by 2050 with no near-term action to
substantially reduce emissions prior to 2030 would lead to a significantly
higher warming contribution from UK territorial emissions than under the
range of exploratory pathways developed within this report, all of which
prioritise early reductions in emissions where possible (Figure 8.6).
• If this delay of ambition was replicated globally it would be close to
impossible to achieve the 1.5°C end of the Paris Agreement long-term
temperature goal, as all modelled global pathways require significant
reductions this decade to keep the required post-2030 reductions within the
limit of what might be feasible.
Pathways attempting to reach Net Zero by 2050 without early action to reduce
emissions would also carry substantial risks of failing to achieve the target,
challenges in delivering the low-emissions transition in a just way, and would not
capture the economic opportunities and co-benefits that actions over the next
decade are expected to bring (Chapter 9). It would also seriously undermine the
efforts to achieve the necessary increase in global near-term ambition given the
UK’s role as host of COP26.
Delivering on the Paris Agreement requires rapid global reductions in emissions in the near-term as well as plans to reach Net Zero.
Minimising UK cumulative emissions of long-lived greenhouse gases on the pathway to Net Zero will help to minimise the UK’s contribution to climate change.
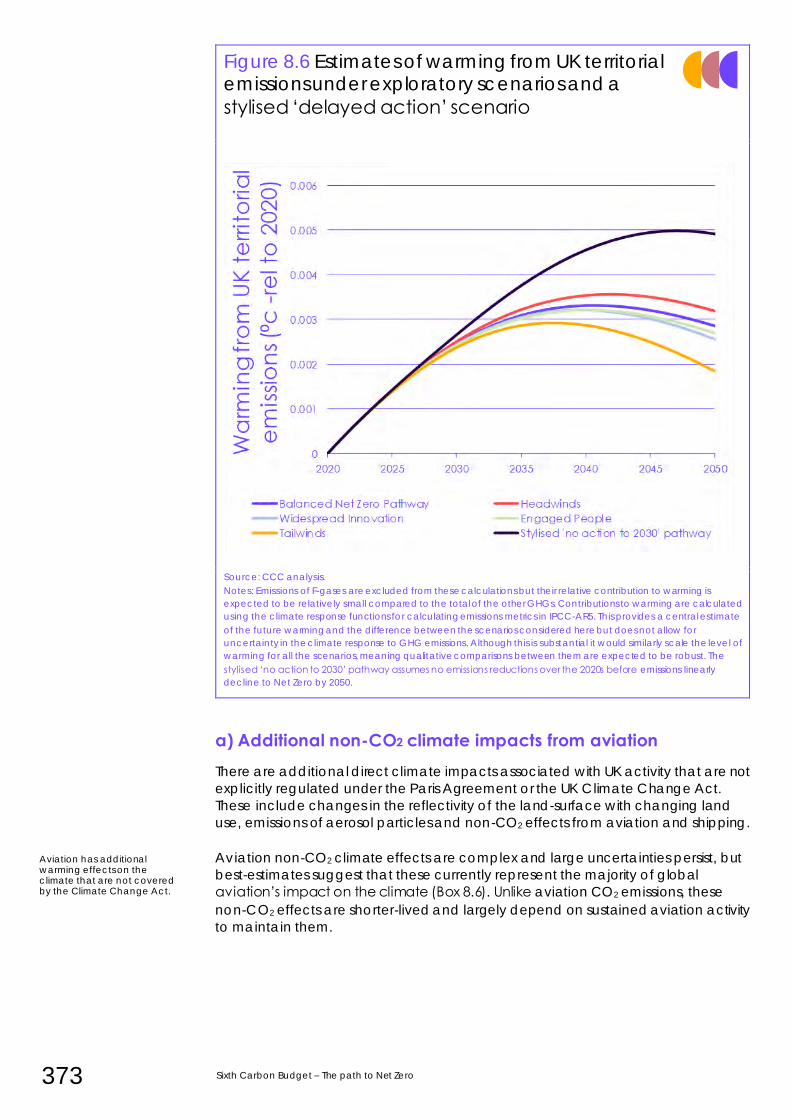
373 Sixth Carbon Budget – The path to Net Zero
Figure 8.6 Estimates of warming from UK territorial emissions under exploratory scenarios and a
stylised ‘delayed action’ scenario
Source: CCC analysis.
Notes: Emissions of F-gases are excluded from these calculations but their relative contribution to warming is
expected to be relatively small compared to the total of the other GHGs. Contributions to warming are calculated
using the climate response functions for calculating emissions metrics in IPCC-AR5. This provides a central estimate
of the future warming and the difference between the scenarios considered here but does not allow for
uncertainty in the climate response to GHG emissions. Although this is substantial it would similarly scale the level of
warming for all the scenarios, meaning qualitative comparisons between them are expected to be robust. The
stylised ‘no action to 2030’ pathway assumes no emissions reductions over the 2020s before emissions linearly
decline to Net Zero by 2050.
a) Additional non-CO2 climate impacts from aviation There are additional direct climate impacts associated with UK activity that are not
explicitly regulated under the Paris Agreement or the UK Climate Change Act.
These include changes in the reflectivity of the land-surface with changing land
use, emissions of aerosol particles and non-CO2 effects from aviation and shipping.
Aviation non-CO2 climate effects are complex and large uncertainties persist, but
best-estimates suggest that these currently represent the majority of global
aviation’s impact on the climate (Box 8.6). Unlike aviation CO2 emissions, these
non-CO2 effects are shorter-lived and largely depend on sustained aviation activity
to maintain them.
Aviation has additional warming effects on the climate that are not covered by the Climate Change Act.
Chapter 8: Scientific context for setting the UK’s Sixth Carbon Budget 374
Box 8.6 The science of aviation non-CO2 climate impacts
Aviation produces a range of non-CO2 pollutants that affect the climate in different
ways. These include emissions that have a warming effect, such as nitrogen oxides, and
those that have a cooling effect, such as sulphates.
Planes can also create contrails (long trails of cloud caused by aircraft flying through
supersaturated air) depending on the local atmospheric conditions. These high-altitude
contrails can help the formation of cirrus clouds, which have a relatively large warming
effect on the global surface air temperature.
A new study has provided an updated synthesis of the effects of global aviation on the
climate:35
• Overall, the net aviation non-CO2 effect is to warm the climate. Globally, non-CO2
effects contribute around two-thirds of the total aviation effective radiative forcing – twice as much as historical CO2 emissions from aviation. The dominant non-CO2 effects
are found to be those from the formation of contrail-induced cirrus clouds, followed by
the net effect of the emission of nitrogen oxides on atmospheric chemistry.
• These non-CO2 effects are generally short-lived, meaning that if aviation emissions
were stopped then their effects on the climate will quickly dissipate. In contrast, CO 2
emissions from aviation will result in elevated atmospheric CO2 concentrations for
centuries into the future.
• Some possible aviation non-CO2 effects remain unquantified. The effect of particulate emissions on the reflectivity of low clouds are still too difficult to quantify but might be
a cooling effect that offsets a significant fraction of aviation non-CO2 warming from
other sources.
It remains extremely challenging to accurately aggregate the effects of these non-CO2
impacts into a CO2-equivalence ‘multiplier’ for use within climate policy mechanisms.
These effects still have significant uncertainties associated with them and their size can
depend on the conditions under which the activity occurs, unlike for well-mixed
greenhouse gases which affect the climate similarly independently of where they occur.
Efforts to reduce aviation non-CO2 effects will help to lower peak levels of global warming
if implemented prior to the date of global Net Zero CO2 emissions (e.g. around 2050-2075
for pathways that meet the Paris Agreement long-term temperature goal), provided
these are not achieved at the expense of additional CO2 emissions (which would create
more warming in the long-term).
The future evolution of UK aviation non-CO2 effects will depend strongly on the
trajectory of UK aviation demand (Box 8.7). In the absence of technological
breakthroughs that can help mitigate aviation non-CO2 effects, scenarios that
keep aviation demand lower will sustain lower non-CO2 warming than those with
higher aviation demands.* It is therefore not appropriate to apply a fixed ratio or
multiplier to estimate non-CO2 impacts as part of the single basket of GHG
emissions. However, the UK should attempt to report annually a best estimate of
the impact of these non-CO2 effects on global temperatures, as they are a
significant part of aviation’s impact on the climate.
For consistency with the Net Zero target, under which UK GHG emissions are
reduced to Net Zero to stop contributing to further increases in global temperature
by 2050, UK aviation non-CO2 effects should also target stopping contributing to
further increases in global temperature by this same date. Without the
development of mitigation options for these non-CO2 effects, this would require
year-on-year demand growth to be reduced to essentially zero by or before 2050.
* Scenarios in which people are most willing to change their behaviour and fly the least would keep non-CO2
warming from UK aviation below 2018 levels in 2050.
How UK aviation non-CO2 warming changes in the future depends strongly on the future pathway for aviation demand.
UK aviation non-CO2 warming should be capped by or before 2050 to align to the ambition of ending the UK’s contribution to global warming by 2050.
Globally, non-CO2 effects from aviation contribute about two-thirds of the total aviation radiative forcing.
375 Sixth Carbon Budget – The path to Net Zero
Box 8.7 Future UK aviation non-CO2 climate impacts
We have projected best estimates of the change in non-CO2 warming from UK aviation
consistent with our exploratory scenarios to 2050 for aviation demand and GHG emissions.
These estimates rely on the latest synthesis of aviation non-CO2 effects.36
In 2020, there has been an estimated 60% drop in UK air travel due to COVID-19
compared to 2019 levels. The short-lived nature of aviation non-CO2 effects means a
similar percentage reduction in the radiative forcing from aviation non-CO2 effects will
have also occurred this year.
There are significant variations in 2050 aviation non-CO2 warming across our exploratory
scenarios, largely depending on the assumed long-term future aviation demand (Figure
B8.7):
• A Baseline trajectory with high growth in activity would see a significant growth in
aviation non-CO2 impacts by 2050, rising by 45% from the level of warming sustained
by UK aviation non-CO2 emissions in 2018.
• Demand management consistent with Headwinds and Balanced Net Zero Pathwayscenarios limits future demand growth but would still see the warming sustained by
non-CO2 effects increase by 7-14% by 2050 compared to 2018.
• The Widespread Innovation scenario reduces aviation GHG emissions through
sustainable aviation fuels and higher efficiency, allowing higher demand than in the
Balanced Net Zero Pathway. However, without additional mitigation options to reduce
non-CO2 effects, this scenario would mean a 24% increase in non-CO2 warming by
2050 from 2018 levels.
• In Widespread Engagement and Tailwinds, there is declining demand, which leads tothe warming sustained by non-CO2 aviation effects falling to 14-19% below 2018 levels
by 2050.
In these scenarios we have not explicitly modelled other technologies that could reduce
non-CO2 effects (except for electrification), due to the current lack of a robust evidence
base in this area.
Potential options being explored include use of low-aromatic sustainable aviation fuels
(to reduce soot and therefore cirrus formation), development of low NOx engine designs,
re-routing of aircraft to avoid cirrus formation zones in the atmosphere (although this
would require more accurate forecasting, and may increase CO2 emissions), or switching
to electric propulsion or cleaner fuels in these zones.
Further research and testing are required to quantify the potential of these mitigation
options, although early stage analysis suggests that they may be able to reduce UK
aviation non-CO2 warming effects in 2050 by 5-20 percentage-points.
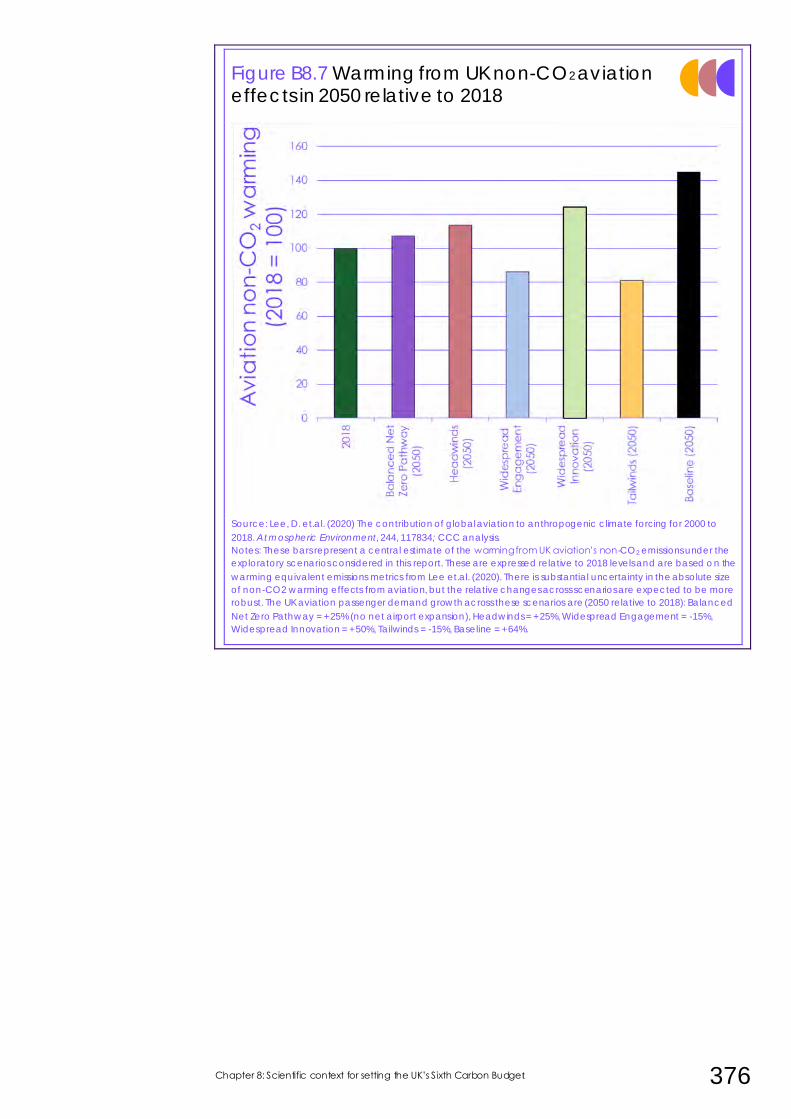
Chapter 8: Scientific context for setting the UK’s Sixth Carbon Budget 376
Figure B8.7 Warming from UK non-CO2 aviation effects in 2050 relative to 2018
Source: Lee, D. et.al. (2020) The contribution of global aviation to anthropogenic climate forcing for 2000 to
2018. Atmospheric Environment, 244, 117834; CCC analysis.
Notes: These bars represent a central estimate of the warming from UK aviation’s non-CO2 emissions under the
exploratory scenarios considered in this report. These are expressed relative to 2018 levels and are based on the
warming equivalent emissions metrics from Lee et.al. (2020). There is substantial uncertainty in the absolute size
of non-CO2 warming effects from aviation, but the relative changes across scenarios are expected to be more
robust. The UK aviation passenger demand growth across these scenarios are (2050 relative to 2018): Balanced
Net Zero Pathway = +25% (no net airport expansion), Headwinds = +25%, Widespread Engagement = -15%,
Widespread Innovation = +50%, Tailwinds = -15%, Baseline = +64%.
377 Sixth Carbon Budget – The path to Net Zero
5. The need to adapt to a changing climate
This section summarises the evidence that indicates climate impacts will continue
to increase even under a rapid reduction in global emissions and could be greater
still if global emissions reductions are not sufficiently rapid to achieve the Paris
Agreement.
This emphasises the need for the UK to adapt to the effects of a changing climate
and support climate-vulnerable countries around the world to adapt to climate
impacts as part of its contribution to the global effort to address climate change.
Planning for a range of climate outcomes is prudent even while also aiming to
achieve the Paris Agreement.
a) Climate risks continue to increase with additional warming
The overall level of impacts from climate change will increase with every
additional small increment in warming.
A growing body of research, summarised by the recent IPCC Special Reports and
Fifth Assessment Report, shows how higher levels of warming levels result in
increasingly severe and pervasive impacts with effects on humans and ecosystems
worldwide.
• 1°C above preindustrial levels: Today’s level of warming is already having
significant impacts around the world. The frequency of heatwaves has
increased in most land regions.37 There are demonstrable impacts on heat-
related mortality particularly for elderly and vulnerable people.38 Patterns of
water availability are changing due to melting land-ice and shifting rainfall
in some parts of the world. The frequency and intensity of heavy
precipitation has increased at a global scale due to climate change, with
knock-on implications for flood risks. Flooding is also increasing in coastal
areas as climate change pushes up sea-levels. Climate change is being
increasingly linked with making the conditions for wildfires more likely.39
Ecosystems and species have been impacted by climate change, with
many species changing their geographical extent and/or migratory
patterns. Climate change has affected crop yields, with more negative
impacts than positive effects.40
• 1.5°C above preindustrial levels: Impacts at 1.5°C warming will be more
severe than at present. Hot temperature extremes will increase more
rapidly than the global average temperature, and over twice as fast in
some parts of the world (e.g. mid-latitude summers). Across the globe there
would be around twice as many people affected by river flooding than
over the recent past.41 The intensity and frequency of heavy rainfall will
generally increase. Around 6% of insects, 4% of vertebrates, and 8% of
plants would lose >50% of their current species ranges.42 There will be very
large impacts on some ecosystems (e.g. coral reefs are projected to
decline by a further 70–90% at 1.5°C).
2°C above preindustrial levels: At 2°C warming many regions will
experience considerable and damaging climate change impacts
including extreme weather and associated detrimental effects on water
availability and food production. Heat-related mortality risks increase
beyond the risks at 1.5°C. Across the globe there would be around a 170%
increase in the number of people affected by river flooding than over the
Climate impacts increase with every bit of additional warming.
Significant climate impacts are already being experienced today.
Chapter 8: Scientific context for setting the UK’s Sixth Carbon Budget 378
recent past. Widespread damage to ecosystems would occur with the rate
of climate change likely too fast for many species to be able to migrate to
regions with compatible climates. Around 18% of insects, 8% of vertebrates,
and 16% of plants would lose >50% of their geographical range. The risk of
irreversible loss of many marine and coastal ecosystems (e.g. coral reefs)
increases significantly for warming at 2°C and above. Risks of 'large-scale
singularities' in the climate system (e.g. triggering inevitable loss of major ice
sheets or collapse in the Atlantic meridional overturning circulation) would
be ‘moderate’ at this level of warming.
• 3°C above preindustrial levels: Major and severe impacts would be
experienced worldwide. For example heat waves would become
prevalent across large parts of the world, with around 4.5 billion people
exposed to associated serious health risks.43 Risks to land-based ecosystems
would be very high with around 25% of species expected to lose over half
of their geographical range by 2100.44 There would be a high risk of 'large-
scale singular events' at 3°C.
• 4°C above preindustrial levels: Warming and increases in humidity in many
regions could make outdoor working, for example in agriculture, very
difficult or even impossible based on people’s current tolerance to heat
extremes. Many freshwater and land-based species would face substantial
risk of extinction. Large risks to the functioning of the global food system
could occur with a substantial chance of large-scale crop failures. Large-
scale failures of food systems and increases in climate-related extreme
events could contribute to large-scale migration of people around the
world creating pressures on social and economic systems with difficult to
predict geopolitical consequences.
Any additional warming is associated with increases in climate change impacts.
Poorer and more vulnerable parts of society are expected to be relatively more
exposed to impacts from many of these increasing climate risks. However, the UK is
not immune from these risks and needs to adapt to the changing climate, even for
the lower levels of warming. Box 8.8 summarises the impact of different levels of
global average warming for the UK.
Box 8.8 Climate change risks for the UK under different global warming levels
The UK is experiencing climate change impacts today which are predicted to increase
further under additional future global warming. The UK Climate Change Risk Assessment
(CCRA) provides a regular assessment of the climate risks (and opportunities) associated
with different levels of global average warming:
• Current warming level (~1.1°C above preindustrial levels): The UK’s average annual temperature has increased by around 1.2°C relative to pre-industrial levels, sea level
has risen by ~16 cm since 1900, there is some evidence of increasing heavy rainfall
depending on the metric used. The likelihood of summer heatwaves such as that in
2018 has doubled over the past few decades.
• Less than 2°C above preindustrial levels: If global average warming is kept to the long-
term temperature goal of the Paris Agreement, the UK is predicted to experience increased average annual temperatures of around 0.6°C by 2050, heavy rainfall
would see an estimated 10% increase, and hot summers like 2018 will occur every
other year (central estimates). Sea levels around the UK would rise by a further 3 - 37
cm (by 2060) compared to today and due to the slow response of the ocean to
climate warming continue to rise reaching 5 - 67 cm above present levels by 2100.
Additional warming will increase the overall level of climate risks in the UK.
379 Sixth Carbon Budget – The path to Net Zero
Water deficits could affect around 15% of water resource zones, but it is likely that
adaptation measures could manage most of the increased risk from flooding and
water scarcity in 2050, though not necessarily by the end of the century.
• 3°C or more above preindustrial levels: A global mean warming of around 3°C or
more by the end of the century would result in a very large increase in seasonal
changes and weather extremes in the UK. Winter rainfall could increase by up to 50% and summer rainfall decrease by 60% by 2100. Water deficits across England could
rise to over 5.5 billion litres per day, and the number of people living in areas of
significant flood risk would more than double. The UK would also experience centuries
of sea level rise; with 1 metre or more becoming inevitable. Daily temperatures exceeding 40°C could occur every 3-4 years. At this level of warming, significant and
systemic impacts are projected to occur, and acceptance of impacts might be the
only viable adaptation strategy in some cases.
Lower levels of warming are also expected to bring some opportunities and benefits to
the UK:
• Outdoor activities may become more attractive, helping to promote healthier
lifestyles.
• Cold-related deaths would be expected to decline with future warming, though the
benefits could be largely offset by an increasing elderly population.
• Growing seasons may lengthen and productivity in agriculture and forestry could
improve with warmer summers. However, these benefits would only be realised if
water and soil quality are not limiting, which they could be even at low levels of
warming.
Source: CCC (2017) Climate Change Risk Assessment 2017 Evidence Report.
b) A wide range of warming outcomes remains possible Past global emissions have increased the global average temperature by more
than 1.1°C above pre-industrial levels, with impacts now being realised around the
world. While past emissions are not expected to commit the world to significant
amounts of additional warming above this level, a large fraction of the observed
warming will be maintained for several centuries even if global CO2 emissions were
instantaneously reduced to Net Zero according to the latest climate models.45
As global emissions continue, warming, and climate impacts, will increase:
• Additional warming is expected even under the most ambitious global emissions pathways and best-case climate outcomes. Under global
emissions trajectory reaching Net Zero CO2 emissions around 2050
additional warming of over 0.2°C is expected by mid-century in nearly all
possible climate outcomes.46 The recent estimates by the WCRP assessment
on climate sensitivity suggest that inevitable levels of warming may be
slightly higher than this, further emphasising the need to improve
preparedness for additional climate impacts.
• Under global emission reduction scenarios that aim to deliver on the Paris Agreement, exceedance of 2°C warming still remains possible. Our
modelling of the climate outcomes consistent with a rapid global reduction
in CO2 emissions to Net Zero by 2060 suggests that there remains a chance
(around 10 – 20% probability) of seeing warming exceed 2°C by 2100 even
if this scenario was successfully delivered.
• Current global pledges are still insufficient to deliver on the Paris Agreement and central expectations of future warming are for higher levels. Under a
continuation of the global ambition needed to achieve current 2030
emissions targets, the median estimate of warming in 2100 is around 3°C
with further rises after 2100 (Figure 8.7).
Best case scenarios will see some inevitable increase in climate risks.
It remains possible that warming could exceed 2°C even under rapid global decarbonisation scenarios.
Chapter 8: Scientific context for setting the UK’s Sixth Carbon Budget 380
Recent commitments from large emitters such as the US and China to
reach Net Zero by 2050 could, if achieved, lower the median level of
expected warming to around 2.3 – 2.4°C above pre-industrial levels by
2100, but are not sufficient on their own to achieve the Paris Agreement.47
Increased ambition towards trajectories expected to be consistent with the
Paris Agreement would bring rapid benefits in terms of reduced rate of
warming and the climate risks experienced, reducing 2020 to 2050 warming
by up to 0.3°C. 48
• Very high levels of warming and climate impacts could be possible under current global ambition for emissions reductions. Under global emissions
scenarios consistent with the ambition of present NDCs continued across
the rest of the century, there remains a significant possibility of warming in
excess of 4°C by 2100, with associated very high levels of climate impacts.
Higher warming also increases the risk of low likelihood, high impact events
including abrupt or very fast rates of climate change, and irreversible
changes, some of which could then accelerate global warming further.
The climate impacts being felt today, the inevitability of future increases in climate
risk and the wide range of climate outcomes possible over the rest of the century
all highlight the importance of continued and increasing effort on preparing for
climate risks alongside emissions reductions. The CCC’s Adaptation Committee has
advised the Government that it needs to implement resilience measures for a
minimum 2°C warming level and should also include consideration of adaptation
planning for up to the 4°C level. The Adaptation Committee’s latest report to
Parliament shows that the UK is not yet prepared for the 2°C level, let alone the 4°C
level.49
The current level of global emissions reduction ambition means warming exceeding 4°C by 2100 cannot be ruled out.
The UK should be planning for a range of climate outcomes as part of effective adaptation policy.
Our assessment of adaptation progress suggests that the UK is falling short.
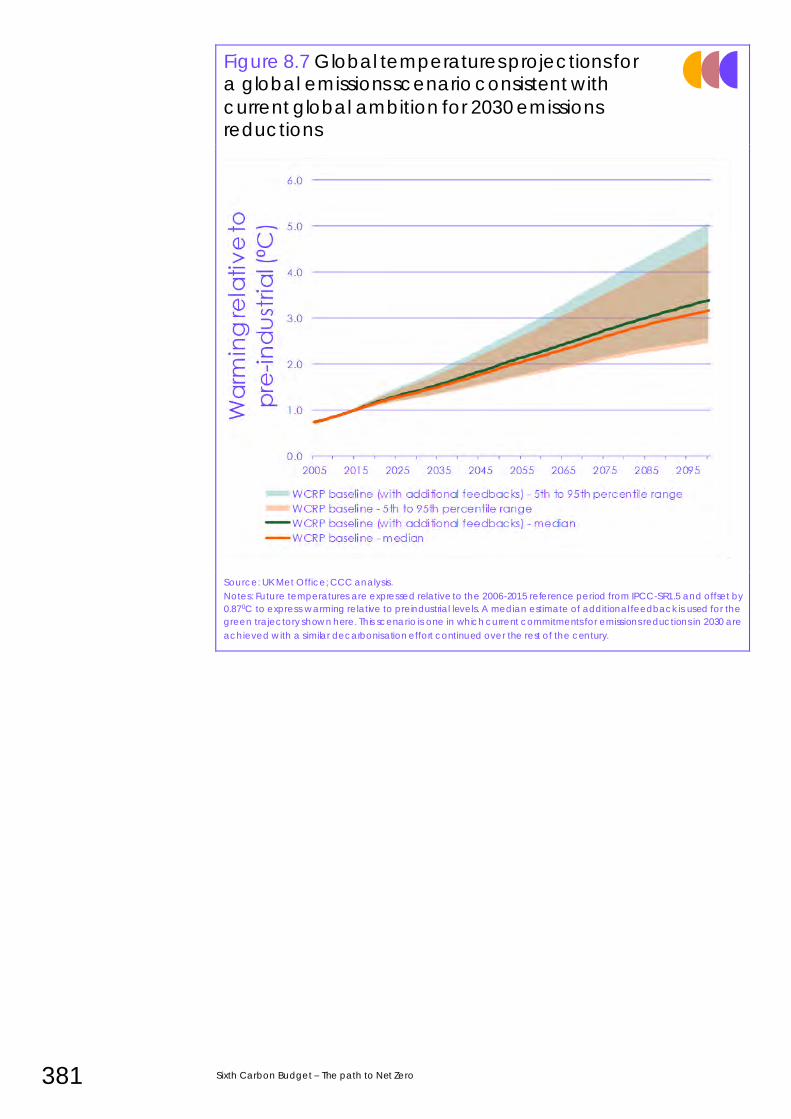
381 Sixth Carbon Budget – The path to Net Zero
Figure 8.7 Global temperatures projections for a global emissions scenario consistent with
current global ambition for 2030 emissions reductions
Source: UK Met Office; CCC analysis.
Notes: Future temperatures are expressed relative to the 2006-2015 reference period from IPCC-SR1.5 and offset by
0.870C to express warming relative to preindustrial levels. A median estimate of additional feedback is used for the
green trajectory shown here. This scenario is one in which current commitments for emissions reductions in 2030 are
achieved with a similar decarbonisation effort continued over the rest of the century.
Chapter 8: Scientific context for setting the UK’s Sixth Carbon Budget 382
1 CCC (2015) The scientific and international context for the Fifth Carbon Budget; CCC (2019) Net
Zero: The UK’s contribution to stopping global warming.
2 UK Met Office (2020) Confirmation that 2019 concludes warmest decade.
3 WMO (2020) WMO Statement on the State of the Global Climate in 2019; Haustein, K. et al.
(2017) A real-time Global Warming Index. Scientific Reports, 7, 15417; globalwarmingindex.org.
4 Based on Church, J. & White, N. (2011) Sea-Level Rise from the Late 19th to the Early 21st
Century. Surveys in Geophysics, 32, 585–602 extended to the present day using satellite altimetry
date from AVISO.
5 Kendon, M. et al. (2020) State of the UK Climate in 2019. International Journal of Climatology, 40,
S1, 1-69.
6 National Academies of Sciences, Engineering, and Medicine (2016) Attribution of Extreme
Weather Events in the Context of Climate Change.
7 IPCC (2018) Special Report on Global Warming of 1.5ºC – Chapter 3: Impacts of 1.5ºC global
warming on natural and human systems.
8 Mitchell, D. et al. (2016) Attributing human mortality during extreme heat waves to
anthropogenic climate change. Environmental Research Letters, 11, 7.
9 Jones, M. et al. (2020) Climate Change Increases the Risk of Wildfires.
10 van Oldenborgh, G. J. et al. (2017) Attribution of extreme rainfall from Hurricane Harvey.
Environmental Research Letters, 12, 124009.
11 IEA (2020) Global CO2 emissions in 2019. 12 IEA (2020) World Energy Outlook 2020.
13 UN Environment Programme (2019) Emissions Gap Report 2019.
14 WMO (2020) Statement on the State of the Global Climate in 2019.
15 Saunois, M. et al. (2020) The Global Methane Budget 2000 – 2017. Earth System Science Data,
12, 1-63; Tian, H. et al. (2020) A comprehensive quantification of global nitrous oxide sources and
sinks. Nature, 586, 248–256.
16 Jackson, R. et al. (2020) Increasing anthropogenic methane emissions arise equally from
agricultural and fossil fuel sources. Environ. Res. Lett.,15, 071002.
17 NOAA (2020) The NOAA Annual Greenhouse Gas Index (AGGI).
18 Bellouin, N. et al. (2019) Bounding Global Aerosol Radiative Forcing of Climate Change. Reviews
of Geophysics, 58, 1.
19 UK Met Office (2020) Coronavirus will impact the atmospheric CO2 record – but not enough to
slow global heating.
20 Forster, P. et al. (2020) Latest climate models confirm need for urgent mitigation. Nature Climate
Change, 10, 7–10.
21 Zelinka, M. et al. (2020). Causes of higher climate sensitivity in CMIP6 models. Geophysical
Research Letters, 47.
22 Tokarska, K. et al. (2020) Past warming trend constrains future warming in CMIP6 models.
Science Advances, 6, 12; Nijsse, F., Cox, P. & Williamson, M. (2020) Emergent constraints on
transient climate response (TCR) and equilibrium climate sensitivity (ECS) from historical warming
in CMIP5 and CMIP6 models. Earth Syst. Dynam., 11, 737–750; Flynn, C. & Mauritsen, T. (2020) On
the climate sensitivity and historical warming evolution in recent coupled model ensembles.
Atmos. Chem. Phys., 20, 7829–7842; Jiménez-de-la-Cuesta, D. & Mauritsen, T. (2019) Emergent
constraints on Earth’s transient and equilibrium response to doubled CO2 from post-1970s global
warming. Nature Geoscience, 12, 902–905.
23 Bjordal, J. et al. (2020) Equilibrium climate sensitivity above 5 °C plausible due to state-
dependent cloud feedback. Nature Geoscience, 13, 718–721.
383 Sixth Carbon Budget – The path to Net Zero
24 Arora, V. et al. (2020) Carbon–concentration and carbon–climate feedbacks in CMIP6 models
and their comparison to CMIP5 models. Biogeosciences, 17, 4173–4222; Jones, C. &
Friedlingstein, P. (2020) Quantifying process-level uncertainty contributions to TCRE and carbon
budgets for meeting Paris Agreement climate targets. Environmental Research Letters, 15,
074019.
25 Sherwood, S. et al. (2020) An Assessment of Earth's Climate Sensitivity Using Multiple Lines of
Evidence. Reviews of Geophysics, 58, 4.
26 Meinshausen, M., Raper, S. & Wigley, T. (2011) Emulating coupled atmosphere-ocean and
carbon cycle models with a simpler model, MAGICC6 – Part 1: Model description and
calibration. Atmos. Chem. Phys., 11, 1417–1456; Lowe, J. et al. (2009) How difficult is it to recover
from dangerous levels of global warming? Environmental Research Letters, 4, 014012. 27 Lamboll, R. et al. (2020) Silicone v1.0.0: an open-source Python package for inferring missing
emissions data for climate change research. Geoscientific Model Development 13, 5259-5275. 28 IPCC (2013) Chapter 6 - Carbon and Other Biogeochemical Cycles, Working Group 1 - 5th
Assessment Report. 29 Lowe, J. & Bernie, D. (2018) The impact of Earth system feedbacks on carbon budgets and
climate response. The impact of Earth system feedbacks on carbon budgets and climate
response. Phil. Trans. R. Soc. A, 376, 20170263.
30 UNFCCC (2015) Report on the structured expert dialogue on the 2013–2015 review. 31 CONSTRAIN (2019) Zero In On The Remaining Carbon Budget And Decadal Warming Rates.
32 Rogelj, J., Schleussner, C.-F. & Hare, W. (2018) Getting It Right Matters: Temperature Goal
Interpretations in Geoscience Research. Geophysical Research Letters, 44, 10, 662–665.
33 Denison, S., Forster, P. & Smith, C. (2019) Guidance on emissions metrics for nationally
determined contributions under the Paris Agreement. Environmental Research Letters, 14, 12.
34 Smith, S. et al. (2012) Equivalence of greenhouse-gas emissions for peak temperature limits.
Nature Climate Change, 2, 535-538.
35 Lee, D. et al. (2020) The contribution of global aviation to anthropogenic climate forcing for
2000 to 2018. Atmospheric Environment, 244, 117834.
36 Lee, D. et al. (2020) The contribution of global aviation to anthropogenic climate forcing for
2000 to 2018. Atmospheric Environment, 244, 117834.
37 IPCC (2018) Chapter 3 - Impacts of 1.5°C of Global Warming on Natural and Human systems.
38 Ebi, K.L. et al. (2017) Detecting and attributing health burdens to climate change. Environmental
Health Perspectives, 125 (8), 085004.
39 Jones, M. et al. (2020) Climate Change Increases the Risk of Wildfires.
40 IPCC (2014) Summary for policymakers, Working Group 2 - 5th Assessment Report. 41 Alfieri, L. et al. (2017) Global projections of river flood risk in a warmer world. Earth’s Future, 5, 2,
171-182. 42 Warren, R. et al. (2018) The projected effect on insects, vertebrates, and plants of limiting global
warming to 1.5°C rather than 2°C. Science, 360, 6390, 791-795. 43 Arnell, N. et al. (2015) The global impacts of climate change under 1.5ºC, 2ºC, 3ºC and 4ºC
pathways (AVOID2). 44 Warren, R. et al. ( 2018) The implications of the United Nations Paris Agreement on climate
change for globally significant biodiversity areas. Climatic Change, 147 (3-4), 395-409 45 MacDougall, A. et al. (2020) Is there warming in the pipeline? A multi-model analysis of the Zero
Emissions Commitment from CO2. Biogeosciences, 17, 2987–3016. 46 CCC (2020) How much more climate change is inevitable for the UK? 47 Climate Action Tracker (2020) Biden’s elect ion could bring a tipping point putting Paris
Agreement 1.5 degree limit ‘within striking distance’.
48 Forster, P. et al. (2020) Current and future global climate impacts resulting from COVID-19.
Nature Climate Change, 10, 913–919.
49 CCC (2019) Progress in preparing for climate change – 2019 Progress Report to Parliament.
Chapter 9: The shape of the emissions path to Net Zero 384
The shape of the emissions path to
Net Zero
1. Delivering on the Paris Agreement 389
2. Supporting the recovery and maintaining momentum 391
3. Making progress in every sector in the 2020s 394
4. Why the recommendation does not require faster progress 408
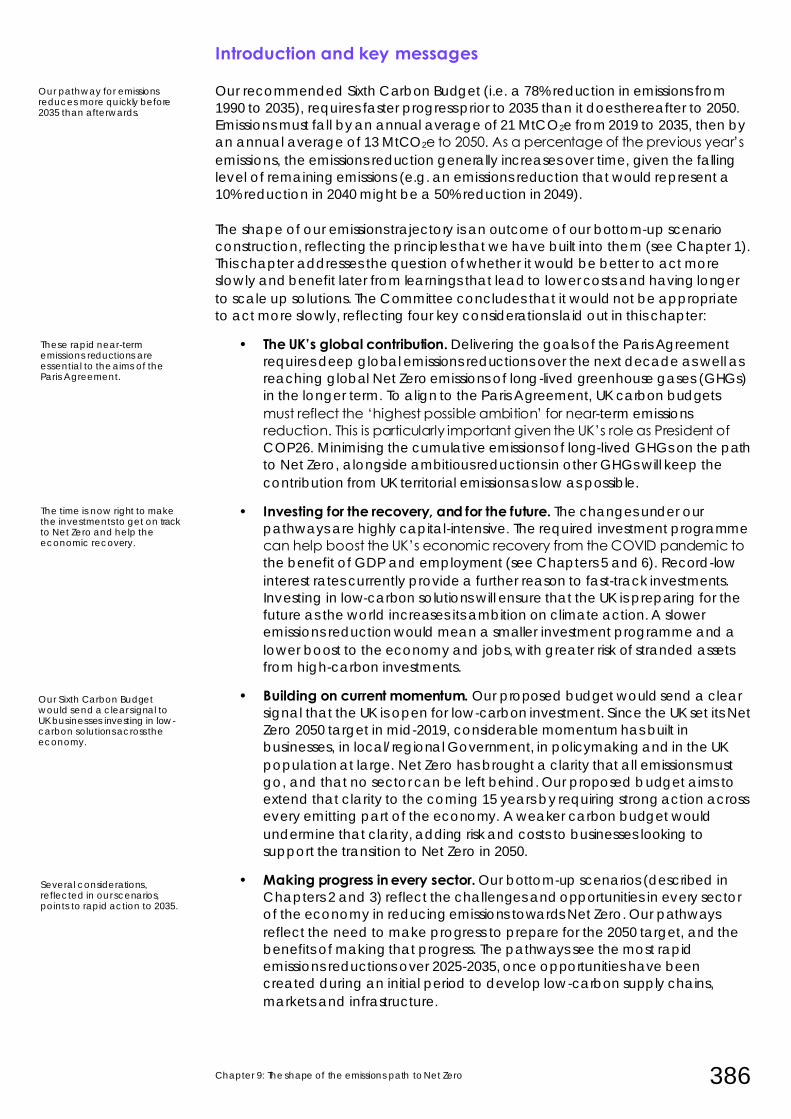
Chapter 9: The shape of the emissions path to Net Zero 386
Introduction and key messages
Our recommended Sixth Carbon Budget (i.e. a 78% reduction in emissions from
1990 to 2035), requires faster progress prior to 2035 than it does thereafter to 2050.
Emissions must fall by an annual average of 21 MtCO2e from 2019 to 2035, then by
an annual average of 13 MtCO2e to 2050. As a percentage of the previous year’s
emissions, the emissions reduction generally increases over time, given the falling
level of remaining emissions (e.g. an emissions reduction that would represent a
10% reduction in 2040 might be a 50% reduction in 2049).
The shape of our emissions trajectory is an outcome of our bottom-up scenario
construction, reflecting the principles that we have built into them (see Chapter 1).
This chapter addresses the question of whether it would be better to act more
slowly and benefit later from learnings that lead to lower costs and having longer
to scale up solutions. The Committee concludes that it would not be appropriate
to act more slowly, reflecting four key considerations laid out in this chapter:
• The UK’s global contribution. Delivering the goals of the Paris Agreement
requires deep global emissions reductions over the next decade as well as
reaching global Net Zero emissions of long-lived greenhouse gases (GHGs)
in the longer term. To align to the Paris Agreement, UK carbon budgets
must reflect the ‘highest possible ambition’ for near-term emissions
reduction. This is particularly important given the UK’s role as President of
COP26. Minimising the cumulative emissions of long-lived GHGs on the path
to Net Zero, alongside ambitious reductions in other GHGs will keep the
contribution from UK territorial emissions as low as possible.
• Investing for the recovery, and for the future. The changes under our
pathways are highly capital-intensive. The required investment programme
can help boost the UK’s economic recovery from the COVID pandemic to
the benefit of GDP and employment (see Chapters 5 and 6). Record-low
interest rates currently provide a further reason to fast-track investments.
Investing in low-carbon solutions will ensure that the UK is preparing for the
future as the world increases its ambition on climate action. A slower
emissions reduction would mean a smaller investment programme and a
lower boost to the economy and jobs, with greater risk of stranded assets
from high-carbon investments.
• Building on current momentum. Our proposed budget would send a clear
signal that the UK is open for low-carbon investment. Since the UK set its Net
Zero 2050 target in mid-2019, considerable momentum has built in
businesses, in local/regional Government, in policymaking and in the UK
population at large. Net Zero has brought a clarity that all emissions must
go, and that no sector can be left behind. Our proposed budget aims to
extend that clarity to the coming 15 years by requiring strong action across
every emitting part of the economy. A weaker carbon budget would
undermine that clarity, adding risk and costs to businesses looking to
support the transition to Net Zero in 2050.
• Making progress in every sector. Our bottom-up scenarios (described in
Chapters 2 and 3) reflect the challenges and opportunities in every sector
of the economy in reducing emissions towards Net Zero. Our pathways
reflect the need to make progress to prepare for the 2050 target, and the
benefits of making that progress. The pathways see the most rapid
emissions reductions over 2025-2035, once opportunities have been
created during an initial period to develop low-carbon supply chains,
markets and infrastructure.
These rapid near-term emissions reductions are essential to the aims of the Paris Agreement.
Our pathway for emissions reduces more quickly before 2035 than afterwards.
Several considerations, reflected in our scenarios, points to rapid action to 2035.
The time is now right to make the investments to get on track to Net Zero and help the economic recovery.
Our Sixth Carbon Budget would send a clear signal to UK businesses investing in low-carbon solutions across the economy.
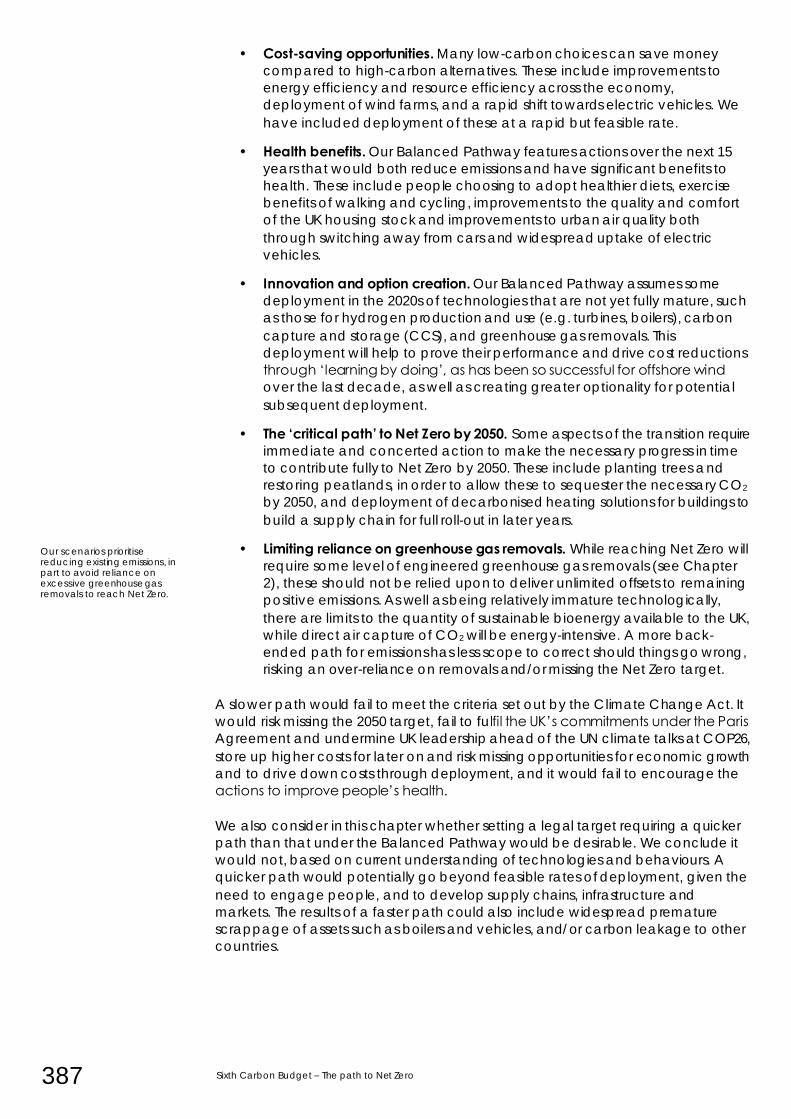
387 Sixth Carbon Budget – The path to Net Zero
• Cost-saving opportunities. Many low-carbon choices can save money
compared to high-carbon alternatives. These include improvements to
energy efficiency and resource efficiency across the economy,
deployment of wind farms, and a rapid shift towards electric vehicles. We
have included deployment of these at a rapid but feasible rate.
• Health benefits. Our Balanced Pathway features actions over the next 15
years that would both reduce emissions and have significant benefits to
health. These include people choosing to adopt healthier diets, exercise
benefits of walking and cycling, improvements to the quality and comfort
of the UK housing stock and improvements to urban air quality both
through switching away from cars and widespread uptake of electric
vehicles.
• Innovation and option creation. Our Balanced Pathway assumes some
deployment in the 2020s of technologies that are not yet fully mature, such
as those for hydrogen production and use (e.g. turbines, boilers), carbon
capture and storage (CCS), and greenhouse gas removals. This
deployment will help to prove their performance and drive cost reductions
through ‘learning by doing’, as has been so successful for offshore wind
over the last decade, as well as creating greater optionality for potential
subsequent deployment.
• The ‘critical path’ to Net Zero by 2050. Some aspects of the transition require
immediate and concerted action to make the necessary progress in time
to contribute fully to Net Zero by 2050. These include planting trees and
restoring peatlands, in order to allow these to sequester the necessary CO2
by 2050, and deployment of decarbonised heating solutions for buildings to
build a supply chain for full roll-out in later years.
• Limiting reliance on greenhouse gas removals. While reaching Net Zero will
require some level of engineered greenhouse gas removals (see Chapter
2), these should not be relied upon to deliver unlimited offsets to remaining
positive emissions. As well as being relatively immature technologically,
there are limits to the quantity of sustainable bioenergy available to the UK,
while direct air capture of CO2 will be energy-intensive. A more back-
ended path for emissions has less scope to correct should things go wrong,
risking an over-reliance on removals and/or missing the Net Zero target.
A slower path would fail to meet the criteria set out by the Climate Change Act. It
would risk missing the 2050 target, fail to fulfil the UK’s commitments under the Paris
Agreement and undermine UK leadership ahead of the UN climate talks at COP26,
store up higher costs for later on and risk missing opportunities for economic growth
and to drive down costs through deployment, and it would fail to encourage the
actions to improve people’s health.
We also consider in this chapter whether setting a legal target requiring a quicker
path than that under the Balanced Pathway would be desirable. We conclude it
would not, based on current understanding of technologies and behaviours. A
quicker path would potentially go beyond feasible rates of deployment, given the
need to engage people, and to develop supply chains, infrastructure and
markets. The results of a faster path could also include widespread premature
scrappage of assets such as boilers and vehicles, and/or carbon leakage to other
countries.
Our scenarios prioritise reducing existing emissions, in part to avoid reliance on excessive greenhouse gas removals to reach Net Zero.

Chapter 9: The shape of the emissions path to Net Zero 388
A faster path may prove possible in future if technologies develop more quickly
than we assume and/or people prove more willing to adopt new technologies
and choose greener lifestyles. If it proves possible, then such a quicker path would
be desirable given the difficulty in achieving the more ambitious end of the Paris
Agreement objective (i.e. limiting global warming to 1.5°C).
This chapter draws on evidence from earlier in the report, to explain why this path is
the right one for emissions on the way to Net Zero. It is set out in four sections:
1. Delivering on the Paris Agreement
2. Supporting the recovery and maintaining momentum
3. Making progress in every sector
4. Why the recommendation does not require faster progress
This is the right path for now, but it would be desirable to go further if that turns out to be feasible.
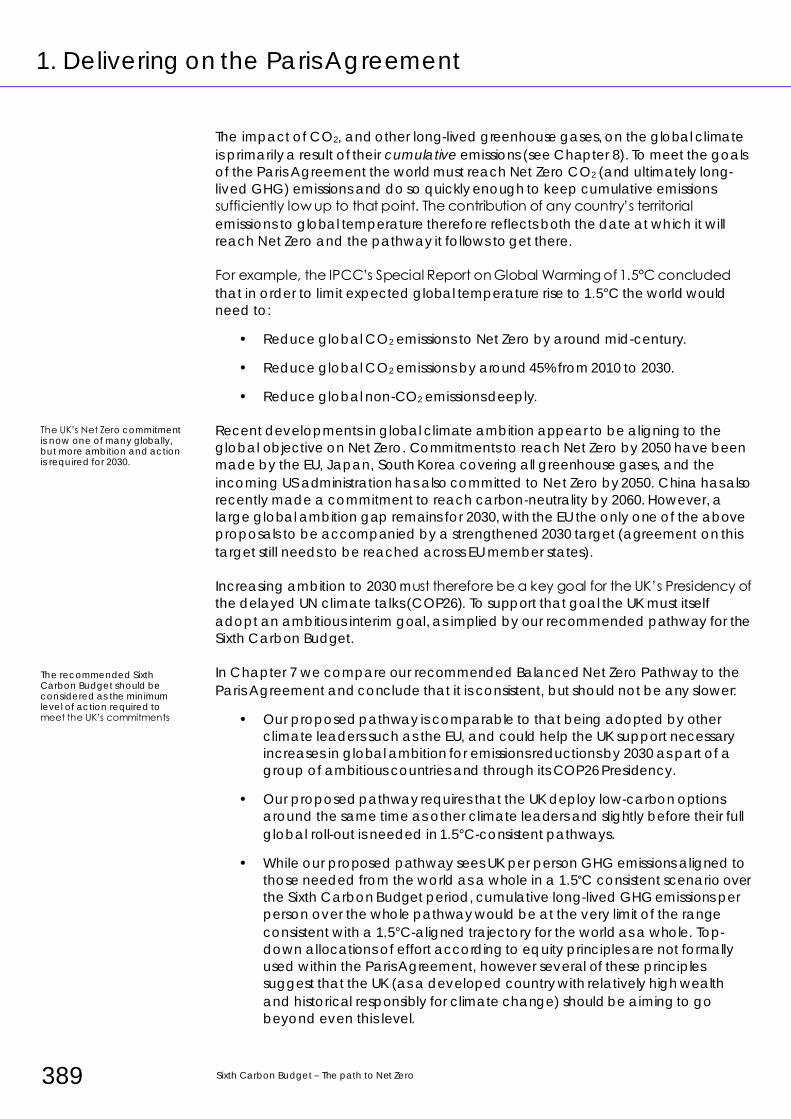
389 Sixth Carbon Budget – The path to Net Zero
1. Delivering on the Paris Agreement
The impact of CO2, and other long-lived greenhouse gases, on the global climate
is primarily a result of their cumulative emissions (see Chapter 8). To meet the goals
of the Paris Agreement the world must reach Net Zero CO2 (and ultimately long-
lived GHG) emissions and do so quickly enough to keep cumulative emissions
sufficiently low up to that point. The contribution of any country’s territorial
emissions to global temperature therefore reflects both the date at which it will
reach Net Zero and the pathway it follows to get there.
For example, the IPCC’s Special Report on Global Warming of 1.5°C concluded
that in order to limit expected global temperature rise to 1.5°C the world would
need to:
• Reduce global CO2 emissions to Net Zero by around mid-century.
• Reduce global CO2 emissions by around 45% from 2010 to 2030.
• Reduce global non-CO2 emissions deeply.
Recent developments in global climate ambition appear to be aligning to the
global objective on Net Zero. Commitments to reach Net Zero by 2050 have been
made by the EU, Japan, South Korea covering all greenhouse gases, and the
incoming US administration has also committed to Net Zero by 2050. China has also
recently made a commitment to reach carbon-neutrality by 2060. However, a
large global ambition gap remains for 2030, with the EU the only one of the above
proposals to be accompanied by a strengthened 2030 target (agreement on this
target still needs to be reached across EU member states).
Increasing ambition to 2030 must therefore be a key goal for the UK’s Presidency of
the delayed UN climate talks (COP26). To support that goal the UK must itself
adopt an ambitious interim goal, as implied by our recommended pathway for the
Sixth Carbon Budget.
In Chapter 7 we compare our recommended Balanced Net Zero Pathway to the
Paris Agreement and conclude that it is consistent, but should not be any slower:
• Our proposed pathway is comparable to that being adopted by other
climate leaders such as the EU, and could help the UK support necessary
increases in global ambition for emissions reductions by 2030 as part of a
group of ambitious countries and through its COP26 Presidency.
• Our proposed pathway requires that the UK deploy low-carbon options
around the same time as other climate leaders and slightly before their full
global roll-out is needed in 1.5°C-consistent pathways.
• While our proposed pathway sees UK per person GHG emissions aligned to
those needed from the world as a whole in a 1.5°C consistent scenario over
the Sixth Carbon Budget period, cumulative long-lived GHG emissions per
person over the whole pathway would be at the very limit of the range
consistent with a 1.5°C-aligned trajectory for the world as a whole. Top-
down allocations of effort according to equity principles are not formally
used within the Paris Agreement, however several of these principles
suggest that the UK (as a developed country with relatively high wealth
and historical responsibly for climate change) should be aiming to go
beyond even this level.
The UK’s Net Zero commitment is now one of many globally, but more ambition and action is required for 2030.
The recommended Sixth Carbon Budget should be considered as the minimum level of action required to meet the UK’s commitments under the Paris Agreement.
Chapter 9: The shape of the emissions path to Net Zero 390
In Chapter 7 we set out how our proposed pathway can be considered a ‘fair and
ambitious’ contribution towards the goals of the Paris Agreement. However, the
structure of the Paris Agreement, scientific understanding linking every additional
reduction in emissions with more avoided climate impacts, and the range of
different possible framings of ‘fairness’ can provide valid reasons for even more
ambitious emissions reduction in the UK.
The binding constraint on the ambition in our Balanced Net Zero Pathway is the
Committee’s judgement over what represents a feasible basis for an ambitious yet
deliverable territorial emissions reduction pathway in the UK for the basis of setting
legally-binding targets under the Climate Change Act. The credibility of targets set
by the UK under the Climate Change Act and the Paris Agreement is an important
part of our international signalling that the UK is serious about reducing emissions
and will deliver on the targets that it sets. The UK should also be aiming to support
the global effort to reduce emissions in other ways alongside its domestic emissions
reductions (Chapter 7).
Should more rapid emissions reductions in UK territorial emissions action turn out to
be feasible (e.g. as in our Tailwinds scenario), as a result of positive developments
on societal/behavioural changes and innovation, then ambition should increase,
rather than allow this to be taken as an opportunity to ease off effort elsewhere.
The Balanced Pathway should be seen as the minimum level of ambition for the
UK’s pathway to Net Zero, with opportunities taken to go further than it where
possible.
Even if it were possible to delay effort while still achieving Net Zero by 2050, this
would result in higher cumulative emissions. Higher cumulative emissions would
lead to a worse climate outcome, and a more back-ended path would also
undermine the UK’s ability to demonstrate international leadership:
• Chapter 8 shows that a stylised pathway achieving Net Zero by 2050 but
with limited action to reduce emissions over the 2020s would lead to a
significantly higher contribution to global warming from UK territorial
emissions over the 2020 – 2050 period. As well as leading to avoiding
additional climate impacts, if replicated globally this would make it
extremely difficult to keep warming to the 1.5°C end of the Paris Agreement
long-term temperature goal.
• The influence from UK action to global action is currently at its strongest as
the UK hosts the next UN climate talks. These talks are aimed explicitly at
increasing global effort to 2030.
• The more challenging and costly parts of our recommended trajectory –
decarbonising buildings and industry, and scaling up CO2 removals from
the atmosphere – are also the areas where the UK has a particularly
important leadership role in helping (alongside other climate leaders) to
develop new global markets and technologies (see Chapter 7). Without
action from the UK (alongside others) to develop and deploy this new
wave of deeper decarbonisation options, the rapid and large-scale global
deployment of these technologies that is needed to reduce global
emissions in line with the Paris Agreement would not be credible.
These factors provide a compelling argument that without pursuing ‘highest
possible ambition’ across the entire pathway to Net Zero, as required by our
recommended Sixth Carbon Budget, the UK would not be satisfying its obligations
under the Paris Agreement.
It is important that the recommended pathway be both ambitious and feasible.
391 Sixth Carbon Budget – The path to Net Zero
2. Supporting the recovery and maintaining momentum
Much has changed since we published our Net Zero advice in May 2019. Net Zero
by 2050 is now law in the UK. It has since been recognised as the ambition for
around half of the world’s emissions (and rising). In the UK more and more
businesses, people and local authorities are recognising the need for, and taking,
climate action. This year the COVID-19 pandemic has created a vast public health
crisis and has had a profound economic impact.
The months ahead have huge significance. The steps that the world and the UK
take to rebuild from the COVID-19 pandemic and its economic damage can
accelerate the transition to low-carbon activities and improve our climate
resilience. Short-term choices that lock in emissions or climate risks must be
avoided. The window for increasing global climate ambition is now.
This section consists of two subsections:
a) Investing in a green recovery
b) Building on existing momentum
a) Investing in a green recovery
The investment programme detailed in Chapter 5 of this report suggests that a
large scale-up of low-carbon investment in the 2020s is ambitious, but achievable.
It is financeable and can boost jobs and GDP, and it will lead to significant
operating cost savings over the longer term. Similarly, there is strong evidence, set
out in our 2020 Progress Report to Parliament and elsewhere, to support a range of
low-carbon and climate adaptation 'green stimulus' measures.1 Many can be
delivered quickly and have high multipliers, high numbers of jobs created, and
boost spending in the UK.
In our 2020 Progress Report we suggested that action by the Government in
response to the pandemic must protect workers and businesses, restore
confidence, stimulate spending and rebuild the economy. These goals can be
strongly complementary to the UK's climate goals. We noted that green stimulus
measures tend to have higher short-run economic multipliers that increase the
effect on GDP of each investment and higher numbers of jobs created, as well as
co-benefits for health and the natural environment.
The investment programme in our Balanced Pathway fits the conditions for a
successful green stimulus programme. It includes new additional investment in all
emitting sectors, compared to a scenario with no further climate action. These
investments align to areas that we’ve previously identified as being strong green
stimulus measures, including:
• Low-carbon building retrofits and buildings that are fit for the future. Our
scenarios involve retrofit of 13 million homes by 2030. Importantly, this
programme is geographically dispersed, reaching all areas of the UK, with
the potential to create local jobs. Estimates outlined in Chapter 6 suggest
potential for over 200,000 new jobs in this sector by 2030, equivalent to
close to 1% of the UK workforce.
Our Sixth Carbon Budget advice fits into a context of increasing climate ambition, and a green recovery from the pandemic.
Our low-carbon investment programme contains strong ‘green stimulus’ measures that can deliver decarbonisation while boosting economic growth.
These investments can deliver a boost to jobs in buildings retrofit, low-carbon energy and natural capital.
Chapter 9: The shape of the emissions path to Net Zero 392
• Natural capital investments in tree planting, peatland restoration and green infrastructure. Tree-planting increases to up to 30,000 ha annually by 2030,
up from 13,000 hectares per year today, and twice the current level of
restored peatland is restored by 2030.
• Strengthening energy system networks and building low-carbon power. Our
scenarios see a rapid increase in electrification, supported by resilient grid
infrastructure and underpinned by an expansion of renewable electricity.
• Infrastructure to make it easy for people to walk and cycle, leading to a
shift in journeys away from private cars.
• Moving towards a circular economy by ensuring that product design
maximises re-use of materials and minimises waste over the product’s
lifetime, leading to lower emissions in industry.
In total, our Balanced Pathway entails increased annual low-carbon investment of
around £50 billion by 2050. That scale-up in investment can support the recovery in
the near term and draw on record-low interest rates. In the longer term, it brings
pay-offs in terms of reduced operating costs (reaching £60 billion per year by
2050), broader benefits to health and the environment, as well as reduced
emissions.
Our recommended Sixth Carbon Budget would send a clear signal that the UK is
open for low-carbon investment. It could bring wider economic opportunities from
capturing a share of the value from growing global markets for low-carbon goods
and services. A slower transition that continues to invest in high-carbon assets
could result in stranded assets or store up difficult transitions in future.
b) Building on existing momentum
Momentum in the UK is building towards the UK’s Net Zero objective. 80% of the
public are concerned about climate change and 66% of people are now aware
of ‘Net Zero’ specifically, up from around half of people earlier this year.2 Similarly,
businesses and local authorities continue to produce ambitious pledges and
deliver climate action, with businesses, including oil and gas companies, pledging
their own Net Zero targets, and the majority of local authorities now having
declared climate emergencies.
Work is underway across all areas of Government, led by two new Cabinet
Committees on climate. Taken together, this can be seen as a foundation for a
comprehensive programme of climate action and investments in the 2020s:
• Policy development is underway across all areas of Government, including
on at least seven key decarbonisation strategies and plans across energy,
transport, land use, manufacturing and buildings in anticipation of a
comprehensive Net Zero Strategy from Government in 2021. The Policy
Report that accompanies this advice offers detailed recommendations
about what these strategies should include.
• Businesses are at the forefront of the UK’s climate ambition, with 45% of FTSE
100 businesses with Net Zero objectives. Increasingly, businesses are
delivering on these ambitions, by procuring low-carbon electricity,
switching to electric vehicles and decarbonising their own operations. The
Confederation of British Industry (CBI) has called on the Government to
capitalise on this through a ‘decade of delivery’ of climate action.3 We set
out how action by businesses can align to the UK’s Sixth Carbon Budget
pathway in a briefing note that accompanies this report (Box 9.1).4
Businesses and local authorities are calling for Government to lead an ambitious programme of climate action in the 2020s.
393 Sixth Carbon Budget – The path to Net Zero
• Local and regional Governments are looking to lead the way on local delivery of Net Zero. The majority of local authorities have now set Net Zero
targets, many of which are more ambitious than the UK’s national
objective. Increasingly they are looking for support from Government, and
a framework within which effective climate action can be coordinated.
We are publishing a briefing note on how local and regional authorities can
align their actions to the goals of the Sixth Carbon Budget alongside this
report.5
• People are increasingly aware of the need for climate action and are
looking to have a say about how best to go about it. However a gap in
understanding remains: while 66% of people are aware of the concept of
Net Zero, only half are aware that their gas boiler produces emissions.6 The
recent Climate Assembly, where a representative sample of the UK
population deliberated around how best to achieve the UK’s Net Zero
objective, emphasised the need for immediate action, as well as involving
people in the decision-making process. Our accompanying Policy Report
offers recommendations on a public engagement strategy for Net Zero.
There are also potential economic opportunities from near-term action, as noted in
Chapters 5 and 6.
Box 9.1 The role of business in delivering the Sixth Carbon Budget
Corporate action is already driving significant change across the UK and internationally,
and accelerating this action will enable the policy, technological, behavioural, and
business model changes needed for a zero-carbon society. Yet many businesses within
the UK are increasingly looking for information and a better understanding of the future
context in which they will operate.
Alongside our advice on the Sixth Carbon Budget we have developed a briefing note,
published alongside this report, on how businesses in the UK can act to support the UK’s
transition to Net Zero. This suggests the following principles to guide business ambition in
the UK:
• Do the basics well – measure, disclose, target, act, adjust. Companies should account
for, and take action on, all emissions they are responsible for and be transparent
about their objectives to reduce emissions, and how they plan to do it.
• Adopt the highest possible ambition, acknowledging that some, particularly large,
businesses may be able to achieve Net Zero earlier than the UK’s national objective.
• Address all emissions, and go beyond. In particular companies should look at the
emissions that occur in their supply chains (‘Scope 3’ emissions), and go beyond this. In
particular we identify two areas to advance progress:
– Companies can lead the transition to electric vehicles in the UK, and should
switch their vehicle fleets to EVs over the 2020s
– Companies should ensure corporate renewables procurement pays for new
low-carbon electricity to be installed, rather than just purchasing existing
renewables.
• Ensure Climate Change is addressed at the highest levels of corporate leadership, including ensuring climate action is given board level and CEO responsibility.
• Minimise offsets, phase them out, and ensure only permanent emissions removals remain, in line with our recommendations around how the UK should meet its national
carbon budgets.
Source: CCC (2020) The role of business in delivering the UK's Net Zero ambition
People in the UK are increasingly aware of the concept of Net Zero, and want to be involved in decisions on how to get there.
Chapter 9: The shape of the emissions path to Net Zero 394
3. Making progress in every sector in the 2020s
The scenarios we set out in Chapters 2 and 3 demonstrate that action is needed
across the economy for the entire period from now through to 2050. The scale-up
over the coming decade arguably will be the most challenging part of the
programme, and the most fundamental to delivering the Net Zero 2050 target.
Delivering that scale-up will depend on effective policy being developed in the
coming year and rolled out over the rest of this Parliamentary term (to 2024). This
Government must be the one to shift the UK decisively onto the path towards
ending our contribution to global warming.
The pathways to Net Zero laid out in this report broadly involve two distinct phases
for UK climate policy, with the next decade being vital:
• The 2020s: scale-up. The UK must build supply chains and new markets for
low-carbon consumer offerings (e.g. electric cars and heat pumps) so that
these can scale from being niche offerings to dominate the market and
fully push out high-carbon alternatives by 2030 or soon after. Alongside, we
must develop and scale up new options for industrial decarbonisation such
as carbon capture and storage (CCS), low-carbon hydrogen and
engineered emissions removals. Tree planting rates must increase from
13,000 hectares per year today to 25,000 hectares per year by 2025 and
perhaps higher by 2030.
• From the early 2030s to 2050: roll-out. Having scaled up the required
markets, these will then take around 15 years to flow through the stock of
vehicles and houses. Instruments driving implementation in industry and
land use should be well developed and continue to drive roll-out at similar
rates. But policy will be less about aiming to scale up markets, instead
focusing on continuing achieved rates of roll-out, tackling emerging barriers
and systems challenges and ensuring fairness across society.
Our scenarios have been developed with a particular attention to the pace at
which change is feasible, allowing time for supply chains to scale up and for
consumer choices to change. They move in step with the natural turnover of long-
lived assets like vehicles and boilers, avoiding increases in embedded emissions or
emissions leakage.
This section considers three particular aspects of our analysis that have led to
the pace of emissions reduction in the Balanced Net Zero Pathway:
a) Taking low-cost opportunities and realising co-benefits
b) The need for progress by 2030 to reach Net Zero by 2050
c) Learning-by-doing, demonstrations and pathfinders
Progress across every sector in the 2020s can ensure the conditions are set for a mass rollout of low-carbon technologies over the 2030s.
395 Sixth Carbon Budget – The path to Net Zero
a) Taking low-cost opportunities and realising co-benefits
There are opportunities to reduce greenhouse gas emissions that would be worth
taking, even ignoring the climate benefits, because they save costs or have
substantial co-benefits (e.g. to health). These opportunities might not have been
taken previously, due to barriers to uptake, a lack of joined-up policy or the cost
reductions only having occurred recently:
• Barriers. There remains considerable potential for reducing demand for
energy and materials, much of which would also be cost-saving or have
small net costs, but where barriers to date have stopped some of these
opportunities being taken up:
– Improvements to home energy efficiency have stalled in the last eight
years, despite remaining cost-effective potential, due to changes to
policy that have failed to address barriers properly, including
information and the cost of finance.
– There are considerable opportunities to improve the resource
efficiency of our economy, thereby reducing the need for carbon-
intensive manufacturing, that are currently not being taken, even
though they would reduce costs to consumers. These include
designing products to last for longer and to be suitable for repair and
re-engineering, increasing sharing of vehicles and appliances, and
reducing waste.
• Co-benefits. A range of measures that reduce emissions also bring co-
benefits to society, most notably for people’s health. Many of these have
small or negative financial costs, and would make sense to pursue even if
considering either climate action or health in isolation. Measures that would
bring overall net benefits to society when considering these wider benefits,
include increases in walking and cycling, better diets, improving home
insulation and measures that improve air quality. Chapter 5 contains a
summary of the main co-impacts of our scenarios.
• Recent reductions in costs, especially of renewable electricity generation
and batteries over the last decade, mean that zero-emissions technologies
are set to become cheaper than the high-carbon alternatives:
– Renewables. Recent cost reductions for renewable electricity
generation have enabled it to become competitive with new fossil
power plants for bulk electricity generation. The auction results of
£39/MWh for offshore wind* have been particularly important for the
UK, because of the large potential for UK deployment and the positive
correlation with energy demand in the UK. Given the strategic
importance of electrification across the whole economy, recent
Government announcements on allowing onshore wind and solar to
compete in auctions and for a target of 40 GW offshore wind
deployment by 2030 are very welcome.
* The auction results are quoted as standard in 2012 prices. £39/MWh in 2012 prices equates to £45/MWh in 2019 prices.
Many of the actions in our scenarios are cost-effective, and have substantial co-benefits, even if the climate benefits are ignored.
A rollout of cheap low-carbon power and electric vehicles builds on global trends for these technologies.
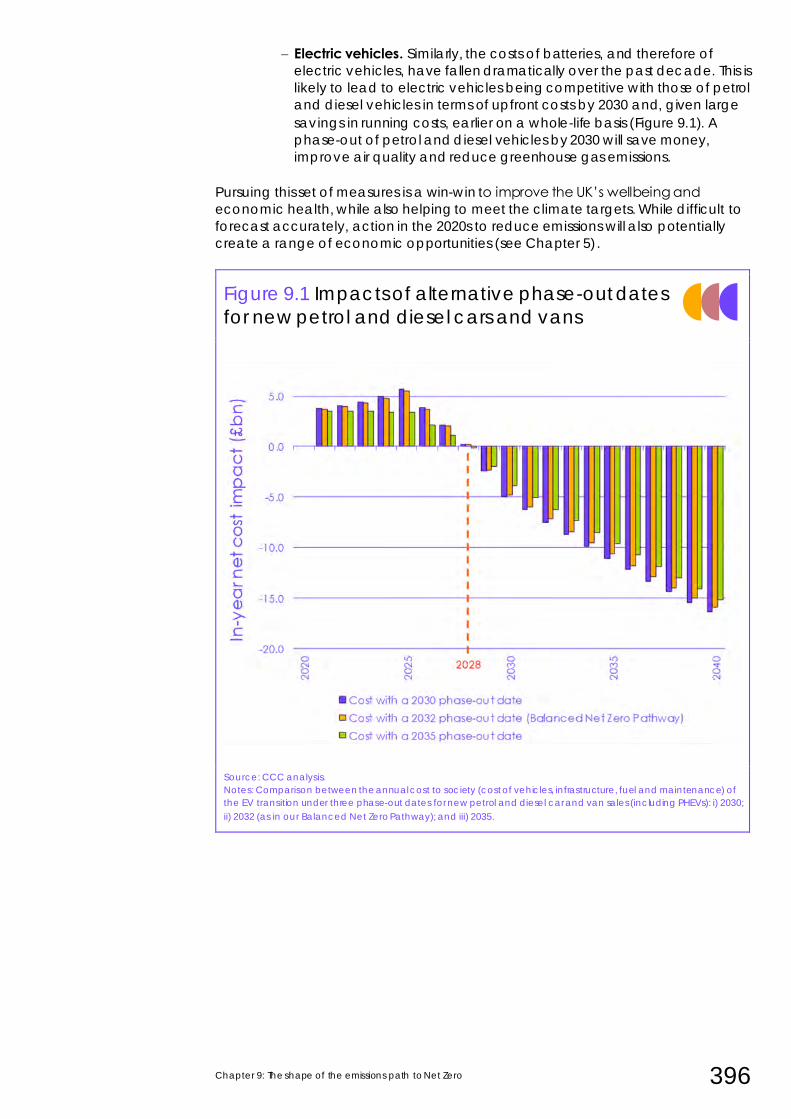
Chapter 9: The shape of the emissions path to Net Zero 396
– Electric vehicles. Similarly, the costs of batteries, and therefore of
electric vehicles, have fallen dramatically over the past decade. This is
likely to lead to electric vehicles being competitive with those of petrol
and diesel vehicles in terms of upfront costs by 2030 and, given large
savings in running costs, earlier on a whole-life basis (Figure 9.1). A
phase-out of petrol and diesel vehicles by 2030 will save money,
improve air quality and reduce greenhouse gas emissions.
Pursuing this set of measures is a win-win to improve the UK’s wellbeing and
economic health, while also helping to meet the climate targets. While difficult to
forecast accurately, action in the 2020s to reduce emissions will also potentially
create a range of economic opportunities (see Chapter 5).
Figure 9.1 Impacts of alternative phase-out dates
for new petrol and diesel cars and vans
Source: CCC analysis.
Notes: Comparison between the annual cost to society (cost of vehicles, infrastructure, fuel and maintenance) of
the EV transition under three phase-out dates for new petrol and diesel car and van sales (including PHEVs): i) 2030;
ii) 2032 (as in our Balanced Net Zero Pathway); and iii) 2035.
397 Sixth Carbon Budget – The path to Net Zero
b) The need for progress by 2030 to reach Net Zero by 2050
The dynamics of decarbonisation vary both across and within sectors. There are
some measures to reduce emissions for which the timing is relatively flexible
between now and 2050, where there are relevant arguments to be made over
their timing (as set out in other sections of this Chapter).
In other areas, however, there is no real flexibility on timing – immediate and
concerted action is required to get on track to making a full contribution to
achieving Net Zero by 2050. This lack of flexibility can be for a range of reasons,
including the need to scale up supply chains (and associated jobs – see Chapter
6), the need for long-term certainty in order for businesses to transition to new
business models, as well as ensuring low-cost financing of the investments in our
scenarios (see Chapter 5) and avoiding boom-bust cycles for industry:
• Stock turnover. Typical asset lifetimes are around 15-20 years, for example
for cars and boilers. Investment should therefore switch entirely from high-
carbon to low-carbon assets by early in the 2030s, apart from such
exceptions that have a clear route to cost-effective retrofitting (e.g.
hydrogen-ready boilers in an area designated for hydrogen roll-out). Any
later switch-over date would imply early capital scrappage, which could
be costly, would undermine investment cases, would increase embedded
emissions* and would make a just transition more difficult to achieve as it
would imply stop-go replacement profiles.
• Lead-times. Reaching a point at which all new investment is in assets that
are compatible with Net Zero cannot happen overnight. Lead-times from
policy to investment and impact, together with the need to scale up
markets, supply chains and supporting infrastructure, as well as public
acceptance of new solutions, means most policies must be at least
outlined in the coming year and firmed up this Parliamentary term (by 2024
or earlier). That should be a realistic goal given that policy is under active
development in most of the required areas.
Importantly the scale-up must include all areas of decarbonisation, including
solutions to reduce emissions today, and technologies that will be required to
remove emissions from the atmosphere in the future.
We have considered the dynamics of emissions reduction across all areas of the
economy, and identified areas where these constraints make immediate and
concerted action necessary to get on track to Net Zero. A failure to get on with
action in the buildings and land use sectors could lead to unnecessary scrappage
and disruption and/or an over-reliance on engineered greenhouse gas removals:
• Buildings. There is minimal room for delay if UK buildings are to reach zero
emissions by 2050, given the need to scale up low-carbon solutions in the
2020s in order to phase out installation of fossil fuel heating installations in
the early 2030s. Delays to this timeline would imply costs and disruption of
scrappage in the 2040s, and could risk failing to reach Net Zero by 2050:
– A delayed path for rolling out low-carbon heating would require
accelerated deployment in the 2040s, potentially going well beyond
the natural replacement rate of heating appliances. This would imply
much more early scrappage of fossil fuel boilers in the 2040s,
increasing costs and disruption for households.
* I.e. the emissions involved in the production and end-of-life disposal of assets like vehicles and boilers.
The pace of our scenarios takes into account the need to build up supply chains, and the need to ensure low-carbon options are available at scale by 2030.
Progress in all sectors is required by 2030. A failure to make progress in the 2020s would build up risks further down the line.
A failure to make progress in buildings could leave significant emissions arising from the UK’s housing stock by 2050.
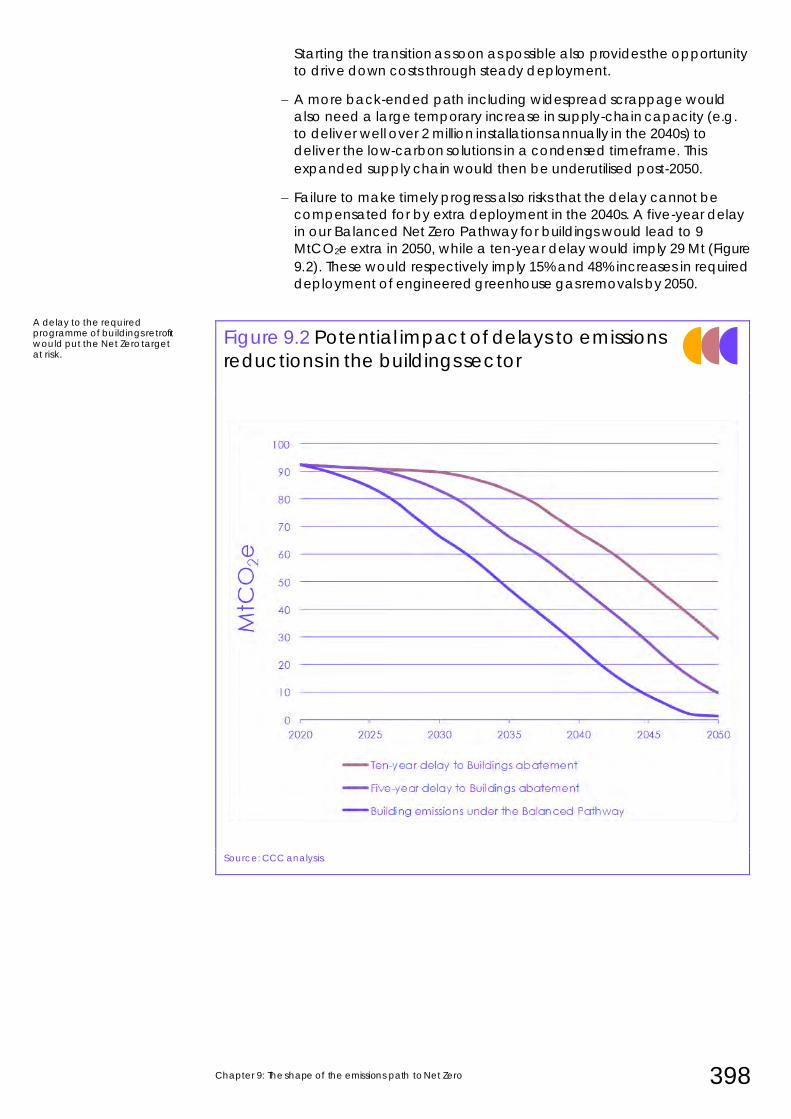
Chapter 9: The shape of the emissions path to Net Zero 398
Starting the transition as soon as possible also provides the opportunity
to drive down costs through steady deployment.
– A more back-ended path including widespread scrappage would
also need a large temporary increase in supply-chain capacity (e.g.
to deliver well over 2 million installations annually in the 2040s) to
deliver the low-carbon solutions in a condensed timeframe. This
expanded supply chain would then be underutilised post-2050.
– Failure to make timely progress also risks that the delay cannot be
compensated for by extra deployment in the 2040s. A five-year delay
in our Balanced Net Zero Pathway for buildings would lead to 9
MtCO2e extra in 2050, while a ten-year delay would imply 29 Mt (Figure
9.2). These would respectively imply 15% and 48% increases in required
deployment of engineered greenhouse gas removals by 2050.
Figure 9.2 Potential impact of delays to emissions
reductions in the buildings sector
Source: CCC analysis.
A delay to the required programme of buildings retrofit would put the Net Zero target at risk.
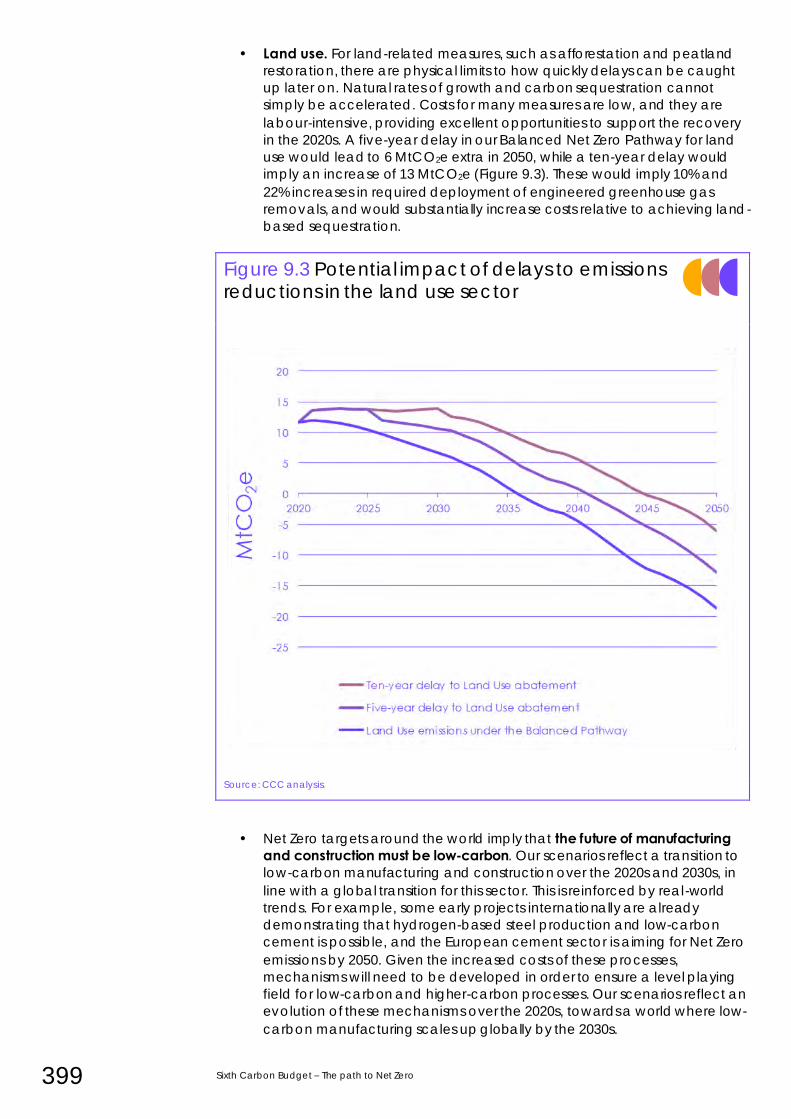
399 Sixth Carbon Budget – The path to Net Zero
• Land use. For land-related measures, such as afforestation and peatland
restoration, there are physical limits to how quickly delays can be caught
up later on. Natural rates of growth and carbon sequestration cannot
simply be accelerated. Costs for many measures are low, and they are
labour-intensive, providing excellent opportunities to support the recovery
in the 2020s. A five-year delay in our Balanced Net Zero Pathway for land
use would lead to 6 MtCO2e extra in 2050, while a ten-year delay would
imply an increase of 13 MtCO2e (Figure 9.3). These would imply 10% and
22% increases in required deployment of engineered greenhouse gas
removals, and would substantially increase costs relative to achieving land-
based sequestration.
Figure 9.3 Potential impact of delays to emissions reductions in the land use sector
Source: CCC analysis.
• Net Zero targets around the world imply that the future of manufacturing and construction must be low-carbon. Our scenarios reflect a transition to
low-carbon manufacturing and construction over the 2020s and 2030s, in
line with a global transition for this sector. This is reinforced by real-world
trends. For example, some early projects internationally are already
demonstrating that hydrogen-based steel production and low-carbon
cement is possible, and the European cement sector is aiming for Net Zero
emissions by 2050. Given the increased costs of these processes,
mechanisms will need to be developed in order to ensure a level playing
field for low-carbon and higher-carbon processes. Our scenarios reflect an
evolution of these mechanisms over the 2020s, towards a world where low-
carbon manufacturing scales up globally by the 2030s.
Chapter 9: The shape of the emissions path to Net Zero 400
A back-ended path for emissions reduction has less scope to be corrected should
things go wrong, risking an over-reliance on removals and/or missing the Net Zero
target.
While the strategy for Net Zero should seek to develop and deploy engineered
greenhouse gas removal options, it should not over-rely on their deployment:
• As well as being relatively immature technologically, there are limits to
deployment of engineered removals both in terms of the finite quantity of
sustainable bioenergy available to the UK and the energy requirements of
direct air capture of CO2 – in the near term low-carbon energy supply
should be prioritised for uses that will contribute more efficiently to
decarbonisation.
• Costs for engineered removals are also likely to be towards the high end of
the range for opportunities to reduce emissions, meaning that a greater
reliance on them is likely to increase costs.
• Action to develop these technologies, through large-scale demonstration,
can give confidence in the ability to scale up these technologies further in
order to meet Net Zero. Reaching 2030 without making progress in these
areas is likely to increase risk and reduce options for the remainder of the
transition.
• The UK Climate Assembly did not favour use of engineered removals. While
some may be inevitable, they should be a last resort that is used only to
offset other emissions that cannot be reduced.
Therefore, while reaching Net Zero will require some level of engineered
greenhouse removals (see Chapter 2), these should not be relied upon to deliver
unlimited offsets to remaining positive emissions.
c) Learning by doing, demonstrations and pathfinders
Innovation theory and historical experience suggests that the limited amount of
time available to achieve Net Zero means that although new technologies will
arise, not all potential innovations will be able to make a significant difference by
2050 (Box 9.2). Innovation is about much more than just technology, extending to
business models, institutions, social change and policy development. Furthermore,
although early-stage research and development is important in establishing the
viability of a technology, without demonstration and deployment technologies
cannot be proven at scale and the costs of technologies are less likely to fall.
Our pathways reflect this, scaling up currently known technologies and options to
reduce emissions over the course of the 2020s, so that by the 2030s mass uptake of
low-carbon technologies, fuels and behaviours is possible, across all sectors of the
economy. Our scenarios envisage that a programme of demonstrations,
pathfinders and ‘learning-by-doing’ allows technologies to be developed,
commercialised and deployed on realistic timescales, taking into account the
current status and future potential of technologies. However, we do not assume
innovation produces unspecified breakthroughs to reduce emissions. If innovation
occurs at a faster pace than that envisaged in our scenarios, then the UK’s climate
objectives could be achieved more easily, or more quickly. We also include
innovation in business models, and behaviour change, resulting in lower emissions.
Policy frameworks will therefore need to incentivise mass deployment of
established low-carbon technologies, while driving deployment of some less-
mature solutions, even if these have higher costs than other low-carbon
technologies in the near term.
A back-ended pathway to achieving Net Zero builds in risks, including a potential overreliance on engineered emissions removals.
Our scenarios do not assume that innovation produces unspecified breakthroughs to reduce emissions.
Although new technologies will arise, not all potential innovations will be able to make a significant difference by 2050.
401 Sixth Carbon Budget – The path to Net Zero
Box 9.2 Energy innovation theory & historical experience
Experience suggests that energy technologies take multiple decades to reach
commercial scale.7 For example, solar panels were invented in the 1950s, but were not
deployed at scale until the 2000s. Similarly, commercialisation of the modern wind turbine
is estimated to have taken 40 years.8
In many cases, the biggest driver of cost reductions and technological improvement will
be through deployment at scale. This has been apparent in the last decade for offshore
wind in the UK where reduced technology costs and reduced cost of capital now mean
that generation from offshore wind is the same cost as from a new gas-fired power plant
(without a carbon price), and the efficiency of the technology has improved.
This trend has also been apparent internationally, where mass manufacture and
deployment of solar PV panels, onshore wind turbines and batteries have reduced costs,
while improving efficiencies. Innovation theory suggests that modular technologies such
as solar panels, wind turbines and batteries continue to reduce in costs in line with
continued deployment achieved through scale and replication of manufacturing
processes (a concept known as ‘learning rates’).*9
However, this isn’t always the case. For example, no similar trend has been established for
the historical deployment of nuclear power stations, which are larger, and therefore less
easy to replicate.10 Though some cost reductions have occurred in South Korea,11 and
could be available through improved construction processes and replicable designs in
the UK,12 and potentially through Small Modular nuclear Reactors (SMRs).13
Global trends are likely to dictate how the scale of deployment affects the cost and
efficiencies of technologies such as renewables, batteries and electrolysers, though
multiple studies have highlighted areas where the UK can play a more active role in
innovation, and where technology innovation can lead to export opportunities for the
UK.14 This includes CCS, low-carbon hydrogen, offshore wind, novel battery technologies,
nuclear power, and smart technology for electricity systems. Business model innovation
will also be important, influenced by policy, and the global role of the UK’s financial
sector can also play a role in developing, and reducing the costs of low -carbon
technologies.
• Offshore wind. The UK has been a global leader in offshore wind and will continue to
play a strong role, supporting a rapidly growing global market for the technology.
• Carbon Capture and Storage is a critical global technology, and is likely to play a
strong role in the UK. Demonstration in the UK can prove the viability of high capture rates for this technology. Similarly, UK Government action can deliver cost savings in
the deployment of CO2 transport and storage networks.
• Low-carbon hydrogen. The UK has a strong research base in hydrogen fuel cells, and
UK companies are active in the development of electrolyser technologies.
Additionally, the UK could be a key country in demonstrating advanced methane
reformation with CCUS.
• The UK is pioneering research into future battery technologies.
• The UK is also one of a few global leaders in nuclear power,15 and is one of just a few
countries considering deploying Generation III nuclear reactors and SMRs.
• Smart technology such as digital optimisation, design and artificial intelligence to
optimise the electricity system for integrating renewables into the grid is an area where
the UK already has prowess, and will be increasingly important in a renewables-centric
world.
* For example, the cost of solar panels has fallen by around 25% with each doubling of installed capacity for the
technology, since 1980. See Fraunhofer (2020) Photovoltaics report
Chapter 9: The shape of the emissions path to Net Zero 402
• Low-carbon heat. Our scenarios suggest a transition to electrification in buildings
heating could make the UK one of the largest markets for air-to-water heat pumps.
Cost reductions could be available through increased deployment of this technology.
• Aeronautics, including emerging research into electric and hydrogen aircraft
propulsion.16
• Business models, policy development and financial innovation are also important. For
example the UK was an early adopter of competitive auctions for renewable
electricity, which is increasingly the model being used around the world.* Similarly, the UK’s Climate Change Act has been used as a model for other countries around the
world.17 The UK is also recognised as a leader in green and sustainable finance and
has considerable potential to shape global financial frameworks towards a transition
to Net Zero.18
Source: See sources 4-15 in Endnotes.
i) The role of innovation in achieving Net Zero
Particularly in areas where the UK has a key role to play in developing low-carbon
technologies and business models, acting now both creates viable pathways to
reach Net Zero and delivers opportunities for cost saving along the way.
Conversely, delayed action risks higher costs on the pathway to Net Zero, and a
loss of potential export opportunities for certain technologies.
Established technologies
In some sectors of the economy, near-full decarbonisation can be achieved with
the set of technologies that is already established (e.g. power generation,
buildings, light-duty vehicles), recognising that global trends continue to improve
the efficiency and reduce the cost of these technologies and broaden the range
of low-cost options. Here, the focus of policy should be on creating frameworks
that drive deployment at scale in the UK, building on global trends, and allowing
markets to deliver with low cost of capital, while having the flexibility to enable
innovative solutions to contribute as they become available.
Establishing clear goals for technology uptake can be valuable in driving
investment into a sector and reducing the cost of capital. We note the value of
conditional goals informally available to offshore wind, which promised a large
future market for the technology contingent on continued cost reductions,
supported through the competitive allocation of long-term contracts through the
Contracts for Difference (CfD) scheme.
In some areas, although the technologies exist to reduce emissions to very low
levels, estimated costs of doing so are relatively high (e.g. for heating buildings,
emissions removals). Policy frameworks will therefore need to be designed in a way
that not only drives the necessary decarbonisation, but also in a way that gives the
best chance of realising and benefiting from cost reductions, and of sharing the
costs and risks of technology deployment in a fair way.
Where people are adversely affected through higher costs being passed through,
targeted Government support may be required (see Chapter 6).
* A consultancy report, published alongside our advice, notes the opportunities for leading countries such as the UK to
develop zero carbon power market designs through relevant policies (e.g. contracts for zero emission sources,
carbon pricing, or policies that address variable renewables and grid balancing) that can then be replicated
elsewhere. See Vivid Economics (2020) Unpacking leadership-driven global scenarios towards the Paris Agreement.
Our scenarios involve mass rollout of established low-carbon technologies, complemented by progress and learning in more emerging technologies and behaviours.
Policy frameworks will therefore need to be designed in a way that gives the best chance of realising and benefiting from cost reductions
403 Sixth Carbon Budget – The path to Net Zero
Where there is uncertainty around the costs or scale of competing low-carbon
options a portfolio of options should be pursued. For example, floating offshore
wind turbines are likely to play a role alongside fixed bottom turbines in the future;
small modular reactors could play a role alongside larger nuclear reactors; blue
(methane-based) and green (electrolytic) hydrogen can both play a role; low-
carbon hydrogen can provide an alternative to electrification for heavy goods
vehicles and potentially for heating buildings; BECCS and DACCS can both be
used for emissions removals at scale.19 Developing these options can give more
certainty over future scale, and lower costs, of low-carbon options as a group as
well as broadening the consumer proposition and routes to optimising across the
energy system.
Emerging technologies and behaviours
Our scenarios also include a range of areas in which solutions have been
proposed, but innovation will be required to go beyond the reach of established
technologies or methods, such as in hydrogen, heavy goods vehicles, and carbon
capture and storage. These also require a policy framework that: enables their
value to be realised (recognising that initially some solutions will not be cost-
competitive), provides supporting infrastructure, promotes sharing of knowledge to
underpin commercial development and drives learning-by-doing.
Demonstrations, pilots and pathfinder projects will be required to establish some of
the low-carbon technologies, business models and behaviours in our scenarios,
from the early 2020s:
• Pathfinder cities can be funded to demonstrate the viability of low-carbon
heat pumps at scale and (if possible) hydrogen at scale, prior to a wider
roll-out. They should also be used to develop a better understanding of
whole systems interactions across low-carbon heat, electricity and transport
and how infrastructure investment can be coordinated efficiently.
• Demonstrating low-carbon hydrogen at scale can prove the viability of
low-carbon hydrogen production via methane reformation with CCS, and
the viability of hydrogen as a consumer offering in homes and HGVs.
• HGV trials across the three decarbonisation options – battery vehicles,
hydrogen fuel cells and catenaries – can be used to demonstrate the most
viable option, or combination of options, for the UK.
• Improving flexibility in the energy system by rolling out mandatory half-
hourly settlement for energy billing, and supporting cost-reflective charging
and smart tariffs so as to provide an accurate source of information at
household level which truly reflects how the electricity system is
decarbonising and the savings which are accessible through load-shifting.
This can be part of a wider strategy to encourage and integrate the use of
data and digitalisation into the UK’s decarbonisation efforts.
• Direct Air Carbon Capture and Storage (DACCS) could be a future solution
for removing carbon from the atmosphere, but only a handful of
demonstration projects exist, and future costs are highly uncertain.
Demonstration of the technology in the UK during the 2020s can increase
confidence over the viability and potential of the technology in a UK
context, as well as globally.
• Initial CCS demonstration projects, deployed at sufficient scale, can
demonstrate the high capture rates and efficiencies considered to be
available to the technology in engineering studies.
Learning-by-doing is a key theme of our scenarios, as evidence shows that costs fall and technologies improve through increased deployment.
Chapter 9: The shape of the emissions path to Net Zero 404
• The need to deploy consumer technologies such as heat pumps and
electric vehicles at scale will require business models to be tested and
trialled before being rolled out at scale.
• Delivering the high levels of societal behaviour change in our scenarios,
such as diet change, will require a more detailed understanding of how
policy can influence these changes.
Moving beyond technology demonstration and towards mass deployment will
require new processes, viable business models and behaviours, in order to reduce
the need for travel, to promote re-use of materials, reduce consumption of animal
protein, and increase the uptake of low-carbon technologies.
Where appropriate, Government should play an active role in supporting
technology development towards commercialisation, while ensuring a move
towards technology neutrality.
Box 9.3 Digitalisation and its role in achieving Net Zero
Digital technology is seen as an important enabler of the UK’s Net Zero transition.
Alongside the low-carbon transformation of our energy, materials and land, the coming
30 years are expected to see fundamental changes in the way we collect, process and
use data.
Reflecting this, a number of studies have been published this year, including by the Royal
Society, ESC and Imperial College, noting the role that digitalisation can play in
decarbonisation. To complement this, the CCC and techUK hosted a roundtable of
industry and academic stakeholders in June 2020 to discuss the role of digital
technologies in reaching Net Zero. The following consensus viewpoints arose:
• Digitalisation will be fundamental to the operation of a Net Zero economy,
underpinning the production and use of energy across increasingly interconnected sectors, particularly with the widespread electrification of vehicles, buildings and
industry in the UK.
• Energy services and pricing tariffs should become increasing flexible and dynamic ,
supporting prosumers (e.g. onsite renewables, batteries, vehicle-to-grid), home and
local grid management, reducing the need for large amounts of grid back-up.
• Digitalisation will help reduce demands for energy, materials, food and water . Artificial
intelligence, machine learning, digital twins and the Internet of Things will lead to
predictive analysis, efficiencies and waste reductions in manufacturing, farming, buildings and transport networks. Additionally, transport demands could be
significantly reduced through video-conferencing and augmented reality.
• Digital tech and supercomputing will allow better forecasting, monitoring and modelling of emissions (e.g. the potential for assets to report Scope 1, 2 & 3 emissions
in real-time, or land carbon stocks), and will shorten innovation cycles to bring new
energy technologies to market faster.
However, several emerging risks were identified as needing to be mitigated. These are
likely to require action from both the technology industry and Government:
• Concerns regarding data privacy, consumer protection and cyber-security need to be addressed early at the system design stage. Given the convergence of new energy and digital technologies, continued public trust and acceptance of change
will be vital to avoid backlash against decarbonisation.
• Data standards and models for data collection & sharing need further development (building on the Modernising Energy Data programme), working across industry,
Government departments and regulators. Data should be ‘Presumed Open’ in order
to improve transparency, and open-source tools promoted.
405 Sixth Carbon Budget – The path to Net Zero
• Interoperability needs to be embedded, to ensure continued flexibility and consumer
choice as markets evolve – lessons can be learnt from the UK’s smart meter roll-out.
• Roll-out of infrastructure such as fibre-optic broadband, 5G and satellite networks are critical enablers to improved connectivity. Acceptable levels of system resilience and
service reliability need to be established and communicated to consumers,
particularly if more energy systems rely on a common piece of connectivity
infrastructure.
• IT infrastructure needs to be run on low-carbon electricity and maximise heat recovery opportunities. Continued focus is required on eco-design, repairs/upgrades, end-of-life
criteria and procurement to drive down IT waste. Data centre energy efficiency needs
to keep improving, even as data becomes more localised for latency and data
residency reasons.
• New, flexible regulatory vehicles that are sufficiently granular and responsive also need to be designed to keep pace with technology changes. Regulatory sandboxes need to be deepened and made systematic. Achieving Net Zero should be a
mandate for each regulator.
Overall, the UK’s digital innovation system, including the Grand Challenges, needs to be
aligned to the challenges of Net Zero, focusing on outcomes rather than prescribing
approaches. Additionally, the National Data Strategy has to consider the data
requirements of a transition to Net Zero.
Source: The Royal Society (2020) Digital technology and the planet: harnessing computing to achieve net zero;
Energy Systems Catapult (2020) Digitalisation for Net Zero; Imperial College London (2020) Digitalisation of Energy
ii) Innovation in our scenarios
Our advice on the Sixth Carbon Budget draws from a range of scenarios, which
cover a broad scope of ambition on the availability of innovative low-carbon
technologies, the cost of technologies, the rapid uptake of technologies and
behaviour change. Three of our scenarios - Widespread Innovation, Tailwinds and
Widespread Engagement - are deliberately more optimistic around the available
opportunities for social change and/or technology development (Table 9.1),
whereas the Balanced Net Zero Pathway and Headwinds are more conservative in
their approach.
Most technologies in our scenarios are deployable at scale today, and in some
cases (such as renewables, and electric vehicles) are already cheaper, or are
expected to be cheaper than the high-carbon alternative. Other technologies,
such as carbon capture and storage, are considered proven technologies, but
given their importance in our scenarios require early demonstration to ensure they
can operate at high efficiencies and CO2 capture rates. In all cases policy should
establish the conditions for mass market deployment and, support innovation
towards a goal of continued cost reduction.
Our scenarios also consider innovation in business models and behaviour, in order
to increase the uptake of low-carbon technologies.
• Diet change involving reduced meat and dairy consumption of up to 50%
compared today, replaced by plant-based foods, or lab grown meat.
• Heat as a service business models, to overcome barriers, unlock flexibility
benefits and reduce costs of installing and using low-carbon heating
technologies.
• Moving towards a circular economy by ensuring that product design
maximises re-use of materials and minimises waste over the products
lifetime can reduce emissions in UK manufacturing.
Our scenarios go further than our 2019 Net Zero advice by including more rapid technology improvements, as well as more novel technologies and business models.
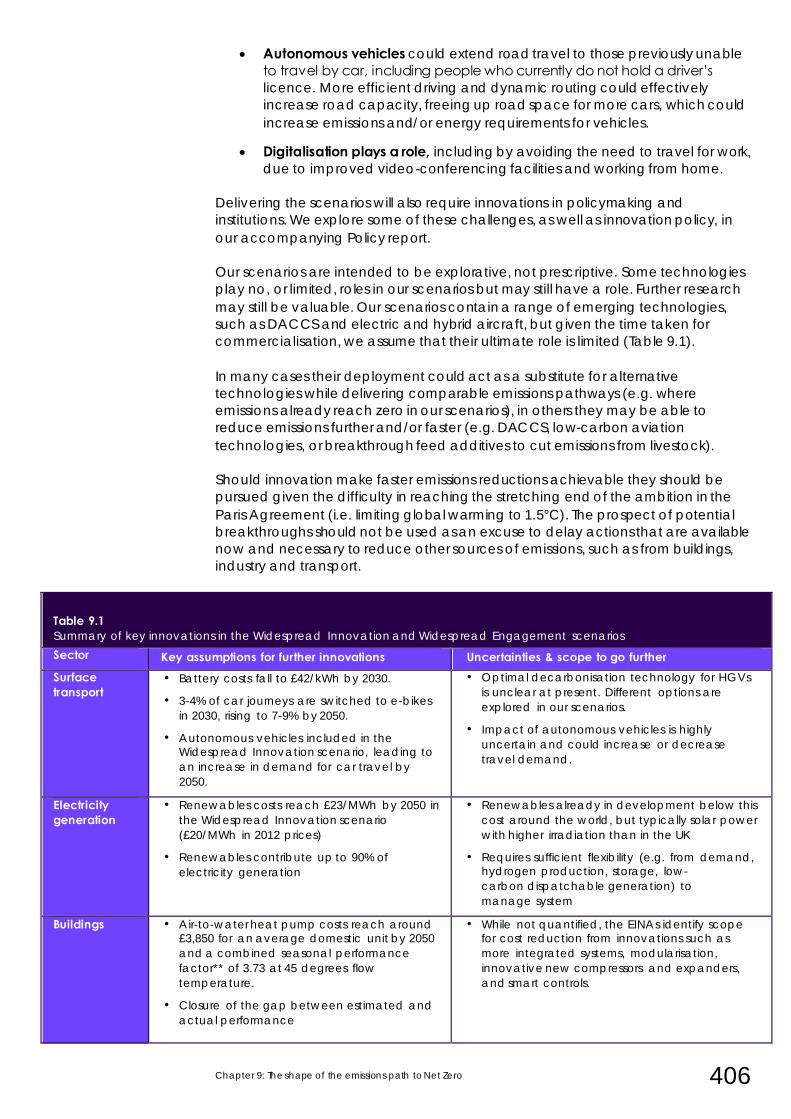
Chapter 9: The shape of the emissions path to Net Zero 406
• Autonomous vehicles could extend road travel to those previously unable
to travel by car, including people who currently do not hold a driver’s
licence. More efficient driving and dynamic routing could effectively
increase road capacity, freeing up road space for more cars, which could
increase emissions and/or energy requirements for vehicles.
• Digitalisation plays a role, including by avoiding the need to travel for work,
due to improved video-conferencing facilities and working from home.
Delivering the scenarios will also require innovations in policymaking and
institutions. We explore some of these challenges, as well as innovation policy, in
our accompanying Policy report.
Our scenarios are intended to be explorative, not prescriptive. Some technologies
play no, or limited, roles in our scenarios but may still have a role. Further research
may still be valuable. Our scenarios contain a range of emerging technologies,
such as DACCS and electric and hybrid aircraft, but given the time taken for
commercialisation, we assume that their ultimate role is limited (Table 9.1).
In many cases their deployment could act as a substitute for alternative
technologies while delivering comparable emissions pathways (e.g. where
emissions already reach zero in our scenarios), in others they may be able to
reduce emissions further and/or faster (e.g. DACCS, low-carbon aviation
technologies, or breakthrough feed additives to cut emissions from livestock).
Should innovation make faster emissions reductions achievable they should be
pursued given the difficulty in reaching the stretching end of the ambition in the
Paris Agreement (i.e. limiting global warming to 1.5°C). The prospect of potential
breakthroughs should not be used as an excuse to delay actions that are available
now and necessary to reduce other sources of emissions, such as from buildings,
industry and transport.
able 1.11:Table 1.11
Table 9.1 Summary of key innovations in the Widespread Innovation and Widespread Engagement scenarios
Sector Key assumptions for further innovations Uncertainties & scope to go further Surface transport
• Battery costs fall to £42/kWh by 2030.
• 3-4% of car journeys are switched to e-bikes
in 2030, rising to 7-9% by 2050.
• Autonomous vehicles included in the Widespread Innovation scenario, leading to
an increase in demand for car travel by
2050.
• Optimal decarbonisation technology for HGVs
is unclear at present. Different options are
explored in our scenarios.
• Impact of autonomous vehicles is highly
uncertain and could increase or decrease
travel demand.
Electricity generation
• Renewables costs reach £23/MWh by 2050 in
the Widespread Innovation scenario
(£20/MWh in 2012 prices)
• Renewables contribute up to 90% of
electricity generation
• Renewables already in development below this
cost around the world, but typically solar power
with higher irradiation than in the UK
• Requires sufficient flexibility (e.g. from demand, hydrogen production, storage, low-
carbon dispatchable generation) to
manage system
Buildings • Air-to-water heat pump costs reach around £3,850 for an average domestic unit by 2050
and a combined seasonal performance
factor** of 3.73 at 45 degrees flow
temperature.
• Closure of the gap between estimated and
actual performance
• While not quantified, the EINAs identify scope for cost reduction from innovations such as
more integrated systems, modularisation,
innovative new compressors and expanders,
and smart controls.
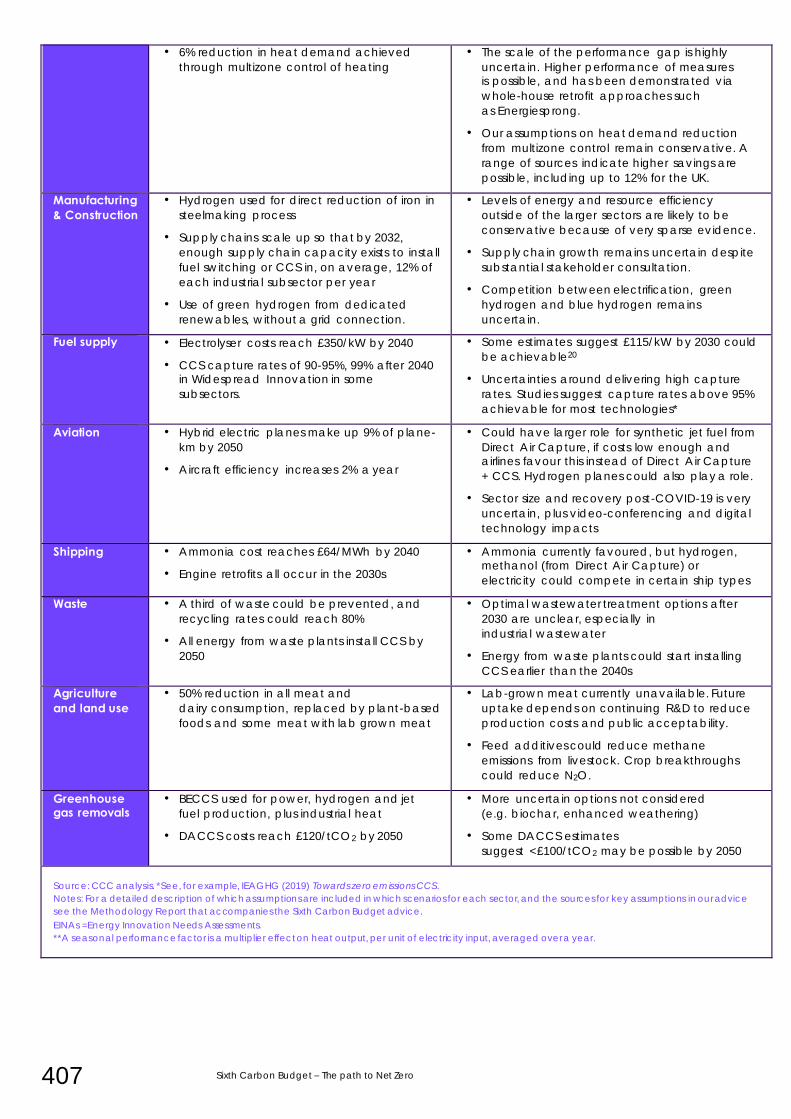
407 Sixth Carbon Budget – The path to Net Zero
• 6% reduction in heat demand achieved
through multizone control of heating
• The scale of the performance gap is highly
uncertain. Higher performance of measures is possible, and has been demonstrated via
whole-house retrofit approaches such
as Energiesprong.
• Our assumptions on heat demand reduction
from multizone control remain conservative. A
range of sources indicate higher savings are
possible, including up to 12% for the UK.
Manufacturing & Construction
• Hydrogen used for direct reduction of iron in
steelmaking process
• Supply chains scale up so that by 2032,
enough supply chain capacity exists to install
fuel switching or CCS in, on average, 12% of
each industrial subsector per year
• Use of green hydrogen from dedicated
renewables, without a grid connection.
• Levels of energy and resource efficiency
outside of the larger sectors are likely to be
conservative because of very sparse evidence.
• Supply chain growth remains uncertain despite
substantial stakeholder consultation.
• Competition between electrification, green
hydrogen and blue hydrogen remains
uncertain.
Fuel supply • Electrolyser costs reach £350/kW by 2040
• CCS capture rates of 90-95%, 99% after 2040 in Widespread Innovation in some
subsectors.
• Some estimates suggest £115/kW by 2030 could
be achievable20
• Uncertainties around delivering high capture
rates. Studies suggest capture rates above 95%
achievable for most technologies*
Aviation • Hybrid electric planes make up 9% of plane-
km by 2050
• Aircraft efficiency increases 2% a year
• Could have larger role for synthetic jet fuel from
Direct Air Capture, if costs low enough and airlines favour this instead of Direct Air Capture
+ CCS. Hydrogen planes could also play a role.
• Sector size and recovery post-COVID-19 is very
uncertain, plus video-conferencing and digital
technology impacts
Shipping • Ammonia cost reaches £64/MWh by 2040
• Engine retrofits all occur in the 2030s
• Ammonia currently favoured, but hydrogen, methanol (from Direct Air Capture) or
electricity could compete in certain ship types
Waste • A third of waste could be prevented, and
recycling rates could reach 80%
• All energy from waste plants install CCS by
2050
• Optimal wastewater treatment options after
2030 are unclear, especially in
industrial wastewater
• Energy from waste plants could start installing
CCS earlier than the 2040s
Agriculture and land use
• 50% reduction in all meat and
dairy consumption, replaced by plant-based
foods and some meat with lab grown meat
• Lab-grown meat currently unavailable. Future
uptake depends on continuing R&D to reduce
production costs and public acceptability.
• Feed additives could reduce methane
emissions from livestock. Crop breakthroughs
could reduce N2O.
Greenhouse gas removals
• BECCS used for power, hydrogen and jet
fuel production, plus industrial heat
• DACCS costs reach £120/tCO2 by 2050
• More uncertain options not considered
(e.g. biochar, enhanced weathering)
• Some DACCS estimates
suggest <£100/tCO2 may be possible by 2050
Source: CCC analysis. *See, for example, IEAGHG (2019) Towards zero emissions CCS .
Notes: For a detailed description of which assumptions are included in which scenarios for each sector, and the sources for key assumptions in our advice
see the Methodology Report that accompanies the Sixth Carbon Budget advice.
EINAs =Energy Innovation Needs Assessments.
**A seasonal performance factor is a multiplier effect on heat output, per unit of electricity input, averaged over a year.
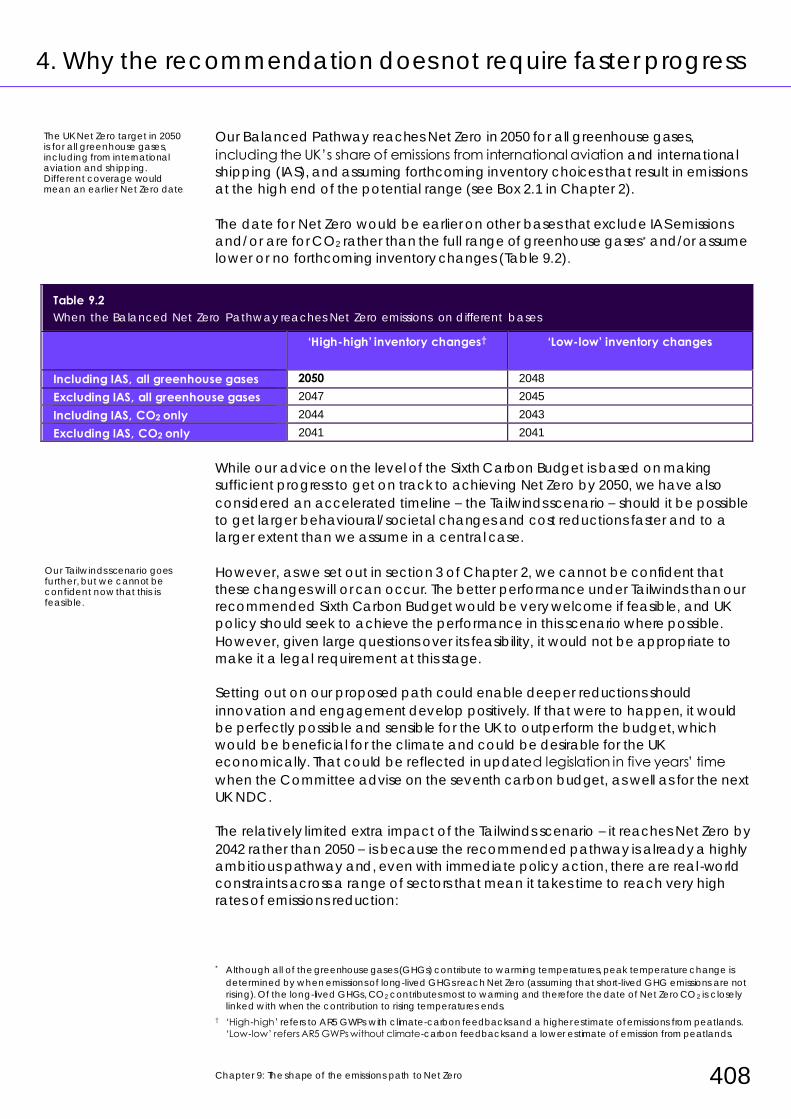
Chapter 9: The shape of the emissions path to Net Zero 408
4. Why the recommendation does not require faster progress
Our Balanced Pathway reaches Net Zero in 2050 for all greenhouse gases,
including the UK’s share of emissions from international aviation and international
shipping (IAS), and assuming forthcoming inventory choices that result in emissions
at the high end of the potential range (see Box 2.1 in Chapter 2).
The date for Net Zero would be earlier on other bases that exclude IAS emissions
and/or are for CO2 rather than the full range of greenhouse gases* and/or assume
lower or no forthcoming inventory changes (Table 9.2).
Table 9.2
When the Balanced Net Zero Pathway reaches Net Zero emissions on different bases
‘High-high’ inventory changes† ‘Low-low’ inventory changes
Including IAS, all greenhouse gases 2050 2048
Excluding IAS, all greenhouse gases 2047 2045
Including IAS, CO2 only 2044 2043
Excluding IAS, CO2 only 2041 2041
While our advice on the level of the Sixth Carbon Budget is based on making
sufficient progress to get on track to achieving Net Zero by 2050, we have also
considered an accelerated timeline – the Tailwinds scenario – should it be possible
to get larger behavioural/societal changes and cost reductions faster and to a
larger extent than we assume in a central case.
However, as we set out in section 3 of Chapter 2, we cannot be confident that
these changes will or can occur. The better performance under Tailwinds than our
recommended Sixth Carbon Budget would be very welcome if feasible, and UK
policy should seek to achieve the performance in this scenario where possible.
However, given large questions over its feasibility, it would not be appropriate to
make it a legal requirement at this stage.
Setting out on our proposed path could enable deeper reductions should
innovation and engagement develop positively. If that were to happen, it would
be perfectly possible and sensible for the UK to outperform the budget, which
would be beneficial for the climate and could be desirable for the UK
economically. That could be reflected in updated legislation in five years’ time
when the Committee advise on the seventh carbon budget, as well as for the next
UK NDC.
The relatively limited extra impact of the Tailwinds scenario – it reaches Net Zero by
2042 rather than 2050 – is because the recommended pathway is already a highly
ambitious pathway and, even with immediate policy action, there are real-world
constraints across a range of sectors that mean it takes time to reach very high
rates of emissions reduction:
* Although all of the greenhouse gases (GHGs) contribute to warming temperatures, peak temperature change is
determined by when emissions of long-lived GHGs reach Net Zero (assuming that short-lived GHG emissions are not
rising). Of the long-lived GHGs, CO2 contributes most to warming and therefore the date of Net Zero CO2 is closely
linked with when the contribution to rising temperatures ends.
† ‘High-high’ refers to AR5 GWPs with climate-carbon feedbacks and a higher estimate of emissions from peatlands.
‘Low-low’ refers AR5 GWPs without climate-carbon feedbacks and a lower estimate of emission from peatlands.
The UK Net Zero target in 2050 is for all greenhouse gases, including from international aviation and shipping. Different coverage would mean an earlier Net Zero date.
Our Tailwinds scenario goes further, but we cannot be confident now that this is feasible.
409 Sixth Carbon Budget – The path to Net Zero
• Developing supply chains, business models and markets. Even for known
technologies, it takes time to develop whole supply chains, build skills,
manufacture and construct the required capacity, build confidence
amongst business and the public and develop effective new business
models. Our assessment is that this is likely to take close to a decade for the
buildings and transport sectors, even with a strong policy framework to
drive these changes.
• Infrastructure development. The transition to Net Zero will require expansion
of existing infrastructure (e.g. electricity grids and electric vehicle charging
networks), development of new ones (e.g. for CO2 transport and storage)
and potential repurposing of fossil infrastructure to be low-carbon (i.e.
conversion of gas networks to hydrogen). These developments generally
have significant lead-times. Uptake of new technologies such as electric
vehicles, hydrogen and CCS will be limited or non-existent until supporting
infrastructure is sufficiently developed.
• The need for pilots and demonstrations prior to mass deployment. As set out
in section 3, it is important to trial potential large-scale solutions to reduce
emissions before committing to them to the exclusion of other options.
While this can push back the timeline for widespread deployment slightly, it
is likely to be worthwhile to avoid the risk that unforeseen issues arise that
derail the entire programme.
Given these challenges, there are risks of trying to go too fast that could backfire
and undermine a more ambitious target.
• Requiring an extremely rapid transition to Net Zero could have unintended
consequences, as feasible options to reduce emissions are limited. This
could lead to a dash for options to fill the gap, which could include large-
scale use of biomass (e.g. with CCS to provide greenhouse gas removals).
This may imply a high reliance on imported biomass, potentially beyond
what can be supplied sustainably and driving unwelcome land-use
changes in other countries.
• Going beyond the natural rate of stock turnover would lead to premature
scrappage of assets (e.g. vehicles, boilers), which could be costly and risk
undermining popular support for transition and increasing embedded
emissions.
• A smooth transition is likely to be a just transition, avoiding stop-start
programmes for the jobs market and investment. An attempt to make the
transition too quickly would make a just transition more difficult to achieve
as it would imply stop-go replacement profiles.
• Emissions reduction targets that are too ambitious to be credibly del ivered
could undermine the international influence of strengthened UK targets. A
significant aspect of the UK’s international influence comes from the
expectation that once set these targets will be met or exceeded.
Our Balanced Net Zero Pathway has been designed to be ambitious on emissions
reductions over the next 15 years, subject to the real-world considerations and
given uncertainty on how supportive people will be of the transition in their choices
and behaviours and how quickly technologies will develop.
We note that some groups have proposed even faster transitions, for example
reaching Net Zero emissions by 2030, or even 2025. The Committee consider such
dates to be implausible to deliver against, and potentially self-defeating as a goal.
It is important to be ambitious but without requiring steps that would undermine the transition.
Chapter 9: The shape of the emissions path to Net Zero 410
• Even under the very extreme changes in behaviour during the national
lockdown earlier this year, emissions were only reduced by around a third,
demonstrating that technological changes would also be needed. We
have not seen evidence to demonstrate that these can be developed,
manufactured and rolled out in full over the next five to ten years. We also
note that over three-quarters of our emissions reduction from nature-based
solutions would not be able to deliver on this timeline given the lags from
planting to sequestering of carbon.
• Targeting such an early date for Net Zero would bring a host of perverse
outcomes, which could undermine the global effort to cut emissions and
would be out of line with the findings of the Climate Assembly:
– While in-use emissions might be cut, embedded emissions would
increase as products were scrapped before the end of their lives. Risks
of carbon leakage could increase, with emissions overseas increasing
to replace UK reductions.
– Public (and business) support for the transition could be lost. It seems
highly unlikely that the needs of a just transition could still be met –
wholesale job losses would be expected in some locations with little
lead-time for example for retraining. Without sufficient time to shift to
low-carbon heating systems, consumer heating demands could not
be met.
– The sorts of draconian measures required to get close to such radical
targets, along with the inevitable failure in meeting them could make
adoption of stretching targets by other countries less likely, rather than
more likely. The UK has offered a positive example of emissions
reduction alongside economic growth, and the goal should be to
continue that example.
– An accelerated transition would go against some of the key principles
of the Climate Assembly.21 This includes preferences for long-term
planning towards a phased transition and the need for a joined-up
approach across the system and all levels of society.
However, as we set out in Chapter 7, there are legitimate analyses based on
different approaches to equity considerations that point to larger contributions
from the UK and other rich countries with a large historical contribution to global
warming. We conclude in Chapter 7 that increased contributions beyond the
ambitious goals for the UK’s domestic emissions that we propose in this report
would be best delivered through increased support for global efforts (e.g. through
climate finance), rather than by setting implausible goals for the UK’s domestic
emissions.
Carbon budgets should set ambitious requirements for UK domestic action. The UK can further support global action in ways that are better than setting targets that are implausible.
411 Sixth Carbon Budget – The path to Net Zero
1 See, for example, Cambridge Econometrics (2020) Assessment of Green Recovery plans after
COVID-19 (a report for the We Mean Business Coalition).
2 BEIS (2020) Public Attitudes Tracker
3 CBI (2019) The Low-Carbon 2020s – a decade of delivery 4 See CCC (2020) The role of business in delivering the UK's Net Zero ambition
5 See CCC (2020) Local Authorities and the Sixth Carbon Budget
6 BEIS (2020) Public Attitudes Tracker; Energy Systems Catapult (2020) Net Zero: A Consumer Perspective.
7 Gross et al. (2018) How long does innovation and commercialisation in the energy sectors take?
8 See 4 9 Wilson et al. (2020) Granular technologies to accelerate decarbonization; Rubin et al. (2015) A
review of learning rates for electricity supply technologies 10 Lang (2017) Nuclear Power Learning and Deployment Rates; Disruption and Global Benefits
Forgone 11 See 7
12 Developer estimate from EdF. World Nuclear News (2018) EDF Energy expects 20% cost saving
for Sizewell C
13 POST (2018) POSTnote 580 - Small Modular Nuclear Reactors
14 BEIS (2019) Energy Innovation Needs Assessments
15 See 11 16 See, for example, The Future of Flight Fund: UKRI (2020) Future of mobility
https://www.ukri.org/our-work/delivering-economic-impact/industrial-strategy-challenge-
fund/future-of-mobility/
17 CCC (2020) Insights Briefings: Sharing the UK approach to addressing climate change 18 See Advisory Group report on The Road to Net Zero Finance, available at www.theccc.org.uk
19 BECCS = Bioenergy with carbon capture and storage; DACCS = direct air capture with carbon
capture and storage.
20 See for example Agora Energiewende (2019) EU-wide innovation support is key to the success of
electrolysis manufacturing in Europe (Figure 1)
21 Climate Assembly UK (2020) The path to net zero
Chapter 10: Recommendations on the Sixth Carbon Budget 412
Recommendations on the Sixth
Carbon Budget
1. The Sixth Carbon Budget level and emissions accounting 416
2. Nationally Determined Contribution for 2030 428
3. Increasing effort during existing carbon budgets 430
4. Traded-sector emissions and UK emission trading system cap 436
5. Next steps: A Net Zero plan and monitoring of progress 440
Chapter 10: Recommendations on the Sixth Carbon Budget 414
Introduction and key messages
This Chapter sets out the Committee’s recommendations, as required by the
Climate Change Act, based on the analysis set out in the rest of this report.
• Budget level. We recommend that the Sixth Carbon Budget for 2033-2037 is
set at 965 MtCO2e, implying a reduction in emissions to 2035 of 78% from
1990 levels or 63% from 2019.
• Budget scope. Our recommended budget includes emissions from the UK’s
share of international aviation and international shipping (IAS). It also allows
for forthcoming changes to the UK’s emissions inventory to fully incorporate
the emissions from peatlands and the IPCC’s latest estimates for the global
warming potential of different greenhouse gases.
– The Committee do not consider the previous approach of allowing
‘headroom’ for aviation and shipping emissions to be sufficient, given
the importance of these emissions and the risk of different treatments
in UK legislation being seen as unfair.
– While there remains some uncertainty on the non-CO2 effects of
aviation, it is clear that these have a warming effect on top of that
from its CO2 emissions. While it is not scientifically valid to account for
these impacts on a ‘CO2-equivalent’ basis, action to limit these
impacts will be needed – just dealing with aviation CO2 is not enough.
• Judging performance. We recommend that the Government plan to meet
the Sixth Carbon Budget through reductions in actual UK emissions and UK
greenhouse gas removals.
– UK-based engineered greenhouse gas removals should be allowed to
meet the carbon budgets and the Net Zero target.
– International carbon credits should not be used to meet the budget,
though they may be useful policy tools and appropriate ways to go
beyond the carbon budgets to support global decarbonisation efforts.
– Should the UK’s participation in the EU Emissions Trading System (EU
ETS) be replaced with a UK ETS linked with the EU system, we will
provide further advice on how to account for cross-border trading
under the carbon budgets.
• The UK’s Nationally Determined Contribution. We recommend that the UK
NDC is set to require at least a 68% reduction from 1990 to 2030 on a basis
that excludes emissions from international aviation and international
shipping, in line with UN convention.
– The headline reduction of at least 68% should be accompanied with a
clear statement of intent to tackle IAS emissions. For example, that
could include a commitment to include them in the UK’s Sixth Carbon
Budget, a 2030 target for IAS emissions and new strategies for reducing
emissions from both shipping and aviation to Net Zero.
– This ambition should be within a transparent NDC that also signals the
UK’s contributions on climate finance, technology development and
capacity building, and plans on adaptation.
– The Government could choose to use credits to go beyond the 68%
reduction as a greater international contribution.
Our recommended Sixth Carbon Budget means a 63% reduction in emissions vs. 2019.
A full scope of greenhouse gas emissions should be included.
The Budget reflects actions required in the UK.
We recommend an NDC on the same path as the Sixth Carbon Budget.
415 Sixth Carbon Budget – The path to Net Zero
• The Fifth Carbon Budget. Emissions must fall more quickly to 2030 than
required by the currently legislated Fifth Carbon Budget, and policy must
be strengthened further than previously planned to deliver greater action. It
is for the Government to decide whether the currently legislated budgets
should be amended to bring them in line with the Net Zero 2050 target,
however the Committee does not consider it necessary to change the
budget level in law – the focus should be on developing policy to deliver
the new Sixth Carbon Budget and the UK’s NDC for 2030.
• UK Emissions Trading System. We recommend that the cap for the UK ETS
should be set in line with the Balanced Net Zero Pathway developed in this
report, implying a 53% reduction in emissions from 2019 to 2030 for the
sectors currently covered by the EU ETS. In the case that a UK ETS is not
established, the same level of emissions reductions should be targeted in
these sectors.
• Net Zero Plan. We recommend that the Government accept the advice in
this report as soon as possible and set out their policies to deliver against it
in the first half of 2021. The expected impact of policies, including those in
early planning, should be clearly quantified and in sum be enough to meet
the budget.
• Consumption emissions. While territorial emissions remain the best basis for
UK carbon budgets, the Committee will continue to scrutinise progress on
consumption emissions as well, and to recommend policies that reduce
both. We will monitor consumption emissions against a Paris-aligned
trajectory in our future annual Progress Reports to Parliament. If UK territorial
emissions are reduced to Net Zero and UK trading partners reduce their
emissions in line with the Paris Agreement we estimate (in Chapter 7) that
UK consumption emissions would be around 90% below 1990 levels in 2050.
This chapter is set out in six sections:
1. The Sixth Carbon Budget level and emissions accounting
2. Nationally Determined Contribution for 2030
3. Increasing effort during existing carbon budgets
4. Traded-sector emissions and UK emission trading system cap
5. Next steps: A Net Zero plan and monitoring of progress
A Government plan for Net Zero and the Sixth Carbon Budget is needed as soon as possible.
Territorial emissions are the best basis for UK targets, but we will track consumption emissions against a Paris-aligned trajectory.
Chapter 10: Recommendations on the Sixth Carbon Budget 416
1. The Sixth Carbon Budget level and emissions accounting
This section sets out our recommended level for the Sixth Carbon Budget and the
basis on which it should be measured. It is in seven parts:
a) The level of the Sixth Carbon Budget
b) Judging performance based on actual emissions
c) Inclusion of international aviation & shipping in carbon budgets
d) Non-CO2 impacts of aviation and shipping
e) The contribution of greenhouse gas removals
f) The use of international carbon offsets or credits
g) Accounting for all UK greenhouse gas emissions in full
a) The level of the Sixth Carbon Budget
The Committee recommends a Sixth Carbon Budget of 965 MtCO2e, including emissions from the UK’s share of international aviation and shipping (IAS).
The reduction of emissions on this scope to 191 MtCO2e per year in 2035 represents
a 78% reduction in emissions on 1990 levels, a 63% reduction against 2019 levels
and a 72% reduction against 2010 levels (Figure 10.1).
This recommended budget aligns to the Balanced Net Zero Pathway set out in
Chapters 2 and 3, which was built on multiple lines of evidence and takes into
account what is feasible and what is necessary to get on track to Net Zero by 2050.
Delivering the budget will require progress on all emissions sources and scaling up
investment and supply chains so that almost all new purchases and investments
are zero-carbon by around 2030, together with development and deployment of
greenhouse gas removal options, and adoption of low-carbon behaviours.
We assess it to be a fair pathway that is compatible with global efforts to limit
warming to 1.5°C. It would reduce per-capita emissions in the UK by 2035 to the
global average level of per-capita emissions from the median of the IPCC’s
pathways for limiting warming to 1.5°C with a 50% probability.
Our recommended Sixth Carbon Budget means a 63% reduction in emissions vs. 2019.
We assess it to be a fair contribution to the aims of the Paris Agreement.
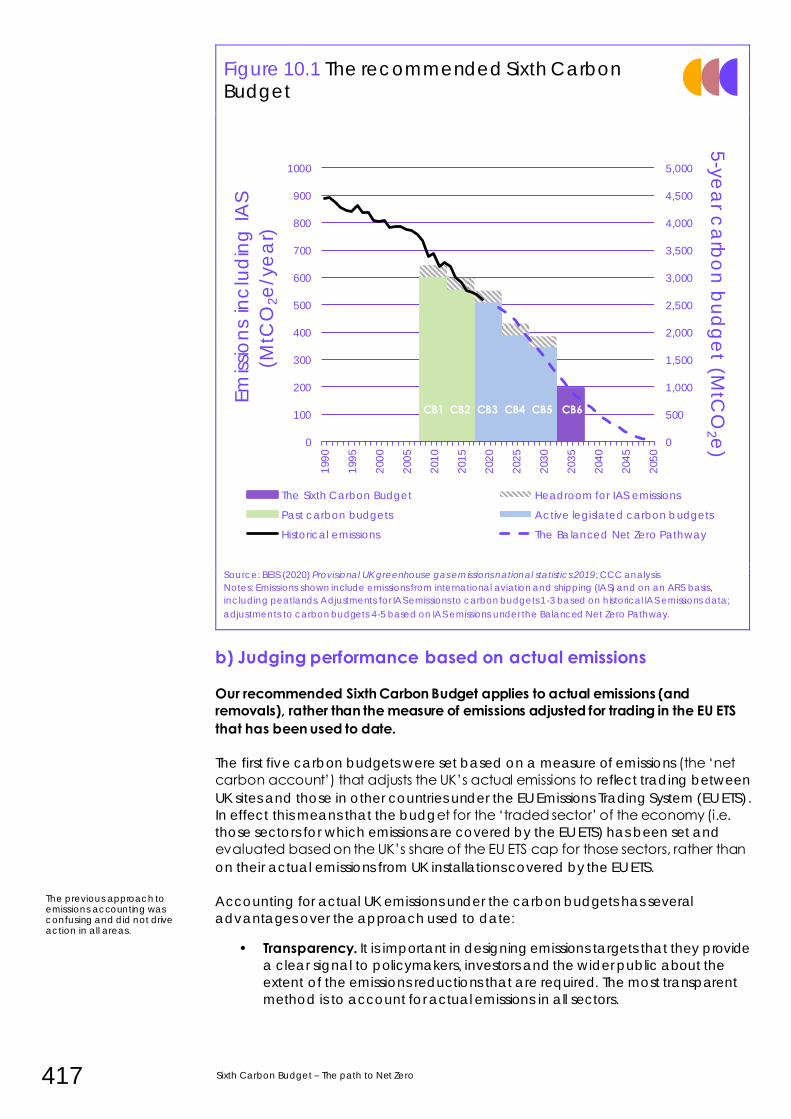
417 Sixth Carbon Budget – The path to Net Zero
Figure 10.1 The recommended Sixth Carbon Budget
Source: BEIS (2020) Provisional UK greenhouse gas emissions national statistics 2019; CCC analysis
Notes: Emissions shown include emissions from international aviation and shipping (IAS) and on an AR5 basis,
including peatlands. Adjustments for IAS emissions to carbon budgets 1-3 based on historical IAS emissions data;
adjustments to carbon budgets 4-5 based on IAS emissions under the Balanced Net Zero Pathway.
b) Judging performance based on actual emissions
Our recommended Sixth Carbon Budget applies to actual emissions (and removals), rather than the measure of emissions adjusted for trading in the EU ETS that has been used to date.
The first five carbon budgets were set based on a measure of emissions (the ‘net
carbon account’) that adjusts the UK’s actual emissions to reflect trading between
UK sites and those in other countries under the EU Emissions Trading System (EU ETS).
In effect this means that the budget for the ‘traded sector’ of the economy (i.e.
those sectors for which emissions are covered by the EU ETS) has been set and
evaluated based on the UK’s share of the EU ETS cap for those sectors, rather than
on their actual emissions from UK installations covered by the EU ETS.
Accounting for actual UK emissions under the carbon budgets has several
advantages over the approach used to date:
• Transparency. It is important in designing emissions targets that they provide
a clear signal to policymakers, investors and the wider public about the
extent of the emissions reductions that are required. The most transparent
method is to account for actual emissions in all sectors.
The previous approach to emissions accounting was confusing and did not drive action in all areas.
0
500
1,000
1,500
2,000
2,500
3,000
3,500
4,000
4,500
5,000
0
100
200
300
400
500
600
700
800
900
1000
199
0
199
5
200
0
200
5
201
0
201
5
202
0
202
5
203
0
203
5
204
0
204
5
205
0
5-y
ea
r ca
rbo
n b
ud
ge
t (MtC
O2 e
)
Em
issio
ns
inc
lud
ing
IA
S
(MtC
O2e
/ye
ar)
The Sixth Carbon Budget Headroom for IAS emissions
Past carbon budgets Active legislated carbon budgets
Historical emissions The Balanced Net Zero Pathway
CB1 CB2 CB3 CB4 CB5 CB6 CB6
Chapter 10: Recommendations on the Sixth Carbon Budget 418
• Recognition of efforts. Long-term decarbonisation of the economy will
require contributions from all sectors. Emissions accounting approaches
that treat some sectors differently may distort decarbonisation strategies
(e.g. leading to use of finite bioenergy resources in sectors where emissions
reductions ‘count’ rather than where they are most cost-effective).
• Policy focus. The carbon budgets framework is designed to drive policy
action to reduce emissions. It is essential that the emissions accounting
system requires appropriate UK policy actions across all sectors.
• Recognising the dynamics of trading systems.
– The ‘net carbon account’ measure assumes that a trading system cap
will be binding once set. That has not been the experience through
the EU ETS – parallel climate policies, particularly support for renewable
energy, together with weaker than expected economic performance
following the financial crisis, led to emissions being below the cap on a
sustained basis.
– That has allowed caps for future phases to be set at a lower level,
while mechanisms like the Market Stability Reserve have removed
emissions allowances in the current phase. This has resulted in the UK’s
share of the EU ETS emissions cap being lower than expected,
meaning that the UK carbon budgets have ended up being too loose.
Moreover, the UK’s departure from the EU ETS means that the measure adjusted for
trading with participants in other countries may no longer be meaningful for the
Sixth Carbon Budget, or indeed any carbon budgets from now on (see section 4).
At the time of writing, it is unclear whether the UK will replace its participation in the
EU ETS with a UK ETS that is linked to the EU ETS, or whether there will be a UK-only
solution (e.g. a tax or a UK ETS that is not linked to the EU ETS).
We recommend that the Government makes plans to meet the Sixth Carbon
Budget on the basis of actual UK emissions and removals. Should the replacement
scheme involve cross-border emissions trading, the Committee will advise on
ensuring that this is treated appropriately under carbon budget accounting.
c) Inclusion of international aviation & shipping in carbon budgets
The Climate Change Act allows the Government to decide to include the UK’s
share of international aviation and international shipping (IAS) emissions in carbon
budgets and the 2050 (Net Zero) target. Under section 35 of the Act, when
recommending a carbon budget the Committee must also advise on whether IAS
should be included with its scope. We advise that IAS emissions should be included in the Sixth Carbon Budget.
To date, IAS emissions have been accounted for, but not formally included in the
budgets or 2050 target:
• Carbon budgets have been set excluding IAS emissions, but with lower
emissions allowed for the other sectors to leave headroom for IAS emissions.
• The Government has recognised the need to include IAS emissions within its
planning for meeting the 2050 target, both for the previous 80% target and
again for the Net Zero target.1 This recognition is consistent with the
approach of the Committee when recommending these targets.
Having left the EU, the previous accounting approach may no longer be meaningful in any case.
The Budget reflects actions required in the UK.
So far, carbon budgets have not formally included international aviation and shipping (IAS) emissions, but have allowed for them.
419 Sixth Carbon Budget – The path to Net Zero
However, it is important to include these emissions formally in the legislated targets,
rather than only being considered as a planning assumption, to guide long-term
policy approaches and infrastructure investment decisions:
• Complete scope of emissions. It is important that all sources of greenhouse
gas emissions should be tackled, and that the scope of targets should
reflect this. This is particularly relevant for aviation, which is likely to be the
second-largest emitting sector in the UK by 2050, even with strong progress
on technology and limiting demand growth. Continued exclusion from
carbon budgets gives an impression of special treatment and raises
questions over fairness for other sectors.
• UK influence and supplementary levers. While the primary policy
approaches to tackling IAS emissions should be international, the UK is a key
player in driving strong international mechanisms. Some supplementary UK
policy levers are also available that would not impact on the
competitiveness of the IAS sectors. It is important that the UK Government
prioritises both of these avenues (see our accompanying Policy Report).
• Flexibility. Including IAS emissions within the formal scope of the Climate
Change Act targets provides extra flexibility in meeting them. Whereas their
exclusion would mean that allowance has to be made outside the target
for these emissions, inclusion opens up the possibility for the IAS sectors to
achieve more and contribute more to meeting the UK’s emissions targets.
• Need for integration with wider Net Zero strategy. The UK’s overall emissions
reduction strategy should be integrated across the economy. This includes
requirements for fuelling infrastructure and supply of alternative fuels (e.g.
hydrogen, ammonia, synthetic fuels) and the overall scale of greenhouse
gas removals to balance remaining emissions to reach Net Zero.
• Inclusion of IAS is manageable. While the United Nations Framework
Convention on Climate Change (UNFCCC) treats emissions from
international aviation and international shipping separately from emissions
solely within country borders, allocating these emissions to countries
presents no fundamentally greater challenges than for other sectors
already included in UK emissions targets:
– Emissions are already estimated and reported to the UN and can be
included in UK emissions targets on the same basis.
The uncertainty attached to estimates of IAS emissions is no higher
than for other sectors covered by carbon budgets (Box 10.1).
– While careful policy design is necessary to avoid simply pushing
emissions abroad, such considerations also apply to sectors already
covered by carbon budgets (e.g. manufacturing and agriculture).
– Inclusion in the UK carbon budgets does not preclude exclusion in
communications to the UN, as we recommend for the UK’s 2030 NDC.
It is important and feasible to include IAS emissions formally in the legislated targets.
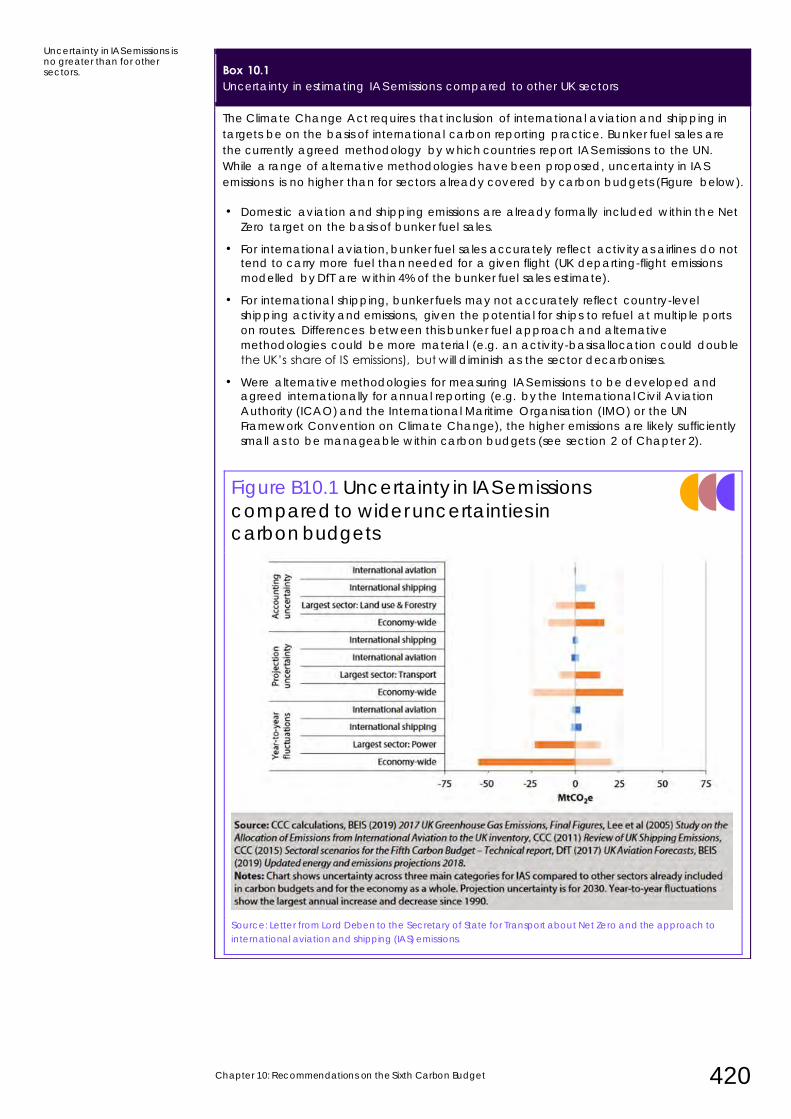
Chapter 10: Recommendations on the Sixth Carbon Budget 420
Box 10.1 Uncertainty in estimating IAS emissions compared to other UK sectors
The Climate Change Act requires that inclusion of international aviation and shipping in
targets be on the basis of international carbon reporting practice. Bunker fuel sales are
the currently agreed methodology by which countries report IAS emissions to the UN.
While a range of alternative methodologies have been proposed, uncertainty in IAS
emissions is no higher than for sectors already covered by carbon budgets (Figure below).
• Domestic aviation and shipping emissions are already formally included within the Net
Zero target on the basis of bunker fuel sales.
• For international aviation, bunker fuel sales accurately reflect activity as airlines do not tend to carry more fuel than needed for a given flight (UK departing-flight emissions
modelled by DfT are within 4% of the bunker fuel sales estimate).
• For international shipping, bunker fuels may not accurately reflect country-level
shipping activity and emissions, given the potential for ships to refuel at multiple ports
on routes. Differences between this bunker fuel approach and alternative
methodologies could be more material (e.g. an activity-basis allocation could double
the UK’s share of IS emissions), but w ill diminish as the sector decarbonises.
• Were alternative methodologies for measuring IAS emissions to be developed and agreed internationally for annual reporting (e.g. by the International Civil Aviation
Authority (ICAO) and the International Maritime Organisation (IMO) or the UN
Framework Convention on Climate Change), the higher emissions are likely sufficiently
small as to be manageable within carbon budgets (see section 2 of Chapter 2).
Figure B10.1 Uncertainty in IAS emissions
compared to wider uncertainties in carbon budgets
Source: Letter from Lord Deben to the Secretary of State for Transport about Net Zero and the approach to
international aviation and shipping (IAS) emissions.
Uncertainty in IAS emissions is no greater than for other sectors.
421 Sixth Carbon Budget – The path to Net Zero
Inclusion of IAS emissions in UK climate targets does not equate to the adoption of
a unilateral policy approach to tackling these emissions, which could be argued to
undermine existing multilateral processes under the respective UN bodies (the
International Civil Aviation Authority (ICAO) and the International Maritime
Organisation (IMO)). Rather, it ensures that the UK takes full responsibility for these
emissions and that, where necessary, effort in other sectors can be altered to
ensure overall emissions are within the necessary limits.
The time has come for the UK to include IAS emissions formally in the Net Zero
target and also in the Sixth Carbon Budget, which finishes only 13 years before
2050.
We therefore conclude that IAS emissions should be included in carbon budgets as early as possible (see section 3), and certainly formally within the scope of the Sixth Carbon Budget and 2050 target. Alongside this, the UK should push for suitably strong international targets and mechanisms to deliver reductions in IAS emissions.
Should the international processes through the IMO and ICAO fail to set suitable
ambition, the UK could take subsequent action to decarbonise these sectors.
Ultimately, whether via a global scheme or a domestic/more limited international
mechanism, any remaining UK IAS emissions in 2050 will need to be balanced by
greenhouse gas removals in order for the sectors to achieve Net Zero.
The Climate Change Act requires that inclusion be on the basis of international
carbon reporting practice. Bunker fuel sales are the currently agreed methodology
by which countries report IAS emissions to the UN, and are therefore the
recommended method of inclusion. Uncertainties over future emissions accounting
methods are similar in size to those in other areas of the carbon budget and are
manageable within the overall envelope of emissions (see section 2 of Chapter 2).
The Committee does not consider the Government’s previous approach of
allowing ‘headroom’ for IAS emissions to be sustainable. Under this approach since
2008, progress has been insufficient:
• The processes under the IMO and ICAO have objectives for emissions
reduction that are less ambitious than the UK has adopted under its Net
Zero target and less ambitious than required to meet the goals of the Paris
Agreement.
• Updated UK aviation and shipping strategies to date have been delayed
(in part due to COVID-19), while previous plans have had limited ambition.
The Clean Maritime Plan considered options for decarbonising the shipping
sector, but did not formally commit to a 2050 target or trajectory. The
previous Aviation Strategy focused more on noise, air traffic modernisation
and expansion than on CO2 emissions and climate change.
• Aviation continues to be under-taxed relative to other emitting activities,
undermining efforts to limit demand for aviation.
Excluding emissions from international aviation and shipping from carbon budgets
and leaving headroom based on their appropriate contribution is therefore not a
credible approach.
If IAS emissions follow a ‘near-BAU’ path rather than reducing as in our Balanced
Net Zero Pathway, then emissions would be around 13 MtCO2e higher in 2035.
Were that to be the case, then emissions from other sectors would need to be
comparably lower to compensate – but the headroom approach would not
automatically require that.
Inclusion of IAS emissions in UK climate targets does not imply taking a unilateral policy approach for them.
It is time to include IAS emissions formally in the Net Zero target and carbon budgets.
The Government’s previous approach of allowing ‘headroom’ for IAS emissions is not enough.
Chapter 10: Recommendations on the Sixth Carbon Budget 422
d) Non-CO2 impacts of aviation and shipping
As well as CO2 emissions resulting from combustion of hydrocarbon fuels, aviation
and shipping result in a number of non-CO2 effects that are not currently within the
legal scope of carbon budgets or the basket of greenhouse gases used
internationally (i.e. CO2, methane, nitrous oxide and various F-gases). We set out
the implications of our scenarios for these aviation non-CO2 effects in Chapter 8.
• Aviation produces a range of different pollutants that affect the climate in
different ways. The most significant effect is from creation of contrails and
high cirrus clouds, although the impacts of these are short-lived. Measuring
these effects on an annual basis is challenging, given their short-term
nature and dependence on localised conditions. Some policies are
already in place to limit some of these non-CO2 effects, such as NOx due to
its impact on local air quality.
• Shipping has non-CO2 effects that come from the emission of sulphur
dioxide, which has an overall cooling effect on the climate but causes
local air pollution. However, improved fuel quality standards with
significantly lower sulphur contents came in to force in 2020, which will
reduce this cooling effect.
In both aviation and shipping these non-CO2 effects are mainly short-lived,
meaning that if they were stopped their effects on the climate would rapidly
disappear. In magnitude these have likely had a larger effect on the climate than
aviation CO2 emissions (see section 4 of Chapter 8).
Not all ways of reducing aviation CO2 emissions have equal implications for these
non-CO2 effects, with distance flown and total fuel burnt (regardless of whether this
is fossil jet fuel) important differentiators:
• Reduced demand for aviation. A reduction in flights that is sustained over
time would reduce the level of warming from aviation non-CO2 effects.
• Improved aircraft efficiency. Improvements in efficiency lead to less fuel
burnt per flight, and lower CO2 emissions. This would also lead to some
reduction in non-CO2 effects, but fractionally less than for the reduction in
CO2 emissions, as some aviation non-CO2 effects (e.g. contrail cirrus) are
driven primarily by the distance flown rather than the fuel burnt.
• Use of hydrocarbon sustainable aviation fuel (SAF). Using truly sustainable
aviation fuels would reduce fossil CO2 emissions from aviation, but would
not eliminate aviation non-CO2 effects. While there is early evidence
emerging that some SAF fuel types might generate less soot, and so
generate fewer cirrus clouds, this is yet to be validated at commercial
scale.
When considering how to limit emissions from aviation, it is therefore important to
recognise these non-CO2 effects are significant, and that constraining the total
distance flown each year has a greater relative benefit to the climate than
measures that reduce the carbon-intensity of flying.
While there remains uncertainty on the non-CO2 effects of aviation, and further
research is necessary, current best estimates show that aviation has a significant
warming effect on top of that from its CO2 emissions. Action to limit these non-CO2
climate effects will be necessary, although not at the expense of reducing CO2
emissions, which have a longer-lasting impact on the climate.
Aviation produces shorter-lived warming effects not captured by UN emissions accounting methods.
Limiting the total distance flown is the most effective way to limit non-CO2 impacts from aviation.
423 Sixth Carbon Budget – The path to Net Zero
Comparing aviation’s non-CO2 and CO2 effects and their relevant impacts on the
climate over different timescales is complex, and will be highly dependent on the
future demand and emissions trajectory for the sector. Attempting to consolidate
these non-CO2 effects down into a single metric (e.g. a multiplier to apply to CO2
emissions) for inclusion in UK targets would not be robust.
The Committee therefore do not currently recommend inclusion of non-CO2 effects of aviation or shipping within the budgets.
However, action to limit these effects is necessary – just dealing with aviation CO2 is
not enough. We therefore recommend a minimum goal that there should be no
additional aviation non-CO2 warming beyond 2050. We will monitor developments
on aviation (and shipping) non-CO2 effects, and the evidence of their impacts, in
our annual Progress Reports.
e) The contribution of greenhouse gas removals
Under section 29 of the Climate Change Act, greenhouse gas removals are
defined as ‘removals of that gas from the atmosphere due to land use, land-use
change or forestry activities’.
While such ‘natural removals’ are vitally important in achieving Net Zero, our
assessment is that it currently appears unlikely that Net Zero could be achieved
cost-effectively without also a significant contribution from ‘engineered’ removals
of CO2 (e.g. use of bioenergy with carbon capture and storage (BECCS) or direct
air capture of CO2 with storage (DACCS) – see section 11 of Chapter 3).
For CO2 removal to contribute effectively to the carbon budgets it must be
genuine and permanent removal. Strong, effective sustainability standards and
verification processes will be vital for including the contribution of CO2 removal.
We recommend that engineered CO2 removal is allowed to contribute to meeting UK carbon targets under the Climate Change Act.
This need not require amendment of the Climate Change Act. For example, a UK
removals credit (or ‘carbon unit’ under the Climate Change Act) could be
defined, such that these UK-located removals can contribute to meeting carbon
budgets and the Net Zero target.
This would enable the 23 Mt of CO2 removals in our 2035 scenario to be funded
through UK carbon credits paid for by sectors like aviation or fossil fuel extraction
that are expected to still have positive emissions in the UK – the outcome of such a
policy would match our pathway in terms of actual emissions.
‘Engineered’ removals appear vital for Net Zero and the Sixth Carbon Budget. They must be allowed to contribute.
It would not be scientifically robust to include aviation non-CO2 effects alongside the greenhouse gases in carbon budgets.
However, aviation non-CO2 effects are important and must be monitored and tackled. No further warming should occur from 2050.
Chapter 10: Recommendations on the Sixth Carbon Budget 424
f) The use of international carbon offsets or credits
Use of international credits under carbon budgets
Under section 34 of the Climate Change Act, the Committee’s recommendation
on a carbon budget must also advise on the extent to which it should be met
through emissions reductions as against use of ‘carbon units’ (e.g. international
emissions credits).
In alignment with our 2019 Net Zero advice, the recommendations provided in this
advice relate to action to reduce emissions within the UK, as part of UK leadership
on climate change and as an appropriate contribution to reducing emissions
globally. The Balanced Net Zero Pathway achieves the budget fully through
domestic actions utilising the UK’s range of low-carbon resources, including for CO2
removal, for which the UK is well placed given its strong CO2 storage capacity,
strong offshore engineering expertise and governance structures.
As we set out in Chapter 7, use of international carbon credits in place of domestic
action poses a number of risks including that use of credits would detract from UK
leadership and reduce clarity on the steps required in the UK to meet Net Zero.
Uncertainties also remain over how international carbon trading will work under the
Paris Agreement to ensure genuine additionality of effort.
Our recommendation is that the Government should not expect or plan to use international credits to meet the Sixth Carbon Budget – the recommended budget should be considered a minimum UK contribution through domestic action.
It is important to be clear that this recommendation applies to the use of
international carbon credits (i.e. paying for emissions reductions elsewhere in the
world to avoid making the required reductions in the UK). It does not preclude the
use of carbon credits within the UK as part of the policy mix for achieving
outcomes aligned to our Balanced Pathway.
It is also the case that the purchase of international carbon credits provides an
additional lever to support wider climate mitigation action internationally. Credit
purchase could be a useful part of the UK’s international climate policy as a
measure in addition to domestic delivery of the legislated carbon budgets (see
Chapter 7). There is also significant corporate interest in credit purchase, including
from firms acting strongly to tackle their own emissions.
Any use of international credits (whether purchased by the Government or UK companies) should be additional to the domestic effort of the Sixth Carbon Budget, to support the global effort to reduce emissions.
We do not identify a particular level of credit purchase should the Government
choose to go beyond the recommended budget, which should be considered in
the round of wider UK support for international ambition (see section 2).
We recognise that international credit markets and the UK’s role in them could
develop in unexpected ways, particularly as the final rules for Article 6 of the Paris
Agreement are agreed, and as new technologies, including for CO2 removal from
the atmosphere, develop. In particular, if in future credits can be applied to
sustainable, verified, permanent CO2 removal in a clearly additional way, there
would be a stronger case to allow them to contribute to UK targets.
The recommended budget should be considered a minimum UK contribution through domestic action, without international credits.
The UK could use credits to increase ambition beyond the budget for domestic action.
425 Sixth Carbon Budget – The path to Net Zero
Sections 26-28 of the Climate Change Act allow for changes in the treatment of
international carbon units and require further advice from the Committee before
any could be used to contribute to UK carbon budgets.
Interaction with the CORSIA scheme for international aviation
For international aviation, the international Carbon Offsetting and Reduction
Scheme for International Aviation (CORSIA) scheme already seeks to offset a
portion of aviation emissions. Under the scheme, larger airlines flying on routes
between countries covered by it are required to offset growth in emissions above
2019 levels by paying for emissions reduction or removal in other sectors. The
scheme starts in 2021 and is mandatory from 2027. The policy currently stops in
2035.
The current level of ambition under CORSIA is an insufficient contribution to the
goals of the Paris Agreement. A more ambitious, long-term global goal for
international aviation emissions consistent with the Paris Agreement would provide
a strong and early signal to incentivise the investment in new, cleaner,
technologies that will be required for the sector to play its role in meeting long-term
targets. This is particularly important in aviation given the long lifetimes of assets.
In order for operation of CORSIA to be compatible with the UK’s Net Zero
commitment, there would need to be appropriate governance for offset credits
and sustainable fuels, as well as an appropriate cap:
• Credits. The credits used to offset emissions would need to lead to genuine
and verifiable emissions reductions or removals that are additional to what
would have occurred otherwise. Ultimately, given that all countries will
need to reduce emissions strongly under the Paris Agreement, offsets will
need to be based on verified greenhouse gas removals. Appropriate
governance will be necessary to ensure that these removals are genuine
and sustainable.
• Sustainable fuels. Use of biofuels, and any other alternative fuels credited
with emissions reductions under CORSIA, will also need to have suitable
governance arrangements to ensure that they are from sustainable sources
and achieve sufficiently high lifecycle greenhouse gas emissions savings.
• Emissions cap. By 2050, the cap under the CORSIA scheme would need to
be reduced from 2019 emissions to zero.
Ideally the CORSIA rules would develop in line with these requirements. If not,
carriers operating in the UK would still be able to procure greenhouse gas removal
(GGR) offsets that do meet the necessary standards, which would also qualify for
CORSIA. Should the CORSIA cap be above Net Zero, carriers operating in the UK
should be obliged to procure additional greenhouse gas removals to offset their
remaining emissions (or an alternative mechanism should be used to achieve an
equivalent outcome).
For now, the Committee’s recommendation on credits within CORSIA is the same as for other credits – they should not be used to meet UK carbon budgets.
It is possible that rules under CORSIA could develop to a point that its offsets could
be an acceptable contribution to UK carbon budgets. In line with section 28 of the
Climate Change Act, the Committee would provide further advice before CORSIA
credits could be used to contribute to UK carbon budgets.
The CORSIA scheme is not currently compatible with the Paris Agreement or the UK’s path.
Under current rules, credits under CORSIA should not contribute to meeting the carbon budgets.
Chapter 10: Recommendations on the Sixth Carbon Budget 426
g) Accounting for all UK greenhouse gas emissions in full
As well as emissions from international aviation and shipping, our proposed budget
includes full estimates for emissions from UK peatlands and uses the latest estimates
from the IPCC for the global warming potentials of methane and other non-CO2
gases. These changes are not currently reflected in the UK emissions inventory, but
are due to be included over the next few years.
However, some uncertainty remains over exactly how these changes will be
incorporated in the UK inventory (reflecting uncertainty over which possible
approach best captures the true level of these emissions – see section 2 of Chapter
2). If, prior to the Sixth Carbon Budget being legislated, the Government has more
clarity on the approach that will be taken, our proposed budget could be
adjusted accordingly.
• Our recommendation on the carbon budget level assumes a current-worst-
case basis for estimating emissions (i.e. we assume the forthcoming
changes add 26 MtCO2e in 2035, which is at the high end of the potential
range of 11-26 MtCO2e/year).
• This approach ensures that forthcoming methodological decisions about
how to estimate UK emissions would not stop this carbon budget from
being achievable, but it risks that those decisions leave the budget looser
than intended. To manage that risk, we set out in Table 10.1 the
appropriate budget level and emissions reduction under the different
choices that could be made in the forthcoming changes to the inventory
methodology.
• Should these methodological decisions come after the relevant point when
the level of the budget could be changed, this is would potentially leave
some contingency within the budget (see Chapter 2, section 3).
While the Committee recommends that the Sixth Carbon Budget formally includes
the UK’s share of IAS emissions (see section 3) and the forthcoming inventory
changes, for comparison with earlier targets we also present in Table 10.1 the
emissions reduction by 2035 on a basis that excludes IAS emissions.
As required by the Climate Change Act and by the standard international
accounting approach agreed by the UNFCCC, UK carbon budgets are set on a
territorial basis (i.e. based on emissions arising from UK sources, not emissions
embedded in goods and services consumed in the UK).
However, the Committee is clear that progress must also be made in addressing
emissions measured on a consumption basis (also known as the UK’s carbon
footprint), and indeed on the wider impacts of UK activity (e.g. including finance
and aid). We discuss these issues further in Chapter 7.
While territorial emissions remain the best basis for UK carbon budgets, the
Committee will continue also to scrutinise progress on consumption emissions and
recommend policies that reduce both. We will monitor consumption emissions
against a Paris-aligned trajectory in our future annual Progress Reports to
Parliament. If UK territorial emissions are reduced to Net Zero and UK trading
partners reduce their emissions in line with the Paris Agreement we estimate (in
Chapter 7) that UK consumption emissions would be around 90% below 1990 levels
in 2050.
Current methods to estimate emissions will be improved upon in future.
The precise impact of these changes is not yet certain.
Territorial emissions are the best basis for UK targets, but we will track consumption emissions against a Paris-aligned trajectory.
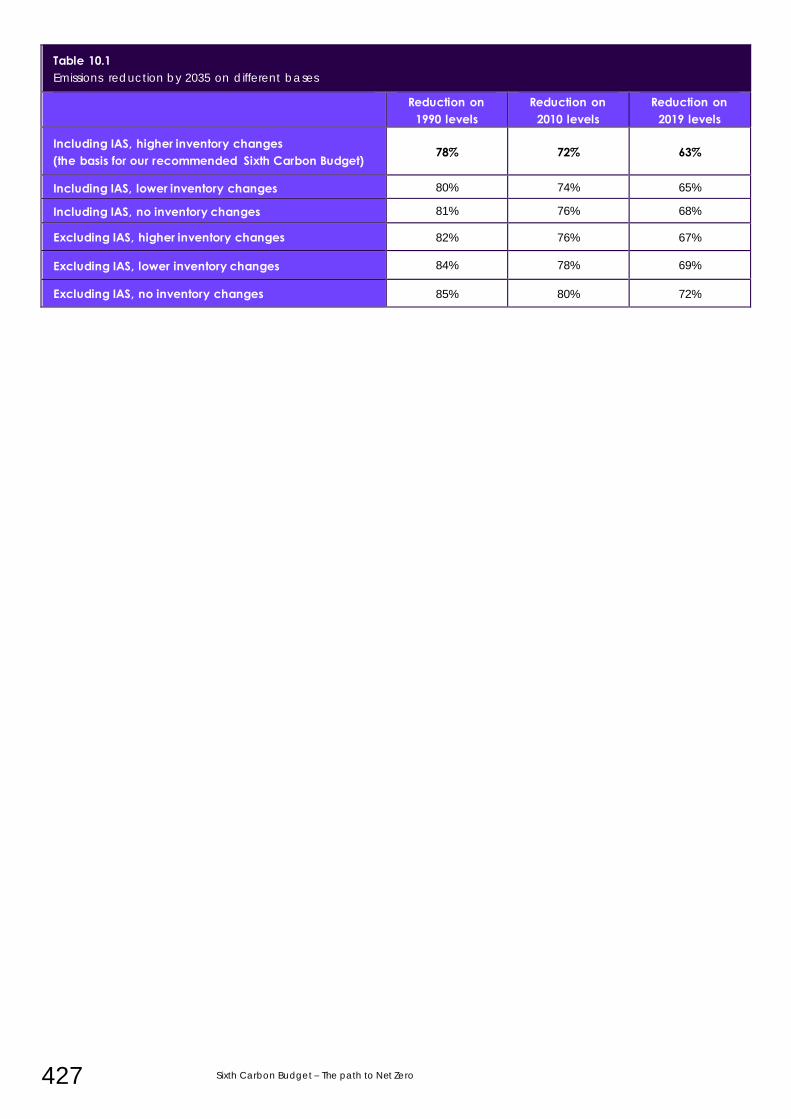
427 Sixth Carbon Budget – The path to Net Zero
Table 10.1
Emissions reduction by 2035 on different bases
Reduction on 1990 levels
Reduction on 2010 levels
Reduction on 2019 levels
Including IAS, higher inventory changes (the basis for our recommended Sixth Carbon Budget)
78% 72% 63%
Including IAS, lower inventory changes 80% 74% 65%
Including IAS, no inventory changes 81% 76% 68%
Excluding IAS, higher inventory changes 82% 76% 67%
Excluding IAS, lower inventory changes 84% 78% 69%
Excluding IAS, no inventory changes 85% 80% 72%
Chapter 10: Recommendations on the Sixth Carbon Budget 428
2. Nationally Determined Contribution for 2030
On 12 December 2020, three days after this report is published, the UK Government
will co-host an event with the United Nations to mark the fifth anniversary of the
Paris Agreement. This has been billed as an opportunity for world leaders to
announce new and enhanced Nationally Determined Contributions (NDCs), which
are due by the end of 2020 under the UN process. Now that the UK has left the EU it
must submit its own NDC, which takes on particular significance as president of
COP26 in Glasgow in November 2021.
As set out in Chapter 7, the pathways to Net Zero developed for this report would
be an appropriate basis for a UK NDC. They imply a progression from current
targets, are designed to reflect the UK’s highest possible ambition based on
current evidence, and represent an appropriate contribution to the temperature
goal of the Paris Agreement that reflects the UK’s responsibilities and capabilities.
The Balanced Net Zero Pathway that underpins our advice on the level of the Sixth
Carbon Budget reaches 316 MtCO2e in 2030 including the UK’s share of
international aviation and shipping (IAS) emissions, and 277 MtCO2e without IAS.
These imply reductions of 64% and 68% respectively on 1990 levels.*
While IAS emissions must be tackled (and we recommend that they are included in
the Sixth Carbon Budget) we recognise the value in the UK aligning to the
conventional UN approach by separating these out in its NDC.
• The UN process treats IAS emissions separately, with these reported as a
separate category and excluded from totals in national territorial emissions
accounts.
• IAS emissions are covered by the respective UN bodies – the International
Civil Aviation Authority (ICAO) and the International Maritime Organisation
(IMO) – rather than by the UN Framework Convention on Climate Change.
• IAS emissions are not explicitly covered by the Paris Agreement, but they
must be addressed to meet the Paris temperature goal.
• Existing NDCs generally have been proposed on a basis that excludes IAS
emissions.
We recommend that the UK NDC is set to require at least a 68% reduction in emissions from 1990 to 2030 on a basis that excludes emissions from international aviation and international shipping, in line with UN convention. A clear commitment should also be made to tackle IAS emissions:
• The UK’s NDC for 2030 should be for a reduction of at least 68% in UK
emissions compared to 1990 levels, excluding the UK’s share of international
aviation and international shipping emissions and without any contribution
of emissions credits. This equates to a 57% reduction on 2010 emissions on
the same basis.
* As for the carbon budget, these reductions anticipate forthcoming inventory changes at the high end of the range.
The UK’s NDC is an important signal ahead of COP26 in Glasgow.
We recommend an NDC based on our Balanced Pathway.
In line with international convention, we recommend an NDC on a basis that excludes IAS emissions.
We recommend an NDC for at least a 68% reduction in emissions by 2030 on 1990 levels (57% on 2010 levels).
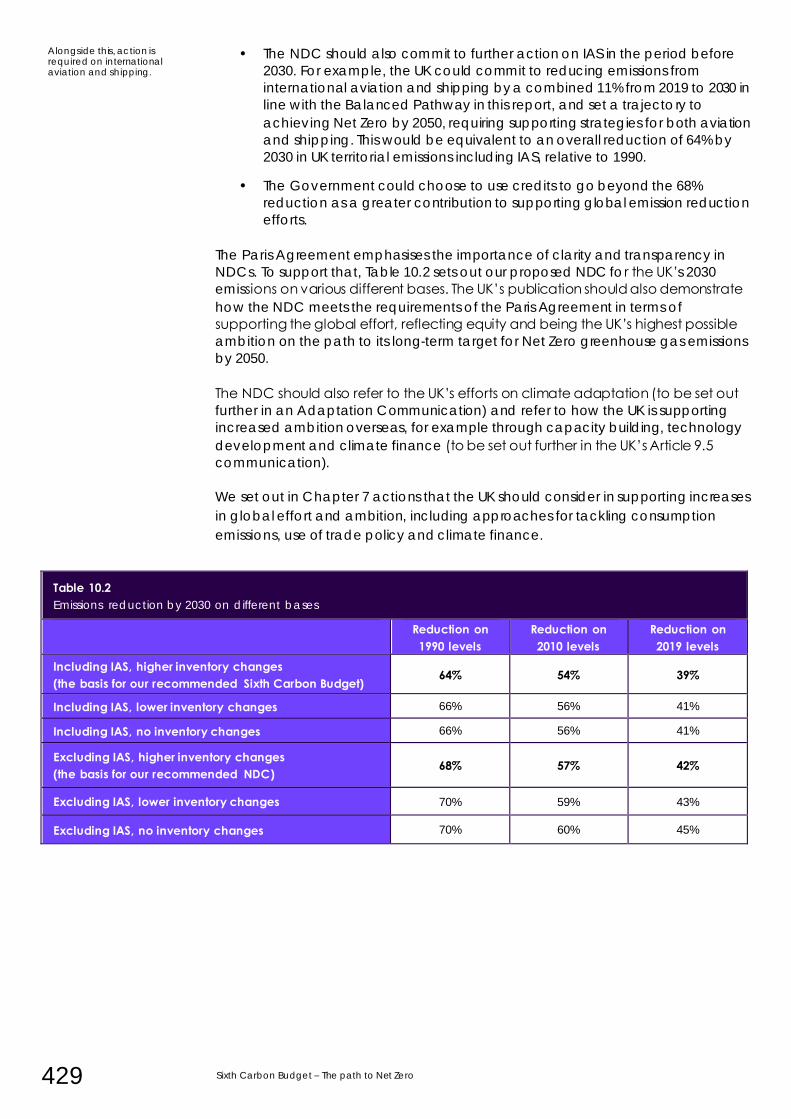
429 Sixth Carbon Budget – The path to Net Zero
• The NDC should also commit to further action on IAS in the period before
2030. For example, the UK could commit to reducing emissions from
international aviation and shipping by a combined 11% from 2019 to 2030 in
line with the Balanced Pathway in this report, and set a trajectory to
achieving Net Zero by 2050, requiring supporting strategies for both aviation
and shipping. This would be equivalent to an overall reduction of 64% by
2030 in UK territorial emissions including IAS, relative to 1990.
• The Government could choose to use credits to go beyond the 68%
reduction as a greater contribution to supporting global emission reduction
efforts.
The Paris Agreement emphasises the importance of clarity and transparency in
NDCs. To support that, Table 10.2 sets out our proposed NDC fo r the UK’s 2030
emissions on various different bases. The UK’s publication should also demonstrate
how the NDC meets the requirements of the Paris Agreement in terms of
supporting the global effort, reflecting equity and being the UK’s highest possible
ambition on the path to its long-term target for Net Zero greenhouse gas emissions
by 2050.
The NDC should also refer to the UK’s efforts on climate adaptation (to be set out
further in an Adaptation Communication) and refer to how the UK is supporting
increased ambition overseas, for example through capacity building, technology
development and climate finance (to be set out further in the UK’s Article 9.5
communication).
We set out in Chapter 7 actions that the UK should consider in supporting increases
in global effort and ambition, including approaches for tackling consumption
emissions, use of trade policy and climate finance.
Table 10.2
Emissions reduction by 2030 on different bases
Reduction on 1990 levels
Reduction on 2010 levels
Reduction on 2019 levels
Including IAS, higher inventory changes (the basis for our recommended Sixth Carbon Budget)
64% 54% 39%
Including IAS, lower inventory changes 66% 56% 41%
Including IAS, no inventory changes 66% 56% 41%
Excluding IAS, higher inventory changes
(the basis for our recommended NDC) 68% 57% 42%
Excluding IAS, lower inventory changes 70% 59% 43%
Excluding IAS, no inventory changes 70% 60% 45%
Alongside this, action is required on international aviation and shipping.
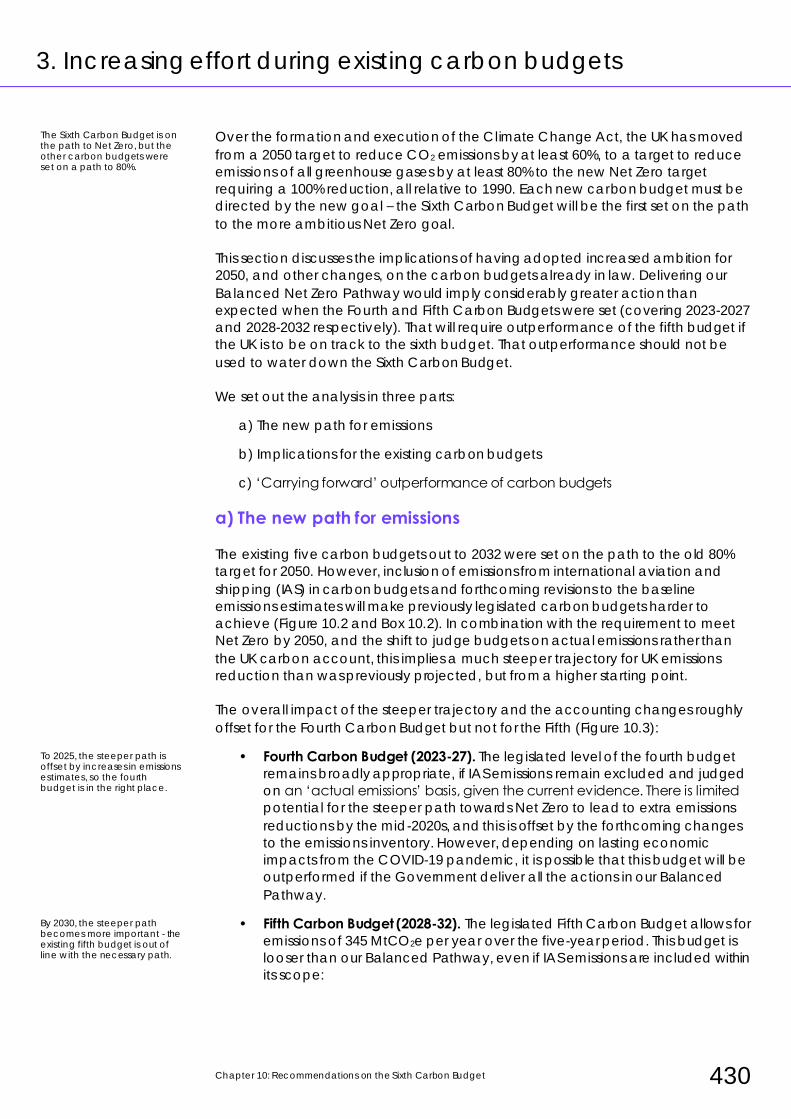
Chapter 10: Recommendations on the Sixth Carbon Budget 430
3. Increasing effort during existing carbon budgets
Over the formation and execution of the Climate Change Act, the UK has moved
from a 2050 target to reduce CO2 emissions by at least 60%, to a target to reduce
emissions of all greenhouse gases by at least 80% to the new Net Zero target
requiring a 100% reduction, all relative to 1990. Each new carbon budget must be
directed by the new goal – the Sixth Carbon Budget will be the first set on the path
to the more ambitious Net Zero goal.
This section discusses the implications of having adopted increased ambition for
2050, and other changes, on the carbon budgets already in law. Delivering our
Balanced Net Zero Pathway would imply considerably greater action than
expected when the Fourth and Fifth Carbon Budgets were set (covering 2023-2027
and 2028-2032 respectively). That will require outperformance of the fifth budget if
the UK is to be on track to the sixth budget. That outperformance should not be
used to water down the Sixth Carbon Budget.
We set out the analysis in three parts:
a) The new path for emissions
b) Implications for the existing carbon budgets
c) ‘Carrying forward’ outperformance of carbon budgets
a) The new path for emissions
The existing five carbon budgets out to 2032 were set on the path to the old 80%
target for 2050. However, inclusion of emissions from international aviation and
shipping (IAS) in carbon budgets and forthcoming revisions to the baseline
emissions estimates will make previously legislated carbon budgets harder to
achieve (Figure 10.2 and Box 10.2). In combination with the requirement to meet
Net Zero by 2050, and the shift to judge budgets on actual emissions rather than
the UK carbon account, this implies a much steeper trajectory for UK emissions
reduction than was previously projected, but from a higher starting point.
The overall impact of the steeper trajectory and the accounting changes roughly
offset for the Fourth Carbon Budget but not for the Fifth (Figure 10.3):
• Fourth Carbon Budget (2023-27). The legislated level of the fourth budget
remains broadly appropriate, if IAS emissions remain excluded and judged
on an ‘actual emissions’ basis, given the current evidence. There is limited
potential for the steeper path towards Net Zero to lead to extra emissions
reductions by the mid-2020s, and this is offset by the forthcoming changes
to the emissions inventory. However, depending on lasting economic
impacts from the COVID-19 pandemic, it is possible that this budget will be
outperformed if the Government deliver all the actions in our Balanced
Pathway.
• Fifth Carbon Budget (2028-32). The legislated Fifth Carbon Budget allows for
emissions of 345 MtCO2e per year over the five-year period. This budget is
looser than our Balanced Pathway, even if IAS emissions are included within
its scope:
The Sixth Carbon Budget is on the path to Net Zero, but the other carbon budgets were set on a path to 80%.
To 2025, the steeper path is offset by increases in emissions estimates, so the fourth budget is in the right place.
By 2030, the steeper path becomes more important - the existing fifth budget is out of line with the necessary path.
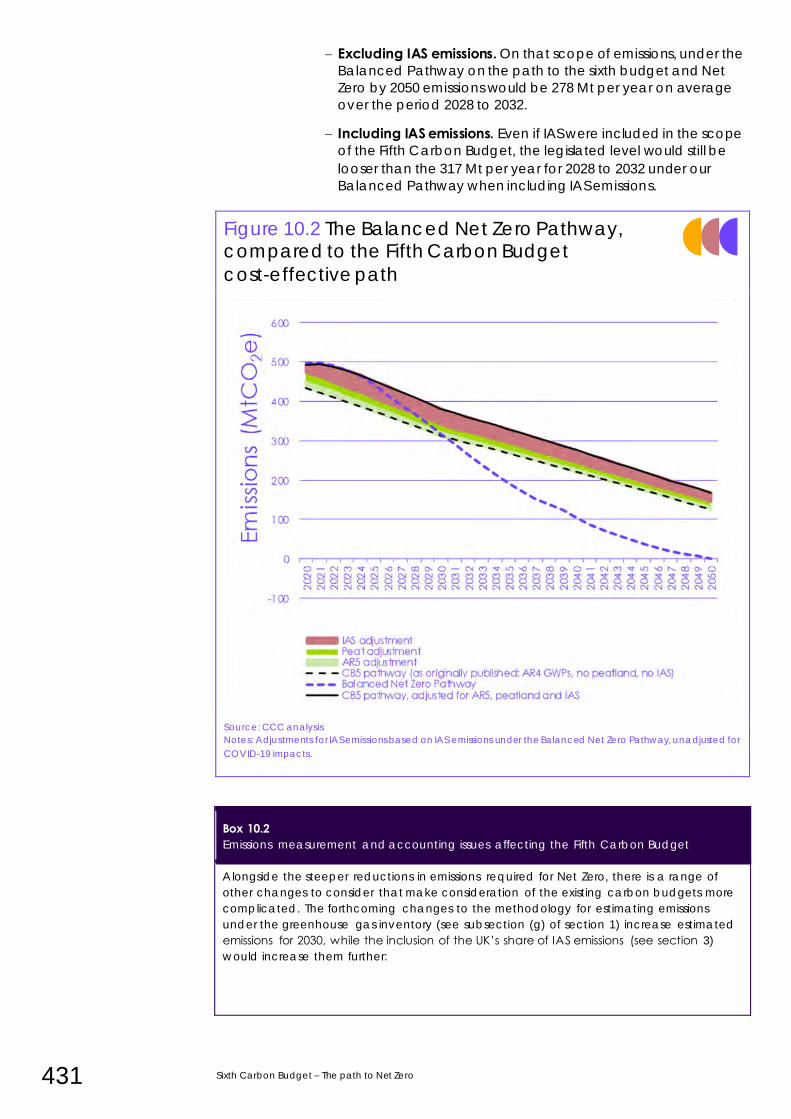
431 Sixth Carbon Budget – The path to Net Zero
– Excluding IAS emissions. On that scope of emissions, under the
Balanced Pathway on the path to the sixth budget and Net
Zero by 2050 emissions would be 278 Mt per year on average
over the period 2028 to 2032.
– Including IAS emissions. Even if IAS were included in the scope
of the Fifth Carbon Budget, the legislated level would still be
looser than the 317 Mt per year for 2028 to 2032 under our
Balanced Pathway when including IAS emissions.
Figure 10.2 The Balanced Net Zero Pathway, compared to the Fifth Carbon Budget
cost-effective path
Source: CCC analysis
Notes: Adjustments for IAS emissions based on IAS emissions under the Balanced Net Zero Pathway, unadjusted for
COVID-19 impacts.
Box 10.2 Emissions measurement and accounting issues affecting the Fifth Carbon Budget
Alongside the steeper reductions in emissions required for Net Zero, there is a range of
other changes to consider that make consideration of the existing carbon budgets more
complicated. The forthcoming changes to the methodology for estimating emissions
under the greenhouse gas inventory (see subsection (g) of section 1) increase estimated
emissions for 2030, while the inclusion of the UK’s share of IAS emissions (see section 3)
would increase them further:
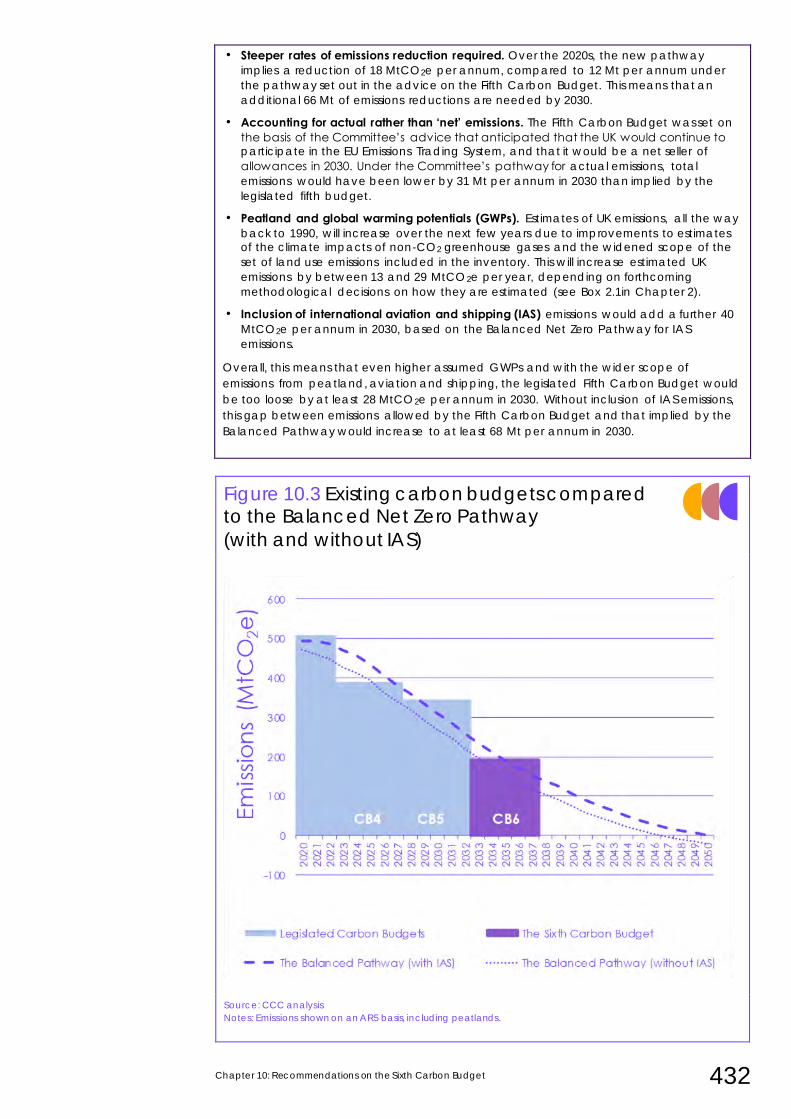
Chapter 10: Recommendations on the Sixth Carbon Budget 432
• Steeper rates of emissions reduction required. Over the 2020s, the new pathway
implies a reduction of 18 MtCO2e per annum, compared to 12 Mt per annum under
the pathway set out in the advice on the Fifth Carbon Budget. This means that an
additional 66 Mt of emissions reductions are needed by 2030.
• Accounting for actual rather than ‘net’ emissions. The Fifth Carbon Budget was set on
the basis of the Committee’s advice that anticipated that the UK would continue to participate in the EU Emissions Trading System, and that it would be a net seller of
allowances in 2030. Under the Committee’s pathway for actual emissions, total
emissions would have been lower by 31 Mt per annum in 2030 than implied by the
legislated fifth budget.
• Peatland and global warming potentials (GWPs). Estimates of UK emissions, all the way
back to 1990, will increase over the next few years due to improvements to estimates of the climate impacts of non-CO2 greenhouse gases and the widened scope of the
set of land use emissions included in the inventory. This will increase estimated UK
emissions by between 13 and 29 MtCO2e per year, depending on forthcoming
methodological decisions on how they are estimated (see Box 2.1in Chapter 2).
• Inclusion of international aviation and shipping (IAS) emissions would add a further 40
MtCO2e per annum in 2030, based on the Balanced Net Zero Pathway for IAS
emissions.
Overall, this means that even higher assumed GWPs and with the wider scope of
emissions from peatland, aviation and shipping, the legislated Fifth Carbon Budget would
be too loose by at least 28 MtCO2e per annum in 2030. Without inclusion of IAS emissions,
this gap between emissions allowed by the Fifth Carbon Budget and that implied by the
Balanced Pathway would increase to at least 68 Mt per annum in 2030.
Figure 10.3 Existing carbon budgets compared to the Balanced Net Zero Pathway
(with and without IAS)
Source: CCC analysis
Notes: Emissions shown on an AR5 basis, including peatlands.
433 Sixth Carbon Budget – The path to Net Zero
b) Implications for the existing carbon budgets
Ideally, all future carbon budgets would be aligned with the pathway to achieve
Net Zero by 2050. This would fulfil the intention of the Climate Change Act for these
nearer-term budgets to ensure that action is on track for the long-term target.
It is our assessment that the Fourth Carbon Budget is on track with the Balanced
Net Zero Pathway, but that the Fifth Carbon Budget is not. Nor, therefore, is it
aligned to our recommended NDC for 2030.
It is for the Government to decide whether the currently legislated budgets are
amended to bring them in line with the revised 2050 target or the 2030 NDC, but
the Committee does not consider it to be necessary. Forthcoming revisions to the
UK’s emissions inventory will make existing carbon budgets more challenging. The
setting of the Sixth Carbon Budget for 2033-37 in accordance with the
Committee’s advice will also require that the UK cuts emissions in line with the 2030
NDC to remain on track. Once the sixth budget is legislated, the trajectory towards
it will have legal force given the requirement in the Climate Change Act that the
Government prepare policies to meet the 2050 target and all legislated carbon
budgets.
If the Government wish to align the fifth budget to our recommended NDC, it
would need to change to 1,585 MtCO2e (assuming the Government enacts the
power in sections 30-31 of the Climate Change Act to include emissions from
international aviation and shipping).
That revision would be permissible under the Climate Change Act - since the
adoption of the UK Net Zero target is clearly a significant change affecting the
basis for the Fifth Carbon Budget – and under the Paris Agreement – since the
revised budget would respect the ‘ratchet principle’ as a clear progression in
ambition on the current commitment.
The Committee will track progress against the Balanced Pathway set out in this report and the UK’s NDC for 2030 (implying emissions of 1,585 MtCO2e, including IAS
emissions, over the Fifth Carbon Budget period), as our best indication of what is
required to stay on track to our recommended Sixth Carbon Budget and the UK’s
2050 Net Zero target.
The Government has also recognised the need to go further and increased its
ambition in several areas compared to previous plans set out in the 2017 Clean
Growth Strategy. For example, moving the phase-out date earlier for new sales of
petrol and diesel cars and vans, and increasing ambition on offshore wind to 2030.
Our pathways in this report demonstrate the need to go further across the
economy (Table 10.3).
With the NDC for 2030, and the fourth and sixth carbon budgets in the right places, it is not necessary to change the Fifth Carbon Budget.
Should the Government choose to amend the Fifth Carbon Budget, its level should be 1,585 MtCO2e.
We will track progress against the Balanced Pathway set out in this report and the UK’s NDC for 2030, rather than the existing Fifth Carbon Budget.
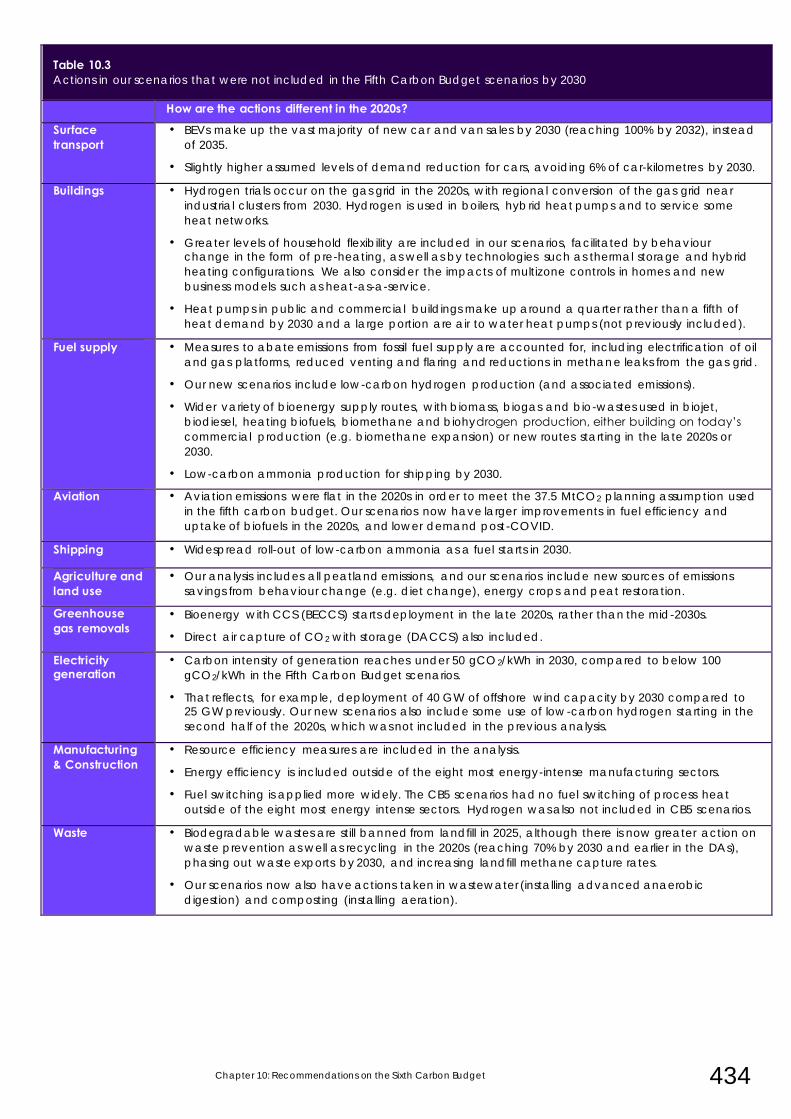
Chapter 10: Recommendations on the Sixth Carbon Budget 434
Table 10.3 Actions in our scenarios that were not included in the Fifth Carbon Budget scenarios by 2030
How are the actions different in the 2020s?
Surface transport
• BEVs make up the vast majority of new car and van sales by 2030 (reaching 100% by 2032), instead
of 2035.
• Slightly higher assumed levels of demand reduction for cars, avoiding 6% of car-kilometres by 2030.
Buildings • Hydrogen trials occur on the gas grid in the 2020s, with regional conversion of the gas grid near
industrial clusters from 2030. Hydrogen is used in boilers, hybrid heat pumps and to service some
heat networks.
• Greater levels of household flexibility are included in our scenarios, facilitated by behaviour change in the form of pre-heating, as well as by technologies such as thermal storage and hybrid
heating configurations. We also consider the impacts of multizone controls in homes and new
business models such as heat-as-a-service.
• Heat pumps in public and commercial buildings make up around a quarter rather than a fifth of
heat demand by 2030 and a large portion are air to water heat pumps (not previously included).
Fuel supply • Measures to abate emissions from fossil fuel supply are accounted for, including electrification of oil
and gas platforms, reduced venting and flaring and reductions in methane leaks from the gas grid.
• Our new scenarios include low-carbon hydrogen production (and associated emissions).
• Wider variety of bioenergy supply routes, with biomass, biogas and bio-wastes used in biojet,
biodiesel, heating biofuels, biomethane and biohydrogen production, either building on today’s
commercial production (e.g. biomethane expansion) or new routes starting in the late 2020s or
2030.
• Low-carbon ammonia production for shipping by 2030.
Aviation • Aviation emissions were flat in the 2020s in order to meet the 37.5 MtCO2 planning assumption used
in the fifth carbon budget. Our scenarios now have larger improvements in fuel efficiency and
uptake of biofuels in the 2020s, and lower demand post-COVID.
Shipping • Widespread roll-out of low-carbon ammonia as a fuel starts in 2030.
Agriculture and land use
• Our analysis includes all peatland emissions, and our scenarios include new sources of emissions
savings from behaviour change (e.g. diet change), energy crops and peat restoration.
Greenhouse gas removals
• Bioenergy with CCS (BECCS) starts deployment in the late 2020s, rather than the mid-2030s.
• Direct air capture of CO2 with storage (DACCS) also included.
Electricity generation
• Carbon intensity of generation reaches under 50 gCO2/kWh in 2030, compared to below 100
gCO2/kWh in the Fifth Carbon Budget scenarios.
• That reflects, for example, deployment of 40 GW of offshore wind capacity by 2030 compared to 25 GW previously. Our new scenarios also include some use of low -carbon hydrogen starting in the
second half of the 2020s, which was not included in the previous analysis.
Manufacturing & Construction
• Resource efficiency measures are included in the analysis.
• Energy efficiency is included outside of the eight most energy-intense manufacturing sectors.
• Fuel switching is applied more widely. The CB5 scenarios had no fuel switching of process heat
outside of the eight most energy intense sectors. Hydrogen was also not included in CB5 scenarios.
Waste • Biodegradable wastes are still banned from landfill in 2025, although there is now greater action on
waste prevention as well as recycling in the 2020s (reaching 70% by 2030 and earlier in the DAs),
phasing out waste exports by 2030, and increasing landfill methane capture rates.
• Our scenarios now also have actions taken in wastewater (installing advanced anaerobic
digestion) and composting (installing aeration).
435 Sixth Carbon Budget – The path to Net Zero
c) ‘Carrying forward’ outperformance of carbon budgets
The Climate Change Act allows for the ‘carry forward’ of outperformance of
carbon budgets to help meet the subsequent budget, subject to the advice of the
Committee.
Our recommended Sixth Carbon Budget is predicated on it being achieved
without any such carry forward of outperformance from preceding carbon
budgets. The level of this budget has been designed to get the UK on track to Net
Zero by 2050 – using earlier outperformance to reduce the amount of effort would
not achieve this. If the Government were to carry forward outperformance from
earlier budgets, the Sixth Carbon Budget would need to be tighter.
More generally, carry forward of outperformance should be avoided, as it would
lead to worse climate outcomes and risks the meeting of later targets given the
stretching nature of the Net Zero target:
• Carrying forward outperformance to subsequent budget periods would
allow an increased level of emissions in that later period.
• Given the importance of cumulative emissions in determining climate
outcomes (see Chapter 7), increasing allowed emissions in later periods
should be avoided. This would also be contrary to the principle of ‘highest
possible ambition’ under the Paris Agreement.
• As well as increasing cumulative emissions, any loosening of later carbon
budgets that enables effort to be reduced is likely to increase risks in
meeting subsequent carbon budgets and Net Zero, given the stretching
nature of these targets.
We therefore recommend that, as a rule, outperformance of carbon budgets is not carried forward to subsequent periods. More generally, given the extremely large outperformance for the Third Carbon
Budget now expected, for reasons other than policy (i.e. changes in the EU ETS
and the impact of COVID-19 on emissions), it is especially important that ‘surplus’
emissions are not carried forward. Existing budgets are already on track or too
loose for a path to Net Zero, so there could be no justification to carry forward
outperformance of the third or subsequent carbon budgets.
The Act potentially allows for surpluses from carbon budgets to help meet subsequent budgets, but this is not consistent with the Paris Agreement.
As a rule, outperformance of carbon budgets should not be carried forward to subsequent periods.
Chapter 10: Recommendations on the Sixth Carbon Budget 436
4. Traded-sector emissions and UK emission trading system cap
This section sets out the Committee’s advice on the contributions from different
sectors of the economy and on emissions covered by emissions trading, as
required under section 34 of the Climate Change Act. It is in three parts:
a) Emissions accounting and the role for emissions trading
b) The path for ‘traded sector’ emissions
c) Sectoral contributions to emissions reduction
a) Emissions accounting and the role for emissions trading
As set out in section 1, the Committee is recommending a carbon budget based
on actual emissions, including UK greenhouse gas removals but without adjusting
for potential cross-border trading of carbon emissions. That is practical given that
the UK will leave the EU Emissions Trading System (EU ETS) at the end of this year
and will help improve transparency.
However, emissions trading, and carbon pricing more generally, remains an
important tool in delivering the transition to Net Zero. The Government has
proposed a UK Emissions Trading System (UK ETS) and committed to consulting on
aligning its cap with Net Zero.2 The pathways set out in this report provide a basis
for setting a Net Zero-aligned cap.
For now, we assume that the scope of emissions covered by emissions trading (the
‘traded sector’) remains as currently under the EU ETS, with the potential addition
of engineered greenhouse gas removals (GGR) given their potential in the sectors
already covered by the EU ETS (e.g. power generation, industry and hydrogen
production).
If a UK ETS is set up following the UK’s departure from the EU ETS, the rules are likely
to default to those currently in place under the EU system. Such a mirroring should
not be retained indefinitely. It will be important for the UK system to evolve from the
current EU ETS rules, specifically to include engineered removals as being able to
contribute to meeting the emissions cap. The EU ETS is also likely to need to do so at
some point, in order to meet the EU’s Net Zero goal.
We note that, should the UK set up its own ETS to follow on from the EU ETS, the
Government has committed to setting the cap from 2023, following the
Committee’s advice on a suitable trajectory. It has also committed to review the
scope of the trading system in 2023 with a view to potentially including additional
sources of emissions shortly thereafter.
The Committee will review the arrangements to follow the UK’s exit from the EU ETS
at a later date.
The cap for a UK Emissions Trading System should be based on the Balanced Net Zero Pathway.
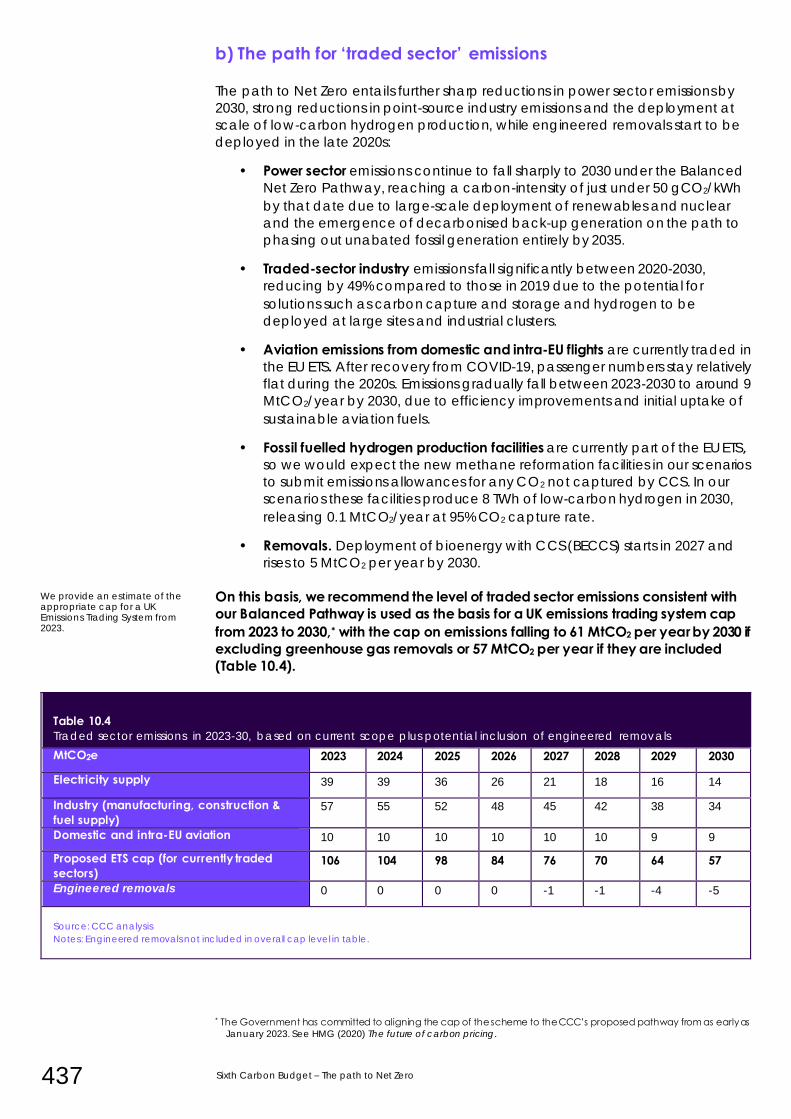
437 Sixth Carbon Budget – The path to Net Zero
b) The path for ‘traded sector’ emissions
The path to Net Zero entails further sharp reductions in power sector emissions by
2030, strong reductions in point-source industry emissions and the deployment at
scale of low-carbon hydrogen production, while engineered removals start to be
deployed in the late 2020s:
• Power sector emissions continue to fall sharply to 2030 under the Balanced
Net Zero Pathway, reaching a carbon-intensity of just under 50 gCO2/kWh
by that date due to large-scale deployment of renewables and nuclear
and the emergence of decarbonised back-up generation on the path to
phasing out unabated fossil generation entirely by 2035.
• Traded-sector industry emissions fall significantly between 2020-2030,
reducing by 49% compared to those in 2019 due to the potential for
solutions such as carbon capture and storage and hydrogen to be
deployed at large sites and industrial clusters.
• Aviation emissions from domestic and intra-EU flights are currently traded in
the EU ETS. After recovery from COVID-19, passenger numbers stay relatively
flat during the 2020s. Emissions gradually fall between 2023-2030 to around 9
MtCO2/year by 2030, due to efficiency improvements and initial uptake of
sustainable aviation fuels.
• Fossil fuelled hydrogen production facilities are currently part of the EU ETS, so we would expect the new methane reformation facilities in our scenarios
to submit emissions allowances for any CO2 not captured by CCS. In our
scenarios these facilities produce 8 TWh of low-carbon hydrogen in 2030,
releasing 0.1 MtCO2/year at 95% CO2 capture rate.
• Removals. Deployment of bioenergy with CCS (BECCS) starts in 2027 and
rises to 5 MtCO2 per year by 2030.
On this basis, we recommend the level of traded sector emissions consistent with our Balanced Pathway is used as the basis for a UK emissions trading system cap from 2023 to 2030,* with the cap on emissions falling to 61 MtCO2 per year by 2030 if excluding greenhouse gas removals or 57 MtCO2 per year if they are included (Table 10.4).
Table 1.11:Table 1.11
Table 10.4 Traded sector emissions in 2023-30, based on current scope plus potential inclusion of engineered removals
MtCO2e 2023 2024 2025 2026 2027 2028 2029 2030
Electricity supply 39 39 36 26 21 18 16 14
Industry (manufacturing, construction & fuel supply)
57 55 52 48 45 42 38 34
Domestic and intra-EU aviation 10 10 10 10 10 10 9 9
Proposed ETS cap (for currently traded sectors)
106 104 98 84 76 70 64 57
Engineered removals 0 0 0 0 -1 -1 -4 -5
Source: CCC analysis
Notes: Engineered removals not included in overall cap level in table.
* The Government has committed to aligning the cap of the scheme to the CCC’s proposed pathway from as early as
January 2023. See HMG (2020) The future of carbon pricing.
We provide an estimate of the appropriate cap for a UK Emissions Trading System from 2023.
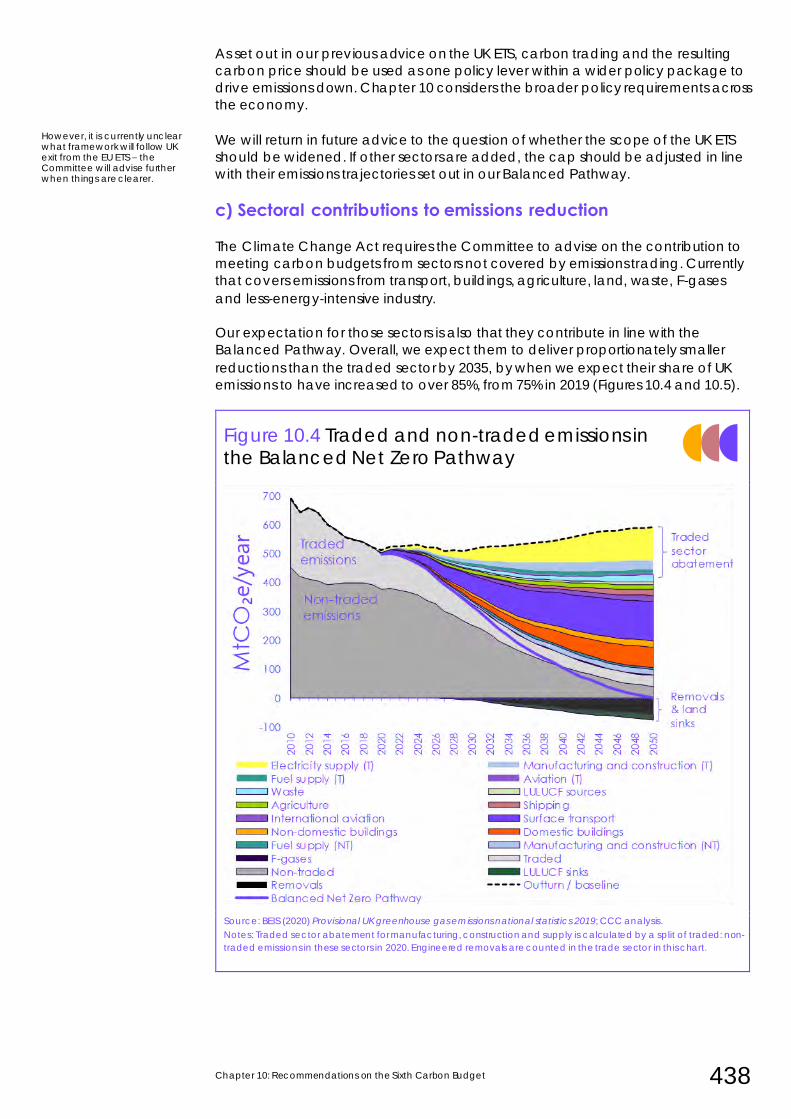
Chapter 10: Recommendations on the Sixth Carbon Budget 438
As set out in our previous advice on the UK ETS, carbon trading and the resulting
carbon price should be used as one policy lever within a wider policy package to
drive emissions down. Chapter 10 considers the broader policy requirements across
the economy.
We will return in future advice to the question of whether the scope of the UK ETS
should be widened. If other sectors are added, the cap should be adjusted in line
with their emissions trajectories set out in our Balanced Pathway.
c) Sectoral contributions to emissions reduction
The Climate Change Act requires the Committee to advise on the contribution to
meeting carbon budgets from sectors not covered by emissions trading. Currently
that covers emissions from transport, buildings, agriculture, land, waste, F-gases
and less-energy-intensive industry.
Our expectation for those sectors is also that they contribute in line with the
Balanced Pathway. Overall, we expect them to deliver proportionately smaller
reductions than the traded sector by 2035, by when we expect their share of UK
emissions to have increased to over 85%, from 75% in 2019 (Figures 10.4 and 10.5).
Figure 10.4 Traded and non-traded emissions in the Balanced Net Zero Pathway
Source: BEIS (2020) Provisional UK greenhouse gas emissions national statistics 2019; CCC analysis.
Notes: Traded sector abatement for manufacturing, construction and supply is calculated by a split of traded: non-
traded emissions in these sectors in 2020. Engineered removals are counted in the trade sector in this chart.
However, it is currently unclear what framework will follow UK exit from the EU ETS – the Committee will advise further when things are clearer.
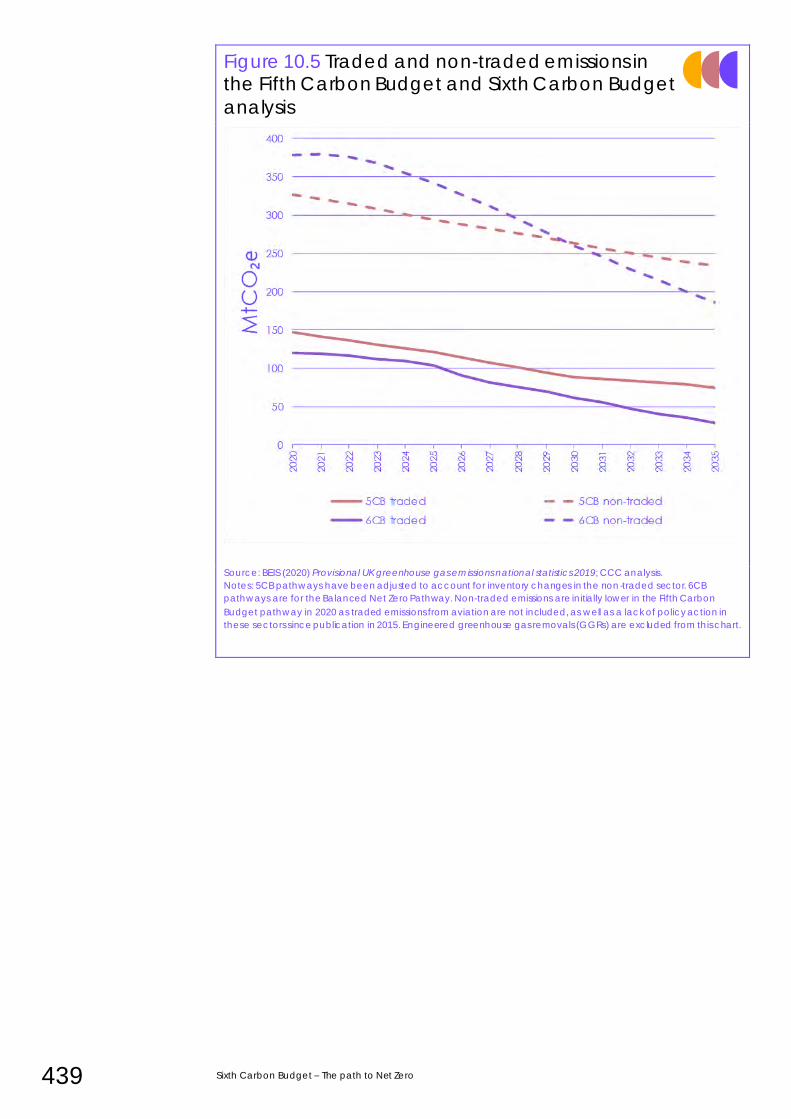
439 Sixth Carbon Budget – The path to Net Zero
Figure 10.5 Traded and non-traded emissions in the Fifth Carbon Budget and Sixth Carbon Budget
analysis
Source: BEIS (2020) Provisional UK greenhouse gas emissions national statistics 2019; CCC analysis.
Notes: 5CB pathways have been adjusted to account for inventory changes in the non-traded sector. 6CB
pathways are for the Balanced Net Zero Pathway. Non-traded emissions are initially lower in the Fifth Carbon
Budget pathway in 2020 as traded emissions from aviation are not included, as well as a lack of policy action in
these sectors since publication in 2015. Engineered greenhouse gas removals (GGRs) are excluded from this chart.
Chapter 10: Recommendations on the Sixth Carbon Budget 440
5. Next steps: A Net Zero plan and monitoring of progress
Following this advice, the Government must set the Sixth Carbon Budget in law by the end of June 2021. This must be followed, as soon as is practicable, by a set of policies and proposals to meet the budget. We recommend that both these steps are taken without delay, in the first half of 2021.
That would demonstrate the UK’s climate credentials as president of COP26 and is
necessary given the limited time available to accelerate emissions reductions as
needed to meet the budget. We expect to report on the Government’s strategies
in our next annual Progress Report in June 2021.
This section sets out our expectations for the Government response, and the
evolving role of the CCC after this advice.
a) The Government response to this advice
The Climate Change Act (sections 13 and 14) requires that the Government
develop policies and proposals that would ‘enable’ the carbon budgets and 2050
target to be met. It is inevitable that not all proposals will be fully developed and
implemented by early next year. However, the Committee’s interpretation of the
requirements of the Act (and of good policymaking) is that the Government
should clearly and quantitatively demonstrate how its proposals will deliver the
Sixth Carbon Budget.
That should be the goal of the Government’s response to this advice, which should
set out a quantified set of policy proposals to deliver the Sixth Carbon Budget and
later Net Zero target:
• The Government’s Energy and Emissions Projections ‘Reference Scenario’
sets out expectations for emissions through the carbon budget periods
under ‘implemented, adopted and agreed’ policies, where the impact of
these policies has been quantified. The latest publication projects a 57%*
reduction in emissions from 1990 to 2035 – a long way short of the 72%
reduction required by our recommended Sixth Carbon Budget on the same
basis.
• Many other policies have been announced or are being developed. These
include, for example, the Buildings and Heat Strategy, the Transport
Decarbonisation Plan, the energy White Paper, a hydrogen strategy and
the National Infrastructure Strategy. For the purposes of section 14 of the
Climate Change Act, the Government should set out the intended effect
of these policies and ‘the time-scales over which those proposals and
policies are expected to take effect’. They should progress as soon as
possible to full implementation.
• If these proposals in sum are insufficient to deliver the Sixth Carbon Budget
the Government should set out the areas where it will develop further and
stronger policies to deliver deeper emissions reductions, and quantify the
expected effect of those.
* Estimate on an AR4 basis, excluding inventory revisions for peatland and emissions from international aviation and
international shipping. BEIS (2020) Updated Energy & Emissions Projections 2019.
The Government should legislate the Sixth Carbon Budget and set out its plans without delay.
441 Sixth Carbon Budget – The path to Net Zero
• If as individual policies progress, their expected impact is reduced, then
they must be compensated by increasing the impact from other policies or
by introduction of new policies to fill the gap. The Government’s response
should therefore also set out an approach to its own tracking of policy
development and progress to ensure that it stays on track to the Sixth
Carbon Budget as circumstances and expectations change.
We are publishing a separate ‘Policy report’ alongside this ‘Advice report’ where
we set out the policy priorities that the Committee has identified to get on track to
the recommended Sixth Carbon Budget and Balanced Net Zero Pathway. We are
also publishing the advice from our Expert Advisory Group on Policy,3 whose
advice is summarised in our Policy report.
These are intended to demonstrate broadly how the required changes might be
delivered. They are not intended to be prescriptive where other means could
achieve the same ends.
The Government should set out an approach to ensure that progress stays on track.
Chapter 10: Recommendations on the Sixth Carbon Budget 442
b) Summary of policy recommendations
Delivering the actions required in the 2020s to meet the Sixth Carbon Budget
requires policies to be strengthened now. Matching strong ambition with action is
vital for the UK’s credibility, with business and with the international community.
Action in early years underpins the transition by developing options and driving
learning-by-doing in key technologies. It keeps open the possibility that i f faster
progress proves possible, it can be taken in further support of the global 1.5°C goal.
A vital challenge is to ensure that the transition is fair, and perceived to be fair.
That was a key theme from the recent UK Climate Assembly, and it is clear that
engaging and involving the public in the transition and in policy design will be vital.
The Treasury Net Zero Review must identify fair ways to share the costs and benefits
of the transition and the Government must develop effective plans for a just
transition while embedding the principle of fairness throughout policy. Plans should
recognise interactions with other transformations, such as digitalisation. Place and
skills will be key dimensions to consider, so it is vital that UK Government policy joins
up well with local, regional and devolved policy on the just transition.
We identify priorities for every sector of the economy, building on our detailed
recommendations in our Progress Report in June.
• Surface transport. A comprehensive policy package will be needed to
deliver on the Government’s new commitment to phase out new sales of
petrol and diesel cars and vans by 2030, including ensuring that plug-in
hybrids play no more than a niche role by then. A further commitment
should be made to phase out sales of diesel HGVs by no later than 2040,
supported by large-scale trials in the near term. Recharging and refuelling
infrastructure will need to develop to meet the range of emerging needs.
Effective demand-side policy is also essential – we identify significant
opportunities, and advantages, to reducing travel demand, but this will not
happen without firm policies.
• Industry. For the manufacturing, construction and fuel supply industries, the
Government must move from the current piecemeal approach to a
comprehensive transition support framework. Taxpayer funding will be key
in early years to ensure industries stay internationally competitive while
reducing emissions. The development of longer-term policies, such as
border tariff adjustments or carbon standards, should begin immediately,
for example through development of improved measurement of carbon-
intensity. Policy must tackle both the demand-side and supply-side for low-
carbon products and ensure relevant infrastructure is available when
needed.
• Buildings. Government must produce a robust and ambitious Heat and
Buildings strategy which sets the direction for the next decade, with clear
signals on the phase-out of fossil heating, rebalancing of policy costs
between electricity and gas, commitments to funding and delivery plans
which include regional and local actors. Our Balanced Pathway is
underpinned by a clear timetable for standards to make all buildings
energy efficient and ultimately low-carbon. The other priorities are rapidly
to scale up supply chains for heat pumps and heat networks and to
develop the option of hydrogen for heat. Proper enforcement of standards
and an effective approach to skills are essential.
• Electricity generation. Low-risk instruments like the auctions of renewable
contracts should continue to support the scale-up of low-carbon
generating capacity.
Only a just transition will be successful.
Policy throughout the economy must be clear, effective and fair.
443 Sixth Carbon Budget – The path to Net Zero
Policy should address barriers to the major scale-up required, for example
by supporting the coordination of connections from offshore windfarms into
the onshore network and greatly strengthening the UK’s power grid.
Following on from the 2024 coal phase-out, gas-fired power without CCS
should be phased out by 2035. Work to improve markets for the provision of
flexibility must accelerate to accommodate the increasing shares of
variable power.
• Low-carbon hydrogen. The Government’s Hydrogen Strategy is due to be
published in spring 2021. It will need to set out a vision for hydrogen’s role in
meeting Net Zero in the longer term, together with the actions, regulations
and incentives across end-use applications and hydrogen supply to
develop hydrogen’s role over the next decade.
• Agriculture and land. We set out detailed recommendations on policy for
land and agriculture in January 2020. These must be implemented in a way
that is fair to farmers. The priorities remain: a strengthened regulatory
baseline to ensure low-regret measures are adopted; incentive schemes
such as auctioned contracts to drive afforestation; and enabling measures
to address issues such as skills, supply chains and barriers for tenant farmers.
Policy design must account for the challenges of the changing climate and
reflect wider environmental priorities, including for biodiversity, to harness
potential synergies and avoid unnecessary trade-offs. Demand-side policies
are also needed to cut food waste and encourage a reduction in
consumption of meat and dairy.
• Aviation and shipping. The UK will need strategies to reduce its emissions
from aviation and shipping to Net Zero. It should help drive international
processes through the International Civil Aviation Organisation and the
International Maritime Organisation to strengthen ambition in line with Net
Zero. Policy should also provide early-stage development support for
engineered CO2 removals, sustainable fuels and more efficient, including
electrified, craft. Demand-side measures should aim to limit aviation growth
in line with our scenarios.
• Waste policy should include a ban on landfilling biodegradable waste by
2025, with recycling increasing to 70% by 2030. More policies are needed to
reduce waste arisings, through the chain from manufacturing to the
consumer. All remaining energy-from-waste plants should fit CCS by 2050.
• F-gases. F-gas regulation already requires reduction of some sources; plans
will need to extend to all sources.
• CO2 removal. A full strategy is needed for CO2 removal, covering both
nature-based and engineered options. It should cover initial development
and demonstration, governance arrangements to ensure sustainability and
that removals are permanent, and market pricing mechanisms and other
routes to market development to support the scale-up required from the
late 2020s.
Net Zero and the Sixth Carbon Budget present a major coordination and delivery
challenge. The Government must organise itself and its agencies to meet that
challenge. The two Cabinet Committees for Climate Action – the Strategy
Committee chaired by the Prime Minister and the Implementation Committee
chaired by the BEIS Secretary of State – are an important element of that, but
stronger governance and coordination will be needed, with delivery processes
reaching out across all levels and localities of Government, across borders, and
across UK businesses and people.
Government must organise at all levels to meet the major delivery challenge of Net Zero.
Aviation and shipping should be included in the Sixth Carbon Budget and must be tackled alongside all other emissions.
Chapter 10: Recommendations on the Sixth Carbon Budget 444
The Committee will continue to offer its support to developing the Government’s
policy programme, and those of Scotland, Wales and Northern Ireland, and will
scrutinise proposals carefully and transparently.
c) The evolving role of the CCC
Following this advice, the Committee’s main role will switch from advising on
climate targets (as we have in this report and the Net Zero report in 2019) to
monitoring progress towards Net Zero and the targets set on the path to it. That will
begin with the Committee’s annual Progress Report to Parliament in June 2021.
i) Monitoring progress towards Net Zero
As in previous Progress Reports, we expect to monitor with a forward-looking
perspective, aiming to identify potential shortcomings before they occur. To do
that we will develop a new set of progress indicators based on the Balanced Net
Zero Pathway set out in this report and against which we will track progress in each
sector of the economy. There may be some areas where progress is faster, and
some where it is slower, but those must balance out across the economy if the
budget is to be delivered. Currently expected progress is well below what is
needed in almost all areas.
For progress to be on track, effective policies must be implemented on a timely
basis. In monitoring development of policy in each sector we will consider the
following questions:
• Is there a clear long-term direction?
• Are there investable incentives for low-carbon options?
• Are barriers to action being tackled?
• Is policy preparing for future challenges as well as current ones?
• Is policy addressing the particular issues for that sector, for example fuel
poverty or competitiveness?
More broadly we will also assess the Government’s progress on tackling the overall
Net Zero challenge. That will involve a particular focus on fairness and the just
transition (including the results of the Treasury’s Net Zero Review into how the costs
and the benefits should be share), success in engaging and involving people
across the UK, regional implementation and the Government’s approach to
delivery.
Given the increasing importance of climate commitments and action by
businesses, including the financial sector, and local Government we will seek to
extend our assessment into action by players beyond central and devolved
Government. And as the UK hosts COP26, we will seek to support efforts to increase
ambition globally and increase our international engagement.
The Committee will now switch back towards a focus on delivery.
445 Sixth Carbon Budget – The path to Net Zero
ii) Monitoring consumption emissions
In Chapter 7 we set out a range of scenarios for the UK’s consumption emissions
based on the Balanced Net Zero Pathway for territorial emissions and different
levels of emissions reduction in the rest of the world. As set out in Chapter 7, there
are levers available to the UK to influence these emissions and we noted that
around 75% of the UK’s consumption emissions are, or soon w ill be, covered by Net
Zero targets, while 45% of imported emissions are in the supply chains of UK firms.
We do not recommend that the UK set a legal target for consumption emissions
comparable to carbon budgets at this time:
• Territorial emissions remain the agreed international approach to setting
emissions targets and map most closely to UK levers of influence.
• Estimates of consumption emissions are considerably more uncertain and
only available with a significant lag (the latest current estimates are for
2017). Estimates are more prone to changing with changes in assumptions
or as a result of changes that do not reflect UK policy.
However, there are strong arguments in favour of monitoring consumption
emissions and considering policies to address imported as well as territorial
emissions:
• The UK’s consumption emissions are estimated to be around 50% higher
than its territorial emissions.
• Poor policy could lead to imported emissions increasing while territorial
emissions fall, especially as the UK strengthens policy targeting sectors
producing traded goods (e.g. manufacturing and agriculture). The carbon
budgets should not be met by exporting our emissions and shutting down
our industries.
• The UK does have levers to affect imported emissions as well as territorial
emissions (see Chapter 7). Some of these and other levers could even
extend beyond the UK’s consumption emissions and help to encourage
reductions in emissions outside the UK that are not imported to the UK.
• Consumption emissions are recognised internationally. Demonstrating that
the UK is considering them and taking action to reduce them can
strengthen the UK’s credibility internationally and ability to encourage
others to adopt high ambition.
We therefore propose to track consumption emissions as a regular part of our
progress monitoring in future. We set out an illustrative Paris-aligned trajectory in
Chapter 7. If UK territorial emissions are reduced to Net Zero and UK trading
partners reduce their emissions in line with the Paris Agreement, we estimate that
UK consumption emissions would be around 90% below 1990 levels in 2050.
We will further develop our analysis of consumption emissions with a view to
developing indicators to provide more timely assessments of progress and to
consider policies to address imported emissions (e.g. in trade agreements and
supply chains).
We do not recommend that the UK set a legal target for consumption emissions at this time.
We will track consumption emissions against a Paris-aligned trajectory.
Chapter 10: Recommendations on the Sixth Carbon Budget 446
1 House of Commons Hansard (12 June 2019) Net Zero Emissions Target, Volume 661, Columns 673
and 682.
2 HMG (2020) The future of carbon pricing
3 CCC Expert Advisory Group report on cross-cutting policy: Sensitive Intervention Points to
achieve net-zero emissions published on the CCC website

447 Sixth Carbon Budget – The path to Net Zero
This page is left intentionally blank.
www.theccc.org.uk@theCCCuk
December 2020
The Sixth Carbon BudgetThe UK's path to Net Zero
Climate Change Committee151 Buckingham Palace Road LondonSW1W 9SW