the smart grid and its role in a carbon-constrained world rob pratt pacific northwest national...
TRANSCRIPT
The Smart Grid and its Role in a Carbon-Constrained World
Rob PrattPacific Northwest National [email protected]
Utah Public Utilities CommissionSmart Grid WorkshopMay 2009

What is the Smart Grid?

3
Seven Characteristics of a Modern Grid — Outcomes
Enables active participation by consumers
Accommodates all generation and storage options
Enables new products, services and markets
Provides power quality for the digital economy
Optimizes assets & operates efficiently
Anticipates and responds to system disturbances (self-heals)
Operates resiliently against attack and natural disaster
The Modern Grid Initiative has defined the smart grid in terms of seven characteristics that are outcomes:
4
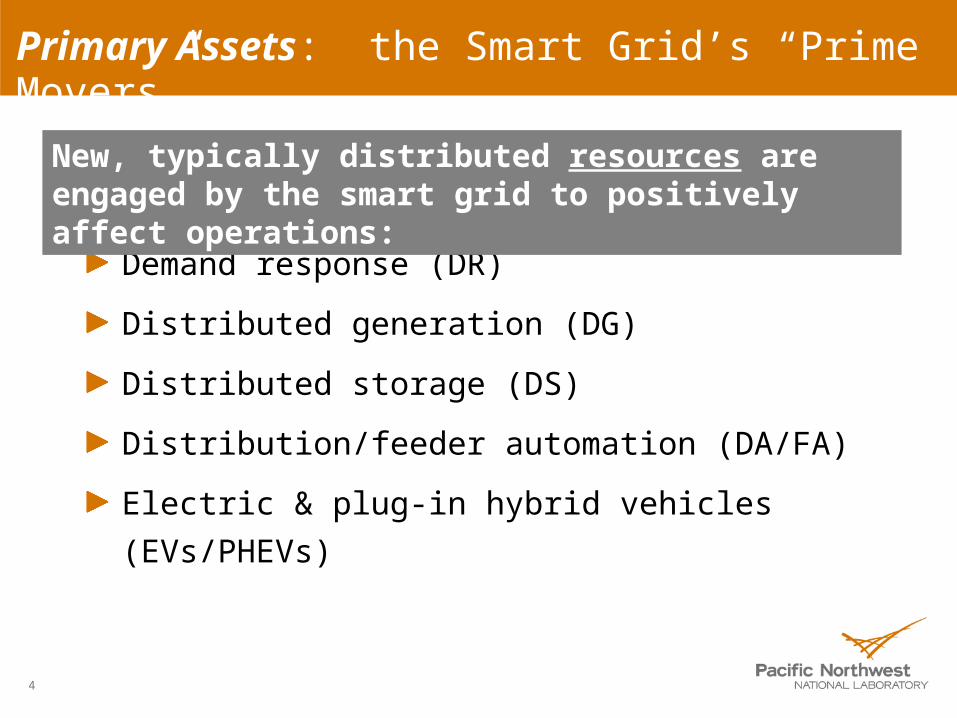
Primary Assets: the Smart Grid’s “Prime Movers”
Demand response (DR)
Distributed generation (DG)
Distributed storage (DS)
Distribution/feeder automation (DA/FA)
Electric & plug-in hybrid vehicles (EVs/PHEVs)
New, typically distributed resources are engaged by the smart grid to positively affect operations:

5
Enabling Assets for the Smart Grid
Communications networks, servers, gateways, etc.
Smart meters
Home/building/industrial energy management/control systems,
User information interfaces & support tools
Utility back office systems
Transmission wide-area phasor measurement (PMU) networks & visualization tools
Cross-cutting technologies that enable manyPrimary assets & applications:
1 hour→1 min intervals
1-way→2-way communications
Instantaneous volts, amps, VARs
Auto connect/disconnect
Other key technical ingredients of the smart grid:Cyber-security for all the above
Interoperability framework, standards & protocols

6
Applications: Operational Strategies that Utilize Smart Grid Resources to Create Benefits
Manage peak load capacity (G, T, & D)displace the need for new generation localize to displace need for new transmission further localize to offset need for new distribution extend transformer lifetimes
Grid control and operational strategies (applications) that engage smart grid assets to improve cost effectiveness, reliability, and energy efficiency:
Reduce costs for wholesale operationslower generation when marginal production costs > retail ratesminimize purchases/maximize sales when prices are high reduce transmission loads when/where congestion costs are high
Provide ancillary servicesregulation: minute-by-minute supply/demand balancingramping & load followingspinning & non-spinning reserve capacityreduce reactive power (VAR) needs
Reduce operational costs of integrating renewablesprovide increased ancillary services to manage intermittent renewables (e.g., wind)dynamically manage distribution voltages & protection schemes to accommodate high penetrations of customer-owned solar/PV
Provide enhanced reliabilityprevent and limit blackouts with transmission wide-area control & visualization tools that enhance situational awareness reconfigure distribution feeders to recover from local outages
Leverage network for energy efficiency & carbon savingsmanage voltage & capacitor banks to reduce losses & conserve end-use loadscustomer information systems enhance energy awareness measure & evaluate efficiency savings, mine for opportunities, & provide automated diagnostic serviceslower costs by combining efficiency & demand response program offerings to customers
Manage peak load capacity (G, T, & D)
Reduce costs for wholesale operations
Provide ancillary services
Reduce operational costs of integrating renewables
Provide enhanced reliability/adequate reliability at less cost
Leverage network for energy efficiency & carbon savings
7
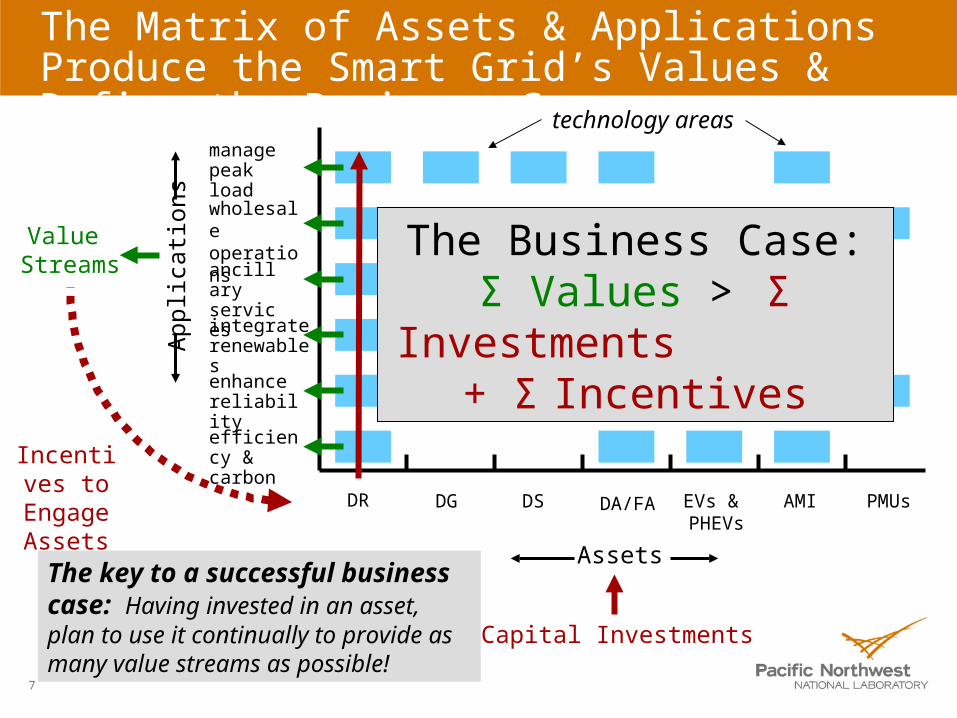
The Matrix of Assets & Applications Produce the Smart Grid’s Values & Define the Business Case
Assets
DR DG DS DA/FA EVs & PHEVs
PMUsAMI
App
licat
ions
Capital Investments
manage peak load
wholesale operations
ancillary services
integrate renewables
enhance reliability
efficiency & carbon
Value Streams
The key to a successful business case: Having invested in an asset, plan to use it continually to provide as many value streams as possible!
The Business Case:Σ Values > Σ Investments
+ Σ Incentives
technology areas
Incentives to Engage
Assets
8
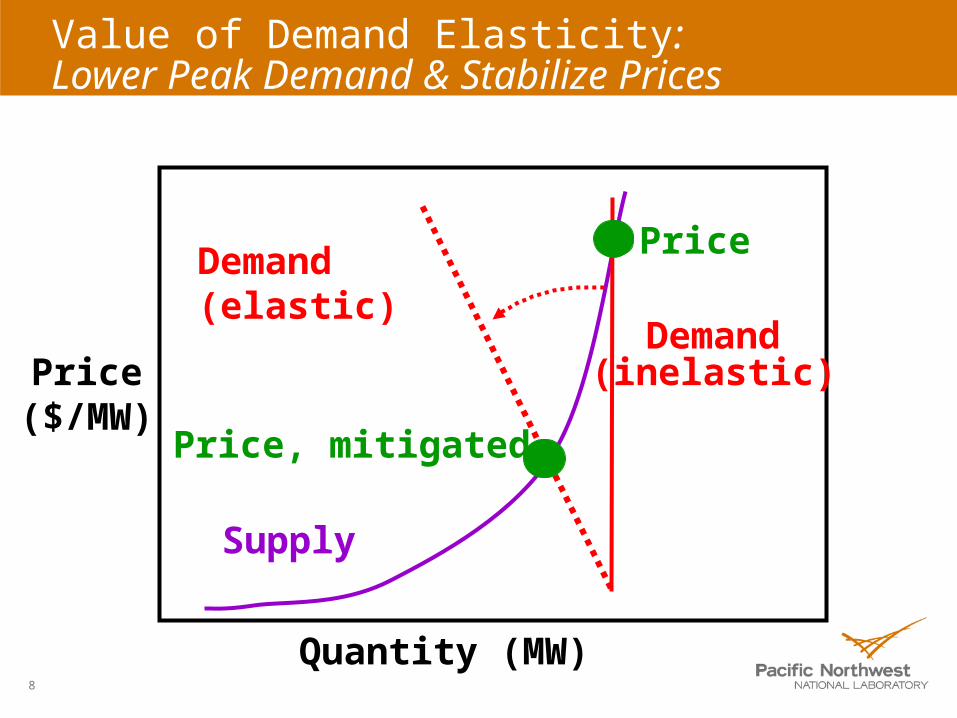
Value of Demand Elasticity: Lower Peak Demand & Stabilize Prices
Demand(elastic)
Demand
Supply
Price
Quantity (MW)
Price($/MW)
Price, mitigated
(inelastic)
9
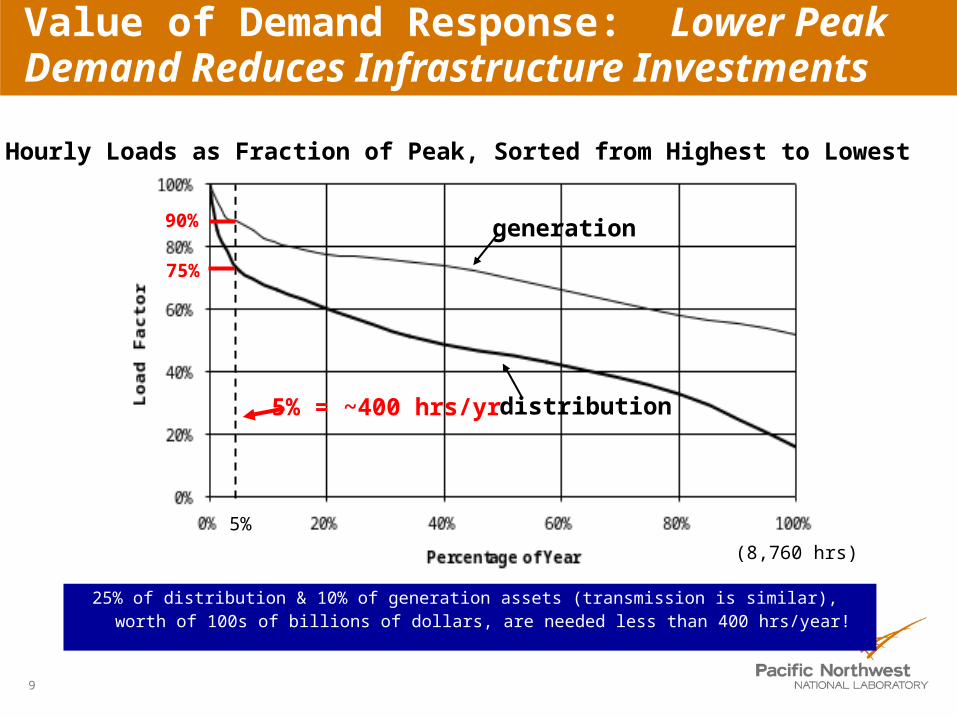
5%
5% = ~400 hrs/yr
75%
90%
(8,760 hrs)
distribution
generation
Value of Demand Response: Lower Peak Demand Reduces Infrastructure Investments
25% of distribution & 10% of generation assets (transmission is similar), worth of 100s of billions of dollars, are needed less than 400 hrs/year!
Hourly Loads as Fraction of Peak, Sorted from Highest to Lowest

10
Communicate – With Whom? About What?A Customer Perspective of the Smart Grid
Aggregators
Appliances, Equipment, Processes
Gen, T, & D Suppliers
EmergencyOperations
DistributionLinemen
Customer
Energy Service Co.s, Vendors, Utility Programs
capacity, avail-ability, price, forecast, contract terms, DG incentives
power require-ments, forecasts, status, curtailment
audit results, retrofit opportunities, designs, costs, terms & conditions
voltage, DG/storage status
grid status level, power/ end-use rations
billing, info access, attractive contracts, approvals, occupancy, performance

FACT:
In the next 20 years, the U.S. will spend $450B on electric infrastructure, just to meet load growth.
Revealing Values + Communications + Advanced Controls≡ Electric infrastructure
CHOICE:
Perpetuate a 20th Century solution
OR
Invest in a 21st Century system saving ratepayers $80B while increasing reliability and flexibility.
The choice iseasy because…
$ bits << $ iron
Information: The Virtual Electric Infrastructure
:
Smart Grid Operational Strategies for Distribution Systems:
Volt-VAR Control andDynamic Feeder Reconfiguration
13
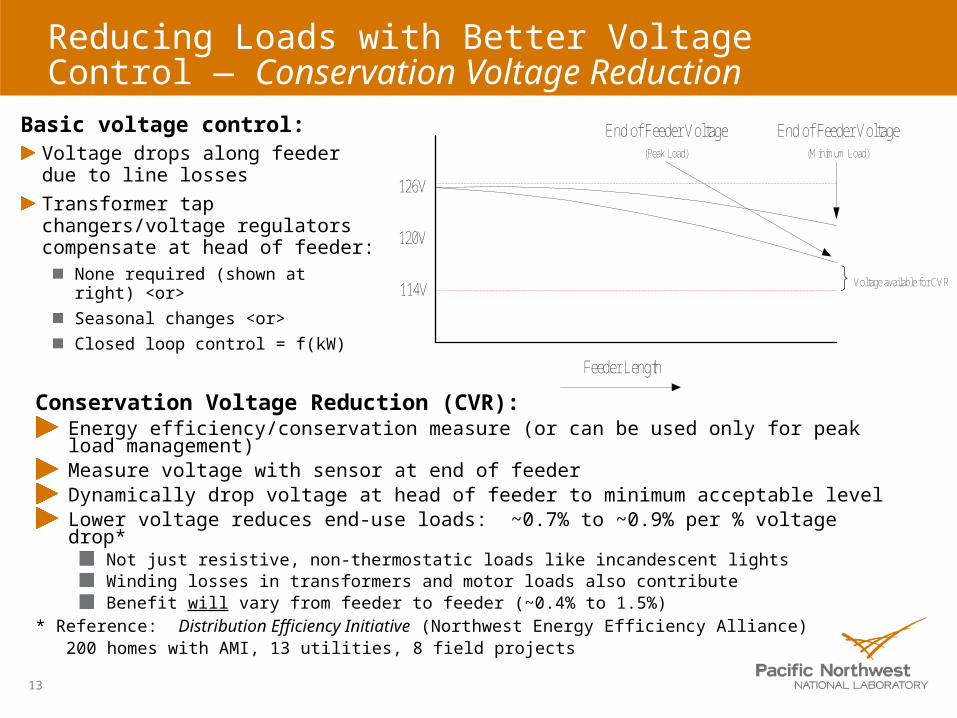
Reducing Loads with Better Voltage Control — Conservation Voltage Reduction
Conservation Voltage Reduction (CVR):Energy efficiency/conservation measure (or can be used only for peak load management)Measure voltage with sensor at end of feederDynamically drop voltage at head of feeder to minimum acceptable levelLower voltage reduces end-use loads: ~0.7% to ~0.9% per % voltage drop*
Not just resistive, non-thermostatic loads like incandescent lightsWinding losses in transformers and motor loads also contributeBenefit will vary from feeder to feeder (~0.4% to 1.5%)
* Reference: Distribution Efficiency Initiative (Northwest Energy Efficiency Alliance) 200 homes with AMI, 13 utilities, 8 field projects
Feeder Length
120V
114V
126V
End of Feeder Voltage(Peak Load)
End of Feeder Voltage(Minimum Load)
} Voltage available for CVR
Basic voltage control:Voltage drops along feeder due to line losses
Transformer tap changers/voltage regulators compensate at head of feeder:
None required (shown at right) <or>
Seasonal changes <or>
Closed loop control = f(kW)
14
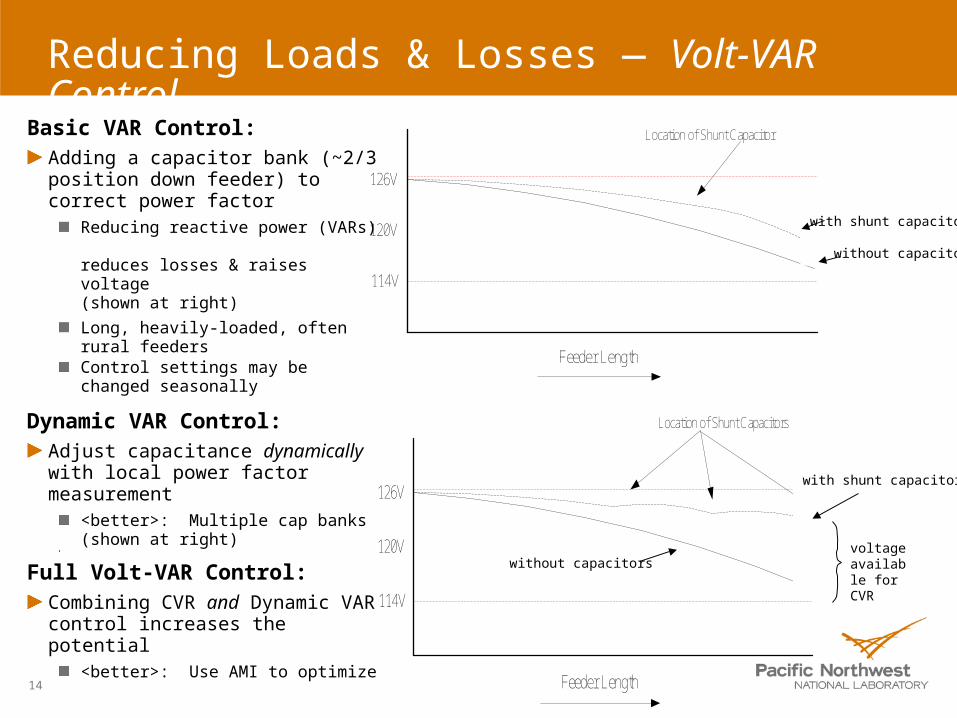
Reducing Loads & Losses — Volt-VAR Control
Feeder Length
120V
114V
126V
Location of Shunt Capacitor
With shunt capacitor
Without shunt capacitor
Basic VAR Control:Adding a capacitor bank (~2/3 position down feeder) to correct power factor
Reducing reactive power (VARs) reduces losses & raises voltage (shown at right)
Long, heavily-loaded, often rural feedersControl settings may be changed seasonally
Dynamic VAR Control:Adjust capacitance dynamically with local power factor measurement
<better>: Multiple cap banks (shown at right)
Full Volt-VAR Control:Combining CVR and Dynamic VAR control increases the potential
<better>: Use AMI to optimize
with shunt capacitor
without capacitor
Feeder Length
120V
114V
126V
With shunt capacitors
Without shunt capacitors
Location of Shunt Capacitors
with shunt capacitors
without capacitorsvoltage available for CVR

15
Self-Healing Distribution Systems – Today’s Operations
Switches:
Manual, open
Two adjacent, radial feeders; today’s operations:
1. Fault
2. Protective relays/fuses trip
3. Entire feeder outage
4. Dispatch truck/crew to find & isolate fault
5. Outage may last hours
X X X X
X X X X
16
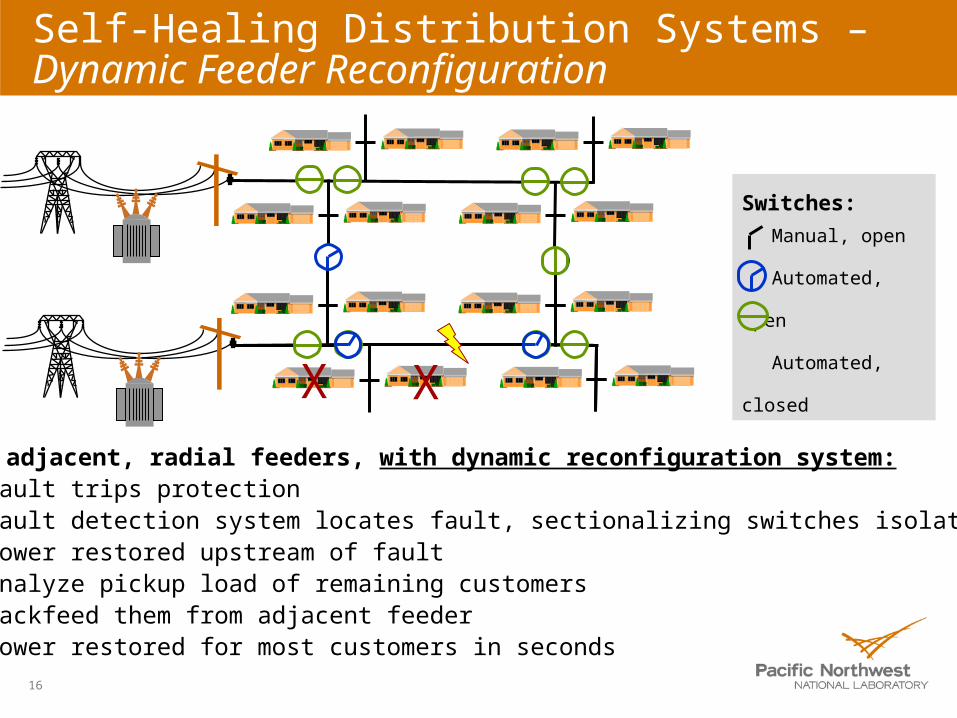
Self-Healing Distribution Systems – Dynamic Feeder Reconfiguration
Switches:
Manual, open
Automated, open
Automated,
closed
Two adjacent, radial feeders, with dynamic reconfiguration system:1. Fault trips protection2. Fault detection system locates fault, sectionalizing switches isolate it3. Power restored upstream of fault4. Analyze pickup load of remaining customers5. Backfeed them from adjacent feeder6. Power restored for most customers in seconds
X X

The Smart Grid and Carbon
19
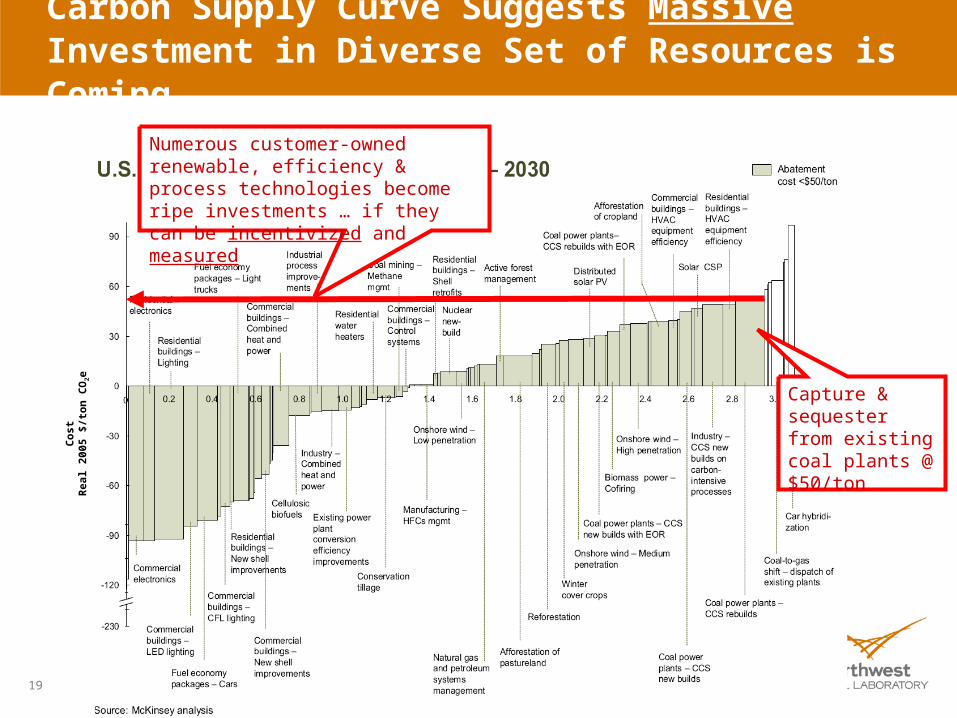
Carbon Supply Curve Suggests Massive Investment in Diverse Set of Resources is Coming
Capture & sequester from existing coal plants @ $50/ton
Co
stR
eal
2005
$/t
on
CO
2e
Numerous customer-owned renewable, efficiency & process technologies become ripe investments … if they can be incentivized and measured
20
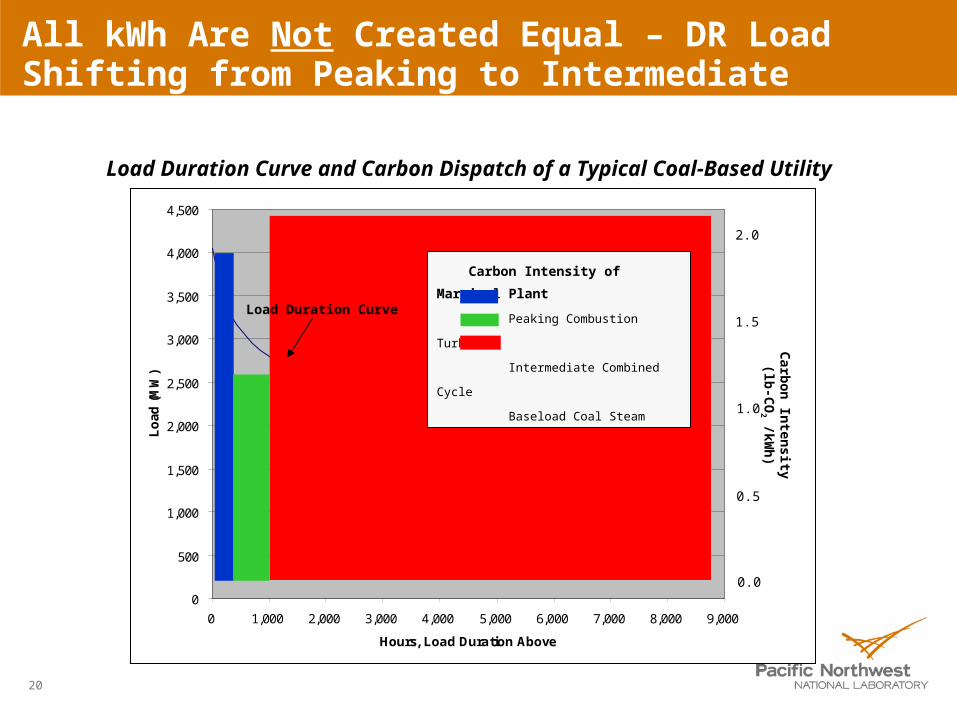
All kWh Are Not Created Equal – DR Load Shifting from Peaking to Intermediate Generation Can Save Carbon
0
500
1,000
1,500
2,000
2,500
3,000
3,500
4,000
4,500
0 1,000 2,000 3,000 4,000 5,000 6,000 7,000 8,000 9,000
Hours, Load Duration Above
Lo
ad (
MW
)
Carb
on
Inten
sity(lb
-CO
2 /kWh
)
1.0
0.5
0.0
2.0
1.5Load Duration Curve
Carbon Intensity of Marginal Plant
Peaking Combustion Turbine
Intermediate Combined Cycle
Baseload Coal Steam
Load Duration Curve and Carbon Dispatch of a Typical Coal-Based Utility

21
A smart grid can deliver carbon savings• End-use conservation & efficiency from demand response controls• Carbon savings from peak load shifting• Minimize losses & resistive loads by continually optimizing distribution voltage• Cost effective & increasingly clean energy for electric vehicles • Improve & sustain end-use efficiency by delivering continuous, remote diagnostic
& commissioning services
Smart Grid Can Deliver and Enable Carbon Savings – A Sample of Mechanisms
A smart grid can enable more, lower cost carbon savings• Lower net cost for wind power by regulating fluctuations with demand response• Distribution grids capable of safely supporting high penetrations of PV solar• Lower costs for efficiency programs by leveraging the demand response/AMI
network to measure & verifying energy & cost savings – for each customer, with unprecedented precision, in real-time
• Accurate accounting of actual carbon footprint of generation displaced by efficiency & renewables
• Solid verification enhances value & tradability of carbon offsets (if allowed)
22
0
5
10
15
20
25
Mill
ions
Bar
rels
Per
Day
Total20.6
US Production
8.2
NetImports
12.5
Trans-portation
13.8
Industry5.0
Res, Com, Electricity
1.8
Gasoline9.1
potential PHEV
displacement6.5
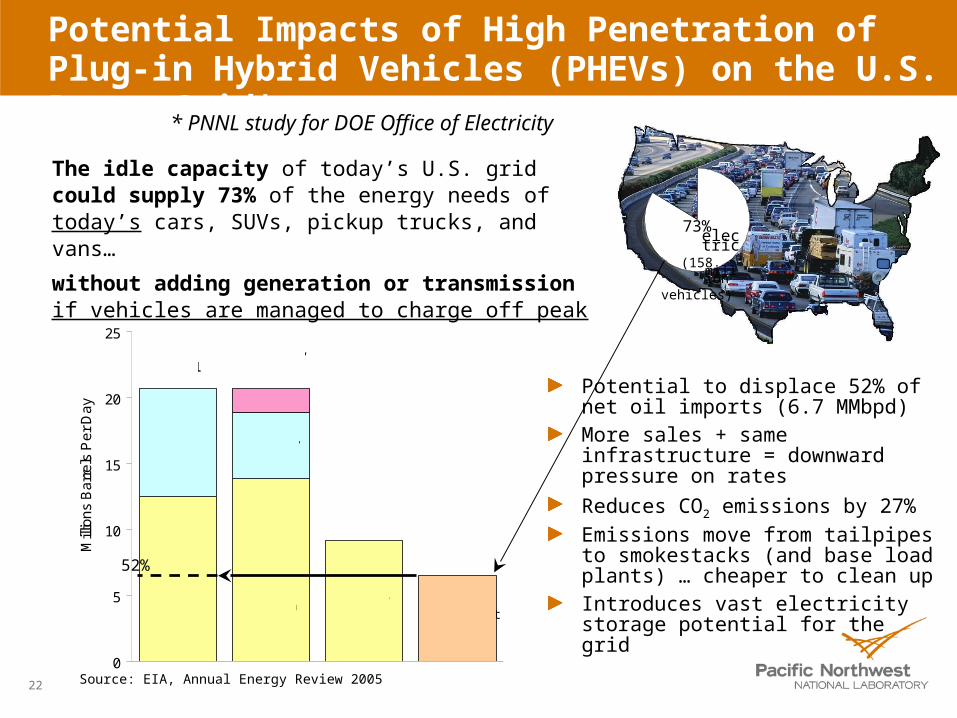
Potential Impacts of High Penetration of Plug-in Hybrid Vehicles (PHEVs) on the U.S. Power Grid*
The idle capacity of today’s U.S. grid could supply 73% of the energy needs of today’s cars, SUVs, pickup trucks, and vans…
without adding generation or transmission if vehicles are managed to charge off peak
73% electr
ic(158 million
vehicles)
52%
Source: EIA, Annual Energy Review 2005
Potential to displace 52% of net oil imports (6.7 MMbpd)More sales + same infrastructure = downward pressure on rates
Reduces CO2 emissions by 27%
Emissions move from tailpipes to smokestacks (and base load plants) … cheaper to clean upIntroduces vast electricity storage potential for the grid
* PNNL study for DOE Office of Electricity
23
How Does a Smart Grid’s Demand Response Capability Deliver Energy Efficiency?
Customers can use scheduling and control capabilities of DR equipment to save energy in addition to peak
Water heater setbacks (especially)
Thermostat setbacks: TOU/CPP customers particularly
Shifting AC loads to off-peak hours results in run times during cooler morning evening hours when AC is more efficient (higher COPs)
DR networks can be leveraged to provide remote diagnostics that improve efficiency (and reduce peak)
Load or run-time signals from DR load controls can be basis for diagnostics
Communications network allows diagnostic services to be provided remotely, universally

24
Mo
nth
ly E
ne
rgy
Co
nsu
mp
tion
Measurement of Efficiency Savings Today:Basis is 12 Monthly Bills
Typical Home – Inland NW (with cooling)
25
Using the DR Network to Measure and Verify Savings from Efficiency
Measure and verify peak, energy, and cost savings, by customer, by end use category
Utilize AMR and demand response network and controls to disaggregate load into major end uses
Time-series and end-use detail provides much higher validity to savings estimates
Build & continually update models of customer loads for use in both verification and diagnostics
Tabulate renewable, efficiency, and carbon credits by integrating with back office systems
Weight consumption by CO2 footprint of generation in real time to gain carbon benefits of load shift
Solid verification enhances value
26
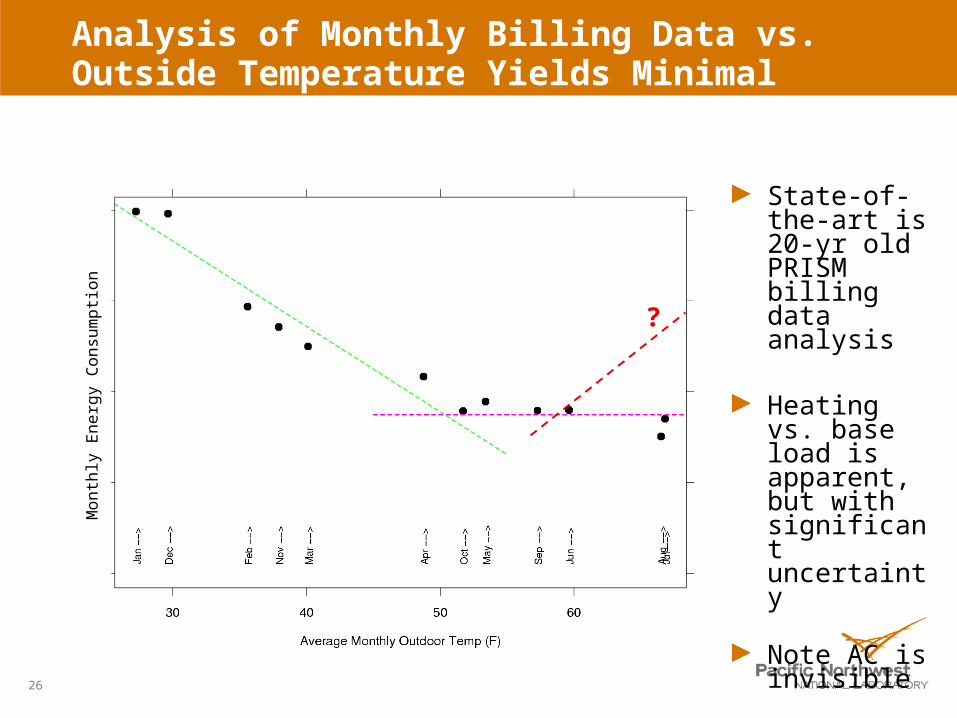
Analysis of Monthly Billing Data vs. Outside Temperature Yields Minimal Information
State-of-the-art is 20-yr old PRISM billing data analysis
Heating vs. base load is apparent, but with significant uncertainty
Note AC is invisible
Mo
nth
ly E
ne
rgy
Co
nsu
mp
tion
?

27
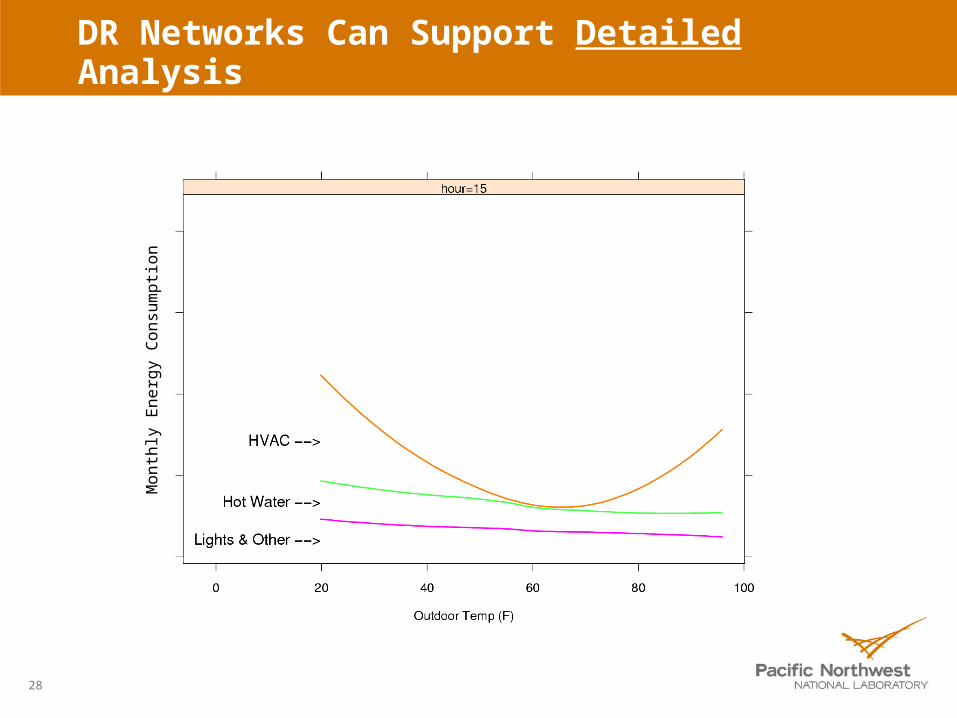
Smart Grid Provides Time-Series Data with End Use Resolution
Vastly improved resolution allows detailed analysis of end-use savings
Note AC load is now apparent
28
Mo
nth
ly E
ne
rgy
Co
nsu
mp
tion
DR Networks Can Support Detailed Analysisof Most Types of Efficiency Savings

What We’ve Learned from the
Olympic Peninsula Demonstration

30
ancillary services
0 6 12 18 24
IBM
distribution congestion
transmission congestion
wholesale cost
JohnsonControls
Invensys
JohnsonControls
$
MW
MarketMarket
Internet broadband communications
Clallam PUD & Port Angelesn = 112, 0.5 MW DR
Clallam County PUD Water Supply District 0.2 MW DR
Sequim Marine Sciences Lab 0.3 MW DR0.5 MW DG
Olympic Peninsula Demonstration

31
Olympic Peninsula Demo: Key Findings (1)
Customers can be recruited, retained, and will respond to dynamic pricing schemes if they are offered:
Opportunity for significant savings (~10% was suggested)
A “no-lose” proposition compared to a fixed rate
Control over how much they choose to respond, with which end uses, and a 24-hour override
prevents fatigue: reduced participation if called upon too often
Technology that automates their desired level of response
A simple, intuitive, semantic interface to automate their response
More Comfort
More Savings Translates to thermostat
control parameters

32
Olympic Peninsula Demo: Key Findings (2)
Significant demand response was obtained:
15% reduction of peak load
Up to 50% reduction in total load for several days in a row during shoulder periods
Response to wholesale prices + transmission congestion + distribution congestion
Able to cap net demand at an arbitrary level to manage local distribution constraint
Short-term response capability could provide regulation, other ancillary services adds significant value at very low impact and low cost)
Same signals integrated commercial & institutional loads, distributed resources (backup generators)